national offender management service annual … annual report 2009/10: management information...
TRANSCRIPT

NOMS Annual Report 2009/10:
Management Information Addendum
National Offender Management Service Annual Report 2009/10: Management Information Addendum Ministry of Justice Information Release
Published 30 March 2011
1

NOMS Annual Report 2009/10:
Management Information Addendum
2
Contents
Introduction 3
Public protection 4
Offending Behaviour Programmes (OBPs) 9
Drug strategy 21
Alcohol treatment 29
Unpaid work (Community Payback) 31
Compliance and enforcement 35
Employment 40
Accommodation 45
Education 49
Safety and decency in custody 54
Court reports 59
Corporate: staff sickness absence and BME representation 60
Cost per prison place/prisoner 66
Annex: Technical notes 78

NOMS Annual Report 2009/10:
Management Information Addendum
Introduction
The National Offender Management Service (NOMS) was created as an executive agency of the Ministry of Justice in April 2008 with the goal of helping prison and probation services work together to manage offenders through their sentences.
The National Offender Management Service Annual Report and Accounts for 2009/10 was published on 9 September 2010. Section 2 of the report provided a summary of the Agency’s performance against its Key Performance Indicators (KPIs) for 2009/10. The current document provides additional information on outturns against the KPIs and other indicators, showing, where available, comparisons with previous years and performance by probation region and by prison function. Information on prison costs is once again included in this volume.
3

NOMS Annual Report 2009/10:
Management Information Addendum
Public protection
Public protection is core to successful and effective delivery of offender management. In managing offenders in the community, NOMS has the protection of the public, including victims, children and vulnerable adults, as an overriding aim all its activity. For prisons the primary aim in protecting the public is to prevent escapes from custody.
Escapes
A prisoner escapes from prison if they unlawfully gain their liberty by breaching the secure perimeter of a closed prison, i.e. the outside wall or boundary of the prison. A prisoner escapes from escort when they are able to pass beyond the control of a security escort. In the case of escapes from prison this may involve overcoming physical security restraints such as a wall or fence; locks, bolts or bars; in the case of escape from escort this may involve overcoming a secure vehicle; handcuffs; or the direct supervision of a security escort. A Category A escape occurs where the prisoner escaping has been categorised to category A. Category A prisoners are those whose escape would be highly dangerous to the public or the police or the security of the State and for whom the aim must be to make escape impossible.
Category A escapes (national KPI)
Target: To ensure no escapes of Category A prisoners in 2009/10
Result: No Category A escapes
Figure 1 shows that there have been no Category A escapes since 1995/96.
Figure 1: Number of Category A escapes
0
1
2
3
4
1995
/96
1996
/97
1997
/98
1998
/99
1999
/200
0
2000
/01
2001
/02
2002
/03
2003
/04
2004
/05
2005
/06
2006
/07
2007
/08
2008
/09
2009
/10
Target
Total Cat A Escapes
4

NOMS Annual Report 2009/10:
Management Information Addendum
Escapes from prisons and prison escorts (national KPI)
Target: To ensure that the rate of escapes from all prisons and from prison escorts, expressed as a proportion of the average prison population, is lower than 0.05 per cent in 2009/10.
Result: The escape rate was 0.01 per cent.
Figure 2 shows the rate of escapes since 2006/07.
Figure 2: Percentage rate of escapes from prisons and prison escorts
0
0.01
0.02
0.03
0.04
0.05
0.06
2006/07 2007/08 2008/09 2009/10
Escapes Rate Target
Escapes from contractor escorts (national KPI)
Target: To ensure that the rate of escapes from contractor escorts is less than 1:20,000 in 2009/10
Result: The rate of escapes from contractor escorts was 1:97,799
Figure 3 illustrates that the rare of escapes from contracted prisoner reduced from 1 in 67,688 journeys in 2008/09 to 1 in 97,799 journeys in 2009/10.
5

NOMS Annual Report 2009/10:
Management Information Addendum
Figure 3: Rate of escapes from contractor escorts
0.0000000
0.0000100
0.0000200
0.0000300
0.0000400
0.0000500
0.0000600
2008/09 2009/10
YTD Ratio of Contractor Escort Escapes Target
1:20,0001:20,000
1:67,6881:97,799
Note: Data for rates of escapes from contractor escorts has only been available since 2008/09. The outturn of 1:97,799 is a correction of the figure originally quoted in the NOMS Annual Report and Accounts 2009/10.
Figure 4 and Table 1 show that there were three escapes from prison escorts and two escapes from prisons during 2009/10. Of the three escapes from prison escorts, two were by prisoners from male local prisons and one from a male category C prison. The prison escapes both took place from male local prisons.
Figure 4: Number of escapes from prisons and prison escorts by prison function 2009/10
0
1
2
3
4
5
Mal
e ca
tego
ry B
Mal
e ca
tego
ry C
Mal
e di
sper
sal
Fem
ale
clos
ed
Fem
ale
loca
l
Fem
ale
open
Mal
e cl
osed
YO
I
Mal
e Y
OI -
You
ng P
eopl
e
Mal
e lo
cal
Mal
e op
en
Mal
e op
en Y
OI
Sem
i ope
n
Clu
ster
Escapes from prisons
Escapes from escorts
6

NOMS Annual Report 2009/10:
Management Information Addendum
Table 1: Number of escapes from prisons and prison escorts by prison function 2009/10
Male category B 0 0 0
Male category C 1 0 1
Male dispersal 0 0 0
Female closed 0 0 0
Female local 0 0 0
Female open 0 0 0
Male closed YOI 0 0 0
Male YOI - Young People 0 0 0
Male local 2 2 4
Male open 0 0 0
Male open YOI 0 0 0
Semi open 0 0 0
Cluster 0 0 0
Totals: 3 2 5
Functionname
Escapes from prison escorts
Escapes from prisons
Escapes total
Absconds
An abscond is an escape that does not involve overcoming a physical security restraint such as that provided by a wall or fence, locks, bolts or bars, a secure vehicle, handcuffs, or the direct supervision of staff.
Figure 5 shows that the overall number of absconds decreased in 2009/10 compared to 2008/09, although there were increases in the open sites of Male Category B and Male Local prisons, Male Open YOI Prisons and Escort Areas.
7

NOMS Annual Report 2009/10:
Management Information Addendum
Figure 5: Number of absconds by prison function
0
50
100
150
200
250M
ale
cate
gory
B*
Mal
e ca
tego
ry C
*
Mal
e di
sper
sal
Fem
ale
clos
ed
Fem
ale
loca
l
Fem
ale
open
Mal
e cl
osed
YO
I
Mal
e Y
OI -
You
ng P
eopl
e
Mal
e lo
cal
Mal
e op
en
Mal
e op
en Y
OI
Sem
i ope
n
Clu
ster
Esc
ort A
reas
Absconds (2008/09)
Absconds (2009/10)
*Function groups male local, male category B, C and Cluster include open sites in which absconds were recorded. Absconds recorded in these functions were predominantly from the open element of the establishments concerned.
Table 2: Number of absconds by prison function
Male category B* 10 23
Male category C* 43 26
Male dispersal 0 0
Female closed 0 0
Female local 0 0
Female open 4 3
Male closed YOI 0 0
Male YOI - Young People 0 0
Male local 1 2
Male open 209 144
Male open YOI 24 34
Semi open 8 2
Cluster 62 35
Escort Areas 1 4
Totals: 273362
Functionname
Absconds (2009/10)
Absconds (2008/09)
*Function groups male local, male category B, C and Cluster include open sites in which absconds were recorded. Absconds recorded in these functions were predominantly from the open element of the establishments concerned.
8

NOMS Annual Report 2009/10:
Management Information Addendum
Offending behaviour programmes (OBPs)
NOMS currently offers a suite of offending behaviour programmes for sex offenders, violent offenders, substance misusers, and general offenders. These programmes are designed to reduce re-offending by helping offenders to learn new skills that improve the way in which they think and solve problems; help them cope with pressures; consider the consequences of their actions; see things from the perspective of others; and to act less impulsively. These are some of the most common characteristics of offenders and accredited programmes are a good way of tackling them. The programmes, which are fully or provisionally accredited by the Correctional Services Accreditation Panel (CSAP), are facilitated by specially trained staff that follow a well documented structure but are encouraged to be responsive to the individual needs of the participants.
Appropriate OBP starts in the community (national KPI)
This indicator was introduced in 2008/09 in order to ensure that offenders in the community who required an accredited OBP were placed on the specific programme that best addressed their offending behaviour.
Target: To ensure that 80 per cent of programme starts in the community meet the relevant programme criteria in 2008/09
Result: 89 per cent programme starts met the relevant programme criteria
Figure 6: Percentage OBP starts that meet programme criteria
0%
10%
20%
30%
40%
50%
60%
70%
80%
90%
100%
2008/09 2009/10
% OBP Starts that Meet Programme Criteria Target
Table 3 shows the percentage of appropriate OBP starts in the community compared to targets by region for 2009/10.
9

NOMS Annual Report 2009/10:
Management Information Addendum
Table 3: Appropriate OBPs starts in the community 2009/10
RegionAnnual Target
Appropriate Starts Total Starts
Percentage of Total Starts that
Met the Relevant
Programme Criteria
East Midlands 80% 1,329 1,452 92%East of England 83% 1,490 1,664 90%London 80% 1,820 2,126 86%North East 80% 1,161 1,325 88%North West 80% 2,796 3,068 91%South East 80% 1,332 1,482 90%South West 80% 950 1,040 91%Wales 80% 1,035 1,174 88%West Midlands 80% 2,037 2,252 90%Yorkshire & Humberside 80% 1,672 1,960 85%
National Total 80% 15,622 17,543 89%
OBP completion rates in the community
The main performance indicator for community OBPs in 2009/10 was the completion rate.
Target: 66 per cent of accredited offending behaviour programmes to be successfully completed (excluding sex offender and domestic violence programmes)
Result: 69 per cent of accredited offending behaviour programmes successfully completed (excluding sex offender and domestic violence programmes)
Table 4 shows the OBP completion rates achieved by regions in 2009/10.
10

NOMS Annual Report 2009/10:
Management Information Addendum
Table 4: OBP completion rates in the community 2009/10
RegionAnnual
targetCommenced Completed
Completion Rate
East Midlands 66% 1,708 1,251 73%
East of England 67% 2,082 1,487 71%
London 65% 2,447 1,845 75%
North East 66% 1,062 753 71%
North West 65% 4,530 2,900 64%
South East 69% 1,980 1,480 75%
South West 65% 1,388 952 69%
Wales 65% 1,530 971 63%
West Midlands 65% 2,776 1,858 67%
Yorkshire & Humberside 65% 2,256 1,496 66%
National Total 66% 21,759 14,993 69%
Note: The completion rate for offending behaviour programmes (excluding SOTP and domestic violence programmes) is based on programmes which commenced 12 months prior to the period of reporting, i.e. between April 2008 and March 2009 for 2009/10 reporting. For that reason the number completed as shown in column 4 of this table differs from the completions shown in Table 5: ‘Number of community OBP completions by region 2009/10’ which relate to the total number of OBPs that were completed during 2009/10, irrespective of commencement date.
OBP completions in custody and community
These outturns exclude Sex Offender Treatment Programmes (SOTP) in custody and the community, Drug Treatment Programmes (DTP) in custody and Domestic Violence (DV) programmes in the community, which are subject to separate targets and are covered on subsequent pages.
Figure 7 shows the annual number of OBP completions since 2006/07. Against this background the number of domestic violence programme completions has increased over the same period. (Further details are provided in subsequent sections of this document).
11

NOMS Annual Report 2009/10:
Management Information Addendum
Figure 7: Number of offending behaviour programme completions in custody and in the community
0
5000
10000
15000
20000
25000
30000
2006/07 2007/08 2008/09 2009/10
YTD OBP Completions in Custody (excluding SOTP)
YTD OBP Completions in the Community (excluding SOTP & DV)
Note: Prior to 2008/09 NOMS presented outturns inclusive of private prisons and adult public prisons but excluding Male YOI – Young People establishments and Immigration Centres. HMPS presented outturns inclusive of adult public prisons, Male YOI – Young People establishments and Immigration Centres but excluding private prisons. Outturn data for previous years has been presented in this report on a consistent basis with 2009/10 outturns, but it is not possible to produce comparable targets retrospectively for previous years.
Figure 8 shows that the number of community OBP completions decreased in Wales and every English region except the East of England in 2009/10 compared to 2008/09. Table 5 shows OBP completions compared to aggregated local targets for 2009/10.
Figure 8: Number of community OBP completions in 2009/10 compared to 2008/09 by region
0
500
1000
1500
2000
2500
Eas
tM
idla
nds
Eas
t of
Eng
land
Lond
on
Nor
th E
ast
Nor
th W
est
Sou
th E
ast
Sou
th W
est
Wal
es
Wes
tM
idla
nds
Yor
kshi
re &
Hum
bers
ide
Community OBP completions 2008/09 Community OBP completions 2009/10
12

NOMS Annual Report 2009/10:
Management Information Addendum
Table 5: Number of community OBP completions by region 2009/10
RegionAggregated*
Annual TargetOBP Completions
Percentage of aggregated* regional
targets
East Midlands 1,161 1,146 99%
East of England 1,201 1,408 117%
London 1,760 1,757 100%
North East 902 775 86%
North West 1,840 1,841 100%
South East 1,268 1,306 103%
South West 791 830 105%
Wales 905 923 102%
West Midlands 1,570 1,700 108%
Yorkshire & Humberside 1,356 1,372 101%
Aggregated* Totals: 12,754 13,058 102%
*Individual targets were set at trust level. These targets have been aggregated to regional and national level to provide an overall comparison against outcomes in the table above.
Figure 9 shows that for the majority of function groups the number of OBP completions remained fairly consistent in 2009/10 compared with 2008/09. Table 6 shows the actual number of OBP completions compared to target by function group for 2009/10.
Figure 9: Number of OBP completions compared to previous year by prison function
0
500
1,000
1,500
2,000
2,500
3,000
Mal
e ca
tego
ry B
Mal
e ca
tego
ry C
Mal
e di
sper
sal
Fem
ale
clos
ed
Fem
ale
loca
l
Fem
ale
open
Mal
e cl
osed
YO
I
Mal
e Y
OI -
You
ngP
eopl
e
Mal
e lo
cal
Mal
e op
en
Mal
e op
en Y
OI
Sem
i ope
n
Clu
ster
OBP completions (2008/09)
OBP completions (2009/10)
13

NOMS Annual Report 2009/10:
Management Information Addendum
Table 6: Number of OBP completions by prison function 2009/10
Male category B 704 730 104%Male category C 2,746 2,704 98%Male dispersal 374 364 97%Female closed 116 114 98%Female local 321 220 69%Female open 0 0 -Male closed YOI 821 811 99%Male YOI - Young People 77 77 100%Male local 1,666 1,589 95%Male open 159 163 103%Male open YOI 88 96 109%Semi open 54 54 100%Cluster 727 787 108%
Aggregated* Totals: 7,853 7,709 98%
Functionname
Aggregated* Annual
target
OBPcompletions
Percentageof aggregated*
targets
*Individual targets were set at establishment level. These targets have been aggregated to function group and national level in the table above to provide an overall comparison against outcomes.
Domestic violence programme completions in the community
Domestic violence is any incident of threatening behaviour, violence or abuse between adults who are or have been in a relationship together, or between family members, regardless of gender or sexuality.
NOMS accredited programmes for domestic violence are programmes targeted at men who are or were in heterosexual relationships at the time the offence was committed. They aim to reduce aggressive behaviour through teaching social skills, anger management techniques and improved moral reasoning.
Domestic violence programme completion rates (community)
The main performance indicator for community domestic violence programmes in 2009/10 was the completion rate.
Target: 68 per cent of accredited domestic violence programmes to be successfully completed
Result: 64 per cent of accredited domestic violence programmes successfully completed
The completion rates achieved at regional level are shown in Table 7.
14

NOMS Annual Report 2009/10:
Management Information Addendum
Table 7: Domestic violence completion rates in the community by region
Region Annual target Commenced Completed Completion Rate
East Midlands 70% 421 289 69%
East of England 67% 495 319 64%
London 67% 441 302 68%
North East 68% 295 213 72%
North West 66% 1,171 720 61%
South East 71% 652 460 71%
South West 67% 449 314 70%
Wales 67% 240 124 52%
West Midlands 67% 221 121 55%
Yorkshire & Humberside 67% 564 327 58%
National Total 68% 4,949 3189 64%
Note: The completion rate for domestic violence programmes is based on programmes which commenced 18 months prior to the period of reporting, i.e. between October 2007 and September 2008 for 2009/10 reporting. For that reason the number completed as shown in column 4 of this table differs from the completions shown in Table 8: ‘Number of domestic violence programme completions by probation region 2009/10’ which relate to the total number of domestic violence programmes that were completed during 2009/10, irrespective of commencement date.
Domestic violence programme completion volumes
The number of domestic violence programmes in the community has increased steadily since 2006/07.
The number of domestic violence programmes increased in the majority of probation regions in 2009/10 compared to 2008/09, as shown in Figure 10. Table 8 shows the number of domestic violence programme completions compared to aggregated targets for 2009/10.
15

NOMS Annual Report 2009/10:
Management Information Addendum
Figure 10: Number of community domestic violence programme completions in 2009/10 compared to 2008/09 by region
0
100
200
300
400
500
600
700
800E
ast
Mid
land
s
Eas
t of
Eng
land
Lond
on
Nor
th E
ast
Nor
th W
est
Sou
th E
ast
Sou
th W
est
Wal
es
Wes
tM
idla
nds
Yor
kshi
re &
Hum
bers
ide
Community domestic violenceprogramme completions 2008/09Community domestic violenceprogramme completions 2009/10
Table 8: Number of domestic violence programme completions by probation region 2009/10
RegionAggregated
annual target
Domestic violence
programme completions
Percentage of target
achieved
East Midlands 267 309 116%East of England 272 354 130%London 320 333 104%North East 170 171 101%North West 660 699 106%South East 390 448 115%South West 242 296 122%Wales 110 134 122%West Midlands 130 104 80%Yorkshire & Humberside 328 342 104%
National Totals: 2,889 3,190 110%
*Individual targets were set at trust level. These targets have been aggregated to regional and national level in the table above to provide an overall comparison against outcomes.
16

NOMS Annual Report 2009/10:
Management Information Addendum
Community SOTP completion rates
The main performance indicator for community SOTPs in 2009/10 was the completion rate.
Target: 78 per cent of accredited sex offender treatment programmes to be successfully completed
Result: 77 per cent of accredited sex offender treatment programmes successfully completed
A breakdown of completion rates by region is shown in Table 9.
Table 9: SOTP completion rates in the community by region
RegionAnnual
targetCommenced Completed Completion Rate
East Midlands 77% 136 87 64%
East of England 81% 156 137 88%
London 77% 123 86 70%
North East 77% 112 91 81%
North West 78% 233 161 69%
South East 79% 244 213 87%
South West 77% 159 142 89%
Wales 77% 74 52 70%
West Midlands 77% 253 162 64%
Yorkshire & Humberside 77% 189 154 81%
National Total 78% 1,679 1285 77%
Note: The completion rate for sex offender treatment programmes is based on programmes which commenced 30 months prior to the period of reporting, i.e. between October 2006 and September 2007 for 2009/10 reporting. For that reason the number completed as shown in column 4 of this table differs from the completions shown in Table 10: ‘Number of community sex offender treatment programme completions by region 2009/10’ which relate to the total number of SOTP that were completed during 2009/10, irrespective of commencement date.
Sex offender treatment programme (SOTP) completions volume in custody and community
Sex offender treatment programmes aim to reduce offending by adult male sex offenders. A range of programmes are available to meet the level of risk and need of the offender.
As illustrated by Figure 11, the overall number of SOTPs delivered by NOMS rose again in 2009/10 compared to the previous three years.
17

NOMS Annual Report 2009/10:
Management Information Addendum
Figure 11: Number of sex offender treatment programme completions in custody and the community
0
500
1000
1500
2000
2500
3000
2006/07 2007/08 2008/09 2009/10
YTD SOTP Completions in Custody YTD SOTP Completions in the Community
Note: Prior to 2008/09 NOMS presented outturns inclusive of private prisons and adult public prisons but excluding Male YOI – Young People establishments and Immigration Centres. HMPS presented outturns inclusive of adult public prisons, Male YOI – Young People establishments and Immigration Centres but excluding private prisons. Outturn data for previous years has been presented in this report on a consistent basis with 2009/10 outturns, but it is not possible to produce comparable targets retrospectively for previous years.
The number of SOTP completions delivered by the probation service increased slightly from 1,367 in 2008/09 to 1,452 in 2009/10. Figure 12 compares the number of completions in each year by region.
Figure 12: Number of community sex offender treatment programme completions in 2009/10 compared to 2008/09 by region
0
50
100
150
200
250
Eas
tM
idla
nds
Eas
t of
Eng
land
Lond
on
Nor
th E
ast
Nor
th W
est
Sou
th E
ast
Sou
th W
est
Wal
es
Wes
tM
idla
nds
Yor
kshi
re &
Hum
bers
ide
Community SOTP completions 2008/09
Community SOTP completions 2009/10
18

NOMS Annual Report 2009/10:
Management Information Addendum
Table 10: Number of community sex offender treatment programme completions by region 2009/10
RegionAggregated*
annual targetSOTP completions
Percentage of aggregated* targets
East Midlands 112 118 105%
East of England 136 146 107%
London 100 102 102%
North East 75 81 108%
North West 165 179 108%
South East 202 228 113%
South West 119 134 113%
Wales 62 70 113%
West Midlands 183 229 125%
Yorkshire & Humberside 133 165 124%
Aggregated* Totals: 1,287 1,452 113%
*Individual targets were set at trust level. These targets have been aggregated to regional and national level in the table above to provide an overall comparison against outcomes.
Figure 13 compares by prison function the number of completions in 2009/10 with the number delivered in 2008/09.
Figure 13: Number of sex offender treatment programme completions in 2009/10 compared to 2008/09 by prison function
0
100
200
300
400
500
600
700
Mal
e ca
tego
ry B
Mal
e ca
tego
ry C
Mal
e di
sper
sal
Fem
ale
clos
ed
Fem
ale
loca
l
Fem
ale
open
Mal
e cl
osed
YO
I
Mal
e Y
OI -
You
ngP
eopl
e
Mal
e lo
cal
Mal
e op
en
Mal
e op
en Y
OI
Sem
i ope
n
Clu
ster
SOTP completions (2008/09)
SOTP completions (2009/10)
19

NOMS Annual Report 2009/10:
Management Information Addendum
Table 11 shows the number of sex offender treatment programmes compared to aggregated local targets by prison function for 2009/10.
Table 11: Number of sex offender treatment programme completions by prison function 2009/10
Male category B 55 46 84%
Male category C 575 593 103%
Male dispersal 117 109 93%
Female closed 0 0 -
Female local 0 0 -
Female open 0 0 -
Male closed YOI 59 62 105%
Male YOI - Young People 0 0 -
Male local 251 250 100%
Male open 0 0 -
Male open YOI 0 0 -
Semi open 0 0 -
Cluster 72 73 101%
Aggregated* Totals: 1129* 1,133 100.4%
Functionname
Aggregated* annualtarget
SOTPcompletions
Percentageof aggregated*
targets
*Individual targets were set at establishment level. These targets have been aggregated to function group and national level to provide an overall comparison against outcomes in the table above.
20
NOMS Annual Report 2009/10:
Management Information Addendum
Drug strategy
The National Offender Management Service has in place a comprehensive drug strategy. It has three key elements:
i. reducing the supply of drugs into prisons, through security measures and drug testing programmes;
ii. reducing demand, through targeted interventions for low, moderate and severe drug-misusers both in prisons and managed in the community; and
iii. establishing effective through-care links to ensure continuity of treatment and support between prisons, probation trusts and community services in order to safeguard the gains made in the criminal justice system.
Prisons deploy a comprehensive range of measures to reduce the supply of drugs into prisons including the random Mandatory Drug Testing (rMDT) programme which is the best available measure of the prevalence of drugs misuse in prisons. NOMS has in place a comprehensive drug treatment framework to address the different needs of drug-misusers in prison. The interventions available are designed to meet the needs of low, moderate and severe drug misusers – irrespective of age, gender or ethnicity.
The drug rehabilitation requirement (DRR), available as part of a Community Order or Suspended Sentence Order, is the primary means for sentenced offenders to address identified drug misuse within community sentencing.
Random Mandatory drug testing (national KPI)
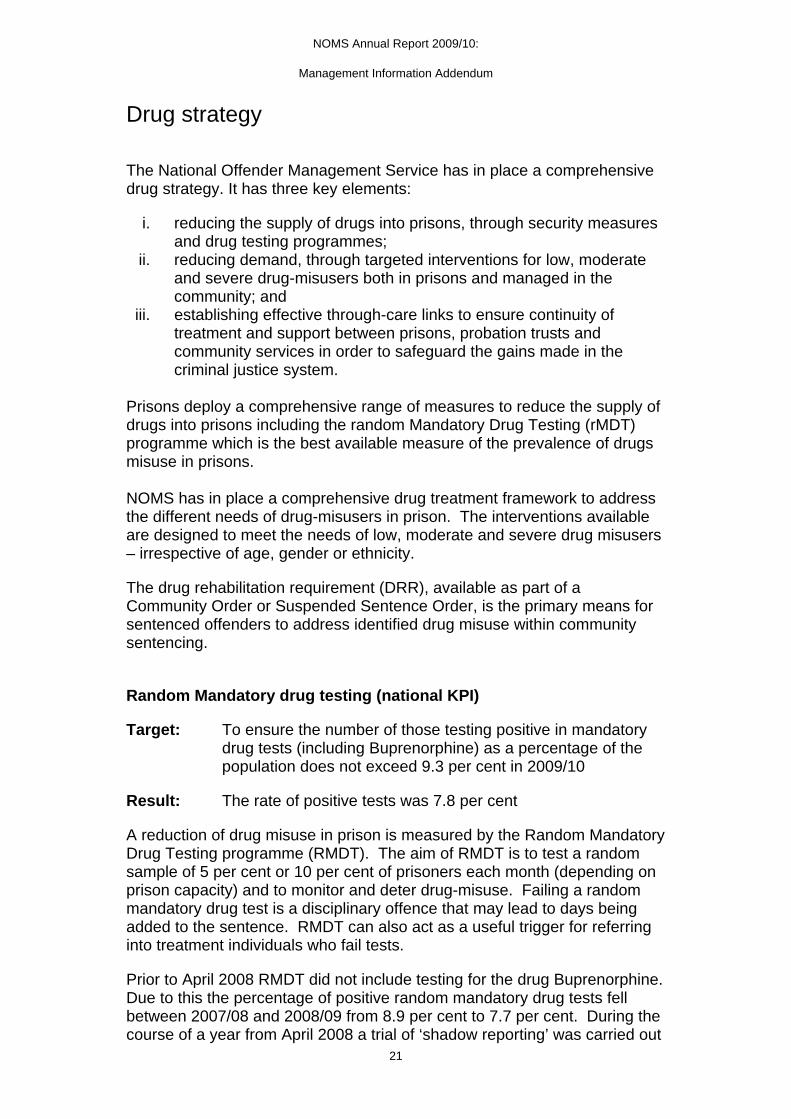
Target: To ensure the number of those testing positive in mandatory drug tests (including Buprenorphine) as a percentage of the population does not exceed 9.3 per cent in 2009/10
Result: The rate of positive tests was 7.8 per cent
A reduction of drug misuse in prison is measured by the Random Mandatory Drug Testing programme (RMDT). The aim of RMDT is to test a random sample of 5 per cent or 10 per cent of prisoners each month (depending on prison capacity) and to monitor and deter drug-misuse. Failing a random mandatory drug test is a disciplinary offence that may lead to days being added to the sentence. RMDT can also act as a useful trigger for referring into treatment individuals who fail tests.
Prior to April 2008 RMDT did not include testing for the drug Buprenorphine. Due to this the percentage of positive random mandatory drug tests fell between 2007/08 and 2008/09 from 8.9 per cent to 7.7 per cent. During the course of a year from April 2008 a trial of ‘shadow reporting’ was carried out
21

NOMS Annual Report 2009/10:
Management Information Addendum
to test all samples for Buprenorphine to gain a clear understanding of the impact this would have on the figures. However as this was only a trial the positive results for this drug were not counted towards the KPI figures for this period (2008/09). From April 2009 onwards all RMDTs positive for Buprenorphine have counted towards the KPI figures. Figure 14 shows a fall in the positive rate of RMDTs between 2008/09 and 2009/10.
Figure 14: Percentage of positive random mandatory drugs tests (RMDTs)
0%
1%
2%
3%
4%
5%
6%
7%
8%
9%
10%
2008/09 2009/10
YTD MDT Rate including Buprenorphine Target
As previously stated above RMDT rates including the drug Buprenorphine were monitored for '08/09 but were not assigned a target. For comparison purposes the rates including Buprenorphine are displayed.
The percentage of positive random mandatory drug tests fell slightly between 2008/09 and 2009/10 for most prison functions (see Figure 15). The rates of positive tests for each prison function in 2009/10 are set out in Table 12.
22

NOMS Annual Report 2009/10:
Management Information Addendum
Figure 15: Rate of positive random mandatory drug testing in 2009/10 compared to 2008/09 by prison function
0.0%
2.0%
4.0%
6.0%
8.0%
10.0%
12.0%
14.0%
Mal
e ca
tego
ry B
Mal
e ca
tego
ry C
Mal
e di
sper
sal
Fem
ale
clos
ed
Fem
ale
loca
l
Fem
ale
open
Mal
e cl
osed
YO
I
Mal
e Y
OI -
You
ngP
eopl
e
Mal
e lo
cal
Mal
e op
en
Mal
e op
en Y
OI
Sem
i ope
n
Clu
ster
Percentage positive tests including buprenorphine - (Shadow measure in 2008/09)Percentage of KPI positive tests 2009/10
Table 12: Rate of positive RMDT by prison function 2009/10
Functionname
No. of mandatorydrug tests
No. of positiveresults
Percentage ofpositive tests
Male category B 3,450 201 5.8%
Male category C 16,239 1,113 6.9%
Male dispersal 1,874 86 4.6%
Female closed 1,040 39 3.8%
Female local 1,826 106 5.8%
Female open 261 4 1.5%
Male closed YOI 5,135 175 3.4%
Male YOI - Young People 1,428 28 2.0%
Male local 19,958 2,239 11.2%
Male open 2,116 209 9.9%
Male open YOI 354 38 10.7%
Semi open 1,517 40 2.6%
Cluster 3,231 271 8.4%
Totals: 58,429 4,549 7.8%
23

NOMS Annual Report 2009/10:
Management Information Addendum
Drug rehabilitation requirement (DRR)
The DRR is an intensive vehicle for tackling the drug misuse and offending of many of the most serious and persistent drug misusing offenders. DRRs involve treatment, regular testing and court reviews of progress and are subject to rigorous enforcement.
DRRs last between six months and three years, and aim to help offenders produce personal action plans that identify what they must do to stop their use of drugs and offending behaviour. They help offenders to identify realistic ways of changing their lives for the better; develop their victim awareness; and provide a credible and well-enforced option for the courts.
DRR completion rates
The main performance indicator for DRRs in 2009/10 was the completion rate.
Target: 45 per cent of DRRs to be successfully completed
Result: 56 per cent of DRRs were successfully completed
A breakdown of the completion rates at regional level is provided in Table 13.
Table 13: DRR completion rates in the community 2009/10
RegionAnnual
targetTerminations (successful
and unsuccessful)Successful
CompletionsCompletion
Rate
East Midlands 44% 1,335 695 52%
East of England 45% 1,064 573 54%
London 45% 2,596 1,430 55%
North East 47% 897 595 66%
North West 46% 2,535 1,534 61%
South East 46% 1,938 1,078 56%
South West 46% 1,190 702 59%
Wales 45% 1,019 502 49%
West Midlands 44% 1,748 864 49%
Yorkshire & Humberside 45% 1,740 1,041 60%
National Total 45% 16,062 9,014 56%
24

NOMS Annual Report 2009/10:
Management Information Addendum
DRR completion volumes in the community
A secondary indicator for DRRs in 2009/10 was completion volumes.
The number of DRR completions increased in all of the English regions and Wales in 2009/10 compared to 2008/09, as shown in Figure 16. Table 14 shows the number of DRR completions nationally and regionally compared to aggregated local targets by region for 2009/10.
Figure 16: Number of DRR completions in the community compared to previous year by region
-
200
400
600
800
1,000
1,200
1,400
1,600
1,800
Eas
tM
idla
nds
Eas
t of
Eng
land
Lond
on
Nor
th E
ast
Nor
th W
est
Sou
th E
ast
Sou
th W
est
Wal
es
Wes
tM
idla
nds
Yor
kshi
re &
Hum
bers
ide
DRR completions 2008/09
DRR completions 2009/10
25

NOMS Annual Report 2009/10:
Management Information Addendum
Table 14: Number of DRR completions by region 2009/10
RegionAggregated*
annual targetDRR
Completions
Percentage of aggregated*
target
East Midlands 570 695 122%East of England 479 573 120%London 1,164 1,430 123%North East 495 595 120%North West 1,092 1,534 140%South East 828 1,078 130%South West 530 702 132%Wales 360 502 139%West Midlands 708 864 122%Yorkshire & Humberside 788 1,041 132%
Aggregated* Totals: 7,014 9,014 129%
Individual targets were set at trust level. These targets have been aggregated to regional and national level in the table above to provide an overall comparison against outcomes.
DRR starts in the community
Data was also collected on DRR starts. Although targets are set at trust level, probation trusts were not formally assessed against them.
Figure 17 shows that most regions had a decrease in DRR starts in 2009/10 compared to 2008/09. This reduction is partly due to police initiatives which divert offenders from charge and a change in focus from commencement to completion targets. Table 15 shows the number of DRR starts regionally and nationally against aggregated local targets for 2009/10.
26

NOMS Annual Report 2009/10:
Management Information Addendum
Figure 17: Number of DRR starts compared to previous year by region
-
500
1,000
1,500
2,000
2,500
3,000
Eas
tM
idla
nds
Eas
t of
Eng
land
Lond
on
Nor
th E
ast
Nor
th W
est
Sou
th E
ast
Sou
th W
est
Wal
es
Wes
tM
idla
nds
Yor
kshi
re &
Hum
bers
ide
DRR starts 2008/09
DRR starts 2009/10
Table 15: Number of DRR starts 2009/10
RegionAggregated*
annual targetDRR Starts
Percentage of aggregated target
East Midlands 1,303 1,240 95%
East of England 1,074 1,020 95%
London 2,586 2,287 88%
North East 1,089 1,081 99%
North West 2,567 2,368 92%
South East 1,874 1,854 99%
South West 1,146 1,204 105%
Wales 1,070 1,098 103%
West Midlands 1,645 1,704 104%
Yorkshire & Humberside 1,932 1,906 99%
Aggregated Totals: 16,286 15,762 97%
*Individual targets were set at trust level. These targets have been aggregated to regional and national level in the table above to provide an overall comparison against outcomes.
27

NOMS Annual Report 2009/10:
Management Information Addendum
Drug treatment programme completions in custody
There has been a fall in the number of drug treatment programme completions in custody from 8,054 in 2008/09 to 7,629 in 2009/10. Comparisons between the numbers starting and completing these programmes in 2008/09 and 2009/10 by prison function are shown in Figure 18 and Table 16.
Figure 18: Drug treatment starts and completions in 2009/10 compared to 2008/09 by prison function
0
1,000
2,000
3,000
4,000
5,000
6,000
Mal
e ca
tego
ry B
Mal
e ca
tego
ry C
Mal
e di
sper
sal
Fem
ale
clos
ed
Fem
ale
loca
l
Fem
ale
open
Mal
e cl
osed
YO
I
Mal
e Y
OI -
You
ngP
eopl
e
Mal
e lo
cal
Mal
e op
en
Mal
e op
en Y
OI
Sem
i ope
n
Clu
ster
Drug treatment starts (2008/09)
Drug treatment starts (2009/10)
Drug treatment completions (2008/09)
Drug treatment completions (2009/10)
Table 16: Drug treatment starts and completions in custody in 2009/10 compared to 2008/09
Male category B 98 70 100 80
Male category C 2,470 1,909 2,701 2,042
Male dispersal 95 84 81 67
Female closed 86 64 88 65
Female local 645 448 622 438
Female open 0 0 0 0
Male closed YOI 948 670 1,060 806
Male YOI - Young People 0 0 0
Male local 4,718 3,495 5,012 3,624
Male open 315 265 458 378
Male open YOI 101 84 98 78
Semi open 14 6 16 11
Cluster 716 534 645 465
Drugtreatmen
0
tcompletions
(2008/09)
Functionname
Drug treatment starts
(2009/10)
Drug treatment starts (2008/09)
10,881
Drug treatment completions
(2009/10)
8,054National Totals: 10,206 7,629
28

NOMS Annual Report 2009/10:
Management Information Addendum
Alcohol treatment
The alcohol treatment requirement (ATR) is one of 12 requirements that may be applied to a Community Order or Suspended Sentence Order. It provides access to a tailored treatment programme with the aim of reducing or eliminating alcohol dependency and is targeted at offenders with the most serious alcohol misuse and offending who require intensive, specialist, care-planned treatment and integrated care involving a range of agencies. The requirement can last between six months and three years as part of a Community Order and six months and two years when part of a Suspended Sentence Order.
Alcohol treatment requirement completion rate
The main performance indicator for ATRs in 2009/10 was the completion rate.
Target: 47 per cent of ATRs to be successfully completed
Result: 72 per cent of ATRs were successfully completed
A breakdown by region is provided in Table 17.
Table 17: ATR completions rates by region
Region Annual target All terminationsSuccessful
CompletionsCompletion
Rate
East Midlands 50% 818 598 73%
East of England 46% 1,273 898 71%
London 50% 1,703 1,259 74%
North East 40% 154 121 79%
North West 45% 550 415 75%
South East 59% 1,300 946 73%
South West 42% 241 186 77%
Wales 40% 128 65 51%
West Midlands 40% 514 325 63%
Yorkshire & Humberside 40% 926 698 75%
National Total 47% 7,607 5,511 72%
Alcohol treatment requirement (ATR) completions
A secondary indicator for ATRs in 2009/10 was the completion volumes.
Figure 19 shows the number of ATR completions by region in 2009/10 compared to 2008/09. Table 18 shows the number of ATR completions nationally and regionally compared to aggregated local targets.
29

NOMS Annual Report 2009/10:
Management Information Addendum
Figure 19: Number of ATR completions in the community
-
200
400
600
800
1,000
1,200
1,400
Eas
tM
idla
nds
Eas
t of
Eng
land
Lond
on
Nor
th E
ast
Nor
th W
est
Sou
th E
ast
Sou
th W
est
Wal
es
Wes
tM
idla
nds
Yor
kshi
re &
Hum
bers
ide
ATR completions 2008/09
ATR completions 2009/10
Table 18: ATR completions by region 2009/10
RegionAggregated*
annual targetATR
Completions
Percentage of aggregated*
targetEast Midlands 231 598 259%East of England 560 898 160%London 500 1,259 252%North East 86 121 141%North West 193 415 215%South East 475 946 199%South West 96 186 194%Wales 81 65 80%West Midlands 158 325 206%Yorkshire & Humberside 300 698 233%
Aggregated* Totals: 2,680 5,511 206%
*Individual targets were set at trust level. These targets have been aggregated to regional and national level in the table above to provide an overall comparison against outcomes.
30

NOMS Annual Report 2009/10:
Management Information Addendum
Unpaid work (Community Payback)
Unpaid Work is one of 12 requirements that the sentencing court may apply to a Community order or Suspended Sentence Order in order to a meet the sentencing purposes of punishment and reparation. For some offenders there are also rehabilitative benefits, as unpaid work can provide an opportunity to develop life and vocational skills that reduce the risk of re-offending. As well as providing an effective punishment, it also enables offenders to make reparation to their local communities, by benefiting those communities with their labours. Community Payback is the scheme by which the sentence of unpaid work is delivered.
Unpaid work completion rates
The main performance indicator for unpaid work completions in 2009/10 was the completion rate.
Target: 73 per cent of unpaid work requirements to be successfully completed
Result: 74 per cent of unpaid work requirements were successfully completed
Table 19: Unpaid work completion rates against target by region 2009/10
Region Annual targetTerminations
(successful and unsuccessful)
Successful Completions
Completion Rate
East Midlands 73% 7,485 5,641 75%East of England 73% 8,770 6,529 74%London 73% 14,052 10,100 72%North East 74% 3,870 3,072 79%North West 72% 13,987 10,397 74%South East 73% 11,513 8,705 76%South West 73% 5,386 3,981 74%Wales 73% 6,147 4,669 76%West Midlands 73% 9,838 7,004 71%Yorkshire & Humberside 73% 9,986 7,685 77%
National Total 73% 91,034 67,783 74%
31

NOMS Annual Report 2009/10:
Management Information Addendum
Unpaid work completion volumes
A secondary indicator for unpaid work in 2009/10 was the completion volume.
Figure 20 shows that the volume of unpaid work completions increased between 2008/09 and 2009/10 in all regions. Table 20 shows the number of unpaid work completions compared to local aggregated targets for 2009/10.
Figure 20: Number of unpaid work completions compared to previous year by region
-
2,000
4,000
6,000
8,000
10,000
12,000
Eas
tM
idla
nds
Eas
t of
Eng
land
Lond
on
Nor
th E
ast
Nor
th W
est
Sou
th E
ast
Sou
th W
est
Wal
es
Wes
tM
idla
nds
Yor
kshi
re &
Hum
bers
ide
Unpaid Work completions 2008/09
Unpaid Work completions 2009/10
Table 20: Number of unpaid work completions by region
RegionAnnual Target
Unpaid Work Completions
Percentage of target
East Midlands 4,007 5,641 141%East of England 5,140 6,529 127%London 8,700 10,100 116%North East 2,400 3,072 128%North West 8,265 10,397 126%South East 6,812 8,705 128%South West 3,360 3,981 118%Wales 2,981 4,669 157%West Midlands 5,181 7,004 135%Yorkshire & Humberside 6,190 7,685 124%
National Totals: 53,036 67,783 128%
32

NOMS Annual Report 2009/10:
Management Information Addendum
Unpaid work stand-downs
A stand-down is when an offender is instructed in advance not to report for work, or when ready and willing offenders are sent home after reporting for work due to operational difficulties in the probation area (e.g. insufficient supervisor coverage, lack of transport, or work availability).
Target: To ensure that the proportion of unpaid work days lost because of stand-downs does not exceed 2.7 per cent in 2009/10
Result: 1.0 per cent of unpaid work days lost because of stand-downs
The proportion of days lost fell between 2008/09 and 2009/10 from 1.7 per cent to 1 per cent.
The proportion of unpaid work days lost fell between 2008/09 and 2009/10 for the majority of regions, as illustrated by Figure 21. Table 21 shows the proportion of unpaid work offender days lost because of stand-downs compared to local aggregated targets for 2009/10.
Figure 21: Proportion of unpaid work offender days lost because of stand-downs in 2009/10 compared to 2008/09 by region
0.0%
0.5%
1.0%
1.5%
2.0%
2.5%
3.0%
3.5%
4.0%
Eas
tM
idla
nds
Eas
t of
Eng
land
Lond
on
Nor
th E
ast
Nor
th W
est
Sou
th E
ast
Sou
th W
est
Wal
es
Wes
tM
idla
nds
Yor
kshi
re &
Hum
bers
ide
% of Unpaid Work days lost due to stand-dow ns 2008/09
% of Unpaid Work days lost due to stand-dow ns 2009/10
33

NOMS Annual Report 2009/10:
Management Information Addendum
Table 21: Proportion of unpaid work offender days lost because of stand-downs 2009/10
RegionAnnual Target (not
to exceed)Days Lost Days Planned % of Days Lost
East Midlands 1.6% 482 157,620 0.3%East of England 4.0% 3,966 223,492 1.8%London 4.0% 4,154 312,598 1.3%North East 1.0% 178 89,661 0.2%North West 1.5% 393 321,882 0.1%South East 4.1% 7,876 273,701 2.9%South West 4.2% 1,849 127,029 1.5%Wales 1.9% 558 139,285 0.4%West Midlands 3.7% 1,671 223,508 0.7%Yorkshire & Humberside 1.1% 686 241,794 0.3%
National Total 2.7% 21,813 2,110,570 1.0%
34
NOMS Annual Report 2009/10:
Management Information Addendum
Compliance and enforcement
The probation service has made progress in increasing offender compliance and ensuring that timely enforcement action is taken where offenders fail to abide by the requirements of their sentence. Seventy-five percent of orders and licences were successfully completed in 2009/10, while 67 per cent of breaches were resolved within 25 working days.
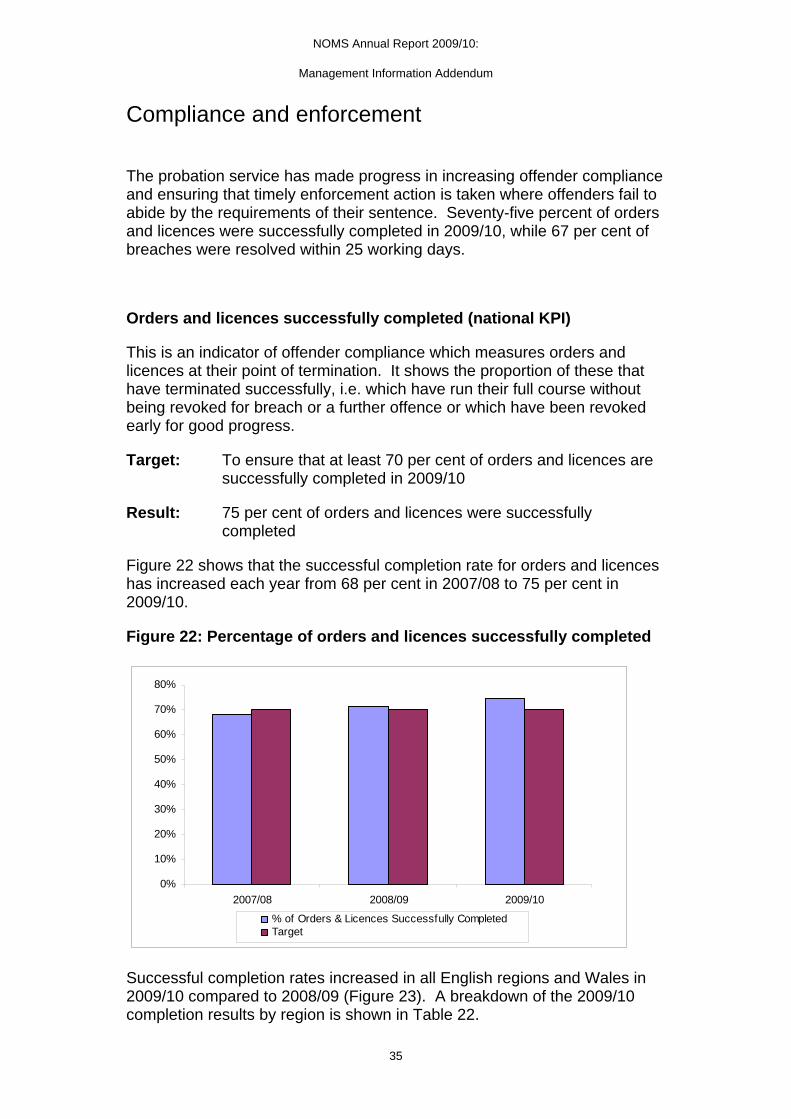
Orders and licences successfully completed (national KPI)
This is an indicator of offender compliance which measures orders and licences at their point of termination. It shows the proportion of these that have terminated successfully, i.e. which have run their full course without being revoked for breach or a further offence or which have been revoked early for good progress.
Target: To ensure that at least 70 per cent of orders and licences are successfully completed in 2009/10
Result: 75 per cent of orders and licences were successfully completed
Figure 22 shows that the successful completion rate for orders and licences has increased each year from 68 per cent in 2007/08 to 75 per cent in 2009/10.
Figure 22: Percentage of orders and licences successfully completed
0%
10%
20%
30%
40%
50%
60%
70%
80%
2007/08 2008/09 2009/10
% of Orders & Licences Successfully CompletedTarget
Successful completion rates increased in all English regions and Wales in 2009/10 compared to 2008/09 (Figure 23). A breakdown of the 2009/10 completion results by region is shown in Table 22.
35

NOMS Annual Report 2009/10:
Management Information Addendum
Figure 23: Percentage of orders and licences successfully completed in 2009/10 compared to 2008/09 by region
0%
20%
40%
60%
80%
100%
Eas
tM
idla
nds
Eas
t of
Eng
land
Lond
on
Nor
th E
ast
Nor
th W
est
Sou
th E
ast
Sou
th W
est
Wal
es
Wes
tM
idla
nds
Yor
kshi
re &
Hum
bers
ide
% orders & licences successfully completed 2008/09
% orders & licences successfully completed 2009/10
Table 22: Percentage of orders and licences successfully completed in 2009/10 by region
RegionAnnual Target
Successful Completions
All Order & Licence
Terminations
% Successful Completions
East Midlands 71% 11,565 15,712 74%East of England 71% 12,874 17,509 74%London 70% 21,185 29,135 73%North East 74% 9,463 11,709 81%North West 70% 23,956 31,823 75%South East 71% 17,396 23,253 75%South West 70% 9,659 12,677 76%Wales 70% 9,395 12,975 72%West Midlands 70% 17,535 24,229 72%Yorkshire & Humberside 71% 15,911 20,594 77%
National Total 70% 148,939 199,616 75%
36
NOMS Annual Report 2009/10:
Management Information Addendum
Resolution of breaches of community penalties
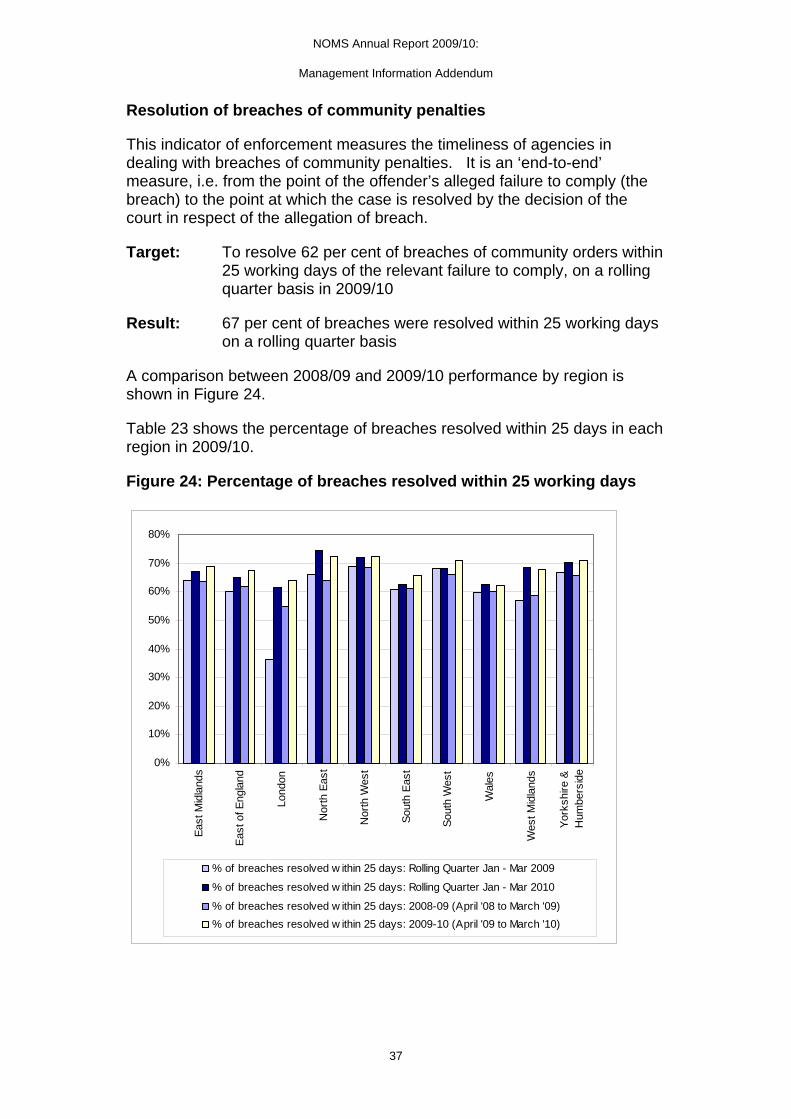
This indicator of enforcement measures the timeliness of agencies in dealing with breaches of community penalties. It is an ‘end-to-end’ measure, i.e. from the point of the offender’s alleged failure to comply (the breach) to the point at which the case is resolved by the decision of the court in respect of the allegation of breach.
Target: To resolve 62 per cent of breaches of community orders within 25 working days of the relevant failure to comply, on a rolling quarter basis in 2009/10
Result: 67 per cent of breaches were resolved within 25 working days on a rolling quarter basis
A comparison between 2008/09 and 2009/10 performance by region is shown in Figure 24.
Table 23 shows the percentage of breaches resolved within 25 days in each region in 2009/10.
Figure 24: Percentage of breaches resolved within 25 working days
0%
10%
20%
30%
40%
50%
60%
70%
80%
Eas
t Mid
land
s
Eas
t of E
ngla
nd
Lond
on
Nor
th E
ast
Nor
th W
est
Sou
th E
ast
Sou
th W
est
Wal
es
Wes
t Mid
land
s
Yor
kshi
re &
Hum
bers
ide
% of breaches resolved w ithin 25 days: Rolling Quarter Jan - Mar 2009
% of breaches resolved w ithin 25 days: Rolling Quarter Jan - Mar 2010
% of breaches resolved w ithin 25 days: 2008-09 (April '08 to March '09)
% of breaches resolved w ithin 25 days: 2009-10 (April '09 to March '10)
37

NOMS Annual Report 2009/10:
Management Information Addendum
Table 23: Proportion of breaches resolved within 25 working days 2009/10
Region Annual Target
Breaches resolved within 25 days
(rolling quarter ending March
2010)
Breaches resolved within 25 days
(April 2009 - March 2010)
East Midlands 62% 67% 69%East of England 61% 65% 67%London 60% 61% 64%North East 61% 75% 72%North West 63% 72% 72%South East 61% 63% 66%South West 62% 68% 71%Wales 60% 62% 62%West Midlands 60% 69% 68%Yorkshire & Humberside 63% 70% 71%
National Total 62% 67% 68%
In line with other partner agencies on Local Criminal Justice Boards (LCJBs), who jointly own the target, NOMS reports performance against it on a rolling quarter basis (3rd column). Full-year figures for 2009/10 are provided for comparison (4th column).
Orders and licences reaching the six months stage without requiring breach action by region
This is an indicator of offender compliance during the first six months of supervision in the community. Breach action must be taken by the probation service on or before second unacceptable absence to comply where the offender is on an order, or on or before the third unacceptable failure where the offender is on licence following release from prison. Orders and licences where there has been no second or third failure are classed as compliant for the purposes of this indicator.
Figure 25 shows that eight of the English regions and Wales achieved an improvement in this area in 2009/10 compared to 2008/09. The results by region for 2009/10 are set out in Table 24.
38

NOMS Annual Report 2009/10:
Management Information Addendum
Figure 25: Percentage of orders and licences reaching 6 months without requiring breach action in 2009/10 compared to 2008/09 by region
0%
20%
40%
60%
80%
100%
Eas
tM
idla
nds
Eas
t of
Eng
land
Lond
on
Nor
th E
ast
Nor
th W
est
Sou
th E
ast
Sou
th W
est
Wal
es
Wes
tM
idla
nds
Yor
kshi
re &
Hum
bers
ide
% orders & licences reaching 6 months w ithout breach 2008/09
% orders & licences reaching 6 months w ithout breach 2009/10
Table 24: Percentage of orders and licences reaching 6 months without requiring breach action 2009/10
RegionTotal no. of cases
not requiring breach action
Total cases sampled% Not requiring
breach action
East Midlands 2,420 3,186 76%
East of England 2,407 3,128 77%
London 3,136 4,314 73%
North East 2,231 2,628 85%
North West 5,819 7,103 82%
South East 3,731 4,832 77%
South West 1,947 2,551 76%
Wales 1,732 2,248 77%
West Midlands 3,352 4,384 76%
Yorkshire & Humberside 3,249 4,175 78%
National Total 30,024 38,549 78%
39

NOMS Annual Report 2009/10:
Management Information Addendum
Employment
Lack of employment is one of the factors associated with re-offending. Many offenders have very poor experience of education and no experience of stable employment.
Employment at end of sentence (national KPI)
Target: At least 35 per cent of offenders to be in employment at the end of their sentence in 2009/10
Result: 35 per cent of offenders were in employment at the end of their sentence in 2009/10
The NOMS employment KPI is a joint (prisons and probation) indicator introduced for 2009/10. It covers prisoners released from custody from sentences of less than 12 months and offenders at the end of their supervision on an order or licence by the probation service.
Figure 26 shows the outturn at regional level for probation, prisons (including High Security estate) and jointly across the Agency.
Figure 26: Percentage of offenders in employment at discharge/termination of order/licence in 2009/10
0%
10%
20%
30%
40%
50%
60%
Eas
tM
idla
nds
Eas
t of
Eng
land
Hig
hS
ecur
ity
Lond
on
Nor
th E
ast
Nor
th W
est
Sou
th E
ast
Sou
th W
est
Wal
es
Wes
tM
idla
nds
Yor
kshi
re &
Hum
bers
ide
Employment on discharge for prisoners serving less than 12 mths (prisons only)Employment at termination of order/licence (probation only)NOMS agency KPI: employment at end of sentence
40

NOMS Annual Report 2009/10:
Management Information Addendum
Employment on release
Target: To ensure that 23.8 per cent of prisoners enter employment upon release in 2009/10
Result: 25.2 per cent of prisoners entered employment upon release
This indicator covers all discharges from custody (sentences of less than 12 months and sentences of 12 months and over). Figure 27 shows by function the general decline in the percentage of offenders entering employment on release at a time of economic recession. A breakdown by prison function is set out in Table 25.
Figure 27: Percentage of employment outcomes compared to previous year by prison function
0102030405060708090
100
Mal
e ca
tego
ry B
Mal
e ca
tego
ry C
Mal
e di
sper
sal
Fem
ale
clos
ed
Fem
ale
loca
l
Fem
ale
open
Mal
e cl
osed
YO
I
Mal
e Y
OI -
You
ng P
eopl
e
Mal
e lo
cal
Mal
e op
en
Mal
e op
en Y
OI
Sem
i ope
n
Clu
ster
% of Employment Outcomes (2008/09)
% of Employment Outcomes (2009/10)
41

NOMS Annual Report 2009/10:
Management Information Addendum
Table 25: Percentage of employment outcomes in prisons in 2009/10
Male category B 35.1 27.6 79%
Male category C 25.5 28.1 110%
Male dispersal 0.0 2.3 -
Female closed 19.5 23.9 122%
Female local 6.0 8.2 136%
Female open 31.3 29.0 93%
Male closed YOI 19.2 22.2 116%
Male YOI - Young People 4.9 7.2 146%
Male local 23.8 24.4 103%
Male open 40.3 42.3 105%
Male open YOI 30.1 32.1 107%
Semi open 26.2 31.9 122%
Cluster 30.8 34.7 113%
Percentageof target
23.8* 25.2
Annualtarget
% Employment Outcomes
106%
Functionname
National Totals:
*Prison Service national target (local targets do not aggregate to the Prison Service national target).
Employment at termination of order/licence
Target: To ensure that 42 per cent of offenders are in employment at termination of their order or licence in 2009/10
Result: 42 per cent of offenders were in employment at termination of their order or licence
Figure 28 shows the percentage of offenders in employment at the end of their probation supervision on an order or licence in 2009/10 compared to 2008/09.
42

NOMS Annual Report 2009/10:
Management Information Addendum
Figure 28: Percentage of offenders employed at termination of order/licence
0%
10%
20%
30%
40%
50%
60%E
ast
Mid
land
s
Eas
t of
Eng
land
Lond
on
Nor
th E
ast
Nor
th W
est
Sou
th E
ast
Sou
th W
est
Wal
es
Wes
tM
idla
nds
Yor
kshi
re &
Hum
bers
ide
% employed at end of order/licence 2008/09
% employed at end of order/licence 2009/10
Table 26 provides a regional breakdown of percentage of offenders in employment.
Offenders in employment at termination of order or licence 2009/10 Table 26:
RegionAnnual Target
Total employed
Total Terminations% Employed at
Termination
East Midlands 42% 2,666 5,720 47%
East of England 43% 2,847 5,931 48%
London 40% 4,220 10,749 39%
North East 40% 2,200 5,319 41%
North West 42% 5,458 13,010 42%
South East 45% 3,837 8,454 45%
South West 40% 2,109 4,728 45%
Wales 40% 1,683 3,929 43%
West Midlands 41% 3,908 9,628 41%
Yorkshire & Humberside 40% 2,871 7,651 38%
National Total 42% 31,799 75,119 42%
43

NOMS Annual Report 2009/10:
Management Information Addendum
Sustaine ent in the community d employm
This indicator measures progress in supporting offenders into sustainable ent.
Target: To ensure that 14,028 offenders under supervision in
ult: 16,913 offenders under supervision in the community found and sustained employment
by A breakdown of the 2009/10 results by region are shown in Table
27.
Figure 29: Number of offenders under probation supervision who find and sustain employment for 4 weeks compared to previous year by region
employm
the community find and sustain employment in 2009/10
Res
Figure 29 compares the results for 2009/10 to those achieved in 2008/09 region.
-
500
1,000
1,5002,000
2,500
3,000
3,500
4,000
Eas
tM
idla
nds
Eas
t of
Eng
land
Lond
on
Nor
th E
ast
No So
So
Yor
Hu
rth
Wes
t
uth
Eas
t
uth
Wes
t
Wal
es
Wes
tM
idla
nds
kshi
re &
mbe
rsid
e
Offenders sustaining employment 2008/09
Offenders sustaining employment 2009/10
Table 27: Number of offenders under probation supervision who find and sustain employment for 4 weeks 2009/10
RegionAnnual Target
Sustained Employment
Percentage of target
East Midlands 1124 1229 109%
East of England 1233 1468 119%
London 2400 3534 147%
North East 705 812 115%
North West 2075 2749 132%
South East 1646 1931 117%
South West 994 1117 112%
Wales 860 980 114%
West Midlands 1407 1488 106%
Yorkshire & Humberside 1584 1605 101%
National Totals: 14,028 16,913 121% 44

NOMS Annual Report 2009/10:
Management Information Addendum
Accommodation
Getting offenders into accommodation is the foundation for successful rehabilitation, resettlement and risk management. It can provide the anchor for a previously chaotic life and act as a springboard for other crucial steps, such as getting and keeping a job, and accessing health care or drug treatment. NOMS aims to increase the number of offenders who have settled accommodation, either while being supervised in the community or to go to at the end of a custodial sentence.
Accommodation (national KPI)
Target: To ensure that at least 79 per cent of offenders to be in settled or suitable accommodation at the end of their sentence in 2009/10.
Result: 84 per cent of offenders were in settled or suitable accommodation at the end of their sentence in 2009/10.
A joint (prisons and probation) KPI was introduced in 2009/10 to measure the percentage of offenders in settled or suitable accommodation at end of their sentence. This indicator covers prisoners released from sentences of less than 12 months and offenders at the end of their supervision in the community.
Figure 30 provides the breakdown by region for probation and prisons (including the High Security prison estate) and the Agency totals.
Figure 30: Percentage of offenders in settled or suitable accommodation at the end of their sentence in 2009/10
0%10%20%30%40%50%60%70%80%90%
100%
Eas
tM
idla
nds
Eas
t of
Eng
land
Hig
hS
ecur
ity
Lond
on
Nor
th E
ast
Nor
th W
est
Sou
th E
ast
Sou
th W
est
Wal
es
Wes
tM
idla
nds
Yor
kshi
re &
Hum
bers
ide
Settled accommodation on discharge for prisoners serving less than 12 mths (prisons only)
Settled accommodation at termination of order (probation only)
NOMS agency KPI: employment at end of sentence
45

NOMS Annual Report 2009/10:
Management Information Addendum
Accommodation in prisons
Target: 81.7 per cent of prisoners to be in settled accommodation upon release.
Result: 89.1 per cent of prisoners were in settled accommodation upon release
This indicator covers all discharges from custody (sentences of less than 12 months and sentences of 12 months and over). Figure 31 shows the outturn by function in 2009/10 compared to 2008/09.
Figure 31: Percentage of prisoners in settled accommodation upon release compared to previous year by prison function
0.010.020.030.040.050.060.070.080.090.0
100.0
Mal
e ca
tego
ry B
Mal
e ca
tego
ry C
Mal
e di
sper
sal
Fem
ale
clos
ed
Fem
ale
loca
l
Fem
ale
open
Mal
e cl
osed
YO
I
Mal
e Y
OI -
You
ngP
eopl
e
Mal
e lo
cal
Mal
e op
en
Mal
e op
en Y
OI
Sem
i ope
n
Clu
ster
Accommodation (2008/09)Accommodation (2009/10)
Table 28 shows that targets were met in each function group.
46

NOMS Annual Report 2009/10:
Management Information Addendum
Table 28: Percentage settled accommodation
Male category B 89.1 90.4 101%
Male category C 81.9 90.3 110%
Male dispersal 80.2 91.9 114%
Female closed 82.4 86.9 105%
Female local 76.0 86.1 113%
Female open 86.8 93.9 108%
Male closed YOI 86.2 92.5 107%
Male YOI - Young People 85.0 93.8 110%
Male local 80.1 86.6 108%
Male open 86.9 96.1 111%
Male open YOI 89.9 98.2 109%
Semi open 75.0 84.1 112%
Cluster 85.9 96.7 112%
National Totals:
Functionname
Annualtarget
% Settled Accommodation
Outcomes
Percentageof target
81.7* 89.1 109%
*Prison Service national target (local targets do not aggregate to the Prison Service national target).
Accommodation at termination of order/licence
Target: To ensure that 75 per cent of offenders are in settled and suitable accommodation at the end of their order or licence in 2009/10
Result: 82 per cent of offenders were in settled and suitable accommodation at the end of their order or licence
The percentage of offenders in accommodation at the end of their order or licence increased from 78 per cent in 2008/09 to 82 per cent in 2009/10. Increases were apparent across all regions (Figure 32) and all regional targets were met (Table 29).
47

NOMS Annual Report 2009/10:
Management Information Addendum
Figure 32: Percentage of offenders in accommodation at the end of their order or licence in 2009/10 compared to 2008/09 by region
0%
20%
40%
60%
80%
100%E
ast
Mid
land
s
Eas
t of
Eng
land
Lond
on
Nor
th E
ast
Nor
th W
est
Sou
th E
ast
Sou
th W
est
Wal
es
Wes
tM
idla
nds
Yor
kshi
re &
Hum
bers
ide
% in settled & suitable accomodation at end of order/licence 2008/09
% in settled & suitable accomodation at end of order/licence 2009/10
Table 29: Offenders in settled and suitable accommodation at termination of order or licence 2009/10
Region Target
No. of Offenders in Settled & Suitable
Accommodation at Termination
Total Terminations
% Settled & Suitable
East Midlands 78% 5,676 6,637 86%East of England 76% 5,612 6,683 84%London 70% 9,525 12,214 78%North East 82% 5,252 6,321 83%North West 76% 12,974 15,504 84%South East 72% 7,911 9,826 81%South West 72% 4,534 5,625 81%Wales 74% 3,901 4,877 80%West Midlands 75% 8,829 10,677 83%Yorkshire & Humberside 74% 6,954 8,447 82%
National Total 75% 71,168 86,811 82%
48

NOMS Annual Report 2009/10:
Management Information Addendum
Education
Referrals to education provision in the community
Many offenders have poor experience of education. The aim is to aid resettlement and enhance employability through skills and education.
Target: To ensure that 53,238 referrals are made to education provision in the community in 2009/10
Result: 60,251 were referred to education provision
Table 30 shows that the number of referrals exceeded target in Wales and seven of the English regions.
Table 30: Referrals to Education Providers in the Community 2009/10
RegionAnnual Target
Referrals to Education
Percentage of target
East Midlands 4,359 4,202 96%
East of England 3,730 5,978 160%
London 7,900 8,750 111%
North East 3,635 3,767 104%
North West 8,124 8,354 103%
South East 6,216 6,586 106%
South West 4,210 5,502 131%
Wales 3,011 5,155 171%
West Midlands 5,600 6,512 116%
Yorkshire & Humberside 6,453 5,445 84%
National Total 53,238 60,251 113%
Note: The definition of a referral was changed for 2009/10, so a comparison with 2008/09 is not possible.
Basic skills awards in prisons (contracted out prisons only)
In England in 2009/10 responsibility for the delivery of basic skills education in prisons lay with the Skills Funding Agency. However, in contracted out prisons, where the Skills Funding Agency did not operate, prisons were themselves responsible for the achievement of education outcomes and targets are set for basic skills awards overall within which outcomes are recorded at entry level, Level 1 and Level 2. Targets are also set for Key Work Skills.
Figure 33 shows that while the number of entry level awards in Male Category B and Male YOI - Young People establishments increased in 2009/10 compared to 2008/09, the number fell in Male Category C and Female Local prisons).
49

NOMS Annual Report 2009/10:
Management Information Addendum
Figure 33: Number of entry level basic skills awards compared to last year by prison function (contracted out prisons only)
0200400
600800
1,0001,200
1,4001,600
Mal
e ca
tego
ry B
Mal
e ca
tego
ry C
Mal
e di
sper
sal
Fem
ale
clos
ed
Fem
ale
loca
l
Fem
ale
open
Mal
e cl
osed
YO
I
Mal
e Y
OI -
You
ngP
eopl
e
Mal
e lo
cal
Mal
e op
en
Mal
e op
en Y
OI
Sem
i ope
n
Clu
ster
No of aw ards(2008/09)No of aw ards(2009/10)
Table 31: Basic skills awards: entry level, Level 1 and Level 2 2009/10 (contracted out prisons only)
Male category B 693 593 351 1,637 1,461 112%
Male category C 132 306 137 575 472 122%Male dispersal 0 0 0 0 - -Female closed 0 0 0 0 - -Female local 177 137 5 319 250 128%Female open 0 0 0 0 - -Male closed YOI 0 0 0 0 - -Male YOI - Young People 277 258 87 622 500 124%Male local 1,338 1,377 601 3,316 3,221 103%Male open 0 0 0 0 - -Male open YOI 0 0 0 0 - -Semi open 0 0 0 0 - -
Cluster 0 0 0 0 - -
Total of all Basic Skills
Awards
Percentageof target
Targets
6469 110%5904Totals 2617
Functionname
Entry Level Basic Skills
Basic skills Awards Level
1
2671
Basic Skills
Awards Level 2
1181
In 2009/10 female local establishments achieved increases in the number of level 1 awards achieved compared to 2008/09, while the numbers fell in Male Category B, Male Category C, Male YOI – Young People and Male Local establishments.
50
NOMS Annual Report 2009/10:
Management Information Addendum
Figure 34: Number of Level 1 basic skills awards compared to last year by prison function (contracted out prisons only)
0
200
400
600
800
1,000
1,200
1,400
1,600M
ale
cate
gory
B
Mal
e ca
tego
ry C
Mal
e di
sper
sal
Fem
ale
clos
ed
Fem
ale
loca
l
Fem
ale
open
Mal
e cl
osed
YO
I
Mal
e Y
OI -
You
ngP
eopl
e
Mal
e lo
cal
Mal
e op
en
Mal
e op
en Y
OI
Sem
i ope
n
Clu
ster
No of aw ards(2008/09)No of aw ards(2009/10)
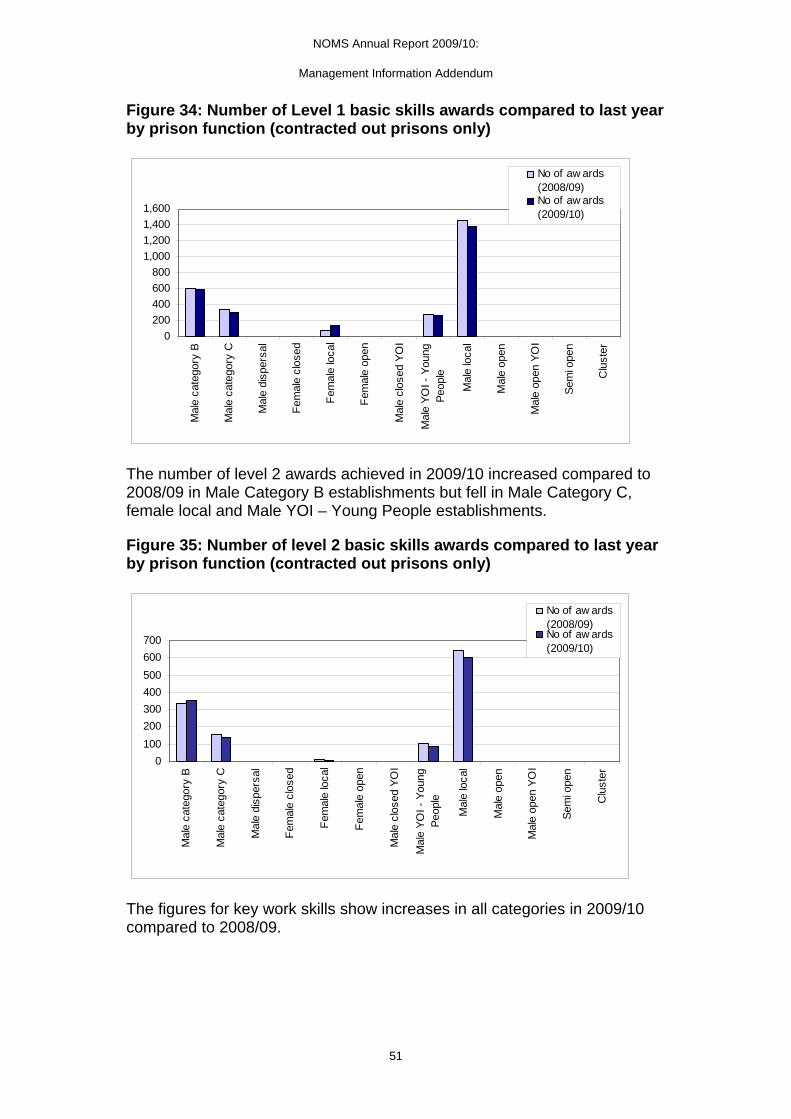
The number of level 2 awards achieved in 2009/10 increased compared to 2008/09 in Male Category B establishments but fell in Male Category C, female local and Male YOI – Young People establishments.
Figure 35: Number of level 2 basic skills awards compared to last year by prison function (contracted out prisons only)
0
100
200
300
400
500
600
700
Mal
e ca
tego
ry B
Mal
e ca
tego
ry C
Mal
e di
sper
sal
Fem
ale
clos
ed
Fem
ale
loca
l
Fem
ale
open
Mal
e cl
osed
YO
I
Mal
e Y
OI -
You
ngP
eopl
e
Mal
e lo
cal
Mal
e op
en
Mal
e op
en Y
OI
Sem
i ope
n
Clu
ster
No of aw ards(2008/09)No of aw ards(2009/10)
The figures for key work skills show increases in all categories in 2009/10 compared to 2008/09.
51

NOMS Annual Report 2009/10:
Management Information Addendum
Figure 36: Number of key work skills awards compared to last year by prison function (contracted out prisons only)
01,0002,0003,0004,0005,0006,0007,0008,000
Mal
e ca
tego
ry B
Mal
e ca
tego
ry C
Mal
e di
sper
sal
Fem
ale
clos
ed
Fem
ale
loca
l
Fem
ale
open
Mal
e cl
osed
YO
I
Mal
e Y
OI -
You
ng P
eopl
e
Mal
e lo
cal
Mal
e op
en
Mal
e op
en Y
OI
Sem
i ope
n
Clu
ster
No of aw ards(2008/09)
No of aw ards(2009/10)
Table 32: Key work skills awards 2009/10 (contracted out prisons only)
Male category B 4,775 3,658Male category C 812 440Male dispersal 0 0Female closed 0 0Female local 2,060 1,600Female open 0 0Male closed YOI 0 0Male YOI - Young People 4,378 3,000Male local 6,683 4,950Male open 0 0Male open YOI 0 0Semi open 0 0
Cluster 0 0
13648
Target
Totals 18708
Functionname
No. ofawards
52

NOMS Annual Report 2009/10:
Management Information Addendum
Education and Training on Release
Securing a place in education or training, on release from prison, can support rehabilitation and reintegration. Developing the skills and knowledge needed to enter the job market will improve offenders' employment prospects and may reduce the likelihood of re-offending.
Figure 37: Percentage of offenders with education or training places at the end of their sentence in 2009/10
0%
10%
20%
30%
40%
50%
60%
70%
Mal
e ca
tego
ry B
Mal
e ca
tego
ry C
Mal
e di
sper
sal
Fem
ale
clos
ed
Fem
ale
loca
l
Fem
ale
open
Mal
e cl
osed
YO
I
Mal
e Y
OI -
You
ng P
eopl
e
Mal
e lo
cal
Mal
e op
en
Mal
e op
en Y
OI
Sem
i ope
n
Clu
ster
Education and Training 2008/09Education and Training 2009/10
Table 33 Percentage Education and Training
Function name Annual target
% Education/TrainingOutcomes Percentage of target
Male category B 4.54% 3.67% 123.74%
Male category C 14.15% 17.84% 79.32%
Male dispersal 0.41% 2.33% 17.50%
Female closed 19.38% 21.64% 89.57%
Female local 7.81% 8.58% 90.92%
Female open 24.87% 22.26% 111.74%
Male closed YOI 18.95% 19.81% 95.67%
Male YOI - Young People 62.29% 64.78% 96.15%
Male local 7.69% 9.73% 79.06%
Male open 6.13% 8.69% 70.52%
Male open YOI 6.00% 13.88% 43.21%
Semi open 9.12% 11.96% 76.27%
Cluster 3.78% 4.05% 93.40%
Aggregated Total 11.21% 13.31% 84.22%
53

NOMS Annual Report 2009/10:
Management Information Addendum
Safety and decency in custody
Safer custody and the prevention of self-inflicted deaths and self-harm is one of the most challenging areas in prisons and is a high priority for NOMS.
Serious assaults (national KPI)
The serious assaults KPI measures the number of incidents in which at least one victim sustained a serious injury as a result of offences against the person, expressed as a percentage of the average prisoner population. An assault is classified as serious if it is a sexual assault; results in detention in outside hospital as an inpatient or requires medical treatment for concussion or internal injuries.
Target: To ensure the number of serious assaults does not exceed 1.9 per cent of the average population in 2009/10
Result: The total rate of serious assaults was 1.67 per cent
The rate of serious assaults fell from 1.8 per cent in 2007/08 to 1.67 per cent in 2009/10 (Figure 38).
Figure 38: Serious assaults rate
0.00%
0.50%
1.00%
1.50%
2.00%
2.50%
3.00%
2007/08 2008/09 2009/10
YTD Annualised Serious Assault as a % of prisoner population
Target
Note: Prior to 2008/09 NOMS presented targets/outturns inclusive of private prisons and adult public prisons but excluding Male YOI – Young People establishments and Immigration Centres. HMPS presented targets/outturns inclusive of adult public prisons, Male YOI – Young People establishments and Immigration Centres but excluding private prisons. Outturn data for previous years has been presented in this report on a consistent basis with 2008/09 outturns, but it is not possible to produce comparable targets retrospectively for previous years.
54

NOMS Annual Report 2009/10:
Management Information Addendum
The majority of serious assaults were on fellow prisoners with 72 per cent of total serious assaults. 16 per cent of serious assaults were on staff (Figure 40).
Figure 39: Percentage breakdown of total serious assaults by assault type
72%
9%
16%3%
On fellow prisoners
On others
On staff
Sexual assaults
Table 34: Serious assaults 2009/10
Male category B 28 1 7 0 36 1.37 0.79Male category C 214 7 23 24 268 1.54 1.14
Male dispersal 39 1 15 5 60 2.45 1.93
Female closed 2 0 0 1 3 1.03 0.35
Female local 9 0 6 9 24 1.82 1.07
Female open 0 0 0 0 0 0.45 0.00
Male closed YOI 214 4 34 12 264 3.75 3.81
Male YOI - Young People 58 0 21 5 84 6.29 6.72
Male local 388 14 87 53 542 1.83 1.74
Male open 3 1 0 0 4 0.57 0.14
Male open YOI 2 0 0 0 2 1.30 0.70
Semi open 4 0 1 2 7 0.82 0.42
Cluster 58 2 8 12 80 1.88 1.51
Escort Areas 0 8 16 1 25 N/A N/A
38 218
Serious assaults
Functionname
On fellow prisoners On others On staffSexual
assaultsTotal
1,399 1.90 1.67
Total assaults rate
Total assaults rate target
National Totals:* 1,019 124
*Prison Service national target (local targets do not aggregate to the Prison Service national target).
55

NOMS Annual Report 2009/10:
Management Information Addendum
Overcrowding (national KPI)
Overcrowding is measured as the percentage of prisoners who, at unlock on the last day of the month, are held in a cell, cubicle or room where the number of occupants exceeds the uncrowded capacity of the cell, cubicle or room. This includes the number of prisoners held two to a single cell, three prisoners in a cell designed for one or two and any prisoners held overcrowded in larger cells or dormitories. For example, if 12 prisoners occupy a dormitory with an uncrowded capacity of ten, then the 12 prisoners are counted as overcrowded.
In 2008/09 the average rate of overcrowding was 24 per cent which was within target.
Target: To ensure the number of prisoners held in accommodation units intended for fewer prisoners does not exceed 26 per cent of the population in 2009/10
Result: The average rate of overcrowding was 24 per cent
Figure 40 illustrates that the rate of overcrowding decreased slightly to 24 per cent after remaining at around 25 per cent for the preceding three years.
Figure 41 and Table 35 show that rates of overcrowding vary by prison function. The rate of overcrowding in male local establishments is still almost twice the national rate, despite a moderate fall.
Figure 40: Percentage of prisoners overcrowded
0.00%
5.00%
10.00%
15.00%
20.00%
25.00%
30.00%
2006/07 2007/08 2008/09 2009/10
YTD % Reported Overcrow ding Rate Target
Note: Prior to 2008/09 NOMS presented targets/outturns inclusive of private prisons and adult public prisons but excluding Male YOI – Young People establishments and Immigration Centres. HMPS presented targets/outturns inclusive of adult public prisons, Male YOI – Young People establishments and Immigration Centres but excluding private prisons. Outturn data for previous years has been presented in this report on a consistent basis with 2008/09 outturns, but it is not possible to produce comparable targets retrospectively for previous years.
56

NOMS Annual Report 2009/10:
Management Information Addendum
Figure 41: Percentage of overcrowding in 2009/10 compared to 2008/09 by prison function
0.0
10.0
20.0
30.0
40.0
50.0
60.0
Mal
e ca
tego
ry B
Mal
e ca
tego
ry C
Mal
e di
sper
sal
Fem
ale
clos
ed
Fem
ale
loca
l
Fem
ale
open
Mal
e cl
osed
YO
I
Mal
e Y
OI -
You
ngP
eopl
e
Mal
e lo
cal
Mal
e op
en
Mal
e op
en Y
OI
Sem
i ope
n
Clu
ster
Overcrow ding rate (2008/09)
Overcrow ding rate (2009/10)
Table 35: Overcrowding 2009/10
Male category B N/A 5.2
Male category C N/A 11.9
Male dispersal N/A 0.0
Female closed N/A 0.0
Female local N/A 7.3
Female open N/A 0.0
Male closed YOI N/A 13.8
Male YOI - Young People N/A 0.0
Male local N/A 48.1
Male open N/A 0.2
Male open YOI N/A 0.0
Semi open N/A 0.0
Cluster N/A 20.3
National Totals: 26.0* 24.1
Overcrowding rate
Functionname
Overcrowding Target
*The overcrowding target is set at a national level only
57

NOMS Annual Report 2009/10:
Management Information Addendum
Self-inflicted deaths
There were 58 self-inflicted deaths in custody in 2009/10. Although any death in custody is a tragedy, the rate of self-inflicted deaths among prisoners in England and Wales has fallen to its lowest level since 1996.
Figure 42: Percentage breakdown of self-inflicted deaths by prison function
Percentage breakdown of self-inflicted deaths by prison function
69%
9%
2%
5% 5%
2%
Male category B
Male category C
Male dispersal
Female closed
Female local
Male closed YOI
Male local
Cluster
Escort Areas
8%
Table 36: Self-inflicted deaths 2009/10
Male category B 3
Male category C 5
Male dispersal 1
Female closed 1
Female local 0
Female open 0
Male closed YOI 5
Male YOI - Young People 0
Male local 40
Male open 0
Male open YOI 0
Semi open 0
Cluster 3
Escort Areas 0
Functionname
Self-inflicteddeaths
Totals: 58
58

NOMS Annual Report 2009/10:
Management Information Addendum
Court Reports
Timeliness of Pre-Sentence Reports
In addition to supervising offenders in the community the probation service plays an important role in support of the courts by providing sentencers with the information they need for sentencing decisions. The vehicle for this information is the Pre-Sentence Report (PSR). The PSR is an assessment made prior to sentencing that takes into account the nature and seriousness of the offence, factors in the offender's background that led to the offence and the risk of further offending and/or risk of serious harm. In most cases the report includes a proposal on the offender’s suitability for different types of sentences.
In requesting a PSR the court will specify a particular timescale in which they wish to receive it. The probation service is measured against how successful they are in meeting these timescales.
Target: To ensure that 90 per cent of Pre-Sentence Reports are provided within the timescale set by the court.
Result: 98.9 per cent of Pre-Sentence Reports were provided within the timescale set by the court in 2009/10.
Table 37 below shows the timeliness of PSR provision by the probation service in each region in 2009/10.
Table 37: PSR Timeliness 2009/10
Region
Number of PSRs completed within timescale set by the court
Total number of PSRs requested
% of PSRs completed on time
East Midlands 16,641 16,885 98.6%East of England 15,840 15,933 99.4%London 29,782 30,404 98.0%North East 15,528 15,601 99.5%North West 32,518 32,765 99.2%South East 23,827 24,092 98.9%South West 15,025 15,101 99.5%Wales 13,671 13,779 99.2%West Midlands 23,720 24,080 98.5%Yorkshire & Humberside 24,642 24,940 98.8%National Total 211,194 213,580 98.9%
59

NOMS Annual Report 2009/10:
Management Information Addendum
Corporate: staff sickness absence and BME representation
Staff sickness in public prisons and the probation service (national KPI)
The indicator of staff sickness looks at the average number of working days lost through sickness absence. In 2009/10 outturns for probation and public prisons were combined to report against the KPI for the Agency as a whole.
Target: To ensure that the average number of staff sickness days lost in 2009/10 does not exceed 10.5 working days per person in public prisons and probation
Result: The average rate of staff sickness was 10.48 days per person.
Beneath the headline Agency KPI outturn, the average rate of staff sickness in public prisons was 10.8 days in 2009/10, which was unchanged compared to 2008/09 but an improvement compared to 11.7 in 2007/08 and 11.6 in 2006/07. In probation, the average number of staff sickness days lost in 2009/10 was 9.8 days, an improvement on the 11 days per person recorded for 2008/09, 12.1 days in 2007/08 and 12 days in 2006/07 (Figure 43).
Figure 43: Days lost due to sickness
0.0
2.0
4.0
6.0
8.0
10.0
12.0
14.0
2006/07 2007/08 2008/09 2009/10
Public Prisons Staff Sickness average days lost per yearProbation Staff Sickness average days lost per annumNOMS Agency Staff SicknessTarget
Note: Prior to 2008/09 joint targets did not exist for prisons and probation and are therefore not shown for comparison purposes. In 2008/09 performance was reported separately for public prisons and probation but against a common target. In 2009/10 the target was set and reported as an overall agency target.
60
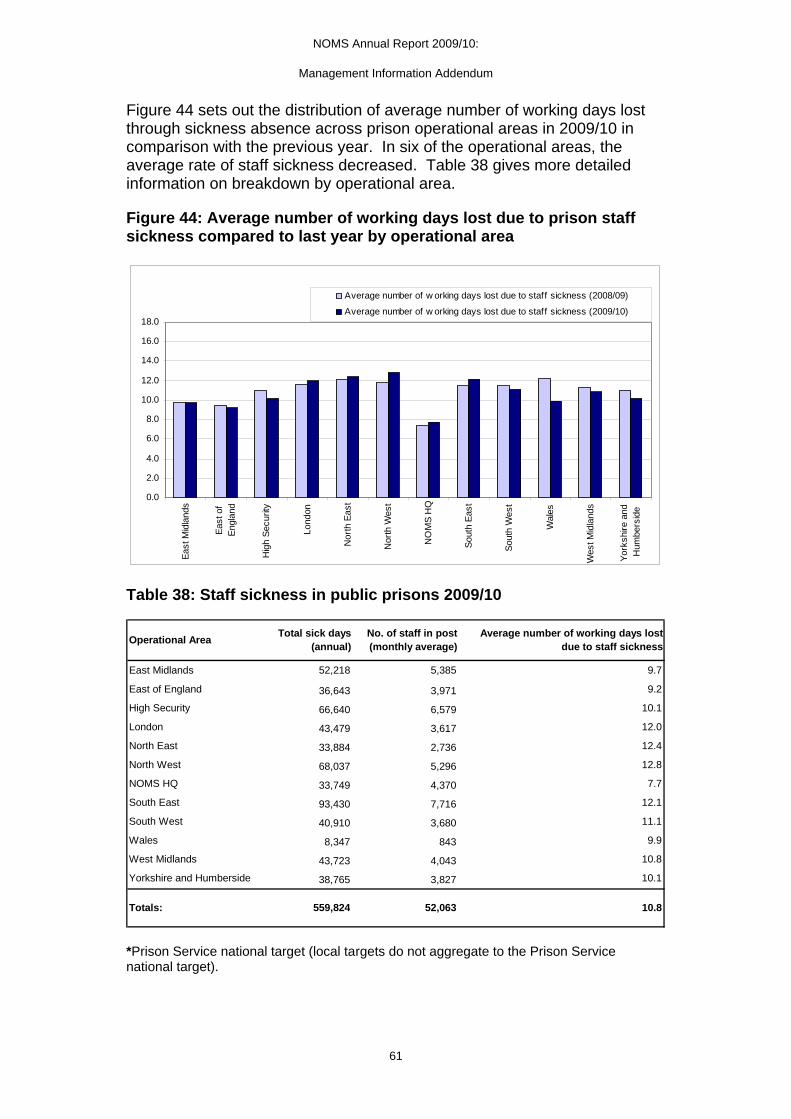
NOMS Annual Report 2009/10:
Management Information Addendum
Figure 44 sets out the distribution of average number of working days lost through sickness absence across prison operational areas in 2009/10 in comparison with the previous year. In six of the operational areas, the average rate of staff sickness decreased. Table 38 gives more detailed information on breakdown by operational area.
Figure 44: Average number of working days lost due to prison staff sickness compared to last year by operational area
0.0
2.0
4.0
6.0
8.0
10.0
12.0
14.0
16.0
18.0
Eas
t Mid
land
s
Eas
t of
Eng
land
Hig
h S
ecur
ity
Lond
on
Nor
th E
ast
Nor
th W
est
NO
MS
HQ
Sou
th E
ast
Sou
th W
est
Wal
es
Wes
t Mid
land
s
Yor
kshi
re a
ndH
umbe
rsid
e
Average number of w orking days lost due to staff sickness (2008/09)
Average number of w orking days lost due to staff sickness (2009/10)
Table 38: Staff sickness in public prisons 2009/10
East Midlands 52,218 5,385 9.7
East of England 36,643 3,971 9.2
High Security 66,640 6,579 10.1
London 43,479 3,617 12.0
North East 33,884 2,736 12.4
North West 68,037 5,296 12.8
NOMS HQ 33,749 4,370 7.7
South East 93,430 7,716 12.1
South West 40,910 3,680 11.1
Wales 8,347 843 9.9
West Midlands 43,723 4,043 10.8
Yorkshire and Humberside 38,765 3,827 10.1
Operational AreaTotal sick days
(annual)No. of staff in post (monthly average)
Average number of working days lost due to staff sickness
Totals: 559,824 52,063 10.8
*Prison Service national target (local targets do not aggregate to the Prison Service national target).
61

NOMS Annual Report 2009/10:
Management Information Addendum
In the probation service the average rate of staff sickness fell for all English regions and Wales, in 2009/10 compared to 2008/09, as shown in Figure 45.
Figure 45: Probation staff sickness absence compared to last year by region
0.0
2.0
4.0
6.0
8.0
10.0
12.0
14.0
Eas
tM
idla
nds
Eas
t of
Eng
land
Lond
on
Nor
th E
ast
Nor
th W
est
Sou
th E
ast
Sou
th W
est
Wal
es
Wes
tM
idla
nds
Yor
kshi
re &
Hum
bers
ide
Ave. days sickness 2008/09 Ave. days sickness 2009/10
Table 39 gives a detailed regional breakdown of the average number of working days lost through sickness absence in the probation service in 2009/10.
Table 39: Probation staff sickness absence 2009/10
Region TargetNo. of Days Short Term
Absence
No. of Days Long Term
Absence
No. of Days DDA Related
AbsenceStaff Years
Ave. Days Sickness per
Staff yearEast Midlands 10.5 8,487 5,030 2,771 1,934 8.4East of England 10.5 7,812 4,587 2,086 1,629 8.9London 10.5 18,366 14,295 - 2,718 12.0North East 10.5 5,613 5,834 1,968 1,209 11.1North West 10.5 13,115 13,005 3,408 3,026 9.8South East 10.5 11,817 8,960 2,301 2,350 9.8South West 10.5 7,603 5,650 651 1,594 8.7Wales 10.5 5,356 7,249 1,110 1,224 11.2West Midlands 10.5 11,387 9,799 2,613 2,374 10.0Yorkshire & Humber 10.5 7,706 7,121 2,297 2,188 7.8
National Total 10.5 97,262 81,529 19,206 20,246 9.8
62

NOMS Annual Report 2009/10:
Management Information Addendum
Race equality: the proportion of minority ethnic staff in public prisons and probation
Delivering and promoting equality are at the heart of NOMS’ vision and values. The Agency’s key performance indicator of race equality measures the level of staff BME representation in public prisons and the probation service.
Target: To ensure that the number of minority ethnic staff across
NOMS, as a proportion of the workforce who have declared their ethnicity, is at least 8.5 per cent by April 2010
Result: 9.1 per cent of staff who declared their ethnicity were from minority ethnic groups
Figure 46: Percentage of minority ethnic staff in NOMS
0.0%
2.0%
4.0%
6.0%
8.0%
10.0%
12.0%
14.0%
16.0%
2009/10
BME Staff in public prisons
BME Staff in probation
BME Staff in NOMS
NOMS Target
Note: 2009/10 was the first year that a joint prisons and probation target was set, therefore there is no comparison to previous years to be made at Agency-level or for probation.
Figure 47 shows that the percentage of BME staff in public prisons has increased since 2007/08. Figure 48 sets out the operational breakdown of minority ethnic staff as a proportion of total workforce for 2009/10 in comparison to the previous year. The highest increase in the proportion of ethnic minority staff was in NOMS HQ. London had a slight decrease in the number of ethnic minority staff, but still met its target (Table 40).
63

NOMS Annual Report 2009/10:
Management Information Addendum
Figure 47: Percentage of minority ethnic staff in public prisons
6.1%
6.1%
6.2%
6.2%
6.3%
6.3%
6.4%
6.4%
6.5%
6.5%
6.6%
2007/08 2008/09 2009/10
Monthly BME Staff in Public prisons Prisons Target
Figure 48: Percentage of minority ethnic staff in public prisons in 2009/10 compared to 2008/09 by operational area
0.0
5.0
10.0
15.0
20.0
25.0
30.0
35.0
Eas
tM
idla
nds
Eas
t of
Eng
land
Hig
hS
ecur
ity
Lond
on
Nor
th E
ast
Nor
th W
est
NO
MS
HQ
Sou
th E
ast
Sou
th W
est
Wal
es
Wes
tM
idla
nds
Yor
kshi
rean
d
% of minority ethnic staff as a proportion of totalw orkforce (2008/09)% of minority ethnic staff as a proportion of thew orkforce w ho declared ethnicity (2009/10)
64

NOMS Annual Report 2009/10:
Management Information Addendum
Table 40: Minority ethnic staff in public prisons 2009/10
East Midlands 4.2 227 4912 4.6%
East of England 4.3 173 3772 4.6%
High Security 4.0 257 6138 4.2%
London 27.4 1003 3318 30.2%
North East 1.2 32 2505 1.3%
North West 2.1 110 4747 2.3%
NOMS HQ 0.0 365 3459 10.6%
South East 4.6 371 7032 5.3%
South West 2.3 80 3246 2.5%
Wales 2.3 22 792 2.8%
West Midlands 6.0 261 3468 7.5%
Yorkshire and Humberside 3.7 147 3509 4.2%
Total workforce who declared their
ethincity (end of Mar 10)
% of minority ethnic staff as a proportion of the
workforce who declared ethnicity (end of Mar 10)
6.4* 3,048 46,898 6.5%
Annualtarget
No. of minorityethnic staff
(end of Mar 10)Operational Area
National Totals:
*Prison Service national target (local targets do not aggregate to the Prison Service national target)
Table 41: Minority ethnic staff in the probation service
Number of minority ethnic staff (at March 2010)
Total workforce who have declared their ethnicity
Minority ethnic staff as % of workforce who have declared their ethnicity
East Midlands 261 2058 12.7%East of England 150 1871 8.0%London 1465 3013 48.6%North East 32 1353 2.4%North West 241 3287 7.3%South East 169 2685 6.3%South West 74 1766 4.2%Wales 47 1326 3.5%West Midlands 582 2609 22.3%Yorkshire & Humberside 216 2468 8.8%
National Total 3237 22436 14.4%
65

NOMS Annual Report 2009/10:
Management Information Addendum
Cost per prison place/per prisoner
Notes on costs per place/per prisoner
1. Displayed figures are subject to rounding.
2. Establishments are categorised in these tables by their main role as at the end of 2009-10.
Establishments that have more than one role have been placed in the category that represents the primary or dominant function of the prison.
For this reason, performance of prisons within a category cannot necessarily be compared on a like for like basis.
3. There are two unit cost measurements. The ‘Direct Resource Expenditure’ includes costs met locally by the establishments.
The ‘Overall cost’ includes prison related overheads met centrally by NOMS, for example, property costs (including depreciation and cost of capital), major maintenance, prisoner escort & custody service (relates to transporting prisoners) and central HQ overheads.
4. YOI refers to Young Offender Institutions.
5. Data for Elmley, Standford Hill and Swaleside are reported under the Sheppey cluster.
Similarly, data for Blakenhurst, Brockhill and Hewell Grange is reported together as a cluster.
Data for Parkhurst, Camphill and Albany are reported under the Isle of Wight cluster.
6. Cookham Wood changed from a Female closed prison to a Male juvenile prison in October 2007. Data for 2009-10 is shown under the category Male Juvenile.
7. Dover and Haslar are not included as they are Immigration Removal Centres operating under Detention Centre Rules 2001.
8. Lindholme includes Lindholme IDC. It is a split site, part Category C Training Prison and part Immigration Detention Centre.
9. The following expenditure is not included:
A one-off impairment charge of £525.05m as a result of the revaluation of land and buildings.
Operation Safeguard (use of police cells).
66

NOMS Annual Report 2009/10:
Management Information Addendum
67
Cost of capital on assets in the course of construction (£22.47m).
Project, Operating & Commissioning costs totalling £2.71m at HMPYOI Isis, as the establishment was not opened during the course of year.
10. Private prisons and public prisons are included. The unit costs are not directly comparable because of different methods of financing.

NOMS Annual Report 2009/10:
Management Information Addendum
Table 42: Summary by Prison Function 2009/10
Male category B 4,468 4,543 £130,962,859 £29,310 £28,829 £167,253,146 £37,431 £36,818Male category C 23,153 23,607 £533,232,906 £23,031 £22,588 £843,185,160 £36,418 £35,718Male dispersal 3,233 3,107 £159,018,563 £49,190 £51,185 £228,727,171 £70,753 £73,623Female closed 1,394 1,291 £53,695,858 £38,522 £41,592 £69,764,860 £50,050 £54,039Female local 2,010 1,800 £75,378,344 £37,500 £41,873 £106,383,076 £52,925 £59,096Female open 248 206 £6,373,960 £25,701 £30,967 £9,850,720 £39,721 £47,858Male closed YOI (ages 15-21) 7,290 6,926 £226,016,318 £31,006 £32,633 £337,561,174 £46,308 £48,738Male YOI young people (ages 15-17)
1,702 1,251 £77,790,329 £45,705 £62,199 £99,491,953 £58,456 £79,551
Male local 23,675 31,159 £816,163,373 £34,473 £26,194 £1,172,722,221 £49,534 £37,637Male open 2,915 2,837 £54,481,662 £18,692 £19,207 £87,017,705 £29,855 £30,677Male open YOI 322 288 £8,766,128 £27,224 £30,473 £13,233,592 £41,098 £46,003Semi open 1,319 1,216 £30,364,258 £23,021 £24,972 £45,647,798 £34,608 £37,542Cluster 4,909 5,295 £118,998,031 £24,240 £22,474 £191,651,961 £39,040 £36,195
Cost per Prisoner
Totals 76,638 83,524 £2,291,242,587 £29,897 £27,432 £3,372,490,538 £44,006 £40,378
Cost per Place
Cost per Prisoner
Overall Resource
Expenditure
Cost per Place
Establishment nameCertified normal accommodation
Average population
Direct Resource
Expenditure
Cost per place is Direct resource expenditure or Overall resource / Baseline certified normal accommodation
Cost per prisoner is Direct resource expenditure or Overall resource / Average population
68

NOMS Annual Report 2009/10:
Management Information Addendum
Table 43: Male category B (7)
Dovegate 931 983 £32,448,310 £34,844 £32,995 £34,492,848 £37,039 £35,074Garth 812 831 £20,604,543 £25,375 £24,782 £32,047,512 £39,467 £38,546Gartree 689 680 £18,005,960 £26,133 £26,463 £26,669,775 £38,708 £39,196Grendon (HMP Grendon & Springhill)
587 518 £15,059,951 £25,656 £29,101 £22,360,208 £38,092 £43,208
Kingston 199 185 £6,154,941 £30,929 £33,285 £9,279,202 £46,629 £50,180Lowdham Grange 650 692 £20,224,371 £31,114 £29,215 £22,224,413 £34,191 £32,105Rye Hill 600 653 £18,464,782 £30,775 £28,284 £20,179,188 £33,632 £30,910
£36,818
Cost per Place
Cost per Prisoner
Totals 4,468 4,543 £130,962,859 £29,310 £28,829 £167,253,146 £37,431
Direct Resource
Expenditure
Cost per Place
Cost per Prisoner
Overall Resource
ExpenditureEstablishment name
Certified normal accommodation
Average population
69

NOMS Annual Report 2009/10:
Management Information Addendum
Table 44: Male category C (38)
Acklington 946 935 £19,068,806 £20,157 £20,404 £30,497,488 £32,238 £32,632Ashwell 599 201 £10,780,794 £17,998 £53,591 £16,094,180 £26,868 £80,004Blundeston 481 519 £13,185,553 £27,413 £25,393 £19,507,171 £40,555 £37,568Buckley Hall 350 381 £9,398,478 £26,853 £24,657 £14,951,989 £42,720 £39,227Bullwood Hall 210 225 £7,054,113 £33,591 £31,317 £10,332,825 £49,204 £45,873Bure 73 72 £6,443,268 £88,567 £89,906 £7,969,440 £109,546 £111,201Canterbury 195 307 £7,549,122 £38,713 £24,603 £11,966,420 £61,366 £39,000Channings Wood 698 724 £15,813,666 £22,656 £21,847 £24,184,057 £34,648 £33,411Coldingley 494 506 £14,018,059 £28,377 £27,681 £21,837,227 £44,205 £43,121Dartmoor 634 608 £15,336,826 £24,203 £25,211 £21,712,259 £34,264 £35,691Edmunds Hill 385 373 £9,532,440 £24,792 £25,590 £14,506,291 £37,728 £38,943Erlestoke 470 465 £10,782,718 £22,942 £23,180 £15,897,306 £33,824 £34,176Everthorpe 603 675 £13,043,793 £21,631 £19,324 £21,051,089 £34,911 £31,187Featherstone 668 663 £14,299,431 £21,417 £21,581 £22,392,541 £33,539 £33,796Guys Marsh 520 572 £12,187,978 £23,438 £21,326 £18,878,966 £36,306 £33,034Haverigg 622 612 £14,353,097 £23,076 £23,472 £21,156,734 £34,014 £34,598Highpoint 920 924 £18,374,576 £19,972 £19,888 £29,204,539 £31,744 £31,609Kennet 175 338 £11,745,116 £67,115 £34,706 £22,001,586 £125,723 £65,013Lancaster Castle 159 235 £7,357,275 £46,272 £31,308 £9,698,315 £60,996 £41,269Lindholme (+IDC) 1,054 1,109 £21,100,924 £20,020 £19,026 £36,330,295 £34,469 £32,757Littlehey 689 736 £16,144,636 £23,438 £21,923 £26,791,175 £38,894 £36,380Maidstone 565 588 £12,092,965 £21,403 £20,552 £19,620,660 £34,727 £33,345Moorland 1,000 1,015 £20,999,891 £21,000 £20,690 £37,346,130 £37,346 £36,794Mount (The) 747 762 £16,518,570 £22,113 £21,668 £28,055,903 £37,558 £36,803Onley 709 677 £17,490,925 £24,664 £25,823 £26,434,167 £37,275 £39,027Ranby 970 1,076 £21,782,913 £22,457 £20,247 £34,549,597 £35,618 £32,114Risley 1,050 1,075 £21,636,889 £20,607 £20,134 £33,633,695 £32,032 £31,297Shepton Mallet 165 188 £6,004,573 £36,391 £31,883 £9,110,721 £55,216 £48,376Stafford 741 736 £14,786,961 £19,955 £20,089 £22,840,278 £30,824 £31,029Stocken 779 808 £15,432,545 £19,811 £19,106 £26,465,176 £33,973 £32,764Usk 320 423 £7,538,953 £23,559 £17,805 £14,031,444 £43,848 £33,139Verne (The) 572 589 £11,512,865 £20,127 £19,533 £17,439,123 £30,488 £29,587Wayland 957 996 £17,758,908 £18,567 £17,839 £29,659,455 £31,008 £29,794Wealstun 812 516 £16,978,252 £20,918 £32,925 £27,937,314 £34,420 £54,177Wellingborough 638 636 £13,460,515 £21,098 £21,150 £20,968,143 £32,865 £32,947Whatton 779 822 £18,217,997 £23,386 £22,161 £27,615,422 £35,450 £33,592Wolds 320 386 £9,342,246 £29,195 £24,197 £13,035,950 £40,737 £33,765Wymott 1,086 1,133 £24,106,269 £22,190 £21,281 £37,480,091 £34,501 £33,088
Cost per Prisoner
Totals 23,153 23,607 £533,232,906 £23,031 £22,588 £843,185,160 £36,418 £35,718
Establishment name
Certified normal accommodation
Average population
Direct Resource Expenditure
Cost per Place
Cost per Prisoner
Overall Resource Expenditure
Cost per Place
70

NOMS Annual Report 2009/10:
Management Information Addendum
Table 45: Male dispersal (5)
Frankland 790 760 £40,694,639 £51,534 £53,551 £57,449,576 £72,752 £75,600Full Sutton 596 583 £29,368,371 £49,303 £50,389 £43,992,344 £73,854 £75,480Long Lartin 606 580 £28,034,936 £46,300 £48,364 £40,189,039 £66,373 £69,331Wakefield 751 738 £29,341,355 £39,057 £39,744 £42,122,786 £56,070 £57,058Whitemoor 491 446 £31,579,262 £64,360 £70,792 £44,973,426 £91,658 £100,818
£73,623
Cost per Place
Cost per Prisoner
Totals 3,233 3,107 £159,018,563 £49,190 £51,185 £228,727,171 £70,753
Direct Resource
Expenditure
Cost per Place
Cost per Prisoner
Overall Resource
Expenditure
Establishment name
Certified normal accommodation
Average population
Table 46: Female closed (4)
Bronzefield 471 445 £24,401,273 £51,817 £54,865 £26,430,696 £56,126 £59,428Downview 358 343 £10,590,306 £29,582 £30,838 £16,167,334 £45,160 £47,078Foston Hall 283 230 £9,983,242 £35,276 £43,453 £13,941,063 £49,262 £60,679Send 282 273 £8,721,037 £30,926 £31,935 £13,225,766 £46,900 £48,431
Cost per Prisoner
Totals 1,394 1,291 £53,695,858 £38,522 £41,592 £69,764,860 £50,050 £54,039
Establishment name
Certified normal accommodation
Average population
Direct Resource
Expenditure
Cost per Place
Cost per Prisoner
Overall Resource
Expenditure
Cost per Place
71
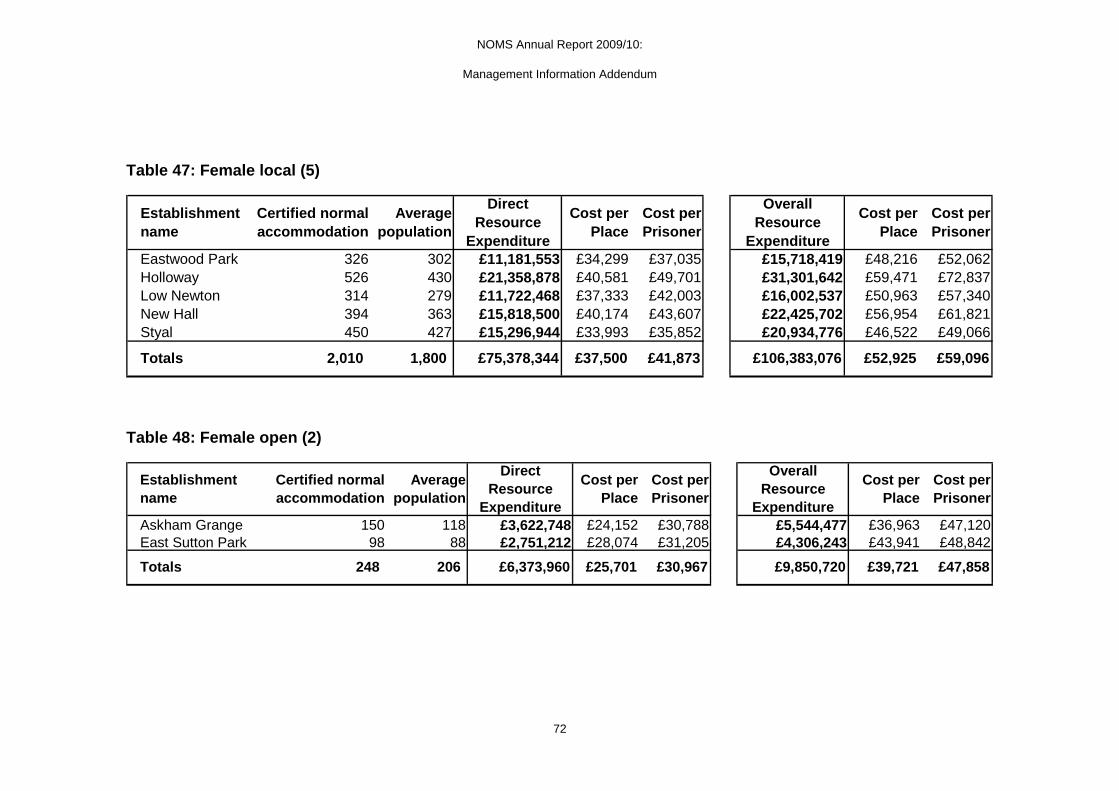
NOMS Annual Report 2009/10:
Management Information Addendum
Table 47: Female local (5)
Eastwood Park 326 302 £11,181,553 £34,299 £37,035 £15,718,419 £48,216 £52,062Holloway 526 430 £21,358,878 £40,581 £49,701 £31,301,642 £59,471 £72,837Low Newton 314 279 £11,722,468 £37,333 £42,003 £16,002,537 £50,963 £57,340New Hall 394 363 £15,818,500 £40,174 £43,607 £22,425,702 £56,954 £61,821Styal 450 427 £15,296,944 £33,993 £35,852 £20,934,776 £46,522 £49,066
£59,096
Cost per Place
Cost per Prisoner
Totals 2,010 1,800 £75,378,344 £37,500 £41,873 £106,383,076 £52,925
Direct Resource
Expenditure
Cost per Place
Cost per Prisoner
Overall Resource
Expenditure
Establishment name
Certified normal accommodation
Average population
Table 48: Female open (2)
Askham Grange 150 118 £3,622,748 £24,152 £30,788 £5,544,477 £36,963 £47,120East Sutton Park 98 88 £2,751,212 £28,074 £31,205 £4,306,243 £43,941 £48,842
Cost per Prisoner
Totals 248 206 £6,373,960 £25,701 £30,967 £9,850,720 £39,721 £47,858
Establishment name
Certified normal accommodation
Average population
Direct Resource
Expenditure
Cost per Place
Cost per Prisoner
Overall Resource
Expenditure
Cost per Place
72

NOMS Annual Report 2009/10:
Management Information Addendum
Table 49: Male closed YOI - Young adults/Young people (14)
Aylesbury 441 436 £13,584,962 £30,805 £31,152 £21,244,077 £48,173 £48,716Brinsford 545 511 £16,256,727 £29,829 £31,798 £24,465,060 £44,890 £47,853Castington 400 345 £14,754,834 £36,887 £42,757 £20,825,867 £52,065 £60,350Deerbolt 513 477 £15,085,242 £29,406 £31,620 £22,758,332 £44,363 £47,703Feltham 762 654 £33,138,053 £43,488 £50,689 £48,404,304 £63,523 £74,041Glen Parva 667 788 £18,338,450 £27,508 £23,265 £28,685,773 £43,029 £36,392Hindley 553 305 £18,216,153 £32,970 £59,823 £25,482,012 £46,121 £83,685Lancaster Farms 480 510 £16,896,876 £35,202 £33,153 £26,371,549 £54,941 £51,743Northallerton 147 226 £5,742,075 £39,062 £25,417 £8,664,405 £58,942 £38,352Portland 605 532 £15,576,852 £25,747 £29,257 £22,794,383 £37,677 £42,813Reading 190 250 £9,016,129 £47,453 £36,005 £12,660,018 £66,632 £50,556Rochester 749 685 £17,550,300 £23,421 £25,627 £26,857,366 £35,842 £39,217Stoke Heath 634 586 £17,078,907 £26,938 £29,141 £25,132,984 £39,642 £42,883Swinfen Hall 604 621 £14,780,758 £24,471 £23,811 £23,215,043 £38,436 £37,398
£48,738
Cost per Place
Cost per Prisoner
Totals 7,290 6,926 £226,016,318 £31,006 £32,633 £337,561,174 £46,308
Direct Resource
Expenditure
Cost per Place
Cost per Prisoner
Overall Resource
Expenditure
Establishment name
Certified normal accommodation
Average population
73

NOMS Annual Report 2009/10:
Management Information Addendum
Table 50: Male YOI - Young people (6)
Ashfield 407 285 £23,141,092 £56,858 £81,292 £23,309,981 £57,273 £81,885Cookham Wood 145 93 £8,935,386 £61,623 £95,822 £11,867,847 £81,847 £127,269Huntercombe 360 233 £13,519,968 £37,555 £58,150 £19,059,646 £52,943 £81,977Warren Hill 222 178 £9,896,726 £44,580 £55,496 £13,552,415 £61,047 £75,995Werrington 160 132 £7,013,541 £43,835 £53,200 £9,695,774 £60,599 £73,546Wetherby 408 330 £15,283,617 £37,460 £46,302 £22,006,290 £53,937 £66,669
Establishment nameCertified normal accommodation
Average population
Direct Resource
Expenditure
Cost per Place
Cost per Prisoner
Overall Resource
Expenditure
Cost per Place
Cost per Prisoner
Totals 1,702 1,251 £77,790,329 £45,705 £62,199 £99,491,953 £58,456 £79,551
74

NOMS Annual Report 2009/10:
Management Information Addendum
Table 51: Male local (36)
Altcourse 794 1,294 £46,438,070 £58,486 £35,883 £49,169,546 £61,926 £37,993Bedford 323 475 £11,890,253 £36,812 £25,041 £17,788,224 £55,072 £37,462Belmarsh 800 874 £39,859,998 £49,825 £45,589 £60,600,103 £75,750 £69,310Birmingham 1,109 1,441 £29,659,870 £26,745 £20,585 £45,802,798 £41,301 £31,789Bristol 424 608 £15,480,815 £36,511 £25,465 £22,249,958 £52,476 £36,600Brixton 606 764 £20,587,169 £33,972 £26,958 £29,421,515 £48,550 £38,527Bullingdon 879 1,092 £22,490,458 £25,586 £20,589 £36,710,197 £41,764 £33,607Cardiff 548 807 £16,189,470 £29,543 £20,055 £29,663,937 £54,131 £36,747Chelmsford 554 675 £17,654,734 £31,868 £26,149 £26,466,755 £47,774 £39,200Doncaster 771 1,118 £23,496,327 £30,475 £21,018 £33,875,362 £43,937 £30,302Dorchester 145 233 £7,836,901 £54,048 £33,647 £10,649,537 £73,445 £45,723Durham 601 964 £23,035,128 £38,301 £23,902 £33,621,757 £55,904 £34,886Exeter 316 524 £13,135,508 £41,568 £25,080 £18,705,527 £59,195 £35,715Forest Bank 876 1,200 £31,562,625 £36,051 £26,300 £35,171,441 £40,173 £29,307Gloucester 225 302 £9,222,434 £40,989 £30,538 £12,814,607 £56,954 £42,432Highdown 999 1,082 £24,121,005 £24,145 £22,293 £41,506,799 £41,548 £38,361Holme House 865 969 £22,388,805 £25,898 £23,115 £35,784,867 £41,394 £36,946Hull 723 1,004 £21,723,433 £30,046 £21,628 £34,326,617 £47,478 £34,176Leeds 829 1,141 £24,321,857 £29,339 £21,324 £37,730,512 £45,513 £33,080Leicester 210 357 £9,440,244 £44,954 £26,443 £13,293,823 £63,304 £37,238Lewes 623 640 £16,313,366 £26,185 £25,496 £24,599,257 £39,485 £38,446Lincoln 448 670 £15,496,171 £34,590 £23,137 £23,031,164 £51,409 £34,388Liverpool 1,186 1,323 £26,051,023 £21,965 £19,691 £39,507,150 £33,311 £29,862Manchester 964 1,227 £35,300,991 £36,619 £28,774 £52,249,605 £54,201 £42,589Norwich 547 637 £16,563,142 £30,266 £25,985 £25,970,579 £47,457 £40,743Nottingham 383 552 £17,900,765 £46,718 £32,453 £26,308,934 £68,662 £47,697Parc 838 1,174 £45,393,240 £54,169 £38,660 £47,744,362 £56,974 £40,662Pentonville 914 1,175 £31,337,256 £34,295 £26,681 £45,719,507 £50,035 £38,927Peterborough 840 950 £31,292,633 £37,253 £32,937 £34,828,071 £41,462 £36,658Preston 453 757 £19,562,006 £43,183 £25,856 £27,300,078 £60,265 £36,083Shrewsbury 184 301 £8,672,656 £47,134 £28,789 £12,150,980 £66,038 £40,335Swansea 248 397 £9,212,630 £37,148 £23,206 £15,843,749 £63,886 £39,909Wandsworth 1,105 1,654 £36,199,901 £32,753 £21,892 £52,939,638 £47,898 £32,015Winchester 499 692 £15,657,238 £31,377 £22,632 £23,250,124 £46,593 £33,607Woodhill 670 814 £32,723,769 £48,817 £40,226 £50,579,248 £75,454 £62,175Wormwood Scrubs 1,176 1,274 £27,951,482 £23,768 £21,934 £45,345,893 £38,559 £35,584
£37,637
Cost per Place
Cost per Prisoner
Totals 23,675 31,159 £816,163,373 £34,473 £26,194 £1,172,722,221 £49,534
Direct Resource
Expenditure
Cost per Place
Cost per Prisoner
Overall Resource
Expenditure
Establishment name
Certified normal accommodation
Average population
75

NOMS Annual Report 2009/10:
Management Information Addendum
Table 52: Male open (6)
Ford 557 540 £8,612,013 £15,461 £15,963 £15,104,764 £27,118 £27,998Hollesley Bay 345 336 £6,934,500 £20,100 £20,613 £11,273,343 £32,676 £33,510Kirkham 590 585 £13,515,299 £22,907 £23,123 £20,443,844 £34,651 £34,977Leyhill 524 498 £10,400,365 £19,861 £20,877 £16,392,988 £31,304 £32,907North Sea Camp 318 305 £5,908,156 £18,579 £19,366 £8,956,643 £28,166 £29,358Sudbury 581 573 £9,111,329 £15,682 £15,903 £14,846,122 £25,553 £25,913
Cost per Prisoner
Totals 2,915 2,837 £54,481,662 £18,692 £19,207 £87,017,705 £29,855 £30,677
Establishment name
Certified normal accommodation
Average population
Direct Resource
Expenditure
Cost per Place
Cost per Prisoner
Overall Resource
Expenditure
Cost per Place
Table 53: Male open YOI (1)
Thorn Cross 322 288 £8,766,128 £27,224 £30,473 £13,233,592 £41,098 £46,003
£46,003
Cost per Place
Cost per Prisoner
Totals 322 288 £8,766,128 £27,224 £30,473 £13,233,592 £41,098
Direct Resource
Expenditure
Cost per Place
Cost per Prisoner
Overall Resource
Expenditure
Establishment name
Certified normal accommodation
Average population
76

NOMS Annual Report 2009/10:
Management Information Addendum
77
Blantyre House 122 120 £3,081,756 £25,260 £25,771 £4,753,287 £38,961 £39,749Drake Hall 315 279 £8,209,835 £26,063 £29,444 £11,782,750 £37,406 £42,257Kirklevington Grange 283 271 £5,810,431 £20,532 £21,434 £8,981,585 £31,737 £33,132Latchmere House 207 199 £4,636,863 £22,400 £23,281 £7,199,983 £34,783 £36,151Morton Hall 392 347 £8,625,373 £22,004 £24,839 £12,930,194 £32,985 £37,236
Cost per Prisoner
Totals 1,319 1,216 £30,364,258 £23,021 £24,972 £45,647,798 £34,608 £37,542
Establishment nameCertified normal accommodation
Average population
Direct Resource
Expenditure
Cost per Place
Cost per Prisoner
Overall Resource
Expenditure
Cost per Place
Brockhill/Hewell Grange/Blakenhurst
1,173 1,384 £28,445,145 £24,250 £20,558 £46,545,585 £39,681 £33,639
Isle of Sheppey - Central Services
2,177 2,249 £50,732,398 £23,306 £22,559 £83,436,429 £38,331 £37,102
IoW Cluster 1,559 1,663 £39,820,487 £25,537 £23,952 £61,669,948 £39,549 £37,095
£36,195
Cost per Place
Cost per Prisoner
Totals 4,909 5,295 £118,998,031 £24,240 £22,474 £191,651,961 £39,040
Direct Resource
Cost per Place
Cost per Prisoner
Overall Resource
Establishment nameCertified normal accommodation
Average population
Table 54: Semi-open (5)
Table 55: Cluster (3)

NOMS Annual Report 2009/10:
Management Information Addendum
Technical Notes
This section provides further technical guidance on the performance indicators used in this report, covering the rationale for each indicator, the technical description, the data source and the calculation used.
Escapes
Category A escapes
Rationale
Escapes are monitored to analyse the frequency across the estate and identify any trends nationally, while taking into consideration the management of risk to the public.
Technical description
This is an escape by a prisoner who is classed as Category A on account of being highly dangerous to the public.
An escape is counted if (i) the prisoner is at liberty for 15 minutes or more before recapture or (ii) a prisoner escapes and is charged with another criminal offence.
Calculation
This indicator is a simple count of the number of Category A escapes.
Data source
Monthly data from prison establishments collated in central performance systems.
Escapes from prisons and prison escorts
Rationale
As above.
78

NOMS Annual Report 2009/10:
Management Information Addendum
Technical description
A prisoner escapes from escort when they are able to pass beyond the control of escorting staff. This may involve overcoming physical security restraints such as a wall or fence; locks, bolts or bars; a secure vehicle; handcuffs; or the direct supervision of escorting staff.
An escape is counted if (i) the prisoner is at liberty for 15 minutes or more before recapture or (ii) a prisoner escapes and is charged with another criminal offence.
Calculation
Rate of escapes from prison and prison escorts = No. of escapes divided by average prison population
Data source
Monthly data from prison establishments collated in central performance systems.
Escapes from contractor escorts
Rationale
As above.
Technical description
A prisoner escapes from escort when they are able to pass beyond the control of escorting staff. This may involve overcoming physical security restraints such as a wall or fence; locks, bolts or bars; a secure vehicle; handcuffs; or the direct supervision of escorting staff.
An escape is counted if (i) the prisoner is at liberty for 15 minutes or more before recapture or (ii) a prisoner escapes and is charged with another criminal offence.
Calculation
Rate of escapes from contractor escorts = 1: {No of movements} divided by {No of escapes from contractor escorts}
Data source
Monthly data from prisoner escort contractors collated in central performance systems.
79

NOMS Annual Report 2009/10:
Management Information Addendum
Absconds
Rationale
Absconds are monitored to analyse the frequency across the open estate and identify any trends nationally also taking into consideration, the management of risk to the Public.
Technical description
An abscond is an escape that does not involve overcoming a physical security restraint such as that provided by a wall or fence, locks, bolts or bars, a secure vehicle, handcuffs, or the direct supervision of staff. An open prison is generally not considered to contain physical security restraints.
Data source
Monthly data from prison establishments collated in central performance systems.
Calculation
This indicator is a simple count of absconds.
Offending Behaviour Programmes (OBPs)
Appropriate OBP starts in the community
Rationale
The purpose of this measure is to ensure the appropriate allocation of offenders to programmes, and remove the incentive to over-deliver.
Technical description
Each accredited offending behaviour programme has set ‘eligibility criteria’ which are linked to the likelihood of reconviction (known as the Offender Group Reconviction Score (OGRS)). The eligibility criteria are designed to ensure that only those offenders who will benefit from the particular programme are placed on it.
80

NOMS Annual Report 2009/10:
Management Information Addendum
Data source
Probation area data on OBPs collated in central performance systems.
Calculation
(The total number of eligible programme starts/ total number of actual starts) x 100 = Percentage of Appropriate Starts in the community.
Offending behaviour programme (OBP) completions in custody and the community
Rationale
The purpose of this measure is to ensure focus on the effective delivery of accredited programmes.
Technical description
OBPs are rehabilitation programmes designed to identify the reasons why offenders offend and reduce and monitor these factors. As well as reducing risk, programmes support risk assessment and the risk management of offenders. These are fully or provisionally accredited by the Correctional Services Accreditation Panel (CSAP). In custody they are known as Living Skills programmes.
Data sources
In custody: Monthly data from prison establishments collated in central performance systems.
In the community: probation area data collated in central performance systems
Calculation
This indicator is a simple count of the number of OBP completions.
A completion is counted when an offender completes an accredited programme and all appropriate reports and documents are completed and returned and recorded as such on the appropriate systems.
Completions in custody and completions in the community are recorded separately.
81

NOMS Annual Report 2009/10:
Management Information Addendum
Sex offender treatment programmes (SOTP in custody and the community
Rationale
The purpose of this measure is to ensure focus on the effective delivery of sex offender treatment programmes.
Technical description
Sex offender treatment programmes aim to reduce offending by adult male sex offenders. A range of programmes is available for sexual offenders according to the level of risk and need of the offender.
Data sources
In custody: monthly data from prison establishments collated in central performance systems.
In the community: probation area data on OBPs collated in central performance systems
Calculation
This indicator is a simple count of the number of SOTP completions.
A completion is counted when an offender completes an accredited programme and all appropriate reports and documents are completed and returned and recorded as such on the appropriate system.
Completions in custody and completions in the community are recorded separately.
82

NOMS Annual Report 2009/10:
Management Information Addendum
Domestic violence programmes in the community
Rationale
The purpose of this measure is to ensure focus on the effective delivery of domestic violence programmes and that the provision of domestic violence programmes is appropriate to meet offender need.
Technical description
Domestic violence is any incident of threatening behaviour, violence or abuse between adults who are or have been in a relationship together, or between family members, regardless of gender or sexuality.
NOMS accredited programmes for domestic violence are programmes targeted at men who are or were in heterosexual relationships at the time the offence was committed. They aim to reduce aggressive behaviour through teaching social skills, anger management techniques and improved moral reasoning.
Data source
Data recorded by probation areas and collated in central performance systems.
Calculation
This indicator is a simple count of the number of domestic violence programme completions.
A completion is counted when an offender completes an accredited programme and all appropriate reports and documents are completed and returned and recorded as such on the appropriate system.
Drug Rehabilitation
Drug rehabilitation requirement (DRR) completion rate
Rationale
The purpose of this measure is to ensure that DRRs given as part of a Community Order or Suspended Sentence Order are successfully completed. As a measure of efficiency, the aim is to maximise the percentage of those terminating which are successfully completed.
83

NOMS Annual Report 2009/10:
Management Information Addendum
Technical description
The drug rehabilitation requirement is one of 12 requirements that may be given by the sentencing court as part of a Community Order or Suspended Sentence Order (SSO) to adult offenders committing an offence post April 2005 when the Criminal Justice Act 2003 came into force. This is a treatment order so the whole order counts as a being 'in treatment' and minimum hours apply. If an offender has more than one requirement these contact hours are the total across all requirements not just the DRR.
Data source
Data extracted from probation case management systems and collated centrally.
Calculation
The completion rate is calculated for a given period as: the number of DRRs completed successfully (including those terminated early for good progress) as a proportion of all terminations in the period less those where the order which were transferred out, orders where the offender died, orders which expired with breach outstanding and orders revoked because of other change of circumstances or for other reasons (i.e. other than because of failure to comply or conviction for further offences).
Drug rehabilitation requirement (DRR) completion volumes
Rationale
The purpose of this measure is to ensure that DRRs given as part of a Community Order or Suspended Sentence Order are successfully completed.
Technical description
As above for ‘DRR completion rate’.
Data source
As above for ‘DRR completion rate’.
Calculation
This is a simple count of the number of successful completions. A successful completion is one which is recorded on the case management system as having expired normally (i.e. run its full course) or has been revoked early by the court for good progress.
84

NOMS Annual Report 2009/10:
Management Information Addendum
Drug rehabilitation requirement (DRR) starts
Rationale
The purpose of this measure is to enable the monitoring of the numbers of offenders under probation supervision that enter drug treatment as a requirement of their sentence.
Technical description
As above for ‘DRR completion rate’.
Data source
As above for ‘DRR completion rate’.
Calculation
This is a simple count of the number of DRR starts.
Drug treatment programmes (in custody only):
Rationale
The purpose of this measure is to ensure focus on the effective delivery of accredited drug treatment programmes.
Technical description
Drug treatment programmes are rehabilitation programmes designed to identify the reasons why offenders offend and reduce and monitor these factors. As well as reducing risk, programmes support risk assessment and the risk management of offenders. These are fully or provisionally accredited by the Correctional Services Accreditation Panel (CSAP).
Data source
Monthly data from prison establishments collated in central performance systems.
Calculation
This indicator is a simple count of the number of drug treatment programme completions.
85

NOMS Annual Report 2009/10:
Management Information Addendum
A completion is counted when an offender completes an accredited programme and all appropriate reports and documents are completed and returned and recorded as such on central systems.
Mandatory drug testing (MDT) in custody
Rationale
Random mandatory drug testing provides the best available measure of drug misuse in prisons.
Technical description
The measure for the rate of drug-misuse is based on the rate of positive drug tests under the random MDT programme. This provides the most accurate indication of the level of drug-misuse in establishments. Random samples are those where a prisoner has been selected for testing using a random prisoner selector on central systems. The programme produces a list of prisoner numbers in the required sample, plus a reserve list. All prisoners - including unconvicted and new receptions - can be selected by the system for random MDT.
A sample is positive when the screening test is positive and there has been no confirmation test (for whatever reason), or a confirmation test was positive. A sample that tests positive for more than one drug counts as one positive sample. Furthermore, some positive samples will be mitigated and declared negative due to prescribed medication. The number of tests does not include spoilt samples or refusals. In the case of transferred prisoners, results for a sample are recorded against the establishment where the sample was taken.
Data source
Monthly data from prison establishments collated in central performance systems.
Calculation
MDT Positive Rate = (Total number of random drug tests that prove positive / total number of random drug tests carried out) x 100
86

NOMS Annual Report 2009/10:
Management Information Addendum
Alcohol treatment requirement (ATR) completion rate
Rationale
The purpose of this measure is to ensure that ATRs given as part of the sentence are completed. As a measure of efficiency, the aim is to maximise the percentage of those terminating which are successfully completed.
Technical description
The alcohol treatment requirement (ATR) is one of 12 requirements that may be applied to a Community Order or Suspended Sentence Order. It provides access to a tailored treatment programme with the aim of reducing or eliminating alcohol dependency. The requirement can last between six months and three years as part of a Community Order and six months and two years when part of a Suspended Sentence Order.
Data source
Data extracted from probation case management systems and collated centrally.
Calculation
Performance against the completion rate target is calculated for a given period as: the number of requirements completed successfully (including those terminated early for good progress) as a proportion of all terminations in the period less orders which were transferred out, orders where the offender died, orders which expired with breach outstanding and orders revoked because of other change of circumstances or for other reasons (i.e. other than because of failure to comply or conviction for further offences).
Alcohol treatment requirement (ATR) completion volumes
Rationale
The purpose of this measure is to ensure that ATRs given as part of a Community Order or Suspended Sentence Order are successfully completed.
Technical description
As above for ‘ATR completion rate’.
Data source
As above for ‘ATR completion rate’
87

NOMS Annual Report 2009/10:
Management Information Addendum
Calculation
This indicator is a simple count of the number of successful ATR completions. A successful completion is one which is recorded on the case management system as having expired normally (i.e. run its full course) or has been revoked early by the court for good progress.
Unpaid work (Community Payback)
Unpaid work completion rate
Rationale
The purpose of this indicator is to ensure focus on the successful completion of unpaid work requirements. As a measure of efficiency, the aim is to maximise the percentage of those terminating which are successfully completed.
Technical description
Unpaid work is one of 12 requirements that may be given as part of a Community Order or Suspended Sentence Order under the Criminal Justice Act 2003 for offences committed on or after 1 April 2005. Unpaid work is work undertaken for the benefit of the local community. It is a punitive intervention that can be used as a creative resource for improving the local environment, and supporting community provider strategies on visibility and community engagement.
The minimum hours that can be ordered are 40 hours and the maximum is 300 hours.
Work undertaken for profit, or for personal gain, cannot be counted as unpaid work.
Data source
Data is extracted from probation case management systems and collated centrally.
Calculation
Performance against the completion rate target is calculated for a given period as: the number of requirements completed successfully (including
88

NOMS Annual Report 2009/10:
Management Information Addendum
those terminated early for good progress) as a proportion of all terminations in the period less those orders which were transferred out, orders where the offender died, orders which expired with breach outstanding and orders revoked because of other change of circumstances or for other reasons (i.e. other than because of failure to comply or conviction for further offences).
Unpaid work completion volumes
Rationale
As above for ‘unpaid work completion rate’.
Technical description
As above for ‘unpaid work completion rate’.
Data source
As above for ‘unpaid work completion rate’.
Calculation
This is a simple count of the number of successful unpaid work completions. A successful completion is one where the specified number of hours have been recorded as completed or which has been revoked early for good progress.
Additional hours imposed for an existing order that includes unpaid work are not counted, but if the court makes an additional requirement of Unpaid Work where there was originally no unpaid work requirement then this is counted.
A successful completion is one which is recorded on the case management system as having expired normally (i.e. run its full course) or has been revoked early by the court for good progress.
Unpaid work stand-downs
Rationale
The purpose of this measure is to reduce the number of planned days of unpaid work not carried out by offenders because they are 'stood down' due to the probation area being unable to provide the appropriate resources to manage the offenders at work.
89

NOMS Annual Report 2009/10:
Management Information Addendum
Technical description
A stand down is when an offender is instructed in advance not to report for work, or when ready and willing offenders are sent home after reporting for work due to operational difficulties in the probation area (e.g. insufficient supervisor coverage, lack of transport, or work availability).
Data source
Data recorded locally and collated on central information systems.
Calculation
(Number of unpaid work days lost because of stand-downs [total of days lost through offender being sent home or told not to attend] / Number of unpaid work offender days planned) x 100
Compliance and Enforcement
Percentage of orders and licences successfully completed
Rationale
To assess of the cases that have terminated, the proportion of cases that have terminated successfully. This metric gives an overview of offender compliance over the life of the order or licence. This is one of a number of compliance measures.
Technical description
Successfully completions are those which are recorded on the case management system as having expired normally (i.e. without being revoked for failure to comply or for a further offence) or which have been terminated early by the court for good progress.
Drug rehabilitation requirements are included in the calculation
Data source
Data extracted from probation case management systems and collated centrally.
Calculation
(a / b) x 100
90

NOMS Annual Report 2009/10:
Management Information Addendum
Where:
a) No. of orders / licences successfully completed
b) Total no. of orders and licences terminated (i.e. including those which were unsuccessful and required breach action but not including the exclusions specified above)
Percentage of community order breaches resolved within 25 working days
Rationale
This is the Local Criminal Justice Board (LCJB) end-to-end enforcement target and seeks to ensure that non-compliance with an order is identified and that appropriate enforcement action is delivered across criminal justice agencies
Technical description
Breach:
A breach is a commencement of action to bring an allegation that an offender has failed to comply with the requirements of an order or licence before the court. Initiation of breach action: an application made for summons or warrant to return offender to court for breach.
Trigger of breach proceedings:
The community provider decides whether an offender has failed to comply with his / her order or licence and institutes action by contacting the court to arrange a first appearance by summons or warrant. The court sets the hearing dates and the court ultimately finalises the case by passing sentence.
Unacceptable failure to comply:
This defines the beginning of breach proceedings, and can consist of unacceptable absences and/or unacceptable behaviour while on a relevant order. It is the Offender Manager’s responsibility to determine the relevant unacceptable failure to comply and instigate breach proceedings
Data source
Data recorded on COMET (Community penalty Enforcement Tracker) system administered by HM Court Service.
91

NOMS Annual Report 2009/10:
Management Information Addendum
Calculation
Proportion of cases resolved =
(Number of cases that were resolved within 25 days / The total number of cases of unacceptable failure to comply) x 100
Percentage of orders & licences that reached 6 month stage without requiring breach action
Rationale
To focus on minimising the proportion of cases that involve a breach within the first six months of supervision in the community.
Technical description
Breach is commencement of action to bring an allegation that an offender has failed to comply with the requirements of an order or licence before the court or the Post Release Section.
DTTO/DRRs are excluded from this indicator.
Data source
Data are produced from probation areas’ monitoring of National Standards for Offender Management. A 20 per cent sample of Orders and licences are monitored six months after commencement.
Calculation
(a / b) x 100
Where:
a) No. of orders / licences not requiring breach action after six months from commencement (no 2nd unacceptable failure on an order; no 3rd on a licence)
b) Total no. of sampled cases which commenced six months previously
92

NOMS Annual Report 2009/10:
Management Information Addendum
Employment
Percentage of offenders in employment at the end of their sentence (Agency KPI)
Rationale
The indicator assesses the employment status of offenders at the end of their sentence as an outcome contributing to a reduction in levels of re-offending. As a joint prisons and probation indicator, it combines the employment outcomes for those at the end of probation supervision with outturns for those released from prison sentences of less than 12 months.
The prison element of this indicator focuses on those sentenced to less than 12 months because prisoners released from sentences of 12 months or more are subject to supervision by the probation service upon release and their employment outturns will therefore be picked up in the probation element of the indicator at the end of the period on licence.
Technical description
Probation element:
See description for ‘Percentage of offenders with employment at the end of order or licence’ (page 42-3])
Prisons element:
Employment outcomes will be expressed as a proportion of recorded discharges of prisoners from sentences of less than 12 months. Performance is calculated using recorded employment status and discharge data.
Employment outcome is defined as:
Full-time employed or self-employed (30 hrs or more a week, on average)
Part-time employed or self-employed (less than 30 hrs a week, on average)
Temporary/casual work
Data sources
Probation:
OASys National Reporting (ONR): centrally-produced reports from local data recorded on Offender Assessment System (OASys).
93

NOMS Annual Report 2009/10:
Management Information Addendum
Prisons:
Monthly data from prison establishments collated in central performance systems.
Calculation
([a + c] / [b + d]) x 100
Where:
a) Number of offenders in employment at the end of their order or licence as recorded on the final (termination) OASys assessment
b) Total number of offenders with final (termination) OASys assessments completed in the current month, excluding those who are unavailable for work
c) Number of employment outcomes for prisoners discharged from sentences of less than 12 months
d) Total number of discharges from sentences of less than 12 months
Percentage of offenders with employment at the end of order or licence
Rationale
The indicator assesses the employment status of offenders at the end of their order or licence as an outcome contributing to a reduction in levels of re-offending.
Technical description
Employment is defined as:
Full-time employed or self-employed (30 hrs or more a week, on average)
Part-time employed or self-employed (less than 30 hrs a week, on average)
Temporary/casual work
Offenders are classed as unemployed if they are available for work but are not in employment at the time, regardless of whether they are receiving benefits.
94

NOMS Annual Report 2009/10:
Management Information Addendum
Those ‘unavailable for work’ are excluded from the calculation. Situations in which an offender should be recorded as being unavailable for work include offenders who are: retired, homemaker or incapacitated; this category also includes those who cannot work for any reason, for example asylum seekers, refugees and foreign nationals who have no right to work in the UK; from 1 April 2009 this has also included those in full or part time education
Data source
OASys National Reporting (ONR): centrally-produced reports from local data recorded on Offender Assessment System (OASys).
Calculation
(a / b) x 100
Where:
a) Number of offenders in employment at the end of their order or licence as recorded on the final (termination) OASys assessment
b) Total number of offenders with final (termination) OASys assessments completed in the current month, excluding those who are unavailable for work
Percentage of offenders with employment on release from custody
Rationale
The purpose of this measure is to identify the number of offenders discharged from custody and accessing employment opportunities. Collation of this data will indicate the effectiveness of the establishment and its partners in supporting offenders into employment.
Technical description
Employment outcomes will be expressed as a proportion of recorded discharges. Performance is calculated using recorded employment status and discharge data.
Employment outcome is defined as:
Full-time employed or self-employed (30 hrs or more a week, on average)
95

NOMS Annual Report 2009/10:
Management Information Addendum
Part-time employed or self-employed (less than 30 hrs a week, on average)
Temporary/casual work
Data source
Monthly data from prison establishments collated in central performance systems.
Calculation
(No. of Employment Outcomes / No. of Discharges) x 100 = % Employment
Sustained employment in the community
Rationale
To ensure that attention is focused on achieving and sustaining employment during supervision
Technical description
Employment includes full-time employment, self-employment, agency working and part-time working for at least 16 hours a week.
Data source
Data recorded locally by probation areas and submitted for collation at the centre.
Calculation
A count of the number of offenders who are being supervised by probation services and have found and kept continuous employment for four weeks.
96
NOMS Annual Report 2009/10:
Management Information Addendum
Accommodation
Percentage of offenders with settled accommodation at the end of their sentence (Agency KPI)
Rationale
This indicator assesses the accommodation status of offenders at the end of their sentence as an outcome contributing to a reduction in levels of re-offending.
Technical description
As a joint prisons and probation indicator, it combines the accommodation outcomes for those at the end of probation supervision with outturns for those released from prison sentences of less than 12 months. The prison element of this indicator focuses on those sentenced to less than 12 months because prisoners released from sentences of 12 months or more are subject to supervision by the probation service upon release and their accommodation outturns will therefore be picked up in the probation element of the indicator at the end of the period on licence.
Probation element:
See description for ‘Percentage of offenders in settled and suitable accommodation at the end of order or licence’ (page [47-6])
Prisons element:
Accommodation outcomes will be expressed as a proportion of recorded discharges of prisoners from sentences of less than 12 months. Performance is calculated using recorded accommodation status and discharge data.
For a definition of ‘settled accommodation’, see Percentage of offenders with settled accommodation on release from custody (page [86]).
Data Source
Probation:
OASys National Reporting (ONR): centrally-produced reports from local data recorded on Offender Assessment System (OASys).
Prisons:
97

NOMS Annual Report 2009/10:
Management Information Addendum
Monthly data from prison establishments collated in central performance systems.
Calculation
([a + c] / [b + d]) x 100
Where:
a) Number of offenders with settled and suitable accommodation at the end of their order or licence as recorded on the final (termination) OASys assessment
b) Total number of offenders with final (termination) OASys assessments completed in the current month
c) Number of accommodation outcomes for prisoners discharged from sentences of less than 12 months
d) Total number of prisoners discharged from sentences of less than 12 months
Percentage of offenders with settled accommodation on release from custody
Rationale
In support of the Accommodation Pathway in the NOMS Reducing Re-offending National Delivery Plan the focus is to increase the number of Prisoners with settled accommodation arranged upon release. This NOMS metric replaced the existing Accommodation measure from April 2007.
Technical description
Accommodation outcomes will be expressed as a proportion of recorded discharges of prisoners. Performance is calculated using recorded accommodation status and discharge data.
Settled accommodation is defined as:
Settled Housing
Essentially this would include any housing which provides permanent independent housing, for example,
A family home where the service user is the owner / tenant or a permanent part of the family and is able to return to that home.
98

NOMS Annual Report 2009/10:
Management Information Addendum
Owner occupier
A tenant of a self contained dwelling with a secure tenancy in the name of the service user
Living with a friend/colleague on a permanent basis where the service user has a bedroom available at all times for their use and access to normal domestic facilities
A caravan or boat which is viewed by the service user as their permanent home.
Supported housing
Housing with support provided by an accredited housing agency, which will provide both a placement for at least three months and support in moving on to permanent accommodation.
Approved Premises
The service user’s risk of harm to others has been assessed such as to make placement in Approved Premises the most appropriate housing option.
Data Source
Monthly data from prison establishments collated in central performance systems.
Calculation
(No. of Accommodation Outcomes/No. of Discharges) x 100 = Settled Accommodation %
Percentage of offenders in settled and suitable accommodation at the end of order or licence
Rationale
This indicator assesses the accommodation status of offenders at the end of their order or licence as an outcome contributing to a reduction in levels of re-offending.
Technical description
Settled accommodation is defined as:
99

NOMS Annual Report 2009/10:
Management Information Addendum
Permanent, independent housing
Bail / probation hostel
Supported housing
Suitable accommodation is defined in OASys under two areas: suitability of the accommodation and suitability of the location of the accommodation. This would include features such as:
Safety of the accommodation
Overcrowding
Facilities
Where the victim lives in the house or nearby
Data source
OASys National Reporting (ONR): centrally-produced reports from local data recorded on Offender Assessment System (OASys).
Calculation
(a / b) x 100
Where:
a) Number of offenders with settled and suitable accommodation at the end of their order or licence as recorded on the final (termination) OASys assessment
b) Total number of offenders with final (termination) OASys assessments completed in the current month
Education
Referrals to education providers in the community
Rationale
This indicator is intended to improve the levels of referrals to education providers in order to support the educational and employment needs of the offender.
100

NOMS Annual Report 2009/10:
Management Information Addendum
Technical description
This includes all referrals and not just those for ‘skills for life’ or ‘basic skills’.
Referrals may be:
Where an Individual Referral Record (IRR) has been completed and agreed with the learner/offender, or
Where an appointment with an accredited provider has been made and confirmed
Data Source
Locally recorded probation area data collated in central systems.
Calculation
A count of the total number of offenders in the community referred to education providers.
Basic Skills and Key Work Skills in custody (Wales only)
Rationale
To increase the number of basic skills and key work skills awards gained by prisoners.
Technical description
Since 2007/08, the Prison Service has no longer owned targets for the achievement of basic skills and work skills in England as these became the responsibility of the Skills Funding Agency. However, in Wales, where the Skills Funding Agency did not have the responsibility for learning and skills, targets for basic and work skills targets are commissioned by the Welsh Director of Offender Management
Data source
Monthly data from prison establishments collated in central performance systems.
Calculation
This indicator is a simple count of the number of basic skills and key work skills
101

NOMS Annual Report 2009/10:
Management Information Addendum
Education and Training
Rationale
The purpose of this measure is to identify the number of offenders leaving custody with education or training places to take up after release.
Technical Description
The education and training status of prisoners at discharge is recorded by establishments using the Local Inmate Database System (LIDS).
An education or training outcome is recorded under the following definitions:
i) Full-time education or training (i.e. 16 or more hours a week of class work or instruction)
ii) Part-time education or training (i.e. less than 16 hours a week of class work or instruction)
Data Source
Monthly data from prison establishments collated in central performance systems.
Calculation
Number of Education & training Outcomes / Number of Discharges *100 = % Education & training
Safety and Decency in Custody
Serious assaults in custody
Rationale
To reduce the incidence of serious assaults and maintain safety and decency in custody.
102

NOMS Annual Report 2009/10:
Management Information Addendum
Technical description
An assault is classified as serious if it:
Is a sexual assault
Results in detention in outside hospital as an inpatient
Requires medical treatment for concussion or internal injuries
The injury is a fracture, scald or burn, stabbing, crushing, extensive or multiple bruising, black eye, broken nose, lost or broken tooth, cuts requiring suturing, bites or temporary or permanent blindness.
Data source
Monthly data from prison establishments collated in central performance systems.
Calculation
The serious assaults KPI measures the number of incidents in which at least one victim sustained a serious injury as a result of offences against the person expressed as a percentage proportion of the average prisoner population.
The serious assault rate % =
(Total Serious Assaults in the year/ Average population for the year) x 100
Overcrowding in custody
Rationale
To maintain overcrowding within acceptable levels.
Technical description
Overcrowding is the count of total number of prisoners who, on the last day of the month, are held in a cell, cubicle or room where the number of occupants exceeds the baseline certified normal accommodation of the cell, cubicle or room. This includes the number of prisoners held two to a single cell, three prisoners in a cell designed for one or two and any prisoners held over crowdedly in larger cells or dormitories. For example, if twelve prisoners occupy a dormitory with a capacity of ten, then the twelve
103

NOMS Annual Report 2009/10:
Management Information Addendum
prisoners should be counted as overcrowded. If the establishment has reported a number of prisoners ‘doubled’, then at least this number should be reported as overcrowded.
Data source
Monthly data from prison establishments collated in central performance systems.
Calculation
Overcrowding rate for the year is calculated by summing the overcrowded figure for each month and prison population figure for each month. The total overcrowded figure for the year is then divided by the total population for the year and expressed as a percentage to show the rate of overcrowding.
Self-inflicted deaths in custody
Rationale
To reduce the incidence of self-inflicted deaths in custody.
Technical description
The three-year rolling average rate of self inflicted deaths per 100,000 prisoners.
Data source
Monthly data from prison establishments collated in central performance systems.
Calculation
(Number of self-inflicted deaths /Average population) x 100,000
Corporate
Staff sickness – agency KPI
Rationale
To monitor and reduce the number of days lost to staff sickness absence in public prisons and the probation service.
104

NOMS Annual Report 2009/10:
Management Information Addendum
Technical description
Staff sickness is reported as the average number of days lost per member of staff per year.
Data sources
Prisons:
Monthly data from prison establishments collated in central performance systems.
Probation:
Monthly data recorded by probation Trusts and collated at the centre.
Calculation
(a + b) / (c + d)
Where:
a) Total days absence for probation staff during the year
b) Total days absence for prison staff during the year
c) Average probation FTE for year
d) Average prison staff headcount for year
Staff sickness – public prisons
Rationale
To monitor and reduce the number of days lost to staff sickness absence in public prisons.
Technical description
The staff sickness measure is shown as the average working days lost through sickness per member of staff for the year.
Data source
Monthly data from prison establishments collated in central performance systems.
105

NOMS Annual Report 2009/10:
Management Information Addendum
Calculation
Total working days lost in the year / Average head count for the year
Staff sickness - probation
Rationale
To monitor and reduce the days lost due to staff sickness absence in the probation service.
Technical description
Days lost due to sickness are recorded as Short Term (less than 28 days in duration), Long Term (28 calendar days or more in duration) and DDA (attributable to disability as defined in the Disability Discrimination Act).
Data source
Monthly data recorded by probation areas and collated at the centre
Calculation
The total days lost due to sickness absence divided by the average FTE for the year.
Race equality: staff in public sector prisons and the probation service
Rationale
NOMS aims to have the same staffing mix as there is in the wider working population.
Technical Description
The representation rate is reported as the number of minority ethnic staff as a proportion of all staff with stated ethnicity.
Data Source
Prisons:
Monthly data from prison establishments is collated in central performance systems.
106

NOMS Annual Report 2009/10:
Management Information Addendum
Probation:
Data is extracted from the HR data warehouse each month
Calculation
Ethnic minority staff as a percentage of total staff with known ethnicities, i.e. staff whose ethnicity is not known are excluded from the base.
(Headcount number of ethnic minority staff / (total staff headcount – Headcount number of staff choosing not to disclose ethnicity)) x 100
107

NOMS Annual Report 2009/10:
Management Information Addendum
108
Explanatory notes
Data in this report are drawn from administrative IT systems. Although care is taken when processing and analysing the data, the level of detail collected is subject to the inaccuracies inherent in any large-scale recording system.
Symbols and conventions
The following symbols have been used throughout the tables in this bulletin:
- = Not applicable 0 = Nil
Contact points for further information
Press enquiries should be directed to the Ministry of Justice press office:
Tel: 020 3334 3555 Email: [email protected]
Other enquiries about these statistics should be directed to:
Performance, Information & Analysis Group National Offender Management Service Ministry of Justice 5th Floor, Red Zone Clive House 70 Petty France London SW1H 9EX Email: [email protected]
General enquiries about the statistical work of the Ministry of Justice can be e-mailed to: [email protected]
General information about the official statistics system of the UK is available from www.statistics.gov.uk


© Crown copyright Produced by the Ministry of Justice
Alternative formats are available on request from [email protected]