contentsdethrives.com/wp-content/uploads/2015/06/appendix... · contents national performance ......
TRANSCRIPT
APPENDIX B: TOPIC BRIEFS
Contents NATIONAL PERFORMANCE MEASURE 1: WELL WOMEN CARE .................................................................................................... 1
NATIONAL PERFORMANCE MEASURE 2: LOW RISK CESAREAN .................................................................................................... 7
NATIONAL PERFORMANCE MEASURE 3: PERINATAL REGIONALIZATION................................................................................... 11
NATIONAL PERFORMANCE MEASURE 4: BREASTFEEDING ......................................................................................................... 15
NATIONAL PERFORMANCE MEASURE 5: SAFE SLEEP ................................................................................................................. 22
NATIONAL PERFORMANCE MEASURE 6: DEVELOPMENTAL SCREENING .................................................................................. 27
NATIONAL PERFORMANCE MEASURE 7: INJURY ........................................................................................................................ 32
NATIONAL PERFORMANCE MEASURE 8: PHYSICAL ACTIVITY .................................................................................................... 37
NATIONAL PERFORMANCE MEASURE 9: BULLYING ................................................................................................................... 42
NATIONAL PERFORMANCE MEASURE 10: ADOLESCENT WELL VISIT ......................................................................................... 47
NATIONAL PERFORMANCE MEASURE 11: CYSHCN HAVING A MEDICAL HOME ........................................................................ 52
NATIONAL PERFORMANCE MEASURE 12: TRANSITION ............................................................................................................. 57
NATIONAL PERFORMANCE MEASURE 13: ORAL HEALTH ........................................................................................................... 62
NATIONAL PERFORMANCE MEASURE 14: HOUSEHOLD SMOKING ............................................................................................. 69
NATIONAL PERFORMANCE MEASURE 15: ADEQUATE INSURANCE COVERAGE .......................................................................... 77

2015-2020 Title V Needs Assessment MCH Topic Briefs
V5
Page 1
Population Domain: Women and Maternal Health
WELL WOMEN CARE NATIONAL PERFORMANCE MEASURE 1
The Importance of Prevention For women, the ability to access preventative services is very important given their longer life expectancies, reproductive and gender specific conditions, and historically greater burden of chronic disease and disability.i
Access to health care is critical to prevent the onset of disease, as well as to identify health issues early and prevent disease progression. Although health care is important for all women, it may be particularly important among women who have poor health status, chronic conditions, or disabilities. However, Hispanic and non-Hispanic American Indian/Alaskan Native women were more likely than non-Hispanic White, non-Hispanic Black, and non-Hispanic Asian women to report having delayed care due to logistical barriers such as not being able to get an appointment soon enough and inconvenient office hours.ii
According to clinical guidelines from the Office of Disease Prevention and Health Promotion, a well woman visit “includes a full checkup, separate from any other visit for sickness or injury. These visits focus on preventive care for women, which may include:
• Services, like shots, that improve your health by preventing diseases and other health problems • Screenings, which are medical tests to check for diseases early when they may be easier to treat • Education and counseling to help you make informed health decisions"iii
National Performance Measure 1: Metric Guidance (page 74) Measure: Percent of women with a past year preventive visit
Source: Behavioral Risk Factor Surveillance System (BRFSS)
Numerator: Women who reported having a routine check-up in the last year
Denominator: Women, ages 18-44
Significance: A well-woman or preconception visit provides a critical opportunity to receive recommended clinical preventive services, including screening, counseling, and immunizations, which can lead to appropriate identification,
2015-2020 Title V Needs Assessment MCH Topic Briefs
V5
Page 2
treatment, and prevention of disease to optimize the health of women before, between, and beyond potential pregnancies. For example, screening and management of chronic conditions such as diabetes, and counseling to achieve a healthy weight and smoking cessation, can be advanced within a well woman visit to promote women’s health prior to and between pregnancies and improve subsequent maternal and perinatal outcomes. The annual well-woman visit has been endorsed by the American College of Obstetrics and Gynecologists (ACOG) and was also identified among the women’s preventive services required by the Affordable Care Act (ACA) to be covered by private insurance plans without cost-sharing.
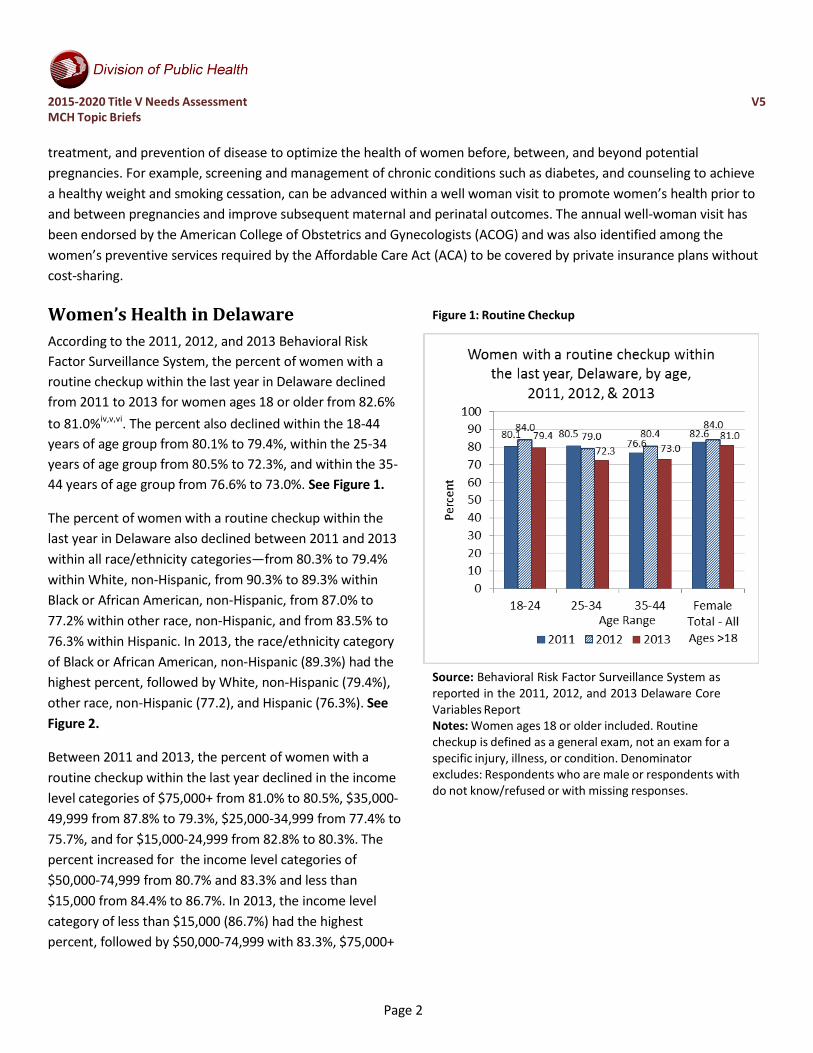
Women’s Health in Delaware According to the 2011, 2012, and 2013 Behavioral Risk Factor Surveillance System, the percent of women with a routine checkup within the last year in Delaware declined from 2011 to 2013 for women ages 18 or older from 82.6% to 81.0%iv,v,vi. The percent also declined within the 18-44 years of age group from 80.1% to 79.4%, within the 25-34 years of age group from 80.5% to 72.3%, and within the 35- 44 years of age group from 76.6% to 73.0%. See Figure 1.
The percent of women with a routine checkup within the last year in Delaware also declined between 2011 and 2013 within all race/ethnicity categories—from 80.3% to 79.4% within White, non-Hispanic, from 90.3% to 89.3% within Black or African American, non-Hispanic, from 87.0% to 77.2% within other race, non-Hispanic, and from 83.5% to 76.3% within Hispanic. In 2013, the race/ethnicity category of Black or African American, non-Hispanic (89.3%) had the highest percent, followed by White, non-Hispanic (79.4%), other race, non-Hispanic (77.2), and Hispanic (76.3%). See Figure 2.
Between 2011 and 2013, the percent of women with a routine checkup within the last year declined in the income level categories of $75,000+ from 81.0% to 80.5%, $35,000- 49,999 from 87.8% to 79.3%, $25,000-34,999 from 77.4% to 75.7%, and for $15,000-24,999 from 82.8% to 80.3%. The percent increased for the income level categories of $50,000-74,999 from 80.7% and 83.3% and less than $15,000 from 84.4% to 86.7%. In 2013, the income level category of less than $15,000 (86.7%) had the highest percent, followed by $50,000-74,999 with 83.3%, $75,000+
Figure 1: Routine Checkup
Source: Behavioral Risk Factor Surveillance System as reported in the 2011, 2012, and 2013 Delaware Core Variables Report Notes: Women ages 18 or older included. Routine checkup is defined as a general exam, not an exam for a specific injury, illness, or condition. Denominator excludes: Respondents who are male or respondents with do not know/refused or with missing responses.

2015-2020 Title V Needs Assessment MCH Topic Briefs
V5
Page 3
with 80.5%, $15,000-24,999 with 80.3%, $35,000-49,999 with 79.3%, and $25,000-34,999 with 75.7%. See Figure 3.

2015-2020 Title V Needs Assessment MCH Topic Briefs
V5
Page 4
Figure 2: Race/Ethnicity Figure 3: Income Level
Source: Behavioral Risk Factor Surveillance System as reported in the 2011, 2012, and 2013 Delaware Core Variables Report Notes: Women ages 18 or older included. Routine checkup is defined as a general exam, not an exam for a specific injury, illness, or condition. Denominator excludes: Respondents who are male or respondents with do not know/refused or with missing responses.
Source: Behavioral Risk Factor Surveillance System as reported in the 2011, 2012, and 2013 Delaware Core Variables Report Notes: Women ages 18 or older included. Routine checkup is defined as a general exam, not an exam for a specific injury, illness, or condition. Denominator excludes: Respondents who are male or respondents with do not know/refused or with missing responses.

2015-2020 Title V Needs Assessment MCH Topic Briefs
V5
Page 5
Interest and Capacity to Address Issue As part of the 2015-2020 Title V Needs Assessment, maternal and child health stakeholders recently completed a survey to identify priority areas for addressing the health needs of Delaware’s women, mothers, and children. The survey questions provided stakeholders with different ways of expressing what they considered priority areas. With regard to well women care, the survey results reveal the following information.
• Stakeholders were asked to rate their “top 7” across 15 national priority areas. Well woman care was ranked #5 among the 15 areas, receiving 135 votes.
• Stakeholders were also asked to identify which among two areas was most important within the women/maternal health domain. Well woman care was rated #1 among the two (82% chose well woman care, 14% chose low risk cesarean).
• Stakeholders were asked to assess the capacity of the Delaware Maternal and Child Health System to address improving well woman care. About two-thirds (63%) thought there was a strong desire to address this issue. Around half (54%) thought evidence-based programs were available and progress was being made in Delaware (49%), but only 32% thought there were adequate resources available in this area.
Related State and National Goals
Figure 4: Stakeholder Survey
Source: 2015 Delaware Title V MCH Stakeholder Survey Notes: Not all survey participants answered every question. 278 participants answered this question.
Healthy People 2020 (Note: No objectives specifically address preventative services for all women, only those who are pregnant.) AHS-2 (Developmental) Increase the proportion of insured persons with coverage for clinical preventive servicesvii
MICH-10 Increase the proportion of pregnant women who receive early and adequate prenatal careviii
MICH-10.2 Increase the proportion of pregnant women who receive early and adequate prenatal care
Baseline: 70.5 percent of pregnant females received early and adequate prenatal care in 2007
Target: 77.6 percent
There are no state goals or strategies related to this health area listed in the First Delaware State Health Improvement Plan or the Delaware Division of Public Health 2014-2017 Strategic Plan.

2015-2020 Title V Needs Assessment MCH Topic Briefs
V5
Page 6
i Institute of Medicine. (2011). Clinical Preventive Services for Women. Report Brief July 2011 ii Institute of Medicine. (2011). Clinical Preventive Services for Women. Report Brief July 2011 iii Office of Disease Prevention and Health Promotion. (2015). “Get Your Well-Woman Visit Every Year.” Retrieved from http://healthfinder.gov/HealthTopics/Category/everyday-healthy-living/sexual-health/get-your-well-woman-visit-every-year iv Center for Disease Control and Prevention. (2014). Delaware 2013 Core Variables Report, Behavioral Risk Factor Surveillance System. Retrieved from http://www.dhss.delaware.gov/dph/dpc/files/de13corevariables.pdf v Center for Disease Control and Prevention. (2013). Delaware 2012 Core Variables Report, Behavioral Risk Factor Surveillance System. Retrieved from http://www.dhss.delaware.gov/dph/dpc/files/de12corevariables.pdf vi Center for Disease Control and Prevention. (2012). Delaware 2011 Core Variables Report, Behavioral Risk Factor Surveillance System. Retrieved from http://www.dhss.delaware.gov/dph/dpc/files/de11corevariables.pdf vii Healthy People 2020. (2015). Access to Health Services – Objectives. Retrieved from http://www.healthypeople.gov/2020/topics- objectives/topic/Access-to-Health-Services/objectives viii Healthy People 2020. (2015). Maternal, Infant, and Child Health – Objectives. Retrieved from http://www.healthypeople.gov/2020/topics-objectives/topic/maternal-infant-and-child-health

2015-2020 Title V Needs Assessment MCH Topic Briefs
V6
Page 7
Population Domain: Women and Maternal Health
LOW RISK CESAREAN NATIONAL PERFORMANCE MEASURE 2
Reducing Low-risk Cesarean Deliveries
When not medically necessary, cesarean deliveries can pose avoidable risks, including longer maternal recovery, neonatal respiratory problems, and potentially severe complications in subsequent pregnancies.i Compared with vaginal delivery cesarean delivery may have short- and long-term risks and consequences, such as surgical complications, admission to neonatal intensive care, and higher costs.ii The American College of Obstetricians and Gynecologists released clinical guidelines aimed at reducing non-medically necessary cesarean delivery for women who are less than 39 weeks pregnant.iii
Efforts to reduce such births include initiatives at the state level to improve the quality of perinatal care, policy changes at the hospital level to disallow elective delivery prior to 39 weeks, and education of the public.iv Additionally, Healthy People 2020 set national objectives to reduce the cesarean delivery rate by ten percent among low-risk women giving birth for the first time and among low-risk women with a prior cesarean section.v Low-risk is defined as non-breech, singleton deliveries at 37 weeks or more gestation.v
National Performance Measure 2: Metric Guidance (page 75) Measure: Percent of cesarean deliveries among low-risk first births Source: Birth certificates Numerator: Cesarean delivery among term (37+ weeks), singleton, vertex births to nulliparous women Denominator: All term (37+ weeks), singleton, vertex births to nulliparous women Significance: Cesarean delivery can be a life-saving procedure for certain medical indications. However, for most low- risk pregnancies, cesarean delivery poses avoidable maternal risks of morbidity and mortality, including hemorrhage, infection, and blood clots—risks that compound with subsequent cesarean deliveries. Much of the temporal increase in cesarean delivery (over 50% in the past decade), and wide variation across states, hospitals, and practitioners, can be attributed to first-birth cesareans. Moreover, cesarean delivery in low-risk first births may be most amenable to intervention through quality improvement efforts. This low-risk cesarean measure, also known as nulliparous term singleton vertex (NTSV) cesarean, is endorsed by the ACOG, The Joint Commission (PC-02), National Quality Forum (#0471), Center for Medicaid and Medicare Services (CMS) – CHIPRA Child Core Set of Maternity Measures, and the American Medical Association-Physician Consortium for Patient Improvement.

2015-2020 Title V Needs Assessment MCH Topic Briefs
V6
Page 8
Low Risk Cesarean Births in Delaware
According to birth certificates from the Delaware Vital Statistics program, the percent of cesarean deliveries among low- risk first births increased from 2006 (23.5%) to 2010 (27.8%)vi. The five-year average percent over this time period was 24.4%. See Figure 1.
Between 2006 and 2010, in Delaware, the race/ethnicity category of Black, non-Hispanic (30.8%) had the highest percentage of cesarean deliveries among low-risk first births, followed by White, non-Hispanic (27.5%), other, non- Hispanic (26.1%), and Hispanic (23.4%). See Figure 2.
Figure 1: Cesarean Deliveries Figure 2: Cesarean Deliveries
Source: Birth Certificates 2006-2010 from Delaware Vital
Statistics Notes: Definition: Cesarean delivery among term (37+ weeks), singleton, vertex births to nulliparous women. Technical definition: GEST ge 37 and PARITY = 1 (current delivery) and PLURAL = 1 and (CLDNONV6=0 and FPCEPH6=1). Vertex births defined as both cephalic presentation and vertex presentation. *The 5-year average was calculated with a numerator of total # of cesarean births and a denominator of total # of low-risk cases.
Source: Birth Certificates 2006-2010 from Delaware Vital Statistics Notes: Definition: Cesarean delivery among term (37+ weeks), singleton, vertex births to nulliparous women. Technical definition: GEST ge 37 and PARITY = 1 (current delivery) and PLURAL = 1 and (CLDNONV6=0 and FPCEPH6=1). Vertex births defined as both cephalic presentation and vertex presentation. *The 2010 average was calculated with a numerator of total # of cesarean births in 2010 and a denominator of total # of low-risk cases in 2010.
2015-2020 Title V Needs Assessment MCH Topic Briefs
V6
Page 9
Interest and Capacity to Address Issue As part of the 2015-2020 Title V Needs Assessment, maternal and child health stakeholders recently completed a survey to identify priority areas for addressing the health needs of Delaware’s women, mothers, and children. The survey questions provided stakeholders with different ways of expressing what they considered priority areas. With regard to low-risk cesarean deliveries, the survey results reveal the following information.
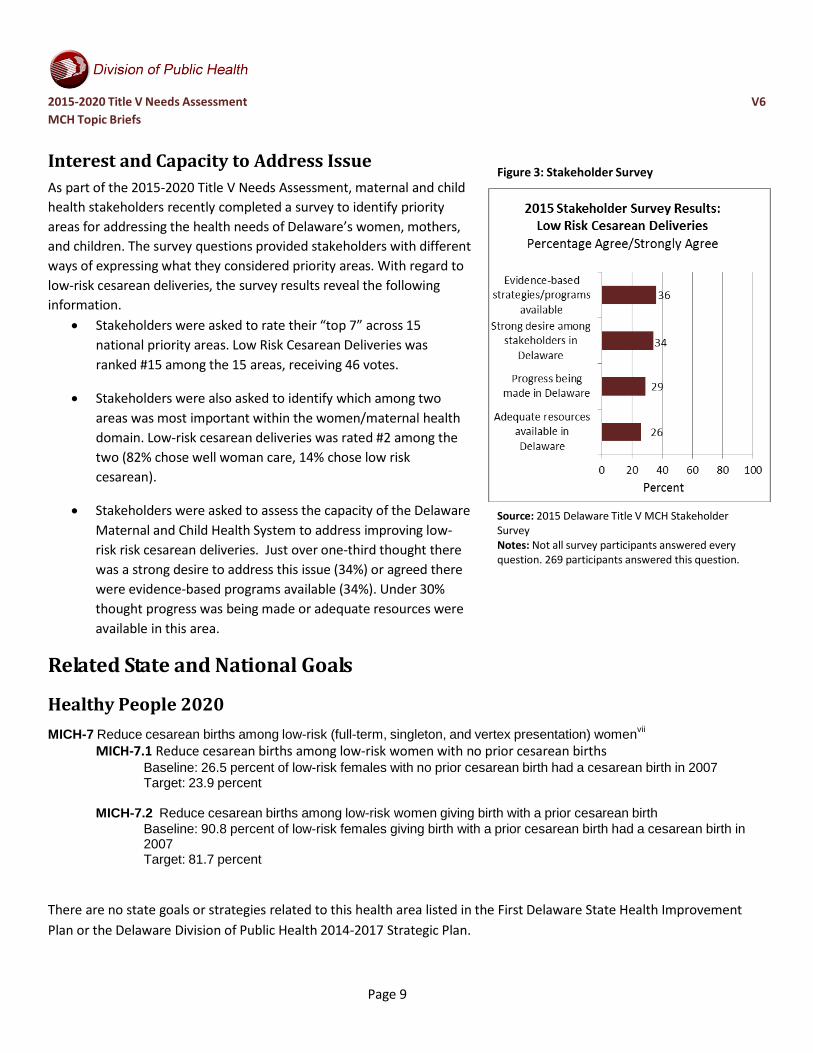
• Stakeholders were asked to rate their “top 7” across 15 national priority areas. Low Risk Cesarean Deliveries was ranked #15 among the 15 areas, receiving 46 votes.
• Stakeholders were also asked to identify which among two areas was most important within the women/maternal health domain. Low-risk cesarean deliveries was rated #2 among the two (82% chose well woman care, 14% chose low risk cesarean).
• Stakeholders were asked to assess the capacity of the Delaware Maternal and Child Health System to address improving low- risk risk cesarean deliveries. Just over one-third thought there was a strong desire to address this issue (34%) or agreed there were evidence-based programs available (34%). Under 30% thought progress was being made or adequate resources were available in this area.
Related State and National Goals
Figure 3: Stakeholder Survey
Source: 2015 Delaware Title V MCH Stakeholder Survey Notes: Not all survey participants answered every question. 269 participants answered this question.
Healthy People 2020 MICH-7 Reduce cesarean births among low-risk (full-term, singleton, and vertex presentation) womenvii
MICH-7.1 Reduce cesarean births among low-risk women with no prior cesarean births Baseline: 26.5 percent of low-risk females with no prior cesarean birth had a cesarean birth in 2007 Target: 23.9 percent
MICH-7.2 Reduce cesarean births among low-risk women giving birth with a prior cesarean birth
Baseline: 90.8 percent of low-risk females giving birth with a prior cesarean birth had a cesarean birth in 2007 Target: 81.7 percent
There are no state goals or strategies related to this health area listed in the First Delaware State Health Improvement Plan or the Delaware Division of Public Health 2014-2017 Strategic Plan.

2015-2020 Title V Needs Assessment MCH Topic Briefs
V6
Page 10
iCenters for Disease Control and Prevention. (2014). Primary Cesarean Delivery Rates, by State: Results from the Revised Birth Certificate, 2006-2013. National Vital Statistics Reports, January 23, 2014, volume 63, number 1. ii Centers for Disease Control and Prevention. (2014). Primary Cesarean Delivery Rates, by State: Results from the Revised Birth Certificate, 2006-2013. National Vital Statistics Reports, January 23, 2014, volume 63, number 1. iii Centers for Disease Control and Prevention. (2014). Primary Cesarean Delivery Rates, by State: Results from the Revised Birth Certificate, 2006-2013. National Vital Statistics Reports, January 23, 2014, volume 63, number 1. iv Centers for Disease Control and Prevention. (2014). Primary Cesarean Delivery Rates, by State: Results from the Revised Birth Certificate, 2006-2013. National Vital Statistics Reports, January 23, 2014, volume 63, number 1. v Child Health USA 2013. (2013) Cesarean Delivery. Retrieved from: http://mchb.hrsa.gov/chusa13/perinatal-health- status-indicators/p/cesarean-delivery.html vi Delaware Vital Statistics (Birth Certificates). 2006-2010. vii Healthy People 2020. (2015). Maternal, Infant, and Child Health – Objectives. Retrieved from http://www.healthypeople.gov/2020/topics-objectives/topic/maternal-infant-and-child-health/objectives

2015-2020 Title V Needs Assessment MCH Topic Briefs
V6
Page 11
Population Domain: Perinatal/Infant Health
PERINATAL REGIONALIZATION NATIONAL PERFORMANCE MEASURE 3
What is Perinatal Regionalization?
“Perinatal regionalization is a system of designating where infants are born or are transferred based on the amount of care that they need at birth. In regionalized systems, very ill or very small infants are born in hospitals that are able to provide the most appropriate care, with high level-technology and specialized health providers. Regionalized systems define hospitals at risk- appropriate levels; Level III hospitals, for example, provide the most appropriate care for the sickest infants. Regionalized systems are often designed, designated, and managed by state health departments, but in some states hospital networks or non- profit groups make these decisions. Infants receiving risk-appropriate care are hypothesized to be more likely to survive when born too little or too soon. The goal of a regionalized system is to reduce infant deaths.”i
National Performance Measure 3: Metric Guidance (page 76) Measure: Percent of very low birth weight (VLBW) infants born in a hospital with a Level III+ Neonatal Intensive Care Unit (NICU) Source: Linked birth certificate and hospital data on NICU levels from American Academy of Pediatrics (AAP) Numerator: VLBW infants born in a hospital with a level III or higher NICU Denominator: VLBW infants (< 1500 grams) Significance: Very low birth weight infants (<1,500 grams or 3.25 pounds) are the most fragile newborns. Although they represented less than 2% of all births in 2010, VLBW infants accounted for 53% of all infant deaths, with a risk of death over 100 times higher than that of normal birth weight infants (≥2,500 grams or 5.5 pounds). VLBW infants are significantly more likely to survive and thrive when born in a facility with a level-III Neonatal Intensive Care Unit (NICU), a subspecialty facility equipped to handle high-risk neonates. In 2012, the AAP provided updated guidelines on the definitions of neonatal levels of care to include Level I (basic care), Level II (specialty care), and Levels III and IV (subspecialty intensive care) based on the availability of appropriate personnel, physical space, equipment, and organization. Given overwhelming evidence of improved outcomes, the AAP recommends that VLBW and/or very preterm infants (<32 weeks’ gestation) be born in only level III or IV facilities. This measure is endorsed by the National Quality Forum (#0477).

2015-2020 Title V Needs Assessment MCH Topic Briefs
V6
Page 12
Perinatal Care in Delaware
Maternity departments with level III neonatal intensive care units (NICUs) have the capacity to serve the smallest and sickest babies. In Delaware the only Level III certified NICU is at Christiana Care Hospital in Newark, DE. There is a Level II NICU at Kent General Hospital in Dover, DE, but Level II NICUs generally do not have the capacity to handle life- threatening issues and often must transfer such cases to Level III facilities. Babies born with very low birth weight (“VLBW”, or under 1,500 grams or 3.25 pounds) are at increased risk of dying within the first year of life.ii A recent review of 37 published studies showed the risk of death for these VLBW, as well as babies born before 32 weeks, is much greater when the babies are not admitted to a Level III NICU.iii The percentage of VLBW babies accounted for only 1.8% births to mothers in Delaware between 2006 and 2010iv. This rate is slightly above the national (2007) benchmark of 1.5%.v
According to 2006-2010 Birth Certificates from Delaware Vital Statistics, the percent of very low birthweight (VLBW) births at a facility with a Level III NICU increased from 78.3% in 2006 to 81.7% in 2010vi. The average percent over that five year period was 79.0%. See Figure 1.
Between 2006 and 2010 (5-year combined), in Delaware, the race/ethnicity category of Hispanic (82.1%) had the highest percentage of very low birthweight (VLBW) infants born at a facility with a Level III NICU, followed by White, non- Hispanic (79.8%), Black, non-Hispanic (78.4%), and other, non-Hispanic (78.1%). See Figure 2.
Figure 1: VLBW at Level III NICU
Source: Birth Certificates 2006-2010 from Delaware Vital Statistics Notes: Definition: VLBW infants had a birth weight of under 1,500 grams. Numerator is number of VLBW infants born in Christiana Care Hospital, the only maternity hospital with a level III NICU in DE.
Figure 2: VLBW at Level III NICU, by Race/Ethnicity
Source: Birth Certificates 2006-2010 from Delaware Vital Statistics Notes: *5-year combined. Definition: VLBW infants had a birth weight of under 1,500 grams. Numerator is number of VLBW infants born in Christiana Care Hospital, the only maternity hospital with a level III NICU in DE.

2015-2020 Title V Needs Assessment MCH Topic Briefs
V6
Page 13
Interest and Capacity to Address Issue As part of the 2015-2020 Title V Needs Assessment, maternal and child health stakeholders recently completed a survey to identify priority areas for addressing the health needs of Delaware’s women, mothers, and children. The survey questions provided stakeholders with different ways of expressing what they considered priority areas. With regard to perinatal regionalization, the survey results reveal the following information.
• Stakeholders were asked to rate their “top 7” across 15 national priority areas. Perinatal Regionalization was ranked #13 among the 15 areas, receiving 87 votes.
• Stakeholders were also asked to identify which among three areas was most important within the perinatal/infant’s health domain. Perinatal Regionalization was rated #2 among the three (35% chose breastfeeding, 32% chose perinatal regionalization, 26% chose safe sleep).
• Stakeholders were asked to assess the capacity of the Delaware Maternal and Child Health System to address improving safe sleep for children. Sixty percent thought there was a strong desire to address this issue. Just over half (52%) thought evidence-based programs existed in this area. Just below half thought there were adequate resources (45%) and progress was being made in this area (46%).
Related State and National Goals
Figure 3: Stakeholder Survey
Source: 2015 Delaware Title V MCH Stakeholder Survey Notes: Not all survey participants answered every question. 265 participants answered this question.
There are no national state goals or strategies related to this health area listed in Healthy People 2020, the First Delaware State Health Improvement Plan or the Delaware Division of Public Health 2014-2017 Strategic Plan.
i Association of Maternal and Child Health Programs. (n.d.) Collaborative Efforts to Address the Impact of Perinatal Regionalization on Infant Mortality [website]. Retrieved from: www.amchp.org ii U.S. Department of Health and Human Services, Health Resources and Services Administration, Maternal and Child Health Bureau. (2013). Child Health USA 2013. iii Lasswell, Barfield, Rochat, Blackmon. (2010). Perinatal Regionalization for very low birth weight and very pre-term infants: a meta- analysis. JAMA. 304(9): 992-1000. Retrieved from: http://www.ncbi.nlm.nih.gov/pubmed/20810377

2015-2020 Title V Needs Assessment MCH Topic Briefs
V6
Page 14
iv John Snow, Inc. (2015). Delaware Perinatal Periods of Risk Analysis, 2006-2010. v U.S. Department of Health and Human Services, Office of Disease Prevention and Health Promotion. (2014). Healthy People 2020. Retrieved from https://www.healthypeople.gov/node/3492/data-details. vi Delaware Vital Statistics (Birth Certificates). 2006-2010.

2015-2020 Title V Needs Assessment MCH Topic Briefs
V6
Page 15
Population Domain: Perinatal/Infant Health
BREASTFEEDING NATIONAL PERFORMANCE MEASURE 4
Benefits of Breastfeeding Breastfeeding offers many benefits to the mother and infant. It improves a mother’s health and healing after childbirth and the cells, hormones and antibodies in the breast milk help protect the infant.i “Breast milk promotes sensory and cognitive development, and protects the infant against infectious and chronic diseases. Exclusive breastfeeding reduces infant mortality due to common childhood illnesses such as diarrhea or pneumonia, and helps for a quicker recovery during illness.”ii Supporting women to breastfeed for the recommended duration is an effective strategy for protecting the health of the infant and the mother.iii However, there are many social factors that can influence breastfeeding initiation and continuation, including lack of knowledge, poor family and social support, employment and childcare. In the U.S., 75% of mothers initiate breastfeeding . However, after six months post-birth only 13% of infants are exclusively breastfed, with rates among African-American infants are much lower. Fifty-eight percent of African- Americans initiate breastfeeding, and 28% breastfeed at six months, with 8% exclusively breastfeeding at six months.
National Performance Measure 4: Metric Guidance (page 77) Measure: A) Percent of infants who are ever breastfed and B) Percent of infants breastfed exclusively through 6 months Source: CDC’s National Immunization Survey (NIS) Numerator: A) Number of infants who were ever breastfed B) Number of infants breastfed exclusively through 6 months Denominator: A) All infants born in a calendar year B) All infants born in a calendar year Significance: Advantages of breastfeeding are indisputable. The American Academy of Pediatrics recommends all infants (including premature and sick newborns) exclusively breastfeed for about six months as human milk supports optimal growth and development by providing all required nutrients during that time. Breastfeeding strengthens the immune system, improves normal immune response to certain vaccines, offers possible protection from allergies, and reduces probability of SIDS. Research demonstrates breastfed children may be less likely to develop juvenile diabetes; and may have a lower risk of developing childhood obesity, and asthma; and tend to have fewer dental cavities throughout life. The bond of a nursing mother and child is stronger than any other human contact. A woman's ability to meet her child’s nutritional needs improves confidence and bonding with the baby and reduces feelings of anxiety and post natal depression. Increased release of oxytocin while breastfeeding, leads to a reduction in post-partum hemorrhage and quicker return to a normal sized uterus over time, mothers who breastfeed may be less likely to develop breast, uterine and ovarian cancer and have a reduced risk of developing osteoporosis.

2015-2020 Title V Needs Assessment MCH Topic Briefs
V6
Page 16
Breastfeeding in Delaware
National Performance Measure 4A Ever Breastfed
According to the 2003, 2007, and 2011/12 National Survey of Children’s Health, the percent of children ages 0-5 who were ever breastfed or fed breast milk increased in Delaware from 62.1% in survey year 2003 to 72.4% in survey year 2011/12 and from 72.3% to 79.2% nationally over the same time periodiv,v,vi. In survey year 2011/12, the percent in Delaware (72.4%) was lower than the national estimate (79.2%). See Figure 1.
In Delaware, between survey year 2007 and 2011/12, the percent of children ages 0-5 who were ever breastfed or given breast milk increased for the race/ethnicity categories of White, non-Hispanic from 72.3% to 75.1% and for Black, non-Hispanic from 61.8% to 67.3%. The percent decreased for the race/ethnicity categories of other, non-Hispanic from 92.7% to 69.5% and for Hispanic from 80.8% to 75.3%. In survey year 2011/12, the highest percent was for the race/ethnicity category of Hispanic (75.3%), followed by White, non- Hispanic (75.1%), other, non-Hispanic (69.5%), and Black, non-Hispanic (67.3%). See Figure 2.
In Delaware, between survey years 2003 and 2011/12, the percent of children ages 0-5 who were ever breastfed or fed breast milk increased for the household income levels of 400% FPL or higher (77.6% to 79.3%), for 200%-399% FPL from 72.8% to 78.2%, for 100- 199% FPL from 49.5% to 65.4%, and from 0-99% FPL from 35.1% to 62.9%. In survey year 2011/12, the household income level of 400% or higher had the highest percent (79.3%), followed by 200-399% FPL with 78.2%, 100-199% FPL with 65.4%, and 0-99% FPL with 62.9%. See Figure 3.
Figure 1: Ever Breastfed
Source: 2003, 2007, and 2011/12 National Survey of Children’s Health Notes: Parent reported of children ages 0-5. Indicator 1.3: Breastfed ever.

2015-2020 Title V Needs Assessment MCH Topic Briefs
V6
Page 17
Figure 2: Ever Breastfed, by Race/Ethnicity Figure 3: Ever Breastfed, by Household Income Level
Source: 2007 and 2011/12 National Survey of Children’s Health Notes: Parent reported of children ages 0-5. Indicator 1.3: Breastfed ever. 2003 data specified different race/ethnicity categories and was not included.
Source: 2003, 2007, and 2011/12 National Survey of Children’s Health Notes: Parent reported of children ages 0-5. Indicator 1.3: Breastfed ever.

2015-2020 Title V Needs Assessment MCH Topic Briefs
V6
Page 18
National Performance Measure 4B
Breastfed through Six Months
According to the 2007 and 2011/12 National Survey of Children’s Health, the percent of children between the ages of 6 months and 5 years who were exclusively breastfed or given breast milk for their first six months increased in Delaware from 10.6% in survey year 2007 to 13.0% in survey year 2011/12 and from 12.4% to 16.0% nationally over the same time periodvii,viii, ix. In survey year 2011/12, the national estimate (16.0%) was higher than the percent in Delaware (13.0%). See Figure 4.
In Delaware, between survey years 2007 and 2011/12, the percent of children who were exclusively breastfed for six months increased in the race/ethnicity categories of White, non-Hispanic from 9.7% to 14.3% and other, non-Hispanic from 12.8% to 20.9%. The percentage decreased within Black, non-Hispanic from 11.1% to 8.7% and within Hispanic from 13.1% to 11.0%. In survey year 2011/12, the race/ethnicity category of other, non-Hispanic (20.9%) had the highest percentage, followed by White, non-Hispanic (14.3%), Hispanic (11.0%), and Black, non-Hispanic (8.7%). See Figure 5.
In Delaware, between survey years 2007 and 2011/12, the percent of children who were exclusively breastfed for six months increased within the household income levels of 200-399% from 9.6% to 13.1% and 400% of higher from 9.3% to 20.7%. The percent decreased within the household income levels of 100-199% FPL from 10.6% to 4.3% and 0- 99% FPL from 15.4% to 9.9%. This is in contrast to national estimates which increased across all household income levels between survey years 2007 and 2011/12. In survey year 2011/12, the household income level of 400% FPL or higher had the highest percentage of 20.7%, followed by 200-399% FPL (13.1%), 0-99% FPL (9.9%), and 100-199% FPL (4.3%). See Figure 6.
Figure 4: Breastfed Exclusively for Six Months
Source: 2007 and 2011/12 National Survey of Children’s Health Notes: Parent reported of children six months to five years. Indicator 1.3a: Exclusive breastfeeding. Four questions are used to construct this indicator: whether the child was ever breastfed or fed breast milk (K6Q40), age at which breastfeeding stopped (K6Q41), age at which formula was introduced (K6Q42), and age at which anything other than breast milk was introduced (K6Q43). To qualify as having been exclusively breastfed for six months, children must meet all of the following: be at least six months old, did not stop breastfeeding before six months of age, and not introduced to formula or anything other than breast milk (including juice, cow's milk, sugar water, baby food, or anything else, even water) until at least six months old.

2015-2020 Title V Needs Assessment MCH Topic Briefs
V6
Page 19
Figure 5: Breastfed Exclusively for Six Months, by Race/Ethnicity
Source: 2007 and 2011/12 National Survey of Children’s Health Notes: Parent reported of children six months to five years. Indicator 1.3a: Exclusive breastfeeding. Four questions are used to construct this indicator: whether the child was ever breastfed or fed breast milk (K6Q40), age at which breastfeeding stopped (K6Q41), age at which formula was introduced (K6Q42), and age at which anything other than breast milk was introduced (K6Q43). To qualify as having been exclusively breastfed for six months, children must meet all of the following: be at least six months old, did not stop breastfeeding before six months of age, and not introduced to formula or anything other than breast milk (including juice, cow's milk, sugar water, baby food, or anything else, even water) until at least six months old.
Figure 6: Breastfed Exclusively for Six Months, by Household Income Level
Source: 2007 and 2011/12 National Survey of Children’s Health Notes: Parent reported of children six months to five years. Indicator 1.3a: Exclusive breastfeeding. Four questions are used to construct this indicator: whether the child was ever breastfed or fed breast milk (K6Q40), age at which breastfeeding stopped (K6Q41), age at which formula was introduced (K6Q42), and age at which anything other than breast milk was introduced (K6Q43). To qualify as having been exclusively breastfed for six months, children must meet all of the following: be at least six months old, did not stop breastfeeding before six months of age, and not introduced to formula or anything other than breast milk (including juice, cow's milk, sugar water, baby food, or anything else, even water) until at least six months old.

2015-2020 Title V Needs Assessment MCH Topic Briefs
V6
Page 20
Interest and Capacity to Address Issue As part of the 2015-2020 Title V Needs Assessment, maternal and child health stakeholders recently completed a survey to identify priority areas for addressing the health needs of Delaware’s women, mothers, and children. The survey questions provided stakeholders with different ways of expressing what they considered priority areas. With regard to breastfeeding, the survey results reveal the following information.
• Stakeholders were asked to rate their “top 7” across 15 national priority areas. Breastfeeding was ranked #7 among the 15 areas, receiving 121 votes.
• Stakeholders were also asked to identify which
among three areas was most important within the perinatal/infant’s health domain. Breastfeeding was rated #1 among the three (35% chose breastfeeding, 32% chose perinatal regionalization, 26% chose safe sleep).
• Stakeholders were asked to assess the capacity of the Delaware Maternal and Child Health System to address improving breastfeeding for children. Almost three-fourths (72%) thought there was a
Source: 2015 Delaware Title V MCH Stakeholder Survey Notes: Not all survey participants answered every question. 260 participants answered this question.
strong desire to address this issue and that evidence-based programs existed in this area. Slightly above half (55%) thought there were adequate resources and 63% thought progress was being made in this area.
Related State and National Goals
Healthy People 2020 MICH-21 Increase the proportion of infants who are breastfedx
MICH-21.1 Increase the proportion of infants who are ever breastfed Baseline: 74.0 percent of infants born in 2006 were ever breastfed, as reported in 2007–09 Target: 81.9 percent
MICH-21.2 Increase the proportion of infants who are breastfed at 6 months Baseline: 43.5 percent of infants born in 2006 were breastfed at 6 months, as reported in 2007–09 Target: 60.6 percent
MICH-21.3 Increase the proportion of infants who are breastfed at 1 year Baseline: 22.7 percent of infants born in 2006 were breastfed at 1 year, as reported in 2007–09 Target: 34.1 percent
Figure 7: Stakeholder Survey

2015-2020 Title V Needs Assessment MCH Topic Briefs
V6
Page 21
MICH-21.4 Increase the proportion of infants who are breastfed exclusively through 3 months Baseline: 33.6 percent of infants born in 2006 were breastfed exclusively through 3 months, as reported in 2007–09 Target: 46.2 percent
MICH-21.5 Increase the proportion of infants who are breastfed exclusively through 6 months Baseline: 14.1 percent of infants born in 2006 were breastfed exclusively through 6 months, as reported in 2007–09 Target: 25.5 percent
There are no state goals or strategies related to this health area listed in the First Delaware State Health Improvement Plan or the Delaware Division of Public Health 2014-2017 Strategic Plan.
i Office of Women’s Health, US Department of Health and Human Services. (2014). Why breastfeeding is important. Retrieved from: http://www.womenshealth.gov/breastfeeding/breastfeeding-benefits.html ii World Health Organization. (2015). Exclusive Breastfeeding. Retrieved from: http://www.who.int/nutrition/topics/exclusive_breastfeeding/en/ iii Office of the Surgeon General, U.S. Department of Health and Human Services. (2011). Executive Summary: The Surgeon General’s Call to Action to Support Breastfeeding. Retrieved from: http://www.surgeongeneral.gov/library/calls/breastfeeding/ iv The Child & Adolescent Health Measurement Initiative. (2012). 2011/12 National Survey of Children’s Health. Retrieved from http://www.childhealthdata.org/learn/NSCH v The Child & Adolescent Health Measurement Initiative. (2012). 2007 National Survey of Children’s Health. Retrieved from http://www.childhealthdata.org/learn/NSCH vi The Child & Adolescent Health Measurement Initiative. (2012). 2003 National Survey of Children’s Health. Retrieved from http://www.childhealthdata.org/learn/NSCH vii The Child & Adolescent Health Measurement Initiative. (2012). 2011/12 National Survey of Children’s Health. Retrieved from http://www.childhealthdata.org/learn/NSCH viii The Child & Adolescent Health Measurement Initiative. (2012). 2007 National Survey of Children’s Health. Retrieved from http://www.childhealthdata.org/learn/NSCH ix The Child & Adolescent Health Measurement Initiative. (2012). 2003 National Survey of Children’s Health. Retrieved from http://www.childhealthdata.org/learn/NSCH x Healthy People 2020. (2015). Maternal, Infant and Child Health Objectives. Retrieved from: http://www.healthypeople.gov/2020/topics-objectives/topic/maternal-infant-and-child-health/objectives

2015-2020 Title V Needs Assessment MCH Topic Briefs
V6
Page 22
Population Domain: Perinatal/Infant Health
SAFE SLEEP NATIONAL PERFORMANCE MEASURE 5
Sudden Unexpected Infant Deaths (SUID)
It is estimated that in the United States approximately 4,000 infants less than one year of age die suddenly and unexpectedly each year.i These deaths are referred to as Sudden Unexpected Infant Deaths (SUID) because the cause of death often cannot be determined, observation of the death is rare, and tests are not available to distinguish between Sudden Infant Death Syndrome (SIDS) and suffocation.i However, it is known that SUID typically occur in unsafe sleeping environments.i Therefore, prevention efforts can focus on issues of unsafe sleeping environments.
There are several types of SUID:i
• Sudden Infant Death Syndrome (SIDS)—sudden death of an infant less than 1 year of age that cannot be explained after thorough investigation is conducted, including a complete autopsy, examination of the death scene, and a review of the clinical history. SIDS is the third leading cause of infant deaths in the United States and the leading cause of death for infants 1 to 12 months old.
• Unknown Cause—sudden death of an infant less than 1 year of age that cannot be explained because a thorough investigation was not conducted and cause of death could not be determined.
• Accidental Suffocation and Strangulation in Bed—death of an infant due to suffocation or strangulation caused by overlay, wedging or entrapment of the infant.
National Performance Measure 5: Metric Guidance (page 78) Measure: Percent of infants placed to sleep on their backs Source: Pregnancy Risk Assessment Monitoring System (PRAMS) Numerator: Mothers reporting that they most often place their baby to sleep on their back (Excludes multiple responses of back and combination with side or stomach sleep positions) Denominator: Live births Significance: Sleep-related infant deaths, also called Sudden Unexpected Infant Deaths (SUID), are the leading cause of infant death after the first month of life and the third leading cause of infant death overall. Sleep-related SUIDs include Sudden Infant Death Syndrome (SIDS), unknown cause, and accidental suffocation and strangulation in bed. Due to heightened risk of SIDS when infants are placed to sleep in side (lateral) or stomach (prone) sleep positions, the AAP has long recommended the back (supine) sleep position. However, in 2011, AAP expanded its recommendations to help reduce the risk of all sleep-related deaths through a safe sleep environment that includes use of the back-sleep position, on a separate firm sleep surface (room-sharing without bed sharing), and without loose bedding. Among others, additional higher-level recommendations include breastfeeding and avoiding smoke exposure during pregnancy and after birth. These expanded recommendations have formed the basis of the National Institute of Child Health and Development (NICHD) Safe to Sleep Campaign.

2015-2020 Title V Needs Assessment MCH Topic Briefs
V6
Page 23
Safe Sleep in Delaware According to the Center for Disease Control’s (CDC) Pregnancy Risk Assessment Monitoring System (PRAMS), the percentage of mothers who reported most often laying their baby on his or her back to sleep slightly declined from 75.7% in 2007 to 73.7% in 2010ii. National estimate data are not available for this survey as it is not administered in all fifty states. See Figure 1.
Hispanic mothers saw the greatest change in percent of mothers most often laying their baby on his or her back to sleep from 78.6% in 2007 to 70.3% in 2010. The percent of other, non-Hispanic mothers also declined from 76.2% in 2007 to 74.2% in 2010 as did the percent for White, non-Hispanic mothers from 80.7% to 79.0%. The percent for Black, non-Hispanic mothers increased from 62.2% to 63.4%. In 2010, White, non-Hispanic mothers (79.0%) had the highest percent, followed by other, non-Hispanic mothers (74.2%), Hispanic mothers (70.3%), and Black, non-Hispanic mothers (63.45%). See Figure 2.
The percentage of mothers who reported most often laying their baby on his or her back to sleep appears to be roughly correlated with income level between 2007 and 2010, as mothers at higher income levels had higher percentages than mothers at lower income levels. Between 2007 and 2010, the percentages declined for the income categories of less than $10,000 (66.3% to 63.4%), $10,000 to $24,999 (74.5% to 70.9%), and $25,000 to $49,999 (73.2% to 70.2%). The percent slightly increased for the income category of $50,000 or more from 82.6% to 83.1%. See Figure 3.
Figure 6: Sleeping on Back
Source: 2007-2010 CDC Pregnancy Risk Assessment Monitoring System (PRAMS) Notes: National estimates not available.

2015-2020 Title V Needs Assessment MCH Topic Briefs
V6
Page 24
Figure 2: By Race/Ethnicity
Source: 2007-2010 CDC Pregnancy Risk Assessment Monitoring System (PRAMS) Notes: National estimates not available.
Figure 3: By Income
Source: 2007-2010 CDC Pregnancy Risk Assessment Monitoring System (PRAMS) Notes: National estimates not available.

2015-2020 Title V Needs Assessment MCH Topic Briefs
V6
Page 25
Interest and Capacity to Address Issue As part of the 2015-2020 Title V Needs Assessment, maternal and child health stakeholders recently completed a survey to identify priority areas for addressing the health needs of Delaware’s women, mothers, and children. The survey questions provided stakeholders with different ways of expressing what they considered priority areas. With regard to safe sleep, the survey results reveal the following information.
• Stakeholders were asked to rate their “top 7” across 15 national priority areas. Safe Sleep was ranked #12 among the 15 areas, receiving 91 votes.
• Stakeholders were also asked to identify which among three areas was most important within the perinatal/infant’s health domain. Safe Sleep was rated #3 among the three (35% chose breastfeeding, 32% chose perinatal regionalization, 26% chose safe sleep).
• Stakeholders were asked to assess the capacity of the Delaware Maternal and Child Health System to address improving safe sleep for children. About three-fourths (74%) thought there was a strong desire to address this issue and that evidence-based programs existed in this area. Fifty-eight percent agreed there were adequate resources and 63% agreed that progress was being made in this area.
Related State and National Goals
Figure 4: Stakeholder Survey
Source: 2015 Delaware Title V MCH Stakeholder Survey Notes: Not all survey participants answered every question. 260 participants answered this question.
Healthy People 2020 MICH-20 Increase the proportion of infants who are put to sleep on their backsiii
Baseline: 69.0 percent of infants were put to sleep on their backs in 2007 Target: 75.9 percent
There are no state goals or strategies related to this health area listed in the First Delaware State Health Improvement Plan or the Delaware Division of Public Health 2014-2017 Strategic Plan.

2015-2020 Title V Needs Assessment MCH Topic Briefs
V6
Page 26
i Centers for Disease Control and Prevention. (2015). About SUIDS and SIDS. Retrieved from: http://www.cdc.gov/sids/aboutsuidandsids.htm ii Center for Disease Control and Prevention. (n.d.) Pregnancy Risk Assessment Monitoring System (PRAMS): CPONDER. Retrieved from http://apps.nccd.cdc.gov/cPONDER/ iii Healthy People 2020 (2015) – Maternal, Infant and Child Health – Objectives. Retrieved from: http://www.healthypeople.gov/2020/topics-objectives/topic/maternal-infant-and-child-health/objectives
2015-2020 Title V Needs Assessment MCH Topic Briefs
V5
Page 27
Population Domain: Child Health
DEVELOPMENTAL SCREENING NATIONAL PERFORMANCE MEASURE 6
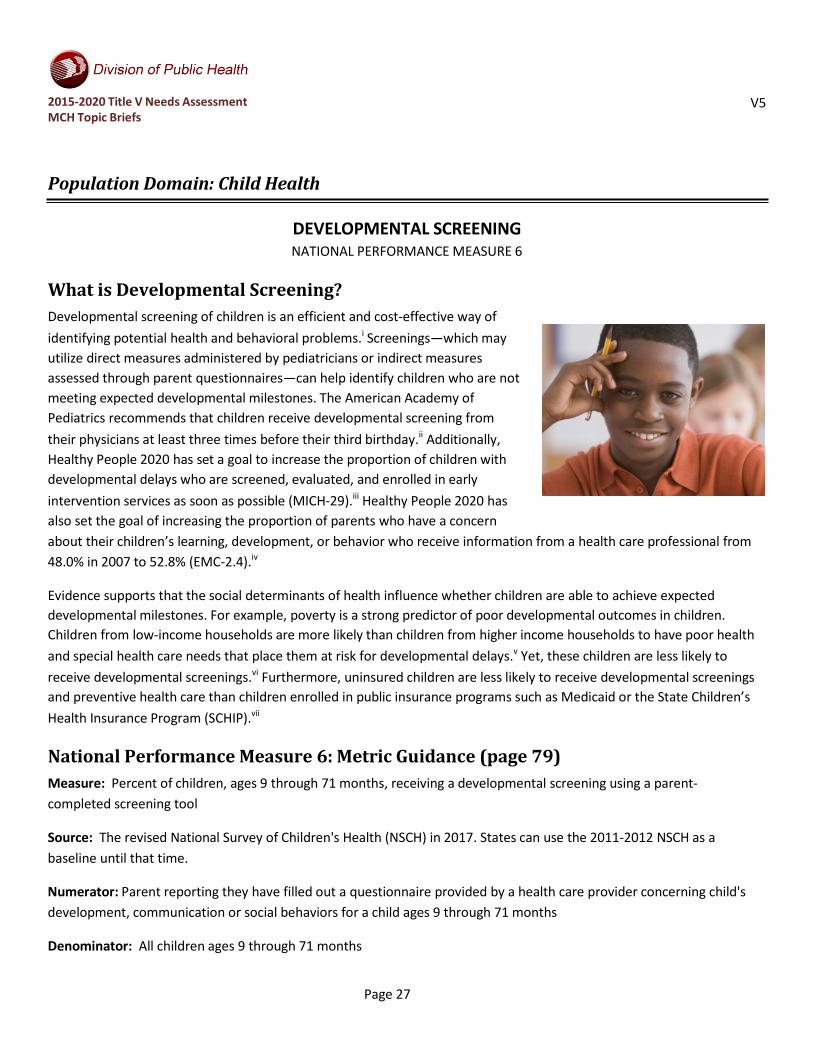
What is Developmental Screening? Developmental screening of children is an efficient and cost-effective way of identifying potential health and behavioral problems.i Screenings—which may utilize direct measures administered by pediatricians or indirect measures assessed through parent questionnaires—can help identify children who are not meeting expected developmental milestones. The American Academy of Pediatrics recommends that children receive developmental screening from their physicians at least three times before their third birthday.ii Additionally, Healthy People 2020 has set a goal to increase the proportion of children with developmental delays who are screened, evaluated, and enrolled in early intervention services as soon as possible (MICH-29).iii Healthy People 2020 has also set the goal of increasing the proportion of parents who have a concern about their children’s learning, development, or behavior who receive information from a health care professional from 48.0% in 2007 to 52.8% (EMC-2.4).iv
Evidence supports that the social determinants of health influence whether children are able to achieve expected developmental milestones. For example, poverty is a strong predictor of poor developmental outcomes in children. Children from low-income households are more likely than children from higher income households to have poor health and special health care needs that place them at risk for developmental delays.v Yet, these children are less likely to receive developmental screenings.vi Furthermore, uninsured children are less likely to receive developmental screenings and preventive health care than children enrolled in public insurance programs such as Medicaid or the State Children’s Health Insurance Program (SCHIP).vii
National Performance Measure 6: Metric Guidance (page 79) Measure: Percent of children, ages 9 through 71 months, receiving a developmental screening using a parent- completed screening tool
Source: The revised National Survey of Children's Health (NSCH) in 2017. States can use the 2011-2012 NSCH as a baseline until that time.
Numerator: Parent reporting they have filled out a questionnaire provided by a health care provider concerning child's development, communication or social behaviors for a child ages 9 through 71 months
Denominator: All children ages 9 through 71 months

2015-2020 Title V Needs Assessment MCH Topic Briefs
V5
Page 28
Significance: Early identification of developmental disorders is critical to the well-being of children and their families. It is an integral function of the primary care medical home. The percent of children with a developmental disorder has been increasing, yet overall screening rates have remained low. The American Academy of Pediatrics recommends screening tests begin at the nine month visit.
Developmental Screening in Delaware According to the National Survey of Children’s Health, the percent of children screened for being at risk for developmental, behavioral and social delays using a parent-reported standardized screening tool during a health care visit in Delaware increased from 10.9% in survey year 2007 to 30.8% in survey year 2011/12viii,ix. In survey year 2007, the rate in Delaware (10.9%) was lower than national estimates (19.5%). In survey year 2011/12, they were equivalent (30.8%). See Figure 1.
In Delaware, between survey year 2007 and 2011/12, the percent of children screened increased in the racial/ethnic categories of White, non-Hispanic (11.7% to 30.2%), Black, non-Hispanic (9.8% to 27.8%), and Hispanic (16.6% to 38.3%). Data were not available for other, non-Hispanic in survey year 2007 in Delaware due to small sample size. In survey year 2011/12, the percent screened in Delaware was lower than national estimates within Black, non-Hispanic (27.8% & 31.7%) and within other, non-Hispanic (28.7% & 31.2%). The percent screened in Delaware was higher than national estimates within White, non-Hispanic (30.2% & 29.9%) and Hispanic (38.2% & 32.4%). In survey year 2011/12 in Delaware, the percent screened was highest within the racial/ethnic category of Hispanic (38.2%), followed by White, non-Hispanic (30.2%), other, non-Hispanic (28.7%), and Black, non-Hispanic (27.8%). See Figure 2.
In Delaware, between survey year 2007 and 2011/12, the percent of children screened increased within all household income levels— from 9.2% to 20.5% in 0-99% FPL, from 20.5% to 30.5% in 100-199% FPL, from 5.2% to 39.7% in 200-399% FPL, and from 12.2% to 31.1% in 400% FPL or higher. In Delaware in survey year 2011/12, the household income level of 200-399% FPL (39.7%) had the highest percent screened, followed by 400% FPL or higher (31.1%), 100- 199% FPL (30.5%), and 0-99% FPL (20.5%). See Figure 3.
Figure 1: Developmental Screening Tool
Source: 2007 & 2011/12 National Survey of Children’s Health Notes: 2003 Data not available. Parent report of children, ages 10 months – 5 years who have had a health care visit in the past 12 months. Parent respondents for all children between 10 months and 5 years of age were asked whether they completed a questionnaire about their child’s development, communication or social behaviors during the previous 12 months (K6Q12). If the response to K6Q12 was “Yes”, parents were asked if the questionnaire covered language or social development (K6Q13 and K6Q13A, respectively, for ages 10-23 months, and K6Q14A and K6Q14B for ages 2-5years).

2015-2020 Title V Needs Assessment MCH Topic Briefs
V5
Page 29
Figure 2: Race/Ethnicity Figure 3: Household Income Level
Source: 2007 & 2011/12 National Survey of Children’s Health Notes: *Data not available due to small sample size. 2003 data not available. Parent report of children, ages 10 months – 5 years who have had a health care visit in the past 12 months. Parent respondents for all children between 10 months and 5 years of age were asked whether they completed a questionnaire about their child’s development, communication or social behaviors during the previous 12 months (K6Q12). If the response to K6Q12 was “Yes”, parents were asked if the questionnaire covered language or social development (K6Q13 and K6Q13A, respectively, for ages 10-23 months, and K6Q14A and K6Q14B for ages 2-5years).
Source: 2007 & 2011/12 National Survey of Children’s Health Notes: 2003 Data not available. Parent report of children, ages 10 months – 5 years who have had a health care visit in the past 12 months. Parent respondents for all children between 10 months and 5 years of age were asked whether they completed a questionnaire about their child’s development, communication or social behaviors during the previous 12 months (K6Q12). If the response to K6Q12 was “Yes”, parents were asked if the questionnaire covered language or social development (K6Q13 and K6Q13A, respectively, for ages 10- 23 months, and K6Q14A and K6Q14B for ages 2-5years).

2015-2020 Title V Needs Assessment MCH Topic Briefs
V5
Page 30
Interest and Capacity to Address Issue As part of the 2015-2020 Title V Needs Assessment, maternal and child health stakeholders recently completed a survey to identify priority areas for addressing the health needs of Delaware’s women, mothers, and children. The survey questions provided stakeholders with different ways of expressing what they considered priority areas. With regard to developmental screening, the survey results reveal the following information:
• Stakeholders were asked to rate their “top 7” across 15 national priority areas. Developmental screening was ranked #1 among the 15 areas, receiving 183 votes.
• Stakeholders were also asked to identify which among three
areas was most important within the children’s health domain. Developmental screening was rated #1 among the three (54% chose developmental screening, 30% chose physical activity,
15% chose injury prevention).
• Stakeholders were asked to assess the capacity of the Delaware Maternal and Child Health System to improve developmental screening for children. About three-fourths thought there was a strong desire to address this issue and that evidence-based programs existed in this area. Slightly less than half of stakeholders (48%) thought there were adequate resources available. However, nearly 60% of stakeholders thought progress is being made in this area.
Related State and National Goals
Figure 4: Stakeholder Survey
Source: 2015 Delaware Title V MCH Stakeholder Survey Notes: Not all survey participants answered every question. 250 participants answered this question.
Healthy People 2020 MICH-29 Increase the proportion of young children with autism spectrum disorder (ASD) and other developmental delays who are screened, evaluated, and enrolled in special services in a timely mannerx
MICH-29.1 Increase the proportion of children (aged 10-35 months) who have been screened for an Autism Spectrum Disorder (ASD) and other developmental delays
22.6 percent of children aged 10 to 35 months were screened for an Autism Spectrum Baseline: Disorder (ASD) and other developmental delays in the past year as reported in 2007

2015-2020 Title V Needs Assessment MCH Topic Briefs
V5
Page 31
Target: 24.9 percent
There are no state goals or strategies related to this health area listed in the First Delaware State Health Improvement Plan or the Delaware Division of Public Health 2014-2017 Strategic Plan.
i Child Trends Data Bank. (2013). Screening and Risk for Developmental Delay: Indicators on Children and Youth. Retrieved from: http://www.childtrends.org/?indicators=screening-and-risk-for-developmental-delay ii American Academy of Pediatrics, Council on Children With Disabilities, Section on Developmental Behavioral Pediatrics, Bright Futures Steering Committee and Medical Home Initiatives for Children With Special Needs Project Advisory Committee. (2006). Identifying infants and young children with developmental disorders in the medical home: An algorithm for developmental surveillance and screening. Pediatrics, 118(1), 405-420. iii U.S. Department of Health and Human Services, Office of Disease Prevention and Health Promotion. (2014). Healthy People 2020. Washington, DC. Retrieved from: https://www.healthypeople.gov/ ivHealthyPeople.gov. (2014). HealthyPeople 2010 [website]. Retrieved from http://www.healthypeople.gov/2020/topicsobjectives2020/default v The Child & Adolescent Health Measurement Initiative. (2012). 2009/10 National Survey of Children’s Health. Retrieved from http://www.childhealthdata.org/learn/NSCH vi B. Strickland, P. vanDyck, M. Kogan, et al., “Assessing and Ensuring a Comprehensive System of Services for Children with Special Health Care Needs: A Public Health Approach.” American Journal of Public Health 101 (2011): 224–231. vii Kaiser Commission on Medicaid and the Uninsured. (2009). The Impact of Medicaid and SCHIP on Low-Income Children’s Health. Retrieved from www.kff.org/medicaid/7645.cfm. viiiThe Child & Adolescent Health Measurement Initiative. (2012). 2011/12 National Survey of Children’s Health. Retrieved from http://www.childhealthdata.org/learn/NSCH ix The Child & Adolescent Health Measurement Initiative. (2012). 2009/10 National Survey of Children’s Health. Retrieved from http://www.childhealthdata.org/learn/NSCH x Healthy People 2020. (2015). Maternal, Infant, and Child Health – Objectives. Retrieved from http://www.healthypeople.gov/2020/topics-objectives/topic/maternal-infant-and-child-health/objectives

2015-2020 Title V Needs Assessment MCH Topic Briefs
V5
Page 32
Population Domain: Child and Adolescent Health
INJURY NATIONAL PERFORMANCE MEASURE 7
Injury in Children and Adolescents
Unintentional injuries are the leading cause of death among children and adolescents ages 1 to 19 years, representing nearly 40% of all deaths in this age group. i Unintentional injuries are also a leading cause of medical spending for adolescents aged 11-18 years old. ii Common causes of fatal and non-fatal unintentional injuries include drowning, falls, fires or burns, poisoning, suffocation and transportation- related injuries. However, most injuries are preventable, and prevention has proven to be cost-effective. Every year, nearly 8.7 million children ages 0-19 years are treated for unintentional injuries in emergency departments and more than 225,000 require hospitalization at a cost of around $87 billion in medical and societal costs.iii
Children and adolescents vary in their risk for different injuries. For instance, infants are injured most often by suffocation, toddlers most at risk for drowning, and as children age they become more vulnerable to traffic-related injuries.iv Many risky behaviors, such as not using seat belts, driving after drinking alcohol, carrying weapons, not wearing protective gear during sports and engaging in physical fights can lead to unintentional injuries during adolescence.v Furthermore, social and economic factors influence risk of unintentional injuries. For example, poverty, crowding, young maternal age, single parent households, and low maternal educational status all confer risk and make children more vulnerable to injury.vi
National Performance Measure 7: Metric Guidance (page 80) Measure: Rate of injury-related hospital admissions per population ages 0 through 19 years Source: State Hospital Discharge data in the State Inpatient Databases (SID) Numerator: Number of hospital admissions among children ages 0 through 19 years with a diagnosis of unintentional or intentional injury. (first admission for an injury event, excludes readmissions for same event) Denominator: Number of children and adolescents 0 through 19 years Significance: Injury is the leading cause of child mortality. For those who suffer non-fatal severe injuries, many will become children with special health care needs. Effective interventions to reduce injury exist but are not fully implemented in systems of care that serve children and their families. Reducing the burden of nonfatal injury can greatly improve the life course trajectory of infants, children, and adolescents resulting in improved quality of life and cost savings.

2015-2020 Title V Needs Assessment MCH Topic Briefs
V5
Page 33
Mortality/Morbidity due to Injury in Delaware
According to the Delaware Trauma System Registry, the rate of non-fatal injury hospitalizations per 100,000 children ages 19 and under increased from 2011 (592.8) to 2013 (623.2)vii. See Figure 1.
In 2011, 2012, and 2013, the rate of injury hospitalizations for children ages 19 and under was higher among males than it was among females. In 2011, the rate for males was 738.2 compared to 441.7 for females. In 2012, the rate for males was 780.3 compared to 459.1 for females. In 2013, the rate was 761.0 for males compared to 477.4 for females. Between 2011 and 2013, the rate of hospitalizations due to injury increased from 738.3 to 761.0 for males and from 441.7 to 477.4 for females. See Figure 2.
In 2013, the rate was highest in the race/ethnicity category of White (648.6), followed by Black (545.1), Hispanic (516.3), other (266.6), American Indian (246.5), and Asian (118.8). Between 2011 and 2013, the rate declined for the race/ethnicity categories of White (656.6 to 648.6), Asian (250.8 to 118.8), and other (308.3 to 266.6). The rate increased for the race/ethnicity categories of Black (455.6 to 545.1), Hispanic (392.3 to 516.3), and American Indian (164.3 to 246.5). See Figure 3.
Figure 1: Non-Fatal Injury
Source: Delaware Trauma System Registry Notes: Numerator is number of hospitalizations. Denominator is total number of people ages 19 and under. Trauma System Registry data is submitted from all acute care hospitals in Delaware and includes patients admitted to the hospital, transferred to an acute care hospital, and Emergency Department deaths. Our definition of a trauma patient is a person sustaining a traumatic injury with ICD9 Code in the 800-959.9 range, excluding poisoning.

2015-2020 Title V Needs Assessment MCH Topic Briefs
V5
Page 34
Figure 2: Gender Figure 3: Race/Ethnicity
Source: Delaware Trauma System Registry Notes: Numerator is number of hospitalizations. Denominator is total number of people ages 19 and under. Trauma System Registry data is submitted from all acute care hospitals in Delaware and includes patients admitted to the hospital, transferred to an acute care hospital, and Emergency Department deaths. Our definition of a trauma patient is a person sustaining a traumatic injury with ICD9 Code in the 800-959.9 range, excluding poisoning.
Source: Delaware Trauma System Registry Notes: Numerator is number of hospitalizations. Denominator is total number of people ages 19 and under. Trauma System Registry data is submitted from all acute care hospitals in Delaware and includes patients admitted to the hospital, transferred to an acute care hospital, and Emergency Department deaths. Our definition of a trauma patient is a person sustaining a traumatic injury with ICD9 Code in the 800-959.9 range, excluding poisoning.
2015-2020 Title V Needs Assessment MCH Topic Briefs
V5
Page 35
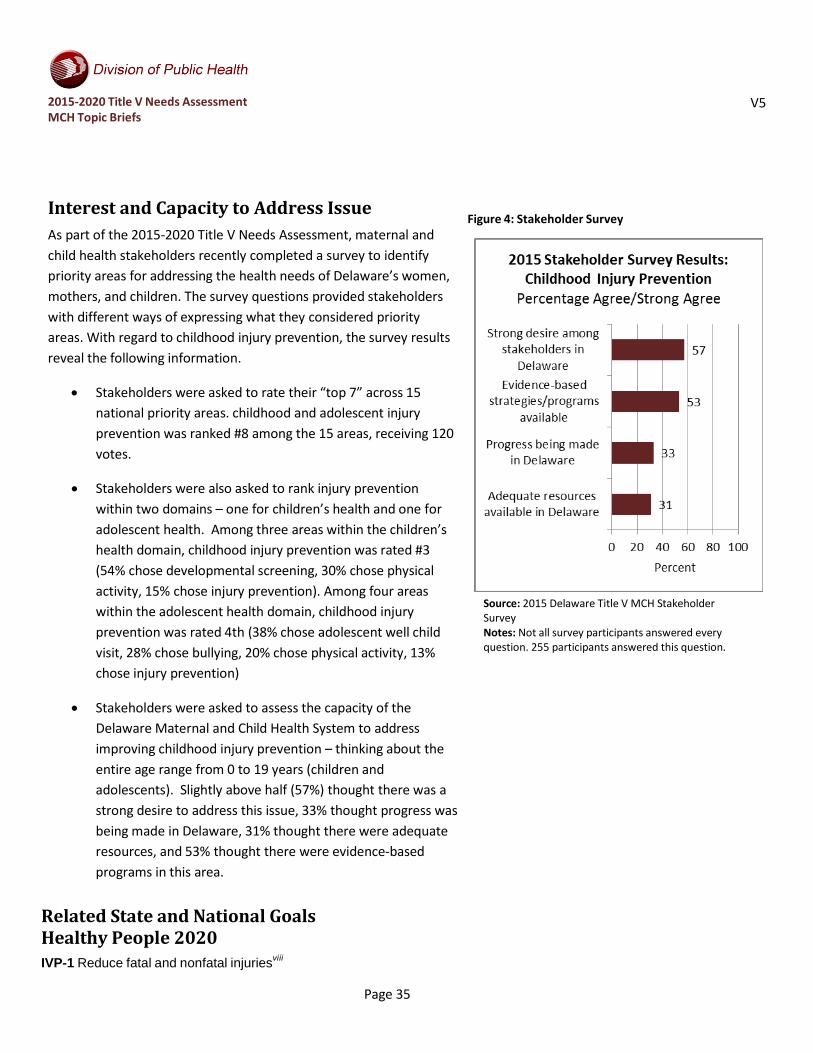
Interest and Capacity to Address Issue As part of the 2015-2020 Title V Needs Assessment, maternal and child health stakeholders recently completed a survey to identify priority areas for addressing the health needs of Delaware’s women, mothers, and children. The survey questions provided stakeholders with different ways of expressing what they considered priority areas. With regard to childhood injury prevention, the survey results reveal the following information.
• Stakeholders were asked to rate their “top 7” across 15 national priority areas. childhood and adolescent injury prevention was ranked #8 among the 15 areas, receiving 120 votes.
• Stakeholders were also asked to rank injury prevention within two domains – one for children’s health and one for adolescent health. Among three areas within the children’s health domain, childhood injury prevention was rated #3 (54% chose developmental screening, 30% chose physical activity, 15% chose injury prevention). Among four areas within the adolescent health domain, childhood injury prevention was rated 4th (38% chose adolescent well child visit, 28% chose bullying, 20% chose physical activity, 13% chose injury prevention)
• Stakeholders were asked to assess the capacity of the Delaware Maternal and Child Health System to address improving childhood injury prevention – thinking about the entire age range from 0 to 19 years (children and adolescents). Slightly above half (57%) thought there was a strong desire to address this issue, 33% thought progress was being made in Delaware, 31% thought there were adequate resources, and 53% thought there were evidence-based programs in this area.
Related State and National Goals Healthy People 2020 IVP-1 Reduce fatal and nonfatal injuriesviii
Figure 4: Stakeholder Survey
Source: 2015 Delaware Title V MCH Stakeholder Survey Notes: Not all survey participants answered every question. 255 participants answered this question.

2015-2020 Title V Needs Assessment MCH Topic Briefs
V5
Page 36
IVP-1.1 (Leading Health Indicator) Reduce fatal injuries
Baseline:
59.7 deaths per 100,000 population were caused by injuries in 2007 (age adjusted to the year 2000 standard population)
Target: 53.7 deaths per 100,000 population IVP-12 Reduce nonfatal unintentional injuriesix
Baseline: 9,233.5 emergency department (ED) visits for nonfatal unintentional injuries per 100,000 population occurred in 2008 (age adjusted to the year 2000 standard population)
Target: 8,310.1 injuries per 100,000 population
There are no state goals or strategies related to this health area listed in the First Delaware State Health Improvement Plan or the Delaware Division of Public Health 2014-2017 Strategic Plan.
i U.S. Department of Health and Human Services, Centers for Disease Control and Prevention, National Center for Injury Prevention and Control. (2012). National Action Plan for Child Injury Prevention, An Agenda to Prevent Injuries and Promote Safety of Children and Adolescents in the United States. Retrieved from: http://www.cdc.gov/safechild/nap/index.html Accessed 12/23/14. ii Children’s Safety Network/National Institute for Health Care Management. (2010). Preventing Adolescent Injury: The Role of Health Plans. Retrieved from: http://www.nihcm.org/pdf/InjuryIssueBrief.pdf. iii U.S. Department of Health and Human Services, Centers for Disease Control and Prevention, National Center for Injury Prevention and Control. (2012). National Action Plan for Child Injury Prevention, An Agenda to Prevent Injuries and Promote Safety of Children and Adolescents in the United States. Retrieved from: http://www.cdc.gov/safechild/nap/index.html Accessed 12/23/14. iv U.S. Department of Health and Human Services, Centers for Disease Control and Prevention, National Center for Injury Prevention and Control. (2012). National Action Plan for Child Injury Prevention, An Agenda to Prevent Injuries and Promote Safety of Children and Adolescents in the United States. Retrieved from: http://www.cdc.gov/safechild/nap/index.html Accessed 12/23/14. v Children’s Safety Network/National Institute for Health Care Management. (2010). Preventing Adolescent Injury: The Role of Health Plans. Retrieved from: http://www.nihcm.org/pdf/InjuryIssueBrief.pdf. vi U.S. Department of Health and Human Services, Centers for Disease Control and Prevention, National Center for Injury Prevention and Control. (2012). National Action Plan for Child Injury Prevention, An Agenda to Prevent Injuries and Promote Safety of Children and Adolescents in the United States. Retrieved from: http://www.cdc.gov/safechild/nap/index.html Accessed 12/23/14. vii Delaware Trauma System Registry. viii Healthy People 2020. (2015). Injury and Violence Prevention – Objectives. Retrieved from http://www.healthypeople.gov/2020/topics-objectives/topic/injury-and-violence-prevention/objectives ix Healthy People 2020. (2015). Injury and Violence Prevention – Objectives. Retrieved from http://www.healthypeople.gov/2020/topics-objectives/topic/injury-and-violence-prevention/objectives

2015-2020 Title V Needs Assessment MCH Topic Briefs
V6
Page 37
Population Domain: Child and Adolescent Health
PHYSICAL ACTIVITY NATIONAL PERFORMANCE MEASURE 8
Physical activity among children and adolescents Regular physical activity in children and adolescents promotes health and fitness. Compared to those who are inactive, physically active youth have higher levels of cardiorespiratory fitness and stronger muscles.i They also typically have lower body fatness.ii Their bones are stronger, and they may have reduced symptoms of anxiety and depression. Youth who are regularly active also have an increased likelihood of a healthy adulthood.iii For example, regular physical activity can prevent the development of risk factors for chronic diseases, such as heart disease, hypertension, type 2 diabetes, or osteoporosis, which could otherwise manifest in adulthood.iv
National Performance Measure 8: Metric Guidance (page 81) Measure: Percent of children ages 6 through 11 years and adolescents ages 12 through 17 years who are physically active at least 60 minutes per day Source: The revised National Survey of Children's Health (NSCH), beginning in 2017 and the Youth Risk Behavior Surveillance System. Numerator: Parent report of children (in NSCH), ages 6 through 11 years, and adolescents (in NSCH), ages 12 through 17 years, who are physically active at least 60 minutes per day. (YRBSS is also available and provides self-report by adolescents) Denominator: All children ages 6 through 11 years and adolescents ages 12 through 17 years Significance: Regular physical activity can improve the health and quality of life of Americans of all ages, regardless of the presence of a chronic disease or disability. Physical activity in children and adolescents reduces the risk of early life risk factors for cardiovascular disease, hypertension, Type II diabetes, and osteoporosis. In addition to aerobic and muscle-strengthening activities, bone-strengthening activities are especially important for children and young adolescents because the majority of peak bone mass is obtained by the end of adolescence.

2015-2020 Title V Needs Assessment MCH Topic Briefs
V6
Page 38
Physical activity among children and adolescents in Delaware
Figure 1: Physical Activity by Age Range
Source: 2008 & 2011 Delaware Survey of Children’s Health Notes: Weighted percentages. Definitions: Physical activity recommendation: 60 minutes or more of moderate-to-vigorous physical activity 7 days a week. The specified source in the guidance is the National Survey of Children’s Health (NSCH). The Delaware of Survey of Children’s Health was used for this infosheet because the NSCH does not currently provide estimates for “at least 60 minutes per day.”
According to the 2008 & 2011 Delaware Survey of Children’s Health, the percent of children who met the recommendation of engaging in moderate-to-vigorous physical activity for 60 minutes or more every day was higher among 6-11 year old children (41.0%, 42.4%) than 12-17 year old children (26.9%, 33.3%).v Between 2008 and 2011, the percent for children ages 6-11 years old increased from 41.0% to 42.4% as the percent for 12-17 years old increased from 26.9% to 33.3%. See Figure 1.
In Delaware, between survey years 2008 and 2011, the percentage of children ages 6-11 who met the recommendation of engaging in moderate-to-vigorous physical activity for 60 minutes or more every day declined among the race/ethnicity categories of Black from 42.2% to 41.1% and other from 45.6% to 45.0%. The percent increased within the race/ethnicity categories of White from 41.1% to 41.8% and Hispanic from 33.1% to 46.9%. Among children ages 6-11, in survey year 2011, the race/ethnicity category of Hispanic had the highest percent (46.9%), followed by other with 45.0%, White with 41.8%, and Black with 41.1%. See Figure 2.
In Delaware, between survey years 2008 and 2011, the percentage of children ages 12-17 who met the recommendation of engaging in moderate-to-vigorous physical activity for 60 minutes or more every day declined in the race/ethnicity categories of Black from 25.2% to 23.1% and Hispanic from 35.0% to 22.7%. The percent increased within the race/ethnicity categories of White from 26.3% to 38.4% and other from 29.2% to 44.2%. In survey year 2011, the race/ethnicity category of other had the highest percent (44.2%), followed by White with 38.4%, Black with 23.1%, and Hispanic with 22.7%. See Figure 2.
Supplemental 2013 Youth Risk Behavior Survey data shows that 23.7% of Delaware high school students and 27.3% of middle school students report being physically active for at least 60 minutes per day on all 7 daysvi. “Physically active” was defined as doing any kind of physical activity that increased their heart rate and made them breathe hard some of the time. National estimates were not available. This infosheet focuses on the Delaware Survey of Children’s Health dataset because the Youth Risk Behavior Survey age stratifications do not properly align to guidance specifications.

2015-2020 Title V Needs Assessment MCH Topic Briefs
V6
Page 39
Figure 2: Race/Ethnicity
Source: 2008 & 2011 Delaware Survey of Children’s Health Notes: Weighted percentages. Definitions: Physical activity recommendation: 60 minutes or more of moderate-to-vigorous physical activity 7 days a week. Hispanic includes any child of Hispanic or Latino origin, as reported by parent/guardian, independent of his/her race; Other includes American Indian, Alaskan Native, Asian, Native Hawaiian, Pacific Islander, and other races; White and Black are non-Hispanic; Percentages for the categories 'Hispanic' and 'Others' should be interpreted with caution due to small sample numbers. The specified source in the guidance is the National Survey of Children’s Health (NSCH). The Delaware of Survey of Children’s Health was used for this infosheet because the NSCH does not currently provide estimates for “at least 60 minutes per day.”

2015-2020 Title V Needs Assessment MCH Topic Briefs
V6
Page 40
Interest and Capacity to Address Issue As part of the 2015-2020 Title V Needs Assessment, maternal and child health stakeholders recently completed a survey to identify priority areas for addressing the health needs of Delaware’s women, mothers, and children. The survey questions provided stakeholders with different ways expressing what they considered priority areas. With regard to physical activity, the survey results reveal the following information.
• Stakeholders were asked to rate their “top 7” across 15 national priority areas. Physical activity was ranked #2 among the 15 areas, receiving 159 votes.
• Stakeholders were also asked to rank physical activity
for both children and adolescents. Among three areas within the children’s health domain, physical activity was rated #2 (54% chose developmental screening, 30% chose physical activity, and 15% chose injury prevention). Among four areas within the adolescent health domain, physical activity was rated #3 (38% chose adolescent well child visit, 28% chose bullying, 20% chose physical activity, and 13% chose injury prevention).
• Stakeholders were asked to assess the capacity of the Delaware Maternal and Child Health System to address physical activity for children and adolescents. More than three-fourths (77%) thought there was a strong desire to address this issue. Seventy-three percent thought that evidence-based programs existed in this area. However, only 42% thought there were adequate resources in Delaware and just under half (48%) thought Delaware was making progress in this area.
Figure 4: Stakeholder Survey Results
Source: 2015 Delaware Title V MCH Stakeholder Survey Notes: Not all survey participants answered every question. 255 participants answered this question.

2015-2020 Title V Needs Assessment MCH Topic Briefs
V6
Page 41
Related State and National Goals
Healthy People 2020 PA-3.1 Increase the proportion of adolescents who meet current Federal physical activity guidelines for aerobic physical activityvii
Baseline: 28.7 percent of adolescents met current physical activity guidelines for aerobic physical activity in 2011 Target: 31.6 percent
The First Delaware State Health Improvement Plan (SHIP) To assure an infrastructure necessary to increase the adoption of health eating and active living.viii
Delaware Division of Public Health Strategic Priority: Promote Healthy Lifestylesix
DPH Top Level Map objective number 5 Description: The vision of this strategic priority is that all Delawareans live, work, learn, and play in healthier communities, live healthier lives, and maintain healthier behaviors. The outcome objectives are to decrease morbidity and premature mortality, and increase health-promoting behaviors and environments.
i Office of Disease Prevention and Health Promotion, Office of the Assistant Secretary for Health, Office of the Secretary, U.S. Department of Health and Human Services. (2008. )Physical Activity Guidelines. Retrieved from: http://www.health.gov/paguidelines/guidelines/chapter3.aspx ii Office of Disease Prevention and Health Promotion, Office of the Assistant Secretary for Health, Office of the Secretary, U.S. Department of Health and Human Services. (2008. )Physical Activity Guidelines. Retrieved from: http://www.health.gov/paguidelines/guidelines/chapter3.aspx iii Office of Disease Prevention and Health Promotion, Office of the Assistant Secretary for Health, Office of the Secretary, U.S. Department of Health and Human Services. (2008. )Physical Activity Guidelines. Retrieved from: http://www.health.gov/paguidelines/guidelines/chapter3.aspx iv Office of Disease Prevention and Health Promotion, Office of the Assistant Secretary for Health, Office of the Secretary, U.S. Department of Health and Human Services. (2008. )Physical Activity Guidelines. Retrieved from: http://www.health.gov/PAGuidelines/ v Nemours Children’s Health System. (2015) NHPS Datacenter: Delaware. Retrieved from http://datacenter.nemours.org/profile/report/43,44,46,48#2/3/a/show vi Centers for Disease Control and Prevention (CDC). 1991-2013 High School Youth Risk Behavior Survey Data. Retrieved from: http://nccd.cdc.gov/youthonline/ vii Healthy People 2020. (2015). Physical Activity – Objectives. Retrieved from http://www.healthypeople.gov/2020/topics-objectives/topic/physical-activity/objectives viii Delaware Department of Health and Social Services, Division of Public Health. The First Delaware State Health Improvement Plan – Assessing and Improving Community Health in Delaware. (2014) Goals and Strategies for the Delaware SHIP – Workgroup: Healthy Lifestyles Goal. Retrieved from: http://www.dhss.delaware.gov/dph/files/shaship.pdf ix Delaware Department of Health and Social Services, Division of Public Health. 2014-2017 Strategic Plan (2014). DPH Strategic Priorities. Retrieved from: http://www.dhss.delaware.gov/dph/files/dphstrategicplan.pdf

2015-2020 Title V Needs Assessment MCH Topic Briefs
V5
Page 42
Population Domain: Child and Adolescent Health
BULLYING NATIONAL PERFORMANCE MEASURE 9
Bullying As A Public Health Issue Bullying is recognized as a significant public and mental health issue. Most definitions of bullying specify aggressive, unwanted, repeated behavior that is difficult to stop, inflicts physical and/or emotional harm, and involves an imbalance of poweri. Approximately 30% of students in the United States have experienced being bullied, and many children (70-85%) experience bullying either as victims, perpetrators, bystanders, or a combination of roles.ii
Mental health problems, especially anxiety and depression, are associated with both bullying and being bullied. For example, children at risk for being bullied typically have lower self- esteem than peers, experience interpersonal problems, have difficulty defending themselves, and are more likely to be overweight or live in low-income households. Additionally, individuals with a mental or physical disability are at risk of being bullied and tend to experience more serious forms of bullyingiii.
Furthermore, according to the Youth Risk Behavior Surveillance System (YRBSS), in 2011, 20% of students in grades nine through 12 in the United States reported that they were bullied on school property and 16.2% reported they had been electronically (“cyber”) bullied in the previous 12 months.iv National efforts to prevent bullying have been proposed and the Healthy People 2020 Objective IVP-35 is to reduce bullying among adolescents to 17.9%.v
This is significant because children who report being bullied or being a bully are also likely to report the above emotional issues, and these issues can persist into adulthood and progress into behavioral and criminal problems.
National Performance Measure 9: Metric Guidance (page 82) Measure: Percent of adolescents, ages 12 through 17 years, who are bullied Source: Youth Risk Behavior Surveillance System (YRBSS), and the National Survey of Children's Health (NSCH). States can use data from the 2013 YRBSS and from the 2011-2012 NSCH as a baseline. (The state will be able to use both data sources as the YRBSS is reported by the adolescents and the NSCH is reported by the parents. The YRBSS is available every other year, and the NSCH will be available annually). Numerator: Parent report on adolescents (in NSCH), and adolescent report (in YRBSS), for adolescents ages 12 through 17 years, who were bullied Denominator: Number of adolescents, ages 12 through 17 years Significance: Bullying, particularly among school-age children, is a major public health problem. Current estimates suggest nearly 30% of American adolescents reported at least moderate bullying experiences as the bully, the victim, or both. Specifically, of a nationally representative sample of adolescents, 13% reported being a bully, 11% reported being a victim of bullying, and 6% reported being both a bully and a victim. Studies indicate bullying experiences are associated

2015-2020 Title V Needs Assessment MCH Topic Briefs
V5
Page 43
with a number of behavioral, emotional, and physical adjustment problems. Adolescents who bully others tend to exhibit other defiant and delinquent behaviors, have poor school performance, are more likely to drop-out of school, and are more likely to bring weapons to school. Victims of bullying tend to report feelings of depression, anxiety, low self-esteem, and isolation; poor school performance; suicidal ideation; and suicide attempts. Evidence further suggests that people who are the victims of bullying and who also perpetrate bullying (i.e., bully-victims) may exhibit the poorest functioning, in comparison with either victims or bullies. Emotional and behavioral problems experienced by victims, bullies, and bully-victims may continue into adulthood and produce long-term negative outcomes, including low self- esteem and self-worth, depression, antisocial behavior, vandalism, drug use and abuse, criminal behavior, gang membership, and suicidal ideation.
Bullying in Delaware According to the 2009, 2011, and 2013 Center for Disease Control’s (CDC) Youth Risk Behavior Survey, the percent of high school students in Delaware reporting being bullied on school property in the last 12 months increased from 15.9% in 2009 to 16.5% in 2011 to 18.5% in 2013vi. In 2014, the percent of middle school students (43.1%) reporting being bullied was greater than the percent of high school students (18.5%) reporting being bulliedvii. See Figure 1.
Among White and Black high school students, the percent bullied increased from 2009 to 2013—the percent for Black students increased from 10.5% to 15.3% and for White from 18.2% to 21.5%. The percent of Hispanic students bullied decreased from 16.3% to 14.3% and the percent of multiple races bullied decreased from 20.2% to 17.0%. In 2013, the racial/ethnic category of White (21.5%) had the highest percentage bullied, followed by Asian (19.2%), multiple races (17.0%), Black (15.3%), and Hispanic (14.3%). See Figure 2.
According to the 2013 Youth Risk Behavior Survey for middle school students, in Delaware, the racial/ethnic category of White had the highest percentage bullied on school property in the last 12 months, followed by multiple races (47.2%), Black (38.2%), and Hispanic (36.9%)viii.
Figure 1: Bullied on School Property
Source: 2009, 2011, & 2013 Youth Risk Behavior Survey Notes: *Middle school data for 2009 and 2011 not available. Students self-reported bullying on school property during the 12 months before the survey.

2015-2020 Title V Needs Assessment MCH Topic Briefs
V5
Page 44
Figure 2: Race/Ethnicity
Source: 2009, 2011, & 2013 Youth Risk Behavior Survey Notes: YRBS data is self-reported by the student. The racial categories of Native Hawaiian or Other Pacific Islander (non- Hispanic) and American Indian or Alaskan Native (non-Hispanic) were listed as not available due to a sample size of less than 100 respondents for the subgroup and were not included in this graph. *Black 2011, Asian 2009, Asian 2011, and Hispanic 2011 were similarly not available. Stratification by age and by household income level were not available. The YRBS survey did not specify whether the racial/ethnic categories of White, Black, or Asian were “non-Hispanic.”

2015-2020 Title V Needs Assessment MCH Topic Briefs
V5
Page 45
Interest and Capacity to Address Issue As part of the 2015-2020 Title V Needs Assessment, maternal and child health stakeholders recently completed a survey to identify priority areas for addressing the health needs of Delaware’s women, mothers, and children. The survey questions provided stakeholders with different ways of expressing what they considered priority areas. With regard to bullying, the survey results reveal the following information.
• Stakeholders were asked to rate their “top 7” across 15 national priority areas. Bullying was ranked #10 among the 15 areas, receiving 106 votes.
• Stakeholders were also asked to identify which among four areas was most important within the adolescent health domain. Bullying was #2 among the four (38% chose adolescent well child visit, 28% chose bullying, 20% chose physical activity, 13% chose childhood injury prevention).
• Stakeholders were asked to assess the capacity of the Delaware Maternal and Child Health System to address reducing the number of adolescents who are bullied. About three-fourths thought there was a strong desire to address this issue, 63% thought evidence-based programs existed in this area, less than half thought there were progress being made in Delaware, 33% thought adequate resources available in this area.
Related State and National Goals
Healthy People 2020 IVP-35 Reduce bullying among adolescentsix
Figure 3: Stakeholder Survey
Source: 2015 Delaware Title V MCH Stakeholder Survey Notes: Not all survey participants answered every question. 254 participants answered this question.
Baseline: 19.9 percent of students in grades 9 through 12 reported that they were bullied on school property in the previous 12 months in 2009
Target: 17.9 percent

2015-2020 Title V Needs Assessment MCH Topic Briefs
V5
Page 46
There are no state goals or strategies related to this health area listed in the First Delaware State Health Improvement Plan or the Delaware Division of Public Health 2014-2017 Strategic Plan.
i Farrington, D. P. & Ttofi, M. M. (2010). School-based programs to reduce bullying and victimization: Systematic review for The Campbell Collaboration Crime and Justice Group. Retrieved from: http://www.ncjrs.gov/pdffiles1/nij/ grants/229377.pdf ii Mental Health Services Oversight and Accountability Commission (2013). Bullying: An Urgent Public Health Issue. Retrieved from: http://mhsoac.ca.gov/MHSOAC_Publications/Documents.aspx iii Mental Health Services Oversight and Accountability Commission (2013). Bullying: An Urgent Public Health Issue. Retrieved from: http://mhsoac.ca.gov/MHSOAC_Publications/Documents.aspx iv Center for Disease Control and Prevention. (n.d.). Youth Risk Behavior Surveillance System: 2011 National Overview. Retrieved from: http://www.cdc.gov/healthyyouth/yrbs/pdf/us_overview_yrbs.pdf v Office of Disease Prevention and Health Promotion. (2014). Healthy People 2020 Injury and Violence Prevention Objectives. Retrieved from: http://www.healthypeople.gov/2020/topics-objectives/topic/injury-and-violence- prevention/objectives?topicId=24#82 vi Centers for Disease Control and Prevention (CDC). (n.d.). 1991-2013 High School Youth Risk Behavior Survey Data. Retrieved from: http://nccd.cdc.gov/youthonline/. vii Centers for Disease Control and Prevention (CDC). (n.d.). 1995-2013 Middle School Youth Risk Behavior Survey Data. Retrieved from: http://nccd.cdc.gov/youthonline/. viii Centers for Disease Control and Prevention (CDC). (n.d.) 1995-2013 Middle School Youth Risk Behavior Survey Data. Retrieved from: http://nccd.cdc.gov/youthonline/. ix Healthy People 2020. (2015). Injury and Violence Prevention – Objectives. Retrieved from http://www.healthypeople.gov/2020/topics-objectives/topic/injury-and-violence-prevention/objectives

2015-2020 Title V Needs Assessment MCH Topic Briefs
V6
Page 47
Population Domain: Adolescent Health
ADOLESCENT WELL VISIT NATIONAL PERFORMANCE MEASURE 10
Adolescent Health/Preventive Care Adolescence is one of the most dynamic stages of human development. While generally characterized by good health, adolescence is also a time of dramatic physical, cognitive, social, and emotional change. During the rapid development that characterizes this stage of life, many physical and mental health conditions and health risk behaviors emerge. Regular preventive care visits for adolescents provide opportunities for early identification, management and intervention for conditions and behaviors that, if not addressed, can become serious and persist into adulthood.i Yet, well care visit rates decline as children age into adolescence.ii
National Performance Measure 10: Metric Guidance (page 83) Measure: Percent of adolescents with a preventive services visit in the last year Source: The revised National Survey of Children's Health (NSCH) beginning in 2017. States can use data from the 2011- 2012 NSCH as a baseline. Numerator: Parent report of adolescents, ages 12 through 17, with a preventive services visit in the past year from the survey Denominator: Number of adolescents, ages 12 through 17 years Significance: Adolescence is a period of major physical, psychological, and social development. As adolescents move from childhood to adulthood, they assume individual responsibility for health habits, and those who have chronic health problems take on a greater role in managing those conditions. Initiation of risky behaviors is a critical health issue during adolescence, as adolescents try on adult roles and behaviors. Risky behaviors often initiated in adolescence include unsafe sexual activity, unsafe driving, and use of substances, including tobacco, alcohol, and illegal drugs. Receiving health care services, including annual adolescent preventive well visits, helps adolescents adopt or maintain healthy habits and behaviors, avoid health-damaging behaviors, manage chronic conditions, and prevent disease. Receipt of services can help prepare adolescents to manage their health and health care as adults. The Bright Futures guidelines recommends that adolescents have an annual checkup starting at age 11. The visit should cover a comprehensive set of preventive services, such as a physical examination, discussion of health-related behaviors, and immunizations. It recommends that the annual checkup include discussion of several health-related topics, including healthy eating, physical activity, substance use, sexual behavior, violence, and motor vehicle safety.

2015-2020 Title V Needs Assessment MCH Topic Briefs
V6
Page 48
Adolescent Well Visits in Delaware Figure 1: Preventive Medical Care Visits
Source: 2003, 2007, & 2011/12 National Survey of Children’s Health Notes: Parent report of children ages 0-17. This indicator has changed over the three iterations of the survey. 2003 Indicator 4.1 was constructed from two questions: did the child have a preventive medical visit, and how many times did they see a doctor. In 2007 these questions were combined into one. In 2011/12 there were again two items. In 2011/12 the first item asked if child had any type of medical care (S4Q01) before being asked about preventive medical care (K4Q20R). Take these changes into consideration when attempting to compare across survey years.
According to the 2003, 2007, and 2011/12 National Survey of Children’s Health, the percent of children ages 12-17 who received one or more preventive medical care visits within the last year increased from 81.0% in survey year 2003 to 86.6% in survey year 2011/12 in Delaware and from 73.0% to 81.7% nationally over the same time periodiii,iv,v. However, more recently, the percent declined from 89.4% in 2007 to 86.6% 2011/12 in Delaware and from 84.2% in 2007 to 81.7% nationally. In 2013, the percent in Delaware (86.6%) was greater than the national estimate (81.7%). See Figure 1.
Between survey year 2007 and 2011/12, the percent of children ages 0-17 who received a preventive medical care visit within the last year decreased for the racial/ethnic categories of White, non- Hispanic (92.3% to 89.8%), Black, non-Hispanic (96.5% to 89.1%), and Hispanic (86.5% to 80.7%). The percent increased for the racial/ethnic category of other, non-Hispanic (88.8% to 91.6%). In survey year 2011/12, the racial/ethnic category of other, non- Hispanic had the highest percent at 91.6%, followed by White, non- Hispanic (89.8%), Black, non-Hispanic (89.1%), and Hispanic (78.8%). See Figure 2.
In Delaware, between survey years 2003 and 2011/12, the percent of children ages 0-17 who had a preventive medical care visit within the last year increased for the household income levels of 0-99% FPL from 80.6% to 80.7%, 100-199% FPL from 83.2% to 86.6%, 200- 399% FPL from 82.5% to 92.0%, and 400% FPL or higher from 87.5% to 90.9%. In Delaware, in survey year 2007, the household income levels of 200-399% FPL and 100-199% FPL had the highest percentages at 93.9%, followed by 400% FPL or higher (93.5%) and 0-99% FPL (86.7%). In survey year 2011/12, the household income level of 200-399% FPL (92.0%) had the highest percent of children ages 0-17 who had a preventive medical care visit within the last year, followed by 400% FPL of higher (90.9%), 100-199% FPL (86.6%), and 0-99% FPL (80.7%). See Figure 3.

2015-2020 Title V Needs Assessment MCH Topic Briefs
V6
Page 49
Figure 2: Race/Ethnicity Figure 3: Household Income Level
Source: 2007 & 2011/12 National Survey of Children’s Health Notes: Parent report of children ages 0-17. Survey year 2003 had different racial/ethnic categories and was not included in this graph. This indicator has changed over the three iterations of the survey. 2003 Indicator 4.1 was constructed from two questions: did the child have a preventive medical visit, and how many times did they see a doctor. In 2007 these questions were combined into one. In 2011/12 there were again two items. In 2011/12 the first item asked if child had any type of medical care (S4Q01) before being asked about preventive medical care (K4Q20R). Take these changes into consideration when attempting to compare across survey years.
Source: 2003, 2007, & 2011/12 National Survey of Children’s Health Notes: Parent report of children ages 0-17. This indicator has changed over the three iterations of the survey. 2003 Indicator 4.1 was constructed from two questions: did the child have a preventive medical visit, and how many times did they see a doctor. In 2007 these questions were combined into one. In 2011/12 there were again two items. In 2011/12 the first item asked if child had any type of medical care (S4Q01) before being asked about preventive medical care (K4Q20R). Take these changes into consideration when attempting to compare across survey years.

2015-2020 Title V Needs Assessment MCH Topic Briefs
V6
Page 50
Interest and Capacity to Address Issue As part of the 2015-2020 Title V Needs Assessment, maternal and child health stakeholders recently completed a survey to identify priority areas for addressing the health needs of Delaware’s women, mothers, and children. The survey questions provided stakeholders with different ways expressing what they considered priority areas. With regard to adolescent well visit, the survey results reveal the following information.
• Stakeholders were asked to rate their “top 7” across 15 national priority areas. Adolescent Well Visit was ranked #4 among the 15 areas, receiving 136 votes.
• Stakeholders were also asked to identify which among four areas was most important within the adolescent health domain. Adolescent well visit was rated #1 among the four (38% chose adolescent well visit, 28% chose bullying, 20% chose physical activity, 13% chose injury prevention).
• Stakeholders were asked to assess the capacity of the Delaware Maternal and Child Health System to address improving access to adolescent well visits for children. Just over half (56%) thought there was a strong desire to address this issue and that evidence- based programs existed in this area (56%). However, only 39% thought there were adequate resources and that progress was being made in this area.
Figure 4: Stakeholder Survey
Source: 2015 Delaware Title V MCH Stakeholder Survey Notes: Not all survey participants answered every question. 251 participants answered this question.

2015-2020 Title V Needs Assessment MCH Topic Briefs
V6
Page 51
Related State and National Goals
Healthy People 2020 AH-1 Increase the proportion of adolescents who have had a wellness checkup in the past 12 monthsvi
Baseline: 68.7 percent of adolescents aged 10 to 17 years had a wellness checkup in the past 12 months, as reported in 2008
Target: 75.6 percent
There are no state goals or strategies related to this health area listed in the First Delaware State Health Improvement Plan or the Delaware Division of Public Health 2014-2017 Strategic Plan.
i Department of Health & Human Services: Center for Medicare and Medicaid Services. (2014). Paving the Road to Good Health: Strategies for Increasing Medicaid Adolescent Well-Care Visits. Retrieved from: http://www.medicaid.gov/Medicaid-CHIP-Program-Information/By- Topics/Benefits/Downloads/Paving-the-Road-to-Good-Health.pdf ii Department of Health & Human Services: Center for Medicare and Medicaid Services. (2014). Paving the Road to Good Health: Strategies for Increasing Medicaid Adolescent Well-Care Visits. Retrieved from: http://www.medicaid.gov/Medicaid-CHIP-Program-Information/By- Topics/Benefits/Downloads/Paving-the-Road-to-Good-Health.pdf iii The Child & Adolescent Health Measurement Initiative. (2012). 2003 National Survey of Children’s Health. Retrieved from http://www.childhealthdata.org/learn/NSCH iv The Child & Adolescent Health Measurement Initiative. (2012). 2007 National Survey of Children’s Health. Retrieved from http://www.childhealthdata.org/learn/NSCH v The Child & Adolescent Health Measurement Initiative. (2012). 2011/12 National Survey of Children’s Health. Retrieved from http://www.childhealthdata.org/learn/NSCH vi Healthy People 2020. (2015). Adolescent Health – Objectives. Retrieved from: http://www.healthypeople.gov/2020/topics-objectives/topic/Adolescent-Health/objectives

2015-2020 Title V Needs Assessment MCH Topic Briefs
V6
Page 52
Population Domain: Children and Youth with Special Health Care Needs (CYSHCN)
CYSHCN HAVING A MEDICAL HOME
NATIONAL PERFORMANCE MEASURE 11
What is a Medical Home?
To achieve optimal health outcomes, children and youth with special health care needs (CYSHCN) must have access to coordinated ongoing comprehensive care within a medical home. A medical home is an approach in which the care provided is accessible, continuous, comprehensive, compassionate, and culturally effective.i It is provided by doctors or nurses who provide primary care and help to manage and facilitate essentially all aspects of pediatric care, including specialty care.”ii Central to a medical home approach is patient- and family-centered care coordination. Medical home effectiveness is measured by the experiences of the families that receive the services, which encourages them to be proactively engaged in the design of systems and policies that will support the development of care coordination. A medical home is an important mechanism for uniting the many segments of a child's care, including behavioral and oral health.iii
National Performance Measure 11: Metric Guidance (page 84) Measure: Percent of children with and without special health care needs having a medical home Source: The revised National Survey of Children's Health (NSCH) beginning in 2017. States can use data from the 2011- 2012 NSCH as a baseline. Numerator: Parent report for all children with and without special health care needs, ages 0 to 18 years, who meet the criteria for having a medical home, with subset analyses for children with special health care needs Denominator: All children and adolescents, ages 0 to 18 years Significance: The American Academy of Pediatrics (AAP) specifies seven qualities essential to medical home care: accessible, family-centered, continuous, comprehensive, coordinated, compassionate and culturally effective. Ideally, medical home care is delivered within the context of a trusting and collaborative relationship between the child’s family and a competent health professional familiar with the child and family and the child’s health history. Providing comprehensive care to children in a medical home is the standard of pediatric practice. Research indicates that children with a stable and continuous source of health care are more likely to receive appropriate preventive care and immunizations, are less likely to be hospitalized for preventable conditions, and are more likely to be diagnosed early for chronic or disabling conditions. The Maternal and Child Health Bureau uses the AAP definition of medical home.

2015-2020 Title V Needs Assessment MCH Topic Briefs
V6
Page 53
Medical Home in Delaware According to the 2005/06 and 2009/10 National Survey of Children with Special Health Care Needs, the percent of children with special healthcare needs (CSHCN) who received coordinate, ongoing, comprehensive care within a medical home declined from 48.1% to 41.4% in Delaware and from 47.1% to 43.0% nationallyiv,v. In survey year 2005/06 the percent in Delaware (48.1%) was higher than the nationally estimate (47.1%). In survey year 2009/10, the national estimate (43.0%) was higher than the percent in Delaware (41.4%). See Figure 1.
In Delaware, between survey years 2005/06 and 2009/10, the percent of CSHCN within a medical home declined across all race/ethnicity categories—from 51.6% to 46.5% among White, non-Hispanic, from 38.6% to 37.0% among Black, non-Hispanic, from 47.8% to 42.1% among other, non-Hispanic, and from 41.8% to 19.6% among Hispanic. In survey year 2009/10 in Delaware, White, non-Hispanic (46.5%) had the highest percent of CSHCN within a medical home, followed by other, non-Hispanic (42.1%), Black, non-Hispanic (37.0%),and Hispanic (19.6%). See Figure 2.
In Delaware in survey year 2009/10, percent of CSHCN within a medical home appears to be positively correlated with household income level. The household income level of 400% FPL or higher (55.4%) had the highest percent, followed by 200-399% (42.6%), 100-199% FPL (31.8%), and 0-99% (25.1%). All household incomes levels had percentages lower than national estimates, except for the percentage for household income level 400% or higher. See Figure 3.
According to the 2011/12 National Survey of Children’s Health, the percent of children (all children ages 0-17) who receive coordinated, ongoing, comprehensive care within a medical home is 55.9% in Delaware and 54.4% nationallyvi. These non-CSHCN state and national estimates are higher than the CSHCN estimates provided here of 41.4% in Delaware and 43.0% nationally in survey year 2009/10.
Figure 1: Medical Home for CSHCN
Source: 2005/06 & 2009/10 National Survey of Children with Special Health Care Needs Notes: Parent report of CSHCN, ages 0-17 years. A total of 19 different survey questions are used to develop the overall composite score for having a Medical Home. To qualify as having a medical home, a child must have a personal doctor or nurse and meet the criteria for adequate care on every needed component. For additional details on medical home, including SAS and SPSS scoring programs, please visit www.childhealthdata.org/browse/medicalhome. If you have further questions, please email:[email protected]

2015-2020 Title V Needs Assessment MCH Topic Briefs
V6
Page 54
Figure 2: Race/Ethnicity Figure 3: Household Income Level
Source: 2005/06 & 2009/10 National Survey of Children with Special Health Care Needs Notes: Parent report of CSHCN, ages 0-17 years. A total of 19 different survey questions are used to develop the overall composite score for having a Medical Home. To qualify as having a medical home, a child must have a personal doctor or nurse and meet the criteria for adequate care on every needed component. For additional details on medical home, including SAS and SPSS scoring programs, please visit www.childhealthdata.org/browse/medicalhome. If you have further questions, please email:[email protected]
Source: 2005/06 & 2009/10 National Survey of Children with Special Health Care Needs Notes: Parent report of CSHCN, ages 0-17 years. 2005/06 data are not available due to reporting inconsistencies. A total of 19 different survey questions are used to develop the overall composite score for having a Medical Home. Lack of clarity at the data source preventing 2005/06 data from being included in this graphic. To qualify as having a medical home, a child must have a personal doctor or nurse and meet the criteria for adequate care on every needed component. For additional details on medical home, including SAS and SPSS scoring programs, please visit www.childhealthdata.org/browse/medicalhome. If you have further questions, please email:[email protected].

2015-2020 Title V Needs Assessment MCH Topic Briefs
V6
Page 55
Interest and Capacity to Address Issue As part of the 2015-2020 Title V Needs Assessment, maternal and child health stakeholders recently completed a survey to identify priority areas for addressing the health needs of Delaware’s women, mothers, and children. The survey questions provided stakeholders with different ways of expressing what they considered priority areas. With regard to medical home, the survey results reveal the following information.
• Stakeholders were asked to rate their “top 7” across 15
national priority areas. Medical Home was ranked #6 among the 15 areas, receiving 123 votes.
• Stakeholders were also asked to identify which among two areas was most important within the children and youth with special health care needs domain. Medical Home was ranked #1 among the two (52% chose medical home, 44% chose transition to adult care).
• Stakeholders were asked to assess the capacity of the Delaware Maternal and Child Health System to address improving access to medical homes for children. About two-thirds (65%) thought there was a strong desire to address this issue. Fifty-seven percent thought evidence- based programs existed in this area. Only 38% thought there were adequate resources. And 41% thought progress was being made in this area.
Related State and National Goals
Figure 4: Stakeholder Survey
Source: 2015 Delaware Title V MCH Stakeholder Survey Notes: Not all survey participants answered every question. 250 participants answered this question.
Healthy People 2020 MICH-30 Increase the proportion of children, including those with special health care needs, who have access to a medical homevii
MICH-30.1 Increase the proportion of children who have access to a medical home Baseline: 57.5 percent of children under age 18 years had access to a medical home in 2007 Target: 63.3 percent
MICH-30.2 Increase the proportion of children with special health care needs who have access to a medical home
Baseline: 47.1 percent of children under age 18 years with special health care needs had access to a medical home in 2005–06 Target: 51.8 percent

2015-2020 Title V Needs Assessment MCH Topic Briefs
V6
Page 56
There are no state goals or strategies related to this health area listed in the First Delaware State Health Improvement Plan or the Delaware Division of Public Health 2014-2017 Strategic Plan.
i McPherson M, Weissman G, Strickland B, Van Dyck PC. (2004). Implementing Community-Based Systems of Services for Children and Youths with Special Health Care Needs: How Well Are We Doing? Pediatrics, 113, 1538. ii McPherson M, Weissman G, Strickland B, Van Dyck PC. (2004). Implementing Community-Based Systems of Services for Children and Youths with Special Health Care Needs: How Well Are We Doing? Pediatrics, 113, 1538. iii US Department of Health and Human Services: HRSA: Health Information Technology. (n.d.) What is a medical home? Why is it important? Retrieved from http://www.hrsa.gov/healthit/toolbox/Childrenstoolbox/BuildingMedicalHome/whyimportant.html iv The Child & Adolescent Health Measurement Initiative. (2012). 2009/10 National Survey of Children’s Health. Retrieved from http://www.childhealthdata.org/learn/NSCH v The Child & Adolescent Health Measurement Initiative. (2012). 2011/12 National Survey of Children’s Health. Retrieved from http://www.childhealthdata.org/learn/NSCH vi The Child & Adolescent Health Measurement Initiative. (2012). 2011/12 National Survey of Children’s Health. Retrieved from http://www.childhealthdata.org/learn/NSCH vii Health People 2020 (2015). Maternal, Infant and Child Health – Objectives. Retrieved from: http://www.healthypeople.gov/2020/topics-objectives/topic/maternal-infant-and-child-health/objectives

2015-2020 Title V Needs Assessment MCH Topic Briefs
V5
Page 57
Population Domain: Children with Special Health Care Needs
TRANSITION NATIONAL PERFORMANCE MEASURE 12
Transition to adult health care Optimal health care is achieved when each person, at every age, receives medically and developmentally appropriate care. Therefore, smooth transition from pediatric to adult care is essential for preventing gaps in care. The goal of a planned health care transition is to maximize lifelong functioning and well-being for all youth, including those who have special health care needs. This process involves ensuring that high-quality, developmentally appropriate health care services are available in an uninterrupted manner as individuals move from adolescence to adulthood. A well-timed transition from child- to adult-oriented health care is specific to each person, but ideally occurs between the ages of 18 and 21 years.
Transition often presents new challenges for youth with chronic illnesses or special needs and their families. Youth need to learn, practice and become confident in the skills they need to manage their own health. Families need to learn about the adult services that will help support their teen in the adult world. Although transition to adult health care is one part of the transition process, there are other issues that youth need to deal with during the transition process. These include adult services, education, employment, financial preparation, transportation and recreation.i Overall, coordination of patient, family and provider responsibilities enables youth to optimize their ability to assume adult roles and activities in managing their health and health care.ii
National Performance Measure 12: Metric Guidance (page 85) Measure: Percent of children with and without special health care needs who received services necessary to make transitions to adult health care Source: The revised National Survey of Children's Health (NSCH) beginning in 2017. States can use data from the 2011- 2012 NSCH as a baseline. Numerator: Parent report of youth with and without special health care needs, ages 12 through 17, whose families report that they received the services necessary to transition to adult health care, with subset analyses for children with special health care needs Denominator: All adolescents, ages 12 through 17 years Significance: The transition of youth to adulthood has become a priority issue nationwide as evidenced by the clinical report and algorithm developed jointly by the AAP, American Academy of Family Physicians and American College of Physicians to improve healthcare transitions for all youth and families. Over 90 percent of children with special health care needs now live to adulthood, but are less likely than their non-disabled peers to complete high school, attend college or to be employed. Health and health care are cited as two of the major barriers to making successful transitions.
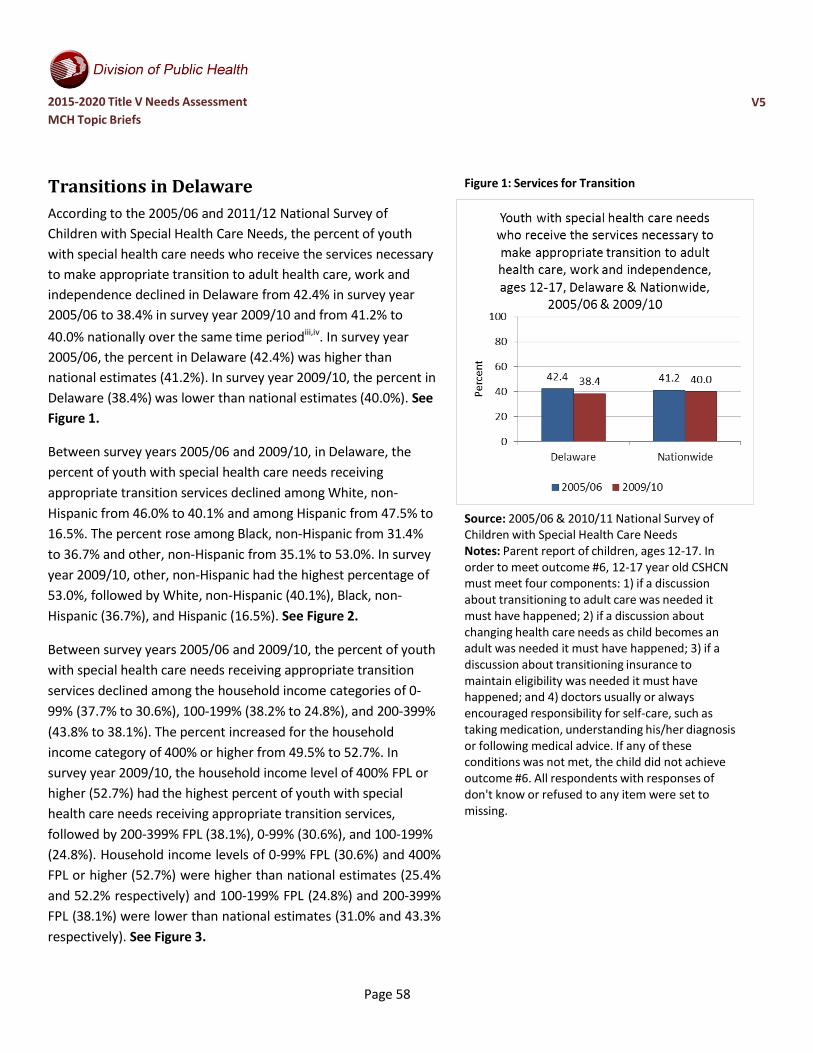
2015-2020 Title V Needs Assessment MCH Topic Briefs
V5
Page 58
Transitions in Delaware According to the 2005/06 and 2011/12 National Survey of Children with Special Health Care Needs, the percent of youth with special health care needs who receive the services necessary to make appropriate transition to adult health care, work and independence declined in Delaware from 42.4% in survey year 2005/06 to 38.4% in survey year 2009/10 and from 41.2% to 40.0% nationally over the same time periodiii,iv. In survey year 2005/06, the percent in Delaware (42.4%) was higher than national estimates (41.2%). In survey year 2009/10, the percent in Delaware (38.4%) was lower than national estimates (40.0%). See Figure 1.
Between survey years 2005/06 and 2009/10, in Delaware, the percent of youth with special health care needs receiving appropriate transition services declined among White, non- Hispanic from 46.0% to 40.1% and among Hispanic from 47.5% to 16.5%. The percent rose among Black, non-Hispanic from 31.4% to 36.7% and other, non-Hispanic from 35.1% to 53.0%. In survey year 2009/10, other, non-Hispanic had the highest percentage of 53.0%, followed by White, non-Hispanic (40.1%), Black, non- Hispanic (36.7%), and Hispanic (16.5%). See Figure 2.
Between survey years 2005/06 and 2009/10, the percent of youth with special health care needs receiving appropriate transition services declined among the household income categories of 0- 99% (37.7% to 30.6%), 100-199% (38.2% to 24.8%), and 200-399% (43.8% to 38.1%). The percent increased for the household income category of 400% or higher from 49.5% to 52.7%. In survey year 2009/10, the household income level of 400% FPL or higher (52.7%) had the highest percent of youth with special health care needs receiving appropriate transition services, followed by 200-399% FPL (38.1%), 0-99% (30.6%), and 100-199% (24.8%). Household income levels of 0-99% FPL (30.6%) and 400% FPL or higher (52.7%) were higher than national estimates (25.4% and 52.2% respectively) and 100-199% FPL (24.8%) and 200-399% FPL (38.1%) were lower than national estimates (31.0% and 43.3% respectively). See Figure 3.
Figure 1: Services for Transition
Source: 2005/06 & 2010/11 National Survey of Children with Special Health Care Needs Notes: Parent report of children, ages 12-17. In order to meet outcome #6, 12-17 year old CSHCN must meet four components: 1) if a discussion about transitioning to adult care was needed it must have happened; 2) if a discussion about changing health care needs as child becomes an adult was needed it must have happened; 3) if a discussion about transitioning insurance to maintain eligibility was needed it must have happened; and 4) doctors usually or always encouraged responsibility for self-care, such as taking medication, understanding his/her diagnosis or following medical advice. If any of these conditions was not met, the child did not achieve outcome #6. All respondents with responses of don't know or refused to any item were set to missing.

2015-2020 Title V Needs Assessment MCH Topic Briefs
V5
Page 59
Figure 2: Race/Ethnicity Figure 3: Household Income Level
Source: 2005/06 & 2010/11 National Survey of Children with Special Health Care Needs Notes: Parent report of children, ages 12-17. In order to meet outcome #6, 12-17 year old CSHCN must meet four components: 1) if a discussion about transitioning to adult care was needed it must have happened; 2) if a discussion about changing health care needs as child becomes an adult was needed it must have happened; 3) if a discussion about transitioning insurance to maintain eligibility was needed it must have happened; and 4) doctors usually or always encouraged responsibility for self-care, such as taking medication, understanding his/her diagnosis or following medical advice. If any of these conditions was not met, the child did not achieve outcome #6. All respondents with responses of don't know or refused to any item were set to missing.
Source: 2005/06 & 2010/11 National Survey of Children with Special Health Care Needs Notes: Parent report of children, ages 12-17. In order to meet outcome #6, 12-17 year old CSHCN must meet four components: 1) if a discussion about transitioning to adult care was needed it must have happened; 2) if a discussion about changing health care needs as child becomes an adult was needed it must have happened; 3) if a discussion about transitioning insurance to maintain eligibility was needed it must have happened; and 4) doctors usually or always encouraged responsibility for self-care, such as taking medication, understanding his/her diagnosis or following medical advice. If any of these conditions was not met, the child did not achieve outcome #6. All respondents with responses of don't know or refused to any item were set to missing. *The variable used to construct child-level CSHCN's NON- IMPUTED household poverty level is found in the publicly released 2005-2006 NS_CSHCN Household File, which has household-level records only.

2015-2020 Title V Needs Assessment MCH Topic Briefs
V5
Page 60
Interest and Capacity to Address Issue As part of the 2015-2020 Title V Needs Assessment, maternal and child health stakeholders recently completed a survey to identify priority areas for addressing the health needs of Delaware’s women, mothers, and children. The survey questions provided stakeholders with different ways of expressing what they considered priority areas. With regard to transition services, the survey results reveal the following information:
• Stakeholders were asked to rate their “top 7” across 15 national priority areas. Transition (for children with and without special health care needs) was ranked #11 among the 15 areas, receiving 103 votes.
• Stakeholders were also asked to identify which among two areas was most important within the children and youth with special health care needs domain. Transition was rated #2 among the two (52% chose medical home, 44% chose transition to adult care).
• Stakeholders were asked to assess the capacity of the Delaware Maternal and Child Health System to address improving transition for children (with and
Figure 5: Stakeholder Survey
Source: 2015 Delaware Title V MCH Stakeholder Survey Notes: Not all survey participants answered every question. 250 participants answered this question.
without special health needs). Just over half (51%) thought there was a strong desire to address this issue. Forty-four percent thought evidence-based programs existed in this area, while only 19% thought there were adequate resources and 31% thought progress was being made in this area.
Related State and National Goals
Healthy People 2020 (Note: No objectives regarding transitions could be found for healthy adolescents.) DH-5 Increase the proportion of youth with special health care needs whose health care provider has discussed transition planning from pediatric to adult health carev
Baseline: 41.2 percent of youth with special health care needs had a health care provider who discussed transition planning from pediatric to adult health care in 2005–06

2015-2020 Title V Needs Assessment MCH Topic Briefs
V5
Page 61
Target: 45.3 percent
There are no state goals or strategies related to this health area listed in the First Delaware State Health Improvement Plan or the Delaware Division of Public Health 2014-2017 Strategic Plan.
i Children’s Hospital of Wisconsin. (2015). Transition to adult care: Introduction to transition. Retrieved from: http://www.chw.org/medical-care/transition-to-adult-care/ ii American Academy of Pediatricians, American Academy of Family Physicians, and American College of Physicians. (2011). Clinical Report – Supporting the Health Care Transition from Adolescence to Adulthood in the Medical Home. Pediatrics, 128 (1). iii The Child & Adolescent Health Measurement Initiative. (2012). 2005/06 National Survey of Children with Special Health Care Needs. Retrieved from http://www.childhealthdata.org/learn/NSCH iv The Child & Adolescent Health Measurement Initiative. (2012). 2009/10 National Survey of Children with Special Health Care Needs. Retrieved from http://www.childhealthdata.org/learn/NSCH v Healthy People 2020. (2015). Disability and Health – Objectives. Retrieved from http://www.healthypeople.gov/node/3501/objectives#4153

2015-2020 Title V Needs Assessment MCH Topic Briefs
V6
Page 62
Population Domain: Cross-cutting/Life Course
ORAL HEALTH NATIONAL PERFORMANCE MEASURE 13
Oral Health throughout the lifespan Oral health is a vital component of overall health and maintaining good oral health may have a positive effect on cardiovascular disease, diabetes and other disorders.i Access to oral health care, proper oral hygiene and adequate nutrition are essential components of good oral health. Therefore, oral health should be maintained during pregnancy and throughout a woman’s lifespan. Good oral health and control of oral disease also protects a woman’s health and quality of life before and during pregnancy, and has the potential to reduce the transmission of pathogenic bacteria from mothers to their children.ii
Oral health is similarly important for youth. Tooth decay is one of the most common preventable chronic diseases in children, and can cause pain and infection, which ultimately contribute to poor eating, speaking, socializing, and overall poor health. However, many children do not receive the preventive dental services, early diagnoses and interventions needed to halt the disease process. Of significance, access to dental care remains the greatest barrier contributing to unmet dental needs for low income children.
National Performance Measure 13: Metric Guidance (page 86) Measure: A) Percent of women who had a dental visit during pregnancy and B) Percent of infants and children, ages 1 through 17 years, who had a preventive dental visit in the last year Source: A) CDC's Pregnancy Risk Assessment Monitoring System (PRAMS); B) the revised National Survey of Children's Health (NSCH) beginning in 2017. States can use data from the 2011-2012 NSCH as a baseline. Numerator: A) Report of a dental visit during pregnancy B) Parent report of infant or child, ages 1 through 17 years, who had a preventive dental visit in the last year Denominator: A) All live births B) All infants and children, ages 1 through 17 years Significance: Oral health is a vital component of overall health. Access to oral health care, good oral hygiene, and adequate nutrition are essential component of oral health to help ensure that children, adolescents, and adults achieve and maintain oral health. People with limited access to preventive oral health services are at greater risk for oral diseases. Oral health care remains the greatest unmet health need for children. Insufficient access to oral health care and effective preventive services affects children’s health, education, and ability to prosper. Early dental visits teach children that oral health is important. Children who receive oral health care early in life are more likely to have a good attitude about oral health professionals and dental visits. Pregnant women who receive oral health care are more likely to take their children to get oral health care.

2015-2020 Title V Needs Assessment MCH Topic Briefs
V6
Page 63
State Title V Maternal and Child Health programs have long recognized the importance of improving the availability and quality of services to improve oral health for children and pregnant women. States monitor and guide service delivery to assure that all children have access to preventive oral health services. Strategies for promoting oral health include providing preventive interventions, such as dental sealants and use of fluoride, increasing the capacity of State oral health programs to provide preventive services, evaluating and improving methods of monitoring oral diseases and conditions, and increasing the number of community health centers with an oral health component.
Oral Health in Delaware
National Performance Measure 13A Dental Visit during Pregnancy
According to the Center for Disease Control’s (CDC) Pregnancy Risk Assessment Monitoring Systemiii, the percentage of women who reported visiting a dentist or dental clinic during their most recent pregnancy rose slightly between 2007 (36.0%) and 2010 (39.0%). National estimate data is not available for this survey as it is not administered in all fifty states. See Figure 1.
The race/ethnicity category of other, non-Hispanic women saw the greatest change in percent of dental visits during pregnancy from 24.9% and 26.2% in 2007 and 2008 respectively to 42.0% and 44.2% in 2009 and 2010 respectively. The year 2010 had the highest percent of all four years for all racial/ethnic categories except White, non- Hispanic women. In the 2009 and 2010, White, non-Hispanic women (50.3%, 45.9%) had the highest percentages of dental visits during pregnancy followed by other, non-Hispanic women (42.0%, 44.2%), Black, non-Hispanic women (26.0%, 31.6%), and Hispanic women (19.7%, 22.3%). See Figure 2.
For each year between 2007 and 2010, lower income women had the lowest percentages of dental visits during pregnancy. The percent for women with incomes of $50,000 or more was between three and four times higher than for women with incomes less than $10,000. The income categories of $10,000 to $24,999 and less than $10,000 saw the greatest changes in percent. The less than $10,000 income category rose from 13.9% in 2007 to 21.2% in 2010 and the $10,000 to $24,999 income category rose from 19.7% in 2007 to 25.2% in 2010. See Figure 3.
Figure 1: Dental Visits during Pregnancy
Source: 2007-2010 CDC Pregnancy Risk Assessment Monitoring System (PRAMS) Notes: National estimates not available.

2015-2020 Title V Needs Assessment MCH Topic Briefs
V6
Page 64
Figure 2: Dental Visits during Pregnancy, by Maternal Race/Ethnicity
Source: 2007-2010 CDC Pregnancy Risk Assessment Monitoring System (PRAMS) Notes: National estimates not available.
Figure 3: Dental Visits during Pregnancy, by Income
Source: 2007-2010 CDC Pregnancy Risk Assessment Monitoring System (PRAMS) Notes: National estimates not available.

2015-2020 Title V Needs Assessment MCH Topic Briefs
V6
Page 65
National Performance Measure 13B
Child and Infant Preventive Dental Care Visits in the Last Year
According to the 2007 and 2011/12 National Survey of Children’s Health, the percent of Delaware children ages 1-17 who received one more preventive dental care visits in the last year was below the national estimate in survey year 2007 and equal to the national estimate in survey year 2011/12iv,v. The national estimate declined from 78.4% in survey year 2007 to 77.2% in survey year 2011/12 and the Delaware value rose from 76.8% to 77.2%. See Figure 4.
Between survey years 2007 and 2011/12, the percent of children who received a preventive dental visit in the last year rose among White, non-Hispanic children (80.0% to 83.3%), Black, non-Hispanic children (73.3% to 75.9%), and Hispanic children (62.6% to 65.5%). It declined among other, non-Hispanic children (68.2% to 66.4%). Delaware was lower than national estimates in all four racial categories in both survey years with the exception of White, non- Hispanic children and Black, non-Hispanic children in survey year 2011/12. See Figure 5.
For both survey years, children at higher household income levels in Delaware had higher rates of preventive dental visits in the last year than children at lower household income levels. Among children at the 0-99% FPL household income level, the State percentage was lower than the national estimate for both survey years. This was also true for higher household income levels with the exception of the 100-199% FPL household income level category in survey year 2011/12. See Figure 6.
Figure 4: Child Preventive Dental Visits in the Last Year or
Source: 2007 & 2011/12 National Survey of Children’s Health Notes: 2003 Data not available. Parent report of children ages 1 through 17.

2015-2020 Title V Needs Assessment MCH Topic Briefs
V6
Page 66
Figure 5: Child Preventive Dental Visits in the Last Year, by Race/Ethnicity of Child
Source: 2007 & 2011/12 National Survey of Children’s Health Notes: 2003 Data not available. Parent report of children ages 1 through 17.
Figure 6: Child Preventive Dental Visits in the Last Year, by Household Income Level
Source: 2007 & 2011/12 National Survey of Children’s Health Notes: 2003 Data not available. Parent report of children ages 1 through 17.

2015-2020 Title V Needs Assessment MCH Topic Briefs
V6
Page 67
Interest and Capacity to Address Issue As part of the 2015-2020 Title V Needs Assessment, maternal and child health stakeholders recently completed a survey to identify priority areas for addressing the health needs of Delaware’s women, mothers, and children. The survey questions provided stakeholders with different ways of expressing what they considered priority areas. With regard to oral health, the survey results reveal the following information.
• Stakeholders were asked to rate their “top 7” across 15 national priority areas. Oral health (to ensure pregnant women and children have an annual preventive visits) was ranked #9 among the 15 areas, receiving 115 votes.
• Stakeholders were also asked to identify which among four areas
was most important within the cross-cutting/life course domain. Oral health for infants and children was rated #2 among the four and oral health for pregnant women was rated 4th (40% chose adequate insurance, 30% chose oral health for infants and children, 17% chose smoking cessation/prevention, 12% chose oral health for pregnant women).
• Stakeholders were asked to assess the capacity of the Delaware
Maternal and Child Health System to address oral health, separately both for pregnant women and for infants and children. Overall, there was more agreement there was more desire, resources, progress, and evidence-based practices pertaining to oral health services for infants and children than for pregnant women. For pregnant women, less than half (40%) agreed there was desire to work on this issue or evidence-based practices available (43%), and less than 20% thought there were resources available or progress being made. For infants and children, two-thirds agreed (66%) there was desire to address this issue and evidence-based practices were available. However, only 34% thought there were resources available and only 41% thought there was progress being made in this area.
Figure 7: Stakeholder Survey, Pregnant Women
Source: 2015 Delaware Title V MCH Stakeholder Survey Notes: Not all survey participants answered every question. 250 participants answered this question.
Figure 8: Stakeholder Survey, Infants and Children
Source: 2015 Delaware Title V MCH Stakeholder Survey Notes: Not all survey participants answered every question. 250 participants answered this question.

2015-2020 Title V Needs Assessment MCH Topic Briefs
V6
Page 68
Related State and National Goals
Healthy People 2020 OH-7 Increase the proportion of children, adolescents, and adults who used the oral health care system in the past yearvi
Baseline: 44.5 percent of persons aged 2 years and older had a dental visit in the past year in 2007 Target: 49.0 percent
OH-8 Increase the proportion of low-income children and adolescents who received any preventive dental service during the past yearvii
Baseline: 30.2 percent of children and adolescents aged 2 to 18 years at or below 200 percent of the Federal poverty level received a preventive dental service during the past year in 2007 Target: 33.2 percent
There are no state goals or strategies related to this health area listed in the First Delaware State Health Improvement Plan or the Delaware Division of Public Health 2014-2017 Strategic Plan.
i Committee Opinion No. 569. (2013). Oral health care during pregnancy and through the lifespan. Obstet. Gynecol; 122:417-22. ii CDA Foundation. 2010. Oral Health During Pregnancy and Early Childhood: Evidence-Based Guidelines for Health Professionals. February, Retrieved from: http://www.cdafoundation.org/portals/0/pdfs/poh_guidelines.pdf iii Center for Disease Control and Prevention. (n.d.) Pregnancy Risk Assessment Monitoring System (PRAMS): CPONDER. Retrieved from http://apps.nccd.cdc.gov/cPONDER/ iv The Child & Adolescent Health Measurement Initiative. (2012). 2009/10 National Survey of Children’s Health. Retrieved from http://www.childhealthdata.org/learn/NSCH v The Child & Adolescent Health Measurement Initiative. (2012). 2011/12 National Survey of Children’s Health. Retrieved from http://www.childhealthdata.org/learn/NSCH vi Healthy People 2020 (2015). Oral Health – Objectives. Retrieved from: http://www.healthypeople.gov/2020/topics-objectives/topic/oral-health/objectives vii Healthy People 2020 (2015). Oral Health – Objectives. Retrieved from: http://www.healthypeople.gov/2020/topics-objectives/topic/oral-health/objectives

2015-2020 Title V Needs Assessment MCH Topic Briefs
V5
Page 69
Population Domain: Cross cutting/Life Course
HOUSEHOLD SMOKING NATIONAL PERFORMANCE MEASURE 14
Household Smoking and Its Impact On Maternal and Child Health Tobacco use is the leading cause of preventable disease and death in the United States. It results in more than 480,000 premature deaths and $289 billion direct health care expenditures and productivity losses each year.i Smoking during pregnancy contributes a number of harmful consequences for both the mother and child. For example, women who smoke during pregnancy are more likely to experience fetal death or deliver a premature and low birth weight babyii.
Additionally, secondhand smoke causes heart disease and lung cancer in adults and a number of health problems in infants and children, including severe asthma attacks, respiratory infections, ear infections and sudden infant death syndrome (SIDS)iii. There is no risk free level of exposure to secondhand smoke.iv During 2011–2012, two out of every five children ages 3 to 11—including seven out of every ten Black children—in the United States were exposed to secondhand smoke regularly.v Therefore, preventing tobacco use and helping tobacco users quit can improve the health and quality of life for Americans of all ages.
National Performance Measure 14: Metric Guidance (page 88) Measure: A) Percent of women who smoke during pregnancy and B) Percent of children who live in households where someone smokes Source: This is an integrated measure with two data sources: A) National Vital Statistics System (NVSS) for smoking during pregnancy and B) the revised National Survey of Children's Health (NSCH) beginning in 2017. States can use data from the 2011-2012 NSCH as a baseline. If selected, the state needs to address both parts (A & B) of the measure. Numerator: A) Women who report smoking during pregnancy B) Parent report of cigar, cigarette, or pipe tobacco use by household members Denominator: A) All women who delivered a live birth in a calendar year B) All children, ages 0 to 18 years Significance: Women who smoke during pregnancy are more likely to experience a fetal death or deliver a low birth weight baby. Further, secondhand smoke (SHS) is a mixture of mainstream smoke (exhaled by smoker) and the more toxic side stream smoke (from lit end of nicotine product) which is classified as a “known human carcinogen” by the US Environmental Protection Agency, the US National Toxicology Program, and the International Agency for Research on Cancer. Adverse effects of parental smoking on children have been a clinical and public health concern for decades and were documented in the 1986 U.S. Surgeon General Report. The only way to fully protect non-smokers from indoor exposure to SHS is to prevent all smoking in the space; separating smokers from non-smokers, cleaning the air, and

2015-2020 Title V Needs Assessment MCH Topic Briefs
V5
Page 70
ventilating buildings do not eliminate exposure. Unfortunately, millions (more than 60%) of children are exposed to SHS in their homes. These children have an increased frequency of ear infections; acute respiratory illnesses and related hospital admissions during infancy; severe asthma and asthma-related problems; lower respiratory tract infections leading to 7,500 to 15,000 hospitalizations annually in children under 18 months; and sudden infant death syndrome (SIDS). Higher intensity medical services are also required by children of parents who smoke including an increased need for intensive care unit services when admitted for flu, longer hospital stays; and more frequent use of breathing tubes during admissions.
Household Smoking in Delaware National Performance Measure 14A
Women who smoke during pregnancy
According to the Center for Disease Control’s (CDC) Pregnancy Risk Assessment Monitoring System (PRAMS), the percent of mothers who smoked during the last three month of pregnancy increased in Delaware between 2007 and 2009 from 12.6% to 16.6% and then declined from 2009 to 2010 from 16.6% to 12.8%vi. See Figure 1.
In Delaware, in 2010, the race/ethnicity category of White, non- Hispanic had the highest percent of mothers smoking during pregnancy of 17.8%, followed by Black, non-Hispanic (9.3%), other, non-Hispanic (3.7%), and Hispanic (2.4%), Among Hispanic and Black, non-Hispanic the percentage increased from 2007 to 2009 (1.7%, 6.6% to 5.5%, 18.6% respectively) and then decreased from 2009 to 2010 (to 2.4% & 9.3% respectively). Among White, non-Hispanic the percentage decreased from 20.0% in 2007 to 17.8% in 2010. See Figure 2.
In Delaware, between the years 2008 and 2010, smoking during pregnancy appears to be negatively correlated with income level. In 2010, the percent was highest for the income level of less than $10,000 (22.1%), followed by $10,000 to $24,999 (21.1%), $25,000 to $49,999 (13.3%), and $50,000 or more (3.6%). This relationship is consistent with 2007 estimates with the exception of the lowest income group (less than $10,000). See Figure 3.
Figure 1: Smoking during Pregnancy
Source: 2007-2010 CDC Pregnancy Risk Assessment Monitoring System (PRAMS) Notes: National estimates not available.

2015-2020 Title V Needs Assessment MCH Topic Briefs
V5
Page 71
Figure 2: Smoking during Pregnancy, by Race/Ethnicity Figure 3: Smoking during Pregnancy, by Income
Source: 2007-2010 CDC Pregnancy Risk Assessment Monitoring System (PRAMS) Notes: National estimates not available.
Source: 2007-2010 CDC Pregnancy Risk Assessment Monitoring System (PRAMS) Notes: National estimates not available.
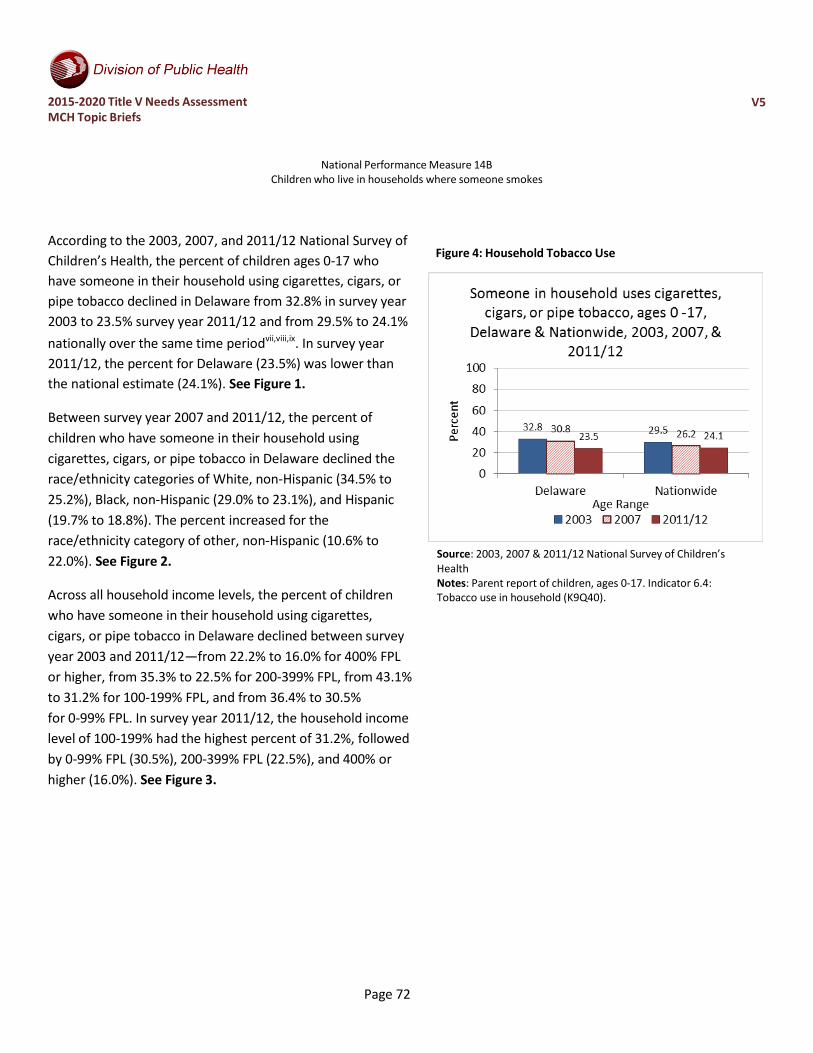
2015-2020 Title V Needs Assessment MCH Topic Briefs
V5
Page 72
National Performance Measure 14B Children who live in households where someone smokes
According to the 2003, 2007, and 2011/12 National Survey of Children’s Health, the percent of children ages 0-17 who have someone in their household using cigarettes, cigars, or pipe tobacco declined in Delaware from 32.8% in survey year 2003 to 23.5% survey year 2011/12 and from 29.5% to 24.1% nationally over the same time periodvii,viii,ix. In survey year 2011/12, the percent for Delaware (23.5%) was lower than the national estimate (24.1%). See Figure 1.
Between survey year 2007 and 2011/12, the percent of children who have someone in their household using cigarettes, cigars, or pipe tobacco in Delaware declined the race/ethnicity categories of White, non-Hispanic (34.5% to 25.2%), Black, non-Hispanic (29.0% to 23.1%), and Hispanic (19.7% to 18.8%). The percent increased for the race/ethnicity category of other, non-Hispanic (10.6% to 22.0%). See Figure 2.
Across all household income levels, the percent of children who have someone in their household using cigarettes, cigars, or pipe tobacco in Delaware declined between survey year 2003 and 2011/12—from 22.2% to 16.0% for 400% FPL or higher, from 35.3% to 22.5% for 200-399% FPL, from 43.1% to 31.2% for 100-199% FPL, and from 36.4% to 30.5% for 0-99% FPL. In survey year 2011/12, the household income level of 100-199% had the highest percent of 31.2%, followed by 0-99% FPL (30.5%), 200-399% FPL (22.5%), and 400% or higher (16.0%). See Figure 3.
Figure 4: Household Tobacco Use
Source: 2003, 2007 & 2011/12 National Survey of Children’s Health Notes: Parent report of children, ages 0-17. Indicator 6.4: Tobacco use in household (K9Q40).

2015-2020 Title V Needs Assessment MCH Topic Briefs
V5
Page 73
Figure 5: Household Tobacco Use, by Race/Ethnicity Figure 6: Household Tobacco Use, by Household Income
Source: 2003, 2007 & 2011/12 National Survey of Children’s Health Notes: Parent report of children, ages 0-17. Indicator 6.4: Tobacco use in household (K9Q40). 2003 data specified different race/ethnicity categories and was not included in this graphic. Source: 2003, 2007 & 2011/12 National Survey of Children’s
Health Notes: Parent report of children, ages 0-17. Indicator 6.4: Tobacco use in household (K9Q40).

2015-2020 Title V Needs Assessment MCH Topic Briefs
V5
Page 74
Interest and Capacity to Address Issue As part of the 2015-2020 Title V Needs Assessment, maternal and child health stakeholders recently completed a survey to identify priority areas for addressing the health needs of Delaware’s women, mothers, and children. The survey questions gave stakeholders a few different ways to express what they considered priority areas. With regards to smoking cessation/prevention, the survey results show:
• Stakeholders were asked to rate their “top 7” across 15 national priority areas. Smoking Cessation/Prevention (to address the number of pregnant women who smoke and the number of children exposed to second hand smoke) was ranked #14 among the 15 areas, receiving 75 votes.
• Stakeholders were also asked to identify which among four areas was most important within the cross-cutting/life course domain. Smoking Cessation/Prevention was rated #3 among the four (40% chose adequate insurance, 30% chose oral health for infants and children, 17% chose smoking cessation/prevention, 12% chose oral health for pregnant women).
• Stakeholders were asked to assess the capacity of the Delaware Maternal and Child Health System to address smoking cessation/prevention, separately both for pregnant women and for infants and children. Overall, there was similar agreement around the desire, resources, progress, and evidence-based practices pertaining to second hand smoke prevention for infants and children and for smoking cessation for pregnant women. In both cases over 70% agreed there was desire to work on these issues and evidence-based practices exist, and around 50% agreed there were resources available or progress being made in Delaware on these issues.
Figure 7: Stakeholder Survey, Smoking during Pregnancy
Source: 2015 Delaware Title V MCH Stakeholder Survey Notes: Not all survey participants answered every question. 250 participants answered this question.
Figure 8: Stakeholder Survey, Household Smoking
Source: 2015 Delaware Title V MCH Stakeholder Survey Notes: Not all survey participants answered

2015-2020 Title V Needs Assessment MCH Topic Briefs
V5
Page 75
every question. 250 participants answered this question.

2015-2020 Title V Needs Assessment MCH Topic Briefs
V5
Page 76
Related State and National Goals
Healthy People 2020 TU-14 Increase the proportion of smoke-free homesx
Baseline: 79.1 percent of adults aged 18 years and older reported that no smoking is allowed in their home in 2006–07
Target: 87.0 percent MICH-11 Increase abstinence from alcohol, cigarettes, and illicit drugs among pregnant womenxi
MICH-11.3 Increase abstinence from cigarette smoking among pregnant women
Baseline: 89.6 percent of females delivering a live birth reported abstaining from smoking cigarettes during pregnancy in 2007
Target: 98.6 percent
There are no state goals or strategies related to this health area listed in the First Delaware State Health Improvement Plan or the Delaware Division of Public Health 2014-2017 Strategic Plan.
i US Department of Health and Human Services: Center for Disease Control and Prevention. (2014). The health consequences of smoking—50 years of progress: a report of the Surgeon General. Atlanta, GA. Retrieved from: http://www.surgeongeneral.gov/library/reports/50-years-of-progress/ ii American College of Obstetricians and Gynecologists. (2010). Smoking cessation during pregnancy. Committee Opinion No. 471. Obstet Gynecol; 116: 1241-4. iii U.S. Department of Health and Human Services. The Health Consequences of Involuntary Exposure to Tobacco Smoke: A Report of the Surgeon General. Atlanta, GA: U.S. Department of Health and Human Services, Centers for Disease Control and Prevention, Coordinating Center for Health Promotion, National Center for Chronic Disease Prevention and Health Promotion, Office on Smoking and Health, 2006. iv U.S. Department of Health and Human Services. The Health Consequences of Involuntary Exposure to Tobacco Smoke: A Report of the Surgeon General. Atlanta, GA: U.S. Department of Health and Human Services, Centers for Disease Control and Prevention, Coordinating Center for Health Promotion, National Center for Chronic Disease Prevention and Health Promotion, Office on Smoking and Health, 2006. v Centers for Disease Control and Prevention. (n.d.)Secondhand Smoke (SHS) Facts. Retrieved from http://www.cdc.gov/tobacco/data_statistics/fact_sheets/secondhand_smoke/general_facts/ vi Center for Disease Control and Prevention. (n.d.) Pregnancy Risk Assessment Monitoring System (PRAMS): CPONDER. Retrieved from http://apps.nccd.cdc.gov/cPONDER/ viiThe Child & Adolescent Health Measurement Initiative. (2012). 2011/12 National Survey of Children’s Health. Retrieved from http://www.childhealthdata.org/learn/NSCH viii The Child & Adolescent Health Measurement Initiative. (2012). 2007 National Survey of Children’s Health. Retrieved from http://www.childhealthdata.org/learn/NSCH ix The Child & Adolescent Health Measurement Initiative. (2012). 2003 National Survey of Children’s Health. Retrieved from http://www.childhealthdata.org/learn/NSCH x Healthy People 2020. (2015). Tobacco Use – Objectives. Retrieved from http://www.healthypeople.gov/2020/topics- objectives/topic/tobacco-use/objectives xi Healthy People 2020. (2015). Maternal, Infant, and Child Health – Objectives. Retrieved from http://www.healthypeople.gov/2020/topics-objectives/topic/maternal-infant-and-child-health/objectives

2015-2020 Title V Needs Assessment MCH Topic Briefs
V5
Page 77
Population Domain: Cross-cutting/Life Course
ADEQUATE INSURANCE COVERAGE NATIONAL PERFORMANCE MEASURE 15
Insurance Coverage and Health Care Access Adequate health insurance is an important indicator of a person’s health. People without medical insurance are more likely to lack a source of medical care and skip routine medical care. Without health care coverage, a person increases their risk for serious and disabling health conditions. Furthermore, those with health insurance sometimes find barriers to using their insurance or accessing care. For example, financial barriers, in the forms of costly premiums and high deductibles, can deter people from accessing care. However, with adequate health insurance, one can prevent disease and disability, detect and treat health conditions, and increase quality of life and life expectancy.i
Inadequately insured children are more likely to have delayed or forgone care and lack a medical home. They are also less likely to receive needed referrals, care coordination, and receive family-centered care. Furthermore, children with special health care needs (CHSHN) constitute a particularly vulnerable subpopulation of children. Health insurance coverage has the potential to enhance access to care and improve the quality of life for these children while protecting their families from financially burdensome health care expenses.
Removing financial barriers will improve access to and affordability of care and prevention services. Because improved preventive care for women has the potential to improve the health of their children, it is important to note new provisions provided by the Patient Protection and Affordable Care Act (ACA). Under the ACA, women’s preventive services, such as mammograms, cervical cancer screening, prenatal care, and other services have to be covered by health plans with no cost sharing (no patient copayments or deductibles).ii Specifically, screening for gestational diabetes is now a covered pre-natal care service, which has the potential to reduce the chance of women giving birth to low birth weight babies. Furthermore, the ACA improves access to preventive services for children and adolescents. For example, it requires that youths be covered for oral and vision health. The ACA also covers a wide variety of screening services for youths, including autism screening, developmental screening (0-3 years of age), and alcohol and drug use assessment (adolescents).iii

2015-2020 Title V Needs Assessment MCH Topic Briefs
V5
Page 78
National Performance Measure 15: Metric Guidance (page 90)
Measure: Percent of children 0 through 17 years who are adequately insured. Source: The National Survey of Children's Health (NSCH). States can use data from the 2011-2012 NSCH as a baseline. Numerator: Parent report of children, ages 0 through 17 years, who were reported to be adequately insured, based on 3 criteria: whether their children’s insurance covers needed services and providers, and reasonably covers costs. If a parent answered “always” or “usually” to all three dimensions of adequacy, then the child was considered to have adequate insurance coverage. (No out-of-pocket costs were considered to be “always” reasonable.) Denominator: All children, 0 through 17 years Significance: Almost one-quarter of American children with continuous insurance coverage are not adequately insured. Inadequately insured children are more likely to have delayed or forgone care, lack a medical home, be less likely to receive needed referrals and care coordination, and receive family-centered care. The American Academy of Pediatrics highlighted the importance of this issue with a policy statement. The major problems cited were cost-sharing requirements that are too high, benefit limitations, and inadequate coverage of needed services.
Adequacy of Insurance Coverage in Delaware
Figure 1: Adequacy of Insurance According to the 2007 and 2011/12 National Survey of Children’s Health, a higher percentage of children were adequately insured in Delaware compared to national estimates in both survey yearsiv. However, the percentage of children adequately insured in Delaware declined between survey years 2007 and 2011/12. National estimates remained constant over this period. See Figure 1.
Source: 2007 & 2011/12 National Survey of Children’s Health Notes: 2003 Data not available. Parent report of children, ages 0 through 17 years. *Adequate insurance is defined by these criteria: child currently has health insurance coverage AND benefits usually or always meet child's needs AND usually or always allow child to see needed providers AND either has no out-of-pocket expenses or out-of-pocket expenses are usually or always reasonable. Five questions were used to create Indicator 3.4 (Adequate Insurance): current health insurance coverage (K3Q01); whether coverage is sufficient to meet the child's needs (K3Q20); whether the family pays some health care costs out of pocket (K3Q21A) and how often these costs are reasonable (K3Q21B); and whether insurance allows the child to see needed health care providers (K3Q22).
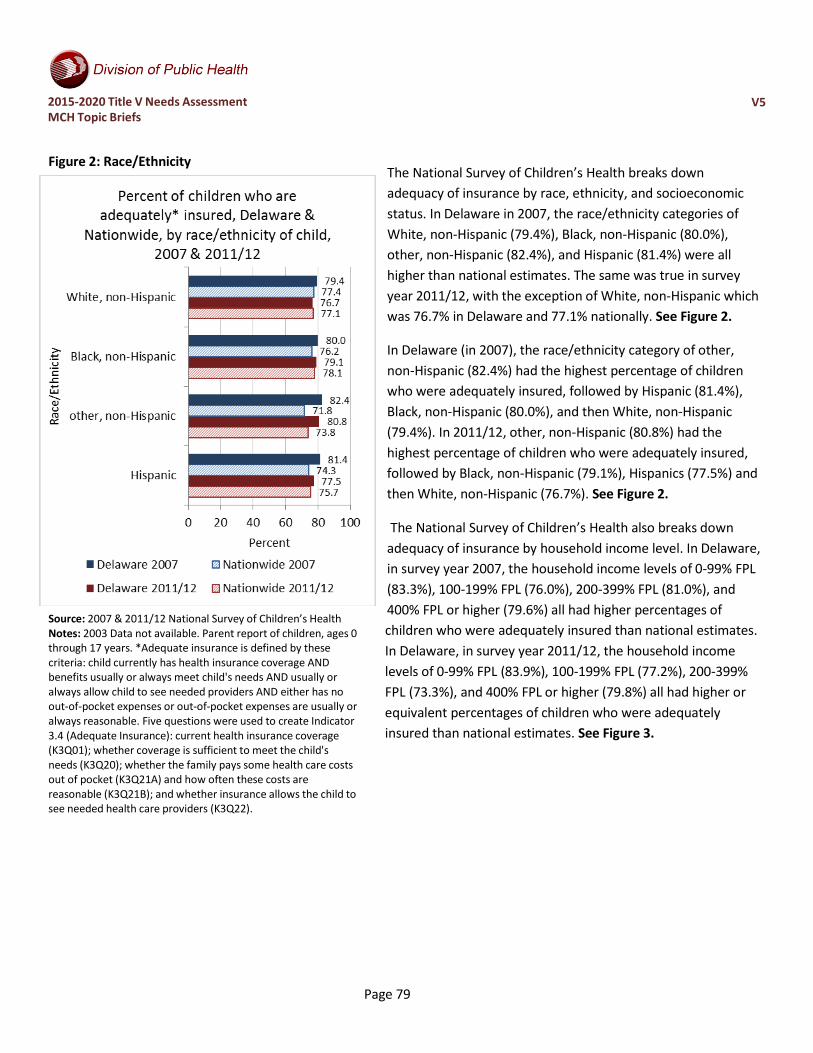
2015-2020 Title V Needs Assessment MCH Topic Briefs
V5
Page 79
Figure 2: Race/Ethnicity
Source: 2007 & 2011/12 National Survey of Children’s Health Notes: 2003 Data not available. Parent report of children, ages 0 through 17 years. *Adequate insurance is defined by these criteria: child currently has health insurance coverage AND benefits usually or always meet child's needs AND usually or always allow child to see needed providers AND either has no out-of-pocket expenses or out-of-pocket expenses are usually or always reasonable. Five questions were used to create Indicator 3.4 (Adequate Insurance): current health insurance coverage (K3Q01); whether coverage is sufficient to meet the child's needs (K3Q20); whether the family pays some health care costs out of pocket (K3Q21A) and how often these costs are reasonable (K3Q21B); and whether insurance allows the child to see needed health care providers (K3Q22).
The National Survey of Children’s Health breaks down adequacy of insurance by race, ethnicity, and socioeconomic status. In Delaware in 2007, the race/ethnicity categories of White, non-Hispanic (79.4%), Black, non-Hispanic (80.0%), other, non-Hispanic (82.4%), and Hispanic (81.4%) were all higher than national estimates. The same was true in survey year 2011/12, with the exception of White, non-Hispanic which was 76.7% in Delaware and 77.1% nationally. See Figure 2.
In Delaware (in 2007), the race/ethnicity category of other, non-Hispanic (82.4%) had the highest percentage of children who were adequately insured, followed by Hispanic (81.4%), Black, non-Hispanic (80.0%), and then White, non-Hispanic (79.4%). In 2011/12, other, non-Hispanic (80.8%) had the highest percentage of children who were adequately insured, followed by Black, non-Hispanic (79.1%), Hispanics (77.5%) and then White, non-Hispanic (76.7%). See Figure 2.
The National Survey of Children’s Health also breaks down
adequacy of insurance by household income level. In Delaware, in survey year 2007, the household income levels of 0-99% FPL (83.3%), 100-199% FPL (76.0%), 200-399% FPL (81.0%), and 400% FPL or higher (79.6%) all had higher percentages of children who were adequately insured than national estimates. In Delaware, in survey year 2011/12, the household income levels of 0-99% FPL (83.9%), 100-199% FPL (77.2%), 200-399% FPL (73.3%), and 400% FPL or higher (79.8%) all had higher or equivalent percentages of children who were adequately insured than national estimates. See Figure 3.

2015-2020 Title V Needs Assessment MCH Topic Briefs
V5
Page 80
Figure 3: Household Income Level
Source: 2007 & 2011/12 National Survey of Children’s Health Notes: 2003 Data not available. Parent report of children, ages 0 through 17 years. *Adequate insurance is defined by these criteria: child currently has health insurance coverage AND benefits usually or always meet child's needs AND usually or always allow child to see needed providers AND either has no out-of-pocket expenses or out-of-pocket expenses are usually or always reasonable. Five questions were used to create Indicator 3.4 (Adequate Insurance): current health insurance coverage (K3Q01); whether coverage is sufficient to meet the child's needs (K3Q20); whether the family pays some health care costs out of pocket (K3Q21A) and how often these costs are reasonable (K3Q21B); and whether insurance allows the child to see needed health care providers (K3Q22).
In Delaware, in survey year 2007, the household income level category of 0-99% FPL (83.3%) had the highest percentage of children who were adequately insured, followed by 200-399% FPL (81.0%), 400% FPL or higher (79.6%), and then 100-199% FPL (76.0%). In Delaware in survey year 2011/12, the household income level category of 0-99% FPL (83.9%) had the highest percentage of children who were adequately insured, followed by 400% FPL or higher (79.8%), 100-199% (77.2%), and then 200- 399% (73.3%). See Figure 3.

2015-2020 Title V Needs Assessment MCH Topic Briefs
V5
Page 81
Interest and Capacity to Address Issue As part of the 2015-2020 Title V Needs Assessment, maternal and child health stakeholders were asked to complete a survey to identify priority areas for addressing the health needs of Delaware’s women, mothers, and children. The survey questions provided stakeholders with different ways of expressing what they considered priority areas. With regard to adequate insurance coverage, the survey results show:
• Stakeholders were asked to rate their “top 7” health issues across 15 national priority areas. Adequate insurance was ranked 3rd out of the 15 areas, receiving 150 votes (out of 250 responses).
• Stakeholders were also asked to identify which among four areas was most important within the cross- cutting/life course domain. Adequate insurance coverage was rated #1out of the four (40% chose adequate insurance coverage, 30% chose oral health (for infants and children), 17% chose smoking cessation/prevention, and 12% chose oral health (for pregnant women).
Figure 4: Stakeholder Survey Results
Source: 2015 Delaware Title V MCH Stakeholder Survey Notes: Not all survey participants answered every question. The number of responses to questions varied from 250 to 305.
• Stakeholders were asked to assess the capacity of the Delaware Maternal and Child Health System to address improving adequate insurance coverage. More than three-fourths thought there was a strong desire to address this issue, but far fewer people though there were adequate resources (only 40%), progress being made (48%) or evidence-based strategies available (57%).
Related State and National Goals
Healthy People 2020 (Note: No objectives could be found regarding adequacy of health insurance.) AHS-1 Increase the proportion of persons with health insurance
AHS-1.1 (Leading Health Indicator) Increase the proportion of persons with medical insurance Leading Health Indicators are a subset of Healthy People 2020 objectives selected to communicate high-priority health issues.
Baseline: 83.2 percent of persons had medical insurance in 2008
Target: 100 percent

2015-2020 Title V Needs Assessment MCH Topic Briefs
V5
Page 82
There are no state goals or strategies related to this health area listed in the First Delaware State Health Improvement Plan or the Delaware Division of Public Health 2014-2017 Strategic Plan.
i Office of Disease Prevention and Health Promotion. (2015, March 16). Healthy People 2020 [Website]. Retrieved from http://www.healthypeople.gov/2020/topicsobjectives2020/default ii U.S. Department of Health and Human Services: Health Resources and Services Administration. (n.d.). Women’s Preventive Services Guidelines [Website]. Retrieved from www.hrsa.gov/womensguidelines iiiHealthCare.gov. (n.d.). Preventive care benefits: Preventive health services for children [Website]. Retrieved from https://www.healthcare.gov/preventive-care-benefits/children/ iv The Child & Adolescent Health Measurement Initiative. (2012). Data Resource Center for Child & Adolescent Health: Survey Results [Website]. Retrieved from http://www.childhealthdata.org/browse/survey/results?q=249&r=1&r2=9 and http://www.childhealthdata.org/browse/survey/results?q=2491&r=1