national principal investigator, - icmr.nic.in indiab phase i final report.pdf · burden of disease...
TRANSCRIPT


Compiled & Edited by: Dr. V. Mohan, National Principal Investigator, Madras Diabetes Research Foundation (MDRF) Dr. Tanvir Kaur, Scientist ‘E’, ICMR Dr. R.M. Anjana, Co-PI, MDRF & Dr. R. Guha Pradeepa, Co-PI, MDRF
Published in 2016
i
FOREWORD
It gives me great pleasure to write this Foreword for the final report of
the ICMR-INDIAB study (Phase I), which was conducted in the states
of Tamil Nadu, Maharashtra, Jharkhand and the Union Territory of
Chandigarh between 2008 and 2010. Non Communicable Diseases
(NCDs) have now become a major cause of death and account for
over 55% of all deaths in India. Diabetes represents one of the
important NCDs.
Reliable population based data on the burden of NCDs such as diabetes is necessary to plan
preventive and curative health services in the country. In this context, the ICMR-INDIAB study
gains significance as it is collecting representative data from the various States and Union
Territories in India. I am very happy to note that the Phase I of the ICMR-INDIAB study
representing the states of Tamil Nadu, Maharashtra, Jharkhand and the Union Territory of
Chandigarh has now been completed and the data has been compiled in a report. I am also
happy to hear that the results of these four regions have been shared with the respective state
governments. Data such as these are invaluable, as they provide a snap shot of the existing
burden of disease in the country.
I congratulate the Principal Investigators of various states who have been involved in collecting
these data, and the Madras Diabetes Research Foundation (MDRF) which is the national
coordinating centre for this study, as well as my colleagues at ICMR. I also wish to thank the
INDIAB Expert Committee Members for providing valuable guidance throughout the study. I
hope to see the other phases of the ICMR-INDIAB study also completed in a timely fashion and
the results presented and published in due course. I am sure this report will stimulate further
research on NCDs in our country.
Dr. Soumya Swaminathan Secretary, Department of Health
Research and Director General, ICMR

ii
PREFACE
It gives me great pleasure to write this Preface for the ICMR-INDIAB study
(Phase I) comprising of 4 regions of India and conducted between 2008
and 2010. The ICMR- INDIAB study is one of the first national studies to
look at the prevalence of diabetes, hypertension, obesity and dyslipidemia
in whole states of the country.
The study is being done in Phases and as the Chairman of the ICMR-INDIAB study Expert
Group or Committee Group, I am pleased to note that the first Phase of the study done in the
three states of Tamil Nadu, Maharashtra, Jharkhand and the Union Territory of Chandigarh, has
been completed and the final report is brought out. I am also happy to note that 8 publications
have come out of this phase of the ICMR INDIAB study till date. I hope that before long, the
other phases of the ICMR INDIAB study including the North Eastern states of India and the Rest
of India will also be completed so that we will have accurate and valuable data on the burden of
non communicable diseases such as diabetes, hypertension and obesity from urban and rural
areas of all parts of our country. Such data is extremely valuable to policy makers and other
stake holders.
I wish to congratulate the Principal Investigators of the various states for conducting and
completing the study in a timely manner and the Madras Diabetes Research Foundation
(MDRF), the National Coordinating Centre, for supervising the study. I am particularly happy
that the study has ensured capacity building in Non Communicable Diseases Prevention and
Control in the various states where the study is being done and particularly help individual
states in planning and policy formulation for Diabetes in the context of the disease status in their
urban and rural areas.
I commend Dr.Bela Shah, Head, NCD and her team at the Division of NCD, ICMR for facilitating
the planning and implementation of this nationally relevant study.
I am sure that this report will be useful to all researchers in this country and abroad.
Dr. Lalit M. Nath Chairperson
Expert Group, ICMR-INDIAB Task Force Project

iii
PREFACE
In recent years, there is reportedly a sharp increase in the number of
individuals sufferings with diabetes which has reportedly increased from
19 million in 1995 to 66.8 million in 2015 according to the International
Diabetes Federation. These figures are predicted to increase to 123.5
million by 2040. Most of the currently available estimates of diabetes
prevalence in India are regional and limited by small sample size. No
study on diabetes has systematically sampled all the states in the country
or even a whole state.
The Indian Council of Medical Research-India Diabetes (ICMR-INDIAB) study is aimed as a
representative national survey. The Phase I data from the ICMR-INDIAB study, conducted in
three states of Tamil Nadu, Maharashtra, Jharkhand and the Union Territory of Chandigarh
serves as an important benchmark and highlights areas for public health and policy action. This
Phase of the study has enhanced capacity building in combating Non Communicable Diseases
in these States. I am also happy to note that several publications have come from this study
which will help the scientific community and public health professionals in planning for
prevention and control of diabetes and other metabolic NCDs.
I gratefully acknowledge the role played by the National Principal Investigator and the State
Principal Investigators of Phase I in successfully conducting and completing the study in a
timely manner. I am grateful to Prof LM Nath, chairperson of ICMR-INDIAB Expert Group and
the members who have devoted their time and provided generous suggestions throughout the
planning and implementation of the study.
The ICMR–INDIAB study will help provide nation wide data and establish a national framework
for monitoring diabetes and cardiovascular risk factors in India.
Dr. Bela Shah Head, Division of NCD, ICMR

iv
MESSAGE
It gives me great pleasure to write a message for the final report for the
ICMR- India Diabetes INDIAB study-Phase I which was conducted in 3
states and 1 Union Territory of India viz., Tamil Nadu, Maharashtra,
Jharkhand and Chandigarh. India is a country with huge diversity. The
heterogeneous nature of the country means that studies done in one
part of the country cannot be extrapolated to another part, as there is so
much cultural, socio economic and other differences from one part of
the country to the other.
Hence, the Indian Council of Medical Research (ICMR) thought it fit to undertake a national
study. ICMR decided to undertake a study to obtain reliable data on the prevalence of diabetes,
hypertension, obesity, dyslipidemia and other non-communicable diseases in the various States
of India. The total sample size planned for the study is 1, 24,000 which will make it one of the
largest epidemiological studies on diabetes ever done. We are privileged that the Madras
Diabetes Research Foundation (MDRF) was chosen as the National Coordinating Centre to
execute the study. We were ably supported by the ICMR-INDIAB Expert Group. The Principal
Investigators of every state provided their full co-operation and support to the study. The ICMR
Headquarters and specially Dr. Bela Shah at Division of NCD and her team also extended their
full support and thanks to the great team work of all the stake holders, the study has already
been completed in 14 states and 1 Union Territory of the country. This report deals with the
results of the study in the first regions. The INDIAB study has already resulted in several
excellent publications and many more are to follow. On behalf of my colleagues at MDRF, we
extend our grateful thanks to ICMR and to the Department of Health Research (DHR) for their
support to the INDIAB study and we look forward to completing the study as early as possible.
Dr. V. Mohan National Principal Investigator,
ICMR-INDIAB Task Force Project, MDRF

v
ACKNOWLEDGEMENT
The various ongoing research programmes in non-communicable diseases
undertaken at the ICMR aim to identify risk factors, their prevention, health
services requirements and control strategies. This ICMR INDIAB study is a
joint effort of a large number of individuals and institutions to determine the
prevalence of type 2 diabetes mellitus and pre-diabetes in urban and rural
areas across India, by estimating the state-wise prevalence of the same.
It is my pleasure to acknowledge the dedication and determination of each
member who worked towards completing this phase of the study in these
four regions.
I would also take this opportunity to thank Dr. L.M. Nath, Chairman of the ICMR-INDIAB study
Expert Group for his constant guidance and support in conducting this study. The Chairman of
the Expert Group is specially acknowledged for his critical inputs, suggestions and his initiative
to ensure the quality of field data during the ICMR Expert Group audits.
I would like to express gratitude to Dr. VM Katoch, the former Secretary, Department of Health
Research (DHR) and Director General, Indian Council of Medical Research, for his interest and
understanding of the need to have this study implemented in the entire country so that reliable
and valuable national data will be available on the burden of NCDs such as diabetes,
hypertension and obesity. I also wish to thank Dr. Soumya Swaminathan, Secretary, DHR and
DG, ICMR for her support and encouragement.
I would like to acknowledge here the initiatives undertaken under the able guidance of Dr. Bela
Shah for this study. I would also like to thank Dr. D.K. Shukla, for his support. I would like to
thank Dr. V. Mohan for his support and coordination in finalizing this report. I would also like to
acknowledge the assistance provided by the ICMR administrative staff in this study.
The ICMR appreciatively acknowledges the valuable contribution of the Expert Group members,
the National Principal Investigator and all the Principal Investigators of the States for extending
their support in conducting this study.
Dr. Tanvir Kaur Programme Officer & Coordinator,
ICMR-INDIAB Task Force Project & Scientist ‘E, Division of NCD, ICMR

vi
Members of the Expert Group
Chairperson
Dr. Lalit.M.Nath Consultant in Community Medicine,
New Delhi
Members
Dr. Ashok Kumar Das Sr. Professor of Medicine & Head, Endocrinology, Pondicherry Institute of Medical Sciences, Puducherry
Dr. R.C. Mahajan Emeritus Professor Postgraduate Institute of Medical Education & Research, Chandigarh
Dr. P.V. Rao Former Senior Professor and Head, Department of Endocrinology and Metabolism, Nizam Institute of Medical Sciences University, Hyderabad
Dr. M.D. Gupte Ex-Director, National Institute of Epidemiology , Chennai
Dr .K. Ramachandran Retired Prof. of Biostatistics (AIIMS), Coimbatore
Dr. R. Lakshmy Professor, Cardiac Biochemistry, AIIMS, New Delhi
Dr. Arvind Pandey Director, National Institute of Medical Statistics, ICMR, New Delhi
Dr. S.V. Madhu Professor & Head , Department of Medicine & Head, Centre for Diabetes, Endocrinology & Metabolism UCMS-GTB Hospital, New Delhi
ICMR Secretariat
Dr. Bela Shah Head, NCD Division
Dr. D.K. Shukla Scientist ‘G’, NCD Division
Dr. Tanvir Kaur Scientist ‘E ‘, NCD Division

vii
Principal Investigators and Co-Investigators
Dr. V. Mohan National Coordinator & Principal Investigator
Director, Madras Diabetes Research Foundation, Chennai
State Principal Investigators
Dr. Anil Bhansali (Chandigarh Union Territory) Professor and Head, Department of Endocrinology , Postgraduate Institute of Medical Education and Research, Chandigarh
Dr. C.S. Yajnik (Maharashtra state) Director, Diabetes Unit, King Edward Memorial Hospital & Research Centre, Pune
Dr. V. K. Dhandhania (Jharkhand state) Department of Diabetology, Diabetes Care Center, Ranchi
Dr. Shashank.R. Joshi (Maharashtra state) Consultant Endocrinologist, Lilavati Hospital, Mumbai
Dr. Prashant P. Joshi (Maharashtra state) Associate Professor, Department of Medicine Indira Gandhi Government Medical College, Nagpur
Dr.V.Mohan (Tamil Nadu state) Director, Madras Diabetes Research Foundation, Chennai
Co- Principal Investigators
Dr. R. M. Anjana Madras Diabetes Research Foundation, Chennai
Dr. R. Guha Pradeepa Madras Diabetes Research Foundation, Chennai
Dr. M. Deepa Madras Diabetes Research Foundation, Chennai

viii
IMPLEMENTING INSTITUTION AND OTHER COLLABORATING INSTITUTIONS
Implementing Institution : Madras Diabetes Research Foundation No. 4, Conran Smith Road, Gopalapuram,
Chennai 600 086
Tel : (9144) 2835 9048 / 2835 9051/ 2835 9052
Fax : (9144) 2835 0935
Email : [email protected]
Website : www.drmohansdiabetes.com
Collaborating Institutions: 1. Postgraduate Institute of Medical Education and Research, Chandigarh
2. Diabetes Care Center, Ranchi 3. Indira Gandhi Government Medical College, Nagpur 4. Lilavati Hospital, Mumbai 5. King Edward Memorial Hospital & Research Centre, Pune
DATE OF COMMENCEMENT: 1st June 2008
DURATION: 3 years
DATE OF COMPLETION: 31st May 2011

ix
TABLE OF CONTENTS
1. Objectives of the study 1
2. Detailed Methodology 2
3. Results 19
4. Limitations 52
5. Conclusions 52
6. Significance of the study 53
7. Public health Implications 53
8. List of Publications 54
9. Abstract 56
10. Synoposis 57
11. Annexures 59

1
OBJECTIVES OF THE STUDY
OBJECTIVES GOALS
Primary 1. To determine the national prevalence of type 2
diabetes mellitus & pre-diabetes [Impaired fasting
glucose (IFG) / Impaired glucose tolerance (IGT)] in
India, by estimating the state-wise prevalence of the
same.
2. To compare the prevalence of type 2 diabetes and
pre-diabetes in urban and rural areas across India.
Secondary 1. To determine the prevalence of hypertension and
hyperlipidemia in urban and rural India.
2. To determine the prevalence of coronary artery
disease among subjects with and without diabetes.
3. To assess the level of diabetes control among self
reported diabetic subjects in urban and rural India.

2
DETAILED METHODOLOGY
EXPERIMENTAL WORK GIVING FULL DETAILS OF EXPERIMENTAL SET UP,
METHODS ADOPTED, DATA COLLECTED SUPPORTED BY NECESSARY TABLES,
CHARTS, DIAGRAMS AND PHOTOGRAPHS
The ICMR-INDIAB Study is a cross-sectional, community- based survey of adults of either
sex, aged 20 years and above, aimed at estimating the prevalence of diabetes and pre-diabetes
from all the 28 states, National Capital Territory (NCT) of Delhi and 2 union territories (UTs)
namely Chandigarh and Puducherry in the mainland of India (the other 4 union territories namely
Andaman and Nicobar Islands, Dadra and Nagar Haveli, Daman and Diu and Lakshadweep are
not being sampled due to logistic reasons). Each state, the National Capital Territory and the
Union Territories will have an urban component [towns including metros, (wherever applicable)]
and a rural component (villages). The study was initiated to estimate the prevalence of diabetes
in India in a phased manner. In Phase I, we have studied three states namely Tamil Nadu,
Maharashtra, Jharkhand and one Union Territory namely Chandigarh located in the south, west,
east and north of the country, respectively. Phase III, which is now ongoing includes the 8 north
eastern states of India namely Sikkim, Assam, Meghalaya, Tripura, Mizoram, Manipur, Nagaland
and Arunachal Pradesh. In Phase II, the rest of India is currently ongoing.
A. SAMPLING:
i. Sample size calculation:
The sample size was calculated separately for urban and rural areas [Table 1], as
previous studies show large variations in urban and rural prevalence of type 2 diabetes mellitus.
Assuming an expected prevalence of 10% in urban areas and 4% in rural areas, allowing a
relative error of 20% on these, a non response rate of 20% and an error of 5%, the sample size
was estimated to be 1200 in urban areas and 2800 in rural areas in each of the regions studied
[Table 2], with a total of 4,000 individuals / state and thus the total sample size for Phase I is
16,000 individuals.

3
Table 1: Sample size calculation for the ICMR- INDIAB study
Study-wise Sample size calculation
Prevalence (p)
q = (1-p)
Relative error (d)
= 20% of “p”
Sample Size per state (n)
n = Z2 (p) (q)
d2
Accounting for Non-responders [20%]
Approx
ICMR-INDIAB Phase I
Rural Diabetes =4 %
96% 20 X 4 = 0.8 %
100
n= (1.96)2 (4) (96)
(0.8)2
= 2304.96 = 2305
n = 20 X 2305 = 461
100
2305 + 461 = 2766
2800
Urban Diabetes = 10 %
90 % 2% (1.96)2 (10) (90)
(2)2
= 864.36 = 865
n = 20 X 865 = 173
100
865 + 173 = 1038
1200
Formula:
Sample size (n) = Z2 (p) (q)
d2
Z= Z statistic for a level of confidence. For the level of confidence of 95%, the conventional Z value is 1.96 {2 SD}
p= prevalence or proportion of the aspect being studied in the population.
q= (1-p)
d= relative error of the estimated prevalence.
Table 2: Total Sample size required for the ICMR- INDIAB - Phase I
Sample Size per state (n) No. of States in Phase
ITotal Sample Size
ICMR- INDIAB Phase I
Rural 28004
11200
Urban 1200 4800
Overall 4000 16000

4
ii. Sampling design:
A stratified multi-stage sampling design, [similar to the one employed in the National
Family Health Survey (NFHS - 3)] was adopted for this study. A two-stage design [Village-
Household] was used in rural areas, while a three-stage design [Wards – Census Enumeration
Blocks (CEBs)-Household] was adopted in urban areas [Figure1]. In both urban and rural areas,
three-level stratification was done based on geographical distribution, population size and female
literacy rate ( as a surrogate of socio-economic status) so as to provide a sample of individuals
that was truly representative of the population of the region under study.
The first level of stratification was based on geographic distribution with each State/UT
being divided into contiguous districts. This was based on the NFH3-3 sampling methodology.
The second level of stratification was based on population size to ensure that there was no
bias in the study and that all villages/wards, big and small, were represented in the sample
studied proportionate to their contribution to the total rural/urban population of a state. The
Probability Proportional to Population size (PPS) method was used to achieve this and arbitrary
cut offs were chosen. The third level of stratification was based on the rural/urban female
Figure 1: ICMR-INDIAB sampling frame work
Stratified multistage design [similar to the National Family Health Survey 3 (NFHS-3)]
Urban
Urban wards
Census Enumeration Block
Household
(3 stage design)Rural
Villages
Household
(2 stage design)
(3 level stratification) (3 level stratification)
5
literacy rate, which was used as a surrogate of socio-economic status, to ensure that the sample
of villages / wards selected is truly representative of the region studied.
The primary sampling units (PSUs) were villages in rural areas and Census Enumeration
Blocks (CEBs) in urban areas. In every village / CEB selected, a mapping and household listing
operation was carried out. The census location map was used to identify all the boundaries of the
selected sampling unit [village or CEB] correctly. If the boundaries of the sampling unit had
undergone change since the census location map was prepared, the team obtained assistance
from local authorities to identify the new boundaries and a boundary map was prepared using
standard mapping symbols in the form provided.
The household listing operation involved preparing up-to-date notional and layout sketch
maps, assigning numbers to structures, recording addresses or the location of the structures and
identifying residential structures in the selected villages. In rural areas with ≥ 500 households
(large sample villages) segmentation was done, and listing was carried out in two segments
selected at random. In urban areas from the list of selected wards provided, one CEB was
selected at random.
The ultimate stage units were households in both areas. Households were selected by
systematic sampling with a random start. In both rural and urban areas, only one individual was
selected within each household using the World Health Organization (WHO) ‘Kish method’
[STEPwise approach to surveillance (STEPS) World Health Organization (WHO)
http://www.who.int/chp/steps/en/]. The complete PSU list for each region is enclosed
(Annexures 1-4).
The three level stratification and sampling frame in rural and urban areas are given in
Figure 2 and 3 respectively.

6
State/UT
Rural Area
Stratified into regions containing contiguous districts
In each region, sub-stratification based on village population size & female literacy rate
In each stratum, villages selected by PPS method (50 villages selected/state)
In each village
56 Households –selected by systematic sampling (sample size in rural area 2800 ; 2800/50=56)
In each household
1 individual selected using KISH table
Figure 2: ICMR-INDIAB STUDY SAMPLING DESIGN IN RURAL AREAS
State/UT
Urban Area
Stratified into regions containing contiguous districts
In each region, sub-stratification done based on town population size & female literacy rate
In each stratum, wards selected by PPS method (50 wards selected/state)
In each ward
All Census Enumeration Blocks (CEBs) listed
1 CEB selected from each ward by random selection
In each CEB
All households listed
24 households –selected by systematic sampling (sample size in urban areas 1200: 1200/50=24)
1 individual selected from each household using KISH table
Figure 3: ICMR-INDIAB STUDY SAMPLING DESIGN IN URBAN AREAS
7
B. ETHICS COMMITTEE APPROVAL / CONSENT FORM:
Approval of the Madras Diabetes Research Foundation [MDRF] Institutional Ethics
committee was obtained prior to commencement of the study. Written informed consent
(Annexures 5) was obtained from respondents after ensuring that they understood and
accepted their role in the study.
C. TRAINING OF FIELD STAFF:
All field workers underwent intensive centralized training [Figures 4 & 5] at the Madras
Diabetes Research Foundation [MDRF] before commencing field work. The training programme
provided standardized training sessions on all aspects of the study. The field staffs were trained
to administer the questionnaires used in the study. In addition, they were trained in mapping and
listing procedures to systematically select the household and individual, to take anthropometric
measurements such as height, weight and waist and clinical measurements such as ECG
(electrocardiogram), blood pressure and pulse rate. They were also trained in blood glucose
measurement using the glucose meter (capillary blood glucose) and the lab technicians were
trained in venous blood collection. Training on quality assurance and quality control measures
was given to ensure quality in each and every step involved in the study. Details of various
procedures adopted in the study are provided in the annexures: Mapping (Annexure 6),
Segmentation & Household Listing (Annexure 7) and Selection of subject using KISH method
(Annexure 8). Training also included calibration of all equipment used in the study
(Annexure 9).
Training was done using printed and digital media aids (e.g. standardized videos dubbed
in local languages, handouts, show cards etc.) Field workers were also trained in rapport
building, communication skills and first-aid. All trainees were evaluated and certified at the end of
the training programme with a written as well a practical examination where intra- and inter-
observer variability was checked.

8
Figure 4: Questionnaire training to the field team
Figure 5: Training on anthropometry & clinical measurement
ANTHROPOMETRY , BLOOD PRESSURE & ECG TRAINING
Waistmeasurement
Weight measurement
Height measurement
ECG recordingBlood pressure recording
Questionnaire training session
Group discussion during training

9
D. QUALITY CONTROL:
Quality control refers to the efforts undertaken during the study, to monitor the quality of
data at identified points of data collection and processing. Quality control in the field was
achieved through multiple tiers of checks. In the first tier of quality control, the quality supervisors
performed daily checks on all questionnaires, anthropometric measurements, and biological
samples collected and/or recorded by the field personnel. The second tier of quality control was
carried out by quality managers who randomly chose 10 PSUs in each state for monitoring of
data collection. These occasions were also utilized for onsite training, refreshers, and/or
collecting repeat samples for validation. The state principal investigators provided a third tier of
quality control via regular field visits to supervise field activities. Finally, an external quality
monitoring team including members from the Indian Council of Medical Research Expert Group
made site visits to check the quality of data and onsite procedures [Figure 6].
During the monitoring visits, the various field activities were observed by the experts and
valuable inputs were provided to the field personnel. These visits by the experts greatly
motivated the field team and helped to assure quality of data collected. For the Chandigarh visit,
Dr. L.M.Nath, Dr. Anil Bhansali, Dr. Ashok Kumar Das, Dr. Tanvir Kaur, Dr. Shukla, Dr. V.Mohan
and Dr. Guha Pradeepa visited the field area. Field visits were made by the State Principal
Investigators, Dr. V.K.Dhandania for Jharkhand, Dr. Prashant Joshi for Maharashtra, Dr. Anil
Bhansali for Chandigarh and Dr. V.Mohan for Tamil Nadu [Figure 7]. The MDRF team
accompanied the State Principal Investigators for all the site visits.
Figure 6: Monitoring visits by experts from ICMR
Dr.Anil Bhansali, Dr.Ashok Kumar Das, Dr.V.Mohan, Dr.Tanvir Kaur (hidden), Dr.L.M.Nath and
Dr.Shukla during the monitoring visit

10
Figure 7: Site visits by the State Principal Investigators during Phase I
Of the ICMR-INDIAB survey
All field work and pre-field activities were documented using quality logbooks. Twenty two
quality logs have been utilized in this study and have helped ensure high standards of quality.
Table 3 shows the various documentations (quality logs) used in the study. These logs are
enclosed as Annexure 10.
CHANDIGARH
JHARKHAND
MAHARASHTRA
TAMILNADU
Dr.V.Mohan, Tamilnadu State PI Dr.V.K. Dhandania, Jharkhand State PI
Dr.Anil Bhansali, Chandigarh State PI Dr.Prashant Joshi, Maharashtra State PI

11
Table 3: Documentation (Quality logs) for the ICMR-INDIAB Study
S. No Format Name Format No.
1 Equipment Calibration Log - Stadiometer INDIAB 2008 -001
2 Equipment Calibration Log – Weighing Machine INDIAB 2008 -002
3 Equipment Calibration Log – Measuring Tape INDIAB 2008 -003
4 Equipment Calibration Log – BP Apparatus INDIAB 2008 -004
5 Equipment Calibration Log – Glucose meter INDIAB 2008 -005
6 Field Investigator Daily Log INDIAB 2008 -006
7 Wastage Log INDIAB 2008 -007
8 Interviewer Certification Rating Form INDIAB 2008 -008
9 Anthropometry Trainee Performance Checklist INDIAB 2008 -009
10 Blood Pressure Performance Checklist INDIAB 2008 -010
11 Blood Drawing Checklist (Venipuncture) INDIAB 2008 -011
12 Capillary One touch & Filter paper Checklist INDIAB 2008 -012
13 Electrocardiogram Performance Checklist INDIAB 2008 -013
14 Mapping &Segmentation Checklist INDIAB 2008 -014
15 QS- Courier log-Paper documents INDIAB 2008 -015
16 QS- Courier log-Biological Samples INDIAB 2008 -016
17 Courier Receipt Register-Pharmacy INDIAB 2008 -017
18 Courier Receipt register-Paper Documents INDIAB 2008 -018
19 Courier Receipt register- Biological Samples INDIAB 2008 -019
20 Item Transaction Register-Lab/Received Item Quality register-Lab INDIAB 2008 -020
21Item Transaction Register-Epidemiology/Received Item Quality register-Epidemiology
INDIAB 2008 -021
22Item Transaction Register- Nutrition/Received Item Quality register- Nutrition
INDIAB 2008 -022

12
E. FIELD TEAM COMPOSITION & RESPONSIBILITIES:
Each field team comprised of two Field Investigators (FIs), two Field Technicians (FTs)
and one Quality Supervisor (QS). Each region studied in Phase I had five such teams and two
Quality Managers (QMs) to monitor the field activities. An additional team was later included to
speed up the study. Figure 8 depicts the field team composition in each region. The job
responsibilities of FI, FT, QS and QM are provided in Annexure 11.
F. STUDY PARAMETERS:
Inclusion criteria:
The inclusion criteria listed below were applied during recruitment of subjects for the study:
All adults (both men & women) aged 20 years and above.
Usual resident of the selected locality.
Willing to provide written consent to participate in the study.
Mentally stable to provide the details required for the study.
FIGURE 8: FIELD TEAM COMPOSITION IN EACH REGION
Stratified multistage design [similar to the National Family Health Survey 3 (NFHS-3)]2 QUALITY MANAGERS
SIX TEAMS
1 QUALITY SUPERVISOR
2 FIELD INVESTIGATORS&
2 FIELD TECHNICIANS
EACH FIELD TEAM

13
An interviewer-administered questionnaire was used to obtain demographic, behavioural and
medical information. Weight, height, and waist circumference were measured and body mass
index (BMI) was calculated. Blood pressure was recorded using an electronic instrument (Model:
HEM-7101, Omron Corporation, Tokyo, Japan) as the mean of two readings taken five minutes
apart.
In addition, in every 5th subject (n=2046), a fasting venous sample was collected and
assayed for total cholesterol, triglycerides and HDL cholesterol. LDL cholesterol was calculated.
A resting 12-lead electrocardiogram (ECG) was carried out in these subjects. The questionnaire
[Annexure 12] and show cards [Annexure 13] used for the study are enclosed. A quick guide to
field operations was developed incorporating all necessary details required by the field staff for
their ready reference in the field [Annexure 14].
In all 16,000 subjects the following was administered:
A structured questionnaire was used to obtain data on demography, personal details
(smoking, alcohol etc.), family income, physical activity level, medical history and family
history of diabetes and heart disease [Annexure 12].
Anthropometric measurements including height, weight, waist and hip measurements.
Measurement of blood pressure [OMRAN electronic equipment] and pulse rate.
Capillary blood glucose measured using glucose meter. An oral glucose tolerance test
[OGTT] was done using a 75 gms oral glucose load and the 2 hour post load capillary
blood sugar was estimated. In self-reported diabetic subjects, only fasting capillary
blood glucose was measured.
In every 5th subject (n= 3,200) the following was administered in addition to the above
mentioned parameters:
A fasting venous sample for measurement of lipids and creatinine. Aliquots from this
sample have been stored for future use (3,962 aliquots out of 1,981 subject’s serum
samples are currently available at MDRF – Details of the stored samples are enclosed
in Annexure 15).
A nutrition questionnaire was also administered to obtain information on fruit and
vegetable intake, oil and salt intake etc.,
An ECG was also done.

14
In all diabetic subjects the following parameters were also studied:
An ECG was done.
In addition, a fasting venous sample was drawn for lipids as well as HbA1c.
G. JUSTIFICATION FOR USING CAPILLARY BLOOD GLUCOSE:
Fasting capillary blood glucose [CBG] was determined using One Touch Ultra glucose
meter (Johnson & Johnson, Milpitas, California) after eight hours of overnight fasting. Oral
glucose 82.5 grams [equivalent to 75 grams of anhydrous glucose] was given and a 2-hour post
load CBG was collected. In individuals with self-reported diabetes, only fasting CBG was
measured. CBG estimation was adopted in favour of venous plasma glucose estimations as it
was neither practical nor feasible to collect, handle, and store such a large volume of samples in
an epidemiological study of this magnitude. Moreover, when CBG estimation was compared to
venous plasma glucose [VPG] estimation, based on the WHO criteria, 43.2% of subjects had
diabetes by the CBG method, whereas 38.6% of subjects had diabetes by the VPG method
(k =0.816, P<0.001)”, which indicate good correlation between the two methods.
The Pearson’s correlation between the capillary whole blood method and the venous
plasma glucose method in the fasting state was r=0.681, while for the 2 hour post glucose state it
was r=0.897. Figure 9 shows the regression between capillary blood glucose and venous
plasma samples in the fasting state and in the 2 hour post-glucose load indicating good
correlation between the two methods. The Bland and Altman Plot [Figure 10] drawn to study the
limits of agreement between the capillary whole blood and venous plasma methods indicates
good agreement between the two methods both in the fasting as well as the 2 hour post glucose
states.

15
Figure 9: Regression analysis comparing venous plasma glucose [lab] and capillary OneTouch® Ultra® glucose concentrations
Figure 1a: Fasting Figure 1b: Two hour post glucose Load
Laboratory estimation of fasting plasma venous glucose [mg/dL]Laboratory estimation of 2 Hour post glucose load plasma
venous glucose [mg/dL]
Cap
illa
ry 2
Ho
ur
po
st G
luco
se L
oad
Blo
od
Su
gar
[O
neT
ou
ch®
Ult
ra®]
Cap
illa
ry F
asti
ng
Blo
od
Su
gar
[O
neT
ou
ch®
Ult
ra®]
0
100
200
300
400
500
600 Slope= 0.890, SE 0.022
Intercept= 46.362, SE 4.25
r-value= 0.897
Slope= 0.668, SE 0.035
Intercept= 45.896; SE 4.321
r-value= 0.681
0
100
200
300
400
500
600
0 100 200 300 400 500 6000 100 200 300 400 500 600
Mean7.7
-1.96 SD
-52.9
+1.96 SD68.3
-200
-100
0
200
300
400
100 200 300 400 500 600Dif
fere
nc
e b
etw
ee
n V
eno
us
Pla
sma
an
d C
ap
illa
ry B
loo
d
Glu
co
se
co
nce
ntr
ati
on
s (m
g/d
l
Average of venous plasma and capillary glucose concentrations (mg/dL)
Dif
fere
nc
e b
etw
ee
n V
en
ou
s P
las
ma
an
d C
ap
illar
y B
loo
d
Glu
co
se
co
nc
entr
ati
on
s (
mg
/dl
Average of venous plasma and capillary glucose concentrations (mg/dL)
Figure 10: Bland and Altman Plot of venous plasma glucose [lab] and capillary OneTouch® Ultra® glucose concentrations
Figure 2a: Fasting Figure 2b: Two hour post glucose load
100
Mean27.0
-1.96 SD
-48.1
+1.96 SD102.2
-200
-100
0
100
200
400
0 100 200 300 400 500 600
300
0

16
H. REFERRAL SYSTEM:
All newly diagnosed diabetic subjects were asked to confirm their diabetes with a venous
OGTT or repeat plasma glucose values at the local public health center, at a government
medical college hospital, or with a private practitioner who specializes in diabetes care, whose
details were provided by field investigators on request [Annexure 16a]. A result slip was
provided to all subjects in the field with details of their anthropometry, blood pressure and
capillary blood glucose measurements. Their lipids and electro cardiogram reports were posted
to them at a later date [Annexure 16b]. All subjects were given a copy of their test results.
Educational material on diet and life style modifications was also provided.
I. STABILITY OF HBA1C IN STORED BLOOD SAMPLES:
The stability of HbA1c in blood samples stored at -20°C up to a month was tested at
Madras Diabetes Research Foundation. This study was conducted in a sample of 142 self-
reported diabetic subjects. HbA1c assay was done on the fasting blood sample on Day 0 (day of
blood sample collection) and several aliquots were stored in the deep freezer at -20°C. The
assay was repeated with the aliquots of the blood samples on 3rd, 7th, 15th and 30th day. HbA1c
levels were measured using the Biorad Variant machine. Statistical analysis was done
considering HbA1c levels of Day 0 as gold standard. Scatter plot comparison between HbA1c
levels of Day 0 and 3rd, 7th, 15th and 30th days were shown in Figure 11.
Day 012.0010.008.006.004.002.000.00
Day 3
12.00
10.00
8.00
6.00
4.00
2.00
0.00
Day 012.0010.008.006.004.002.000.00
Day 7
12.00
10.00
8.00
6.00
4.00
2.00
0.00
Day 012.0010.008.006.004.002.000.00
Day
15
12.00
10.00
8.00
6.00
4.00
2.00
0.00
Day 012.0010.008.006.004.002.000.00
Day
30
12.00
10.00
8.00
6.00
4.00
2.00
0.00
Figure 11: Scatter plot comparison between HbA1c levels of Day 0 and 3rd, 7th, 15th and 30 Days

17
No significant underestimation or overestimation in HbA1c levels measured on 3rd, 7th,
15th, and 30 days, which assures the stability of HbA1c in blood samples stored at -20°C up to a
month.
J. DEFINITIONS USED:
Diabetes: Individuals diagnosed by a physician and on anti-diabetic medications (self-reported)
and/or those who had fasting capillary blood glucose (CBG) ≥126 mg/dl and/or 2-hr post-glucose
CBG value ≥220 mg/dl [World Health Organization (WHO) criteria].
Impaired fasting glucose [IFG]: Fasting CBG ≥110 mg/dl and <126 mg/dl and 2-hr post-
glucose value <160 mg/dl [WHO criteria].
Impaired glucose tolerance [IGT]: Two-hour post-glucose CBG ≥160 mg/dl but <220 mg/dl and
fasting value <126 mg/dl [WHO criteria].
Prediabetes: Individuals with IFG or IGT or both.
Hypertension: Individuals with systolic blood pressure (SBP) ≥140 mmHg, and/or diastolic blood
pressure (DBP) ≥90 mmHg and/or on treatment with anti-hypertensive drugs [Joint National
Committee (JNC) 7 Criteria].
Dyslipidemia: Individuals with total cholesterol ≥200mg/dl or triglycerides ≥150mg/dl or HDL
cholesterol <40 (males) and <50 mg/dl (females) or on drug treatment for dyslipidemia [National
Cholesterol Education Programme (NCEP) guidelines].
Obesity: Generalized obesity (BMI ≥25 kg/m2) and abdominal obesity (WC ≥90cm in males and
≥80cm in females) were defined using WHO Asia Pacific guidelines.
Metabolic syndrome: Metabolic syndrome was defined as the presence of any three risk factors
– hyperglycemia Fasting (CBG ≥110 mg/dl), high blood pressure, abdominal obesity,
hypertriglyceridemia and low HDL cholesterol [South Asian Modified (SAM)–NCEP criteria].
Coronary artery disease (CAD): CAD was diagnosed on the basis of documented history of
myocardial infarction (MI) or drug treatment for CAD and/or Minnesota codes 1-1-1 to 1-1-7 (Q-
wave changes), 4-1 to 4-2 (ST segment depression) or 5-1 to 5-3 (T-wave abnormalities).

18
K. STATISTICAL ANALYSIS:
The study population was weighted for calculating prevalence rates [Annexure 17 a-d].
Sample weights were calculated using the National Family Health Survey (NFHS 3) model,
which is designed for self weighting at the domain level. The domains were urban and rural
areas of each state/UT. The design weight is the inverse of the overall sampling fraction in each
domain. The overall sampling fraction is the product of the selection probabilities at each
sampling stage (two stages in rural areas and three stages in urban areas).The design weight
was adjusted for household non-response in the calculation of the household sampling weight.
The household sampling weight was further adjusted for individual non-response to obtain the
individual sampling weight. Both adjustments for non-response were done at the domain level in
order to preserve the self-weighting nature of the sample within domains. The sampling weights
were further normalized at the state level to obtain standard state weights. The state standard
weights were calculated to ensure that the total number of weighted cases equals the total
number of unweighted cases for each state.

19
RESULTS
DETAILED ANALYSIS OF RESULTS INDICATING CONTRIBUTIONS MADE
TOWARDS INCREASING THE STATE OF KNOWLEDGE IN THE SUBJECT.
Phase I of the ICMR-INDIAB study has been successfully completed in 4 regions namely,
Tamil Nadu, Jharkhand, Chandigarh and Maharashtra.
A. Phase I recruitment status and response rate:
In Tamil Nadu, of the total 4,216 individuals selected to be interviewed in 105 PSUs (52
urban PSU and 53 rural PSU), 3,664 individuals participated in the study (86.9% response rate).
In Jharkhand, of the total 4,000 individuals to be interviewed in all 100 PSUs (50 urban PSU and
50 rural PSU) 3,337 individuals participated in the study (83.4% response rate). In Chandigarh,
of the total 3,991 individuals to be interviewed in all 44 PSUs (21 urban PSU and 23 rural PSU),
3,356 individuals participated in the study (84.1% response rate) and in Maharashtra, of the total
4,400 individuals to be interviewed in all 114 PSUs (62 urban PSU and 52 rural PSU) 3,920
individuals participated in the study (89.1% response rate). Figures 12 and 13 depicts the
primary sampling units (PSUs) selected in urban and rural areas of the selected states.
Figure 12: PSUs selected in urban and rural Tamilnadu and Jharkhand
JHARKHAND STATE

20
The state wise detailed response rate is shown in Table 4. The proportion of selected
subjects not available during the study period is high in urban areas compared to rural areas in
all 4 regions and it ranged from 2.5% in rural Tamil Nadu to 8.5% in urban Chandigarh. Houses
remained locked and subjects could not be contacted in 0.5 to 4.3% of households and 4.3 to
13.6% of subjects refused to participate even after repeated visits and requests.
Figure 13: PSUs selected in urban and rural Chandigarh and Maharashtra

21
Overall, of the 16,607 subjects selected for the study, 14,277 [86%] subjects participated,
of whom 13,055 gave blood samples. Responders and non-responders were compared and
there were no significant differences in the general characteristics between the 13,055
‘responders’ and the 1,222 ‘non-responders’ with respect to age, weight, height, BMI, and waist
circumference in all 4 regions studied.
B. General characteristics of the study population:
Figure 14 shows the gender distribution of the study subjects in ICMR-INDIAB survey
compared to the Census of India, 2001. The gender distribution of all four regions almost exactly
matches with the census population showing that the survey is representative of each region
studied.
StatusTamil Nadu Jharkhand Chandigarh Maharashtra
Urban RuralOver
allUrban Rural
Overall
Urban RuralOver
allUrban Rural
Overall
Completed n(%)
1076
(86.2)
2588
(87.2)
3664
(86.9)
945
(78.8)
2392
(85.4)
3337
(83.4)
911
(77.5)
2445
(87.0 )
3356
(84.1)
1254
(84.3)
2666
(91.6)
3920
(89.1)
Respondent not available
n(%)
93(7.3)
73(2.5)
166(3.9)
50(4.2)
114(4.1)
163(4.1)
100(8.5)
117(4.2)
217(5.4)
60(4.0)
90(3.1)
150(3.4)
Refusedn(%)
71(5.7)
287(9.7)
358(8.5)
163(13.6)
173(6.1)
333(8.3)
136(11.6)
191(6.8)
327(8.2)
147(9.9)
125(4.3)
272(6.2)
House locked n(%)
6(0.5)
19(0.6)
25(0.6)
39(3.3)
119(4.3)
162(4.1)
29(2.5)
49(1.7)
78(2.0)
25(1.7)
24(0.8)
49(1.1)
Others n(%)
2(0.2)
1(0.03)
3(0.1)
3(0.3)
2(0.7)
5(0.1)
--
13(0.5)
13(0.3)
2(0.1)
7(0.2)
9(0.2)
Table 4: State wise response rate for Phase I of the study
Responses are after repeated visits (at least 3) Partially completed
*
***
*
**

22
Table 5 shows the educational status of the study population. Jharkhand had the highest
number of subjects with no formal schooling (urban: 20.8% and rural: 58.1%) compared to other
Phase I regions. In urban areas, Chandigarh had the highest proportion of subjects with higher
educational status i.e., undergraduate degree or above (17.7%) followed by Jharkhand (13.8%),
Maharashtra (10.3%) and Tamil Nadu (10.2%). In rural areas also, Chandigarh had the highest
proportion of subjects with higher educational status (5.5%) followed by Maharashtra (3.8%),
Tamil Nadu (3%) and Jharkhand (1.3%).
51.1 48.648.9 51.4
0
10
20
30
40
50
60
Male Female
Pro
po
rtio
n o
f s
ub
ject
s
(%)
51.1 48.950.6 49.4
0
10
20
30
40
50
60
Male Female
49.6 50.450.6 49.4
0
10
20
30
40
50
60
Male Female
51.4 48.649.8 50.2
0
10
20
30
40
50
60
Male Female
Tamilnadu Jharkhand
Chandigarh Maharashtra
Census ICMR-NDIAB
Figure 14: Gender Distribution of study subjects in ICMR-INDIAB compared to the census 2001
Pro
po
rtio
n o
f s
ub
jec
ts
(%)
Pro
po
rtio
n o
f s
ub
jec
ts
(%)
Pro
po
rtio
n o
f s
ub
jec
ts
(%)
Tamil Nadu

23
Table 5: Educational status of the study population
Educational statusTamil Nadu (%) Chandigarh (%) Jharkhand (%) Maharashtra (%)
Urban Rural Urban Rural Urban Rural Urban Rural
No formal schooling 17.7 35.4 14.3 22.5 20.8 58.1 16.9 35.9
Primary school 48.8 47.8 24.2 29.4 21.9 22.1 34.7 34.6
High school & higher secondary school
20.0 12.0 41.2 40.3 39.2 18.1 35.9 24.6
Technical education 3.3 1.8 2.7 2.3 4.3 0.5 2.3 1.0
Undergraduate degree 7.6 2.2 15.4 5.0 11.7 1.2 8.6 3.2
PG degree or above 2.6 0.8 2.3 0.5 2.1 0.1 1.7 0.6
Table 6: Occupational status of the study population
Occupational statusTamil Nadu (%) Chandigarh (%) Jharkhand (%) Maharashtra (%)
Urban Rural Urban Rural Urban Rural Urban Rural
n 1071 2582 909 2439 934 2389 1250 2657
Professional /Executive /Manager/Big business
6.2 1.7 10.3 3.5 9.0 1.5 6.0 2.2
Clerical /Medium business
1.7 0.6 6.4 4.1 5.4 0.7 4.7 1.1
Sale 4.8 2.1 8.2 6.4 7.6 3.4 5.6 8.3
Agriculture/Self-employed
11.2 43.5 2.7 4.3 6.9 24.3 6.5 39.3
Household & domestic work
2.7 0.5 2.4 1.0 5.3 2.6 6.7 3.0
Services 3.2 1.9 7.9 5.2 2.3 1.7 5.7 3.8
Skilled manual 16.3 8.5 8.1 16.9 8.3 5.7 13.9 9.2
Unskilled manual 14.4 10.3 5.2 9.8 6.7 13.2 8.5 6.0
Do not work/Unemployed
38.4 30.3 48.2 48.5 46.9 46.7 41.8 26.7
Others 0.9 0.6 0.3 0.1 0.5 0.1 0.5 0.1

24
Table 6 shows the occupational status of the study population. Professionals or
executives or managers or those involved in big business were found in higher proportion in
urban areas with 10.3% in Chandigarh followed by 9% in Jharkhand, 6.2% in Tamil Nadu and
6% in Maharashtra. Subjects involved in agriculture or those self-employed were more in rural
areas with 43.5% in Tamil Nadu followed by 39.3% in Maharashtra, 24.3% in Jharkhand and
4.3% in Chandigarh. In urban areas, the unemployed proportion ranged from 38.4% in Tamil
Nadu to 48.2% in Chandigarh and in rural areas, it ranged from 26.7% in Maharashtra to 48.5%
in Chandigarh.
The general characteristics of the study population, comparing urban and rural areas in
all the four regions is shown in Tables 7-10. In Tamil Nadu and Chandigarh, the urban residents
were significantly older, heavier, had higher BMI, waist circumference and blood pressure
compared to the rural residents. In Jharkhand, the urban residents were significantly taller,
heavier and had higher BMI, waist circumference and blood pressure compared to the rural
residents. In Maharashtra, the urban residents were significantly younger, taller, heavier and had
higher BMI, waist circumference and diastolic blood pressure compared to the rural residents.
Table 7: General characteristics of the study population [Tamil Nadu state]
Parameters Urban Rural P-value
N 1076 2586
Age (yrs) 41 ± 14 43 ± 15 < 0.001
Height (cms) 157.4 ± 9.4 157.0 ± 8.9 0.289
Weight (Kgs) 58.6 ± 12.7 53.6 ± 11.0 < 0.001
BMI 23.6 ± 4.6 21.7 ± 3.9 < 0.001
Waist (cms) 80.9 ± 12.2 76.1 ± 11.5 < 0.001
BP Systolic (mmHg) 130 ± 19 128 ± 19 0.005
BP Diastolic (mmHg) 81 ± 11 78 ± 11 0.002

25
Table 8: General characteristics of the study population [Jharkhand state]
Parameters Urban Rural P-value
N 945 2388
Age (yrs) 40 ± 14 40 ± 14 0.774
Height (cms) 157.2 ± 9.4 155.4 ± 8.8 < 0.001
Weight (Kgs) 56.3 ± 13.2 46.7 ± 9.3 < 0.001
BMI 22.7 ± 4.7 19.2 ± 3.0 < 0.001
Waist (cms) 80.8 ± 13.6 71.4 ± 10.4 < 0.001
BP Systolic (mmHg) 130 ± 19 126 ± 19 < 0.001
BP Diastolic (mmHg) 79 ± 11 76 ± 11 < 0.001
Table 9: General characteristics of the study population [Chandigarh state]
Parameters Urban Rural P-value
N910 2445
Age (yrs)40 ± 13 34 ± 12 <0.001
Height (cms)159.3 ± 9.5 158.8 ± 9.1 0.329
Weight (Kgs)61.9 ± 13.1 57.7 ± 12.8 <0.001
BMI24.4 ± 4.7 22.8 ± 4.5 <0.001
Waist (cms)83.8 ± 12.5 79.7 ± 12.7 <0.001
BP Systolic (mmHg)130 ± 18 124 ± 16 <0.001
BP Diastolic (mmHg)79 ± 11 76 ± 11 <0.001
Table 10: General characteristics of the study population [Maharashtra state]
Parameters Urban Rural P-value
N 1254 2666
Age (yrs) 40 ± 14 42 ± 15 <0.001
Height (cms) 157.7 ± 9.6 156.9 ± 9.3 0.013
Weight (Kgs) 55.4 ± 12.3 50.7 ± 11.2 <0.001
BMI 22.2 ± 4.4 20.5 ± 3.8 <0.001
Waist (cms) 77.3 ± 12.4 72.7 ± 11.7 <0.001
BP Systolic (mmHg) 128 ± 19 127 ± 18 0.111
BP Diastolic (mmHg) 80 ± 12 77 ± 11 <0.001

26
The biochemical parameters of the study population comparing urban and rural areas in all
four regions are shown in Tables 11-14. In Tamil Nadu, the urban residents had significantly
higher cholesterol, triglycerides, LDL cholesterol and glycated haemoglobin and lower HDL
cholesterol compared to rural residents. In Jharkhand, the urban residents had significantly
higher cholesterol, triglycerides, LDL cholesterol and glycated haemoglobin compared to rural
residents. In Chandigarh, the urban residents had significantly higher cholesterol, LDL
cholesterol and glycated haemoglobin compared to rural residents. In Maharashtra, the urban
residents had significantly higher cholesterol, triglycerides and glycated haemoglobin compared
to rural residents.
Table 11: Biochemical parameters of the study population (In a subset) [Tamil Nadu state]
ParametersUrban
(n=195)Rural
(n=465)P-value
Total Cholesterol (mg/dL) 172 ± 48 165 ± 37 0.031
Triglycerides (mg/dL)* 122 114 0.032
HDL (mg/dL) 38 ± 10 40 ± 12 0.044
LDL (mg/dL) 104 ± 36 98 ± 31 0.047
Creatinine (mg/dL) 0.86 ± 0.24 0.87 ± 0.24 0.528
HBA1C (%) 6.0 ± 1.2 5.8 ± 1.0 0.009
* Geometric mean
Table 12: Biochemical parameters of the study population (In a subset) [Chandigarh state]
ParametersUrban
(n=154)Rural
(n=364)P-value
Total Cholesterol (mg/dL) 170 ± 41 155 ± 38 <0.001
Triglycerides (mg/dL)* 140 127 0.151
HDL (mg/dL) 40 ± 12 39 ± 11 0.441
LDL (mg/dL) 98 ± 33 86 ± 31 <0.001
Creatinine (mg/dL) 0.69 ± 0.19 0.73 ± 0.17 <0.001
HBA1C (%) 5.8 ± 1.3 5.5 ± 1.1 0.009
* Geometric mean

27
Table 13: Biochemical parameters of the study population (In a subset) [Jharkhand state]
ParametersUrban
(n=133)Rural
(n=278) P-value
Total Cholesterol (mg/dL) 158 ± 40 128 ± 29 <0.001
Triglycerides (mg/dL)* 132 96 <0.001
HDL (mg/dL) 38 ± 11 37 ± 10 0.248
LDL (mg/dL) 88 ± 31 70 ± 23 <0.001
Creatinine (mg/dL) 0.73 ± 0.22 0.72 ± 0.27 0.891
HBA1C (%) 5.4 ± 1.1 5.0 ± 0.6 <0.001
* Geometric mean
Table 14: Biochemical parameters of the study population (In a subset) [Maharashtra state]
ParametersUrban
(n=116)Rural
(n=362)P-value
Total Cholesterol (mg/dL) 164 ± 35 159 ± 36 0.165
Triglycerides (mg/dL)* 118 105 0.065
HDL (mg/dL) 42 ± 16 40 ± 13 0.397
LDL (mg/dL) 94 ± 29 94 ± 33 0.979
Creatinine (mg/dL) 0.8 ± 0.2 0.8 ± 0.3 0.816
HBA1C (%) 5.7 ± 1.3 5.5 ± 1.3 0.155
* Geometric mean
C. Results of Phase I – results of Primary Objectives 1 & 2 are presented
together:
Primary Objective 1: To determine the national prevalence of type 2 diabetes mellitus & pre-
diabetes [Impaired fasting glucose (IFG) / Impaired glucose tolerance (IGT)] in India, by
estimating the state-wise prevalence of the same.
Primary Objective 2: To compare the prevalence of type 2 diabetes and pre-diabetes in urban
and rural areas across India.

28
The weighted prevalence of diabetes (both self-reported and newly diagnosed diabetes)
in the urban and rural population of the four regions is shown in Figure 15. In Tamil Nadu, the
prevalence of diabetes in urban areas (13.7%) is almost double the rate found in rural areas
(7.8%). In Jharkhand, the prevalence of diabetes in urban area is four fold higher than rural
areas (urban: 13.5% vs. rural: 3%, p<0.001). In Chandigarh, the prevalence of diabetes in urban
is higher than the rates in rural areas (urban: 14.2% vs. rural: 8.3%, p<0.001). In Maharashtra
also, the prevalence of diabetes in urban is higher than the rates in rural areas (urban: 10.9% vs.
rural: 6.5%, p<0.001). In Chandigarh, the prevalence of diabetes, both in urban and rural areas
was higher than in other three regions, viz., Tamil Nadu, Jharkhand and Maharashtra.
Overall, in all four regions studied, the prevalence of diabetes was higher in urban,
compared with rural areas. This difference was most marked in Jharkhand, where rural–urban
disparities in socioeconomic status are among the highest in India. This could be because urban
Jharkhand is built around industries and hence the population is a mix of people of several
cultures and states. Rural Jharkhand is really quite poor and has very low obesity rates.
Chandigarh was found to have the highest prevalence of diabetes, in both urban (14.2%) and
13.7
7.8
0
2
4
6
8
10
12
14
16
Urban Rural
Pre
val
en
ce
of
dia
bet
es
(%)
Tamilnadu Jharkhand
Chandigarh Maharashtra
Figure 15: Prevalence* of diabetes in the urban and rural population in all the 4 regions studied
13.5
3
0
2
4
6
8
10
12
14
16
Urban Rural
Pre
vale
nc
e o
f d
iab
etes
(%
)
10.9
6.5
0
2
4
6
8
10
12
14
16
Urban Rural
Pre
vale
nc
e o
f d
iab
etes
(%
)
14.2
8.3
0
2
4
6
8
10
12
14
16
Urban Rural
Pre
vale
nce
of
dia
be
tes
(%
)
*Weighted prevalence
p<0.001 p<0.001
p=0.004 p<0.001
Tamil Nadu

29
rural (8.3%) areas. This is not unexpected, as Chandigarh serves as the joint capital of Punjab
and Haryana, two prosperous states in India. Moreover, in Chandigarh the rural areas are not
really “rural”, but a suburb of an urban area.
Figure 16 shows the weighted prevalence of diabetes (self-reported, newly diagnosed
and overall diabetes) in the urban and rural population of the four regions. Only in Tamil Nadu
(both urban and rural) and in urban Jharkhand, the proportion of subjects with self-reported
diabetes is higher than newly diagnosed diabetes and in all other regions, the proportion of newly
diagnosed diabetes is higher than self-reported diabetes.
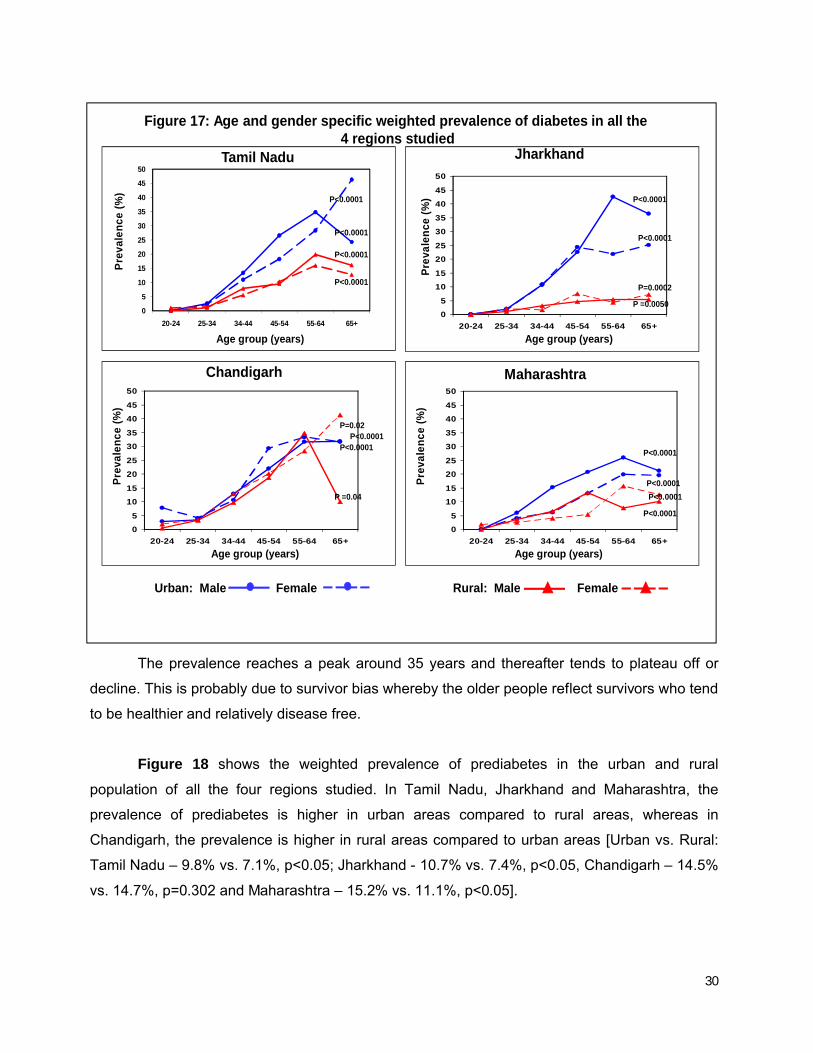
Figure 17 presents the age and gender specific prevalence of diabetes in urban and rural
population. In all 4 regions, the take-off point in prevalence was in the age group 25-34 years. At
every age interval, the prevalence of diabetes in urban areas was higher compared to rural
areas.
8.5
4.15.2
3.8
13.7
7.8
0
2
4
6
8
10
12
14
16
Urban Rural
Pre
vale
nce
of
dia
bet
es (
%)
8.4
0.7
5.1
2.3
13.5
3
0
2
4
6
8
10
12
14
16
Urban Rural
Pre
vale
nce
of
dia
bet
es (
%)
6.6
3.1
7.6
5.2
14.2
8.3
0
2
4
6
8
10
12
14
16
Urban Rural
Pre
vale
nce
of
dia
bet
es
(%)
3.7
1.7
7.2
4.9
10.9
6.5
0
2
4
6
8
10
12
14
16
Urban Rural
Pre
vale
nce
of
dia
bet
es
(%)
Tamilnadu Jharkhand
Chandigarh Maharashtra
Self-reported Newly diagnosed Overall diabetes
Figure 16: Prevalence* of diabetes (self-reported, newly diagnosed and overall) in the urban and rural population in all the 4 regions studied
*Weighted prevalence
Tamil Nadu
30
The prevalence reaches a peak around 35 years and thereafter tends to plateau off or
decline. This is probably due to survivor bias whereby the older people reflect survivors who tend
to be healthier and relatively disease free.
Figure 18 shows the weighted prevalence of prediabetes in the urban and rural
population of all the four regions studied. In Tamil Nadu, Jharkhand and Maharashtra, the
prevalence of prediabetes is higher in urban areas compared to rural areas, whereas in
Chandigarh, the prevalence is higher in rural areas compared to urban areas [Urban vs. Rural:
Tamil Nadu – 9.8% vs. 7.1%, p<0.05; Jharkhand - 10.7% vs. 7.4%, p<0.05, Chandigarh – 14.5%
vs. 14.7%, p=0.302 and Maharashtra – 15.2% vs. 11.1%, p<0.05].
Figure 17: Age and gender specific weighted prevalence of diabetes in all the4 regions studied
Tamil Nadu
Age group (years)
0
5
10
15
20
25
30
35
40
45
50
20-24 25-34 34-44 45-54 55-64 65+
Pre
vale
nc
e (%
)
Age group (years)
Chandigarh
Pre
vale
nc
e (
%)
0
5
10
15
20
25
30
35
40
45
50
20-24 25-34 34-44 45-54 55-64 65+0
5
10
15
20
25
30
35
40
45
50
20-24 25-34 34-44 45-54 55-64 65+
Urban: Male Female Rural: Male Female
P<0.0001
P =0.04
P<0.0001P<0.0001
P=0.02P
reva
len
ce (
%)
Age group (years)
Jharkhand
P =0.0050
P=0.0002
P<0.0001
P<0.0001
Maharashtra
Pre
vale
nc
e (%
)
Age group (years)
0
5
10
15
20
25
30
35
40
45
50
20-24 25-34 34-44 45-54 55-64 65+
P<0.0001
P<0.0001
P<0.0001
P<0.0001
P<0.0001
P<0.0001
P<0.0001

31
Figure 19 presents the age and gender specific prevalence of prediabetes in the urban
and rural population. Except in Chandigarh, the prevalence of prediabetes is higher in urban
areas in all age groups.
9.8
7.1
0
2
4
6
8
1012
14
16
Urban Rural
Pre
vale
nce
of
dia
bet
es (
%)
Tamil Nadu Jharkhand
Chandigarh Maharashtra
Figure 18: Prevalence* of prediabetes in the urban and rural population in all the 4 regions studied
10.7
7.4
0
2
4
68
10
12
14
16
Urban Rural
Pre
vale
nce
of
dia
bet
es (
%)
15.2
11.1
0
2
4
6
8
10
12
1416
Urban Rural
Pre
vale
nce
of
dia
bet
es (
%)14.5 14.7
0
2
4
6
8
10
12
14
16
Urban Rural
Pre
vale
nce
of
dia
bet
es (
%)
*Weighted prevalence
p=0.005 p=0.001
p=0.945 p<0.001

32
Weighted prevalence of diabetes, prediabetes and ratio of self-reported diabetes to newly
diagnosed diabetes in the study population is given in Table 15. The ratio of known to newly
diagnosed diabetes is a good indicator of the level of diabetes awareness in a population. In all
the four regions studied, the newly detected diabetes cases outnumbered individuals with known
diabetes, except in Tamil Nadu where periodic screening is done.
Figure 19: Age and gender specific weighted prevalence of prediabetes in all the 4 regions studied
Tamil Nadu
Age group (years)
0
5
10
15
20
25
30
35
40
45
50
20-24 25-34 34-44 45-54 55-64 65+
Pre
vale
nce
(%
)
Age group (years)
Chandigarh
Pre
vale
nce
(%
)
0
5
10
15
20
25
30
35
40
45
50
20-24 25-34 34-44 45-54 55-64 65+
Pre
vale
nce
(%
)
Age group (years)
Jharkhand
0
5
10
15
20
25
30
35
40
45
50
20-24 25-34 34-44 45-54 55-64 65+
Maharashtra
Pre
vale
nce
(%
)
Age group (years)
0
5
10
15
20
25
30
35
40
45
50
20-24 25-34 34-44 45-54 55-64 65+
Urban: Male Female Rural: Male FemaleP<0.05 for all except Chandigarh & Jharkhand [ Urban- female subjects]

33
Table 15: Weighted prevalence of diabetes and prediabetes in the study population (n=13,055)
# Union Territory; * p <0.05 compared to rural population; KD = Known Diabetes; NDD = Newly Detected Diabetes; Total diabetes = known diabetes and newly diagnosed diabetes. IFG= Impaired Fasting Glucose; IGT= Impaired Glucose Tolerance; Prediabetes = impaired fasting glucose or impaired glucose tolerance.
Status Tamil Nadu Maharashtra Jharkhand Chandigarh#
Urban Rural Overall Urban Rural Overall Urban Rural Overall Urban Rural Overall
N 1029 2480 3509 1093 2476 3569 840 2051 2891 839 2247 3086
KD% 8.5* 4.1 6.0 3.7* 1.7 2.5 8.4* 0.7 2.4 6.6* 3.1 6.2
(95% CI) (7.1-9.9) (3.2-5.0) (5.2-6.8) (2.7-4.7) (1.2-2.3) (2.0-3.0) (6.3-10.5) (0.3-1.0) (1.8-3.0) (5.7-7.5) (1.2-5.0) (5.4-7.1)
NDD% 5.2* 3.8 4.4 7.2* 4.9 5.9 5.1* 2.3 2.9 7.6 5.2 7.4
(95% CI) (4.1-6.3) (3.0-4.7) (3.7-5.1) (6.0-8.5) (3.9-5.8) (5.1-6.7) (3.4-6.8) (1.7-2.9) (2.3-3.5) (6.6-8.6) (2.8-7.7) (6.5-8.3)
Ratio of KD: NDD
1:0.6 1:0.9 1:0.7 1:1.9 1:2.9 1:2.4 1:0.6 1:3.3 1:1.2 1:1.2 1:1.7 1:1.2
Total Diabetes% 13.7* 7.8 10.4 10.9* 6.5 8.4 13.5* 3.0 5.3 14.2* 8.3 13.6
(95% CI) (12.3-15.7) (6.6-9.0) (9.0-11.0) (9.4-12.6) (5.4-7.6) (7.5-9.3) (11.3-16.7) (2.3-3.7) (4.5-6.1) (12.7-15.3) (5.3-14.4) (12.8-15.2)
IFG% 4.8 4.4 4.6 8.7 7.6 8.0 5.3 4.7 4.8 9.3 10.9 9.5
(95% CI) (3.7-5.9) (3.5-5.3) (3.9-5.3) (7.3-0.1) (6.5-8.8) (7.1-8.9) (3.6-7.0) (3.8-5.6) (4.0-5.6) (8.2-10.4) (7.6-14.4) (8.5-10.5)
IGT% 3.9* 2.2 2.9 3.9* 2.6 3.1 4.3* 2.2 2.7 3.9 2.5 3.8
(95% CI) (2.9-4.9) (1.6-2.9) (2.3-3.5) (2.9-4.9) (1.9-3.3) (2.5-3.7) (2.7-5.9) (1.6-2.8) (2.1-3.3) (3.2-4.6) (0.8-4.2) (3.1-4.5)
IFG+IGT% 1.1 0.6 0.8 2.6* 0.9 1.6 1.1 0.5 0.6 1.3 1.3 1.3
(95% CI) (0.6-1.6) (0.3-1.0) (0.5-1.1) (1.8-3.4) (0.5-1.3) (1.2-2.0) (0.3-1.9) (0.2-0.8) (0.3-0.9) (0.9-1.7) (0.1-2.1) (0.9-1.7)
Prediabetes% 9.8* 7.1 8.3 15.2* 11.1 12.8 10.7* 7.4 8.1 14.5 14.7 14.6
(95% CI) (8.3-11.3) (6.0-8.2) (7.4-9.2) (13.2-7.0) (9.7-12.4) (12.0-14.1) (8.6-13.4) (6.3-8.5) (7.1-9.1) (12.7-15.3) (11.1-19.0) (13.7-16.3)

34
Summary of Phase I - Primary Objectives 1 & 2:
State wise prevalence: The overall weighted prevalence of diabetes was 10.4% (95%
CI: 9.0-11.0%) in Tamil Nadu, 5.3% (95% CI: 4.5-6.1%) in Jharkhand, 13.6% (95% CI:12.8-
15.2%) in Chandigarh and 8.4% (95% CI:7.5-9.3%) in Maharashtra. The overall weighted
prevalence of prediabetes in Tamil Nadu, Jharkhand, Chandigarh and Maharashtra was 8.3%,
8.1%, 14.6% and 12.8% respectively. This translates to 4.8 million individuals with diabetes and
3.9 million with prediabetes in Tamil Nadu. In Jharkhand, an estimated 0.96 million have
diabetes and 1.5 million, prediabetes. Chandigarh would have 0.12 million people with diabetes
and 0.13 million with prediabetes and in Maharashtra, 6.0 million have diabetes and 9.2 million,
prediabetes.

35
D. Results of Phase I – Secondary Objective 1:
Secondary Objective 1: To determine the prevalence of hypertension and hyperlipidemia in
urban and rural India.
Figure 20 shows the prevalence of hypertension (self-reported, newly diagnosed and
overall) in urban and rural population of all the 4 regions studied. In urban areas, the highest
prevalence of hypertension (overall) was observed in Chandigarh (32.6%) and Tamil Nadu
(32.3%) followed by 30.5% in both Jharkhand and Maharashtra. In rural areas, Tamil Nadu had
the highest prevalence of hypertension (28%) followed by Maharashtra (24.5%), Jharkhand
(22.2%) and Chandigarh (20.4%).
Figure 21 presents the age specific prevalence of hypertension in urban and rural areas.
In all regions, the prevalence of hypertension increases with increasing age. Even in the age
group of 20-24 years, the prevalence of hypertension ranged from 5.4%–13.9% in urban and
7.75.5
24.622.5
32.328
0
5
10
15
20
25
30
35
Urban RuralPre
vale
nc
e o
f h
ype
rte
ns
ion
(%
)
7.9
2
22.620.2
30.5
22.2
0
5
10
15
20
25
30
35
Urban Rural
10.15.9
22.5
14.6
32.6
20.4
0
5
10
15
20
25
30
35
Urban Rural
73.6
23.520.9
30.5
24.5
0
5
10
15
20
25
30
35
Urban Rural
Tamil Nadu Jharkhand
Chandigarh Maharashtra
Self-reported Newly diagnosed Overall hypertension
Figure 20: Prevalence of hypertension (self-reported, newly diagnosed and overall) in the urban and rural population in all the 4 regions studied
Pre
vale
nce
of
hyp
ert
ens
ion
(%
)
Pre
vale
nc
e o
f h
ype
rte
nsi
on
(%
)
Pre
vale
nce
of
hyp
erte
ns
ion
(%
)

36
9%–10% in rural areas. At every age interval, the prevalence of hypertension in urban areas
was higher compared to rural areas in all the 4 regions studied.
Figures 22–24 shows the prevalence of different components of dyslipidemia
[hypercholesterolemia (cholesterol ≥200 mg/dl), hypertriglyceridemia (triglycerides ≥150 mg/dl)
and low HDL cholesterol (HDL-C <40 mg/dl in men and <50 mg/dl in women). Figure 25 shows
the prevalence of dyslipidemia (presence of hypercholesterolemia or hypertriglyceridemia or low
HDL cholesterol).
In urban areas, Chandigarh (25%) and in rural areas, Tamil Nadu (16.0%) had the highest
prevalence of hypercholesterolemia compared to the other regions. In the case of
hypertriglyceridemia, both urban and rural Chandigarh had the highest prevalence (urban:
45.9%, rural: 35.6%) compared to their counterparts in the other regions. About 67–78% of the
population had low HDL cholesterol irrespective of the region under study. The prevalence of
dyslipidemia ranged from 75.7% in urban Maharashtra to 87.2% in urban Chandigarh.
01020304050607080
20-24 25-34 35-44 45-54 55-64 65+
Prev
alen
ce o
f hyp
erte
nsio
n (%
)
01020304050607080
20-24 25-34 35-44 45-54 55-64 65+
Prev
alen
ce o
f hyp
erte
nsio
n (%
)
01020304050607080
20-24 25-34 35-44 45-54 55-64 65+
Prev
alen
ce o
f hyp
erte
nsio
n (%
)
01020304050607080
20-24 25-34 35-44 45-54 55-64 65+
Prev
alen
ce o
f hyp
erte
nsio
n (%
)
Figure 21: Agewise prevalence of hypertension in the urban and rural population in all the 4 regions studied
Urban Rural
Tamil Nadu Jharkhand
Chandigarh Maharashtra
P for trend, p<0.001 in all states

37
*p<0.05, **p<0.001
23.7
13.9
10.5
25
16
13.7
2.2
11.6
0
10
20
30
40
Tamilnadu Maharashtra Jharkhand Chandigarh
Urban
Rural
Pro
po
rtio
n o
f su
bje
cts
(%)
*
**
*
Figure 22: Prevalence of hypercholesterolemia in the urban and rural population in all the 4 regions studied
Tamil Nadu
Figure 23: Prevalence of hypertriglyceridemia in the urban and rural population in all the 4 regions studied
*p<0.05, **p<0.001
33
28.7
38.3
45.9
29.6
20.9
17.3
35.6
0
10
20
30
40
50
Tamilnadu Maharashtra Jharkhand Chandigarh
Urban
Rural
Pro
po
rtio
n o
f su
bje
cts
(%)
**
*
Tamil Nadu

38
Figure 25: Prevalence of dyslipidemia in the urban and rural population in all the 4 regions studied
77.8 75.780.5
87.2
76.5 77.480.1 81.1
0
10
20
30
40
50
60
70
80
90
100
Tamilnadu Maharashtra Jharkhand Chandigarh
Urban Rural
Pro
po
rtio
n o
f su
bje
cts (%
)
Tamil Nadu
Figure 24: Prevalence of low HDL cholesterol in the urban and rural population in all the 4 regions studied
72.269.6
74.4 76.4
67.6 69.6
7875.1
0
10
20
30
40
50
60
70
80
90
Tamilnadu Maharashtra Jharkhand Chandigarh
Urban RuralP
ropo
rtio
n o
f subje
cts
(%
)
Tamil Nadu

39
Figure 26: Prevalence of obesity (generalized and abdominal) in the urban and rural population in all the 4 regions studied
The prevalence of generalized obesity (as defined by BMI ≥25 kg/m2) and abdominal
obesity (as defined by waist circumference ≥90 cm in men and ≥80 cm in women) in all four
regions is shown in Figure 26. The highest prevalence of both generalized and abdominal
obesity was seen in urban and rural Chandigarh and the lowest prevalence in urban areas was
seen in Maharashtra, whereas for rural areas the lowest prevalence was seen in Jharkhand. In
all the regions, prevalence of both generalized and abdominal obesity was higher in urban areas
compared to rural areas.
35.7
20
37.4
22.1
0
10
20
30
40
50
Urban Rural
Pre
vale
nce o
f ob
esi
ty (%
)
30.4
4.3
37.2
8.7
0
10
20
30
40
50
Urban Rural
40.3
27.9
46.6
32.1
0
10
20
30
40
50
Urban Rural
26.1
12.2
26.7
15
0
10
20
30
40
50
Urban Rural
Tamil Nadu Jharkhand
Chandigarh Maharashtra
Generalized obesity Abdominal obesity
Pre
vale
nce
of o
besi
ty (%
)
Pre
vale
nce
of o
bes
ity (%
)
Pre
vale
nce o
f ob
esi
ty (%
)
P for trend, p<0.001 in all states

40
The prevalence of metabolic syndrome [based on south Asian modified National
Cholesterol Education Programme (SAM-NCEP) criteria] is shown in Figure 27. In all regions
studied, urban areas had higher prevalence of metabolic syndrome compared to rural areas
except in Maharashtra. The prevalence ranged from 16.7% to 41.7% in urban and 8.5% to
25.8% in rural areas. Urban Chandigarh had the highest prevalence of metabolic syndrome
(41.7%) compared to other regions.
35.9
25.8
0
10
20
30
40
50
Urban RuralPre
vale
nce
of
met
abo
lic
syn
dro
me
(%
) Tamilnadu Jharkhand
Chandigarh Maharashtra
Figure 27: Prevalence of metabolic syndrome in the urban and rural population in all the 4 regions studied
30
8.5
0
10
20
30
40
50
Urban Rural
16.7 17.1
0
10
20
30
40
50
Urban Rural
41.7
25.6
0
10
20
30
40
50
Urban Rural
Pre
vale
nce
of
met
abo
lic
syn
dro
me
(%
)
Pre
vale
nc
e o
f m
eta
bo
lic
syn
dro
me
(%
)
Pre
vale
nc
e o
f m
eta
bo
lic
syn
dro
me
(%
)
p=0.007 p<0.001
p<0.001 p=0.879
Tamil Nadu

41
E. Results of Phase I – Secondary Objective 2:
Secondary Objective 2: To determine the prevalence of coronary artery disease among subjects with and without diabetes.
The prevalence of coronary artery disease (CAD) among subjects with and without
diabetes is shown in Figure 28. In both urban and rural areas, the prevalence of CAD was
higher among diabetic subjects compared to subjects without diabetes. Maharashtra (both
urban and rural) had the highest prevalence of CAD among diabetic subjects compared to other
regions.
8.5
5.6
2.9 2.5
0
2
4
6
8
10
12
Urban Rural
Pre
vale
nce
of
CA
D (
%)
8.9
1.60.8 0.8
0
2
4
6
8
10
12
Urban Rural
8.4
3.82.8
0.9
0
2
4
6
8
10
12
Urban Rural
10.6
8.3
2.11.2
0
2
4
6
8
10
12
Urban Rural
Tamil Nadu Jharkhand
Chandigarh Maharashtra
With diabetes Without diabetes
Figure 28: Prevalence of coronary artery disease (CAD) among subjects with and without diabetes in the study population
Pre
vale
nce
of
CA
D (
%)
Pre
vale
nce
of
CA
D (
%)
Pre
vale
nce
of
CA
D (
%)
p=0.001 p=0.010 p<0.001 p=0.439
p=0.002 p<0.001
p<0.001p<0.001

42
F. Results of Phase I – Secondary Objective 3:
Secondary Objective 3: To assess the level of diabetes control among self reported diabetic
subjects in urban and rural India.
Figure 29 shows the mean glycated haemoglobin (HbA1c) among subjects with self-
reported diabetes. In urban areas, the mean HbA1c was highest in Chandigarh (mean ± SD: 8.7
± 2.2%) followed by Tamil Nadu (8.3 ± 1.9%), Jharkhand (8.2 ± 2.4%) and Maharashtra (8.0 ±
1.9%). In rural areas, the mean HbA1c was highest in Chandigarh (9.3 ± 2.4%) followed by
Jharkhand (8.3 ± 2.1%), Tamil Nadu (8.1 ± 2.1%) and Maharashtra (7.9 ± 2.3%).
Figure 30 shows the glycemic control among subjects with self-reported diabetes.
Subjects were categorized based on their HbA1c values as those under good control (HbA1c:
<7%), fair control (HbA1c: 7-9%) and poor control (HbA1c: >9%). Proportion of diabetic subjects
with good glycemic control ranged from 30% to 34.7% in urban areas and 17% to 40% in rural
areas. Urban Jharkhand and rural Maharashtra had the highest proportion of subjects with good
glycemic control. About one-third of the diabetic subjects were under poor glycemic control in all
8.3 8.1
0
2
4
6
8
10
12
Urban Rural
Mea
n H
bA
1c (
%)
Tamil Nadu Jharkhand
Chandigarh Maharashtra
Figure 29: Mean glycated haemoglobin (HbA1c) among subjects with self-reported diabetes
8.2 8.3
0
2
4
6
8
10
12
Urban Rural
8 7.9
0
2
4
6
8
10
12
Urban Rural
8.79.4
0
2
4
6
8
10
12
Urban Rural
Mea
n H
bA
1c (
%)
Mea
n H
bA
1c (
%)
Mea
n H
bA
1c (
%)
p=0.609 p=0.843
p=0.190 p=0.902
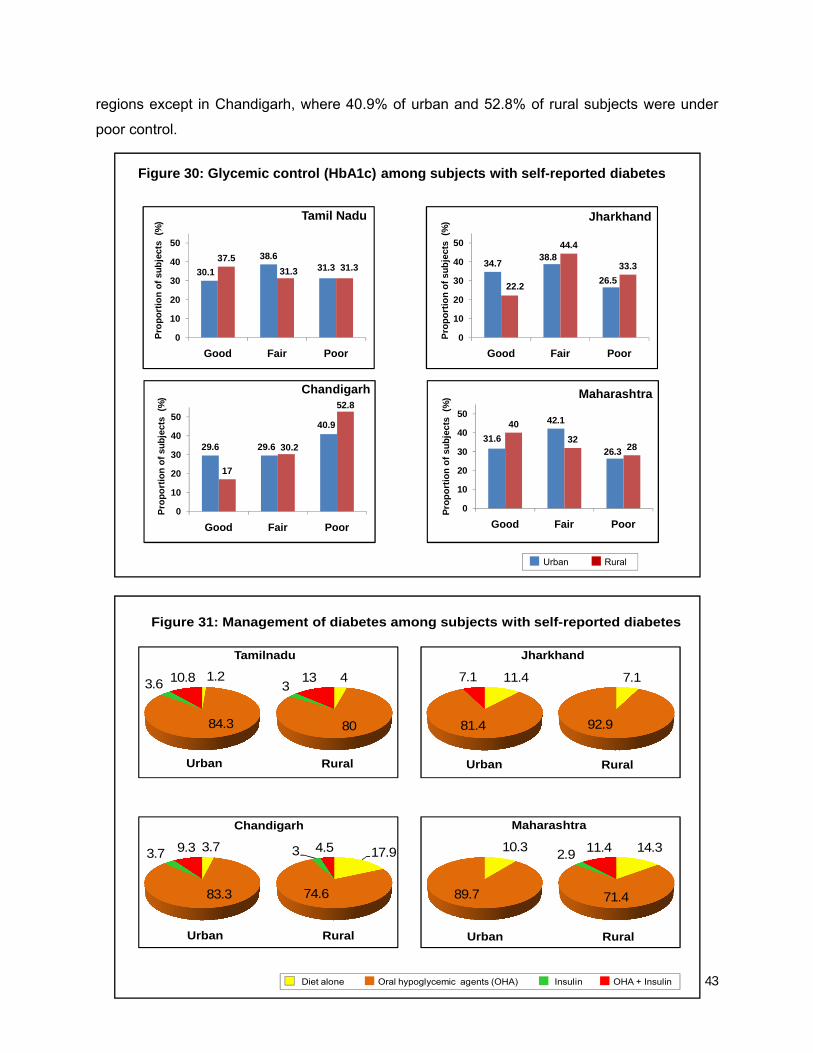
43
regions except in Chandigarh, where 40.9% of urban and 52.8% of rural subjects were under
poor control.
1.2
84.3
3.6 10.8 4
80
313
3.7
83.3
3.7 9.3 17.9
74.6
3 4.5
11.4
81.4
7.1 7.1
92.9
10.3
89.7
14.3
71.4
2.9 11.4
Tamilnadu Jharkhand
Chandigarh Maharashtra
Urban Rural Urban Rural
Urban Rural Urban Rural
Diet alone Oral hypoglycemic agents (OHA) Insulin OHA + Insulin
Figure 31: Management of diabetes among subjects with self-reported diabetes
30.1
38.631.3
37.5
31.3 31.3
0
10
20
30
40
50
Good Fair Poor
Pro
po
rtio
n o
f su
bje
cts
(%
)
34.738.8
26.522.2
44.4
33.3
0
10
20
30
40
50
Good Fair Poor
29.6 29.6
40.9
17
30.2
52.8
0
10
20
30
40
50
Good Fair Poor
31.6
42.1
26.3
40
3228
0
10
20
30
40
50
Good Fair Poor
Tamil Nadu Jharkhand
Chandigarh Maharashtra
Urban Rural
Figure 30: Glycemic control (HbA1c) among subjects with self-reported diabetes
Pro
po
rtio
n o
f su
bje
cts
(%
)
Pro
po
rtio
n o
f su
bje
cts
(%
)
Pro
po
rtio
n o
f su
bje
cts
(%
)

44
Management of diabetes among subjects with self-reported diabetes is depicted in
Figure 31. In all 4 regions, 71.4% to 89.7% were on oral hypoglycaemic agents (OHA), 2.9% to
3.7% were on insulin, 4.5% to 13% were on both OHA and insulin and 1.2% to 17.9% were on
diet alone. Surprisingly in the Maharashtra urban sample, none of the subjects reported taking
insulin. The reason for this is not clear. This could be one of the limitations of the study.
G. Additional results:
Physical activity:
Pattern of physical activity in urban and rural areas is shown in Table 16. Overall, in all
the four regions studied inactivity was significantly more in urban areas compared to rural areas
(65.0% vs. 50.0%; p<0.001). Similarly there was a significant difference between physically
inactive males and females. Highly active subjects were significantly more prevalent in rural
areas compared to urban areas. In Chandigarh, there was a significant difference between
inactive males and females and between urban and rural residents (73.2% vs. 63.4%, p<0.001),
Highly active subjects were significantly higher in rural compared to urban areas (10.8% vs.
6.5%;p<0.001). In Jharkhand, inactivity was significantly higher in urban compared to rural
areas (47.8% vs. 28.9%, p<0.001), while active and highly active subjects were significantly
higher in the rural areas compared to urban areas. Female subjects were more inactive
compared to males in the rural areas (44.2% vs. 13.3%; p<0.001). In both urban and rural
areas, males were significantly highly active than females. In Maharashtra also, inactivity was
significantly higher in urban areas compared to rural areas (65.4% vs. 50.4%, p<0.001), while
subjects were highly active in rural areas (17.8% vs. 10.3%, p<0.001). A significantly greater
proportion of male subjects were highly active in both urban and rural areas. In Tamil Nadu as
well, significantly more urban residents were inactive compared to rural residents (71.0% vs.
55.4%, p<0.001), while subjects were highly active in rural compared to urban areas (13.3% vs.
8.3%,p<0.001). In rural and urban areas, females were physically inactive than males (Rural:
62.3% vs. 48.2%, p<0.001; urban: 77.4 vs. 64.1%, p<0.001). In both the rural and urban areas,
males were highly active than females.

45
TABLE 16: PHYSICAL ACTIVITY LEVELS IN THE STUDY POPULATION
PHYSICAL ACTIVITY
RURAL URBAN
OVERALL
Male (n=5002)
Female (n=5052)
Total (n=10054)
Male (n=2069)
Female (n=2104)
Total (n=4173)
Inactive n (%) 2014(40.3) 3011 (59.6)* 5025 (50.0) 1214 (58.7) # 1498 (71.2)* @ 2712 (65.0) $
Active n (%) 2040(40.8) 1407 (27.8)* 3447 (34.3) 605 (29.2) # 485 (23.0)* @ 1090 (26.1) $
Highly active n (%) 948(18.9) 634 (12.6)* 1582 (15.7) 250 (12.1) # 121 (5.8)* @ 371 (8.9) $
CHANDIGARH
Male (n=1240)
Female (n=1192)
Total (n=2432)
Male (n=444)
Female (n=464)
Total (n=908)
Inactive n (%) 670 (54.0) 895 (75.1)* 1578 (63.4) 279 (62.8) # 386 (83.2)* @ 665 (73.2) $
Active n (%) 379 (30.6) 224 (18.8)* 603 (24.8) 122 (27.5) # 62 (13.4)* @ 184 (20.3) $
Highly active n (%) 191(15.4) 73 (6.1)* 264 (10.8) 43 (9.7) # 16 (3.5)* @ 59 (6.5) $
JHARKHAND
Male(n=1197
Female(n=1187)
Total(n=2384)
Male (n= 482)
Female(n=463)
Total (n=945)
Inactive n (%) 165 (13.8) 525 (44.2)* 690 (28.9) 214 (44.4) ## 256 (55.3)** @ 470 (47.8) $
Active n (%) 732 (61.2) 460 (38.8)* 1192 (50.0) 205 (42.5) # 176 (38.01) @ 381 (42.2) $
Highly active n (%) 300 (25.1) 202 (17.0)* 502 (21.1) 63 (13.1) # 31 (6.7)* @ 94 (10.0) $
MAHARASHTRA
Male (n=1313)
Female (n=1343)
Total (n=2656)
Male (n=625)
Female (n=623)
Total (n=1248)
Inactive n (%) 576 (43.9) 763 (56.8)* 1339 (50.4) 389 (62.2) # 428 (68.5) @ 816 (65.4) $
Active n (%) 474 (36.1) 370 (27.6)* 844 (31.8) 159 (25.5) # 144 (23.1) @ 303 (24.3) $
Highly active n (%) 263 (20.0) 210 (15.6)** 473 (17.8) 77 (12.3) # 52 (8.4)** 129 (10.3) $
TAMIL NADU
Male (n=1252)
Female (n=1330)
Total (n=2582)
Male (n=518 )
Female (n=554)
Total (n=1072)
Inactive n (%) 603 (48.2) 828 (62.3)* 1431 (55.4) 332 (64.1) # 429 (77.4)* @ 761 (71.0) $
Active n (%) 455 (36.3) 353 (26.5)* 808 (31.3) 119 (23.0) # 103 (18.6) @ 222 (20.7) $
Highly active n (%) 194 (15.5) 149 (11.2)** 343 (13.3) 67 (12.9) # 22 (4.0)* @ 89 (8.3) $
* p <0.001 compared to male subjects; ** p <0.05 compared to male subjects; $ p < 0.001 compared to rural residents; # p <0.001 compared to rural male subjects; ## p <0.05 compared to rural male subjects; @ p <0.001compared to rural female
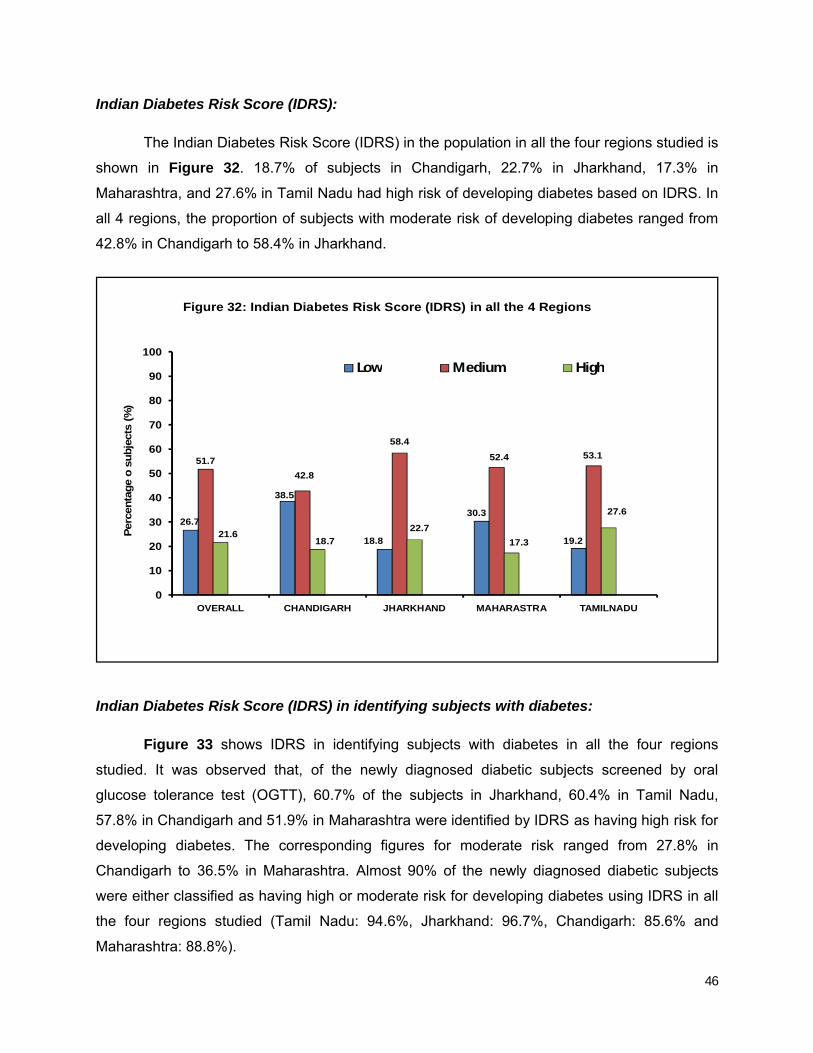
46
Indian Diabetes Risk Score (IDRS):
The Indian Diabetes Risk Score (IDRS) in the population in all the four regions studied is
shown in Figure 32. 18.7% of subjects in Chandigarh, 22.7% in Jharkhand, 17.3% in
Maharashtra, and 27.6% in Tamil Nadu had high risk of developing diabetes based on IDRS. In
all 4 regions, the proportion of subjects with moderate risk of developing diabetes ranged from
42.8% in Chandigarh to 58.4% in Jharkhand.
Indian Diabetes Risk Score (IDRS) in identifying subjects with diabetes:
Figure 33 shows IDRS in identifying subjects with diabetes in all the four regions
studied. It was observed that, of the newly diagnosed diabetic subjects screened by oral
glucose tolerance test (OGTT), 60.7% of the subjects in Jharkhand, 60.4% in Tamil Nadu,
57.8% in Chandigarh and 51.9% in Maharashtra were identified by IDRS as having high risk for
developing diabetes. The corresponding figures for moderate risk ranged from 27.8% in
Chandigarh to 36.5% in Maharashtra. Almost 90% of the newly diagnosed diabetic subjects
were either classified as having high or moderate risk for developing diabetes using IDRS in all
the four regions studied (Tamil Nadu: 94.6%, Jharkhand: 96.7%, Chandigarh: 85.6% and
Maharashtra: 88.8%).
26.7
38.5
18.8
30.3
19.2
51.7
42.8
58.4
52.4 53.1
21.618.7
22.7
17.3
27.6
0
10
20
30
40
50
60
70
80
90
100
OVERALL CHANDIGARH JHARKHAND MAHARASTRA TAMILNADU
Low Medium High
Perc
enta
ge
o s
ubje
cts
(%
)
Figure 32: Indian Diabetes Risk Score (IDRS) in all the 4 Regions

47
Dietary profile:
The staple food consumed by the urban and rural population in all the four regions
studied is shown in Figure 34.
97.8
2 0.2
99
0.5 0.30.1
14.5
85.3
0.1 0.1 16
83.9
41.957.6
0.5
92.3
7.6 0.1
30.8
58.2
0.2 2 8.8 20.6
36.3
0.413.8
28
0.9
Tamil Nadu Jharkhand
Chandigarh Maharashtra
Urban Rural Urban Rural
Urban Rural Urban Rural
Rice Wheat Ragi Bajra Jowar Maize
Figure 34: Staple food of the urban and rural population in all the 4 regions studied
9.714.4
3.4
11.6
5.4
33.327.8
3636.5
34.2
57 57.8 60.7
51.9
60.4
0
10
20
30
40
50
60
70
80
90
100
OVERALL CHANDIGARH JHARKHAND MAHARASTRA TAMILNADU
Low Medium High
Per
centa
ge
o s
ub
ject
s (%
)
Figure 33: Indian Diabetes Risk Score (IDRS) in identifying subjectswith diabetes in all the 4 Regions

48
Rice is main staple food in Tamil Nadu and rural Jharkhand. Wheat is main staple for
both urban and rural Chandigarh. About half of the population in urban Jharkhand and urban
Maharashtra consumes wheat as the main staple food. The staple food in rural Maharashtra is
varied and comprises of 36.3% wheat, 28% Jowar, 20.6% rice, 13.8% Bajra, 0.9% maize and
0.4% ragi consumers.
Table 17 shows the major cooking oil of the urban and rural population in all the 4
regions studied. In Tamil Nadu, the major oil used for cooking is sunflower oil, followed by palm
oil, groundnut oil and gingelly oil. The major cooking oil in Jharkhand is mustard oil. In
Chandigarh, in addition to mustard oil, the next major oil used is soyabean oil. In Maharashtra,
the major oil used is soyabean oil, followed by groundnut and sunflower oil.
Table 17: Major cooking oil used of the urban and rural population in all the 4 regions studied
Cooking oil Tamil Nadu Jharkhand Chandigarh Maharashtra
Urban Rural Urban Rural Urban Rural Urban Rural
Mustard oil 0.3 0.1 90.4 98.7 65.4 81.6 4.1 0.9
Coconut oil 2.3 3.2 0.2 0 0 0.2 0.6 0.2
Groundnut oil 21.4 39.7 1.1 0.1 1.2 0.3 29.6 20.2
Sunflower oil 40.0 15.9 2.3 0.1 4.2 0.5 14.9 5.3
Soyabean oil 0.2 0 4.7 0.2 23.2 14.2 45.1 65.0
Palm oil 29.6 29.7 0.2 0.1 0.4 0.1 3.3 5.6
Gingelly oil 5.4 11.2 0.3 0 0.1 0 0 0.1
Others* 0.9 0 0.8 0.7 5.4 2.9 2.5 2.7
*Others include rice bran oil, vanaspathi, ghee & butter

49
Knowledge of diabetes and its complications:
Knowledge of diabetes and its complications is presented in Figures 35-37. Figure 35
shows the knowledge of diabetes among the urban and rural residents of the study population.
Only 58.4% of the urban residents and 36.8% of the rural residents reported that they knew
about a condition called diabetes. Of those who reported that they knew about diabetes, 86.3%
of the urban residents and 78.4% of the rural residents felt that the prevalence of diabetes was
increasing. 64.6% of urban and 46.2% of rural residents reported that diabetes could affect
other organs. Among self-reported diabetic subjects, the corresponding figures are 82.8% and
78.1%. Only 65.7% of the urban residents and 51% of the rural residents were aware that
diabetes could be prevented.
0
10
20
30
40
50
60
70
Urban Rural Overall
58.4
36.843.2
% o
f re
spo
nd
ers
DO YOU KNOW WHAT DIABETES IS? - YES
Figure 35: Knowledge of diabetes in the study population
IF YES, DO YOU THINK IN GENERAL MORE
AND MORE PEOPLE ARE GETTING
AFFECTED WITH DIABETES NOWADAYS?
0102030405060708090
100
Urban Rural
86.3 78.4
% o
f re
spo
nd
ers

50
Figure 36: Knowledge about diabetes related complications
DO YOU THINK DIABETES CAN AFFECT
OTHER ORGANS? – General population
DO YOU THINK DIABETES CAN AFFECT
OTHER ORGANS? – Self reported diabetic
population
0102030405060708090
100
URBAN RURAL
64.646.2
Yes P
erc
en
tag
e (%
)
0102030405060708090
100
URBAN RURAL
82.8 78.1
Yes
Perc
en
tag
e (%
)
0102030405060708090
100
Urban Rural
65.7
51
% o
f re
sponder
s
Figure 37: Knowledge of diabetes prevention
Can diabetes be prevented? – Yes

51
Migration & its effect on diabetes rates:
Figure 38 shows the proportion of subjects based on migration from rural to urban areas
in the 4 regions. Individuals migrating from rural–urban ranged from 23.5% in Jharkhand, 26.4%
in Maharashtra, 31.1% in Tamil Nadu to 36.6% in Chandigarh.
Figure 38: Rural-Urban migration rates in all 4 regions studied
31.1
26.423.5
36.6
0
5
10
15
20
25
30
35
40
45
50
Tamil Nadu Maharashtra Jharkhand Chandigarh
% o
f su
bje
cts

52
LIMITATIONS OF THE STUDY
One of the limitations of this study is the use of capillary blood glucose to screening for
diabetes, which has wider coefficient of variation than venous plasma. However, the logistical
constraints of poor compliance, limited availability of quality-controlled laboratories, challenges
in transporting and storing blood samples at the required temperature and insufficient
phlebotomists preclude the use of venous sampling. Secondly, the cross-sectional nature of the
design does not allow for cause–effect relationships to be made. Only prospective longitudinal
follow-up studies can throw light on the true risk factors associated with diabetes. Third, the
results and conclusions for glycemic control have been derived from a single cross-sectional
estimation of HbA1c, which may be normal/abnormal at a given point of time, and do not
represent a prospective evaluation of glycemic control over a period of time.
CONCLUSIONS
In summary, of the four regions studied, the prevalence of diabetes was highest in Chandigarh
followed by Tamil Nadu, Maharashtra and Jharkhand. Again, the prevalence of prediabetes was
highest in Chandigarh followed by Maharashtra, Tamil Nadu and Jharkhand. The prevalence of
hypertension, dyslipidemia and metabolic syndrome are highest in Chandigarh compared to
other regions. In terms of glycemic control, Chandigarh had the highest proportion of diabetic
subjects under poor control. Urban Jharkhand and rural Maharashtra had the highest proportion
of subjects with good glycemic control. These preliminary analyses meet the primary and
secondary objectives of this study.

53
SIGNIFICANCE OF THE STUDY
The ICMR–INDIAB study provides accurate and comprehensive data on prevalence of
diabetes and prediabetes in regions representing the north, south, east and west of India. The
study also provides valuable information on the distribution of risk factors in the regions studied.
This study is also unique in that it is designed to be representative of both rural and urban areas
and provide estimates for prediabetes, dyslipidemia, hypertension, obesity, and the level of
glycemic control among the confirmed cases of diabetes. Early detection of diabetes and
prediabetes will help in early implementation of interventions to reduce morbidity and mortality
associated with it. The study helps to throw light on the health burden due to diabetes in India
and also to plan measures for both control and prevention of diabetes in the regions where the
study is completed.
PUBLIC HEALTH IMPLICATIONS
Diabetes and other non communicable disease risk factors like dyslipidemia,
hypertension, obesity and metabolic syndrome are imposing a large and growing burden on
public health. These conditions are preventable, but are often silent in their manifestation.
Therefore the ICMR-INDIAB study will help to throw light on the large burden of undiagnosed
risk factors and provides an opportunity for prevention of disease in this group of people. In
addition for those with an established diagnosis of diabetes the level of control is assessed and
opportunity for better control of diabetes. All participants in the study are also provided with
general advice on prevention of NCDs. This will help to improve the awareness about NCDs in
the population at large. Thus new initiatives like these are needed to institute prevention
programmes to curb the huge strain of NCDs on the national healthcare systems. The ICMR-
INDIAB study helps not only in earlier detection of diabetes through screening, but also in
planning prevention programmes for the country.

54
LIST OF RESEARCH PUBLICATIONS FROM THE PROJECT (TILL 2015)
1. ICMR-INDIAB study methodology (Annexure 18)
Anjana RM, Pradeepa R, Deepa M, Datta M, Sudha V, Unnikrishnan R, Nath LM, Das
AK, Madhu SV, Rao PV, Shukla DK, Kaur T, Ali MK, Mohan V. The Indian Council of
Medical Research–India Diabetes (ICMR–INDIAB) Study: Methodological Details.
[ICMR-INDIAB-1] J Diabetes Sci Technol 2011; 5: 906-914.
2. Prevalence of diabetes and prediabetes (Annexure 19)
Anjana RM, Pradeepa R, Deepa M, Datta M, Sudha V, Unnikrishnan R, Bhansali A,
Joshi SR, Joshi PP, Yajnik CS, Dhandhania VK, Nath LM, Das AK, Rao PV, Madhu SV,
Shukla DK, Kaur T, Priya M, Nirmal E, Parvathi SJ, Subhashini S, Subashini R, Ali MK,
Mohan V for the ICMR– INDIAB Collaborative Study Group. Prevalence of diabetes and
prediabetes in urban and rural India: results of the ICMR-INDIAB study (Phase-1)
[ICMR-INDIAB-2]. Diabetologia 2011; 54: 3022-7.
3. Prevalence of generalized and abdominal obesity (Annexure 20)
Pradeepa R, Anjana RM, Joshi SR, Bhansali A, Deepa M, Joshi PP, Dhandhania VK,
Madhu SV, Rao PV, Geetha L, Subashini R, Unnikrishnan R, Shukla DK, Kaur T, Mohan V,
Das AK, for the ICMR– INDIAB Collaborative Study Group. Prevalence of generalized and
abdominal obesity in urban and rural India- the ICMR-INDIAB study (phase-I) [ICMR-
INDIAB-3]. Indian J Med Res, 2015:142: pp 139-150
4. Knowledge and awareness of diabetes (Annexure 21)
Deepa M, Bhansali A, Anjana RM, Pradeepa R, Joshi SR, Joshi PP, Dhandhania VK, Rao
PV, Subashini R, Unnikrishnan R, Shukla DK, Madhu SV, Das AK , Mohan V, Kaur T for the
ICMR–INDIAB Collaborative Study Group. Knowledge and awareness of diabetes in urban
and rural India: The ICMR–INDIAB study (Phase I) [ICMR-INDIAB 4]. Indian J Endocrinol
Metab. 2014;18:379-85.

55
5. Physical activity and inactivity patterns (Annexure 22)
Anjana RM, Pradeepa R, Das AK, Deepa M, Bhansali A, Joshi SR, Joshi
PP, Dhandhania VK, Rao PV, Sudha V, Subashini R, Unnikrishnan R, Madhu SV, Kaur
T, Mohan V, Shukla DK; ICMR– INDIAB Collaborative Study Group.
Physical activity and inactivity patterns in India - results from the ICMR-INDIAB
study (Phase-1) [ICMR-INDIAB-5].Int J Behav Nutr Phys Act. 2014;11:26.
6. Prevalence and risk factors of hypertension (Annexure 23)
Bhansali A, Dhandania VK, Deepa M, Anjana RM, Joshi SR, Joshi PP, Madhu SV, Rao
PV, Subashini R, Sudha V, Unnikrishnan R, Das AK, Shukla DK, Kaur T, Mohan V,
Pradeepa R for the ICMR– INDIAB Collaborative Study Group. Prevalence and risk
factors for hypertension in urban and rural India: the ICMR-INDIAB Study (Phase-1)
[ICMR-INDIAB- 6]. J. Hum Hypertens. 2015; 29:204-9.
7. Prevalence of dyslipidemia (Annexure 24)
Joshi SR, Anjana RM, Deepa M, Pradeepa R, Bhansali A, Dhandania VK, Joshi PP,
Unnikrishnan R, Nirmal E, Subashini R, Madhu SV, Rao PV, Das AK, Kaur K, Shukla DK,
Mohan V, for the ICMR– INDIAB Collaborative Study Group. Prevalence of dyslipidemia in
urban and rural India: The ICMR-INDIAB study [ICMR-INDIAB- 7]. PLOS One 2014;9:
e96808.
8. Glycemic control in self reported diabetes (Annexure 25)
Unnikrishnan R, Anjana RM, Deepa M, Pradeepa R, Joshi SR, Bhansali A, Dhandania
VK, Joshi PP, Madhu SV, Rao PV, Lakshmy R, Jaishri R, Velmurugan K, Nirmal E,
Subashini R, Vijaychandrika V, Kaur T, Shukla DK, Das AK, Mohan V, for the ICMR–
INDIAB Collaborative Study Group. Glycemic control among individuals with self-
reported diabetes in India-the ICMR-INDIAB Study (PHASE-1) [ICMR-INDIAB-8].
Diabetes Techno Ther. 2014;16:596-603.

56
ABSTRACT
The ICMR-INDIAB study (Phase I) reports on the results obtained from three states
[Tamil Nadu, Jharkhand and Maharashtra] and one Union Territory [Chandigarh] of India. A
stratified multi-stage sampling design was used to survey individuals aged ≥20 years with the
primary objective to determine the prevalence of diabetes and prediabetes in India. Of the
16,607 individuals selected for the study, 14,277 [86%] individuals participated. The weighted
prevalence of diabetes (both known and newly diagnosed) in Tamil Nadu was 10.4%,
Jharkhand, 5.3%, Chandigarh, 13.6% and Maharashtra, 8.4%. The prevalence of prediabetes
was 8.3%, 8.1%, 14.6% and 12.8% respectively. The prevalence of hypertension, dyslipidemia
and metabolic syndrome are highest in Chandigarh compared to other regions. In terms of
glycemic control, urban Jharkhand and rural Maharashtra had the highest proportion of diabetic
subjects with good glycemic control. Maharashtra had the highest prevalence of coronary artery
disease among diabetic subjects compared to other regions. This study throws light on the
health burden due to diabetes in India and will help plan measures for both control and
prevention of diabetes in the regions where the study is completed.

57
SYNOPSIS
The ICMR-INDIAB Study is a cross-sectional, community- based survey of adults of either sex,
aged 20 years and above, aimed at determining the national prevalence of type 2 diabetes
mellitus & pre-diabetes [Impaired fasting glucose (IFG) / Impaired glucose tolerance (IGT)] from
all the 28 states, National Capital Territory (NCT) of Delhi and 2 union territories (UTs) namely
Chandigarh and Puducherry in the mainland of India. Each state, the National Capital Territory
and the Union Territories will have an urban component [towns including metros, (wherever
applicable)] and a rural component (villages). The secondary objectives are 1) to determine the
prevalence of hypertension and hyperlipidemia in urban and rural India; 2) to determine the
prevalence of coronary artery disease among subjects with and without diabetes and 3) to
assess the level of diabetes control among self reported diabetic subjects in urban and rural
India. The study was initiated to estimate the prevalence of diabetes in India in a phased
manner. In Phase I, three states namely Tamil Nadu, Maharashtra, Jharkhand and one Union
Territory namely Chandigarh located in the south, west, east and north of the country,
respectively were studied. ICMR-INDIAB north east component, which is now ongoing includes
the 8 north eastern states of India namely Sikkim, Assam, Meghalaya, Tripura, Mizoram,
Manipur, Nagaland and Arunachal Pradesh. The ICMR-INDIAB-Rest of India (ROI) component
(Phase II) involving all the other states in India are currently in progress.
The ICMR-INDIAB study (Phase I) reports on the results obtained from three states
[Tamil Nadu, Jharkhand and Maharashtra] and one Union Territory [Chandigarh] of India. A
stratified multi-stage sampling design was used. Of the 16,607 individuals selected for the
study, 14,277 [86%] individuals participated. The weighted prevalence of diabetes (both known
and newly diagnosed) in Tamil Nadu was 10.4%, Jharkhand, 5.3%, Chandigarh, 13.6% and
Maharashtra, 8.4%. The prevalence of prediabetes was 8.3%, 8.1%, 14.6% and 12.8%
respectively.
In urban areas, the highest prevalence of hypertension (overall) was observed in
Chandigarh (32.6%) and Tamil Nadu (32.3%) followed by 30.5% in both Jharkhand and
Maharashtra. In rural areas, Tamil Nadu had the highest prevalence of hypertension (28%)
followed by Maharashtra (24.5%), Jharkhand (22.2%) and Chandigarh (20.4%). The prevalence
of dyslipidemia ranged from 75.9% in urban Maharashtra to 84.4% in urban Chandigarh. About
70–78% of the population had low HDL cholesterol irrespective of the region under study.
The highest prevalence of both generalized and abdominal obesity was seen in urban and rural

58
Chandigarh and in all the regions, prevalence of both generalized and abdominal obesity was
higher in urban areas compared to rural areas. The prevalence of metabolic syndrome ranged
from 16.7% to 41.7% in urban areas and 8.5% to 25.8% in rural areas. Urban Chandigarh had
the highest prevalence of metabolic syndrome (41.7%) compared to other regions.
In terms of glycemic control, urban Jharkhand and rural Maharashtra had the highest
proportion of diabetic subjects with good glycemic control. Proportion of diabetic subjects with
good glycemic control ranged from 30% to 34.7% in urban areas and 17% to 40% in rural areas.
Regarding awareness of diabetes in the study population, only 58.4% of the urban residents
and 36.8% of the rural residents reported that they knew about a condition called diabetes. Only
65.7% of the urban residents and 51% of the rural residents were aware that diabetes could be
prevented. Maharashtra had the highest prevalence of coronary artery disease among diabetic
subjects compared to other regions. This phase of the study throws light on the health burden
due to diabetes in 3 selected states and on union territory and will help plan measures for both
control and prevention of diabetes and other non communicable diseases in the regions where
the study is completed.

59
ANNEXURES