national protocol framework for the inventory and
TRANSCRIPT
U.S. Fish and Wildlife Service U.S. Department of the Interior National Wildlife Refuge System
National Protocol Framework for the Inventory and
Monitoring of Migratory Shorebirds

ON THE COVER
Migrating Red Knots and Short-billed Dowitchers, Monomoy National Wildlife Refuge, Massachusetts
Photograph by: Brad Winn

i
NWRS Survey Protocol Signature Page
1 Version is a decimal number with the number left of decimal place indicating the number of times this protocol has
been approved (e.g., first approved version is 1.0.; prior to first approval all versions are 0.x; after first approval, all
minor changes are indicated as version 1. x until the second approval and signature, which establishes version 2.0,
and so on). 4 Signature by Regional I&M Coordinator signifies approval of a protocol framework to be used at multiple stations
within a Region. 5 Signature by National I&M Coordinator signifies approval of a protocol used at multiple stations from two or more
Regions.
Protocol Title: National Protocol Framework for the Inventory and Monitoring of Migratory
Shorebirds
Version1 : Draft 1.0
Scope: National Authors and Affiliations S. Schmidt, Manomet
Brad Winn, Manomet
Approvals
Action Signature/Name Date
Prepared By: S. Schmidt, Manomet; Brad Winn, Manomet
Submitted By: Lee O’Brien, USFWS, NWRS, I&M
Regional I&M4
Approval:
National I&M5
Approval:
Jana Newman, USFWS , NWRS, I&M
Version1 Date Author Change Made Reason for Change

ii
Survey Protocol Summary
The majority of shorebird species (52) found nesting in North America spend most of each year
in non-breeding habitats (nine months or 75%) while either migrating, or on over-wintering
grounds. The longest distance migrants of this group fly to and from their brief nesting seasons
in northern Canada and Alaska. Declines in migrant shorebirds during the 1980’s and 1990’s
have generally stabilized in recent years Trend data derived from International Shorebird Survey
(ISS) and other sources indicate continued long-term declines in at least seven species. However,
the authors caution that 25% of North American shorebirds have no population data at all, and
more long-term survey data are needed. Shorebird trends throughout the world show declines in
the majority of species. The National Wildlife Refuge system is playing an increasingly crucial
role in maintaining, managing, protecting, shorebird habitat throughout the country.
Understanding the temporal and spatial shorebird use patterns will be important to maximize
stewardship potential on each refuge while contributing to gaps in population trend data
nationally. The protocol described in this document is meant to be used to monitor migrating and
wintering shorebirds in all potential habitats within a refuge. The design is similar to that laid out
by the Program for Regional and International Shorebird Monitoring (PRISM). PRISM outlines
a systematic approach to sampling while the survey methods are compatible with the traditional
ISS. The primary goal is to estimate the number of shorebirds utilizing stopover sites during the
spring and fall migration. These sites can then be more effectively managed to conserve focal
species on a regional or local level. The sampling frame is defined as all potential shorebird
habitats within a refuge. These areas are then divided into plots. The sampling unit is defined as
a plot at a particular point in time. Data are recorded at the plot level. Spring counts should be
made from March through June and fall counts are July through October. The winter season, if
being surveyed is November to March. Surveys can be conducted once every ten days, which is
the preferred timing. Alternatively, plots can be surveyed three times a season with the surveys
spaced according to the schedule outlined in SOP #2. Surveys should be consistently conducted
either two hours before and after high tide or low tide. Shorebird data collected with this protocol
should be entered into the Avian Knowledge Network database.
Suggested citation: Schmidt S R and Winn B. 2014. U.S. National Protocol Framework for the Inventory and
Monitoring Migratory Shorebirds. Natural Resources Program Center, Fort Collins, CO.
This protocol is available from ServCat [http://ServeCat.doc.location ]

iii
Brian Harrington, Monomoy National Wildlife Refuge, Sept. 2012
Acknowledgments
We extend our most sincere gratitude to Dr. Jon Bart for his significant contributions to the
ISS/PRISM protocol in this report and continued support of Manomet’s conservation efforts. We
also thank Brian Harrington whose commitment to shorebird science drove him to conceive,
launch, and coordinate ISS over the last three decades. Brian’s considerable efforts have
advanced our collective understanding and appreciation of shorebird migration in the Western
Hemisphere more than any other individual or institution.

iv
Contents
NWRS Survey Protocol Signature Page .......................................................................................... i
Survey Protocol Summary .............................................................................................................. ii
Acknowledgments.......................................................................................................................... iii
Narrative ......................................................................................................................................... 1
Element 1: Introduction .............................................................................................................. 1
Background ......................................................................................................................... 1
Objectives ........................................................................................................................... 2
Element 2: Sampling Design ...................................................................................................... 3
Sampling units, sample frame, and target universe ............................................................ 3
Sample selection and size ................................................................................................... 4
Survey timing and schedule ................................................................................................ 4
Sources of error ................................................................................................................... 5
Element 3: Field Methods and Sample Processing ..................................................................... 5
Pre-survey logistics and preparation ................................................................................... 5
Establishment of sampling units ......................................................................................... 6
Data collection procedures (field, lab) ................................................................................ 6
End-of-season procedures ................................................................................................... 6
Element 4: Data Management and Analysis ............................................................................... 7
Data entry, verification, and editing ................................................................................... 7
Metadata .............................................................................................................................. 7
Data security and archiving ................................................................................................ 7
Analysis methods ................................................................................................................ 7
Software .............................................................................................................................. 8
Element 5: Reporting .................................................................................................................. 8
Implications and application ............................................................................................... 8
Reporting schedule.............................................................................................................. 9
Report distribution .............................................................................................................. 9
Element 6: Personnel Requirements and Training...................................................................... 9
Roles and responsibilities ................................................................................................. 10
Qualifications .................................................................................................................... 10
Training ............................................................................................................................. 10
Element 7: Operational Requirements ..................................................................................... 10
Budget ............................................................................................................................... 10

v
Staff time ........................................................................................................................... 11
Coordination ..................................................................................................................... 11
Element 8: References .............................................................................................................. 11
Standard Operating Procedure 1: Sampling Design ..................................................................... 13
Sampling unit .................................................................................................................... 13
Target universe (inferential population) ........................................................................... 14
Sampling plan and sample selection ................................................................................. 15
Sample size ....................................................................................................................... 17
Survey timing frequency ................................................................................................... 17
Standard Operating Procedure 2: Conducting Surveys ................................................................ 18
Survey Timing – Among-year survey timing ................................................................... 18
Survey Timing – Within-year survey timing .................................................................... 19
Observational Techniques ................................................................................................. 20
Accuracy ........................................................................................................................... 20
Species Identification ........................................................................................................ 21
Recording Variables.......................................................................................................... 22
References ......................................................................................................................... 22
Standard Operating Procedure 3: Data Processing ....................................................................... 27
Setting up online data entry accounts – Project Account .. Error! Bookmark not defined.
Setting up online data entry accounts – Surveyor AccountError! Bookmark not defined.
Entering Data ..................................................................... Error! Bookmark not defined.
Entering Data - Direct Submission .................................... Error! Bookmark not defined.
Importing Data ................................................................... Error! Bookmark not defined.
Uploading Formatted Data ................................................. Error! Bookmark not defined.
References .......................................................................... Error! Bookmark not defined.
Standard Operating Procedure 4: Data Analysis .......................................................................... 32
All plots in the target universe surveyed........................................................................... 32
A sample of plots surveyed ............................................................................................... 32
Trend estimation ............................................................................................................... 33
References ......................................................................................................................... 33
Supplemental Materials 1: Formatting tips for Excel ................................................................... 34
Supplemental Materials 2: ISS Survey Form................................................................................ 37
Supplemental Materials 3: List of Helpful Websites .................................................................... 39

vi
List of Tables Table 1. Equipment and materials necessary to conduct shorebird surveys. ............................................... 5
Table 2. Example estimate of survey costs for refuge................................................................................ 11
Table 3. Plots in the sampling area............................................................................................................. 17
Table 4. Recommended survey dates for preferred Option #1.. ................................................................. 18
Table 5. Recommended survey dates Survey Options #2 and #3. ............................................................. 19
Table 6. Tide codes used to designate tidal cycle at beginning of the survey. ........................................... 20
Table 7. Accuracy of count codes .............................................................................................................. 21
Table 8. The term and definition used to record unknown shorebird species. ........................................... 21
Table 9. Overview of survey data form. ..................................................................................................... 22
Table 10. Observation Effort Type protocols refer to method used to conduct the survey. ................ Error!
Bookmark not defined.
Table 11. Checklist style data need to be formatted. .................................. Error! Bookmark not defined.
Table 12. Record style data need to be formatted. ..................................................................................... 29
Table 13. Species names should be spelled out according the following list ............................................. 30
List of Figures
Figure 1. Plot GA-45 on the Wolf Island National Wildlife Refuge (beach strata). .................................... 3
Figure 2. Example of the CONCATENATE function using the ISS survey form. ................................... 34
Figure 3. Example of the formula to calculate duration (in minutes) using the ISS survey form. ............. 35
Figure 4. The ISS Survey Form prints best on legal size (8.5” x 14”) paper. ............................................ 38

1
Narrative Element 1: Introduction
The majority shorebird species found nesting in North America spend most of the year in non-
breeding habitats both during migration and over-wintering. Thirty-five of these mostly wetland-
dependent species migrate long distances to and from their brief nesting seasons in northern
Canada and Alaska to more temperate or tropical wintering areas. Distances these birds fly can
be as far as 11,000 miles between seasonal destinations. Many of the species that fly these
distances use long-hop migration strategies, relying on specific food-rich wetland locations to
stop, rest, and replenish body weight before flying the next flight segment. Migration stopover
patterns appear as a series of Western Hemisphere stepping stones, with hundreds or thousands
of miles separating each stop (Harrington et al. 2002).
The National Wildlife Refuges are playing an increasingly crucial role in maintaining, managing,
protecting, and in some cases recreating these stepping stone wetland habitats that support
shorebirds throughout the country. Understanding the temporal and spatial shorebird use patterns
will be important to maximize stewardship potential on each individual refuge.
This survey protocol framework was modeled after the commonly used protocols developed for
the International Shorebird Survey (ISS) and Program for Regional and International Shorebird
Monitoring (PRISM) surveys. The framework will give managers, biologist, and citizen science
volunteers a template on how to record shorebird use of their particular refuge, where to record
the data, and guide the managers in how to analyze the data in order to make informed local
wetland management decisions for shorebird conservation. The ISS/PRISM survey protocols are
expected to integrate well with the fledgling Integrated Waterbird Management and Monitoring
(IWMM) currently being developed by for the Atlantic and Mississippi flyways. Please refer to
the IWMM team website at http://iwmmprogram.ning.com or for specific questions directly to
Brian Tavernia [email protected]. Background
In 1974 Manomet Center for Conservation Sciences, led by Brian Harrington, developed the
International Shorebird Surveys (ISS) to gather basic migration information on shorebirds and
the wetlands they use. Brian and Manomet recognized that there were considerable gaps in
knowledge of this understudied group of birds. The ISS and later the sister program Atlantic
Canada Shorebird Survey, set out to see what shorebirds species were migrating in what numbers
in which of the flyways. Data collected by volunteers from over 50,000 shorebird counts, at more
than 600 sites reaffirmed that many species of shorebirds depend on a finite number of migration
staging sites within the year. These results drew attention to the importance of specific refueling
stops for shorebirds, and eventually led to the establishment of the Western Hemisphere
Shorebird Reserve Network (WHSRN), one of the longest running conservation strategies in the
country.
ISS data are used principally for conservation and management initiatives. But have also been
used to identify sites in North and South America that qualify for inclusion in the Western
Hemisphere Shorebird Reserve Network (WHSRN), for charting migration timing at key sites,

2
and for developing an atlas with basic information regarding shorebird migration ecology. ISS
evaluations have helped formulate practices and inform training programs in federal agencies as
varied as the U.S. Forest Service, the Department of Defense, and the U.S. Fish and Wildlife
Service, as well as dozens of state agencies.
Data from ISS and other sources indicate there have been long-term declines in many species
and within populations in North America (Andres et al. 2012) and other data sources indicate
some major shorebird declines throughout the world (Zockler et al. 2012). The National Wildlife
Refuge system is perhaps the best platform in the U.S. on which to monitor shorebird abundance
and trends. Refuges have the ability to commit to long-term population survey data collecting
that is needed to understand population vulnerabilities with such seasonally ephemeral migrants
like shorebirds.
An important goal of the ISS is to have an operational monitoring program that provides reliable
data about distribution and trends in shorebird populations for decades. Crucial to this goal are
low costs, operations on a broad geographic scale, and competent personnel. Costs of paying for
this work would be prohibitive, so the ISS is developed around a volunteer base to gather needed
information. When followed, this survey protocol framework will help provide reliable
information to assist decisions on shorebird conservation and management.
Objectives
Management objective: The recently completed Atlantic Flyway Shorebird Conservation
Business Strategy has set a population objective of increasing shorebird populations using that
flyway by 10-15% by 2020 (http://www.manomet.org/atlantic-flyway-shorebird-conservation-
business-strategy). Species priorities and population trends will vary by Flyway, creating the
need for regionally specific management objectives. By expanding and integrating wetland acres
and management protocols for shorebirds within the National Wildlife Refuge system, the
Atlantic Flyway Conservation Business Strategy population targets can be stepped down and
customized at the regional level within all flyways. The local conservation targets and actions
should be prioritized by regional biological refuge teams.
Sampling objective: Each refuge or refuge complex will develop its own ISS sampling objectives
based on regional shorebird conservation goals. The fundamental attribute that will be measured
by observational counts is the number of shorebirds by species and strata within a refuge for a
given time period.
1. All species of shorebirds using the plots in the refuge will be surveyed;
2. Shorebird surveys will be conducted on plots within the refuge on likely habitat,
including open wetlands in fresh, brackish and saltwater. Managed impoundments, mud
flats, sand flats, and shallow water environments attract shorebird use;
3. Shorebirds are to be counted or estimated by species;
4. The target response should be annual trends in shorebird use of managed and unmanaged
refuge habitats;
5. Shorebirds tend to respond rabidly to newly exposed or available wetland habitats in
response to impoundment drawdowns or protection from human traffic, especially on
beaches. So some levels of response can be expected within days of management action
made during migratory periods.

3
6. Shorebird counts or estimates should be as accurate as possible, and surveyors can
practice estimating well in advance of the survey periods to improve estimating accuracy.
Element 2: Sampling Design
This protocol is meant to be used to monitor migrating and wintering shorebirds in all potential
habitats within a refuge. The design is similar to that laid out by the Program for Regional and
International Shorebird Monitoring (PRISM), a program that has built upon the International
Shorebird Survey (ISS) and is described in SOP 1: Sampling Design. PRISM outlines a
systematic approach to sampling while the survey methods are compatible with the traditional
ISS. The primary goal is to estimate the number of shorebirds utilizing stopover sites during the
spring and fall migration (Thomas 2005). Monitoring can provide land managers with
information on key locations within their refuge. These sites can then be more effectively
managed to conserve focal species on a regional or local level. Sampling units, sample frame, and target universe
The sampling frame is defined as all potential shorebird habitats within a refuge. These areas are
then divided into plots. The sampling unit is defined as a plot at a particular point in time. Data is
recorded at the plot level. Plot sizes can vary in size and shape. Here is an example of a plot (in
red) from the Wolf Island National Wildlife Refuge on the Georgia Coast:
Figure 1. Plot GA-45 on the Wolf Island National Wildlife Refuge (beach strata).

4
Plots should meet the following four criteria:
1) The plot is consistent with management objectives or existing monitoring areas,
2) Plots should be easy to survey,
3) It should be feasible to survey a plot within one survey window which can depend on tide
when applicable.
4) Plots should be delineated according to the intensity of shorebird use.
In situations such as coastal inlets, where the dynamic nature of the site will create continual
change, plot boundaries should be fixed points that reflect this expected change, and be large
enough to incorporate shorebird use over time. Plots should generally only include one side of
an inlet unless the inlet is small and both sides can be surveyed easily on one survey event.
The target universe depends on the management objectives. The ISS/PRISM program is
designed to estimate and monitor shorebird populations using non-breeding surveys. Ideally, the
mean number of birds present is estimated on a regional scale for inferences to be made at that
level. In some cases (Atlantic States coastal refuges), regional sampling frames have been
developed, but on most refuges, the target universe is strictly within-site. Changes in shorebird
numbers will be made on a refuge by refuge basis without inference to population trend, unless
they are part of a larger sampling frame. Check to see if there are any regional-scale shorebird
surveys in the area that the survey could be coordinated with. Coastal ISS surveys are conducted
at either high or low tide to avoid double counting. Local conditions will determine timing. Sample selection and size
Generally plots are stratified according to the number of birds expected based on historic
observations in the area (strata and proximate vicinity) (Thomas 2005) but also can be stratified
according to management objectives. Determination of strata is based on the proportion of
shorebird days (one shorebird spending 24 hours within an area) within a plot (Bart et al. 2005).
Type 1 or “to be surveyed” strata are plots with high shorebird use or are plots to be surveyed
because of a management interest. Type 2 strata have birds present in smaller numbers and Type
3 plots are areas with virtually no shorebirds.
The sample selection of plots within each strata can either be random or systematic. Two plots
within each stratum should be surveyed. The number of additional plots counted will depend on
resources allocated to surveys. Typically, all Type 1 plots should be surveyed. The Type 2 and
Type 3 plots can be determined by random selection. This design can be revisited if a shift in
shorebird use is detected. Sample size depends on the survey objectives and the number of
surveys that can be realistically delivered. Survey timing and schedule
Spring counts are made from March through early June and “fall” counts are July through
October. The winter season, if being surveyed is November to March.
Survey times should be selected systematically throughout the migration season. Surveys can be
conducted once every ten days, which is the preferred timing. The ten day interval was chosen as
the approximate length of stay at a stop-over site (Howe, Geissler and Harrington 1989). With
survey visits spread through the season, peak migration stopover numbers should be captured.

5
Alternatively, plots can be surveyed three times a season with the surveys spaced according to
the schedule outlined in SOP 2: Conducting Surveys.
Surveys should be consistently conducted either two hours before and after high tide or low tide
if circumstances favor low tide survey visits. This avoids double counting birds that move to
different habitats depending on the tide.
Surveys should only include the birds present at the start of the survey. Birds entering the survey
area are excluded from the official count. This can be challenging if the birds leave before the
surveyor can count them. Sources of error
Measurement error/bias could occur in area where habitat and uneven topography interfere with
detectability of birds. For instance, vegetation within mudflats may screen birds making them
impossible to locate (Byrne et al. 2009). Some species may prefer more vegetated areas thus
biasing the count towards the more visible species (Thomas 2005). Additionally, areas disturbed
by human use could affect the survey. Bias can occur if good shorebird habitat is inaccessible to
the surveyor. Measurement error/bias could also occur with varying observer abilities or if the
survey is attempted during a severe weather event.
Element 3: Field Methods and Sample Processing Pre-survey logistics and preparation
Shorebird identification skills, as well as training in estimating large numbers of birds should be
practiced by biologists and volunteers well in advance of the initial surveys. An excellent tool for
counting and estimating groups of birds, mammals, and fish is available at
(http://www.wildlifecounts.com).
Shorebird surveys are conducted within predetermined, plots that have been mapped with GIS or
remote sensing software. Sampling is either done from one “stationary” location, or by
“traveling” as when the observer walks a beach. In impoundments on a refuge, multiple plots can
be sampled in a “traveling” survey effort or from a “stationary” point such as an observation
platform or corner between wetland units. Criteria for point selection are that they provide 1) an
unobstructed view of the plot, 2) as a whole, provide total coverage of the plot and, 3) are safe
and reasonably easy to get to.
Field equipment should be organized and tested prior to the field season. The list of equipment is
provided in Table 1.
Table 1. Equipment and materials necessary to conduct shorebird surveys.
EQUIPMENT DATA COLLECTION
Binoculars Site Map/Plot Map Spotting Scope (preferably with weather protection) Data Form Field Guide Pen Protocol Clipboard
6
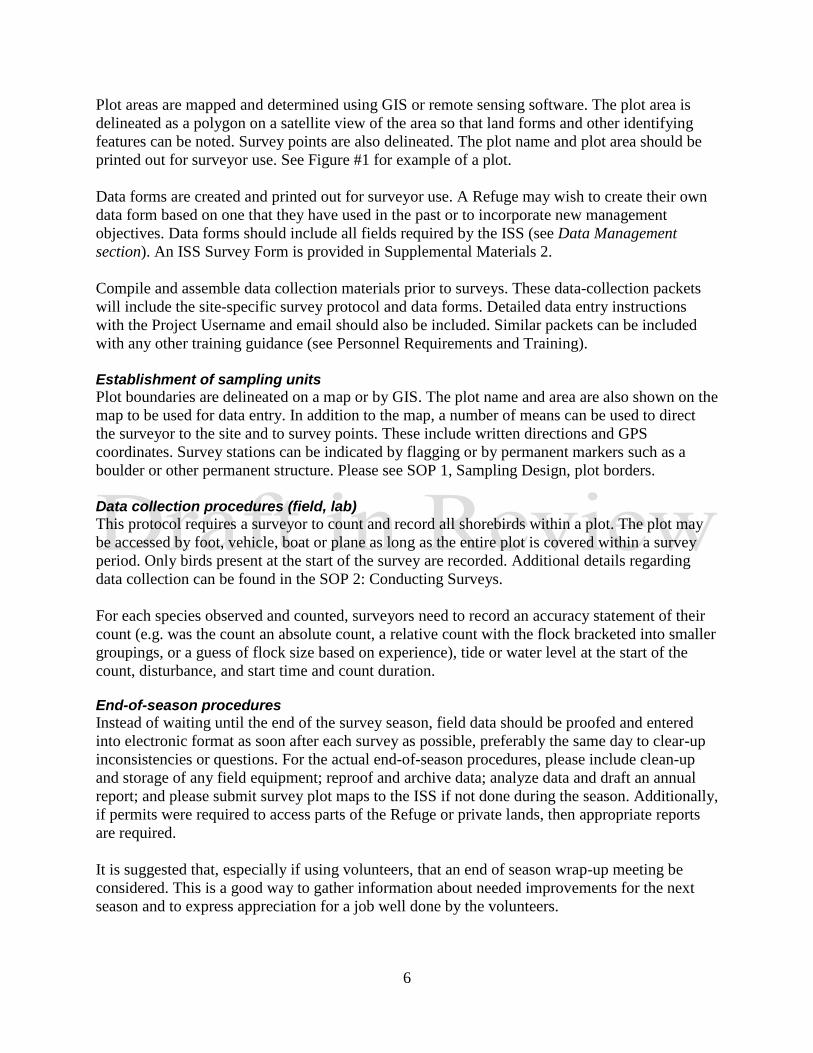
Plot areas are mapped and determined using GIS or remote sensing software. The plot area is
delineated as a polygon on a satellite view of the area so that land forms and other identifying
features can be noted. Survey points are also delineated. The plot name and plot area should be
printed out for surveyor use. See Figure #1 for example of a plot.
Data forms are created and printed out for surveyor use. A Refuge may wish to create their own
data form based on one that they have used in the past or to incorporate new management
objectives. Data forms should include all fields required by the ISS (see Data Management
section). An ISS Survey Form is provided in Supplemental Materials 2.
Compile and assemble data collection materials prior to surveys. These data-collection packets
will include the site-specific survey protocol and data forms. Detailed data entry instructions
with the Project Username and email should also be included. Similar packets can be included
with any other training guidance (see Personnel Requirements and Training).
Establishment of sampling units
Plot boundaries are delineated on a map or by GIS. The plot name and area are also shown on the
map to be used for data entry. In addition to the map, a number of means can be used to direct
the surveyor to the site and to survey points. These include written directions and GPS
coordinates. Survey stations can be indicated by flagging or by permanent markers such as a
boulder or other permanent structure. Please see SOP 1, Sampling Design, plot borders.
Data collection procedures (field, lab)
This protocol requires a surveyor to count and record all shorebirds within a plot. The plot may
be accessed by foot, vehicle, boat or plane as long as the entire plot is covered within a survey
period. Only birds present at the start of the survey are recorded. Additional details regarding
data collection can be found in the SOP 2: Conducting Surveys.
For each species observed and counted, surveyors need to record an accuracy statement of their
count (e.g. was the count an absolute count, a relative count with the flock bracketed into smaller
groupings, or a guess of flock size based on experience), tide or water level at the start of the
count, disturbance, and start time and count duration. End-of-season procedures
Instead of waiting until the end of the survey season, field data should be proofed and entered
into electronic format as soon after each survey as possible, preferably the same day to clear-up
inconsistencies or questions. For the actual end-of-season procedures, please include clean-up
and storage of any field equipment; reproof and archive data; analyze data and draft an annual
report; and please submit survey plot maps to the ISS if not done during the season. Additionally,
if permits were required to access parts of the Refuge or private lands, then appropriate reports
are required.
It is suggested that, especially if using volunteers, that an end of season wrap-up meeting be
considered. This is a good way to gather information about needed improvements for the next
season and to express appreciation for a job well done by the volunteers.

7
Element 4: Data Management and Analysis
Since the eBird database does not store covariate data along with the observational shorebird
data, we are investigating means to store shorebird data in the Avian Knowledge Network
(AKN). Once this is determined, we will update the procedures for data management and storage
here and in SOP 3: Data Processing. Data entry, verification, and editing
Enter data as soon as possible following a plot survey visit. It is very important to have a second
person familiar with the survey protocol to thoroughly review the field sheets prior to data entry.
Establish a schedule for this review check of field data. If the review and data entry are left too
long, some questions regarding species ID, erroneous numbers, or indecipherable numbers or
text might be lost. It is helpful to use different colored ink for the review from that used in the
original field work. Data checkers should initial and date the review of survey data. Metadata
Metadata provide descriptive information about the data that was collected including how it was
collected, who collected it, and data field and attribute definitions. Documentation of biological
metadata should follow the U.S. Fish and Wildlife Service’s standards as set forth by the FGDC
Biological Data Working Group, and USGS Biological Resources Division (1999) and described
by Executive Order 12906 as amended by Executive Order 13286 (Federal Geographic Data
Committee 2000; US Fish and Wildlife Service. 2013). Metadata should be archived with
original data. In most cases, the site-specific survey protocol will provide this information and a
copy of the protocol can be stored on site with the original data. Data security and archiving
Hardcopy and electronic survey data, field notes, and plot maps will be archived in compliance
with relevant Service data standards (http://www.fws.gov/stand/) and Refuge System Policy (701
FW2). Data sheets should be proofread, scanned and archived in ServCat as a digital holding of a
relevant annual report. Corrections should be made to the copied data before data entry. Field
notes may optionally be scanned and archived in ServCat in the same manner. The ServCat
metadata record for each report-data holdings should be cross-referenced to the guiding site-
specific survey protocol. Original electronic and hardcopy data should also be stored in a secure
manner. This will provide three locations of the collected data, AKN, ServCat, and at the
surveyed refuge.
Electronic data should be archived according to the Service’s Policy on Electronic Records (282
FW4; http://www.fws.gov/policy/282fw4.html ). This requires that metadata describing the data,
collection procedures, data quality, quality control parameters, formats, and storage locations
should be documented and a hardcopy stored with the original data sheets. A copy or link to the
site-specific survey protocol will typically provide the needed information. Analysis methods
SOP 4: Data Analysis, describes how to use these surveys to estimate the mean number of birds
present in the study area during the study period and to estimate trends in this mean, especially
across a series of years. Analysis depends on the number of plots surveyed in the target universe.

8
If all plots in the target universe are surveyed on the same day, then the estimated mean number
of birds is the mean of the survey totals and the estimated standard error is the square root of the
variance of the counts divided by the number of counts.
If all plots are surveyed but on different days, then the estimated mean number of birds is the
sum of the mean number of birds in each plot. If only some plots in the target universe are
sampled, then the plots need to be grouped by strata and number of plots within each stratum is
used in the estimation process.
Additional analysis of the data will be dependent upon management and sampling objectives.
Software
All analyses can be accomplished in basic spreadsheets or with programmable statistical
software (e.g., SAS; R).
Element 5: Reporting
These reporting and archiving instructions are adapted from the Landbird Monitoring Protocol
(Knutson 2008) and provide basic procedures based on U.S. Fish and Wildlife Service standards.
Each refuge may have additional procedures depending on underlying survey objectives.
Reporting includes providing written summaries of survey findings, documentations of events
that may have influenced the data, and archiving of raw data in addition to procedures described
under Data Management and Analysis. For those surveys conducted to support management,
implications and how the results inform those management activities should also be reported.
Implications and application
An annual report should be produced for each year that a survey using the protocol is conducted
to count shorebirds. This report is in addition to the reporting of data using AKN (see Data entry,
verification, and editing).
Objectives and Methods –
The objective of an annual report is to summarize the results of the annual shorebird monitoring
(initial inventory if it is the first year of survey) at the refuge and to document deviations in the
survey protocol. This would include information about shorebird use of the refuge, changes in
site-specific use over time or with management activities, and management implications, when
possible. Periodic and final synthesis of the results provided in the annual reports will likely
provide more meaningful information on trends in shorebird numbers and local use. If additional
types of data are collected, then the appropriate summary information is required according to
the stated objectives. Data uploaded to AKN will be used to establish trends in shorebird
populations and migration pathways at broader scales. Summary of Results –
In addition to reporting the information obtained by analyzing the data to estimate the mean
number of birds in study area as described in Element 4: Data Management and Analysis,

9
descriptive summary statistics may be useful especially for species of concern to the refuge or
the flyway. Important Findings –
Findings can be compared to prior year statistics to determine the magnitude of changes, if any,
that have occurred in survey areas. The importance of findings will vary according to the
management objective.
The following list of items that should be included in a report is adapted from How to develop
survey protocols: a handbook by US Fish and Wildlife Service (2013):
1. Title: Include these three items: a) Name of the survey, b) Survey ID, and
c) Date that the survey was conducted.
2. Authors: Identify names, affiliations and contact information.
3. Date prepared: Provide the date of the report.
4. Objectives: Include the management and sampling objectives identified in the survey
protocol.
5. Methods: Provide a complete description of survey and data analysis methods, citing the
appropriate survey protocol will usually suffice. Add descriptions for methods not
covered in the protocol.
6. Results: Describe the number and types of samples collected and present data summaries.
7. Problems encountered: Describe any difficulties with the data collection or analysis,
including departures from the methods in the survey protocol.
8. Important findings: Interpret the results of the survey with respect to the management
objectives or decisions that must be made. Discuss reliability of the results and provide
conclusions and any recommendations.
Reporting schedule
Annual field season summary reports are recommended in order to monitor site- and refuge-
specific shorebird observations (Byrne 2009). Additional reports, for instance reports for funding
sources or the Refuge Report Series should be produced as necessary. Data should be reported
annually to the ISS database as described in SOP 3: Data Processing, and electronic or hard
copies of survey site maps should be archived annually. Report distribution
Summary reports should be distributed internally as necessary. Data should be reported to the
ISS via the AKN portal. Electronic or hard copies of survey site maps should be sent annually to
Brad Winn ([email protected]), Manomet Center for Conservation Sciences, P.O. 1770,
Manomet, MA 02330, ATTN: ISS).
Element 6: Personnel Requirements and Training
The Refuge may choose to utilize personnel on staff to conduct the surveys; they may hire a
seasonal technician or recruit volunteers. Recruitment should take place well before the field
season to allow time for training and for paperwork and permits, if necessary, to clear.
Volunteers may be recruited to conduct the surveys. Extremely knowledgeable and willing
participants are the basis of the ISS in general and can be very effective and loyal if conducting

10
work for the refuge “in their back yard.” A volunteer coordinator is strongly suggested to
manage and coordinate volunteers. One tool that is available for training both volunteers and
biologists to count shorebirds is a program that can be ordered here
(http://www.wildlifecounts.com). Roles and responsibilities
The number of sites to be surveyed and budget will determine the number of personnel or
volunteers required to complete the survey. The survey coordinator, usually a Refuge Biologist,
will be responsible for ensuring that the site-specific survey protocol is followed. When the
number of people, paid staff or volunteers, helping to implement the survey becomes large it will
be helpful to assign someone from the crew to assist the survey coordinator, particularly in data
collection and management. Qualifications
The skills required for a surveyor position include a willingness to learn; ability to identify to
species shorebirds in winter, spring, and transitional plumage; ability to walk long distances, deal
with adverse weather, and spend long hours in the field; and have a meticulous eye for detail.
Skills may also include the ability to work with spreadsheet programs and online data entry
systems. Training
Technicians/volunteers will need to be trained in identification of shorebirds in breeding,
transition, and winter plumage, proper implementation of the survey protocol, skills and
strategies to count large flocks of shorebirds. Contact the Manomet Center for Conservation
Sciences for assistance in building these skills. Data management personnel may need instruction
in data formatting and entry into the online data entry system or spreadsheet. Training aids such
as Wildlife Counts, a program that allows one to practice estimating or counting large flocks,
provide structured learning and performance feedback.
Safety training may be in order in areas with ticks, venomous snakes, or poisonous vegetation.
Training will also be necessary if vehicle, radios and/or GPS devices are used. The types of
training needed by employees or volunteers will also vary by the environment encountered at a
refuge or in a particular region. These training requirements should be spelled out in the site-
specific survey protocol.
Volunteer services agreements (150 FW 1; FWS 2003) must be completed, when necessary.
Also, permits may be required for personnel/volunteers to enter closed areas of the refuge.
Element 7: Operational Requirements Budget
Budget considerations will depend upon the size of the refuge and the number of plots to survey.
Costs include the cost of equipment, project leader time, and field technician time (See Table 2).
Additional costs may include housing and vehicle operation and maintenance. Mileage
reimbursement should be considered if using volunteers.

11
Table 2. Example estimate of survey costs for refuge.
PHASE STATION
PERSONNEL STAFF
TIME (FTE) EQUIPMENT & CONTRACTS
OPERATION COSTS
Collect Data 1-2 staff 144 hrs/yr N/A $4,000 (incl. fuel costs) Analysis 1 staff 8 hrs/yr N/A $500 Report 1 staff & 1 vol. 40 hrs/yr N/A $2,500 Total -- 192hrs/yr -- $7,000/yr
Staff time
Staff required will depend on whether technicians are hired or volunteers recruited and the level
of survey effort. Staff will be necessary early in the year to begin the employment process for
technicians or to recruit volunteers. Volunteers may be sought through refuge Friends groups,
local birding clubs, known area birders, and local or state environmental divisions.
In preparation for the field season, staff time is required to define and stratify sampling units or
plots, delineate the boundaries of each plot on maps, draft a working version of the field and data
entry protocol, design a training program and schedule surveys. During field season staff will
need to coordinate surveys, maintain contact with technicians or volunteers and respond to issues
as they arise. At the end of the field season, staff is needed to clean and store field equipment,
manage data entry, analyze data, and write-up an end of season report. If using volunteers to
conduct the surveys, it is strongly suggested that a report/newsletter be issued that summarizes
the data analysis and acknowledges their effort in a successful season. Coordination
Coordination with other agencies or organizations may be necessary depending on the Refuge’s
situation and geographic location. In some states there are ISS Survey Coordinators available at
various levels of assistance from recruiting surveyors to training surveyors to conducting surveys
(e.g. Maine Inland Fisheries and Wildlife, New Jersey Audubon, and State of Delaware Fish &
Wildlife Shorebird Project). Coordination with these organizations and agencies will depend on
the Refuge’s need.
Element 8: References
Andres BA, Smith PA, Morrison RIG, Gratto-Trevor CL, Brown SC, Friis CA. 2012. Population
estimates of North American shorebirds, 2012. Wader Study Group Bull. 119(3): 178–194.
Bart J, Andres BA, Brown SC, Donaldson G, Harrington B, Johnston V, Jones S, Morrison RIG,
and Skagen S. 2005. The Program for Regional and International Shorebird Monitoring
(PRISM). Pages 983-901 in Ralph, C.J. and T. D. Rich (editors). Bird conservation
implementation and integration in the Americas: Proceedings of the Third international Partners
in Flight conference. General Technical Report PSW-GTR-191, U.S. Department of Agriculture
Forest Service, Albany, California.

12
Byrne MW, DeVivo JC, Maxfield JM, Wright CJ, Thompson E. 2009. Methods for monitoring
migratory and wintering shorebirds in Southeast Coast Network Parks. Natural Resource Report
NPS/SECN/NRR—2009/107. National Park Service, Fort Collins, Colorado.
Executive Order 12906. 1994. Coordinating geographic data acquisition and access: The
National Spatial Data Infrastructure. Federal Register 59(71):17671–17674.
Executive Order 13286. 2003. Amendment of executive orders, and other actions, in connection
with the transfer of certain functions to the Secretary of Homeland Security. Federal Register
68(43):10619–10633.
FGDC Biological Data Working Group and USGS Biological Resources Division. 1999. Content
Standard for Digital Geospatial Metadata - Biological Data Profile, FGDC-STD-001.1-1999
Federal Geographic Data Committee. Washington, D.C. Available:
http://www.fgdc.gov/standards/projects/FGDC-standards-
projects/metadata/biometadata/biodatap.pdf (accessed Aug 2013).
Harrington BA, Brown SC, Corven J, and Bart J. 2002. Collaborative Approaches to the
Evolution of Migration and Development of Science-based Conservation in Shorebirds. Auk.
119(4):914-921, 2002.
Howe MA, Geissler PH, Harrington BA. 1989. Population Trends of North American Shorebirds
Based on the International Shorebird Survey. Biological Conservation 49: 185-199.
Knutson MG, Danz NP, Sutherland TW, Gray BR. 2008. Landbird Monitoring Protocol for the U.S. Fish
and Wildlife Service, Midwest and Northeast Regions, Version 1. Biological Monitoring Team Technical
Report BMT‐2008‐01. U.S. Fish and Wildlife Service, La Crosse, WI. 25 pages + 11 Standard Operating
Procedures.
Thomas S. 2005. Temperate non-breeding surveys --- A key to shorebird conservation. Pages
918-923 in Ralph, C.J. and T. D. Rich (editors). Bird conservation implementation and
integration in the Americas: Proceedings of the Third international Partners in Flight conference.
General Technical Report PSW-GTR-191, U.S. Department of Agriculture Forest Service,
Albany, California.
US Fish and Wildlife Service. 2013. How to develop survey protocols: a handbook. National
Wildlife Refuge System, USFWS, Natural Resource Program Center, Fort Collins, CO.
Zöckler C, Lanctot R, Brown S, Syroechkovskiy E. 2012: Waders (Shorebirds) [in Arctic Report
Card 2012], http://www.arctic.noaa.gov/reportcard.

13
Standard Operating Procedure 1: Sampling Design
This SOP describes a sampling design for conducting nonbreeding shorebird surveys that
monitors use at managed and unmanaged wetland sites within a refuge, provides information on
habitat relationships during spring and fall migration, and helps local managers meet their
shorebird habitat and population goals. 1. All species of shorebirds using the plots in a refuge
will be surveyed; 2. Shorebird surveys will be conducted on plots within the refuge on likely
habitat, including open wetlands in fresh, brackish and saltwater. Managed impoundments, mud
flats, sand flats, and shallow water environments attract shorebirds. 3. Shorebirds are to be
counted or estimated by species;.
Sampling unit
The sampling units are defined in space and time; they may be thought of as a “plot-time,” that
is, a defined plot at a particular point in time. We discuss the two “dimensions” of the sampling
unit below.
Plot borders –
Four criteria may be used in defining plot borders.
First, plot borders should be consistent with management objectives. For example, if the plots are
in controlled impoundments, and the impoundments are managed separately, then a plot should
probably not include more than one impoundment. Data will not generally be recorded below the
plot level so if one plot covered two impoundments it would not be possible to determine later
how many birds were in each impoundment.
Second, plots should be easy to survey. For example, plots on the coast, at the mouth of a river,
should not extend across the river unless it is easy to drive around the river or birds on both sides
can be seen from one side of the river. On a coastline with few access points, the plots would
usually extend between access roads, so the surveyor could walk from one end to the other and
then be picked up, or the borders would be mid-way between access roads if the surveyor was
going to walk up and back. In general, one would not delineate a series of beach plots stretching
away from a single access point because if surveyors were going to walk to the farthest plot, they
could just as easily count birds throughout the entire stretch of beach. People familiar with the
areas will find many other ways to make the plots as easy as possible to survey.
Third, plots should be feasible to survey during one visit. If surveys are to be made during a
given period with reference to tides (e.g., within two hours of high tide), then the surveyor or
survey team must be able to complete the survey within the survey window. There is no need,
however, for plots to be the same size. Plots surveyed on foot will generally be much smaller
than plots surveyed by vehicle. If a boat is used to reach plots, and a team of surveyors is present,
then the plot may be quite large and could include several islands.
Fourth, when feasible, plots should be delineated to maximize the difference in numbers of birds.
That is, try to design the plots so some plots have lots of birds and the others have few birds. One
reason for doing this is that sampling intensity can then be higher in areas with many birds so

14
that the “good places” will be well-surveyed. Stratification is used to ensure that – even though
surveys are concentrated in good areas – an unbiased estimate is obtained of the mean number
present throughout the study area (see Sampling plan and sample selection below).
Survey times –
The temporal dimension of the survey is usually defined as a single point in time so that the
mean number present may be estimated. The mean number present times the number of days in
the survey period equals the number of bird-days (i.e., one bird-day equals a bird in the study
area for one day) which facilitates comparison of different areas and may be used, in the
ISS/PRISM program for monitoring trends in shorebirds using counts during the non-breeding
survey. In contrast, if surveyors count all birds present in the plot at any time during the survey
then the number recorded cannot easily be used to estimate mean number present. Furthermore,
the count has undesirable statistical properties. For example, its value tends to increase with
survey duration because the longer the count the more birds enter the plot. This means that if
survey duration changes, counts will probably change even if the mean number of birds in the
survey area does not change.
Defining the sampling unit as a plot-point in time means that birds which enter the plot after the
start of the survey should not be included in the official count, though they can be recorded as
incidental birds. On the other hand, birds present at the start of the survey that fly away should be
counted which may be challenging if they leave well ahead of the surveyor. When this is a
danger, the plot can be sub-divided into compartments – as described above – that are then
surveyed sequentially.
The temporal dimension usually includes time of day restrictions. For example, surveys may be
conducted during working hours within two hours of a high tide.
Target universe (inferential population)
This is the area and period of time to which statistical inferences will be made. Two broad
program objectives – which dictate very different target universes – should be distinguished. One
objective, is documenting, describing and monitoring use by shorebirds of the study area during
the study period. This is a typical objective for Refuges and other areas managed for birds and in
programs designed to ensure that shorebirds are finding suitable habitat in areas managed for
multiple use (e.g., beaches). For this objective, the target universe will usually be all areas used
by shorebirds and all times at which the areas are used.
A second objective is to participate in the ISS/PRISM program designed to estimate and monitor
shorebird populations using non-breeding surveys. This survey uses data from all participating
locations to estimate the mean number of birds present throughout the large study area during the
study period. Additionally, this data is combined with data collected by researchers using
geolocators to estimate the mean number of days that shorebirds in the population spend in the
study area during the study period. It may be shown that dividing the estimated mean number of
shorebirds in the larger study area divided by the mean number of days a shorebird spends in a
study area equals population size. Utilizing data from both types of surveys in a series of years
permits estimating trend in size. For the Refuge conducting the on the ground surveys, a subtle
problem arises in selecting the target universe. Suppose that birds feed at low tide in one area and
then move to another area at high tide. It might be natural to survey the first areas at low tide and

15
the second at high tide. Yet if this were done, then the birds would be counted twice and the
mean number of birds present in the study area would be badly over-estimated. To avoid this
problem, the target universe is carefully defined to avoid consistent double-counting. Usually
this means counting birds only at high tide, because in many cases they are easier to count then,
but in some large areas (e.g., a State) decisions have been made to count them at low tide (also
for practical reasons). Either approach may yield unbiased estimates but care is needed at the
border between areas counted at high and low tides to avoid a situation in which birds in that
area are consistently double-counted.
It is entirely feasible to design the target universe to meet both objectives. For example, a Refuge
near the coast might have many more birds at high tide, when birds leave the coast for roosting
areas on the Refuge. Refuge staff might want to conduct surveys at all times of day to document
this pattern and submit the data to the ISS/PRISM program. The data will then be culled by
analysts based on their criteria for determining trends in population.
The target universe should almost always be delineated on a map. The description of the target
universe might be “Areas in Figure xx surveyed between 1 August and 30 September between
8:00 am and 5:00 pm and within two hours of a high tide.”
Subset of the target universe available for sampling (sampled population)
In many studies, some areas cannot be surveyed (usually due to access issues). The question then
arises whether they should be included in the target universe even though they cannot be selected
for surveys. The issue to consider, in answering this question, is whether the inaccessible areas
are likely to have substantially different numbers of shorebirds than the areas that can be
surveyed. If this is likely, then these areas should be excluded from the target universe. For
example, the administrative unit might include mainland and islands and far more shorebirds
might be present on the islands. If the islands could not be surveyed, then they should be
excluded from the target universe. On the other hand, if most islands can be surveyed and a few
that cannot be surveyed have similar habitat to the others, then all the islands could be included
in the target universe. Similar principles apply in defining the temporal dimension of the target
universe. If surveys are conducted only on weekdays, but weekends are judged to have similar
numbers of birds, then all days should be included in the target universe (e.g., so that bird use
throughout the study period can be estimated). If numbers are substantially different on
weekends (e.g., lower due to high human pressure) then weekends should be excluded from the
target universe.
In deciding how much, if at all, the sampled population will differ from the target universe, keep
in mind that areas that are difficult – but not impossible – to survey can be placed in one or more
strata and sampled only occasionally. In the example above with mainland and islands, if the
islands actually can be surveyed – but at much higher cost than the mainland - then islands might
be placed in their own stratum and only a few surveys can be made in these areas. In general, this
is a much better option than completely excluding hard-to-survey areas. The section below on
designing sampling plans provides additional discussion of this issue.
Sampling plan and sample selection
Once the target population has been delineated, it must be sub-divided into plots, and – in many
cases – plots must be assigned to strata. Once plots are defined, decisions must be made about
16
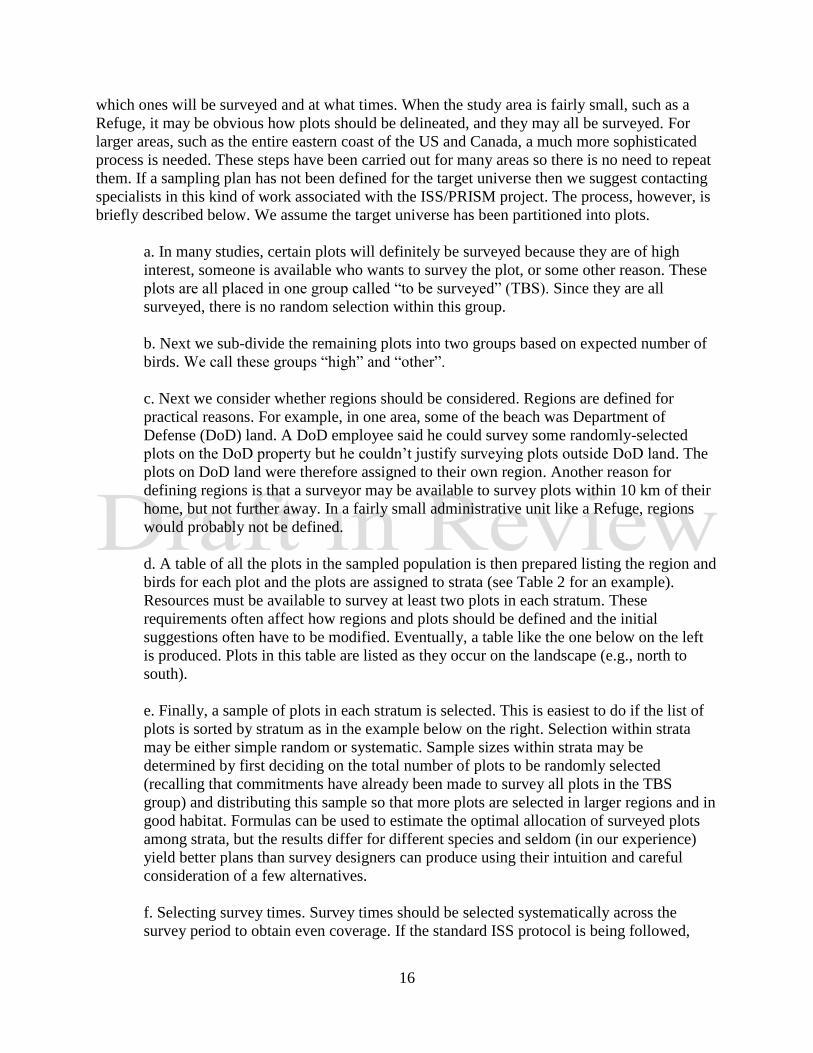
which ones will be surveyed and at what times. When the study area is fairly small, such as a
Refuge, it may be obvious how plots should be delineated, and they may all be surveyed. For
larger areas, such as the entire eastern coast of the US and Canada, a much more sophisticated
process is needed. These steps have been carried out for many areas so there is no need to repeat
them. If a sampling plan has not been defined for the target universe then we suggest contacting
specialists in this kind of work associated with the ISS/PRISM project. The process, however, is
briefly described below. We assume the target universe has been partitioned into plots.
a. In many studies, certain plots will definitely be surveyed because they are of high
interest, someone is available who wants to survey the plot, or some other reason. These
plots are all placed in one group called “to be surveyed” (TBS). Since they are all
surveyed, there is no random selection within this group.
b. Next we sub-divide the remaining plots into two groups based on expected number of
birds. We call these groups “high” and “other”.
c. Next we consider whether regions should be considered. Regions are defined for
practical reasons. For example, in one area, some of the beach was Department of
Defense (DoD) land. A DoD employee said he could survey some randomly-selected
plots on the DoD property but he couldn’t justify surveying plots outside DoD land. The
plots on DoD land were therefore assigned to their own region. Another reason for
defining regions is that a surveyor may be available to survey plots within 10 km of their
home, but not further away. In a fairly small administrative unit like a Refuge, regions
would probably not be defined.
d. A table of all the plots in the sampled population is then prepared listing the region and
birds for each plot and the plots are assigned to strata (see Table 2 for an example).
Resources must be available to survey at least two plots in each stratum. These
requirements often affect how regions and plots should be defined and the initial
suggestions often have to be modified. Eventually, a table like the one below on the left
is produced. Plots in this table are listed as they occur on the landscape (e.g., north to
south).
e. Finally, a sample of plots in each stratum is selected. This is easiest to do if the list of
plots is sorted by stratum as in the example below on the right. Selection within strata
may be either simple random or systematic. Sample sizes within strata may be
determined by first deciding on the total number of plots to be randomly selected
(recalling that commitments have already been made to survey all plots in the TBS
group) and distributing this sample so that more plots are selected in larger regions and in
good habitat. Formulas can be used to estimate the optimal allocation of surveyed plots
among strata, but the results differ for different species and seldom (in our experience)
yield better plans than survey designers can produce using their intuition and careful
consideration of a few alternatives.
f. Selecting survey times. Survey times should be selected systematically across the
survey period to obtain even coverage. If the standard ISS protocol is being followed,

17
then each selected plot will be surveyed every ten days. In the large-scale ISS/PRISM
project, plots may be surveyed only three times or even fewer if care is taken to select the
survey time(s) in a manner that insures the mean number present throughout the study
period is estimated without (selection) bias. It is very important to avoid conducting
surveys at times selected because it is known that high numbers of birds will be present.
For example, do not wait for particularly “good” weather conditions and conduct the
surveys then. That would yield a highly biased estimate of the mean number of
shorebirds present.
Table 3. All plots in the sampling area are assigned to a stratum based on shorebird use or management objectives.
PLOT STRATUM REGION BIRDS STRATUM PLOT REGION BIRDS SELECTED?
1 1 1 Good 1 1 1 Good 1
2 2 1 Other 1 4 1 Good 0
3 2 1 Other 1 6 1 Good 1
4 1 1 Good 2 2 1 Other 0
5 2 1 Other 2 3 1 Other 1
6 1 1 Good 2 5 1 Other 1
7 2 1 Other 2 4 1 Other 0
8 2 1 Other 2 8 1 Other 1
9 2 1 Other 2 9 1 Other 1
10 3 2 Other 3 10 2 Other 0
11 3 2 Other 3 11 2 Other 1
12 3 2 Other 3 12 2 Other 1
13 3 2 Other 3 13 2 Other 0
Sample size
For Refuge-specific projects, the needed sample size depends entirely on accuracy targets and
variation in numbers of shorebirds between sampling units. If advance information is available
on how these numbers vary between surveys, any statistician can offer advice on needed sample
sizes.
The needed sample size depends entirely on the survey objectives. In the ISS/PRISM project, a
good deal of attention has been given to this issue, and decisions are made based on a
compromise between what cooperators can realistically deliver and accuracy targets. In most
areas, designing a rigorous sampling plan, as described above, was much harder than getting the
needed coverage. Several states, for example, were able to survey nearly all the plots in the
initial target universe (which was for beach shorebirds). For the large-scale ISS/PRISM project,
therefore, we recommend not worrying too much about sample sizes and contacting personnel
working on the project for assistance in making final decisions.
Survey timing frequency
This issue was discussed in section 1 above, Sampling unit.

18
Standard Operating Procedure 2: Conducting Surveys
This protocol requires surveyors to count and record all shorebirds observed within the count
area. Do not record target species only. Search the entire plot area, as delineated on the plot map,
and record all shorebirds detected that were in the plot at the time the survey started. Any method
may be used (e.g., boat, foot, vehicle, aerial) as long as the entire plot is covered.
Survey Timing – Among-year survey timing Survey Option#1 (Preferred Option) –
Surveys are conducted during both spring and fall migrations (Table 3). Spring migration begins
March 15th (or April 1st in northern states) and continues until June 15th (or June 5th in
southern states; Table 3). Fall migration begins July 15th to October 25th. Winter surveys, if
conducted, run from November 5th to March 14th. Surveys should be conducted on the
recommended dates, or as close as possible +/- 3 days. Surveys are conducted every 10 day.
Table 4. Recommended survey dates throughout the spring and fall migration for preferred Option #1. Winter surveys are optional. Surveys are conducted at ten day intervals throughout migration periods or, if winter surveys are conducted, at any interval during the winter. Northern states should begin surveys on April 1st and southern states can stop spring migration surveys after June 5th.
STATES SPRING FALL WINTER
Southern March 15 July 15 November 5 - March 14
March 25 July 25
April 5 August 5
April 15 August 15
April 25 August 25
May 5 September 5
May 15 September 15
May 25 September 25
June 5 October 5
October 15
October 25
Northern April 1 July 15 November 5 - March 14
April 15 July 25
April 25 August 5
May 5 August 15
May 15 August 25
May 25 September 5
June 5 September 15
June 15 September 25
October 5
October 15 October 25

19
In general, the more counts made at an ISS site and the longer the record of years, the more
valuable a census series becomes as a scientific record. However, in the event that surveys
cannot be conducted as frequently as described in Survey Option#1, two additional, least
preferred options are described.
Survey Option#2 –
During spring migration, survey the site twice in April, twice in May and once in June between
the 1st and 10th of the month (Table 4). Counts should be at least 1 week apart. (For those in the
Southeast, survey your site once in March between the 15th and 31st of the month, twice in April
and twice in May.)
During fall migration, survey the site once in July between the 11th
and 31st, twice in August,
twice in September and twice in October. Counts should be done at least one week apart.
Survey Option #3 -
During spring migration, survey the site three times between April 1st and June 10th
(Table 4).
The first count should be between April 1st and 23rd, the second between April 24th and May
16th and the third between May 17th and June 10th. In the Southeast, the first count should be
between March 15th and April 6th, the second between April 7th and 29th and the third between
April 30th and May 22nd. Counts should be at least 14 days apart.
During fall migration, survey the site three times between July 15th
and October 15th
. The first
count should be between July 15th
and August 15th
, the second between August 16th
and
September 15th
and the third between September 16th
and October 15th
. Counts should be done at
least 14 days apart.
Table 5. Recommended survey dates and frequencies for Survey Options #2 and #3.
OPTION STATES DATES SURVEY FREQUENCY NOTES
#2 Southern March 15
th – 31
st once All surveys should be
conducted at least one week apart.
April 1st – 31
st twice
May 1st – 31
st twice
Northern April 1st – 30
th twice All surveys should be
conducted at least one week apart.
May 1st – 31
st twice
June 1st – 15
th once
#3 Southern March 15
th – April 6th once All surveys should be
conducted at least 14 days apart.
April 7th
– 29th once
April 30th
– May 22nd
once Northern April 1
st – 23
rd once All surveys should be
conducted at least 14 days apart.
April 24th
– May 16th
once
May 17th
– June 15th
once
Survey Timing – Within-year survey timing
At coastal sites, try to count at times when the survey will be most accurate. For some coastal
sites the most accurate counts are conducted within 2 hours of high tide when birds gather at
resting areas; for other sites, a better representation of the site may be within 2 hours of the low
tides when birds are feeding.

20
Using a tide chart for the area nearest the site, record the tide at the beginning of the survey.
Record the tide using the tide codes outlined in Table 5.
At inland sites or impoundments, the survey should be conducted at a time of day when
shorebirds tend to be most active, depending on your prior knowledge of the site. At inland
wetland sites (including lakes, ponds, etc.), indicate whether the water levels are Normal (N),
High (H), or Low (L). At impoundments, indicate whether the water levels are Normal (N), High
(H), or Low (L) or record the water level if a water level meter is installed.
Table 6. Tide codes used to designate tidal cycle at beginning of the survey. Adapted from Methods for monitoring migratory and wintering shorebirds in Southeast Coast Network Parks (Byrne et al. 2009).
TIDE CODE DEFINITION
1 High (~1 hour before to ~1 hour after peak)
2 Almost high, and rising (~1.5 hours before high tide)
3 Almost high, and falling (~1.5 hours after high tide)
4 Hal-tide, rising (~2.5 hours before high tide)
5 Half- tide, falling (2.5 hours after high tide)
6 Almost low, rising (~1.5 hours after low tide)
7 Almost low, falling (~1.5 hours before low tide)
8 Low (~1 hour before to 1 hour after peak)
9 Not observed, not applicable, or observations made during more than one of these periods.
Observational Techniques
Each survey should be a count of all shorebird species observed and not just target species.
Surveyors should attempt to record all shorebirds in the plot at the start of the survey. Birds that
enter the plot after the survey begins, or that are outside the plot at the start of the survey, can be
ignored or should be separately recorded as incidental sightings. If the plot is too large to see at a
single time, then it may be sub-divided into compartments small enough that the surveyor can
identify birds that leave during the survey (and are counted) or arrive after the survey begins (and
are not counted). The surveyor only counts in one compartment at a time.
Many practical problems arise in conducting the surveys. Surveyors must be careful not to push
birds ahead and then double-count them. Large, dense flocks are hard to count and may require
training with visual aids. The surveyor should approach the site quietly and slowly to minimize
surprising the birds. Scan the entire area immediately to obtain an estimate of number of birds,
number of flocks and species composition. Obtain a quick estimate of total numbers of birds and
the proportion of each species compared to the total. This is important so that if the birds are
spooked and fly away, an estimate of each species can be calculated.
Systematically count the number of birds of each species using binoculars and/or a spotting
scope. Accuracy of the count and correct identification of species is critical and addressed in the
next sections. Accuracy

21
At best it is difficult to count a thousand small sandpipers milling about on a beach. It is
important to note whether the tally is an actual a count, an estimate made by a methodical
procedure, or an educated guess. A systematically-made estimate is one where a count is made of
one or more portions of a flock and then extrapolated to determine a total count. An educated
guess ("guesstimate") is when you look at a flock and estimate the number of birds within the
flock. On the data sheet, place an asterisk (*) next to a count tally; two asterisks (**) next to a
extrapolated count; and three asterisks (***) next to the number if it is a "guesstimate".
Table 7. Accuracy of Count Code. Symbols are placed next to species survey count to indicate the level of count accuracy. Circle the number for a “guesstimate”.
SYMBOL ACCURACY OF COUNT
* Counted
** Extrapolated
*** Guesstimated
Species Identification
It may not be possible to identify all the shorebirds observed, especially in large mixed-species
flocks. For example, a couple of Western Sandpipers in a large flock of 5,000 Semipalmated
Sandpipers may be missed. This protocol requires that “identified” birds are recorded only if
they have been identified. Therefore, a mixed-flock of 500 Sanderlings and other sandpipers gets
recorded as 500 “peep sp” and not 500 Sanderlings. Resist the temptation to present accuracy
that does not exist. If unsure of the species, get as close as possible to the species by using the
definitions for “peep sp.”,” large shorebird”, “small plover sp.” rather than include everything in
“shorebird sp.” (Table 7).
Table 8. The term and definition used to record unknown shorebird species.
TERM DEFINITION/SCIENTIFIC NAME
small plover sp. Charadrius sp (Wilson’s/Killdeer/Semipalmated/Piping/Snowy)
Golden-plover sp. Pluvialis dominica/fulva
plover sp. Charadriida sp (small and large plover)
Greater/Lesser Yellowlegs Tringa melanoleuca/flavipes
Short-billed/Long-billed Dowitcher Limnodromus griseus/scolopaceus
peep sp. the 5 small Calidris shorebirds (Semipalmated/Western/Least/White-rumped/Baird’s)
large shorebird sp. Scolopacidae sp. (larger shorebirds birds such as Willet//Dowitchers/Godwit/Curlew/Whimbrel/etc.)
shorebird sp. all Charadriiformes sp.
phalarope sp. Phalaropus sp.
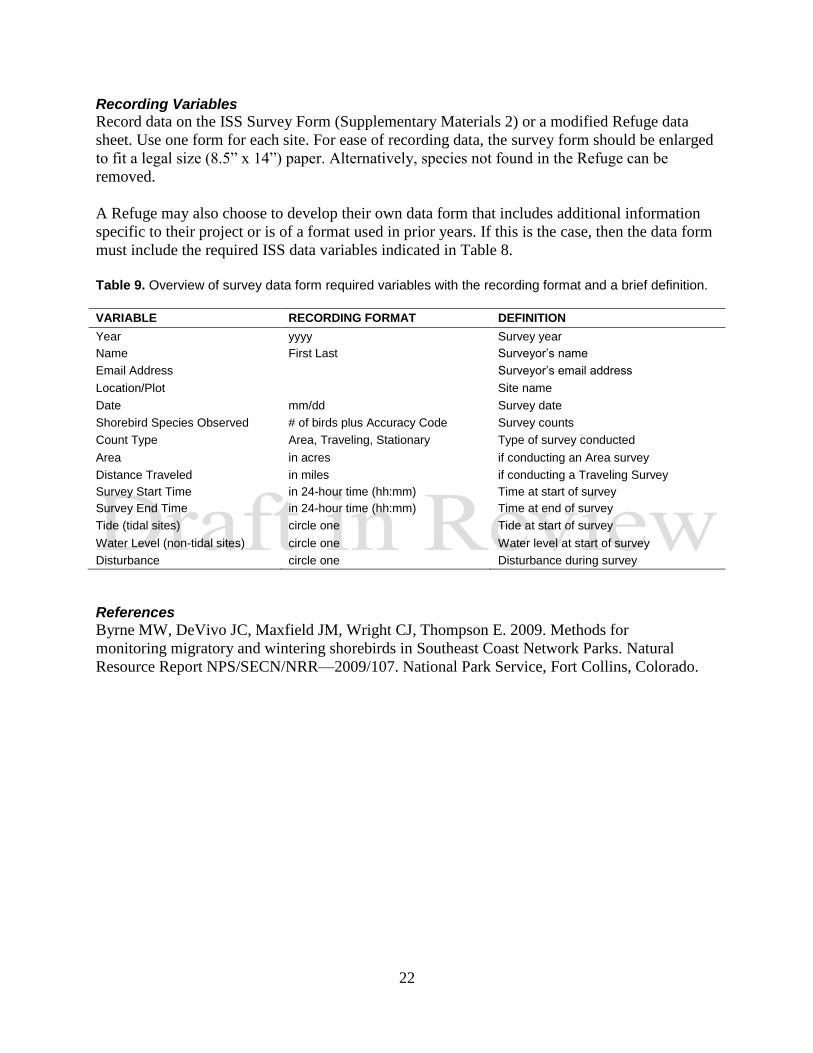
22
Recording Variables
Record data on the ISS Survey Form (Supplementary Materials 2) or a modified Refuge data
sheet. Use one form for each site. For ease of recording data, the survey form should be enlarged
to fit a legal size (8.5” x 14”) paper. Alternatively, species not found in the Refuge can be
removed.
A Refuge may also choose to develop their own data form that includes additional information
specific to their project or is of a format used in prior years. If this is the case, then the data form
must include the required ISS data variables indicated in Table 8.
Table 9. Overview of survey data form required variables with the recording format and a brief definition.
VARIABLE RECORDING FORMAT DEFINITION
Year yyyy Survey year
Name First Last Surveyor’s name
Email Address Surveyor’s email address
Location/Plot Site name
Date mm/dd Survey date
Shorebird Species Observed # of birds plus Accuracy Code Survey counts
Count Type Area, Traveling, Stationary Type of survey conducted
Area in acres if conducting an Area survey
Distance Traveled in miles if conducting a Traveling Survey
Survey Start Time in 24-hour time (hh:mm) Time at start of survey
Survey End Time in 24-hour time (hh:mm) Time at end of survey
Tide (tidal sites) circle one Tide at start of survey
Water Level (non-tidal sites) circle one Water level at start of survey
Disturbance circle one Disturbance during survey
References
Byrne MW, DeVivo JC, Maxfield JM, Wright CJ, Thompson E. 2009. Methods for
monitoring migratory and wintering shorebirds in Southeast Coast Network Parks. Natural
Resource Report NPS/SECN/NRR—2009/107. National Park Service, Fort Collins, Colorado.

27
Standard Operating Procedure 3: Data Processing
Since the eBird database does not store covariate data along with the observational shorebird
data, we are investigating means to store shorebird data in the Avian Knowledge Network
(AKN) database. This SOP will provide detailed instructions for data entry, data validation and
database administration, when data management procedures have been finalized. Currently, the
SOP provides a general overview of the AKN.
Terminology
Using the database to enter or manage data requires knowledge of a few salient terms. In the
AKN system:
AKN Regional “Project Leader” = USFWS personnel assigned to oversee all AKN
database permissions for the region, usually the Regional I&M Database Manager. This
person is the liaison to AKN and sets access permissions to the database throughout the
region. In this SOP we will refer to this role as the Regional “Project Leader” to denote
that this is not the Refuge Project Leader.
AKN Survey “Project Leader” = Survey Coordinator, usually the Refuge or Zone
Biologist. This person can give permissions to field biologists and technicians for data
entry and validation. This is the person that will be contacted if there are questions about
the data and who has a commitment to the accuracy and the validity of data entered from
your site. Throughout this SOP we will refer to this role as the Survey “Project Leader”
to denote that this is not the Refuge Project Leader.
Project = the name of the refuge, park, forest or other area over which a survey is
conducted.
Field Observer = the person or persons collecting data in the field via this protocol.
Data Entry Technician = the person entering data collected via this protocol.
Gain Access to the Database
The Survey Coordinator is the refuge lead on the survey and will need to have database access
permission from the Regional “Project Leader” before survey data for the refuge can be entered.
He or she will assign, to a Survey “Project Leader” (Survey Coordinator), permissions for project
creation, project access, and data entry. If this is an ongoing survey, the project should already
exist in the AKN database.
Proof and Archive the Data Sheets
Data entry errors influence the quality and utility of collected data. However, many of these
types of errors can be controlled through data organization, checking and entry techniques. The
following steps should be used to reduce errors in the database and make original data recording
materials available for future reference, back-up or checking.
1. Organize data sheets by survey unit to facilitate data upload. Proofread the data sheets
ensuring that they have been filled out completely. If more than one person is collecting
data, have someone that did not collect these particular data conduct the review.
2. Mark corrections on copied data sheets with red pen. Any corrected errors, or changes
made by the data “proofer” (that are entered differently into the database than they appear

28
on the data sheet) should be circled, initialed, and corrected. Notes should be written in
the margins or in the comments section whenever necessary to document the reason for
the corrections.
3. Once reviewed and corrected, scan the data sheets to have a digital archive. If a portable
computer or personal digital assistant (PDA) is used export the file into appropriate
digital storage. The process and location of this back-up information should be specified
in a site-specific survey protocol.
4. After data entry into AKN, archive the scanned data sheets or exported PDA file. If the
data are associated with a survey report, include these data as an Appendix to the report
and archive the report in ServCat. The original completed data forms or PDA file can also
be stored on site in a safe place, preferably in a designated fireproof safe or cabinet.
Enter the Data Prepare for data entry:
1. Organize your data and guidance materials to aid data entry process.
2. A data form will help verify that you have all the right data entry fields for your project.
3. A description or knowledge of the methods used for this survey.
4. The name and address of the Survey Coordinator (the person that can be contacted
regarding questions about these data, once entered).
To enter the data into the AKN database:
1. Log on to the website and use your email address and password to access the data entry
web site.
2. Enter allinformation from the datasheet into the database. The database is intended to
accept data uploaded from handheld devices (PDA’s), spreadsheets or stand-alone
databases. Check with the Regional “Project Leader” or at the website to see when this
will be available.
3. After all data from each data sheet have been entered or uploaded, proof the data in the
database, reviewing the data forms and sorting summaries (from queries) to check for
typos, errors, and blank fields. As each data sheet (or any PDA output) is proofed, date
and initial that the input data were reviewed and checked against the original data
records. The data entry person will also verify the data has been proofed in the database
by changing the status of the data records to the next appropriate level (see the user’s
manual for the database).
Verify and Validate
In general, AKN uses a tiered set of levels for indicating the data validation and access. <Briefly
describe the levels of validation that are planned for IWMM data in AKN here or show a table or
reference a user’s manual>[To be added when available]
Once the person entering data is finished, he or she needs to notify the Survey “Project Leader”
that data are ready to be proofed in the database. The Survey “Project Leader” will:
1. Ensure all datasheets have been initialed.
2. Compare the data sheets with the data records in the database and if there are no errors,
change the status of the records to the next appropriate level (see the user’s manual for
the database).

29
3. Discuss any questionable data entry or field observer errors with the Data Entry
Technician and/or Field Observer. If there are errors, the Survey “Project Leader” will
open up the records for editing.
4. After all errors are satisfactorily resolved in the database, the Survey “Project Leader”
will change the status of the records in the database back to the next appropriate level
(see the user’s manual for the database).
Data Maintenance and Archiving
AKN is responsible for performing periodic backups of all data residing in the database.
Editing of data that has already been “verified” in the database must be made in the AKN
database by the Survey “Project Leader” via the interface. Contact the Regional Data Manager
for assistance if numerous edits are needed. A detailed log identifying any changes to records
already verified as correct and dates of the change must be maintained by the Survey
Coordinator and stored along with the archived datasets in the annual reports stored in ServCat.
Table 12. Record style data need to be formatted. Be familiar with this formatting before the field season and train surveyors to record data as formatted to save time at the data entry step.
COLUMN HEADING DESCRIPTION
Common Name Species common name written according to Table 12
Genus Only required if not using Common Name
Species Only required if not using Common Name
Number # birds observed or X (X=present); include species comments by adding a “pipe” (|) (e.g. “ 200|estimated”)
Location Name ISS Site Name
Latitude decimal degrees; not required – will be able to indicate location after imported
Longitude decimal degrees; not required – will be able to indicate location after imported
Date mm/dd/yyyy
Start Time hh:mm AM/PM or 24-hour time with colon (hh:mm)
State/Province Two letter code (e.g., NY, MA, TX)
Country Code Two letter code (e.g., US, CA, MX)
Protocol Stationary, Traveling, Casual, or Area.
Number of Observers # people conducting survey
Duration Convert to minutes. Start time- end time.
All Observations Reported?
Y = reported all birds seen; N = did not report all (e.g. only reported shorebirds)
Effort Distance Miles In miles; required for Traveling protocol
Effort Area Acres In acres; required for Area protocol
**Submission Comments
Add water level, disturbance, & tide data here (e.g. Water level = xxx; Disturbance = xx; Tide = xx); other comments (no quotation marks allowed); separate comments with a semi-colon (;).

30
** Water level, disturbance, and tide data must be entered under the Notes heading along with any other comments about the survey. If these variables were originally entered under their own column headings use spreadsheet formulas to quickly combine text from multiple columns into a single column. Formula suggestions for Microsoft Excel are given in the Supplemental Materials 1 section.
Table 13. Species names should be spelled out according the following list. If you are unsure of the species, try get as close as you can by using the definitions for “peep sp.”,” large shorebird”, “small plover sp.” rather than lump everything in “shorebird sp”.
ENTRY NAME DEFINITION/SCIENTIFIC NAME
Black-bellied Plover Pluvialis squatarola
American Golden-Plover Pluvialis dominica
Pacific Golden-Plover Pluvialis fulva
Snowy Plover Charadrius alexandrinus
Wilson’s Plover Charadrius wilsonia
Semipalmated Plover Charadrius semipalmatus
Piping Plover Charadrius melodus
Killdeer Charadrius vociferus
small plover sp. = Charadrius sp (Wilson’s/Killdeer/Semipalmated/Piping/Snowy)
Golden-plover sp. Pluvialis dominica/fulva
plover sp. = Charadriida sp (small and large plover)
American Oystercatcher Haematopus palliatus
Black-necked Stilt Himantopus mexicanus
American Avocet Recurvirostra americana
Greater Yellowlegs Tringa melanoleuca
Lesser Yellowlegs Tringa flavipes
Greater/Lesser Yellowlegs Tringa melanoleuca/flavipes
Solitary Sandpiper Tringa solitaria
Willet Tringa semipalmata
Willet (Eastern) Tringa semipalmata semipalmata
Willet (Western) Tringa semipalmata inornata
Spotted Sandpiper Actitis macularius
Upland Sandpiper Bartramia longicauda
Whimbrel Numenius phaeopus
Long-billed Curlew Numenius americanus
Hudsonian Godwit Limosa haemastica
Marbled Godwit Limosa fedoa
Ruddy Turnstone Arenaria interpres
Black Turnstone Arenaria melanocephala
Surfbird Aphriza virgata
Red Knot Calidris canutus
Sanderling Calidris alba
Semipalmated Sandpiper Calidris pusilla
Western Sandpiper Calidris mauri
Least Sandpiper Calidris minutilla

31
ENTRY NAME DEFINITION/SCIENTIFIC NAME
White-rumped Sandpiper Calidris fuscicollis
Baird's Sandpiper Calidris bairdii
Pectoral Sandpiper Calidris melanotos
Dunlin Calidris alpina
Stilt Sandpiper Calidris himantopus
Buff-breasted Sandpiper Tryngites subruficollis
Short-billed Dowitcher Limnodromus griseus
Long-billed Dowitcher Limnodromus scolopaceus
Short-billed/Long-billed Dowitcher Limnodromus griseus/scolopaceus
peep sp. = the 5 small Calidris shorebirds (Semipalmated/Western/Least/White-rumped/Baird’s)
large shorebird sp. = Scolopacidae sp. (larger shorebirds birds such as Willet//Dowitchers/Godwit/Curlew/Whimbrel/etc.)
shorebird sp. = all Charadriiformes sp.
Wilson's Snipe Gallinago delicata
American Woodcock Scolopax minor
Wilson's Phalarope Phalaropus tricolor
Red-necked Phalarope Phalaropus lobatus
Red Phalarope Phalaropus fulicarius
phalarope sp. Phalaropus sp.
Purple Sandpiper Calidris maritima

32
Standard Operating Procedure 4: Data Analysis
These surveys are used mainly to estimate the mean number of birds present in the study area
during the study period and to estimate trends in this mean, especially across a series of year.
The methods used to estimate mean numbers present depend on whether all plots have been
surveyed, as might be true at a Refuge, or not, as is true in the ISS or ISS/PRISM programs.
All plots in the target universe surveyed
If all plots in the target universe have been surveyed, then the only sampling is in time. If, in
addition, all plots are surveyed on the same days, then we have one-stage systematic sampling.
Such surveys are almost always treated as simple random samples. The estimated mean number
present is simply the mean of the survey totals and the estimated standard error (SE) is the square
root of the variance of the counts divided by the number of counts:
�̂̅�𝑠𝑟𝑠 =1
𝑚∑𝑦𝑖
𝑚
𝑖
𝑆�̂�(�̂̅�𝑠𝑟𝑠) = √∑(𝑦𝑖 − �̅�)2
𝑚(𝑚 − 1)
where yi is the total number of birds counted on all plots on the ith
day, �̅� is the simple mean of
the yi, and m is number of survey days. These formulas are available in any introductory
statistical methods text and can be solved using simple programs such as Microsoft Excel.
If all plots are surveyed, but not on the same days, then we have stratified sampling with plots as
strata. In this case, we estimate the mean number of birds recorded in each plot (stratum) and
sum the results:
�̂̅�𝑠𝑡 =∑1
𝑚𝑖
𝑛
𝑖
∑𝑦𝑖𝑗
𝑚𝑖
𝑗
𝑆�̂�(�̂̅�𝑠𝑡) = √∑∑(𝑦𝑖𝑗 − �̅�𝑖)
2
𝑚𝑖(𝑚𝑖 − 1)
𝑛
𝑖
where yij is the number of birds recorded on the jth
survey of the ith
plot, �̅�𝑖 is the mean of these
surveys, mi is the number of times plot i was surveyed, and n is the number of plots. These
formulas can easily be solved using a spreadsheet such as Microsoft Excel or with more
sophisticated statistical packages such as SAS or a programming language such as R. A sample of plots surveyed
If only some plots in the target universe are surveyed (and assuming plots are assigned to strata),
then we have stratified random sampling. The formulas are similar to the ones immediately

33
above, but the strata are groups of plots and stratum sizes must be incorporated into the
estimation process. The estimates are:
�̂̅�𝑠𝑡 =∑𝑁ℎ𝑛ℎ
𝐿
ℎ
∑�̅�ℎ𝑖
𝑛ℎ
𝑖
𝑆�̂�(�̂̅�𝑠𝑡) = √∑𝑁ℎ2𝑠2(�̅�ℎ𝑖)
𝑛ℎ
𝑛
ℎ
where Nh is the total number of plots in stratum h, nh is the number of plots in stratum h that were
surveyed, �̅�ℎ𝑖 is the mean number of birds recorded on the ith
plot in stratum h, and 𝑠2(�̅�ℎ𝑖) is the
sample variance of the �̅�ℎ𝑖. These estimates can also be calculated with a spreadsheet though
more effort is required than for the cases above. One advantage of doing this, however, is that the
user then knows exactly what is being calculated whereas this may be less certain with statistical
packages. This problem does not arise with a programming language such as R because the code
is then retrievable.
Trend estimation
A large literature, recently reviewed by Gitzen et al. (2012) exists on methods for estimating
trends with counts such as the ones above. A very simple program was introduced recently by
Bart and Thomas (unpublished manuscript) that estimates trends from data collected using all
three approaches described above. References
Gitzen RA, Millspaugh JJ, Cooper A, Licht DS. 2012. Design and analysis of long-term
ecological monitoring studies. Cambridge University Press, UK

34
Supplemental Materials 1: Formatting tips for Excel
In this appendix are formulas to create the Submission Comments/Notes fields in the Record or Checklist Import formats and to help
determine Duration.
The CONCATENATE Function
If you have entered your data into a spreadsheet with columns for each variable, you will have to condense the water
level/disturbance/tide data and count accuracy data so that it will fit into the Comments sections. ISS eBird does not have separate
columns for these variables at this time.
The easiest way to condense several columns into one column and to add text is to use the CONCATENATE function in Excel. Below
is an example formula.
Figure 2. Example of the CONCATENATE function using the ISS survey form.
Final formula results. “Copy”
the information in B70/C70 and
“Paste Special – Values” into
B71/C71.
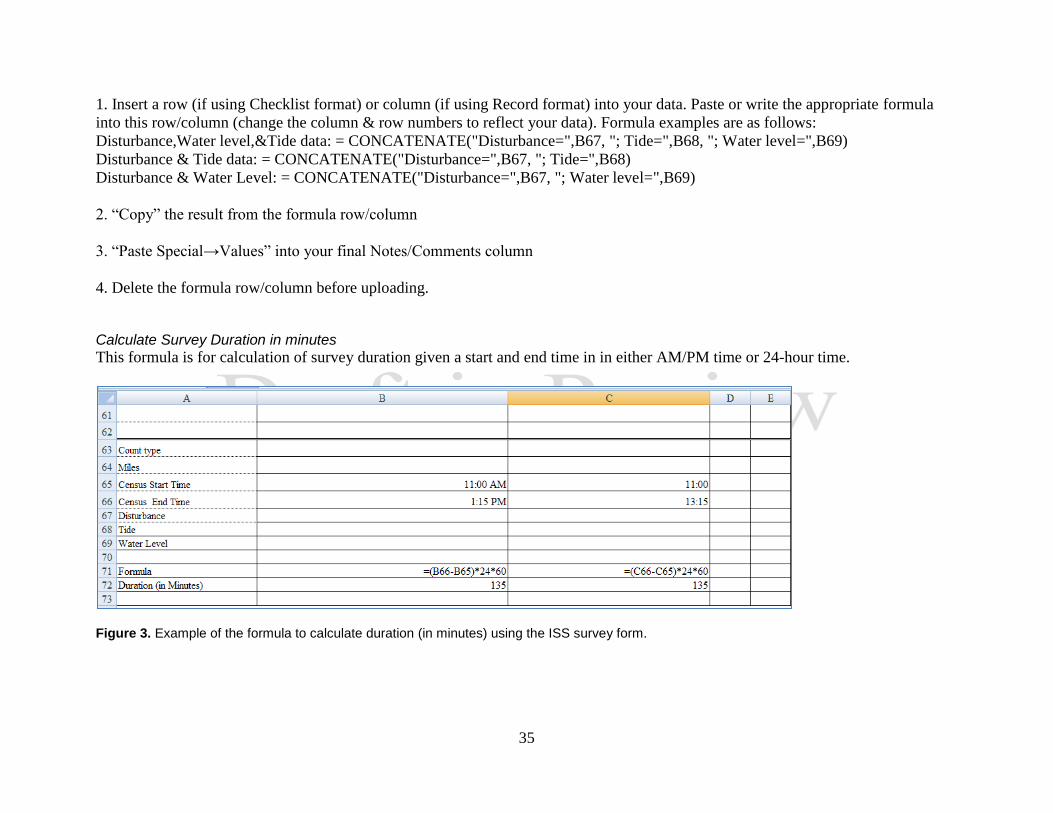
35
1. Insert a row (if using Checklist format) or column (if using Record format) into your data. Paste or write the appropriate formula
into this row/column (change the column & row numbers to reflect your data). Formula examples are as follows:
Disturbance,Water level,&Tide data: = CONCATENATE("Disturbance=",B67, "; Tide=",B68, "; Water level=",B69)
Disturbance & Tide data: = CONCATENATE("Disturbance=",B67, "; Tide=",B68)
Disturbance & Water Level: = CONCATENATE("Disturbance=",B67, "; Water level=",B69)
2. “Copy” the result from the formula row/column
3. “Paste Special→Values” into your final Notes/Comments column
4. Delete the formula row/column before uploading.
Calculate Survey Duration in minutes
This formula is for calculation of survey duration given a start and end time in in either AM/PM time or 24-hour time.
Figure 3. Example of the formula to calculate duration (in minutes) using the ISS survey form.

36
The steps for this calculation are as follows:
1. Create a Formula row and format the formula cell (e.g. B71/C71) as a number.
2. The formula is (End time – Start time)*24*60. Apply same formula to AM/PM time or to 24-hour time.
3. “Copy” the results of the Formula and “Paste Special → Values” into your final Duration (in minutes) row (e.g. B72/C72).
4. Delete the Formula row before submitting. Split Text into Separate Columns
When you download your data, Notes/Comments column will contain a string of text consisting of the disturbance, tide, water level,
and comments information. It is easy to split these comments fields so that each piece of information is in its own column as long as
you remembered to separate comments by a semi-colon(;).
1. Insert extra columns besides the Notes/Comments field.
2. Highlight the Notes/Comments field.
3. Apply “Text to Columns” in the Data tab.
4. Choose “Delimited” by a semi-colon (;).
5. Data are now in separate columns.

37
Supplemental Materials 2: ISS Survey Form
The ISS/PRISM Survey Form is formatted for legal sized paper (8 ½” x 14”) (Figure 13). This
form can be modified by the Refuge as necessary; however, all variables should be included on
the new form. One suggestion for modifying this form is to remove shorebird species not
typically found on the refuge.
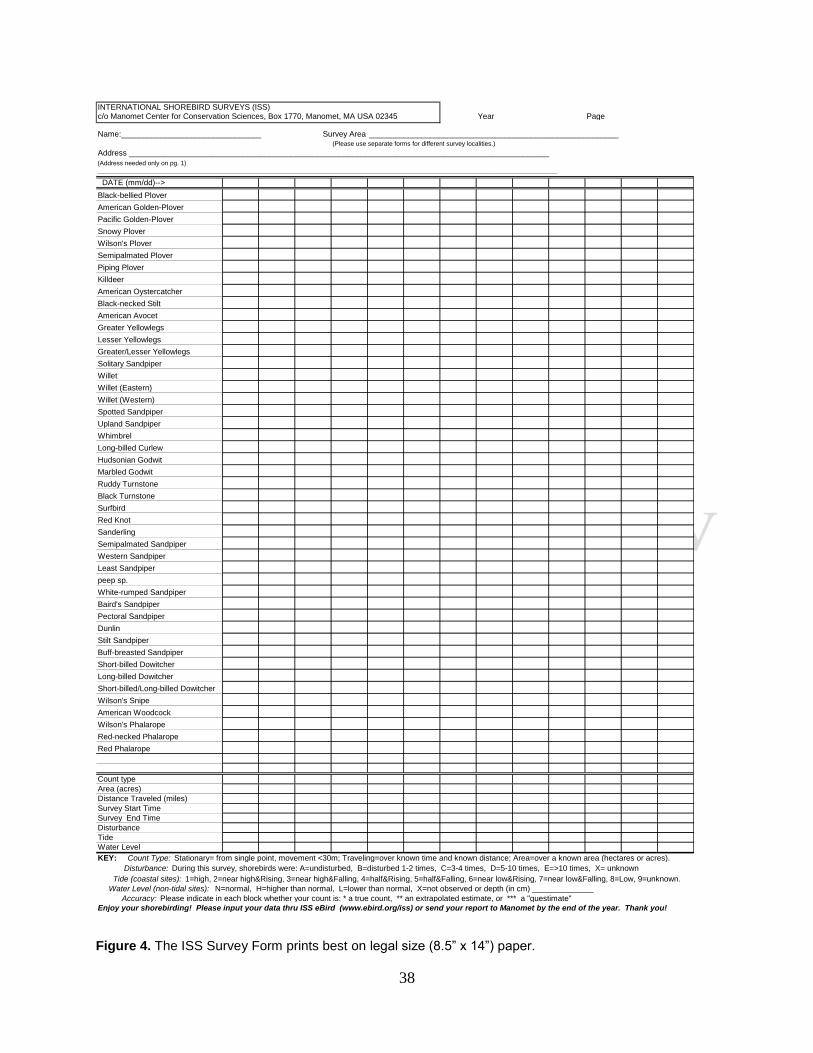
38
INTERNATIONAL SHOREBIRD SURVEYS (ISS) c/o Manomet Center for Conservation Sciences, Box 1770, Manomet, MA USA 02345 Year___________ Page __________
Name:________________________________ Survey Area _________________________________________________________(Please use separate forms for different survey localities.)
Address ________________________________________________________________________________________________
(Address needed only on pg. 1)_________________________________________________________________________________________________________
DATE (mm/dd)-->
Black-bellied Plover
American Golden-Plover
Pacific Golden-Plover
Snowy Plover
Wilson's Plover
Semipalmated Plover
Piping Plover
Killdeer
American Oystercatcher
Black-necked Stilt
American Avocet
Greater Yellowlegs
Lesser Yellowlegs
Greater/Lesser Yellowlegs
Solitary Sandpiper
Willet
Willet (Eastern)
Willet (Western)
Spotted Sandpiper
Upland Sandpiper
Whimbrel
Long-billed Curlew
Hudsonian Godwit
Marbled Godwit
Ruddy Turnstone
Black Turnstone
Surfbird
Red Knot
Sanderling
Semipalmated Sandpiper
Western Sandpiper
Least Sandpiper
peep sp.
White-rumped Sandpiper
Baird's Sandpiper
Pectoral Sandpiper
Dunlin
Stilt Sandpiper
Buff-breasted Sandpiper
Short-billed Dowitcher
Long-billed Dowitcher
Short-billed/Long-billed Dowitcher
Wilson's Snipe
American Woodcock
Wilson's Phalarope
Red-necked Phalarope
Red Phalarope
Count type
Area (acres)
Distance Traveled (miles)
Survey Start Time
Survey End Time
Disturbance
Tide
Water Level
KEY: Count Type: Stationary= from single point, movement <30m; Traveling=over known time and known distance; Area=over a known area (hectares or acres).
Disturbance: During this survey, shorebirds were: A=undisturbed, B=disturbed 1-2 times, C=3-4 times, D=5-10 times, E=>10 times, X= unknown
Tide (coastal sites): 1=high, 2=near high&Rising, 3=near high&Falling, 4=half&Rising, 5=half&Falling, 6=near low&Rising, 7=near low&Falling, 8=Low, 9=unknown.
Water Level (non-tidal sites): N=normal, H=higher than normal, L=lower than normal, X=not observed or depth (in cm) ______________
Accuracy: Please indicate in each block whether your count is: * a true count, ** an extrapolated estimate, or *** a "guestimate"
Enjoy your shorebirding! Please input your data thru ISS eBird (www.ebird.org/iss) or send your report to Manomet by the end of the year. Thank you!
Figure 4. The ISS Survey Form prints best on legal size (8.5” x 14”) paper.
39
Supplemental Materials 3: List of Helpful Websites AKN ISS site…
ISS Home Page: http://www.manomet.org/programs/shorebird-conservation/international-
shorebird-survey-iss . Protocols, Survey Forms, maps and news are found here.
The U.S. Shorebird Plan PRISM site: http://www.shorebirdplan.org/science/program-for-
regional-and-international-shorebird-monitoring/ . Additional information on the ISS/PRISM
program at the national level.

U.S. Fish and Wildlife Service U.S. Department of the Interior National Wildlife Refuge System