national report on human exposure to environmental chemicals
TRANSCRIPT

2009Fourth National Report on Human Exposure to Environmental Chemicals
Executive Summary
Department of Health and Human ServicesCenters for Disease Control and PreventionNational Center for Environmental Health

1
Background
The National Report on Human Exposure to
Environmental Chemicals (National Exposure
Report) is a series of ongoing assessments of
the U.S. population’s exposure to environmental
chemicals by measuring chemicals in people’s
blood and urine, also called biomonitoring.
The Fourth National Report on Human Exposure
to Environmental Chemicals (Fourth Report)
presents exposure data for 212 environmental
chemicals for the civilian, noninstitutionalized U.S.
population. This Fourth Report includes results
from 2003–2004, as well as data from1999–2000
and 2001–2002 as reported in the Second and
Third National Report on Human Exposure to
Environmental Chemicals.
To obtain data for this Fourth Report, the
Centers for Disease Control and Prevention
(CDC)’s Environmental Health Laboratory at
the National Center for Environmental Health
measured chemicals or their metabolites in
blood and urine from a random sample of
participants from the National Health and
Nutrition Examination Survey (NHANES).
CDC’s National Center for Health Statistics
conducts NHANES, which is a series of
surveys on the health status, health-related
behaviors, and nutrition of the U.S. population.
Since 1999, NHANES has been conducted in
continuous two-year survey cycles.
For the National Exposure Report, an environmental
chemical refers to a chemical compound or
chemical element present in air, water, food, soil,
dust, or other environmental media, such as
consumer products. Blood and urine levels reflect
the amount of the chemical that actually gets into
the body from the environment. Either the
chemical or its metabolite is measured. A metabolite
is a substance produced when body tissues
chemically alter the original compound.
The Fourth Report includes results for 75 chemicals
measured for the first time in the U.S. population.
These chemicals are in the following groups:
• acrylamideandglycidamideadducts;
• arsenicspeciesandmetabolites;
• environmentalphenols,including
bisphenolAandtriclosan;
• perchlorate;
• perfluorinatedchemicals;
• polybrominateddiphenylethers;
• volatileorganiccompounds;and
• someadditionstochemicalgroups
previously measured.
A complete listing of the 75 new chemicals is
given on page 10. A full listing of the chemicals
included in the Fourth Report is available at http://www.cdc.gov/exposurereport/pdf/NER_Chemical_List.pdf.
1

2
Interpreting the Data
The presence of an environmental chemical in
people’s blood or urine does not mean that it will
cause effects or disease. The toxicity of a chemical is
related to its dose or concentration, in addition to a
person’s individual susceptibility. Small amounts may
be of no health consequence, whereas larger
amounts may cause adverse health effects.
Research studies, separate from the National
Exposure Report, are required to determine the levels
of a chemical that may cause health effects and the
levels that are not a significant health concern. For
some chemicals, such as lead, research studies
provide a good understanding of health risks
associated with various blood levels. For most of
the environmental chemicals included in the
Fourth Report, more research is needed to determine
whether exposure at the levels reported is a cause
for health concern. CDC conducts and provides
biomonitoring measurements for this type of
research in collaboration with other agencies and
institutions.
The Fourth Report presents data that provides estimates
of exposure for the civilian, noninstitutionalized U.S.
population. The current survey design does not
permit CDC to estimate exposure on a state-by-state
or city-by-city basis. For example, CDC cannot extract
a subset of data and examine levels of blood lead that
represent a state population.
Public Health Uses of the Fourth Report
The Fourth Report provides unique exposure
information to scientists, physicians, and health
officials to help prevent effects that may result from
exposure to environmental chemicals. Specific public
health uses of the exposure information in the Fourth
Report are to:
• determinewhichchemicalsgetinto
Americans’ bodies and at what
concentrations;
• determinewhatproportionofthe
population has levels above those
associated with adverse health effects for
chemicalswithaknowntoxicitylevel;
• establishreferencevaluesthatcanbeused
by physicians and scientists to determine
whether a person or group has an unusually
highexposure;
• assesstheeffectivenessofpublichealth
efforts to reduce exposure of Americans
totracklevelsovertime;
• determinewhetherexposurelevelsare
higher among minorities, children, women
of childbearing age, or other special
groups;and
• directprioritiesforresearchonhuman
health effects from exposure.

3
Key Highlights and Findings
First-Time Exposure Information for the U.S. Population Provided for 75 Chemicals
The Fourth Report, for the first time, provides
population reference values in blood and urine,
including 95th percentile levels, for 75 chemicals.
The 95th percentile level means that 95% of the
population has concentrations below that level.
Public health officials use such reference values
to determine whether groups of people are
experiencing an exposure that is unusual
compared with an exposure experienced by
the rest of the population.
To provide scientists and public health officials
these new data quickly, CDC published much of
this exposure information on new chemicals in
separate scientific peer-reviewed publications
before the Fourth Report was released. Abstracts
and links to full-text articles are available
at http://www.cdc.gov/exposurereport/.
Widespread Exposure to Some Industrial Chemicals
Findings in the Fourth Report indicate widespread
exposure to some commonly used industrial
chemicals.
• Polybrominateddiphenylethersarefire
retardants used in certain manufactured
products. These accumulate in the
environment and in human fat tissue. One
type of polybrominated diphenyl ether,
BDE-47, was found in the serum of nearly all
of the NHANES participants.
• BisphenolA(BPA),acomponentofepoxy
resins and polycarbonates, may have
potential reproductive toxicity. General
population exposure to BPA may occur
through ingestion of foods in contact with
BPA-containing materials. CDC scientists
found bisphenol A in more than 90% of the
urine samples representative of the U.S.
population.
• Anotherexampleofwidespreadhuman
exposure included several of the
perfluorinated chemicals. One of these
chemicals, perfluorooctanoic acid (PFOA),
was a byproduct of the synthesis of other
perfluorinated chemicals and was a synthesis
aid in the manufacture of a commonly used
polymer, polytetrafluoroethylene, which is
used to create heat-resistant non-stick
coatings in cookware. Most participants had
measurable levels of this environmental
contaminant.

4
Key Highlights and Findings, cont’d
Ongoing Progress in Reducing Blood Lead Levels in Children
Progress is being made in reducing children’s
blood lead levels. New data on blood lead levels
in children aged 1 to 5 years enable estimates
of the number of children with elevated levels
(that is, levels greater than or equal to 10
micrograms per deciliter [µg/dL]). Figure 1
shows how the percentage of blood lead
levels in children has declined since the late
1970s. For example, for the period 1999–2004,
1.4% of children aged 1 to 5 years had elevated
blood lead levels, the smallest percentage of any
of the prior survey periods.
These data document that public health efforts to
reduce the number of children with elevated blood
lead levels in the general population continue to
be successful. However, the Fourth
Report also notes that other data
sources show that special populations
of children at high risk for lead
exposure (for example, children
living in homes containing lead-based
paint or lead-contaminated dust) have
higher rates of elevated blood lead
levels and remain a major public
health concern.
First-Time Assessment of Acrylamide Exposure in the U.S. Population
Acrylamide is formed when foods containing
carbohydrates are cooked at high temperatures
(e.g., French fries) and as a byproduct of tobacco
smoke. Most people are exposed to acrylamide
through the diet and from smoking. Because
acrylamide is a reactive chemical, it can bind to
proteins. These reaction products are called
adducts. CDC’s Environmental Health Laboratory
developed a new method to measure acrylamide
and its metabolite, glycidamide, as adducts of
hemoglobin, a major blood protein. This measure
reflects the dose of acrylamide and glycidamide over
the previous several months of intake. The data in
the Fourth Report show that acrylamide exposure is
extremely common in the U.S. population.
Figure 1. Percentage of children 1-5 years old in the U.S. population with elevated blood lead levels (≥ 10 μg/dL).1
Survey Years
Percent >10 µg/dL
1.44.4
8.6
88.2
0
20
40
60
80
100
1999-20041991-19941988-19911976-1980
1Jones RL, Homa DM, Meyer PA, Brody DJ, Caldwell KL, Pirkle JL, Brown MJ. Trends in blood lead levels and blood lead testing among U.S. children aged 1 to 5 years, 1988–2004. Pediatrics 2009;123(3):e376-e385.

5
Key Highlights and Findings, cont’d
First Available Exposure Data on Mercury in the U.S. Population
For the first time, the Fourth Report characterizes mercury exposure of the U.S. population aged 1 year and older.
Previous National Exposure Reports presented mercury levels for children 1–5 years old and women 16–49 years old.
Total blood mercury levels are primarily composed of one type of mercury, methyl mercury, which enters the body
mainly from dietary seafood sources. Findings in the Fourth Report show that total blood mercury levels increase
with age for all groups and begin to decline after the fifth decade of life. Compared to older women of childbearing
age, younger women have higher birth rates and lower mercury levels (see Figure 2).
Figure 2. Age-related changes in total blood mercury levels for females aged16-49 by race/ethnicity, 1999-2006.2
Eight Different Species and Metabolites of Arsenic Measured
By using special laboratory methods, CDC researchers measured total arsenic and seven other forms of
arsenic in the urine of NHANES participants for the first time. Some of the forms of arsenic measured are
metabolites of inorganic arsenic and others are less toxic species that are formed in the environment. By
differentiating these types of arsenic exposure, the Fourth Report helps scientists understand which
forms of arsenic are important to human health.
2 Caldwell KL, Mortensen ME, Jones RL, Caudill SP, Osterloh JD. Total blood mercury concentrations in the U.S. population: 1999-2006. Int J Hyg Environ Health 2009;212:588-598.
Key Highlights and Findings, cont’d
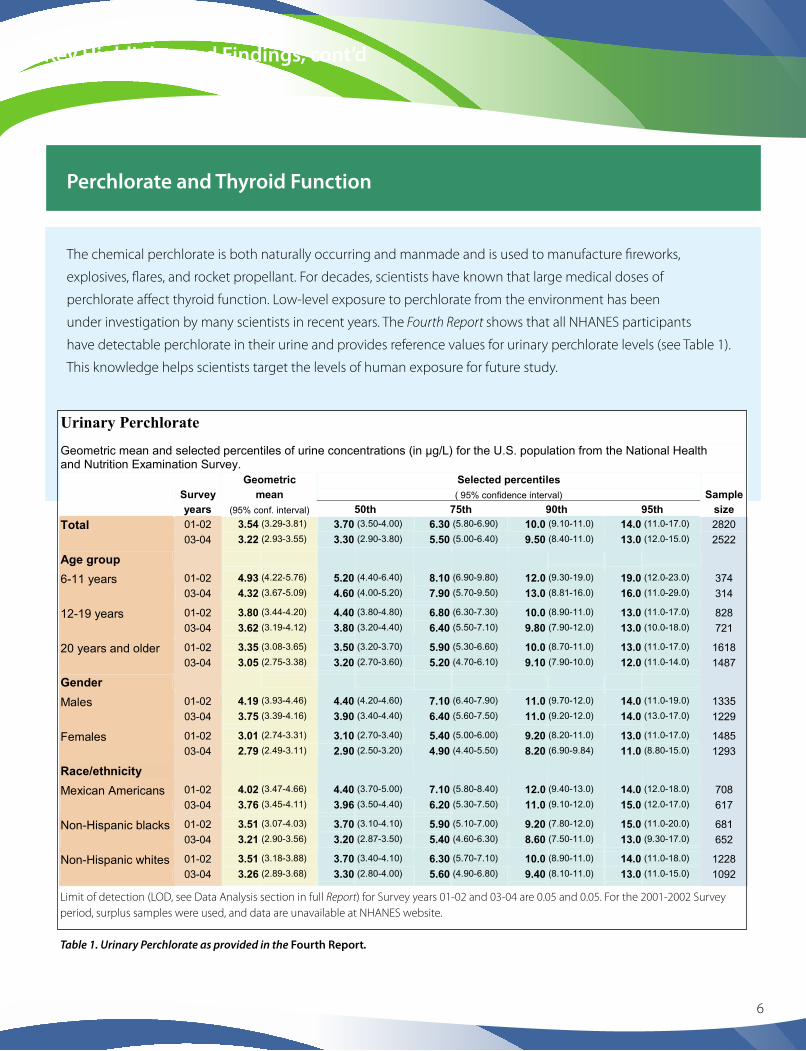
Perchlorate and Thyroid Function
The chemical perchlorate is both naturally occurring and manmade and is used to manufacture fireworks,
explosives, flares, and rocket propellant. For decades, scientists have known that large medical doses of
perchlorate affect thyroid function. Low-level exposure to perchlorate from the environment has been
under investigation by many scientists in recent years. The Fourth Report shows that all NHANES participants
have detectable perchlorate in their urine and provides reference values for urinary perchlorate levels (see Table 1).
This knowledge helps scientists target the levels of human exposure for future study.
6
Geometric Selected percentiles Survey mean ( 95% confidence interval) Sample
size years (95% conf. interval) 50th 75th 90th 95th
Total 01-02 3.54 (3.29-3.81) 3.70 (3.50-4.00) 6.30 (5.80-6.90) 10.0 (9.10-11.0) 14.0 (11.0-17.0) 2820
03-04 3.22 (2.93-3.55) 3.30 (2.90-3.80) 5.50 (5.00-6.40) 9.50 (8.40-11.0) 13.0 (12.0-15.0) 2522
Age group
6-11 years 01-02 4.93 (4.22-5.76) 5.20 (4.40-6.40) 8.10 (6.90-9.80) 12.0 (9.30-19.0) 19.0 (12.0-23.0) 374
03-04 4.32 (3.67-5.09) 4.60 (4.00-5.20) 7.90 (5.70-9.50) 13.0 (8.81-16.0) 16.0 (11.0-29.0) 314
12-19 years 01-02 3.80 (3.44-4.20) 4.40 (3.80-4.80) 6.80 (6.30-7.30) 10.0 (8.90-11.0) 13.0 (11.0-17.0) 828
03-04 3.62 (3.19-4.12) 3.80 (3.20-4.40) 6.40 (5.50-7.10) 9.80 (7.90-12.0) 13.0 (10.0-18.0) 721
20 years and older 01-02 3.35 (3.08-3.65) 3.50 (3.20-3.70) 5.90 (5.30-6.60) 10.0 (8.70-11.0) 13.0 (11.0-17.0) 1618
03-04 3.05 (2.75-3.38) 3.20 (2.70-3.60) 5.20 (4.70-6.10) 9.10 (7.90-10.0) 12.0 (11.0-14.0) 1487
Gender
Males 01-02 4.19 (3.93-4.46) 4.40 (4.20-4.60) 7.10 (6.40-7.90) 11.0 (9.70-12.0) 14.0 (11.0-19.0) 1335
03-04 3.75 (3.39-4.16) 3.90 (3.40-4.40) 6.40 (5.60-7.50) 11.0 (9.20-12.0) 14.0 (13.0-17.0) 1229
Females 01-02 3.01 (2.74-3.31) 3.10 (2.70-3.40) 5.40 (5.00-6.00) 9.20 (8.20-11.0) 13.0 (11.0-17.0) 1485
03-04 2.79 (2.49-3.11) 2.90 (2.50-3.20) 4.90 (4.40-5.50) 8.20 (6.90-9.84) 11.0 (8.80-15.0) 1293
Race/ethnicity
Mexican Americans 01-02 4.02 (3.47-4.66) 4.40 (3.70-5.00) 7.10 (5.80-8.40) 12.0 (9.40-13.0) 14.0 (12.0-18.0) 708
03-04 3.76 (3.45-4.11) 3.96 (3.50-4.40) 6.20 (5.30-7.50) 11.0 (9.10-12.0) 15.0 (12.0-17.0) 617
Non-Hispanic blacks 01-02 3.51 (3.07-4.03) 3.70 (3.10-4.10) 5.90 (5.10-7.00) 9.20 (7.80-12.0) 15.0 (11.0-20.0) 681
03-04 3.21 (2.90-3.56) 3.20 (2.87-3.50) 5.40 (4.60-6.30) 8.60 (7.50-11.0) 13.0 (9.30-17.0) 652
Non-Hispanic whites 01-02 3.51 (3.18-3.88) 3.70 (3.40-4.10) 6.30 (5.70-7.10) 10.0 (8.90-11.0) 14.0 (11.0-18.0) 1228
03-04 3.26 (2.89-3.68) 3.30 (2.80-4.00) 5.60 (4.90-6.80) 9.40 (8.10-11.0) 13.0 (11.0-15.0) 1092
Limit of detection (LOD, see Data Analysis section in full Report) for Survey years 01-02 and 03-04 are 0.05 and 0.05. For the 2001-2002 Survey period, surplus samples were used, and data are unavailable at NHANES website.
Table 1. Urinary Perchlorate as provided in the Fourth Report.
Urinary Perchlorate Geometric mean and selected percentiles of urine concentrations (in µg/L) for the U.S. population from the National Health and Nutrition Examination Survey.
2 Caldwell KL, Mortensen ME, Jones RL, Caudill SP, Osterloh JD. Total blood mercury2009;212:588-598.
concentrations in the U.S. population: 1999-2006. Int J Hyg Environ Health

7
Key Highlights and Findings, cont’d
Reduced Exposure to Environmental Tobacco Smoke
Environmental tobacco smoke (ETS) has significant
health effects on cardiovascular and respiratory
disease. Cotinine is a metabolite of nicotine, and
for nonsmokers, levels of cotinine in people’s blood
tracks exposure to ETS. In the past 15 years, data
show that blood cotinine levels for nonsmokers in
the U.S. population have decreased about 70%,
indicating that public health interventions to reduce
ETS exposure have been successful.
U.S. Population’s Exposure to Volatile Organic Compounds
People are exposed every day to volatile chemicals
in the air we breathe. The Fourth Report provides
measurements on 33 of these hydrocarbon and
halohydrocarbon-type chemicals. One example
is the gasoline additive methyl tert-butyl ether
(MTBE). Exposure to this chemical can occur
through the air we breathe or from contaminated
water sources. A high percentage of the NHANES
participants representing the U.S. population showed
detectable levels of MTBE.
Exposure to Cadmium
Recent research studies show that urine cadmium
levels as low as 1 microgram per gram of creatinine
in people may be associated with subtle markers
of effects on the kidney and with an increased risk
for low bone-mineral density. The Fourth Report
shows that about 5% of the U.S. population aged
20 years and older has urinary cadmium levels at or
near these levels. Cigarette smoking is the most likely
source for these higher cadmium levels. These
findings should promote further research on the
public health consequences of cadmium in people.

8
Selection of Chemicals for the Fourth Report
Chemicals presented in the Fourth Report were
selected on the basis of scientific data that suggested
exposure in the U.S. population; the seriousness of
health effects known or suspected to result from
exposure; the need to assess the efficacy of public
health actions to reduce exposure to a chemical; the
availability of a biomonitoring analytical method
with adequate accuracy, precision, sensitivity,
specificity, and speed; the availability of sufficient
quantity of blood or urine samples; and the
incremental analytical cost to perform the
analyses. More information is available at
http://www.cdc.gov/exposurereport/chemical_selection.htm.
Plans for Future National Exposure Reports
CDC’s goal is to make new biomonitoring exposure
information available as soon as possible to the
public and scientific community. To meet this goal,
CDC periodically releases the National Exposure
Report and also publishes biomonitoring exposure
information in peer-reviewed publications. The
National Exposure Report is cumulative, providing
biomonitoring exposure data starting in 1999
through the latest available data at the time of the
report release. Future plans include releasing data
on additional chemicals and providing more
information on exposure in population groups
defined by age, sex, and race or ethnicity.
Peer-reviewed journal articles published since the
latest release of the National Exposure Report
provide more recent and supplementary
biomonitoring data for the U.S. population. These
peer-reviewed publications typically also contain
more extensive data analysis than that provided in
the National Exposure Report.

9
About CDC’s Environmental Health Laboratory
By using advanced laboratory science and innovative
techniques, CDC’s Environmental Health Laboratory at
the National Center for Environmental Health has been
at the forefront of efforts to assess people’s exposure to
environmental chemicals. CDC’s laboratory scientists
have built on more than three decades of experience in
measuring chemicals directly in people’s blood or urine,
a process known as biomonitoring. Biomonitoring
measurements are the most health-relevant assessments
of exposure because they measure the total amount of
the chemical that actually gets into people from all
environmental sources (e.g., air, soil, water, dust, or food).
With a few exceptions, the concentration of the chemical in
people provides the best exposure information for public
health officials to evaluate the potential for adverse health
effects.

New Chemicals in the Fourth Report
Brominated Fire Retardants2,2’,4-Tribromodiphenyl ether (BDE 17) 2,4,4’-Tribromodiphenyl ether (BDE 28) 2,2’,4,4’-Tetrabromodiphenyl ether (BDE 47) 2,3’,4,4’-Tetrabromodiphenyl ether (BDE 66) 2,2’,3,4,4’-Pentabromodiphenyl ether (BDE 85) 2,2’,4,4’,5-Pentabromodiphenyl ether (BDE 99) 2,2’,4,4’,6-Pentabromodiphenyl ether (BDE 100) 2,2’,4,4’,5,5’-Hexabromodiphenyl ether (BDE 153) 2,2’,4,4’,5,6’-Hexabromodiphenyl ether (BDE 154) 2,2’,3,4,4’,5’,6-Heptabromodiphenyl ether (BDE 183) 2,2’,4,4’,5,5’-Hexabromobiphenyl (BB 153)
Disinfection By-Products (Trihalomethanes)Bromodichloromethane Dibromochloromethane (Chlorodibromomethane) Tribromomethane (Bromoform) Trichloromethane (Chloroform)
Volatile Organic CompoundsBenzene Chlorobenzene (Monochlorobenzene) 1,2-Dibromo-3-chloropropane (DBCP) Dibromomethane 1,2-Dichlorobenzene (ortho-Dichlorobenzene) 1,3-Dichlorobenzene (meta-Dichlorobenzene) 1,4-Dichlorobenzene (para-Dichlorobenzene) 1,1-Dichloroethane 1,2-Dichloroethane (Ethylene dichloride)1,1-Dichloroethene (Vinylidene chloride) cis-1,2-Dichloroethene trans-1,2-Dichloroethene Dichloromethane (Methylene chloride) 1,2-Dichloropropane 2,5-Dimethylfuran (DMF) Ethylbenzene Hexachloroethane Methyl tert-butyl ether (MTBE) Nitrobenzene Styrene 1,1,2,2-Tetrachloroethane Tetrachloroethene (Perchloroethylene) Tetrachloromethane (Carbon tetrachloride) Toluene 1,1,1-Trichloroethane (Methyl chloroform) 1,1,2-Trichloroethane Trichloroethene (Trichloroethylene, TCE) meta- and para-Xylene ortho-Xylene
AcrylamideAcrylamide hemoglobin adducts Glycidamide hemoglobin adducts
Perchlorate
Total and Speciated ArsenicArsenic, Total Arsenic (V) acid Arsenobetaine Arsenocholine Arsenous (III) acid Dimethylarsinic acid Monomethylarsonic acid Trimethylarsine oxide
Environmental PhenolsBenzophenone-3 (2-Hydroxy-4-methoxybenzophenone)Bisphenol A (2,2-bis [4-Hydroxyphenyl] propane)4-tert -Octylphenol (4-[1,1,3,3-Tetramethylbutyl] phenol)Triclosan (2,4,4’-Trichloro-2’-hydroxyphenyl ether)
Phthalate MetaboliteMono-(2-ethyl-5-carboxypentyl) phthalate (MECPP)
PerfluorochemicalsPerfluorobutane sulfonic acid (PFBuS) Perfluorodecanoic acid (PFDeA) Perfluorododecanoic acid (PFDoA) Perfluoroheptanoic acid (PFHpA) Perfluorohexane sulfonic acid (PFHxS) Perfluorononanoic acid (PFNA) Perfluorooctane sulfonamide (PFOSA) Perfluorooctane sulfonic acid (PFOS) 2-(N-Ethyl-perfluorooctane sulfonamido) acetic acid (Et-PFOSA-AcOH) 2-(N-Methyl-perfluorooctane sulfonamido) acetic acid (Me-PFOSA-AcOH)Perfluorooctanoic acid (PFOA) Perfluoroundecanoic acid (PFUA)
Non-Dioxin-Like Polychlorinated Biphenyls2,2’,3,5’-Tetrachlorobiphenyl (PCB 44) 2,2’,4,5’-Tetrachlorobiphenyl (PCB 49) 2,2’,3,3’,4,4’,5,5’,6,6’-Decachlorobiphenyl (PCB 209)
10

Centers for Disease Control and PreventionNational Center for Environmental HealthDivision of Laboratory SciencesMail Stop F-204770 Buford Highway, NEAtlanta, GA 30341-3724
Telephone: (toll free) 1-800-CDC-INFO (1-800-232-4636)Email: [email protected]: http://www.cdc.gov/exposurereport