national research center for geoanalysis wenjun qu 2017-9-23 · national research center for...
TRANSCRIPT
Scheme for high efficiency determination of critical materials elements
National Research Center for Geoanalysis
Wenjun Qu
2017-9-23

Contents
Current Research Status I
II
III
Scheme for Determination of Critical
Materials Elements
Examples of typical ore sample analysis
methods
I. Current Research Status
Method research is relatively laggard
Overuse chemical reagents
Single element analysis instruments
Lengthy procedure, Low efficiency
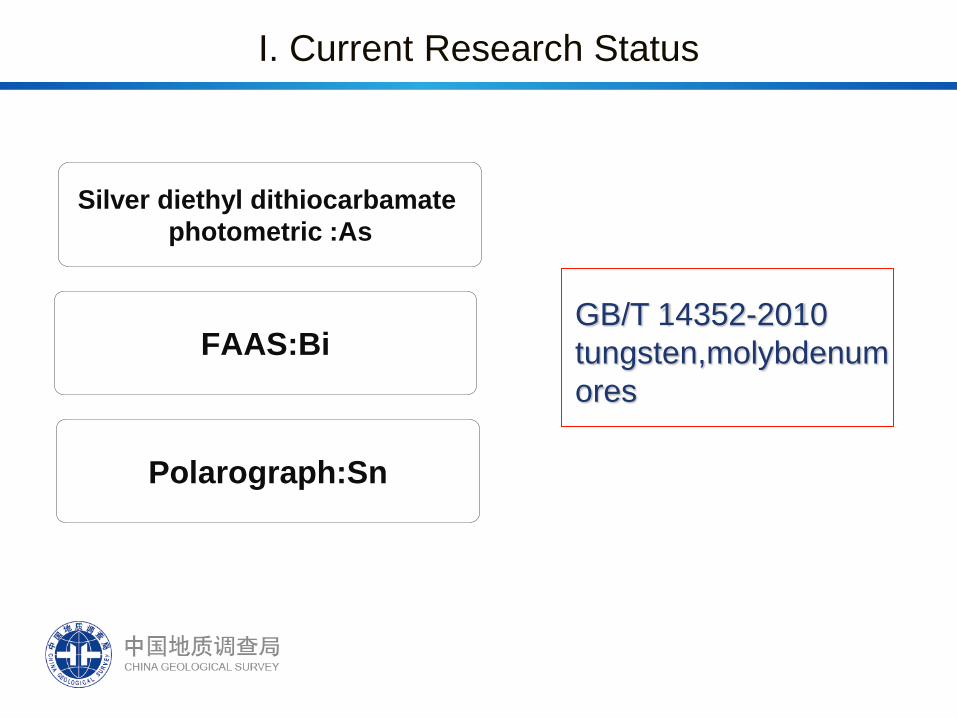
I. Current Research Status
Silver diethyl dithiocarbamate
photometric :As
FAAS:Bi
Polarograph:Sn
GB/T 14352-2010
tungsten,molybdenum
ores
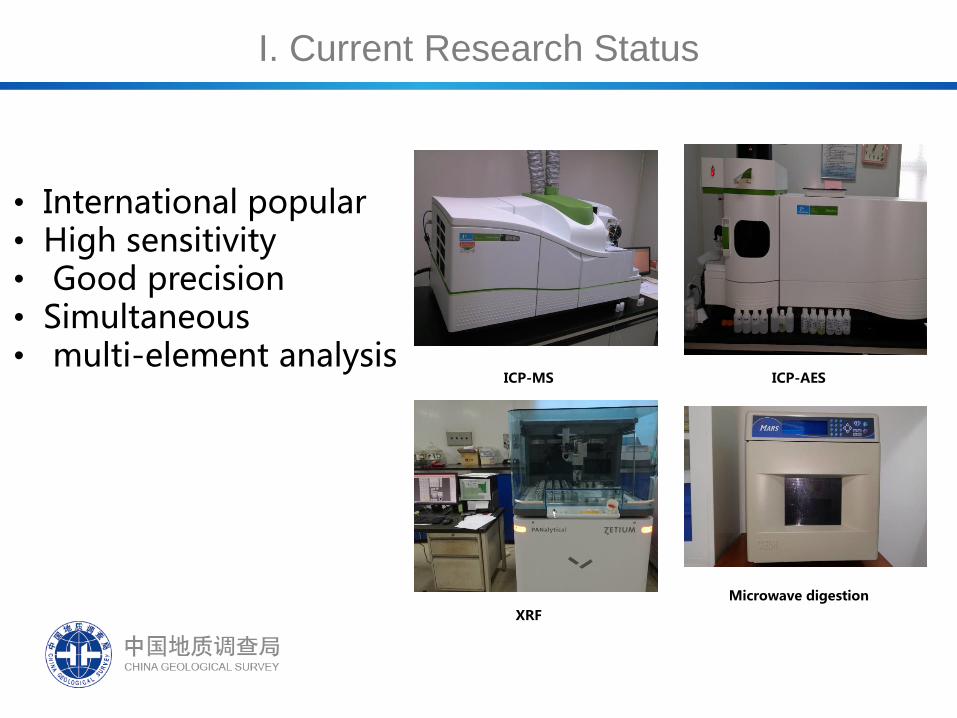
I. Current Research Status
ICP-MS
ICP-AES
XRF
Microwave digestion
• International popular • High sensitivity • Good precision • Simultaneous • multi-element analysis
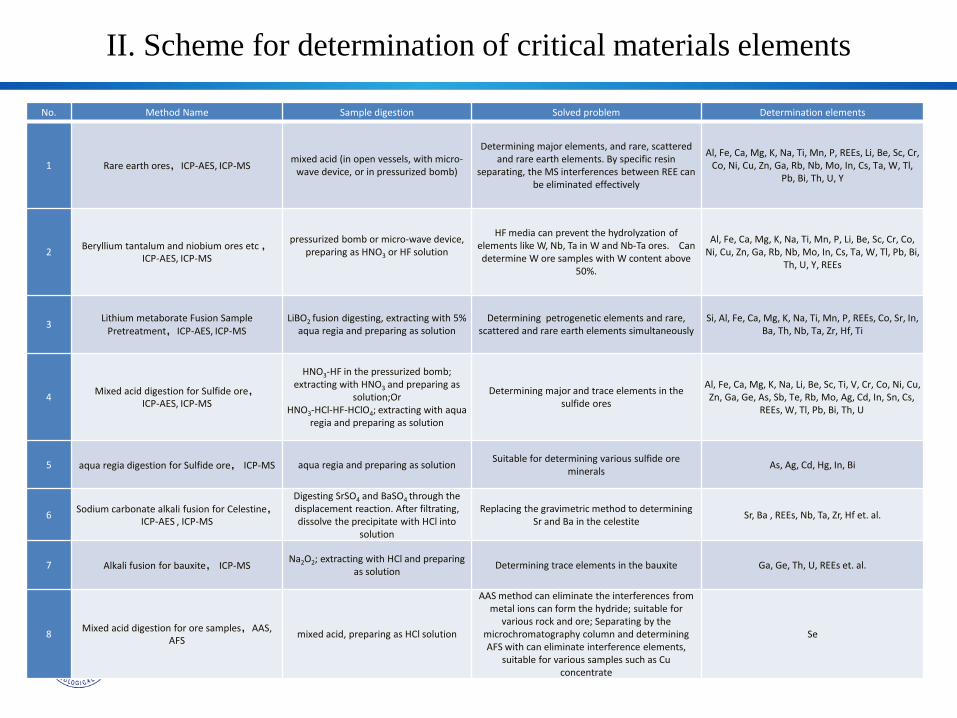
II. Scheme for determination of critical materials elements
No. Method Name Sample digestion Solved problem Determination elements
1 Rare earth ores,ICP-AES, ICP-MS mixed acid (in open vessels, with micro-
wave device, or in pressurized bomb)
Determining major elements, and rare, scattered and rare earth elements. By specific resin
separating, the MS interferences between REE can be eliminated effectively
Al, Fe, Ca, Mg, K, Na, Ti, Mn, P, REEs, Li, Be, Sc, Cr, Co, Ni, Cu, Zn, Ga, Rb, Nb, Mo, In, Cs, Ta, W, Tl,
Pb, Bi, Th, U, Y
2 Beryllium tantalum and niobium ores etc ,
ICP-AES, ICP-MS
pressurized bomb or micro-wave device, preparing as HNO3 or HF solution
HF media can prevent the hydrolyzation of elements like W, Nb, Ta in W and Nb-Ta ores. Can determine W ore samples with W content above
50%.
Al, Fe, Ca, Mg, K, Na, Ti, Mn, P, Li, Be, Sc, Cr, Co, Ni, Cu, Zn, Ga, Rb, Nb, Mo, In, Cs, Ta, W, Tl, Pb, Bi,
Th, U, Y, REEs
3 Lithium metaborate Fusion Sample
Pretreatment,ICP-AES, ICP-MS LiBO2 fusion digesting, extracting with 5%
aqua regia and preparing as solution Determining petrogenetic elements and rare,
scattered and rare earth elements simultaneously Si, Al, Fe, Ca, Mg, K, Na, Ti, Mn, P, REEs, Co, Sr, In,
Ba, Th, Nb, Ta, Zr, Hf, Ti
4 Mixed acid digestion for Sulfide ore,
ICP-AES, ICP-MS
HNO3-HF in the pressurized bomb; extracting with HNO3 and preparing as
solution;Or HNO3-HCl-HF-HClO4; extracting with aqua
regia and preparing as solution
Determining major and trace elements in the sulfide ores
Al, Fe, Ca, Mg, K, Na, Li, Be, Sc, Ti, V, Cr, Co, Ni, Cu, Zn, Ga, Ge, As, Sb, Te, Rb, Mo, Ag, Cd, In, Sn, Cs,
REEs, W, Tl, Pb, Bi, Th, U
5 aqua regia digestion for Sulfide ore, ICP-MS aqua regia and preparing as solution Suitable for determining various sulfide ore
minerals As, Ag, Cd, Hg, In, Bi
6 Sodium carbonate alkali fusion for Celestine,
ICP-AES , ICP-MS
Digesting SrSO4 and BaSO4 through the displacement reaction. After filtrating, dissolve the precipitate with HCl into
solution
Replacing the gravimetric method to determining Sr and Ba in the celestite
Sr, Ba , REEs, Nb, Ta, Zr, Hf et. al.
7 Alkali fusion for bauxite, ICP-MS Na2O2; extracting with HCl and preparing
as solution Determining trace elements in the bauxite Ga, Ge, Th, U, REEs et. al.
8 Mixed acid digestion for ore samples,AAS,
AFS mixed acid, preparing as HCl solution
AAS method can eliminate the interferences from metal ions can form the hydride; suitable for
various rock and ore; Separating by the microchromatography column and determining AFS with can eliminate interference elements,
suitable for various samples such as Cu concentrate
Se

III. Examples of typical ore sample
analysis methods
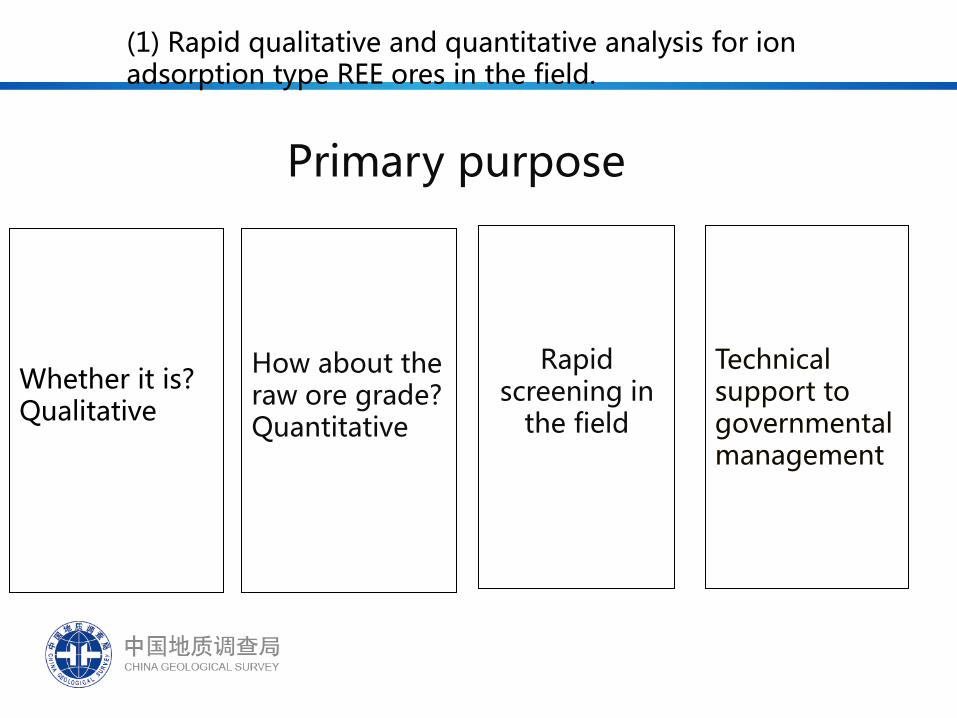
(1) Rapid qualitative and quantitative analysis for ion adsorption type REE ores in the field.
Technical support to governmental management
Primary purpose
Rapid screening in
the field
How about the raw ore grade? Quantitative
Whether it is? Qualitative
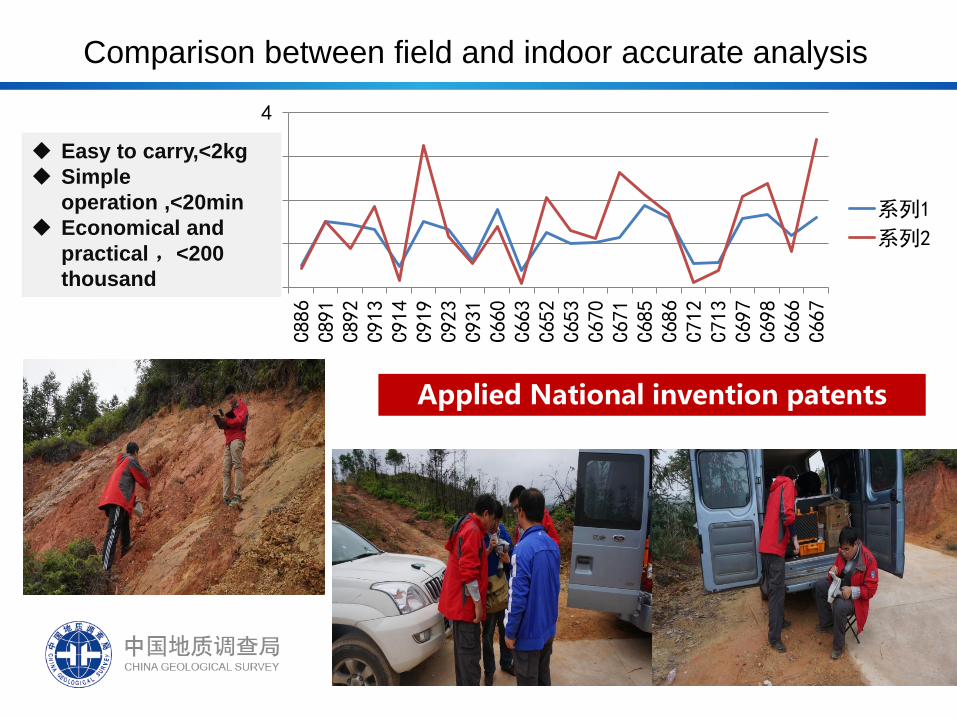
Comparison between field and indoor accurate analysis
0
1
2
3
4
C886
C891
C892
C913
C914
C919
C923
C931
C660
C663
C652
C653
C670
C671
C685
C686
C712
C713
C697
C698
C666
C667
系列1
系列2
Easy to carry,<2kg
Simple
operation ,<20min
Economical and
practical ,<200
thousand
Applied National invention patents
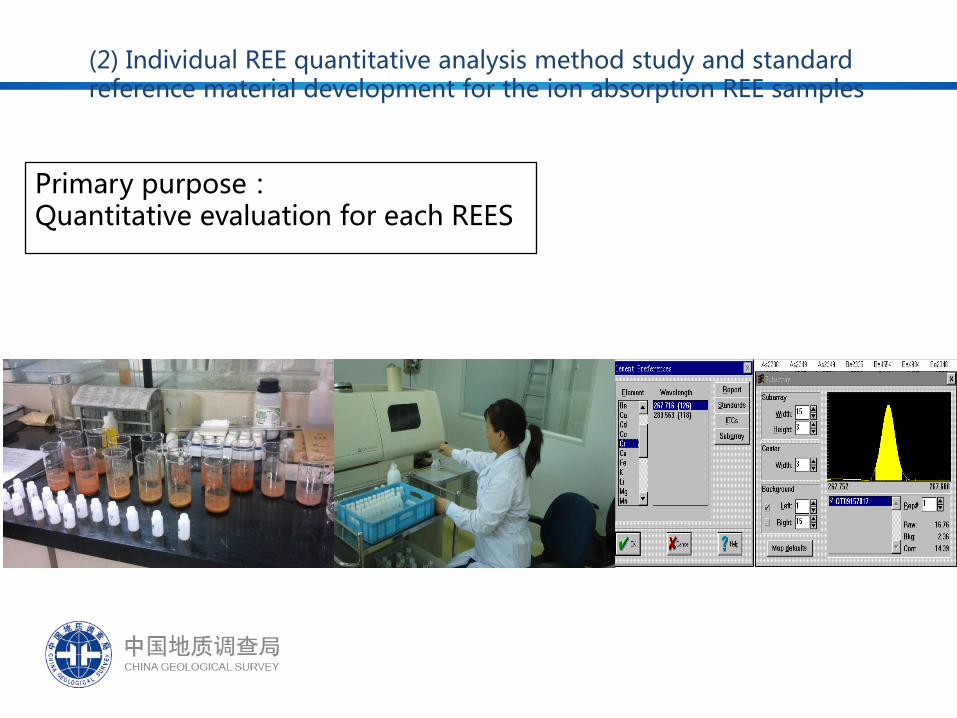
(2) Individual REE quantitative analysis method study and standard reference material development for the ion absorption REE samples
Primary purpose: Quantitative evaluation for each REES
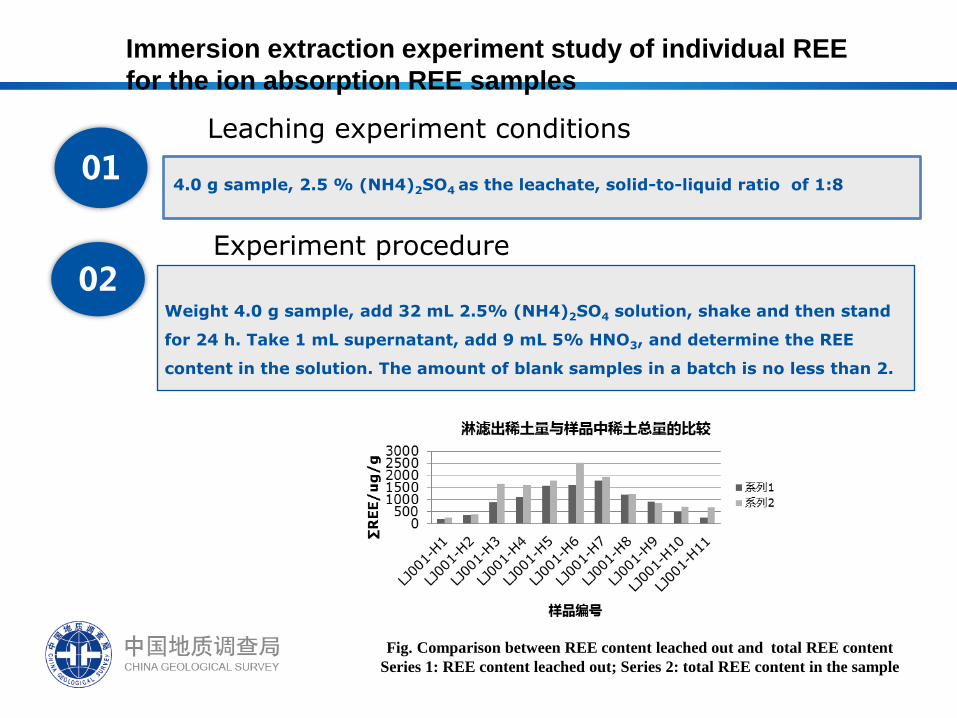
Immersion extraction experiment study of individual REE
for the ion absorption REE samples
01 Leaching experiment conditions
02 Experiment procedure
Weight 4.0 g sample, add 32 mL 2.5% (NH4)2SO4 solution, shake and then stand
for 24 h. Take 1 mL supernatant, add 9 mL 5% HNO3, and determine the REE
content in the solution. The amount of blank samples in a batch is no less than 2.
4.0 g sample, 2.5 % (NH4)2SO4 as the leachate, solid-to-liquid ratio of 1:8
Fig. Comparison between REE content leached out and total REE content
Series 1: REE content leached out; Series 2: total REE content in the sample
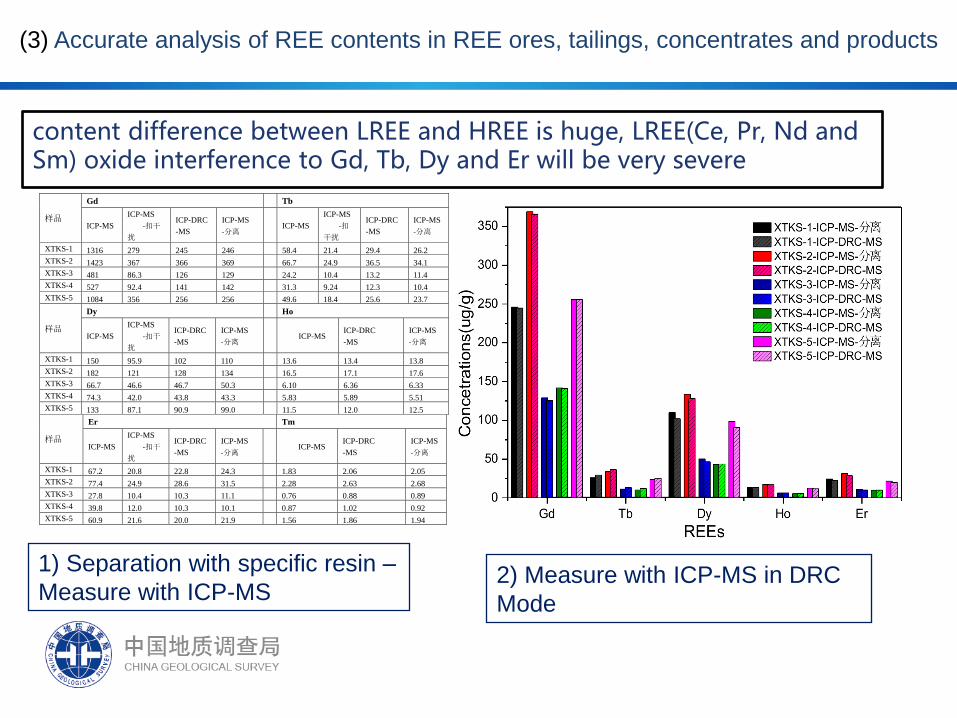
(3) Accurate analysis of REE contents in REE ores, tailings, concentrates and products
content difference between LREE and HREE is huge, LREE(Ce, Pr, Nd and Sm) oxide interference to Gd, Tb, Dy and Er will be very severe
1) Separation with specific resin –
Measure with ICP-MS 2) Measure with ICP-MS in DRC
Mode
样品
Gd Tb
ICP-MS
ICP-MS
-扣干
扰
ICP-DRC
-MS
ICP-MS
-分离
ICP-MS
ICP-MS
-扣
干扰
ICP-DRC
-MS
ICP-MS
-分离
XTKS-1 1316 279 245 246 58.4 21.4 29.4 26.2
XTKS-2 1423 367 366 369 66.7 24.9 36.5 34.1
XTKS-3 481 86.3 126 129 24.2 10.4 13.2 11.4
XTKS-4 527 92.4 141 142 31.3 9.24 12.3 10.4
XTKS-5 1084 356 256 256 49.6 18.4 25.6 23.7
样品
Dy Ho
ICP-MS
ICP-MS
-扣干
扰
ICP-DRC
-MS
ICP-MS
-分离
ICP-MS ICP-DRC
-MS
ICP-MS
-分离
XTKS-1 150 95.9 102 110 13.6 13.4 13.8
XTKS-2 182 121 128 134 16.5 17.1 17.6
XTKS-3 66.7 46.6 46.7 50.3 6.10 6.36 6.33
XTKS-4 74.3 42.0 43.8 43.3 5.83 5.89 5.51
XTKS-5 133 87.1 90.9 99.0 11.5 12.0 12.5
样品
Er Tm
ICP-MS
ICP-MS
-扣干
扰
ICP-DRC
-MS
ICP-MS
-分离
ICP-MS ICP-DRC
-MS
ICP-MS
-分离
XTKS-1 67.2 20.8 22.8 24.3 1.83 2.06 2.05
XTKS-2 77.4 24.9 28.6 31.5 2.28 2.63 2.68
XTKS-3 27.8 10.4 10.3 11.1 0.76 0.88 0.89
XTKS-4 39.8 12.0 10.3 10.1 0.87 1.02 0.92
XTKS-5 60.9 21.6 20.0 21.9 1.56 1.86 1.94
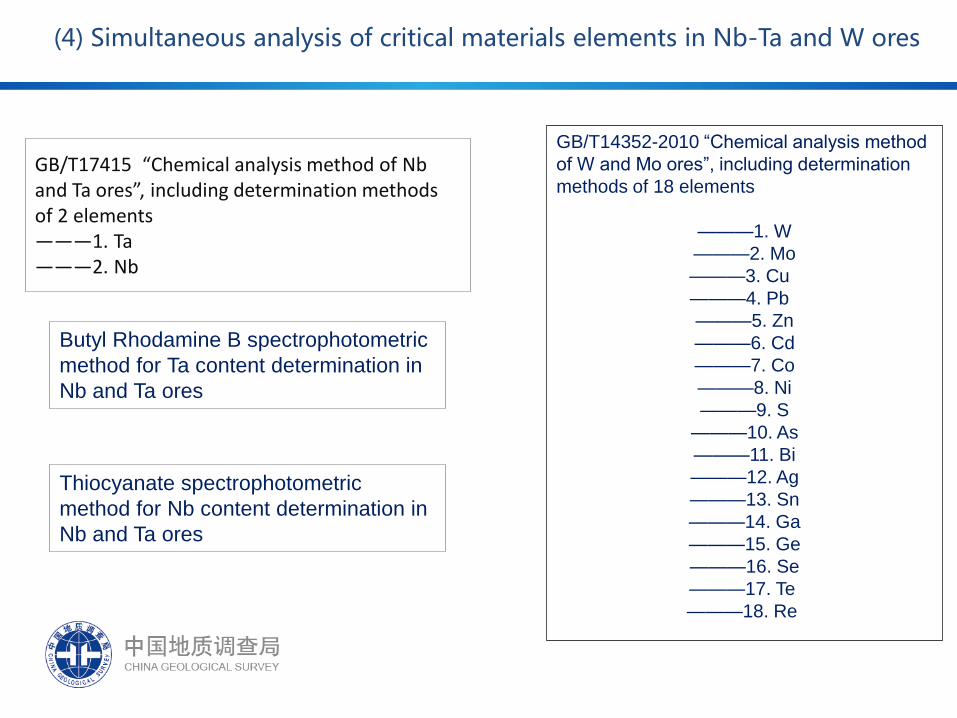
(4) Simultaneous analysis of critical materials elements in Nb-Ta and W ores
GB/T14352-2010 “Chemical analysis method
of W and Mo ores”, including determination
methods of 18 elements
———1. W
———2. Mo
———3. Cu
———4. Pb
———5. Zn
———6. Cd
———7. Co
———8. Ni
———9. S
———10. As
———11. Bi
———12. Ag
———13. Sn
———14. Ga
———15. Ge
———16. Se
———17. Te
———18. Re
GB/T17415 “Chemical analysis method of Nb and Ta ores”, including determination methods of 2 elements ———1. Ta ———2. Nb
Butyl Rhodamine B spectrophotometric
method for Ta content determination in
Nb and Ta ores
Thiocyanate spectrophotometric
method for Nb content determination in
Nb and Ta ores
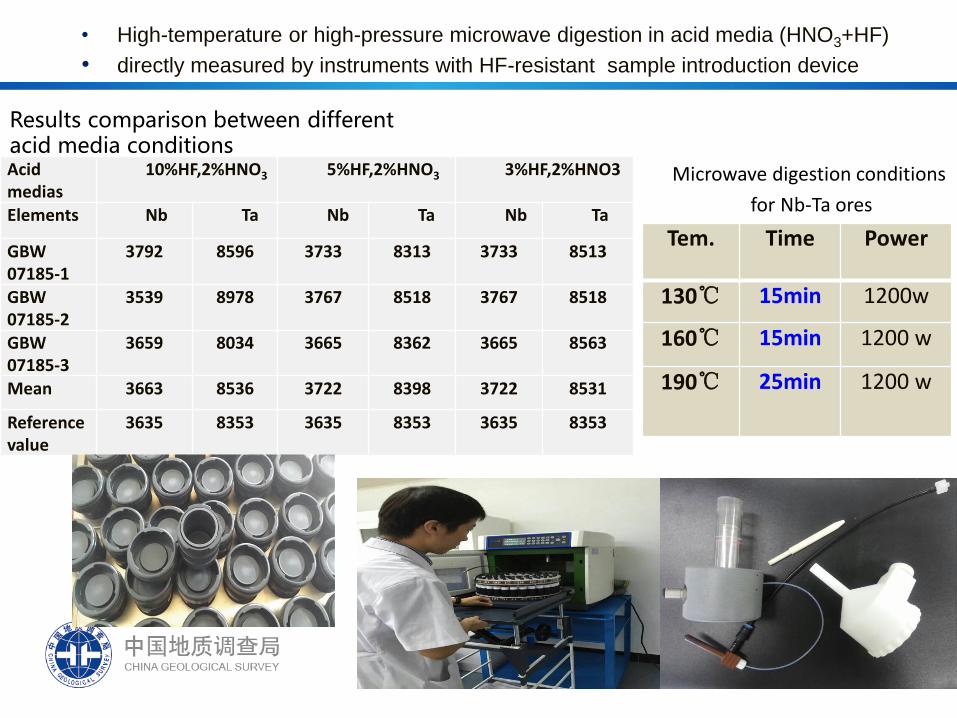
• High-temperature or high-pressure microwave digestion in acid media (HNO3+HF)
• directly measured by instruments with HF-resistant sample introduction device
Acid medias
10%HF,2%HNO3 5%HF,2%HNO3 3%HF,2%HNO3
Elements Nb Ta Nb Ta Nb Ta
GBW 07185-1
3792 8596 3733 8313 3733 8513
GBW 07185-2
3539 8978 3767 8518 3767 8518
GBW 07185-3
3659 8034 3665 8362 3665 8563
Mean 3663 8536 3722 8398 3722 8531
Reference value
3635 8353 3635 8353 3635 8353
Tem.
Time Power
130℃ 15min 1200w
160℃ 15min 1200 w
190℃ 25min 1200 w
Results comparison between different acid media conditions
Microwave digestion conditions
for Nb-Ta ores

Technical Features
•High-temperature pressurized acid digestion
•High-efficient micro-wave digestion
Sample digestion technique – less reagent consumption
•Sample solutions can be directly measured by ICP-AES and ICP-MS
•Effectively avoid the hydrolyzation of Nb, Ta and W
HF-resistant sample introduction system – easy operation
• Analyzable content range: ppm - %
• The advantage in analyzing high content samples is more prominent
Wide dynamic range – both raw ore and concentrate can be
analyzed
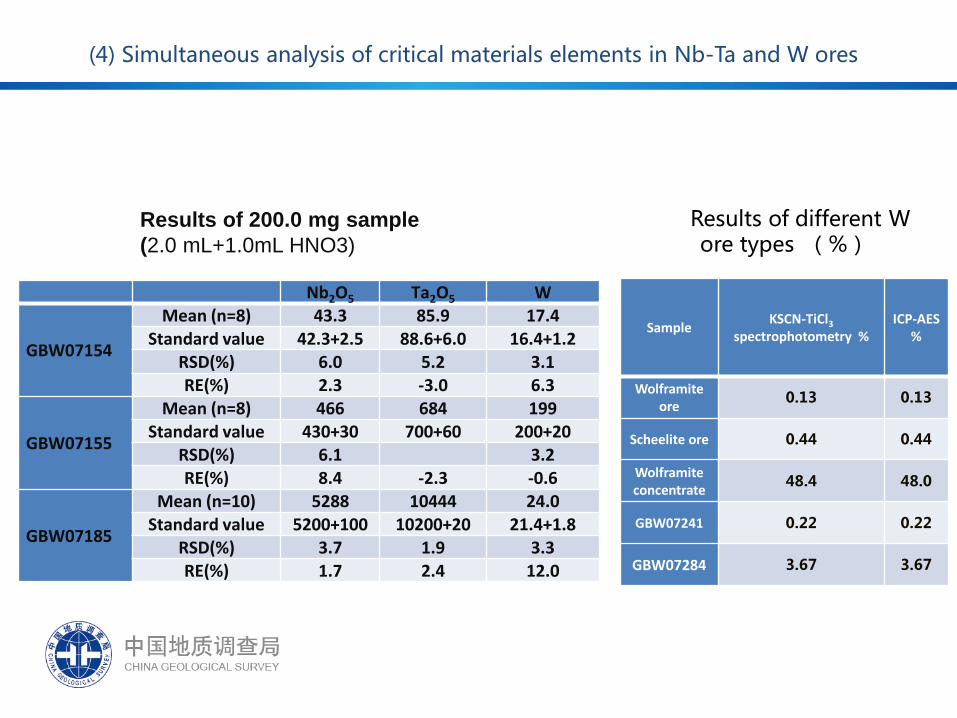
(4) Simultaneous analysis of critical materials elements in Nb-Ta and W ores
Results of 200.0 mg sample
(2.0 mL+1.0mL HNO3)
Results of different W ore types (%)
Nb2O5 Ta2O5 W
GBW07154
Mean (n=8) 43.3 85.9 17.4 Standard value 42.3+2.5 88.6+6.0 16.4+1.2
RSD(%) 6.0 5.2 3.1 RE(%) 2.3 -3.0 6.3
GBW07155
Mean (n=8) 466 684 199 Standard value 430+30 700+60 200+20
RSD(%) 6.1 3.2 RE(%) 8.4 -2.3 -0.6
GBW07185
Mean (n=10) 5288 10444 24.0 Standard value 5200+100 10200+20 21.4+1.8
RSD(%) 3.7 1.9 3.3 RE(%) 1.7 2.4 12.0
Sample KSCN-TiCl3
spectrophotometry %
ICP-AES %
Wolframite ore
0.13 0.13
Scheelite ore 0.44 0.44
Wolframite concentrate
48.4 48.0
GBW07241 0.22 0.22
GBW07284 3.67 3.67

Thanks for your attention !