national research council mapping science committee floodplain mapping – sensitivity and errors
DESCRIPTION
National Research Council Mapping Science Committee Floodplain Mapping – Sensitivity and Errors. Scott K. Edelman, PE Watershed Concepts and Karen Schuckman, EarthData March 30, 2005 Washington, D.C. Agenda. Factors Contributing to Floodplain Boundary Accuracy A. Terrain Data - PowerPoint PPT PresentationTRANSCRIPT
National Research CouncilMapping Science CommitteeFloodplain Mapping – Sensitivity and ErrorsScott K. Edelman, PE
Watershed Concepts
and Karen
Schuckman,
EarthData
March 30, 2005
Washington, D.C.
March 30, 2005 2
Agenda Factors Contributing to Floodplain Boundary
Accuracy
A. Terrain Data
B. Hydrologic Analysis
C. Hydraulic Analysis
D. Floodplain Mapping
March 30, 2005 3
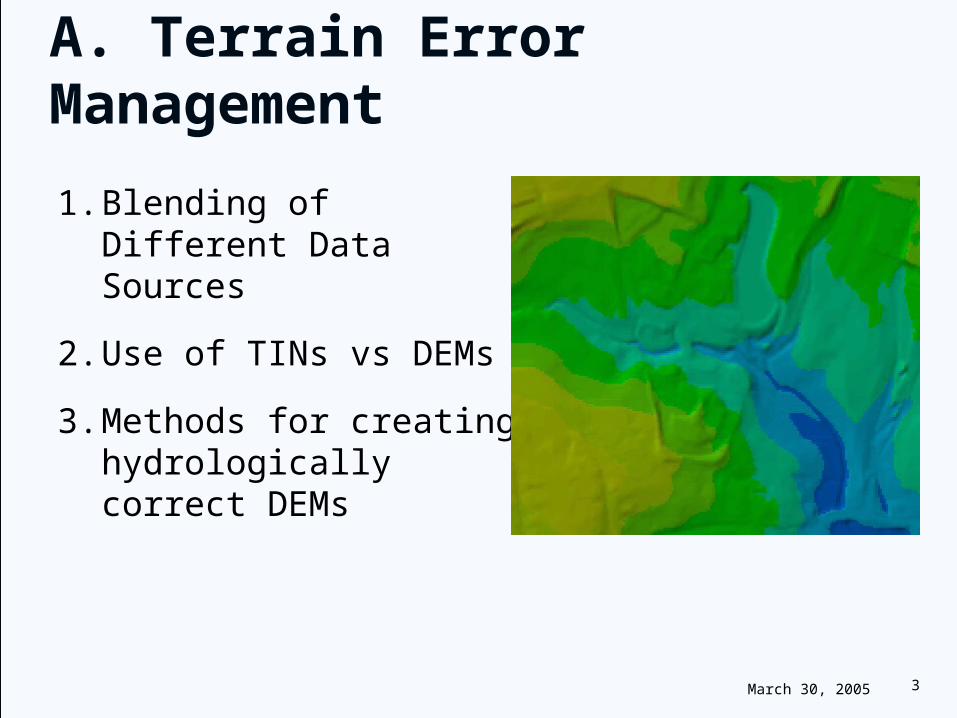
A. Terrain Error Management
1. Blending of Different Data Sources
2. Use of TINs vs DEMs
3. Methods for creating hydrologically correct DEMs
March 30, 2005 4
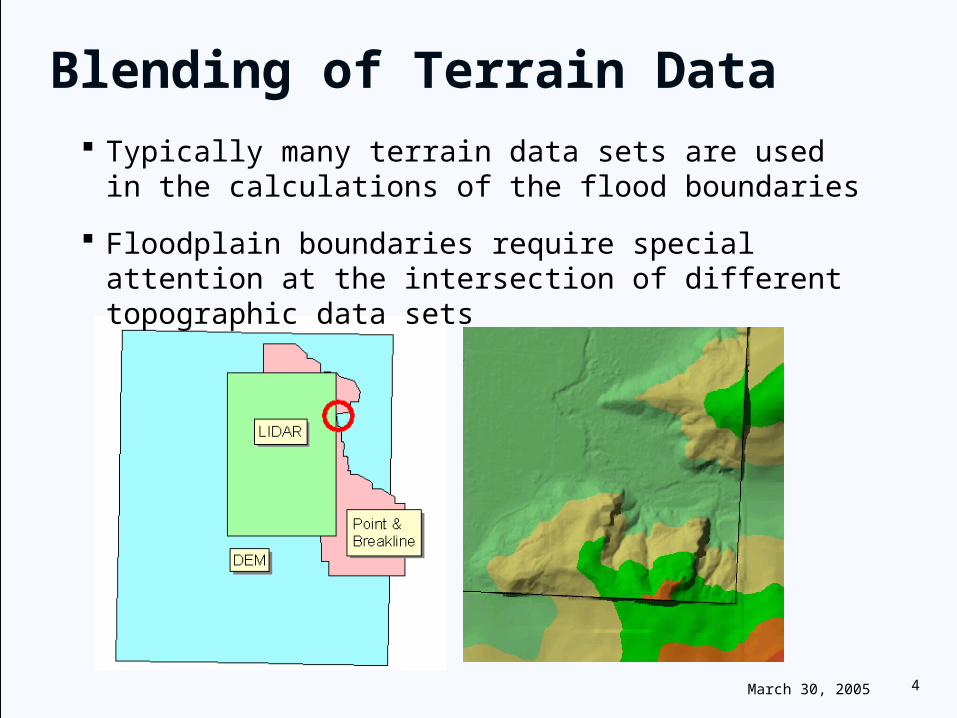
Blending of Terrain Data Typically many terrain data sets are used in the
calculations of the flood boundaries
Floodplain boundaries require special attention at the intersection of different topographic data sets
Insert Graphic showing Shelving of Data
March 30, 2005 5
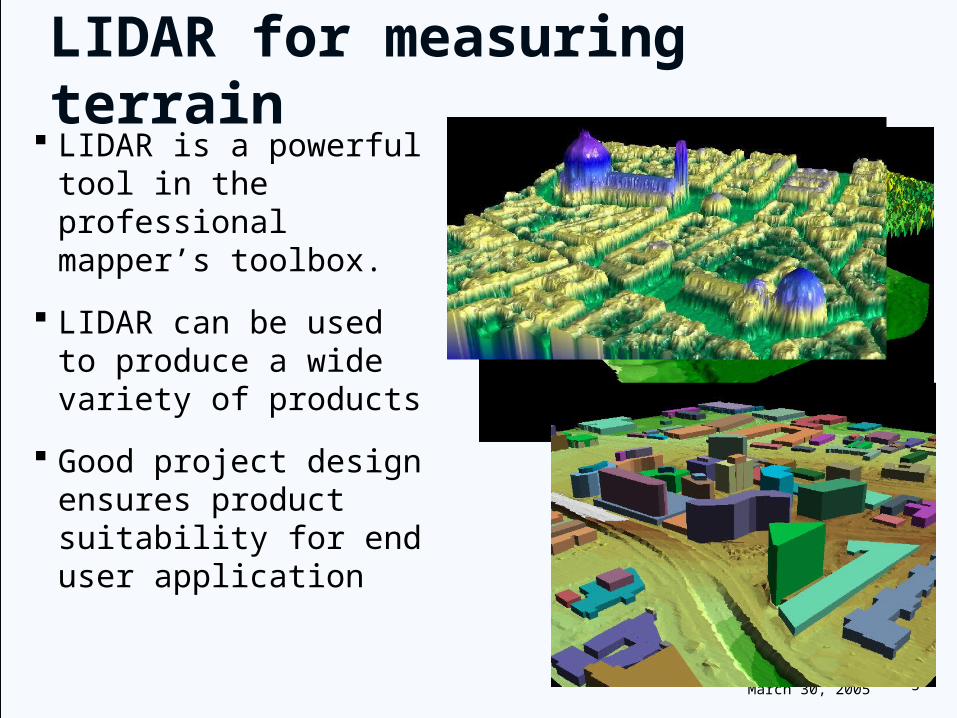
LIDAR is a powerful tool in the professional mapper’s toolbox.
LIDAR can be used to produce a wide variety of products
Good project design ensures product suitability for end user application
LIDAR for measuring terrain
March 30, 2005 6
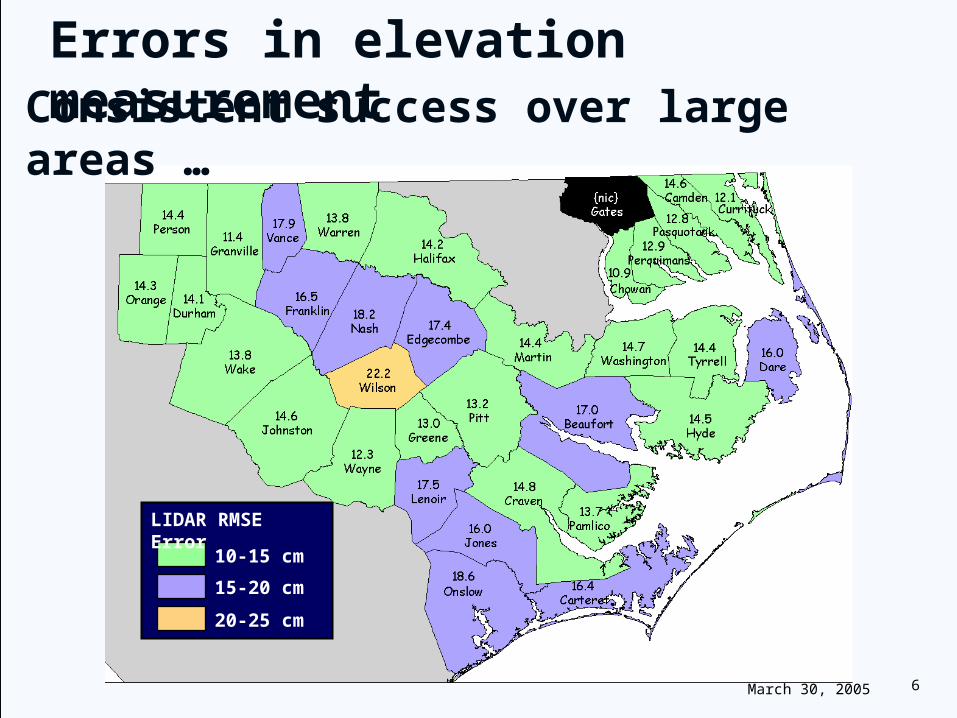
10-15 cm
LIDAR RMSE Error
15-20 cm
20-25 cm
Consistent success over large areas …Errors in elevation measurement
March 30, 2005 7
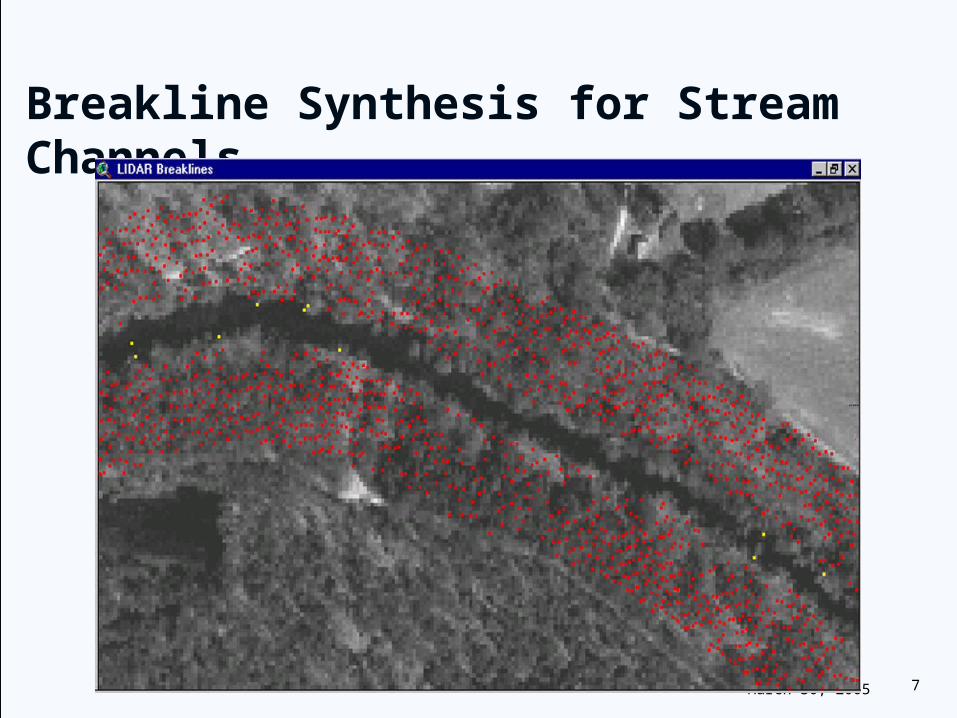
Breakline Synthesis for Stream Channels
March 30, 2005 8
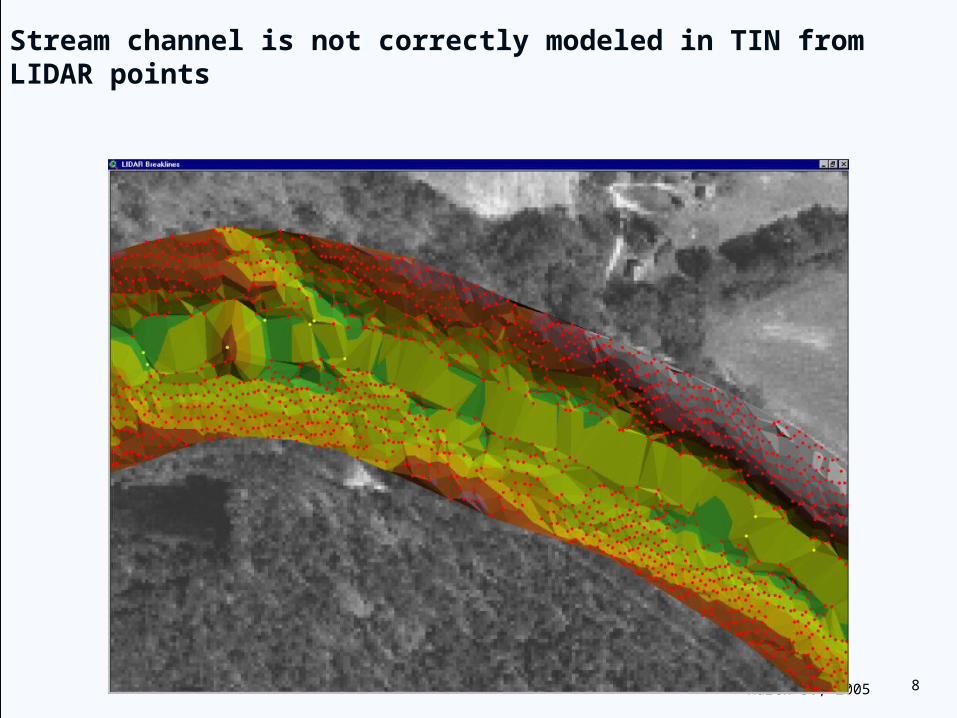
Stream channel is not correctly modeled in TIN from LIDAR points
March 30, 2005 9
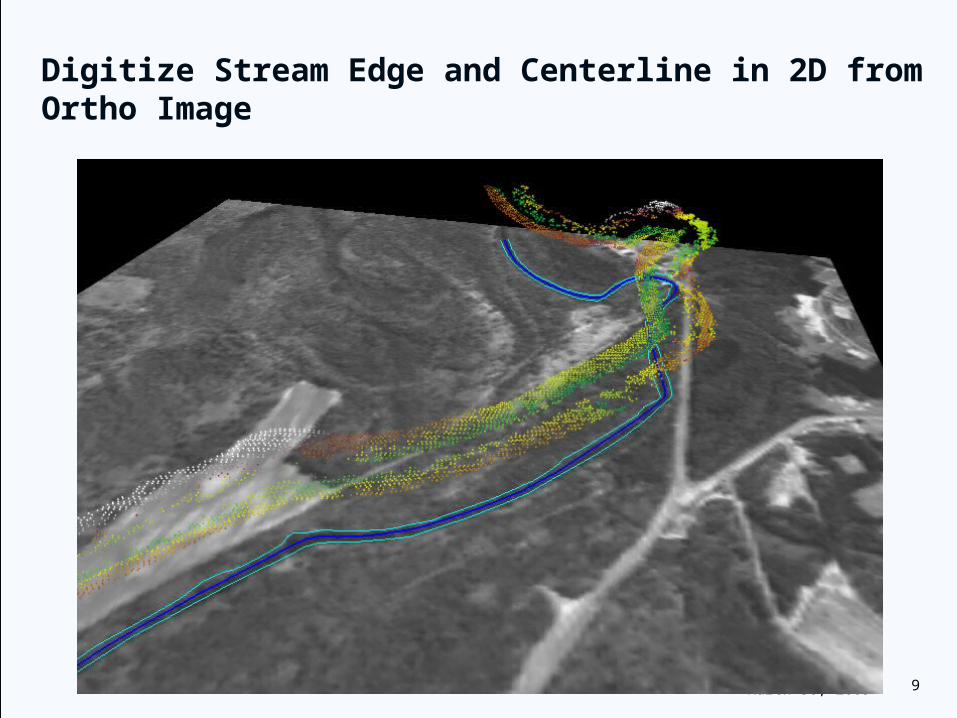
Digitize Stream Edge and Centerline in 2D from Ortho Image
March 30, 2005 10
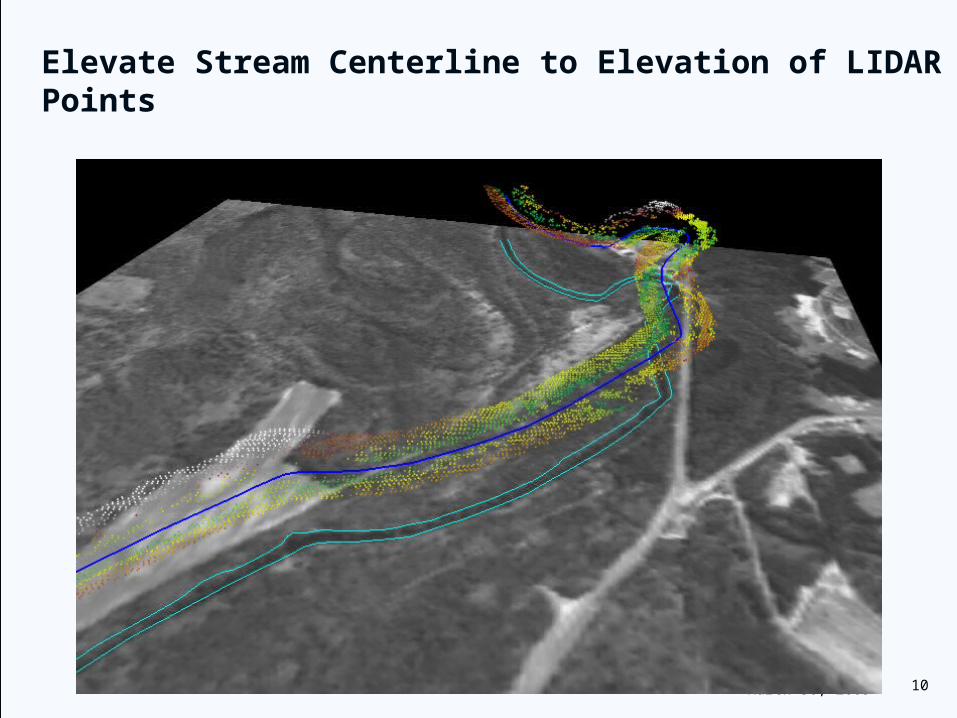
Elevate Stream Centerline to Elevation of LIDAR Points
March 30, 2005 11
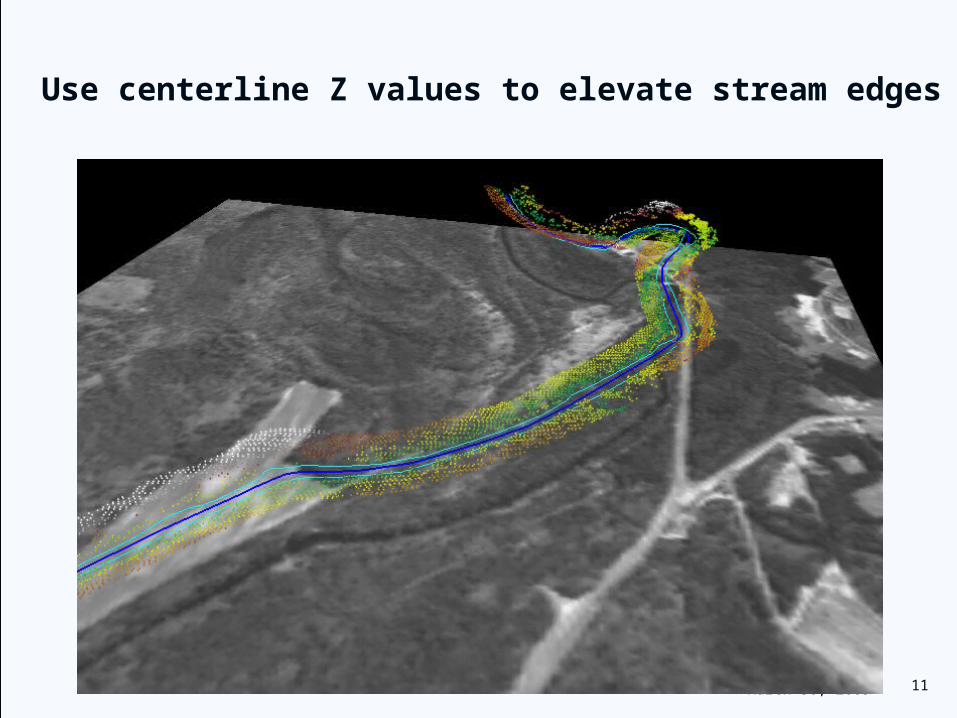
Use centerline Z values to elevate stream edges
March 30, 2005 12
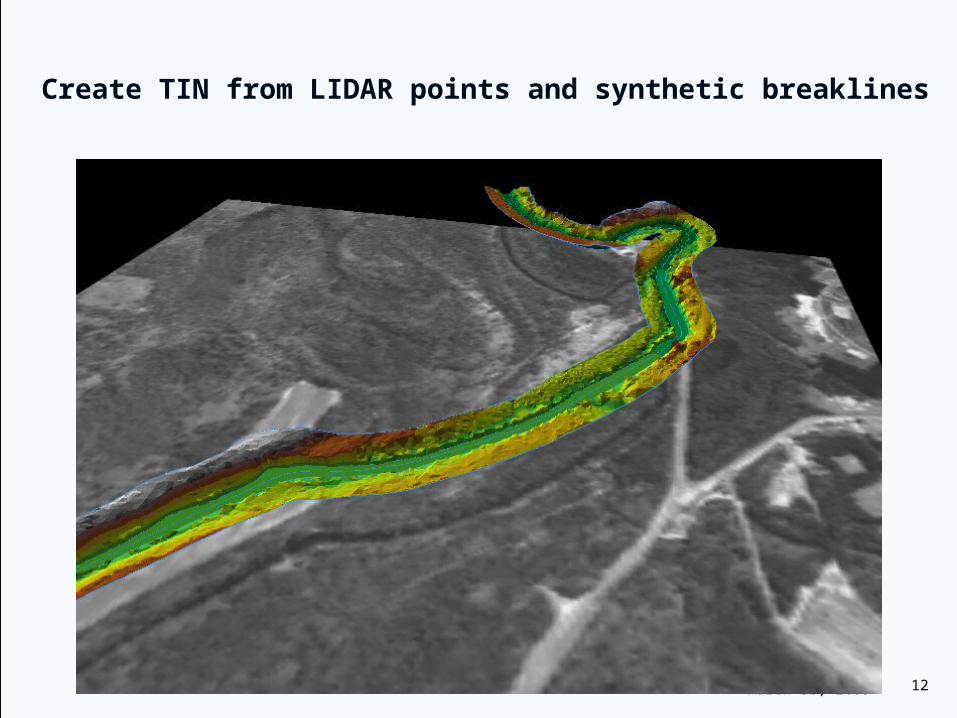
Create TIN from LIDAR points and synthetic breaklines
March 30, 2005 13
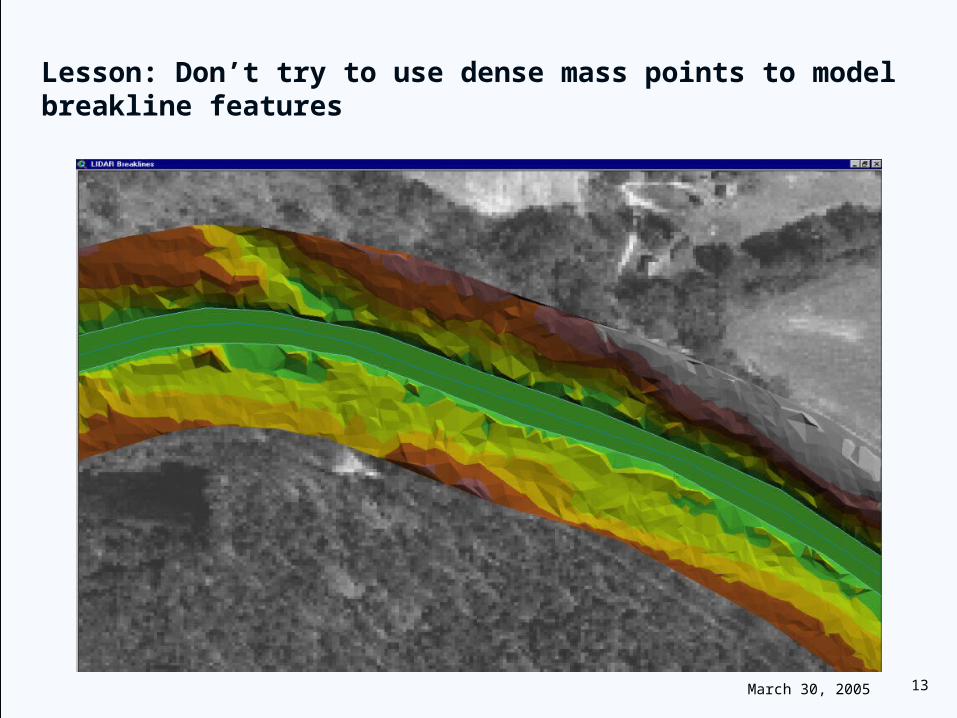
Lesson: Don’t try to use dense mass points to model breakline features
March 30, 2005 14
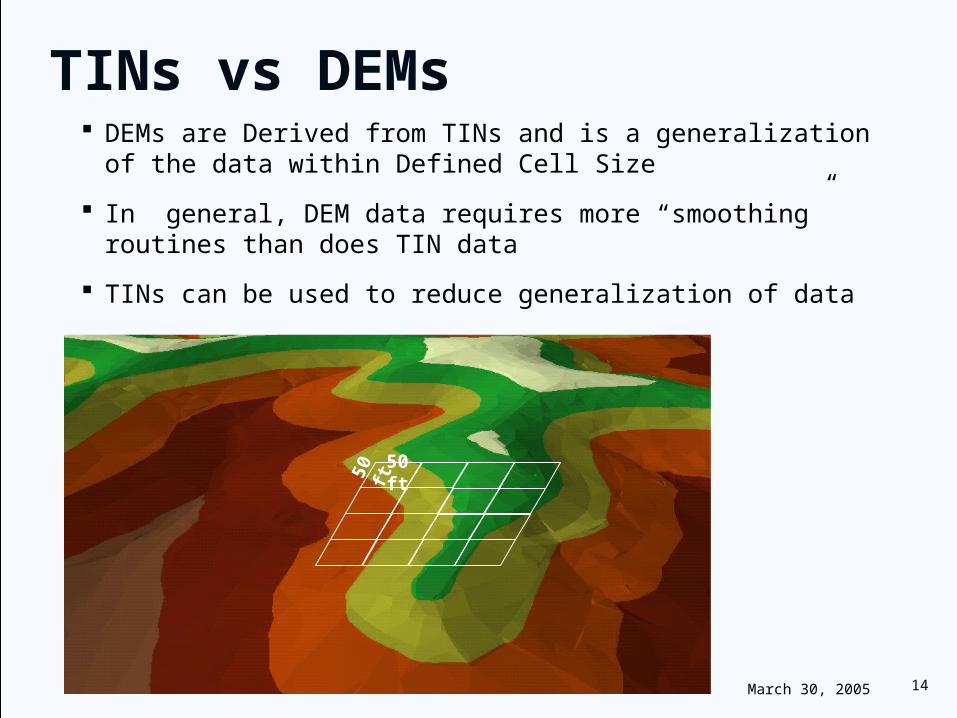
TINs vs DEMs DEMs are Derived from TINs and is a generalization of the data
within Defined Cell Size
In general, DEM data requires more “smoothing” routines than does TIN data
TINs can be used to reduce generalization of data
Insert Graphic showing TIN Data
Insert Graphic showing DEM Data
50
ft
50 ft
March 30, 2005 15
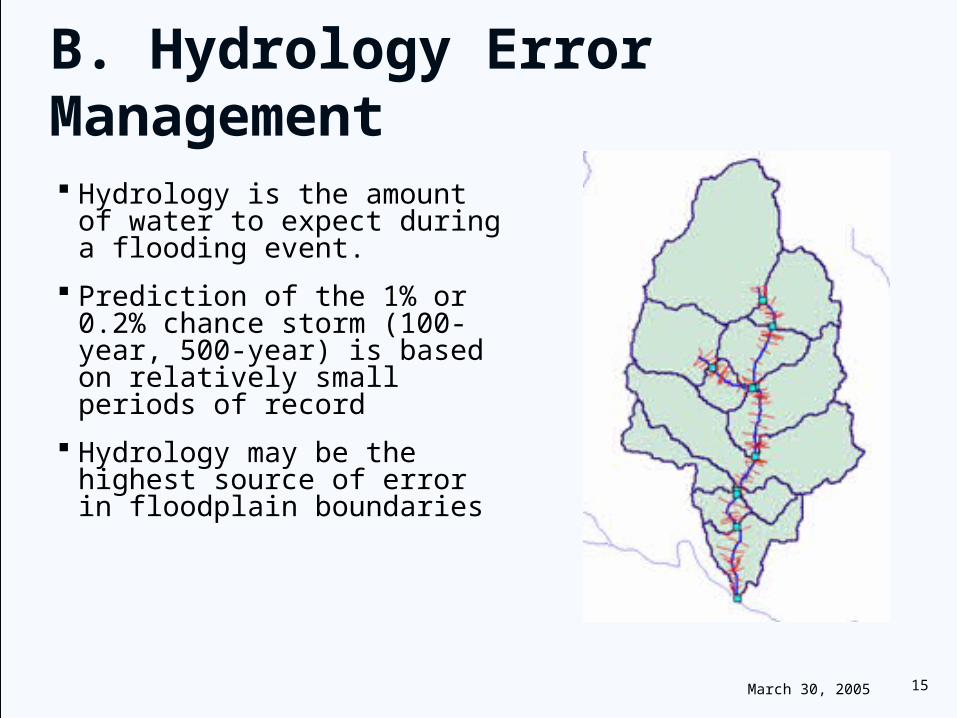
B. Hydrology Error Management
Hydrology is the amount of water to expect during a flooding event.
Prediction of the 1% or 0.2% chance storm (100-year, 500-year) is based on relatively small periods of record
Hydrology may be the highest source of error in floodplain boundaries
March 30, 2005 16Drainage Area (mi.2)
1% A
nn
ua
l C
han
ce D
isc
har
ge
(cfs
)
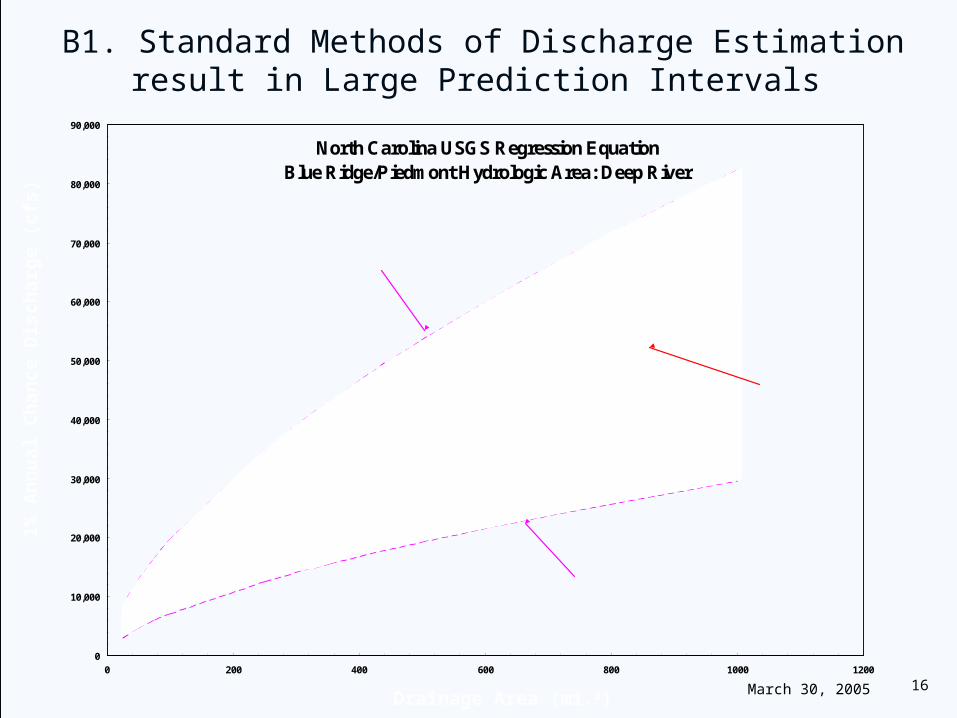
North Carolina USGS Regression Equation Blue Ridge/Piedmont Hydrologic Area: Deep River
0
10,000
20,000
30,000
40,000
50,000
60,000
70,000
80,000
90,000
0 200 400 600 800 1000 1200
Regression Estimate
Average Error of PredictionLower Limit (-47.1%)
Average Error of PredictionUpper Limit (+47.1%)
B1. Standard Methods of Discharge Estimation result in Large Prediction Intervals
March 30, 2005 17
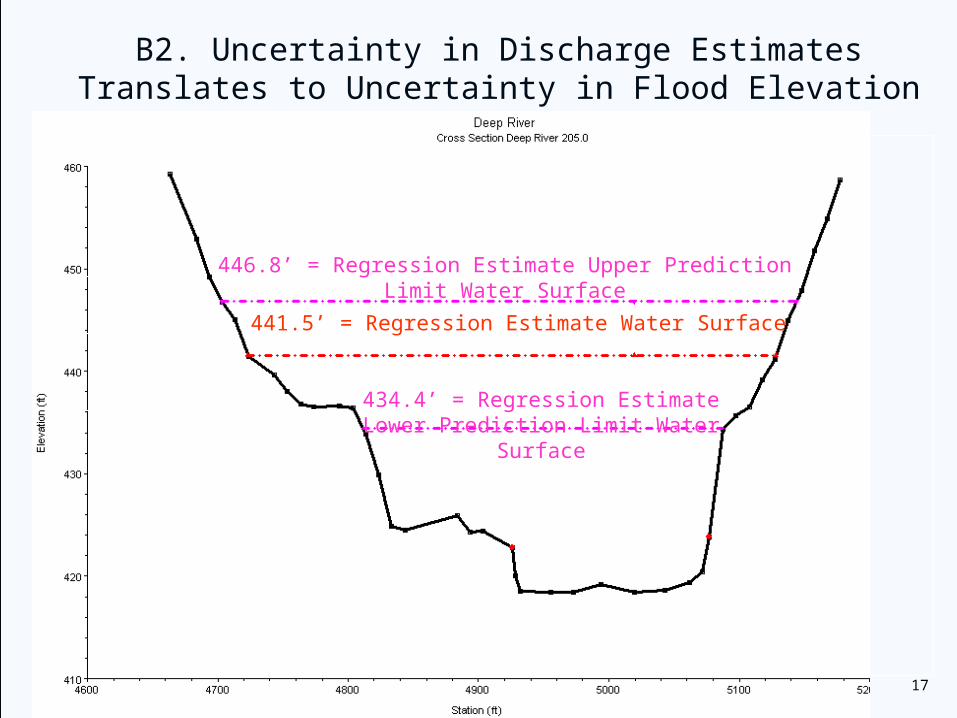
446.8’ = Regression Estimate Upper Prediction Limit Water Surface
434.4’ = Regression Estimate Lower Prediction Limit Water Surface
441.5’ = Regression Estimate Water Surface5.3’
7.1’
B2. Uncertainty in Discharge Estimates Translates to Uncertainty in Flood Elevation
March 30, 2005 18
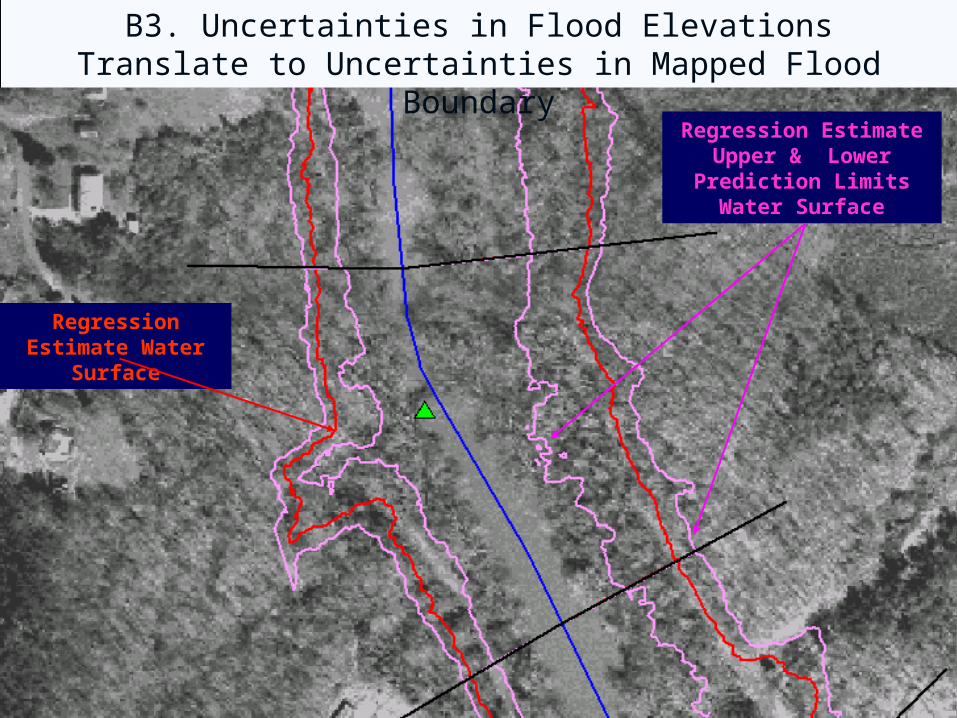
B3. Uncertainties in Flood Elevations Translate to Uncertainties in Mapped Flood Boundary
Regression Estimate Upper & Lower
Prediction Limits Water Surface
Regression Estimate Water Surface
March 30, 2005 19
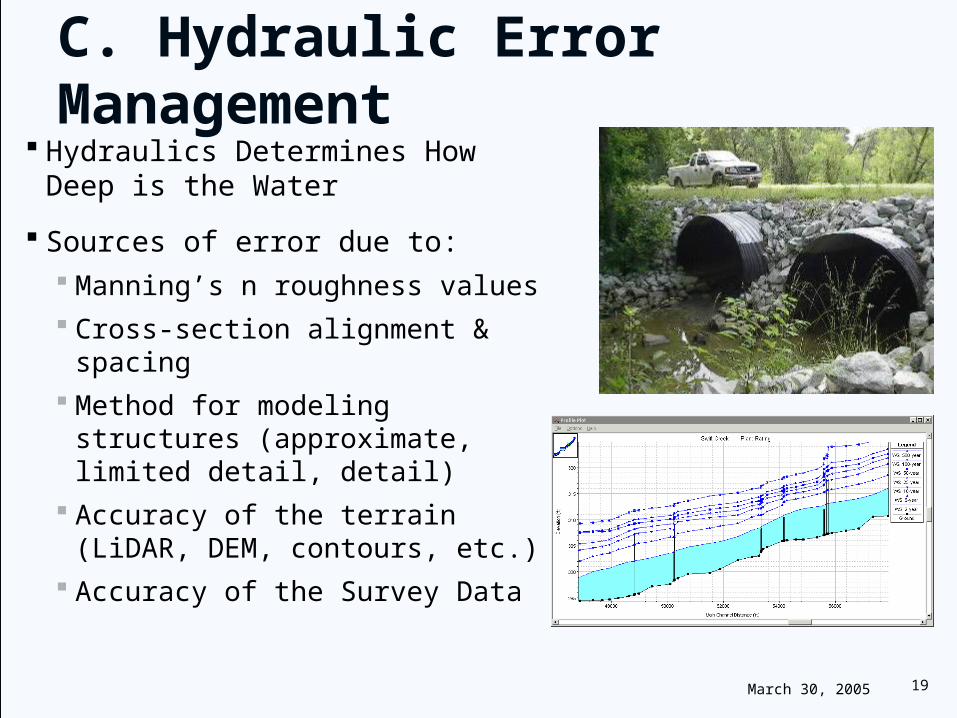
C. Hydraulic Error Management Hydraulics Determines How Deep
is the Water
Sources of error due to: Manning’s n roughness values
Cross-section alignment & spacing
Method for modeling structures (approximate, limited detail, detail)
Accuracy of the terrain (LiDAR, DEM, contours, etc.)
Accuracy of the Survey Data
March 30, 2005 20
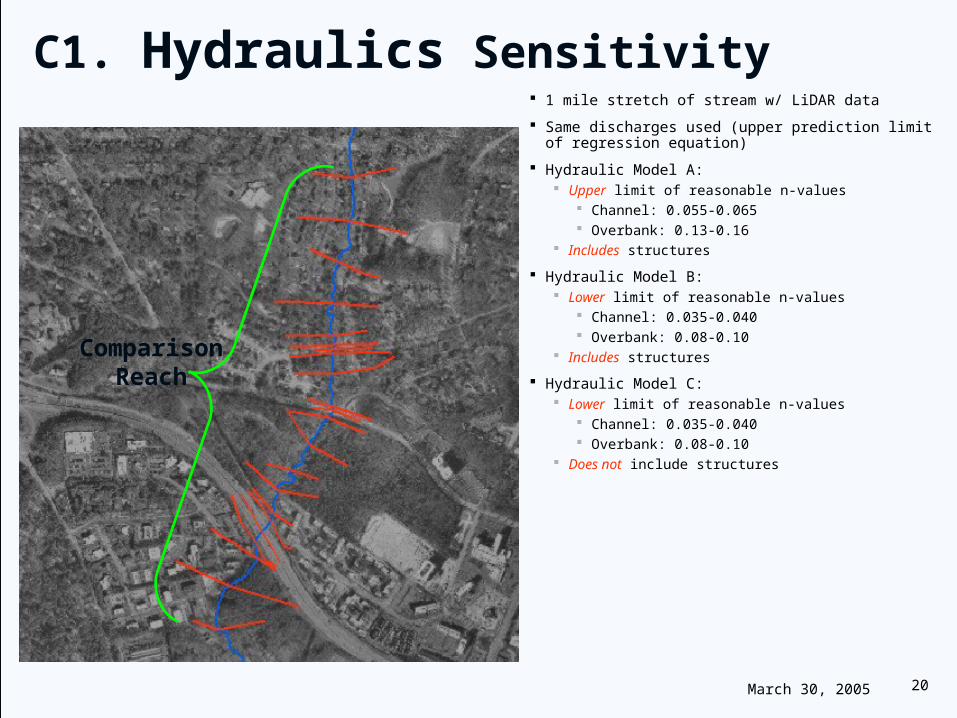
C1. Hydraulics Sensitivity 1 mile stretch of stream w/ LiDAR data
Same discharges used (upper prediction limit of regression equation)
Hydraulic Model A: Upper limit of reasonable n-values
Channel: 0.055-0.065 Overbank: 0.13-0.16
Includes structures
Hydraulic Model B: Lower limit of reasonable n-values
Channel: 0.035-0.040 Overbank: 0.08-0.10
Includes structures
Hydraulic Model C: Lower limit of reasonable n-values
Channel: 0.035-0.040 Overbank: 0.08-0.10
Does not include structures
ComparisonReach
March 30, 2005 21
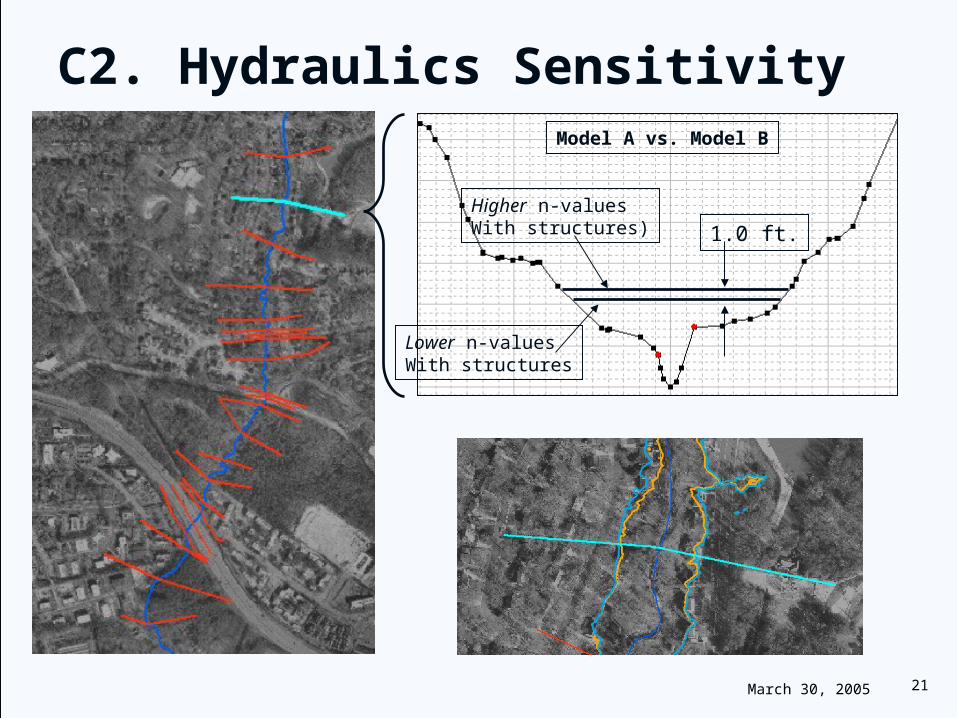
C2. Hydraulics Sensitivity
Higher n-valuesWith structures)
Lower n-valuesWith structures
1.0 ft.
Model A vs. Model B
March 30, 2005 22
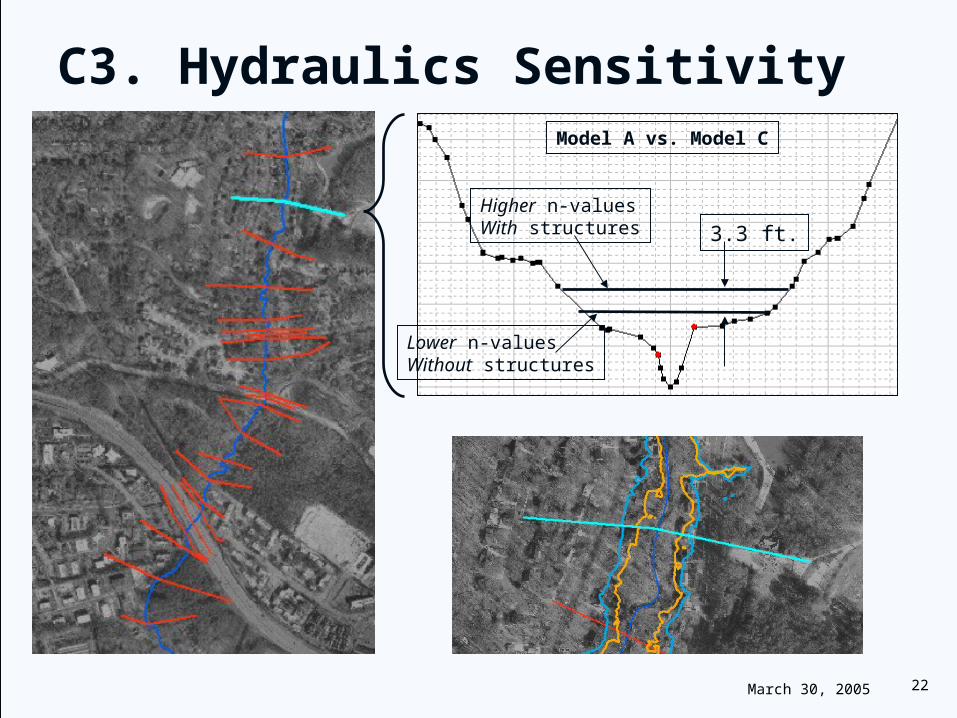
C3. Hydraulics Sensitivity
Higher n-valuesWith structures
Lower n-valuesWithout structures
3.3 ft.
Model A vs. Model C
March 30, 2005 23
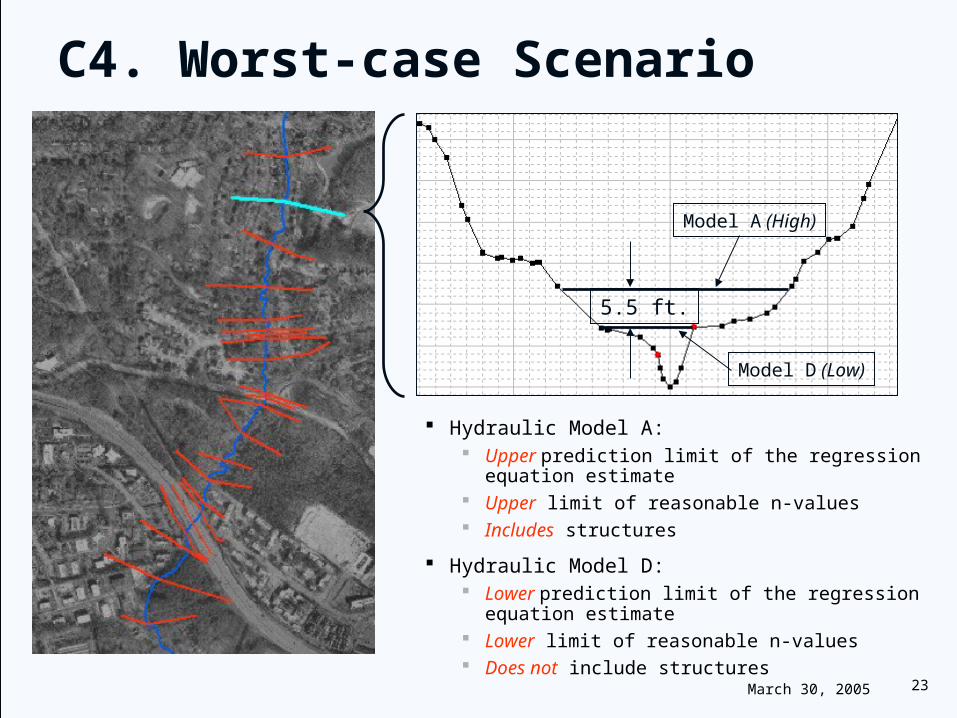
C4. Worst-case Scenario
Hydraulic Model A: Upper prediction limit of the regression equation
estimate Upper limit of reasonable n-values Includes structures
Hydraulic Model D: Lower prediction limit of the regression equation
estimate Lower limit of reasonable n-values Does not include structures
Model A (High)
5.5 ft.
Model D (Low)
March 30, 2005 24
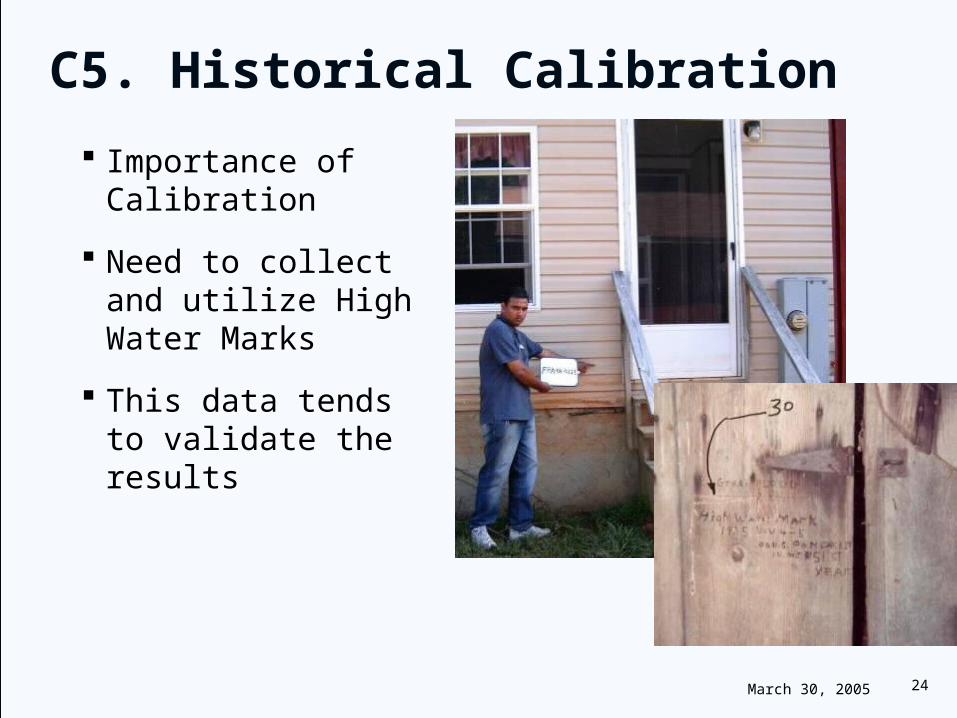
C5. Historical Calibration
Importance of Calibration
Need to collect and utilize High Water Marks
This data tends to validate the results
March 30, 2005 25
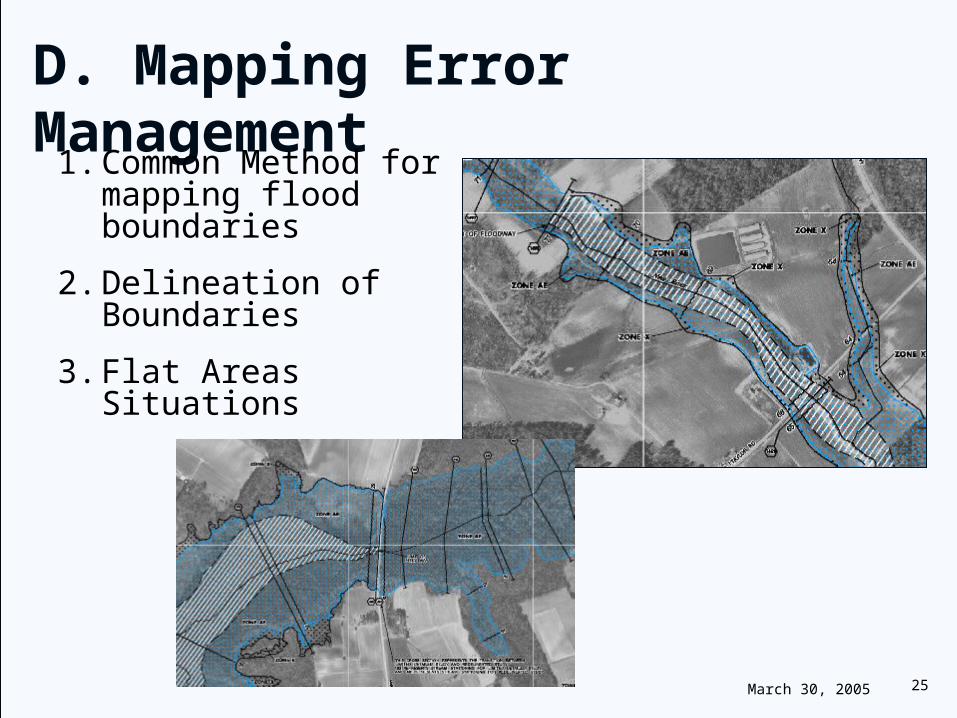
D. Mapping Error Management
1. Common Method for mapping flood boundaries
2. Delineation of Boundaries
3. Flat Areas Situations
March 30, 2005 26
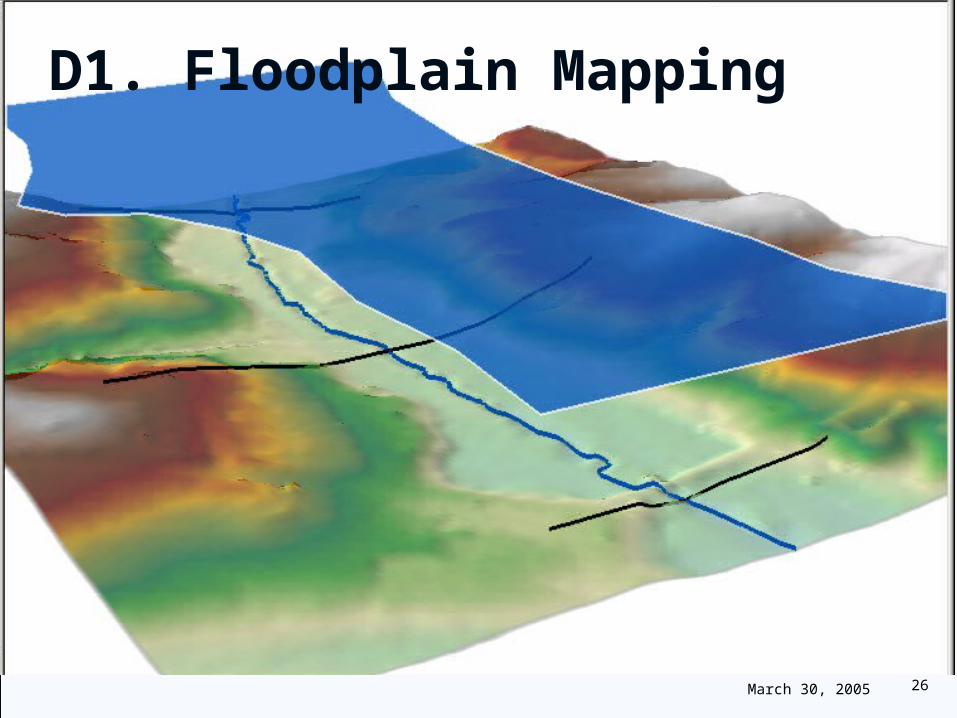
D1. Floodplain Mapping
March 30, 2005 27
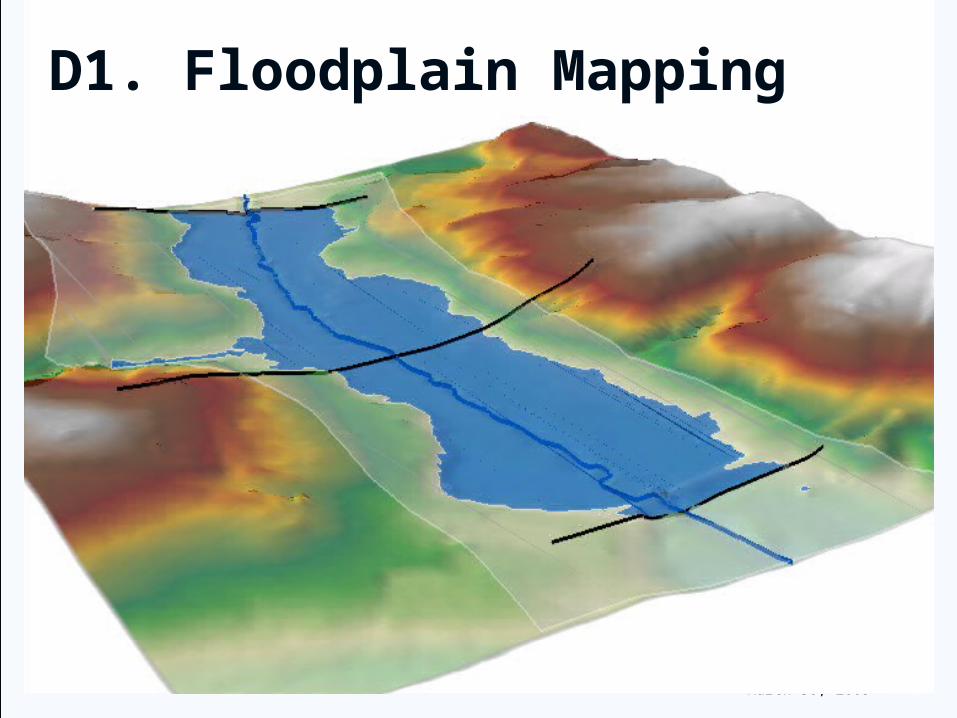
D1. Floodplain Mapping
March 30, 2005 28
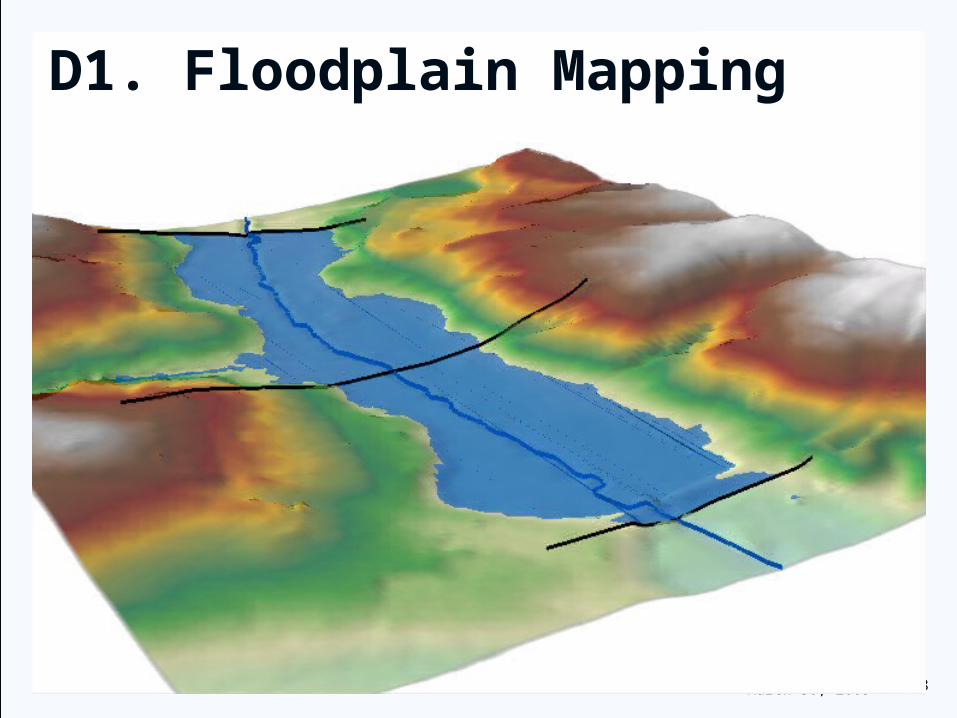
D1. Floodplain Mapping
March 30, 2005 29
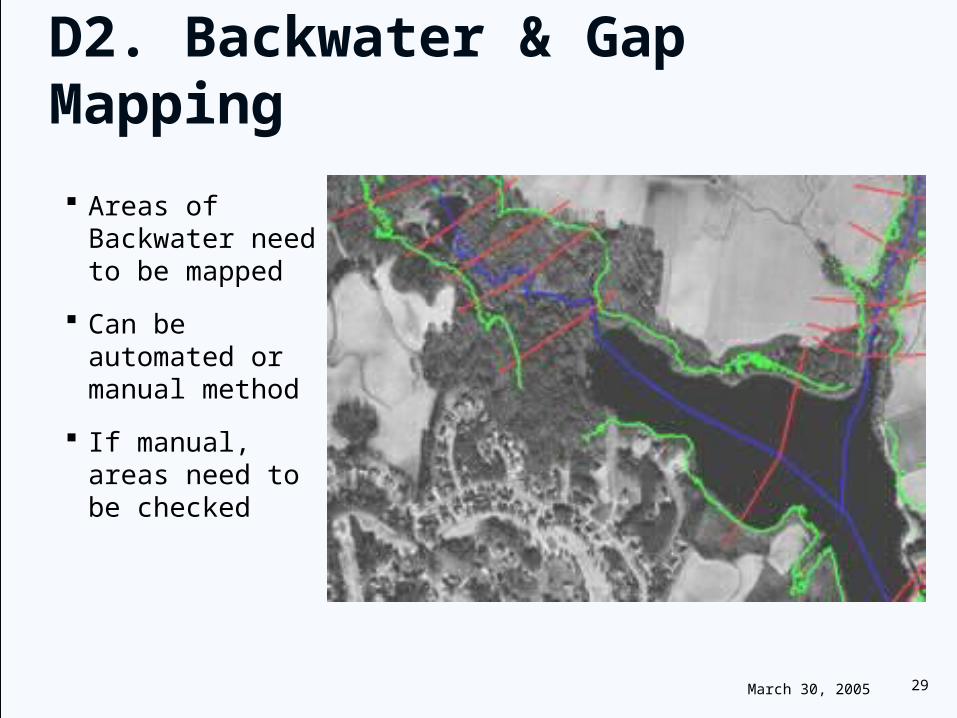
D2. Backwater & Gap Mapping
Areas of Backwater need to be mapped
Can be automated or manual method
If manual, areas need to be checked
March 30, 2005 30
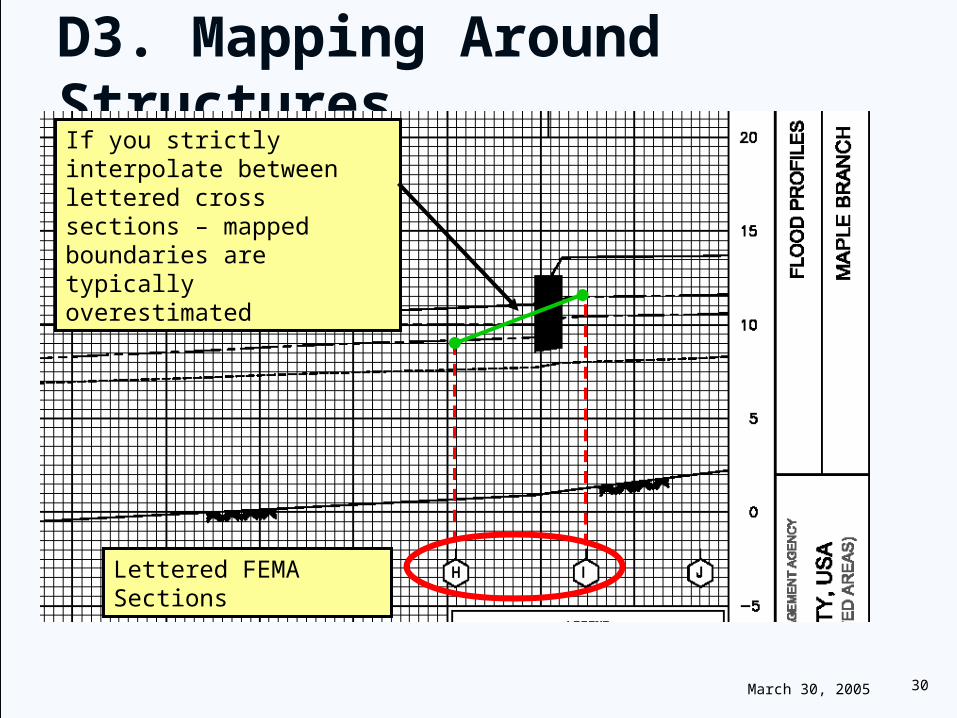
D3. Mapping Around Structures
Lettered FEMA Sections
If you strictly interpolate between lettered cross sections – mapped boundaries are typically overestimated
March 30, 2005 31
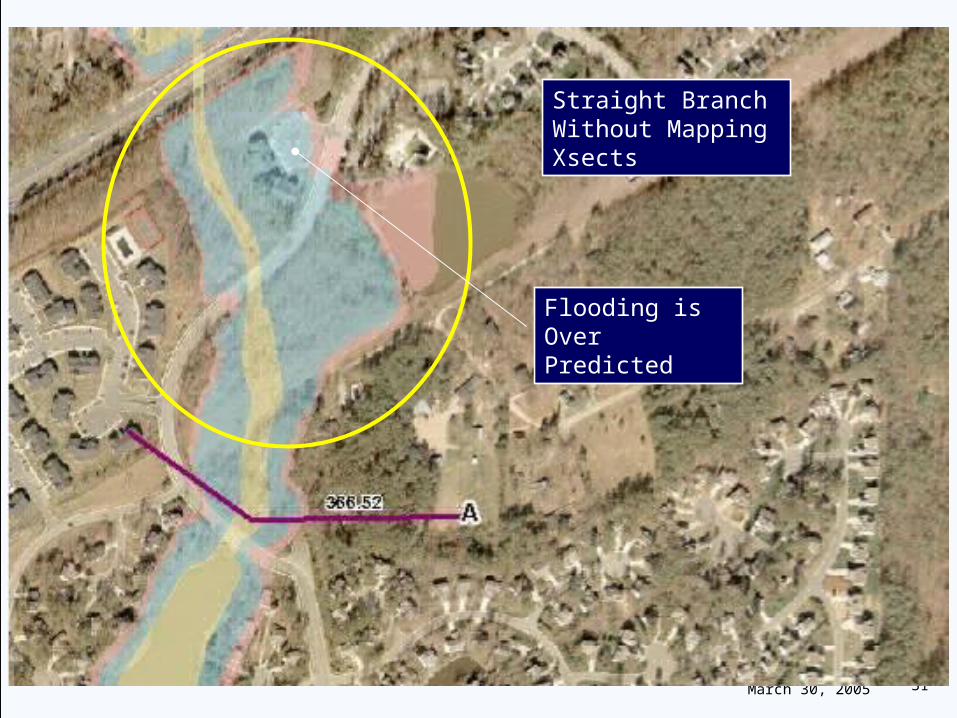
Straight Branch Without Mapping Xsects
Flooding is Over Predicted
March 30, 2005 32
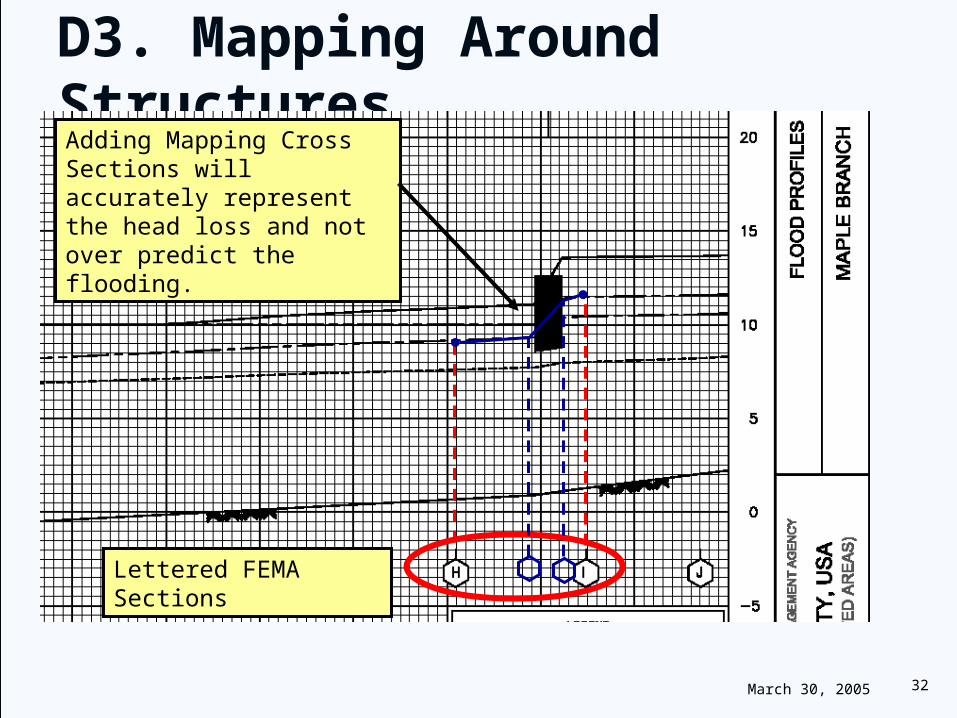
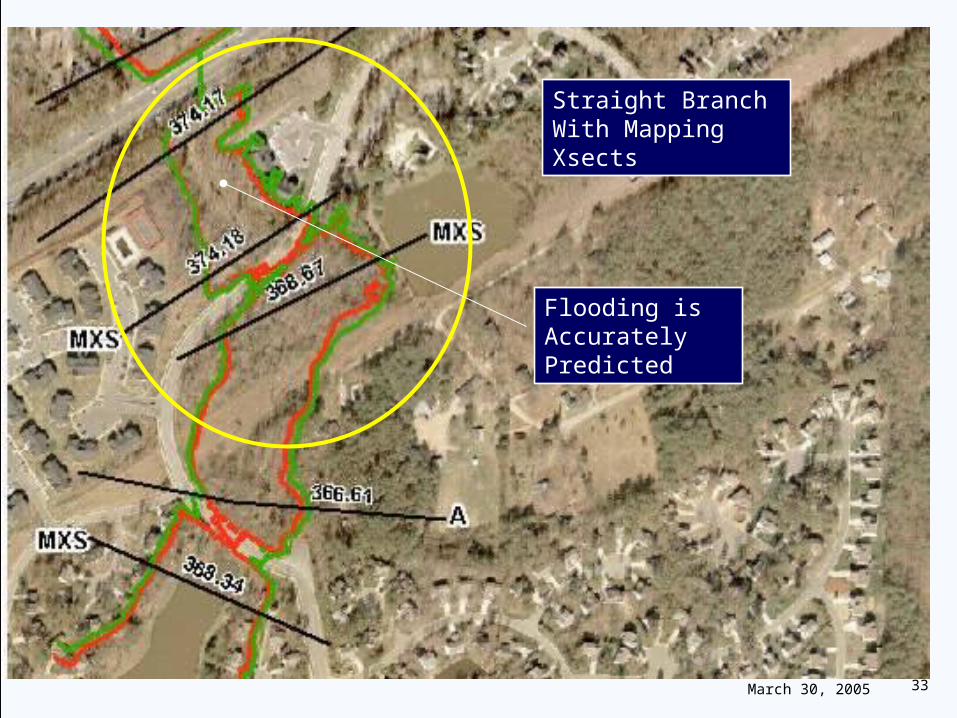
D3. Mapping Around Structures
Lettered FEMA Sections
Adding Mapping Cross Sections will accurately represent the head loss and not over predict the flooding.
March 30, 2005 33
Straight Branch With Mapping Xsects
Flooding is Accurately Predicted
March 30, 2005 34
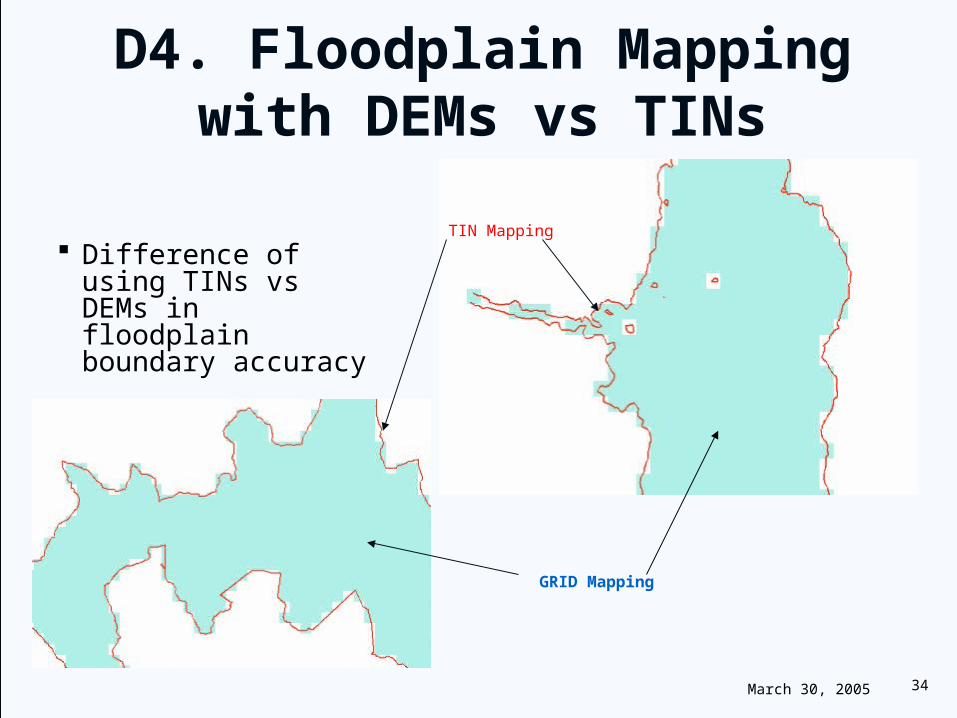
D4. Floodplain Mapping with DEMs vs TINs
Difference of using TINs vs DEMs in floodplain boundary accuracy
TIN Mapping
GRID Mapping
March 30, 2005 35
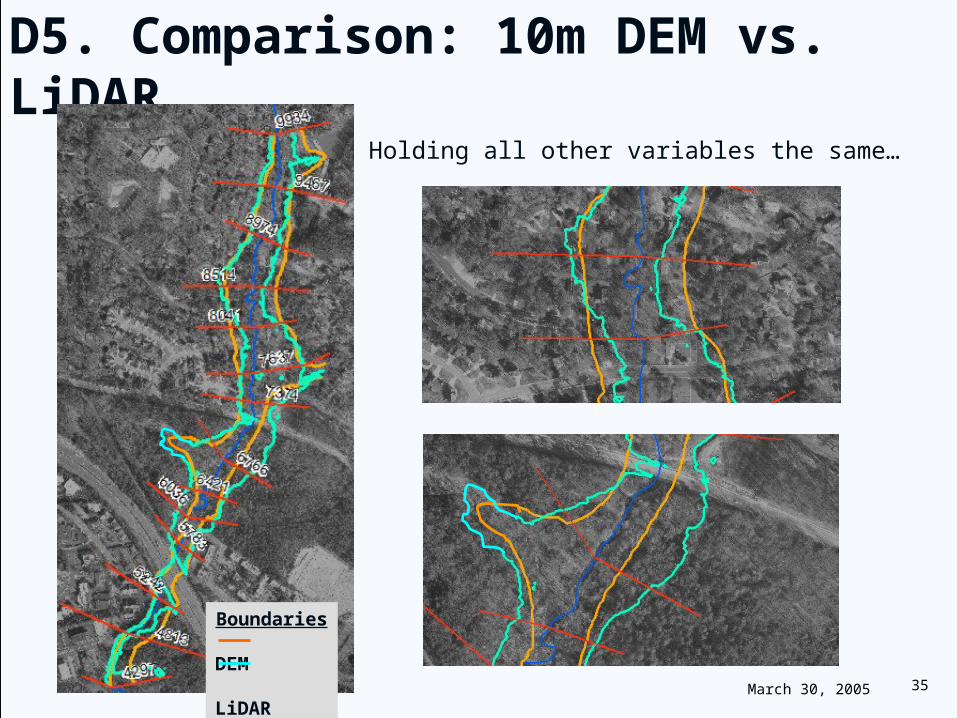
D5. Comparison: 10m DEM vs. LiDAR
Holding all other variables the same…
Boundaries DEM LiDAR
March 30, 2005 36
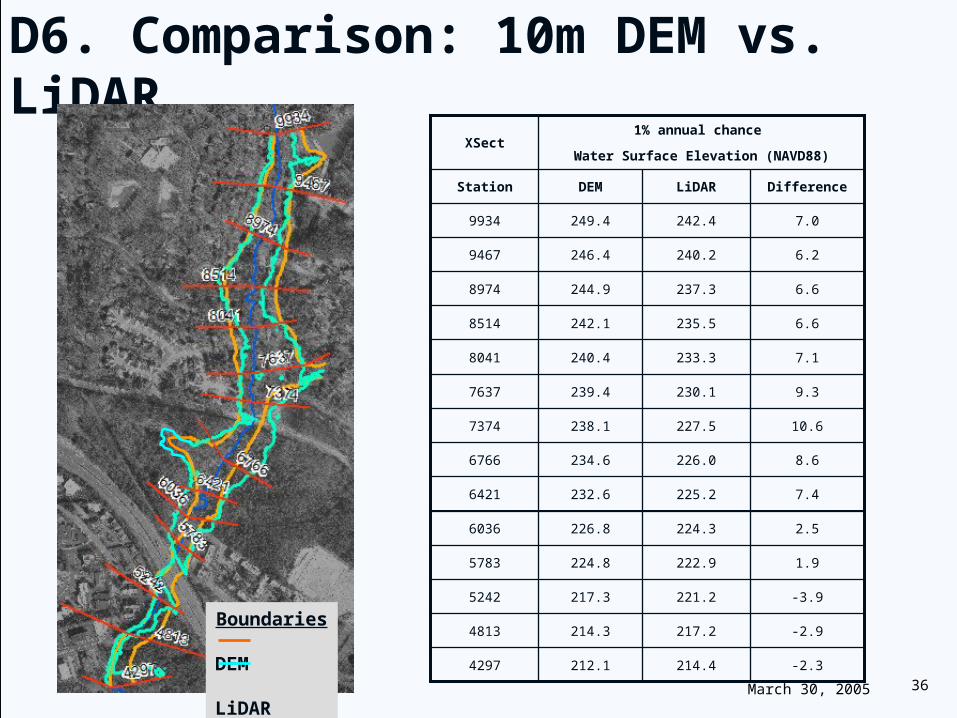
D6. Comparison: 10m DEM vs. LiDAR
-2.3214.4212.14297
-2.9217.2214.34813
-3.9221.2217.35242
1.9222.9224.85783
2.5224.3226.86036
7.4225.2232.66421
8.6226.0234.66766
10.6227.5238.17374
9.3230.1239.47637
7.1233.3240.48041
6.6235.5242.18514
6.6237.3244.98974
6.2240.2246.49467
249.4
DEM
1% annual chance
Water Surface Elevation (NAVD88)
7.0242.49934
DifferenceLiDARStation
XSect
Boundaries DEM LiDAR