national road master plan (2007-2017) - road ... road master plan (2007 – 2017) 2 i. introduction...
TRANSCRIPT
NATIONAL ROAD MASTER PLAN (2007-2017)
National Road Master Plan (2007 – 2017)
ii
Message of the Honorable Jeyaraj Fernandopulle
Minister of Highways and Road Development In launching the Master Plan, we bring to the public eye the Government's vision of the future shape of Sri Lanka’s road network. Long-term planning needs such a vision. In transforming a vision to a plan, known constraints should be taken on board and each step towards the realization of the vision should be defined and justifiable. To this end, the National Road Master Plan documents a credible plan of action, to which the Government is firmly committed. We need to vigorously address the challenges that stand in the way of making our vision a reality. Otherwise, our success and achievements to date, our efforts to improve the lives of our people will be marred by capacity constraints and inefficiencies; and the successful achievement of our economic growth target of 8% would be jeopardized, if we do not pursue a dramatic overhaul of our transport system. The National Road Master Plan highlights the formidable challenges that Sri Lanka’s road sector is facing. These challenges are not unique. The transport sector worldwide is confronted with intensified demand for the movement of people and goods. Increasing freight movements are stimulated by globalization and trade liberalization. These developments have contributed to a stronger integration of national economies in global value chains. Sri Lanka is no exception and continuing globalization will accelerate the demand for the transportation of both people and goods. People's travel needs are expanding rapidly as rising incomes generate a desire for greater mobility. The National Road Master Plan reflects an acute awareness of these trends. The National Road Master Plan will support economic growth. At the same time, it will provide safeguards against adverse social and environmental impacts of transport. Regrettably, the much-needed economic growth is a source of undesirable outcomes, including unfettered urbanization, traffic congestion, pollution, and environmental degradation. The Master Plan has to contribute to addressing the pressing issues of energy efficiency, climate change, traffic congestion, and transport safety. The Government is appreciative of the role of our development partners in supporting our efforts for economic development and poverty alleviation. Past success notwithstanding, let us reassess priorities and approaches of our cooperation. In the future, we must focus more attention on confronting cross-cutting issues. The Government remains fully committed to the principle of integrated and sustainable socio-economic development. In the same vein, transport planning and development must not be divorced from spatial and socio-economic development. We need to ensure that we use our limited financial resources for maximum benefit and believe that a well-integrated program will result in efficiency gains and better development results. The National Road Master Plan represents a comprehensive and well-founded strategy for road development in Sri Lanka over the next 10 years. Let us join hands to make the Master Plan a resounding success.
Colombo, December 2007
National Road Master Plan (2007 – 2017)
iii
Message from Mr. S. Amarasekara Secretary, Ministry of Highways and Road Development
This National Road Master Plan would not have come into existence without the contributions and tireless efforts of a great many individuals, including staff from RDA, officials from the Government, representatives from the donor community, consultants, and other stakeholders. All these contributions are gratefully acknowledged. The Master Plan will mark a milestone in the long history of road development in Sri Lanka. It starts with a comprehensive and candid assessment of current issues and constraints, which is indispensable for providing an adequate justification and rationale for the Plan and its components. Approach and methodology that were adopted for the formulation of the Master Plan are sound. The quality of the Master Plan has benefited from this approach in addition to the extra time taken for the collection of fresh data on traffic and road surface conditions. The composition of the Master Plan is well balanced. It addresses major constraints in the areas of road capacity, maintenance, urban traffic, road safety, and land acquisitions. The components of the Master Plan are economically viable and their priority was determined based on sound economic investment criteria. The resource envelope is ambitious, yet realistic. The financing strategy is diversified, but will rest on the continued support of our traditional partners. The Government’s emphasis is on adequate cost recovery and a “user-pays” policy. The Road Maintenance Trust Fund is in place to ensure sustainable funding of maintenance. A limited number of projects have been identified that may be suitable for the participation of the private sector not only in construction, but also in the financing and perhaps operations of the highways. The proposed National Thoroughfares Act will provide a legal basis for privately operated and financed highways. This is new territory for Sri Lanka and a cautious approach is proposed in this regard. RDA is well equipped to take on the challenge of implementing the Master Plan. In the future, RDA will increasingly have to focus on its core activities and to delegate project preparation activities to external units consistent with arrangements that have been tried out and proven effective. Given the scope of the Master Plan, the resource needs for the outsourcing will more than double compared to the present level. The new National Thoroughfares Act will facilitate land acquisition for road construction and widening. Devising a three-year rolling investment plan that will allow shifting of projects, if unforeseen delays occur, will cushion the effect of slippages. A lesson learned is that overly complicated project designs have also caused delays in the past. Smoother implementation of the Master Plan would be made possible, if donors take a program approach, rather than a project-centric approach. The Master Plan provides a suitable platform to this end. Promoting the local contracting industry will be an aim of the Master Plan. The overarching objective will be to achieve economy and efficiency in implementation. The policy intent is to strengthen the competitiveness of our local industry, rather than sheltering it from competition. A flexible approach will be taken for the sourcing of materials. The requirements of the Master Plan may stretch local sources. In such an event, we may have to cast our nets wider. The performance of NRMP implementation will be closely monitored. Accountability for the performance will be strengthened by a project monitoring system. Colombo, December 2007
National Road Master Plan (2007 – 2017)
iv
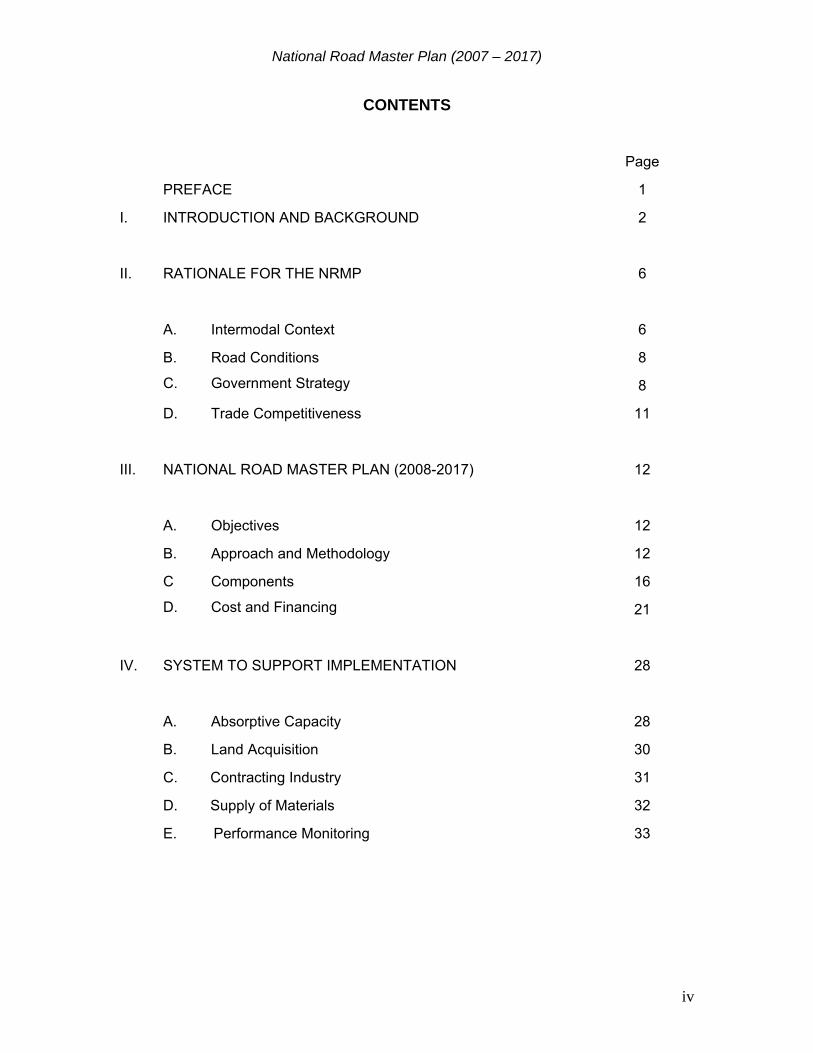
CONTENTS
Page
PREFACE 1
I. INTRODUCTION AND BACKGROUND 2
II. RATIONALE FOR THE NRMP 6
A. Intermodal Context 6
B. Road Conditions 8
C. Government Strategy 8
D. Trade Competitiveness 11
III. NATIONAL ROAD MASTER PLAN (2008-2017) 12
A. Objectives 12
B. Approach and Methodology 12
C Components 16
D. Cost and Financing 21
IV. SYSTEM TO SUPPORT IMPLEMENTATION 28
A. Absorptive Capacity 28
B. Land Acquisition 30
C. Contracting Industry 31
D. Supply of Materials 32
E. Performance Monitoring 33
National Road Master Plan (2007 – 2017)
1
PREFACE
It took almost three years to complete the National Road Master Plan. Its foundation was laid by work carried out in 2005. It soon became clear that additional data on road conditions and traffic had to be collected to make the outcome of the exercise relevant and meaningful. By the time the first results became available major work on high mobility roads had already begun. This necessitated an assessment of how the traffic flows in the network would respond to the new capacity. Network modeling and analysis added an important dimension to the study. In a word, the process of preparing the National Road Master Plan went through several iterations of modeling, output analysis and model calibration. This is not untypical for complex planning exercises. The quality of the Master Plan has benefited from the extra effort.
In April 2007, the Road Development Authority held a one-day workshop, at which the technical findings of the Master Plan were discussed with officials from the Government and representatives of the donor community. While the quality of the technical aspects of the Report was appreciated, it was observed that the Report could play a more useful role by the including policy, institutional, and implementation issues and by showing how these issues would be addressed under the Master Plan.
In addition, it was decided to present the findings in a different format. To this end, the key document of the Master Plan was to take the form of a more reader-friendly, succinct executive summary that, to the extent possible, would limit the use of technical terms. The summary should provide adequate background, explain the rationale for a Master Plan, and describe in easily understandable terms the approach adopted and the resulting components of the Plan. The feasibility of the Plan was to be demonstrated by discussing sound financing arrangements, an implementation organization, and ancillary factors with an influence on implementation.
The following Executive Summary is an attempt to meet these requirements. The
technical report and its annexes that were presented at the April 2007 workshop will be retained as part of the documentation of the Master Plan, as they provide a valuable source of technical information, to which the more inclined reader may wish to refer. Specifically, the report presented to the April 2007 workshop will be used as a technical appendix to this Summary Report.
It is hoped that this Report can convince all stakeholders that the National Road
Master Plan is a well founded and credible blue-print for long-term road development in Sri Lanka.
National Road Master Plan (2007 – 2017)
2
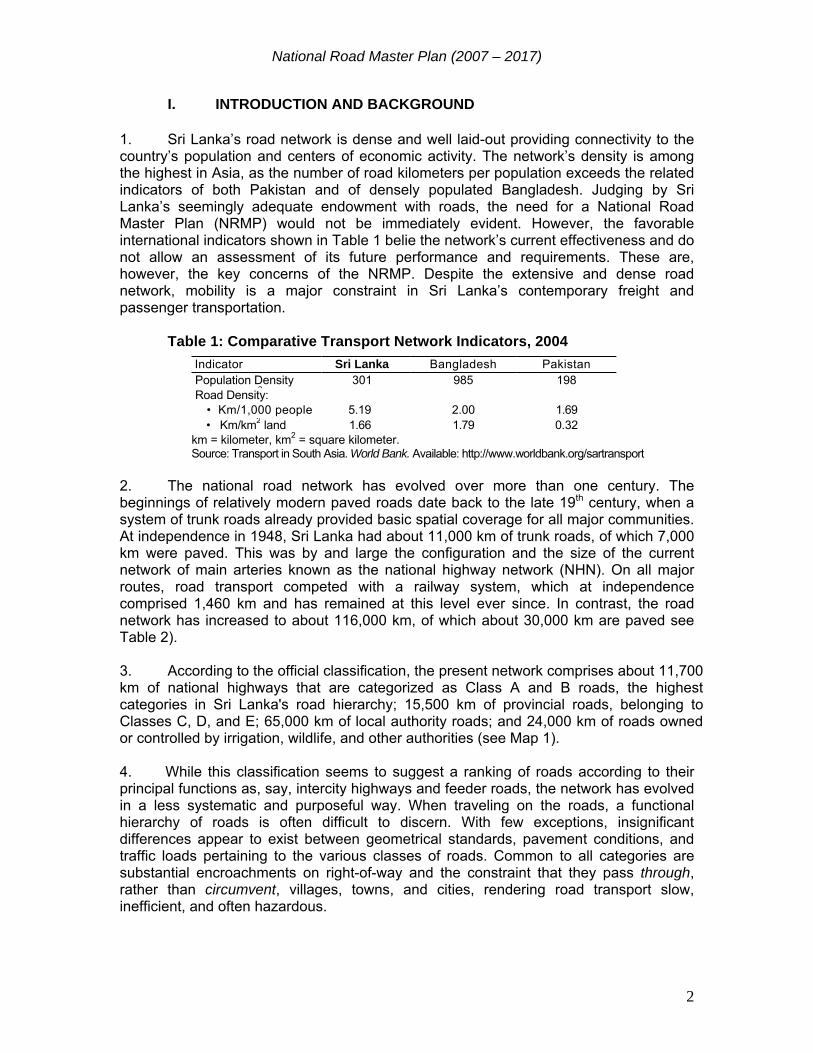
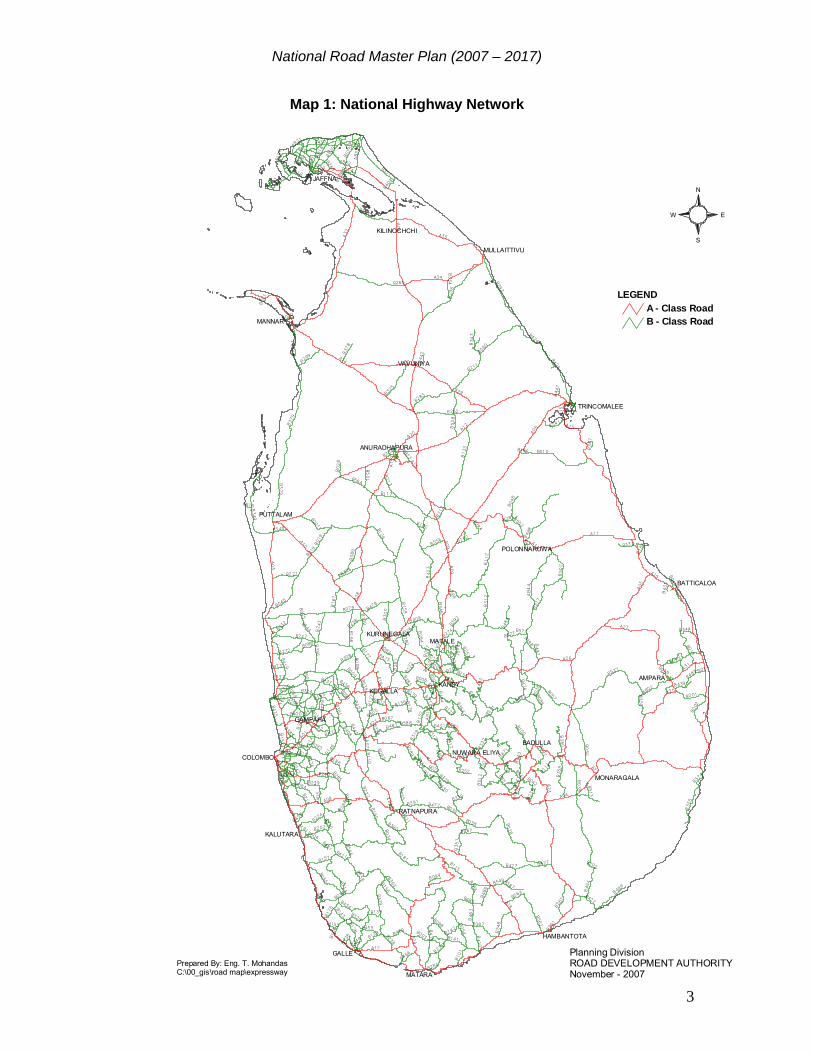
I. INTRODUCTION AND BACKGROUND 1. Sri Lanka’s road network is dense and well laid-out providing connectivity to the country’s population and centers of economic activity. The network’s density is among the highest in Asia, as the number of road kilometers per population exceeds the related indicators of both Pakistan and of densely populated Bangladesh. Judging by Sri Lanka’s seemingly adequate endowment with roads, the need for a National Road Master Plan (NRMP) would not be immediately evident. However, the favorable international indicators shown in Table 1 belie the network’s current effectiveness and do not allow an assessment of its future performance and requirements. These are, however, the key concerns of the NRMP. Despite the extensive and dense road network, mobility is a major constraint in Sri Lanka’s contemporary freight and passenger transportation.
Table 1: Comparative Transport Network Indicators, 2004
Indicator Sri Lanka Bangladesh Pakistan Population Density
2301 985 198
Road Density: • Km/1,000 people 5.19 2.00 1.69 • Km/km2 land 1.66 1.79 0.32
km = kilometer, km2 = square kilometer. Source: Transport in South Asia. World Bank. Available: http://www.worldbank.org/sartransport
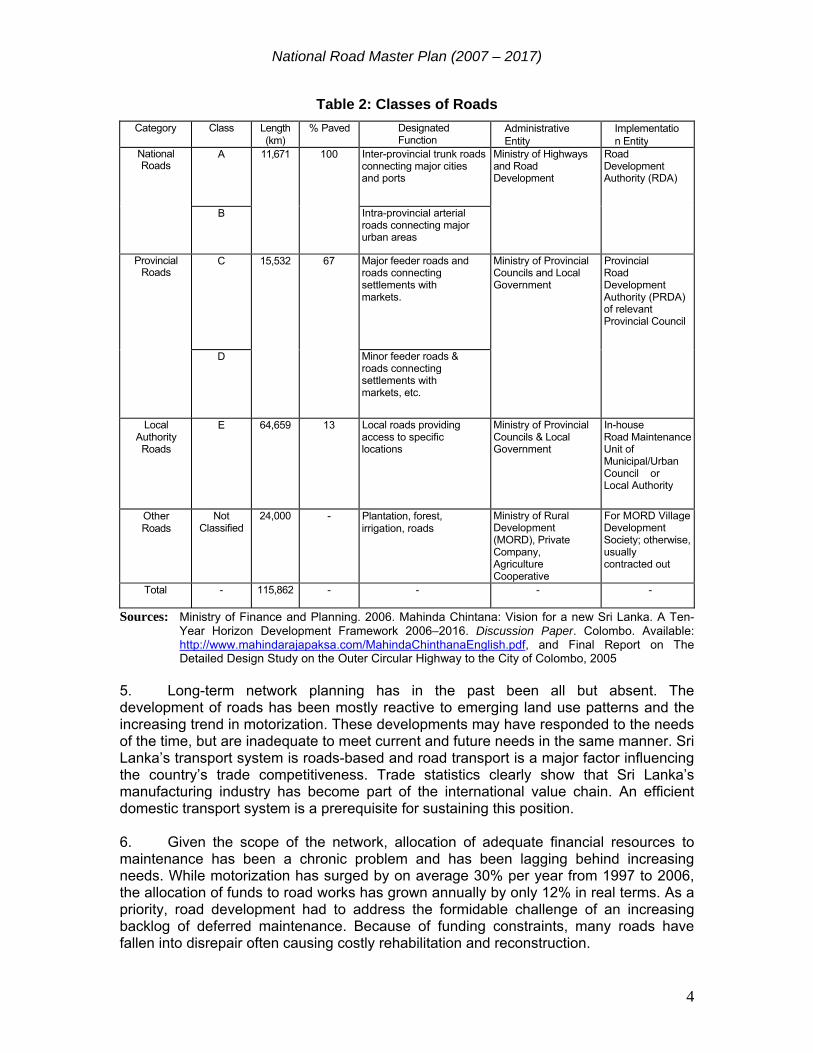
2. The national road network has evolved over more than one century. The beginnings of relatively modern paved roads date back to the late 19th century, when a system of trunk roads already provided basic spatial coverage for all major communities. At independence in 1948, Sri Lanka had about 11,000 km of trunk roads, of which 7,000 km were paved. This was by and large the configuration and the size of the current network of main arteries known as the national highway network (NHN). On all major routes, road transport competed with a railway system, which at independence comprised 1,460 km and has remained at this level ever since. In contrast, the road network has increased to about 116,000 km, of which about 30,000 km are paved see Table 2). 3. According to the official classification, the present network comprises about 11,700 km of national highways that are categorized as Class A and B roads, the highest categories in Sri Lanka's road hierarchy; 15,500 km of provincial roads, belonging to Classes C, D, and E; 65,000 km of local authority roads; and 24,000 km of roads owned or controlled by irrigation, wildlife, and other authorities (see Map 1). 4. While this classification seems to suggest a ranking of roads according to their principal functions as, say, intercity highways and feeder roads, the network has evolved in a less systematic and purposeful way. When traveling on the roads, a functional hierarchy of roads is often difficult to discern. With few exceptions, insignificant differences appear to exist between geometrical standards, pavement conditions, and traffic loads pertaining to the various classes of roads. Common to all categories are substantial encroachments on right-of-way and the constraint that they pass through, rather than circumvent, villages, towns, and cities, rendering road transport slow, inefficient, and often hazardous.
National Road Master Plan (2007 – 2017)
3
Map 1: National Highway Network
COLOMBO
KANDY
GALLE
JAFFNA
VAVUNIYA
MATALE
ANURADHAPURA
RATNAPURA
BADULLA
GAMPAHA
BATTICALOA
MANNAR
KURUNEGALA
KEGALLA
KALUTARA
NUWARA ELIYA
MATARA
TRINCOMALEE
AMPARA
POLONNARUWA
KILINOCHCHI
MONARAGALA
HAMBANTOTA
MULLAITTIVU
PUTTALAM
A04
A06A1
2
A09
A02
A05
A14
A01
A15
A18
A03
A32
A17
A26
A07
A08
A28
A35
AB44
A10
A11
B247
A27
A25
A34
A29
B035
B079
A30
B501
B133
B326
B403
B296
B308
B527
B423
B424
B282
A21
B413
B269
B213
B312
B045
B29
7
B322
B379
B363
B42
1
A16
B010
B112
B159
B528
B157
B057
B484
AB21
B415
AB2
0
B056
B036
B349
B324
B488
B019
B492
B371
B502
A22
B115
B060
B346
A31
B240
B084
B36
4
B274
AB10
B181
B445
A23
B538
B018
A24
B357
B283
B14
6
B014
B038
B517
B129
B464
B126
B359
B156
B437
A33
B478
B427
B325
B089
B457
B208
B114
B499
B562
B190
B332
B127
B166
B214
B205
B275
B454
AB31AB17
A20
B409B300
B141
AB39
AB16
AB29
B35
3
AB18
B272
B304
B201
B512
B56
7
B474
A13
AB19
B391
B055
B508
B279AB
01B355
B285
B100
B408
B317
B419
B360
B356
B482
B093
B243
B001
B211
B549
B412
B224
B07
5
B548
B002
B299
B467
B374
B387
A19
B207
B227
B486
B410
B461
B432
AB13
B009B1
28
B425
B339
B167
B556
B268
B034
B054
B429
B278
B222
AB32
B143
B329
B122
B188
B11
3
B430
B153
B281
B239
B172
B248
B177
B044
B258
B149
B463
B563
B043
B483
B264
B472
B039
B125
B513
B485
B462
B587
B252
B110
B160
B117
B552
B541
B458
B378
B136
B216
B390
B334
B244
B475
B350
B343
B286
B101
B351
B003
B067
B28
9
B238
B095
B088
B132
B38
5
B195
B073
B422
B471
B466
B097
B431
B265
B320
B142
B292
B480
B154
B257
B417
B456
B319
B32
8
B162
B564
B497
B189
B042
B183
B455
B435
B333
B086
B048
B008
B411
B330
B443
B099
B262
B256B005
B206
B287
B015
B544
B337
B087
B405
B237
B280
B
B442
B348
B602
B047
B498
B068
B539
B212
B389
B441
B152
B090
B176
B40
2
B294
B094
B006B439
B344
B284
AB11
B493
B361
B392
B400
B174
B012
AB23
B065
B071
B477
B184
B074
B150
B15
8B603
B180
B236
B473B031
B147
B588
B577
AB26
B358
B605
B028
B507
B202
B046
B098
B197
B137
B582
B503
B007
B116
B234
B139
B406
B191
B347
B138B106
B447
B433
B511
B516
B076
B399
B323
B182
AT 5
7
B25
1
B082
B382
B040
B310
B196
B481
B600
B226
B016
B163
B381
B030
B301
B064
B589
B529
B424
B019
A15B379
B577
A11
AB39
A32
A09
B264
B427
A09
A15
Planning DivisionROAD DEVELOPMENT AUTHORITYNovember - 2007
S
N
EW
Prepared By: Eng. T. MohandasC:\00_gis\road map\expressway
A - Class RoadB - Class Road
LEGEND
National Road Master Plan (2007 – 2017)
4
Table 2: Classes of Roads
Category Class Length (km)
% Paved Designated Function
Administrative Entity
Implementation Entity
National Roads
A 11,671 100 Inter-provincial trunk roads connecting major cities and ports
Ministry of Highways and Road Development
Road Development Authority (RDA)
B
Intra-provincial arterial roads connecting major urban areas
Provincial Roads
C 15,532 67 Major feeder roads and roads connecting settlements with markets.
Ministry of Provincial Councils and Local Government
Provincial Road Development Authority (PRDA) of relevant Provincial Council
D
Minor feeder roads & roads connecting settlements with markets, etc.
Local Authority Roads
E 64,659 13 Local roads providing access to specific locations
Ministry of Provincial Councils & Local Government
In-house Road Maintenance Unit of Municipal/Urban Council or Local Authority
Other Roads
Not Classified
24,000 - Plantation, forest, irrigation, roads
Ministry of Rural Development (MORD), Private Company, Agriculture Cooperative
For MORD Village Development Society; otherwise, usually contracted out
Total - 115,862 - - - -
Sources: Ministry of Finance and Planning. 2006. Mahinda Chintana: Vision for a new Sri Lanka. A Ten-Year Horizon Development Framework 2006–2016. Discussion Paper. Colombo. Available: http://www.mahindarajapaksa.com/MahindaChinthanaEnglish.pdf, and Final Report on The Detailed Design Study on the Outer Circular Highway to the City of Colombo, 2005
5. Long-term network planning has in the past been all but absent. The development of roads has been mostly reactive to emerging land use patterns and the increasing trend in motorization. These developments may have responded to the needs of the time, but are inadequate to meet current and future needs in the same manner. Sri Lanka’s transport system is roads-based and road transport is a major factor influencing the country’s trade competitiveness. Trade statistics clearly show that Sri Lanka’s manufacturing industry has become part of the international value chain. An efficient domestic transport system is a prerequisite for sustaining this position. 6. Given the scope of the network, allocation of adequate financial resources to maintenance has been a chronic problem and has been lagging behind increasing needs. While motorization has surged by on average 30% per year from 1997 to 2006, the allocation of funds to road works has grown annually by only 12% in real terms. As a priority, road development had to address the formidable challenge of an increasing backlog of deferred maintenance. Because of funding constraints, many roads have fallen into disrepair often causing costly rehabilitation and reconstruction.
National Road Master Plan (2007 – 2017)
5
7. Substantial capacity expansion to cope with the growth in traffic did not occur. The emphasis on adhering to the existing road limits, which often were below the legal extent of the right-of-way, has narrowed the scope for (i) widening roads to multi-lane carriageways; (ii) improving cross-sections, particularly with respect to drainage; and (iii) catering to the needs of pedestrians and cyclists. The past emphasis on rehabilitation and maintenance has led to a piecemeal approach to the improvement of the network. Projects have been scattered across the country, thus precluding the development of a cohesive network of trunk routes built and maintained to consistent standards. There is a need for a strategic shift from the traditional project centric approach to an approach that is focused on programs and strategies. 8. The challenge to road planning in Sri Lanka and thus to the NRMP is to release road development from a trap, in which it has been caught for a long time: The maintenance needs of the country’s intricate network have been consistently neglected because of insufficient resources. The consequent build-up of deferred maintenance has led to a gradual deterioration of road conditions. As a result, costly rehabilitation and reconstruction had to be accorded the highest priority, adding pressure on the already burdened Government coffers. At the same time, the scope for taking proactive measures to meet the rapid growth in traffic and, more generally, the needs of key economic sectors and modern transport logistics, has been very narrow. 9. The NRMP will confront these challenges. Covering the entire national road network, the NRMP will prescribe how the network will be maintained, improved and expanded to promote national integration and economic growth. It will strike a rational balance between the need to maintain, rehabilitate, and modernize Sri Lanka’s road system. The NRMP will provide safe roads to all users and will minimize the negative environmental and social impact that may result from the road projects. The means to implement the NRMP will be secured: This will apply to (i) sustainable funding of road maintenance, (ii) tapping a range of sources for the financing of road investments, (iii) improving institutional arrangements, and (iv) developing the capabilities and capacities of Sri Lankan road contractors to play a more significant role in the competition for contracts. 10. The NRMP will provide a sound basis for decision-making and for allocating scarce public resources to the road sector. Businesses and the general public will benefit from a rational use of funds and from a transport system that will be efficient and competitive. The NRMP will reassure Sri Lanka’s development partners of the strategic relevance of the projects, in which they participate, and the development results, which the projects are expected to yield. Implementation of the NRMP will be closely monitored and a program monitoring system will be devised that will set targets and determine accountabilities for attaining the targets.
National Road Master Plan (2007 – 2017)
6
II. RATIONALE FOR THE NRMP 11. The need for the NRMP is justifiable at different levels. At the operational level, transport in Sri Lanka is overwhelmingly roads-based and a large portion of the network is in a poor condition and has become an impediment to efficient transport. Secondly, as transport is a key input into overall national income generation, the Government’s development strategy has to count on a reliable transport system and the support from a coherent long-term approach to transport development. Thirdly, Sri Lanka’s integration in the global economy rests also on efficient transport logistics, which, among other factors, is a determinant of the country’s trade competitiveness. A. Intermodal Context - Why Emphasis on Roads? 12. In 2006, the Government launched a 10-year horizon development framework (2006–2016) as a vision for a new Sri Lanka.1 The vision is to attain economic growth of at least 8% per year over the next decade. With regard to the transport sector, the vision is “to provide accessibility to all population in the country and to have a high and quality mobility road network for the transportation of passengers and goods.” Mahinda Chintana, the presidential manifesto setting the Government’s development agenda, places a distinct emphasis on road development, while fully keeping the need for a balanced intermodal transport in view.
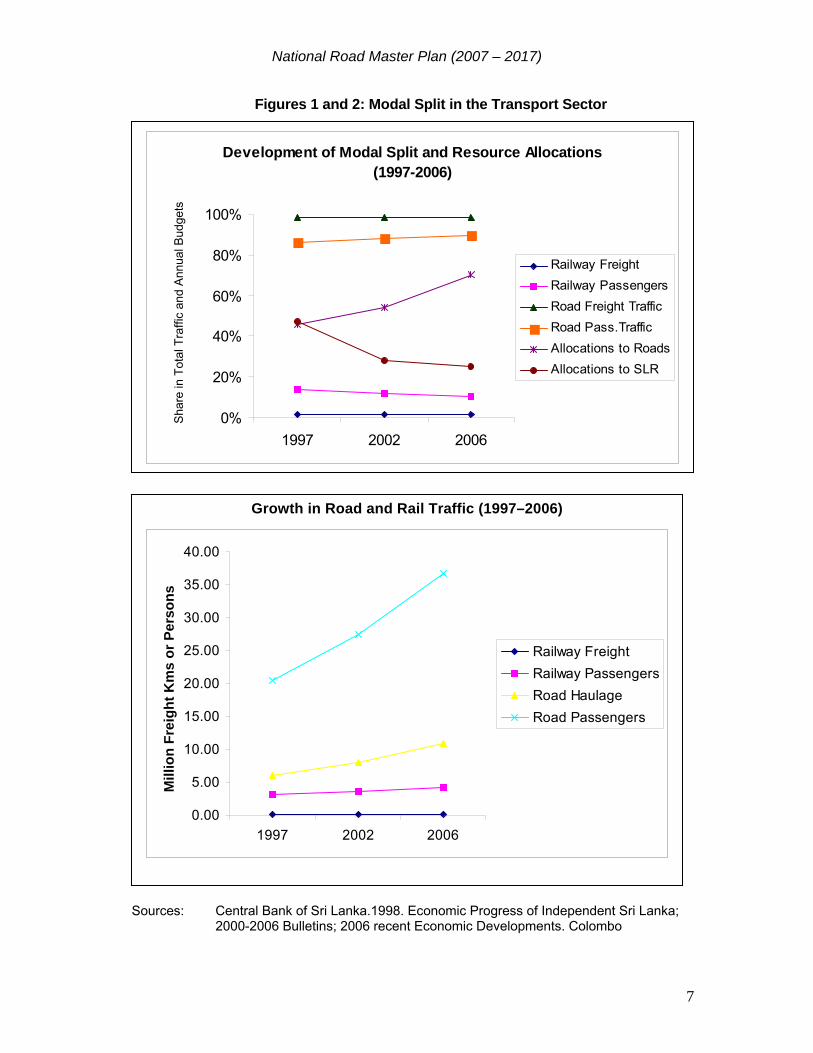
13. Under Mahinda Chintana, Sri Lanka Railways (SLR) is expected to regain a substantial portion of its lost market share, notably for bulk freight, for which railways are deemed to have a cost advantage over road transport. The vision of Mahinda Chintana is set against a backdrop of a steady decline in railway traffic for both passengers and freight and sharply increasing road traffic over the past decades. For passengers, SLR’s market share is at about 10%, while that for freight has fallen below 5% (see Figures 1 and 2). Despite certain comparative advantages, economic development has bypassed SLR. Shippers and consignees are principally interested in a clearly defined accountability, door-to-door services, and predictable transit times, which SLR has been struggling to provide. 14. The outlook for SLR is for continued intense competition from road transport, especially under conditions of much improved roads. Making SLR more competitive will require an all-embracing reform program with a focus on customer needs and the introduction of commercial procedures and standards that are common to private enterprises. Worldwide experience gained in railway reforms suggests that such far-reaching reforms take a long time to complete. Sri Lanka’s transport needs and the needs of the economy at large may not be able to afford such a long time. A continued emphasis on road development is therefore a realistic option and in the interest of the overall economy. This must not preclude efforts towards addressing interface problems between road and rail transport, which would make the whole transport system more efficient.
1 Ministry of Finance and Planning. 2006. Mahinda Chintana: Vision for a new Sri Lanka. Ibid.
National Road Master Plan (2007 – 2017)
7
Figures 1 and 2: Modal Split in the Transport Sector
Sources: Central Bank of Sri Lanka.1998. Economic Progress of Independent Sri Lanka; 2000-2006 Bulletins; 2006 recent Economic Developments. Colombo
Development of Modal Split and Resource Allocations (1997-2006)
0%
20%
40%
60%
80%
100%
1997 2002 2006
Sha
re in
Tot
al T
raffi
c an
d A
nnua
l Bud
gets
Railway FreightRailway PassengersRoad Freight TrafficRoad Pass.TrafficAllocations to RoadsAllocations to SLR
Growth in Road and Rail Traffic (1997–2006)
0.00
5.00
10.00
15.00
20.00
25.00
30.00
35.00
40.00
1997 2002 2006
Mill
ion
Frei
ght K
ms
or P
erso
ns
Railway FreightRailway PassengersRoad HaulageRoad Passengers
National Road Master Plan (2007 – 2017)
8
B. Road Conditions
15. More than 50% of the entire road network, including national and provincial roads, is in poor to bad condition, requiring either rehabilitation or upgrading. To address the serious backlog in maintenance, it will be necessary to increase the financial resources for road maintenance. This means at the same time that decisions for investments in new road capacity be rationalized. In order to ensure that funds are appropriately used for maintenance, there is a need to develop mechanisms that provide predictable and reliable resource allocations for road maintenance. 16. There is an urgent need to embark on a program for the construction of new intercity highways. During the last two decades, emphasis has been placed on the rehabilitation of existing roads and construction of new rural roads. The inadequate capacity of trunk roads poses major challenges to the fast growing traffic. Traffic levels now exceed the design capacity of many roads. Uncontrolled roadside development has reduced the capacity of the road network. The scope for widening roads on existing alignments is limited mainly because of land acquisition constraints. Increasing traffic volumes and a traffic mix consisting of motorized and non-motorized traffic has resulted in low travel speeds, severe traffic congestions, and increased accident rates. 17. The capacity constraints have created severe safety problems. As a result of rising traffic, uncontrolled roadside development, and a traffic mix consisting of pedestrians, animal driven carts and cyclists, road safety has become a major concern. The annual economic cost resulting from road accidents are estimated at Rs. 9 billion. The issue has not only economic, but also social dimensions. The incidence of road accidents is on those, who are least able to cope with the severe effects. The majority of road accident fatalities and injuries are borne by bicyclists, motorcyclists, and pedestrians, who typically belong to the poorer sections of society. C. Government Strategy 18. Road transport has become a priority sector because of the need to restore regionally balanced living conditions and economic opportunities for all Sri Lankans. Sri Lanka’s urban population has been experiencing steady growth over the past decades. This trend is expected to continue. While currently 30% of the country's population is living in urban areas, by 2015 this share is projected to exceed 50%. However, unfettered urbanization has in the past led to undesirable outcomes, reflected in ribbon-type urban expansions, population concentration on the Western Province, and imbalance in regional income distribution. Mahinda Chintana provides a blue print for future urban development.2 19. Priority will be placed on creating major growth centers with adequate capacity and economic opportunities to absorb a growing urban population. The Government has identified potential growth centers at the national, regional, and district level. Specifically, the Government strategy envisages to
2 Ministry of Finance and Planning. 2006. Mahinda Chintana: Vision for a new Sri Lanka. A Ten-Year
Horizon Development Framework 2006–2016. Discussion Paper. Colombo. Available: http://www.mahindarajapaksa.com/MahindaChinthanaEnglish.pdf
National Road Master Plan (2007 – 2017)
9
• Establish growth hubs at the national level to ensure balanced development in the country;
• Develop regional cities on particular economic themes; and • Develop small and medium townships throughout the country as second and
third order cities.
20. The growth centers at the national level include Greater Dambulla, Greater Hamabantota, Greater Trincomalee, Colombo-Sri Jayewardenepura, Jaffna, Batticloa and Anuradhapura. The prospective regional growth centres are Galle, Kandy, Horana, Kurunagala, Puttlam, Kegalle, Vavuniya, Badulla, Mahiyangana, Awissawella, and Monaragala. The NRMP will play its part in ensuring that the process of urbanization will generate social and economic gains. Towards this end, priority will be accorded to providing efficient connectivity between the hubs and between the hubs and the subordinated centers.

National Road Master Plan (2007 – 2017)
10
Map 2: Proposed Growth Centers for Accelerated Economic Development
National Road Master Plan (2007 – 2017)
11
D. Trade Competitiveness 21. In the era of globalization, good road conditions matter more than just improving mobility of the population. Sri Lanka’s economy has traditionally been open to international trade with exports and imports averaging more than 60% of GDP over the past two decades. Thus, Sri Lanka’s economy cannot take shelter from the competitive forces that have been unleashed by globalization. The country’s manufacturing industry is integrated in the international value chain. In Sri Lanka’s external trade, imported intermediate goods for domestic processing have to a large extent replaced fully manufactured goods. In 2006, they accounted for about 55% of total imports. With a share of 73% in total export earnings, manufactured items, rather than agricultural products, currently dominate exports. 22. Efficient road transport is key for Sri Lanka’s trade competitiveness. Globalization has been driven by trade liberalization, and the development of information and communication technology (ICT) along with technological innovations for manufacturing and transport. These developments have created the conditions for an expansion in the international division of labor, in which Sri Lanka is fully integrated. Elements of the value chain are redeployed in accordance with the comparative cost advantage of each link to often remote geographical locations. Logistics services support and coordinate the spatially dispersed business activities. Efficient transport logistics, of which road infrastructure is an important part, thus provide the necessary underpinning of a country’s trade competitiveness, along with other important determinants. 23. Increased global competition and the need to reduce costs have encouraged enterprises to source intermediate and final goods from the global market. Sri Lanka has benefited from this development. While logistics costs are determining the competitiveness of enterprises, a transport system, including good infrastructure and sound policies and institutions, influence the cost of businesses and thus determine the competitiveness of a country. The cost share of transport logistics in total value added may appear small. However, good or poor transport conditions can still determine "where-to-source" decisions of international businesses.
24. Moreover, the economic significance of transport logistics is not limited to its costs. The nature and quality of the transport service is often equally important, particularly in those sectors, where business processes are contingent on rapid and reliable delivery. Increased containerized cargo on Sri Lanka’s roads reflects the development in transport logistics. At the same time, given existing road and traffic conditions, it contributes to slow traffic flows and prevents containerization from exploiting its full cost advantage. Container trucks have a large claim on road capacity and as such contribute to slow moving traffic and congestion. Banning such trucks from the roads during daytime is not a lasting solution as it delays the cargo, limits the productivity of trucks and increases the cost of transport.
National Road Master Plan (2007 – 2017)
12
III. NATIONAL ROAD MASTER PLAN (2008 – 2017) A. Objectives 25. The overall objective of the NRMP is to help sustain and enhance general welfare, promote economic growth, eradicate poverty, and strengthen social cohesion. The mission of the NRMP is to:
26. The NRMP will ensure that the road network will be planned, maintained, constructed and developed to
(i) Promote economic development of the country, by taking into
consideration the immediate and future socio-economic development plans and policies of the Government;
(ii) Facilitate greater mobility, reduce travel times and costs, and improve accessibility;
(iii) Meet current and expected future transport needs, of both passenger and freight, and ensure efficient utilization of assets and investments;
(iv) Improve the quality of roads by using cost effective and innovative techniques of design, construction and maintenance with improved safety for the people;
(v) Strike a balance between the maintenance and rehabilitation of existing assets and adding capacity through widening, improving, and new road construction;
(vi) Promote institutional development of the road administration; (vii) Ensure protection of the environment and of social and cultural values;
and (viii) Develop the local road contracting industry.
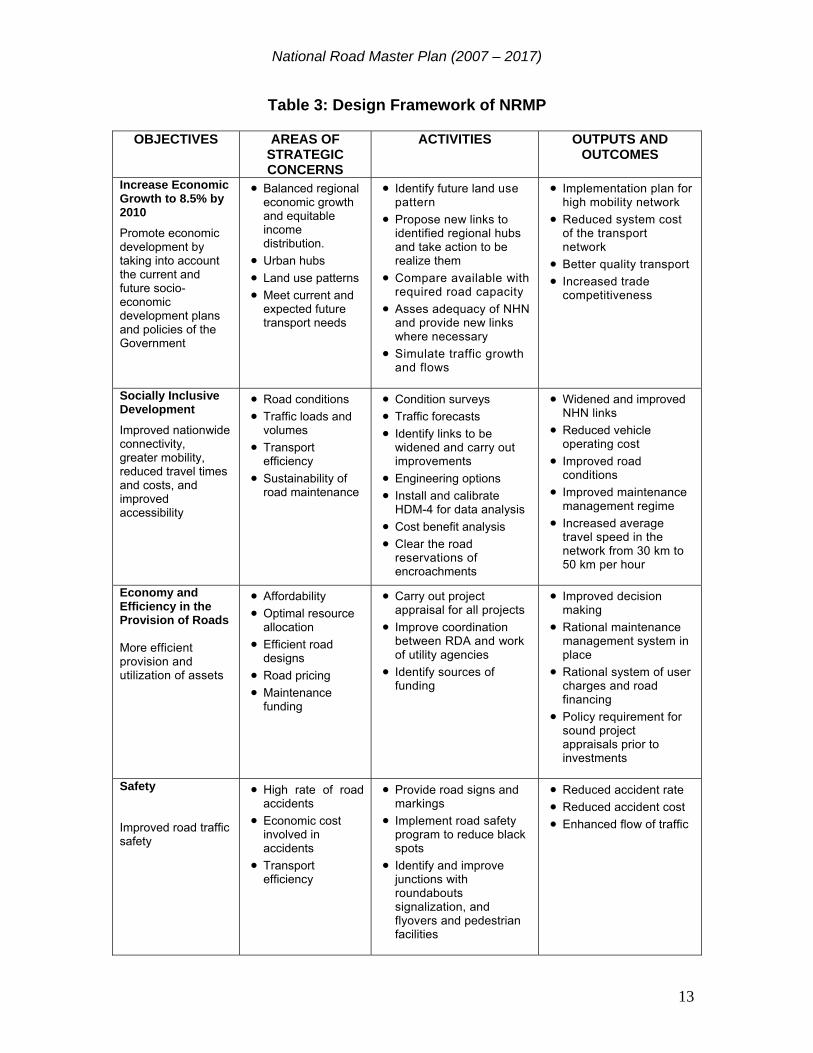
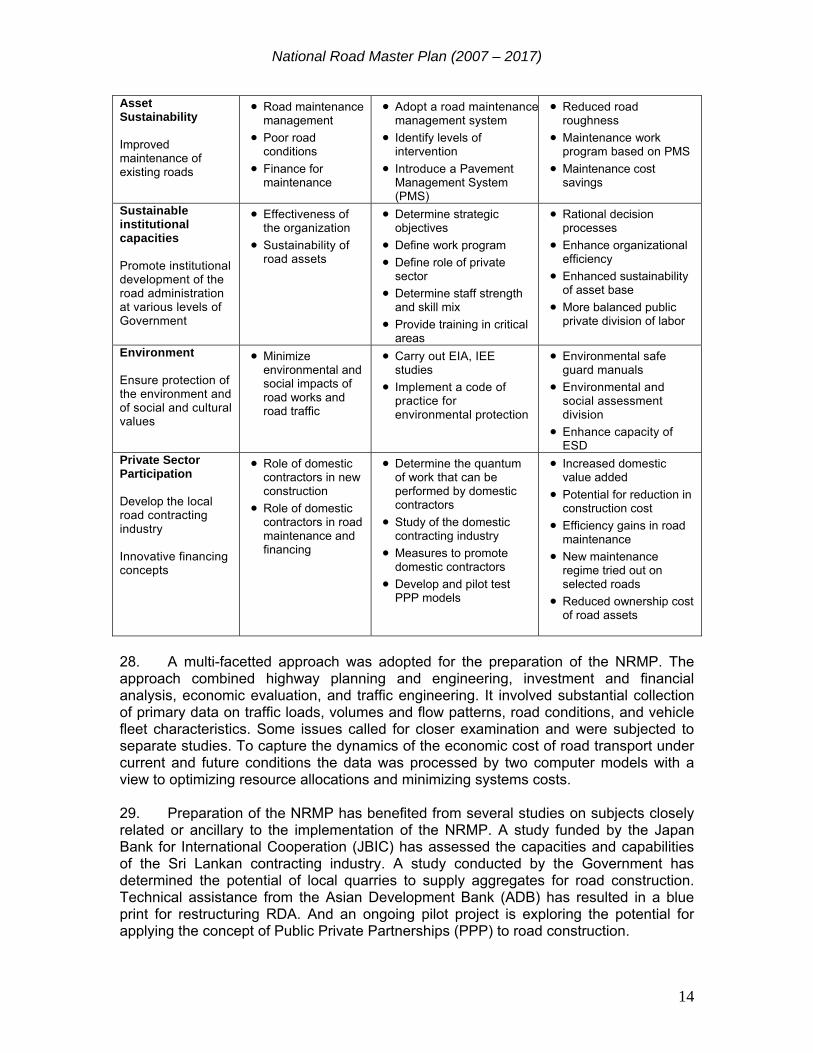
B. Approach and Methodology 27. Scarce financial Government resources are facing competing claims from various sectors. The road sector has in the past absorbed a substantial share of the resources and the implementation of NRMP will lead to increases in this regard Therefore, proper evaluation and optimization of road expenditures become imperative. The formulation of NRMP has employed tools and methods that meet this requirement. In addition to analytical work, the NRMP involves a number of institutional measures that are aimed at strengthening the sustainability of the road sector at large, its asset base, its institutions, and Sri Lanka’s contracting industry that is still at an early stage of development. The relationship of NRMP objectives, main areas of concerns, envisaged action and outputs is illustrated in the design framework in Table 3.
“To provide an adequate and efficient network of national highways, to ensure mobility and accessibility at an acceptable level of safety and comfort, in an environment-friendly manner for the movement of people and goods in the socio-economic development of the nation.”
National Road Master Plan (2007 – 2017)
13
Table 3: Design Framework of NRMP
OBJECTIVES AREAS OF STRATEGIC CONCERNS
ACTIVITIES OUTPUTS AND OUTCOMES
Increase Economic Growth to 8.5% by 2010 Promote economic development by taking into account the current and future socio-economic development plans and policies of the Government
• Balanced regional economic growth and equitable income distribution.
• Urban hubs • Land use patterns • Meet current and
expected future transport needs
• Identify future land use pattern
• Propose new links to identified regional hubs and take action to be realize them
• Compare available with required road capacity
• Asses adequacy of NHN and provide new links where necessary
• Simulate traffic growth and flows
• Implementation plan for high mobility network
• Reduced system cost of the transport network
• Better quality transport • Increased trade
competitiveness
Socially Inclusive Development Improved nationwide connectivity, greater mobility, reduced travel times and costs, and improved accessibility
• Road conditions • Traffic loads and
volumes • Transport
efficiency • Sustainability of
road maintenance
• Condition surveys • Traffic forecasts • Identify links to be
widened and carry out improvements
• Engineering options • Install and calibrate
HDM-4 for data analysis • Cost benefit analysis • Clear the road
reservations of encroachments
• Widened and improved NHN links
• Reduced vehicle operating cost
• Improved road conditions
• Improved maintenance management regime
• Increased average travel speed in the network from 30 km to 50 km per hour
Economy and Efficiency in the Provision of Roads More efficient provision and utilization of assets
• Affordability • Optimal resource
allocation • Efficient road
designs • Road pricing • Maintenance
funding
• Carry out project appraisal for all projects
• Improve coordination between RDA and work of utility agencies
• Identify sources of funding
• Improved decision making
• Rational maintenance management system in place
• Rational system of user charges and road financing
• Policy requirement for sound project appraisals prior to investments
Safety Improved road traffic safety
• High rate of road accidents
• Economic cost involved in accidents
• Transport efficiency
• Provide road signs and markings
• Implement road safety program to reduce black spots
• Identify and improve junctions with roundabouts signalization, and flyovers and pedestrian facilities
• Reduced accident rate • Reduced accident cost • Enhanced flow of traffic
National Road Master Plan (2007 – 2017)
14
Asset Sustainability Improved maintenance of existing roads
• Road maintenance management
• Poor road conditions
• Finance for maintenance
• Adopt a road maintenancemanagement system
• Identify levels of intervention
• Introduce a Pavement Management System (PMS)
• Reduced road roughness
• Maintenance work program based on PMS
• Maintenance cost savings
Sustainable institutional capacities Promote institutional development of the road administration at various levels of Government
• Effectiveness of the organization
• Sustainability of road assets
• Determine strategic objectives
• Define work program • Define role of private
sector • Determine staff strength
and skill mix • Provide training in critical
areas
• Rational decision processes
• Enhance organizational efficiency
• Enhanced sustainability of asset base
• More balanced public private division of labor
Environment Ensure protection of the environment and of social and cultural values
• Minimize environmental and social impacts of road works and road traffic
• Carry out EIA, IEE studies
• Implement a code of practice for environmental protection
• Environmental safe guard manuals
• Environmental and social assessment division
• Enhance capacity of ESD
Private Sector Participation Develop the local road contracting industry Innovative financing concepts
• Role of domestic contractors in new construction
• Role of domestic contractors in road maintenance and financing
• Determine the quantum of work that can be performed by domestic contractors
• Study of the domestic contracting industry
• Measures to promote domestic contractors
• Develop and pilot test PPP models
• Increased domestic value added
• Potential for reduction in construction cost
• Efficiency gains in road maintenance
• New maintenance regime tried out on selected roads
• Reduced ownership cost of road assets
28. A multi-facetted approach was adopted for the preparation of the NRMP. The approach combined highway planning and engineering, investment and financial analysis, economic evaluation, and traffic engineering. It involved substantial collection of primary data on traffic loads, volumes and flow patterns, road conditions, and vehicle fleet characteristics. Some issues called for closer examination and were subjected to separate studies. To capture the dynamics of the economic cost of road transport under current and future conditions the data was processed by two computer models with a view to optimizing resource allocations and minimizing systems costs. 29. Preparation of the NRMP has benefited from several studies on subjects closely related or ancillary to the implementation of the NRMP. A study funded by the Japan Bank for International Cooperation (JBIC) has assessed the capacities and capabilities of the Sri Lankan contracting industry. A study conducted by the Government has determined the potential of local quarries to supply aggregates for road construction. Technical assistance from the Asian Development Bank (ADB) has resulted in a blue print for restructuring RDA. And an ongoing pilot project is exploring the potential for applying the concept of Public Private Partnerships (PPP) to road construction.
National Road Master Plan (2007 – 2017)
15
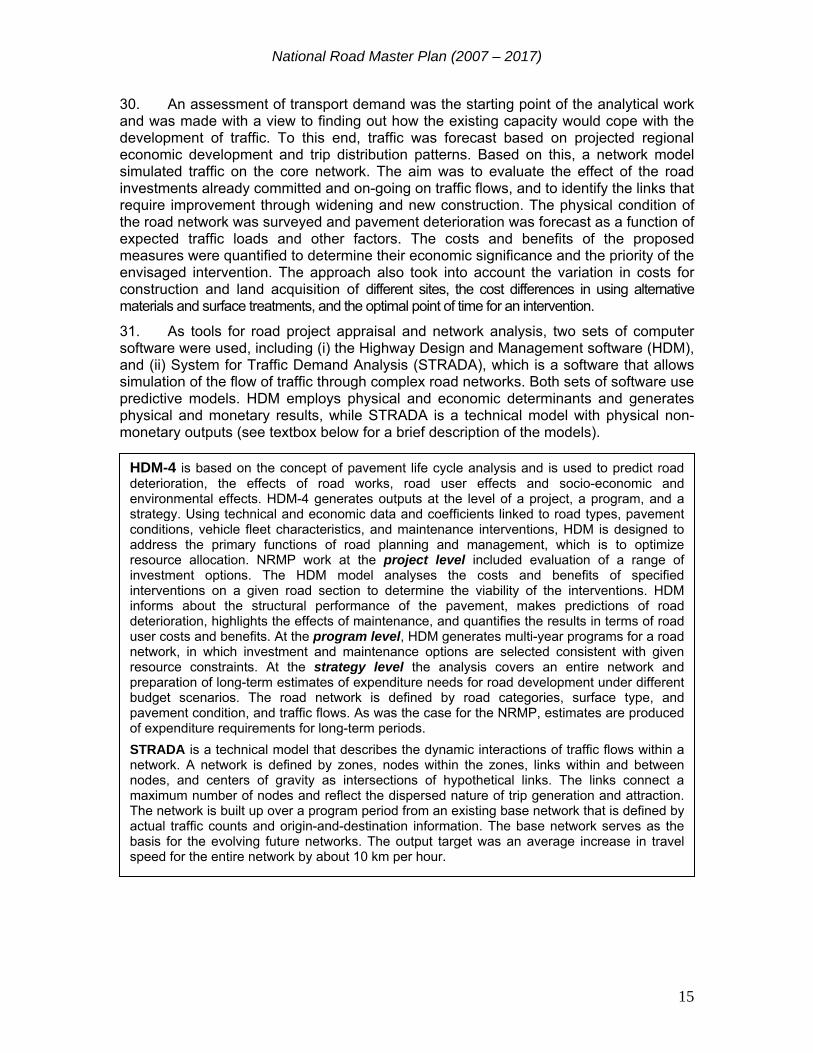
30. An assessment of transport demand was the starting point of the analytical work and was made with a view to finding out how the existing capacity would cope with the development of traffic. To this end, traffic was forecast based on projected regional economic development and trip distribution patterns. Based on this, a network model simulated traffic on the core network. The aim was to evaluate the effect of the road investments already committed and on-going on traffic flows, and to identify the links that require improvement through widening and new construction. The physical condition of the road network was surveyed and pavement deterioration was forecast as a function of expected traffic loads and other factors. The costs and benefits of the proposed measures were quantified to determine their economic significance and the priority of the envisaged intervention. The approach also took into account the variation in costs for construction and land acquisition of different sites, the cost differences in using alternative materials and surface treatments, and the optimal point of time for an intervention. 31. As tools for road project appraisal and network analysis, two sets of computer software were used, including (i) the Highway Design and Management software (HDM), and (ii) System for Traffic Demand Analysis (STRADA), which is a software that allows simulation of the flow of traffic through complex road networks. Both sets of software use predictive models. HDM employs physical and economic determinants and generates physical and monetary results, while STRADA is a technical model with physical non-monetary outputs (see textbox below for a brief description of the models).
HDM-4 is based on the concept of pavement life cycle analysis and is used to predict road deterioration, the effects of road works, road user effects and socio-economic and environmental effects. HDM-4 generates outputs at the level of a project, a program, and a strategy. Using technical and economic data and coefficients linked to road types, pavement conditions, vehicle fleet characteristics, and maintenance interventions, HDM is designed to address the primary functions of road planning and management, which is to optimize resource allocation. NRMP work at the project level included evaluation of a range of investment options. The HDM model analyses the costs and benefits of specified interventions on a given road section to determine the viability of the interventions. HDM informs about the structural performance of the pavement, makes predictions of road deterioration, highlights the effects of maintenance, and quantifies the results in terms of road user costs and benefits. At the program level, HDM generates multi-year programs for a road network, in which investment and maintenance options are selected consistent with given resource constraints. At the strategy level the analysis covers an entire network and preparation of long-term estimates of expenditure needs for road development under different budget scenarios. The road network is defined by road categories, surface type, and pavement condition, and traffic flows. As was the case for the NRMP, estimates are produced of expenditure requirements for long-term periods. STRADA is a technical model that describes the dynamic interactions of traffic flows within a network. A network is defined by zones, nodes within the zones, links within and between nodes, and centers of gravity as intersections of hypothetical links. The links connect a maximum number of nodes and reflect the dispersed nature of trip generation and attraction. The network is built up over a program period from an existing base network that is defined by actual traffic counts and origin-and-destination information. The base network serves as the basis for the evolving future networks. The output target was an average increase in travel speed for the entire network by about 10 km per hour.
National Road Master Plan (2007 – 2017)
16
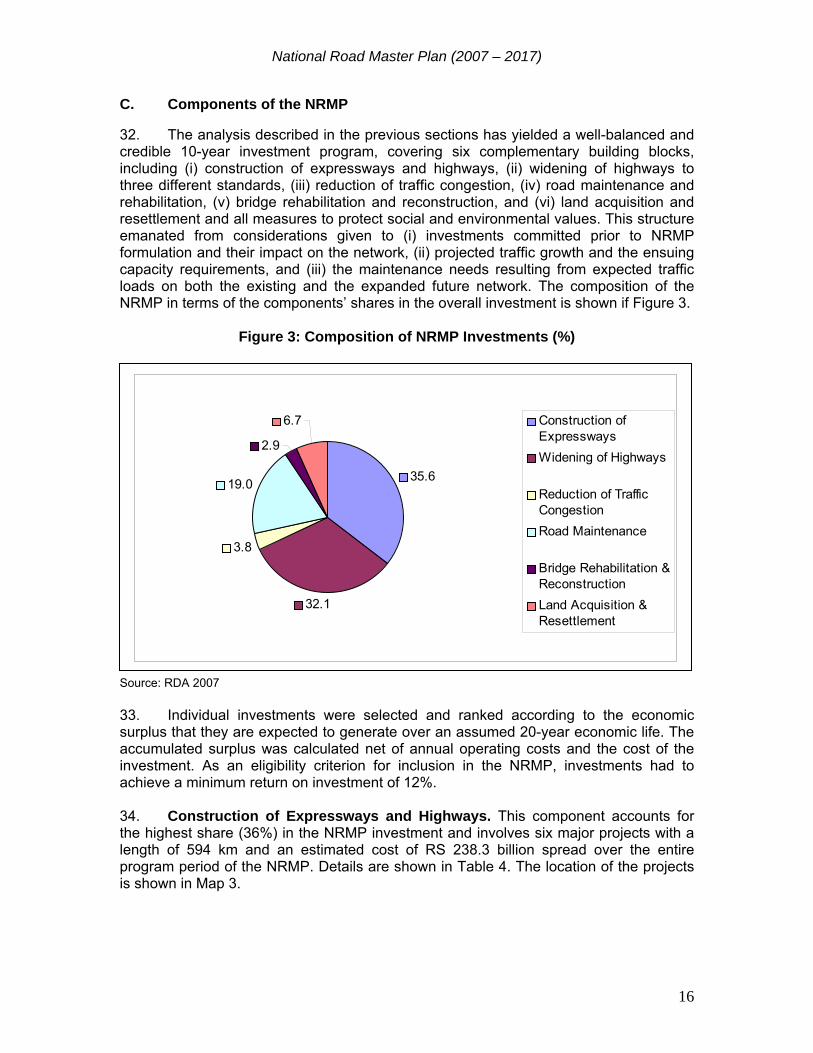
C. Components of the NRMP 32. The analysis described in the previous sections has yielded a well-balanced and credible 10-year investment program, covering six complementary building blocks, including (i) construction of expressways and highways, (ii) widening of highways to three different standards, (iii) reduction of traffic congestion, (iv) road maintenance and rehabilitation, (v) bridge rehabilitation and reconstruction, and (vi) land acquisition and resettlement and all measures to protect social and environmental values. This structure emanated from considerations given to (i) investments committed prior to NRMP formulation and their impact on the network, (ii) projected traffic growth and the ensuing capacity requirements, and (iii) the maintenance needs resulting from expected traffic loads on both the existing and the expanded future network. The composition of the NRMP in terms of the components’ shares in the overall investment is shown if Figure 3.
Figure 3: Composition of NRMP Investments (%)
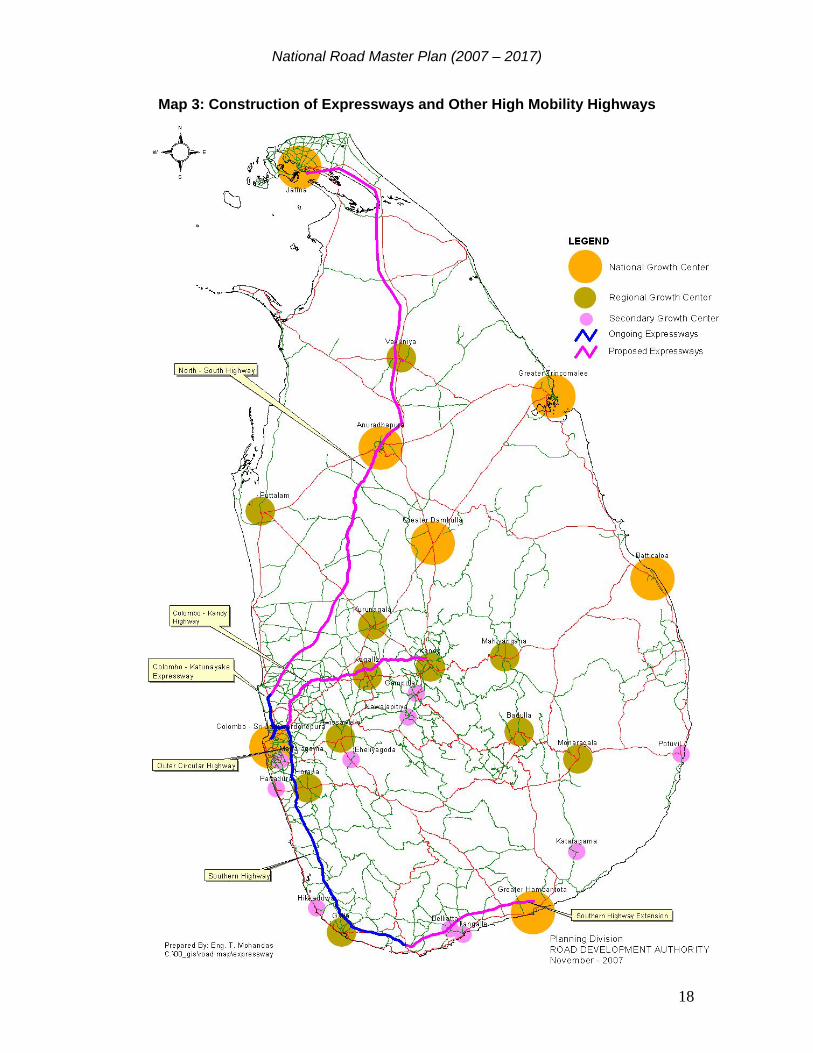
Maintenance Rehabilitation Source: RDA 2007 33. Individual investments were selected and ranked according to the economic surplus that they are expected to generate over an assumed 20-year economic life. The accumulated surplus was calculated net of annual operating costs and the cost of the investment. As an eligibility criterion for inclusion in the NRMP, investments had to achieve a minimum return on investment of 12%. 34. Construction of Expressways and Highways. This component accounts for the highest share (36%) in the NRMP investment and involves six major projects with a length of 594 km and an estimated cost of RS 238.3 billion spread over the entire program period of the NRMP. Details are shown in Table 4. The location of the projects is shown in Map 3.
35.6
32.1
3.8
19.0
2.9
6.7 Construction ofExpresswaysWidening of Highways
Reduction of TrafficCongestionRoad Maintenance
Bridge Rehabilitation &ReconstructionLand Acquisition &Resettlement

National Road Master Plan (2007 – 2017)
17
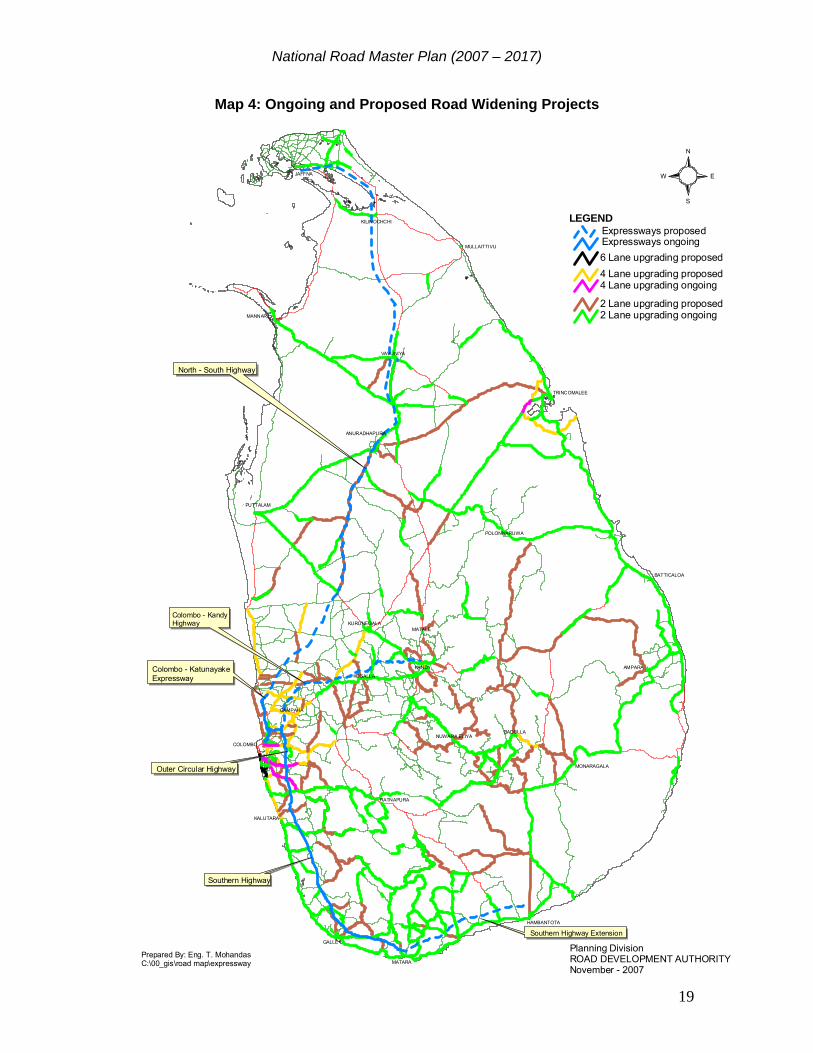
Table 4: Construction of Expressways and Highways (Billion Rupees) Source: RDA 2007 35. Widening of Highways. Widening of highways under the NRMP is the most significant component in terms of geographical coverage (see Map 4) and, along with that, connectivity of people. The component includes 141 individual projects and involves a total of 4,900 km that will be improved to multi-lane standards, which for the majority of the roads means two lanes. The interventions levels shown in Table 5 are based on recognized international capacity analysis, with the criteria for the three widening options determined by current and forecast average annual daily traffic (AADT). The total cost of the widening component is estimated at Rs 215 billion, which makes it the second largest component in the NRMP (32%).
Table 5: Widening of Highways (Billion Rupees) Source: RDA 2007 36. Reduction of Traffic Congestion. This component covers 112 improvements located mainly in towns and cities, where they will ensure a smoother flow of traffic and a lower incidence of accidents. The proposed measures include Improvement of junctions, provision of signaling systems at junctions, construction of by passes and flyovers, and grade-separated interchanges. The relatively small cost share of these projects in total NRMP investments (3.8%) belies their impact on providing relief to traffic congestion, avoidance of accidents, and contribution to the economic benefits attributable to the NRMP. Because of their relatively low cost, the heavy urban traffic, and the high cost savings generated by the improvements, the proposed measures are generating the highest return on investments among all NRMP components.
Table 6: Reduction of Traffic Congestion (Billion Rupees) Source: RDA 2007
KM 2007 2008 2009 2010 2011 2012 2013 2014 2015 2016 2017 TOTAL
Colombo Katunayake 25.1 2.9 10.1 10.4 0.2 0.0 0.0 0.0 0.0 0.0 0.0 0.0 23.5Southern Expressway 130.0 8.0 7.1 5.9 8.0 10.0 2.0 0.0 0.0 0.0 0.0 0.0 41.0Outer Circular Highway 28.0 2.9 5.4 11.1 6.0 6.0 5.6 0.0 0.0 0.0 0.0 0.0 37.1Colombo Kandy Expressway 98.0 0.0 0.2 1.4 10.7 13.3 10.0 6.0 0.0 0.0 0.0 0.0 41.7Colombo Jaffna Expressway 213.0 0.1 0.1 0.5 0.5 1.0 7.0 12.0 18.0 20.0 20.0 8.8 88.0Extension Southern Expressway 100.0 0.0 0.0 0.0 0.0 0.0 0.0 0.0 0.0 0.0 2.0 5.0 7.0
Total 594.1 13.9 23.0 29.3 25.3 30.3 24.6 18.0 18.0 20.0 22.0 13.8 238.3
Required KM 2007 2008 2009 2010 2011 2012 2013 2014 2015 2016 2017 TOTALAADT
Widening to 6 Lanes 30,000 22.2 0.1 0.3 0.4 2.0 2.0 2.3 2.5 2.5 2.5 2.5 2.5 19.6Widening to 4 Lanes 15,000 477.7 0.4 0.3 0.5 0.8 5.8 8.0 7.5 10.2 3.8 0.7 0.9 38.9Widening to 2 Lanes 3,000 4399.7 14.8 16.5 16.5 10.8 9.2 11.0 11.8 9.0 19.3 23.9 13.8 156.6
Total 4899.7 15.2 17.2 17.3 13.6 17.0 21.3 21.8 21.7 25.7 27.1 17.2 215.1
2007 2008 2009 2010 2011 2012 2013 2014 2015 2016 2017 TOTALNo.
New Fly Overs 21 0.4 0.5 0.6 1.6 3.2 3.0 3.8 4.6 1.8 0.8 0.3 20.5Improvement of Junctions 33 0.0 0.0 0.0 0.1 0.1 0.1 0.1 0.1 0.1 0.1 0.0 0.7New signalling systems 33 0.0 0.0 0.1 0.1 0.1 0.1 0.1 0.1 0.1 0.1 0.1 1.0New By-Passes 25 0.0 0.2 0.3 0.4 0.5 0.6 0.5 0.2 0.2 0.2 0.1 3.0
Total 112 0.4 0.8 0.9 2.2 3.9 3.8 4.4 5.0 2.1 1.1 0.4 25.1
Projects
National Road Master Plan (2007 – 2017)
18
Map 3: Construction of Expressways and Other High Mobility Highways
National Road Master Plan (2007 – 2017)
19
Map 4: Ongoing and Proposed Road Widening Projects
KANDY
GALLE
JAFFNA
MANNAR
MATALE
AMPARA
MATARA
KEGALLA
GAMPAHA
BADULLA
COLOMBO
VAVUNIYA
PUTTALAM
KALUTARA
RATNAPURA
BATTICALOA
KURUNEGALA
MONARAGALA
HAMBANTOTA
KILINOCHCHI
MULLAITTIVU
TRINCOMALEE
POLONNARUWA
ANURADHAPURA
NUWARA ELIYA
Prepared By: Eng. T. MohandasC:\00_gis\road map\expressway
Outer Circular Highway
North - South Highway
Colombo - KandyHighway
Colombo - KatunayakeExpressway
Southern Highway
Southern Highway Extension
Planning DivisionROAD DEVELOPMENT AUTHORITYNovember - 2007
LEGENDExpressways proposed Expressways ongoing 6 Lane upgrading proposed4 Lane upgrading proposed
2 Lane upgrading proposed2 Lane upgrading ongoing
4 Lane upgrading ongoing
S
N
EW
National Road Master Plan (2007 – 2017)
20
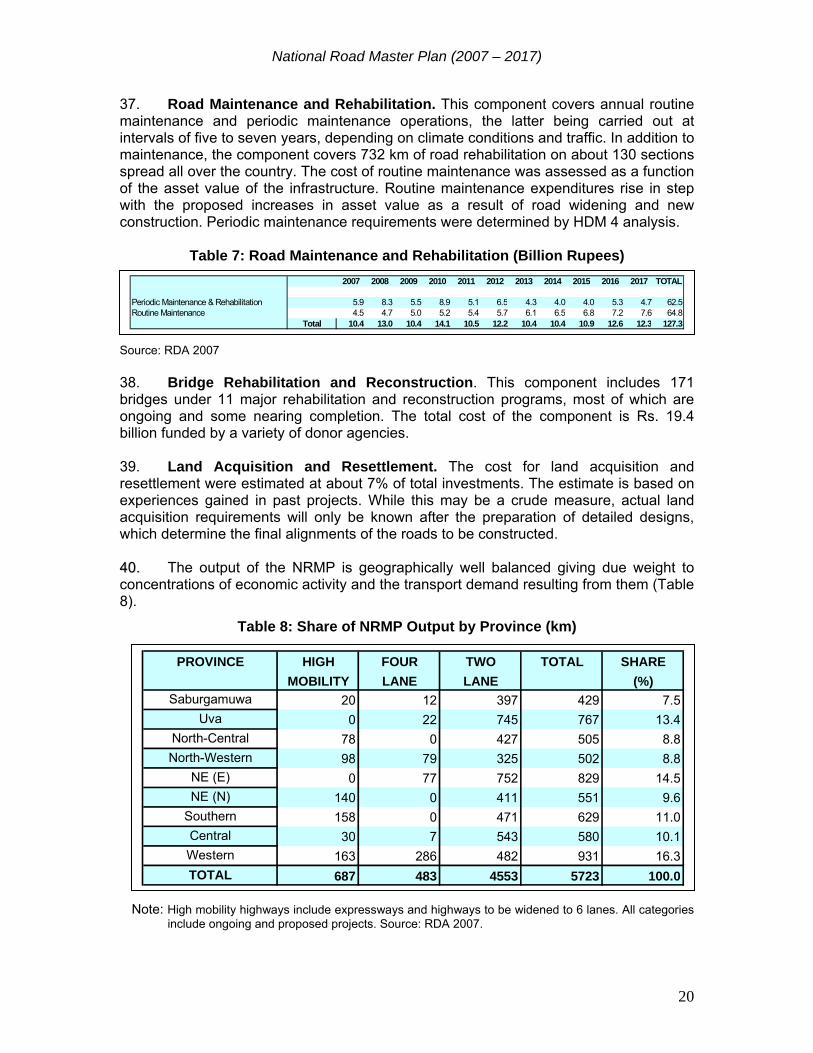
37. Road Maintenance and Rehabilitation. This component covers annual routine maintenance and periodic maintenance operations, the latter being carried out at intervals of five to seven years, depending on climate conditions and traffic. In addition to maintenance, the component covers 732 km of road rehabilitation on about 130 sections spread all over the country. The cost of routine maintenance was assessed as a function of the asset value of the infrastructure. Routine maintenance expenditures rise in step with the proposed increases in asset value as a result of road widening and new construction. Periodic maintenance requirements were determined by HDM 4 analysis.
Table 7: Road Maintenance and Rehabilitation (Billion Rupees) Source: RDA 2007 38. Bridge Rehabilitation and Reconstruction. This component includes 171 bridges under 11 major rehabilitation and reconstruction programs, most of which are ongoing and some nearing completion. The total cost of the component is Rs. 19.4 billion funded by a variety of donor agencies. 39. Land Acquisition and Resettlement. The cost for land acquisition and resettlement were estimated at about 7% of total investments. The estimate is based on experiences gained in past projects. While this may be a crude measure, actual land acquisition requirements will only be known after the preparation of detailed designs, which determine the final alignments of the roads to be constructed. 4400.. The output of the NRMP is geographically well balanced giving due weight to concentrations of economic activity and the transport demand resulting from them (Table 8).
Table 8: Share of NRMP Output by Province (km)
Note: High mobility highways include expressways and highways to be widened to 6 lanes. All categories include ongoing and proposed projects. Source: RDA 2007.
2007 2008 2009 2010 2011 2012 2013 2014 2015 2016 2017 TOTAL
Periodic Maintenance & Rehabilitation 5.9 8.3 5.5 8.9 5.1 6.5 4.3 4.0 4.0 5.3 4.7 62.5Routine Maintenance 4.5 4.7 5.0 5.2 5.4 5.7 6.1 6.5 6.8 7.2 7.6 64.8
10.4 13.0 10.4 14.1 10.5 12.2 10.4 10.4 10.9 12.6 12.3 127.3Total
PROVINCE HIGH FOUR TWO TOTAL SHAREMOBILITY LANE LANE (%)
Saburgamuwa 20 12 397 429 7.5Uva 0 22 745 767 13.4
North-Central 78 0 427 505 8.8North-Western 98 79 325 502 8.8
NE (E) 0 77 752 829 14.5NE (N) 140 0 411 551 9.6
Southern 158 0 471 629 11.0Central 30 7 543 580 10.1Western 163 286 482 931 16.3TOTAL 687 483 4553 5723 100.0
National Road Master Plan (2007 – 2017)
21
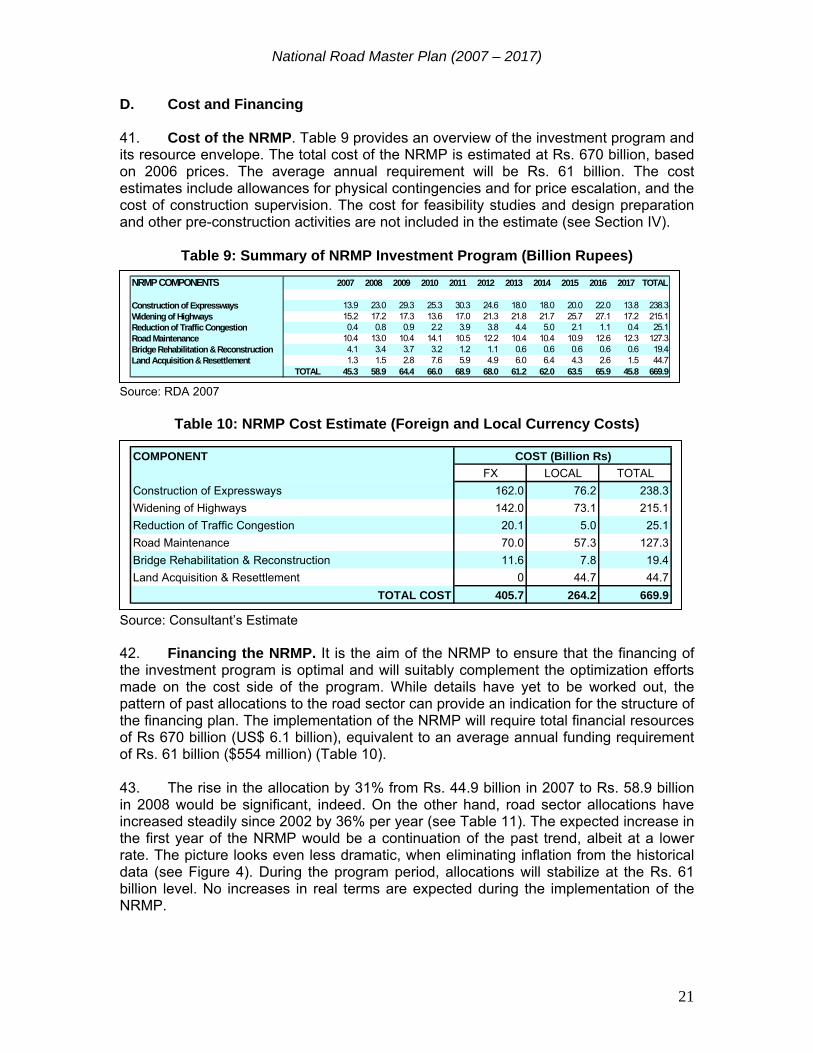
D. Cost and Financing 41. Cost of the NRMP. Table 9 provides an overview of the investment program and its resource envelope. The total cost of the NRMP is estimated at Rs. 670 billion, based on 2006 prices. The average annual requirement will be Rs. 61 billion. The cost estimates include allowances for physical contingencies and for price escalation, and the cost of construction supervision. The cost for feasibility studies and design preparation and other pre-construction activities are not included in the estimate (see Section IV).
Table 9: Summary of NRMP Investment Program (Billion Rupees) Source: RDA 2007
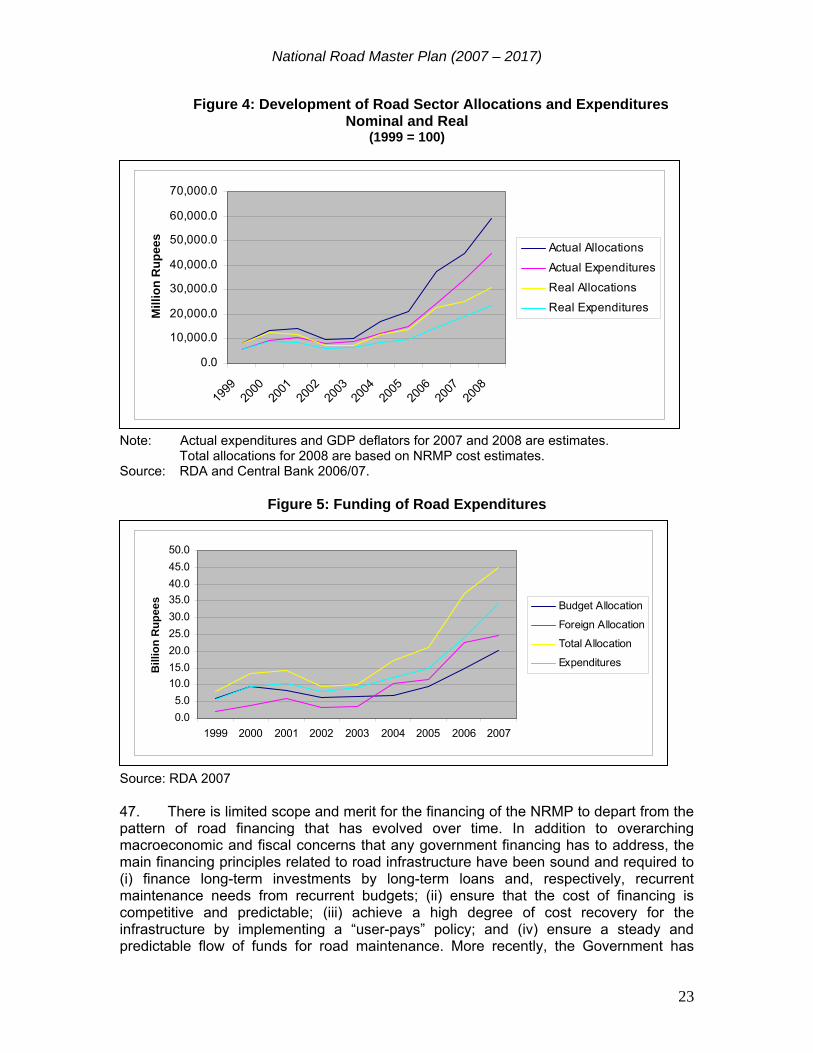
Table 10: NRMP Cost Estimate (Foreign and Local Currency Costs) Source: Consultant’s Estimate 42. Financing the NRMP. It is the aim of the NRMP to ensure that the financing of the investment program is optimal and will suitably complement the optimization efforts made on the cost side of the program. While details have yet to be worked out, the pattern of past allocations to the road sector can provide an indication for the structure of the financing plan. The implementation of the NRMP will require total financial resources of Rs 670 billion (US$ 6.1 billion), equivalent to an average annual funding requirement of Rs. 61 billion ($554 million) (Table 10). 43. The rise in the allocation by 31% from Rs. 44.9 billion in 2007 to Rs. 58.9 billion in 2008 would be significant, indeed. On the other hand, road sector allocations have increased steadily since 2002 by 36% per year (see Table 11). The expected increase in the first year of the NRMP would be a continuation of the past trend, albeit at a lower rate. The picture looks even less dramatic, when eliminating inflation from the historical data (see Figure 4). During the program period, allocations will stabilize at the Rs. 61 billion level. No increases in real terms are expected during the implementation of the NRMP.
NRMP COMPONENTS 2007 2008 2009 2010 2011 2012 2013 2014 2015 2016 2017 TOTAL
Construction of Expressways 13.9 23.0 29.3 25.3 30.3 24.6 18.0 18.0 20.0 22.0 13.8 238.3Widening of Highways 15.2 17.2 17.3 13.6 17.0 21.3 21.8 21.7 25.7 27.1 17.2 215.1Reduction of Traffic Congestion 0.4 0.8 0.9 2.2 3.9 3.8 4.4 5.0 2.1 1.1 0.4 25.1Road Maintenance 10.4 13.0 10.4 14.1 10.5 12.2 10.4 10.4 10.9 12.6 12.3 127.3Bridge Rehabilitation & Reconstruction 4.1 3.4 3.7 3.2 1.2 1.1 0.6 0.6 0.6 0.6 0.6 19.4Land Acquisition & Resettlement 1.3 1.5 2.8 7.6 5.9 4.9 6.0 6.4 4.3 2.6 1.5 44.7
45.3 58.9 64.4 66.0 68.9 68.0 61.2 62.0 63.5 65.9 45.8 669.9TOTAL
COMPONENTFX LOCAL TOTAL
Construction of Expressways 162.0 76.2 238.3Widening of Highways 142.0 73.1 215.1Reduction of Traffic Congestion 20.1 5.0 25.1Road Maintenance 70.0 57.3 127.3Bridge Rehabilitation & Reconstruction 11.6 7.8 19.4Land Acquisition & Resettlement 0 44.7 44.7
TOTAL COST 405.7 264.2 669.9
COST (Billion Rs)

National Road Master Plan (2007 – 2017)
22
Table 11: Development of Road Sector Allocations and Actual Expenditures (Billion Rupees)
Note: Actual expenditures for 2007 and 2008 are estimates. Total allocations for 2008 are based on
NRMP cost estimates. Source: RDA 2007. 44. The data above show that actual expenditures for roads have consistently been below the allocations to the sector. The average annual shortfall has been 25% of the allocations, with the utilization rates of maintenance allocations lower than the average and that for capital expenditures higher. These ratios may point to constraints in the institutional capacity to absorb the resources in a timely manner, which, in turn, may raise the issue as to what level of expenditure is achievable. 45. While a program of this magnitude presents a challenge to the implementation capacity, the development of expenditures vis-à-vis allocations also provides cause for confidence. Since 2003, road expenditures have matched the growth trend of allocations and the gap between expenditures and allocations has not widened. Thus, while institutional capacity may have been inadequate to fully absorb the allocation in a given year, it has responded positively to the challenges, albeit with a time lag. Institutional arrangements are in place to address this issue. These arrangements will be discussed in Section IV, A. 46. In the past, road sector expenditure was met from Government allocations, including those from the Central Government and, to a limited extent, from the revenues of Provincial and Local Authorities. However, the allocations were only partly financed from Government revenues. A substantial share of the allocations was backed by funds from international finance institutions (IFIs). On average over the last five years, IFIs have contributed about 50% to road sector allocations of the Government (Figure 5).
1999 2000 2001 2002 2003 2004 2005 2006 2007 2008ALLOCATIONSBudget 6.0 9.6 8.3 6.2 6.5 6.7 9.5 14.8 20.3 29.4Foreign 2.0 3.9 6.0 3.4 3.5 10.5 11.6 22.5 24.6 29.5TOTAL ALLOCATIONS 8.0 13.5 14.3 9.6 10.0 17.2 21.1 37.3 44.9 58.9
EXPENDITURES 5.6 9.4 10.5 8.1 9.1 12.3 14.9 24.3 34.2 45.0
ABSORPTION RATE 70.6% 69.8% 73.1% 84.0% 91.4% 71.4% 70.8% 65.0% 76.1% 76.4%
National Road Master Plan (2007 – 2017)
23
Figure 4: Development of Road Sector Allocations and Expenditures Nominal and Real
(1999 = 100) Note: Actual expenditures and GDP deflators for 2007 and 2008 are estimates.
Total allocations for 2008 are based on NRMP cost estimates. Source: RDA and Central Bank 2006/07.
Figure 5: Funding of Road Expenditures
Source: RDA 2007 47. There is limited scope and merit for the financing of the NRMP to depart from the pattern of road financing that has evolved over time. In addition to overarching macroeconomic and fiscal concerns that any government financing has to address, the main financing principles related to road infrastructure have been sound and required to (i) finance long-term investments by long-term loans and, respectively, recurrent maintenance needs from recurrent budgets; (ii) ensure that the cost of financing is competitive and predictable; (iii) achieve a high degree of cost recovery for the infrastructure by implementing a “user-pays” policy; and (iv) ensure a steady and predictable flow of funds for road maintenance. More recently, the Government has
0.0
10,000.0
20,000.0
30,000.0
40,000.0
50,000.0
60,000.0
70,000.0
1999
2000
2001
2002
2003
2004
2005
2006
2007
2008
Mill
ion
Rup
ees
Actual Allocations
Actual Expenditures
Real Allocations
Real Expenditures
0.05.0
10.015.020.025.030.035.040.045.050.0
1999 2000 2001 2002 2003 2004 2005 2006 2007
Bill
ion
Rup
ees Budget Allocation
Foreign Allocation
Total Allocation
Expenditures
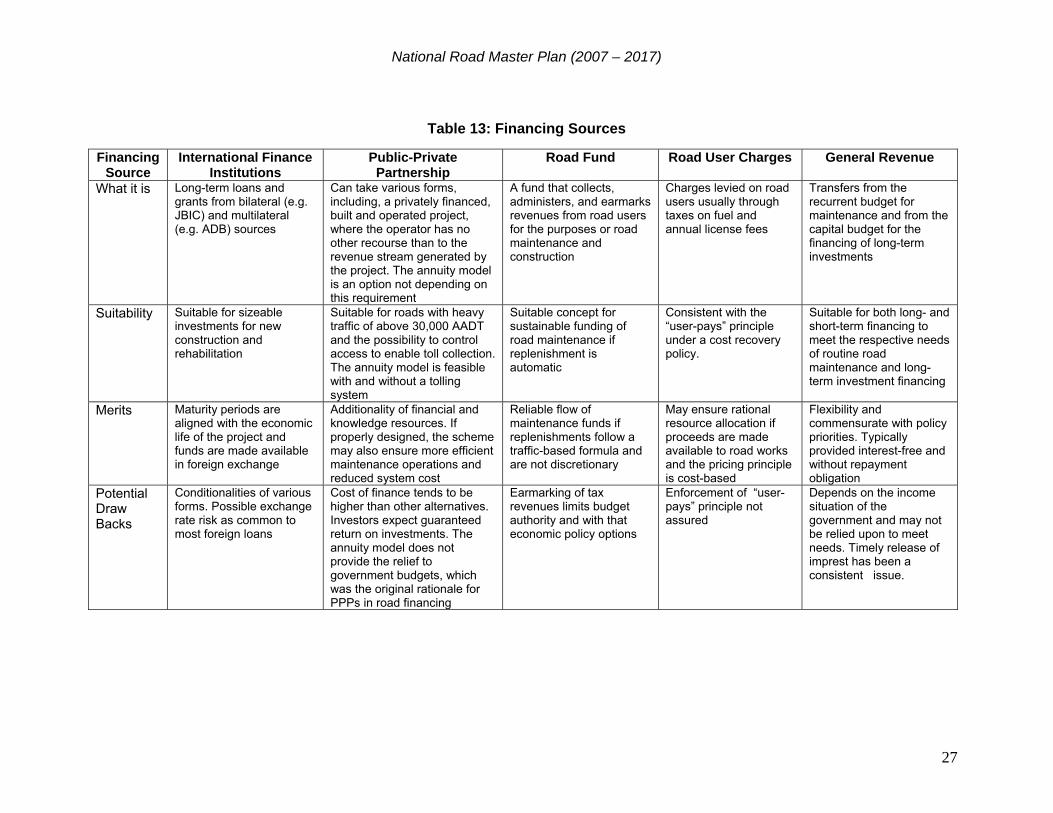
National Road Master Plan (2007 – 2017)
24
begun to engender the participation of the private sector in the financing of road projects. The rationale for this policy is to gain access to the skills of the private sector, particularly management skills, and to mobilize additional funds through the provision of commercially attractive investment opportunities. The aspect of additionality is a major policy principle in connection with pursuing private sector involvement in road financing. The effectiveness of road maintenance could be enhanced if work was outsourced to private firms under performance-based contracts. The Government is testing such arrangements under selected ADB projects. 48. The potential of the private sector for the financing of road development has attracted increasing attention during the last few years. Mahinda Chintana explicitly supports the promotion of Public-Private Partnerships (PPPs), which is the overarching term for the various forms of cooperation between the public and the private sectors (see the text box below for a brief description of PPPs). With the assistance from ADB, the Government is designing a model concession agreement for such partnership and is testing a PPP modality in a pilot project. Until the results are available and evaluated, the Government intends to take a cautious approach to PPP projects. The National Thoroughfares Act will provide the authority for concluding PPP concession contracts for expressways
POTENTIAL FOR PRIVATE SECTOR PARTICIPATION IN ROAD FINANCING Source: European Union 2003. Commission Guidelines for Successful Public-Private Partnerships.
Brussels. 49. Financing Strategy. Adherence to the financing principles stated above necessarily narrows the choice of financing sources, with the choice also being dependent on the use of funds. With each source having a distinct role to play, there is no substitutional or competitive relationship among the sources. Table 13 provides a synopsis of the financing sources and their respective functions, merits and disadvantages. The financing strategy for the NRMP rests on four pillars, including (i) long-term loans from IFIs, (ii) allocations from the capital budget for investments, (iii) the Road Maintenance Trust Fund (RMTF)3 initially for routine maintenance operations, and (iv) private sector financing for commercially attractive highway projects. 50. The RMTF was introduced early 2006 with a view to ensuring reliable funding for road maintenance and, eventually, also for construction. The current role of the RMTF is limited to the financing of routine and periodic road maintenance. The operation of the fund is dependent on earmarked tax proceeds from the sale of gasoline and 3 In October 2005, the Cabinet approved the establishment of RMTF under the provisions of the Trust
Ordinance. RMTF is administered and managed by a Board of Trustees comprising the Deputy Secretary to the Treasury and Chairman, Finance Commission. A Technical Advisory Committee, chaired by Secretary, Ministry of Highways, assists the Board.
A Public-Private Partnership (PPP) is a partnership between the public sector and the private sector for the purpose of delivering a project or a service traditionally provided by the public sector. PPPs recognize that both parties have certain advantages relative to the other in the performance of specific tasks. By allowing each sector to do what it does best, public services and infrastructure can be provided in the most economically efficient manner. The overall aim of PPPs is therefore to structure the relationship between the parties, so that risks are borne by those best able to control them and increased value is achieved through the exploitation of private sector skills and competencies.
National Road Master Plan (2007 – 2017)
25
diesel. Such allocations replace budgetary allocations previously given directly to the Ministry of Highways. The allocations to the fund are linked to the sale of gasoline and diesel at the rate of Rs. 1 per liter of gasoline and Rs. 0.5 per liter of diesel. This formula presently generates about Rs. 1.5 billion annually, which will be adequate to meet the routine maintenance requirements of the National Highways. In the longer run, the potential for expanding the use of the fund will be explored to include road construction. Towards this end, the fund may issue road bonds, once its assets have reached a critical mass to leverage fresh funding. To reach such a level, new forms of road pricing and operations will be required that rely on workable PPP concepts for investments and operations of highways.
51. The Government is pilot testing an innovative approach to PPPs that combines elements of project financing with performance based maintenance contracts. In contrast to non-recourse project financing, the model does not require a traffic and toll scenario to make the investment commercially viable (see text box below).
Annuity Model as a Variant of PPP
52. The NRMP will continue to depend on financial assistance from IFIs. Major advantages of this assistance include relatively long maturity periods of loans that align their amortization periods with the economic life of the projects. In addition, the support from IFIs is not limited to financing of infrastructure. In most cases, valuable assistance has been provided for a variety of complementary measures, including capacity building, sector surveys, and feasibility studies. The Government will seek a commitment of IFIs for the entire NRMP. This would imply a strategic shift from the traditional project centric approach to an approach that is focused on programs and strategies. To this end, ADB, having been a key supporter of Sri Lanka’s road development in the past, has adopted a new loan product, the multitranche financing facility (MFF). The MFF provides a framework for a series of financings, spread over period of up to 10 years, for a sequence of related project investments, which are managed through an integrated program such as the NRMP.
An Annuity Contract is a PPP, in which a private investor may participate in the financing, and may be the contractor for the construction and subsequent maintenance of the road infrastructure. The contribution to the financing may vary and would be converted to constant annuities spread over an agreed period. The annuities, which are the basis for the remuneration of the investor, would have to reflect the capital outlay, the cost of the capital, a profit margin, and the remuneration for the maintenance services performed during the contract period. The government would pay the annuities. The government may collect a toll, but having the responsibility for making the annuity payments, would have to make up for any potential shortfall. This approach may be attractive for a project, for which the private sector would not be willing to assume the traffic and toll risk. The annuity model is also possible for ordinary highways with no access control and tolling. The merits of the annuity model with and without tolling lie in the potential to secure financing, when the government may not be able to raise the financing and the subsequent benefits of providing connectivity in a timely manner. In combination with a maintenance contract, the added benefit would be proper regular maintenance and a departure from the pattern of deferring maintenance until such a time when costly rehabilitation and reconstruction become necessary.
National Road Master Plan (2007 – 2017)
26
53. A long-term financing commitment of donors will make estimates of future resource availability more reliable and would lead to a greater convergence between the functions of planning and financing of the investment program. Another step in this direction will be to implement the NRMP on the basis of a multi-year year rolling plan. The principal benefits of this approach come from integrating a ‘top down’ view on likely resource availability with a ‘bottom up’ estimate of the cost of meeting the output targets set for the NRMP. The approach will also help align implementation with the Government’s 3-year Medium Term Budgetary Framework. A flexible approach is further necessary to respond to the possibilities of changing priorities, implementation delays affecting the sequencing of investments, and changes in traffic and road conditions4.
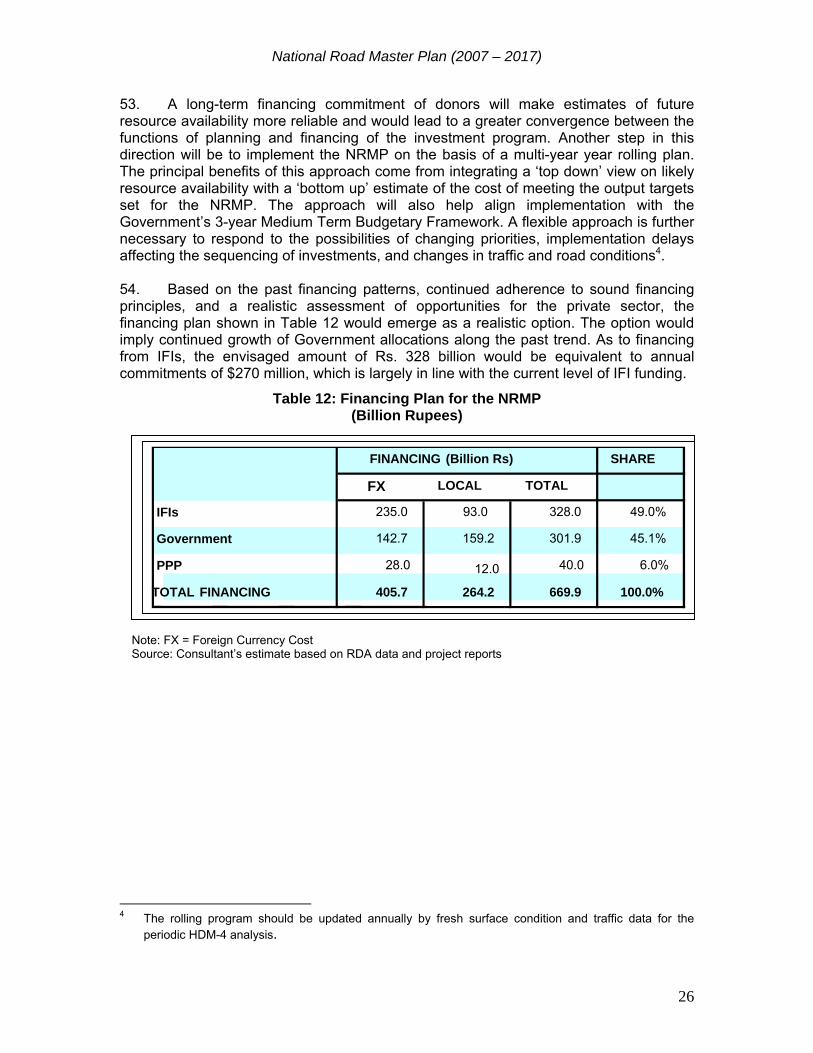
54. Based on the past financing patterns, continued adherence to sound financing principles, and a realistic assessment of opportunities for the private sector, the financing plan shown in Table 12 would emerge as a realistic option. The option would imply continued growth of Government allocations along the past trend. As to financing from IFIs, the envisaged amount of Rs. 328 billion would be equivalent to annual commitments of $270 million, which is largely in line with the current level of IFI funding.
Table 12: Financing Plan for the NRMP (Billion Rupees)
Note: FX = Foreign Currency Cost Source: Consultant’s estimate based on RDA data and project reports
4 The rolling program should be updated annually by fresh surface condition and traffic data for the
periodic HDM-4 analysis.
SHARE
FX LOCAL TOTAL
IFIs 235.0 93.0 328.0 49.0%
Government 142.7 159.2 301.9 45.1%
PPP 28.0 12.0 40.0 6.0%
TOTAL FINANCING 405.7 264.2 669.9 100.0%
FINANCING (Billion Rs)
National Road Master Plan (2007 – 2017)
27
Table 13: Financing Sources Financing
Source International Finance
Institutions Public-Private
Partnership Road Fund Road User Charges General Revenue
What it is Long-term loans and grants from bilateral (e.g. JBIC) and multilateral (e.g. ADB) sources
Can take various forms, including, a privately financed, built and operated project, where the operator has no other recourse than to the revenue stream generated by the project. The annuity model is an option not depending on this requirement
A fund that collects, administers, and earmarks revenues from road users for the purposes or road maintenance and construction
Charges levied on road users usually through taxes on fuel and annual license fees
Transfers from the recurrent budget for maintenance and from the capital budget for the financing of long-term investments
Suitability Suitable for sizeable investments for new construction and rehabilitation
Suitable for roads with heavy traffic of above 30,000 AADT and the possibility to control access to enable toll collection. The annuity model is feasible with and without a tolling system
Suitable concept for sustainable funding of road maintenance if replenishment is automatic
Consistent with the “user-pays” principle under a cost recovery policy.
Suitable for both long- and short-term financing to meet the respective needs of routine road maintenance and long-term investment financing
Merits Maturity periods are aligned with the economic life of the project and funds are made available in foreign exchange
Additionality of financial and knowledge resources. If properly designed, the scheme may also ensure more efficient maintenance operations and reduced system cost
Reliable flow of maintenance funds if replenishments follow a traffic-based formula and are not discretionary
May ensure rational resource allocation if proceeds are made available to road works and the pricing principle is cost-based
Flexibility and commensurate with policy priorities. Typically provided interest-free and without repayment obligation
Potential Draw Backs
Conditionalities of various forms. Possible exchange rate risk as common to most foreign loans
Cost of finance tends to be higher than other alternatives. Investors expect guaranteed return on investments. The annuity model does not provide the relief to government budgets, which was the original rationale for PPPs in road financing
Earmarking of tax revenues limits budget authority and with that economic policy options
Enforcement of “user-pays” principle not assured
Depends on the income situation of the government and may not be relied upon to meet needs. Timely release of imprest has been a consistent issue.
National Road Master Plan (2007 – 2017)
28
IV. IMPLEMENTATION OF THE NRMP 55. Successful implementation of the NRMP will rely on an effective support system that includes (i) adequate financial resources for the preparation of feasibility studies and design, (ii) institutional capacity to execute projects, (iii) a legal framework and government procedures, and (iv) availability of contractors and construction supplies at competitive rates. In general, economy and efficiency in implementation will be the overriding principle. This means that implementation will have to (i) meet time-bound targets, (ii) follow competitive procedures in the procurement of goods and services, and (iii) comply with recognized standards of contract management and administration. The Road Development Authority (RDA) has accumulated experience in all these areas A. Absorptive Capacity 56. RDA will be responsible for implementing the NRMP. RDA was created in the mid 1980s with the prospect of being more autonomous, more flexible and better equipped to attract and retain qualified staff than its predecessor, the erstwhile Department of Highways. RDA has lived up to this expectation and has benefited from various capacity building measures, including, more recently, an all-embracing re-engineering effort. RDA is now well equipped as an institution to take on the challenge of NRMP implementation (see text box below).
57. RDA has over the past five years steadily increased its output in real terms. As noted earlier, RDA’s expenditures have since 2003 consistently matched the growth trend of allocations, although expenditures have fallen short of financial allocations. Rather than being related to institutional bottlenecks, the reasons for the observed gap between allocations and expenditures resulted mainly from (i) delays in land acquisition, which is inevitably a critical path for all subsequent construction activities; and (ii) temporary liquidity constraints delaying the provision of imprest funds to RDA.
Reorganization of the Road Development Authority (2005-2006) RDA’s previous organizational structure had been an impediment to efficient management, supervision and decision-making. The principal drawback had been the organizational width below the level of the General Manager (GM). That level consisted of 22 positions, including 12 department heads and 10 project directors, all under the direct supervision of the GM. The new organization has reduced the span of control of the GM to a more manageable level and has improved the effectiveness of the GM. At the senior management level five Assistant General Managers were appointed to be responsible for (i) Planning and Programming, (ii) Asset Development, (iii) Asset Management (Operation and Maintenance), (iv) Finance and Administration, and (v) Project Management Units. The Project Management Units (PMU) were brought under the direct control of RDA’s line management, thus avoiding duplication and clarifying responsibilities. The PMUs are now grouped in accordance with the source of financing of their respective projects. A Central Support Division consists of 4 units (procurement, land acquisition and resettlement, R&D and training) and is providing services to all major divisions of RDA. There is now a separate Environmental and Social Division, highlighting the increased significance of this area. The new organizational structure was replicated at the provincial level. Overall, the new set-up will (i) improve the workflow among divisions, (ii) more clearly define responsibilities, (iii) improve capacity for strategic planning, (iv) provide better scope for delegation and speedy decision making, and (v) lead to increased institutional efficiency.

National Road Master Plan (2007 – 2017)
29
58. Financial indicators alone are not an accurate measure for RDA’s absorption capacity, and not all delays are necessarily reflected in financial data. The growth in output masks the fact that considerable delays have occurred. While it is difficult to isolate the causative factors, there is evidence that overly complicated project designs have contributed to the delays. The traditional project approach provides only limited flexibility to respond to emerging risks and unforeseen circumstances. The risks are aggravated by projects with a multitude of components spread over a wide geographical area with each location requiring land acquisition and the standard set of actions to comply with safeguard conditions.
59. Implementation of the NRMP would be more efficient, if donors see fit to depart from the rigid project approach and instead adopt the NRMP as a program that can be jointly financed. Rather than agreeing on a narrow project scope, donors could select time or area slices of the NRMP for their respective involvements. Within these slices, the selection of subprojects could be flexible. This approach would be consistent with the nature of a multi-year rolling program. 60. In terms of staff, RDA has substantial productivity reserves. India’s National Highway Authority manages its sizeable network with less than one third of RDA’s staff contingent.5 This explains partly, why RDA has managed to generate the past increases in output with largely unchanged administrative budgets.6 In addition, RDA has outsourced most of the project preparatory activities. The “Road Project Preparatory Facility” funded by ADB is aimed at increasing the preparedness of investment projects by accelerating project preparation at the preconstruction stage and has financed past ADB projects. It is proposed that this approach, which includes the outsourcing of feasibilities studies and design preparation, be continued under the NRMP. The respective cost estimates are shown in Table 14.
Table 14: Cost Estimates for NRMP Project Preparation
61. The estimates are based on costs incurred with project preparation in the past. In addition to the allowances for feasibility studies and design preparation, the estimates include the cost for sustaining the office that is in charge of the project preparatory facility (“incremental project cost”). 62. RDA has carefully considered the option of outsourcing the preparatory work. To avoid a potential disconnect between project preparation and the planning function of
5 NHA India has sanctioned staff strength of about 700 employees. This compares to about 2,700 regular
RDA employees. 6 The administrative budget rose by a nominal 11% from Rs. 1,117. 1 million in 2005 to 1,245.6 million in
2006. Source: RDA Annual Report 2006.
KM Total CostRs.Million
Expressways 594 239.6 Widening 4900 1,588.6 Rehabilitation 3300 514.3 Fly Overs 27.6 Bridges 22.0 Incremental Cost 242.0
Total 2,634.0 Source: Estimates based on completed ADB projects
National Road Master Plan (2007 – 2017)
30
RDA, RDA staff will be seconded to project implementation units from time to time. The option of filling such units exclusively with RDA employees would not be sustainable given the temporary nature of the work and the fact that the NRMP implementation will generate a peak demand that cannot be met by RDA. Outsourcing the preparatory work will therefore be the most effective option. B. Land Acquisition and Resettlement (LAR) 63. An estimated 4,000 hectares will have to be acquired at a cost of Rs. 45 billion over the next 10 years. Approximately 47,000 household and business premises will be affected by the proposed acquisition. Adequate time will be allowed for the process. While attempts have been made in the past to administratively shorten the process, the critical factor causing delays is the resettlement of the affected people. 64. Land acquisition has in the past caused significant delays to project implementation. This applies to both, the actual acquisition and the subsequent resettlement of the affected people. While the process of land acquisition has often taken an inordinately long time, the ambiguous guidelines on resettlement have led to disputes over a fair compensation causing additional delays. A third problem is related to a realistic assessment of the likely cost involved in land acquisition. Based on past experience not limited to Sri Lanka, estimates of land acquisition and resettlement cost are particularly susceptible to over- or underestimation. As the pre-feasibility cost estimates are typically based on preliminary, often only conceptual, designs that only roughly define the final alignment of a road and which do not include land and household surveys, the potential for unrealistic estimates is substantial. Obviously, this affects projects involving new construction and road widening more than rehabilitation of roads that follow existing alignments. Given the mix of such projects in the NRMP, the sequencing of projects will give due consideration to the difference in lead times so that adequate time can be allowed for proper estimation of the LAR costs.
Current LAR Procedures
65. Several legal amendments are under consideration, which will improve the situation. Among them is the Draft National Thoroughfares Act, which has already been approved by the Ministry of Justice and is awaiting consideration by Parliament. As regards land acquisition, the proposed Act empowers RDA to prepare a survey plan depicting the land area required for certain road works, based on which the Minister will declare the land area a road reservation. Determining the alignment under the
The process of land acquisition takes on average more than a year. While attempts have been made in the past to shorten the process, the critical issue is the resettlement of the affected people. There are several sections of the Land Acquisition Act, which take time to comply with: The Notice under Section 4 calls for written objections (6 weeks); the Inquiry under Section 4 into various objections (9 weeks), the Survey under Section 6 (6 weeks), the Notice under Section 7 for compensation (6 weeks), Valuation (8 weeks), Notice under Section 38 A if the land is not taken over earlier (6 weeks). In 2001, the Cabinet approved a shorter procedure for land acquisition. While there was a significant reduction to around 36 weeks for the entire process, there were important issues on the resettlement side. Another shortcoming relates to the preparation of the Resettlement Action Plan (RAP), which sometimes has been carried out prior to proper ground demarcation. Ground demarcation should always precede the RAP, if the latter is to be credible.
National Road Master Plan (2007 – 2017)
31
engineering phase of a road project and undertaking a survey plan for land acquisition are two separate activities, the former being driven by engineering and the latter by legal considerations. That these activities are divorced may cost valuable time. It will benefit the efficiency of the entire process, if both activities are synchronized, if not carried out jointly. 66. The proposed National Thoroughfares Act will prevent ribbon developments along roads, as no building will be allowed to commence on land adjacent to a road. The amendment of the RDA Act is also under consideration to make it consistent with the proposed National Thoroughfares Act. Similarly, the Ministry of Lands is amending the Land Acquisition Act to better reflect the National Involuntary Resettlement Policy. 67. In addition to improvements to processes and regulations, RDA is proposing that a phased approach to project implementation be adopted. The merits of the approach lie in the fact that the impact of land acquisition as a critical path for implementation would be neutralized at least temporarily. Details of the approach, which will be tested in upcoming projects, are explained in the text box below.
By-passing the Bottleneck of Land Acquisition
C. Contracting Industry 68. Private sector contractors, including international and domestic contractors, will carry out the civil works under the NRMP. To ensure availability of contractors at competitive prices, the procurement procedures will follow accepted international practices. This implies that (i) the funds provided for project implementation shall be used only for the intended purpose, (ii) economy and efficiency in implementation shall be observed, (iii) all eligible bidders shall be given an opportunity to compete, (iv) the development of the domestic contracting shall be encouraged, and (v) there shall be transparency in all stages of the procurement process. 69. The recruitment of contractors under the NRMP will strike a balance between the goals of efficient NRMP implementation and the promotion of the domestic contracting industry. The promotional efforts should not, however, compromise the above general principles. While pursuing the development of the local contracting industry and while
The implementation process for a project will be sliced into two stages. Under Stage I, feasibility studies will be undertaken that will evaluate different construction options, including (a) road rehabilitation within the available right-of-way precluding land acquisition; and (b) design standards fully consistent with current and projected traffic volumes and resulting in the need for land acquisition. Engineering and preparation of detailed designs will be carried out based on alternative (b) and the land acquisition process will be started using available local funds. The use of foreign funds will be focused on road rehabilitation that follows existing alignments and right-of-ways thus avoiding conflict with land acquisition procedures. Typically, the width of the carriageway to be rehabilitated would vary from 6.8 meter to 7.4 meter. Under the rehabilitation work, the sub base of the road will be constructed to the full depth requirement. In contrast, the base and wearing course will be applied in two stages.
During the first stage, only one layer of asphalt will be applied with the balance to be applied during Stage II. Stage II starts with the completion of land acquisition procedures. After completing all related requirements, bidding documents will be prepared for the work that is still required to improve the roads to the higher standards enabling them to cope with the current and expected traffic demand. Such additional work will be under taken within 5 years from the beginning of Stage I.
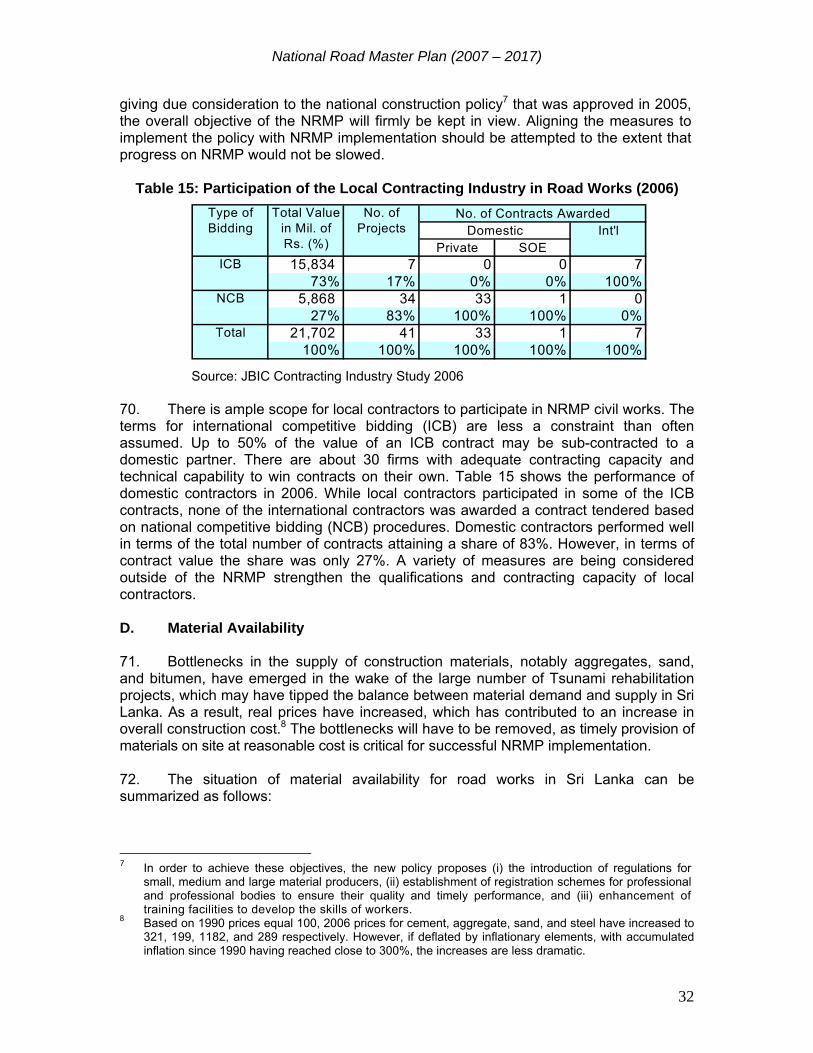
National Road Master Plan (2007 – 2017)
32
giving due consideration to the national construction policy7 that was approved in 2005, the overall objective of the NRMP will firmly be kept in view. Aligning the measures to implement the policy with NRMP implementation should be attempted to the extent that progress on NRMP would not be slowed.
Table 15: Participation of the Local Contracting Industry in Road Works (2006)
Source: JBIC Contracting Industry Study 2006
70. There is ample scope for local contractors to participate in NRMP civil works. The terms for international competitive bidding (ICB) are less a constraint than often assumed. Up to 50% of the value of an ICB contract may be sub-contracted to a domestic partner. There are about 30 firms with adequate contracting capacity and technical capability to win contracts on their own. Table 15 shows the performance of domestic contractors in 2006. While local contractors participated in some of the ICB contracts, none of the international contractors was awarded a contract tendered based on national competitive bidding (NCB) procedures. Domestic contractors performed well in terms of the total number of contracts attaining a share of 83%. However, in terms of contract value the share was only 27%. A variety of measures are being considered outside of the NRMP strengthen the qualifications and contracting capacity of local contractors. D. Material Availability 71. Bottlenecks in the supply of construction materials, notably aggregates, sand, and bitumen, have emerged in the wake of the large number of Tsunami rehabilitation projects, which may have tipped the balance between material demand and supply in Sri Lanka. As a result, real prices have increased, which has contributed to an increase in overall construction cost.8 The bottlenecks will have to be removed, as timely provision of materials on site at reasonable cost is critical for successful NRMP implementation. 72. The situation of material availability for road works in Sri Lanka can be summarized as follows:
7 In order to achieve these objectives, the new policy proposes (i) the introduction of regulations for
small, medium and large material producers, (ii) establishment of registration schemes for professional and professional bodies to ensure their quality and timely performance, and (iii) enhancement of training facilities to develop the skills of workers.
8 Based on 1990 prices equal 100, 2006 prices for cement, aggregate, sand, and steel have increased to 321, 199, 1182, and 289 respectively. However, if deflated by inflationary elements, with accumulated inflation since 1990 having reached close to 300%, the increases are less dramatic.
Int'lPrivate SOE
15,834 7 0 0 773% 17% 0% 0% 100%
5,868 34 33 1 027% 83% 100% 100% 0%
21,702 41 33 1 7100% 100% 100% 100% 100%
Type of Bidding
Total Value in Mil. of Rs. (%)
No. of Projects
No. of Contracts AwardedDomestic
ICB
NCB
Total
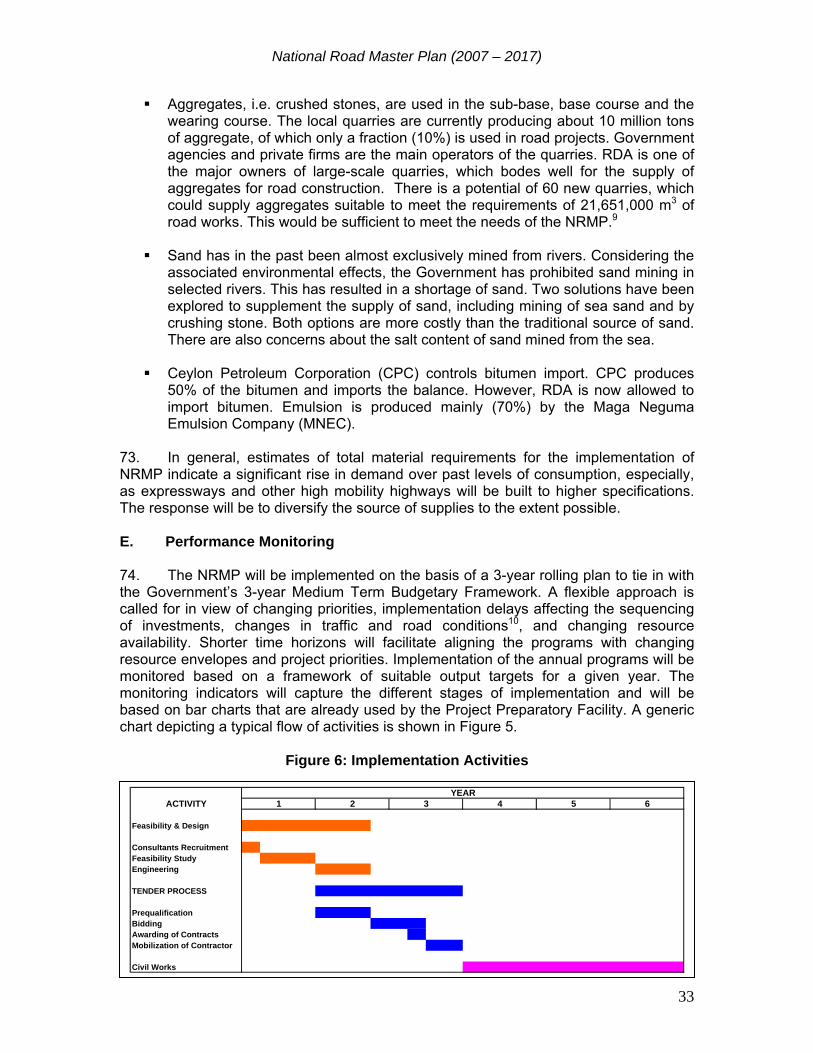
National Road Master Plan (2007 – 2017)
33
Aggregates, i.e. crushed stones, are used in the sub-base, base course and the wearing course. The local quarries are currently producing about 10 million tons of aggregate, of which only a fraction (10%) is used in road projects. Government agencies and private firms are the main operators of the quarries. RDA is one of the major owners of large-scale quarries, which bodes well for the supply of aggregates for road construction. There is a potential of 60 new quarries, which could supply aggregates suitable to meet the requirements of 21,651,000 m3 of road works. This would be sufficient to meet the needs of the NRMP.9
Sand has in the past been almost exclusively mined from rivers. Considering the
associated environmental effects, the Government has prohibited sand mining in selected rivers. This has resulted in a shortage of sand. Two solutions have been explored to supplement the supply of sand, including mining of sea sand and by crushing stone. Both options are more costly than the traditional source of sand. There are also concerns about the salt content of sand mined from the sea.
Ceylon Petroleum Corporation (CPC) controls bitumen import. CPC produces
50% of the bitumen and imports the balance. However, RDA is now allowed to import bitumen. Emulsion is produced mainly (70%) by the Maga Neguma Emulsion Company (MNEC).
73. In general, estimates of total material requirements for the implementation of NRMP indicate a significant rise in demand over past levels of consumption, especially, as expressways and other high mobility highways will be built to higher specifications. The response will be to diversify the source of supplies to the extent possible. E. Performance Monitoring 74. The NRMP will be implemented on the basis of a 3-year rolling plan to tie in with the Government’s 3-year Medium Term Budgetary Framework. A flexible approach is called for in view of changing priorities, implementation delays affecting the sequencing of investments, changes in traffic and road conditions10, and changing resource availability. Shorter time horizons will facilitate aligning the programs with changing resource envelopes and project priorities. Implementation of the annual programs will be monitored based on a framework of suitable output targets for a given year. The monitoring indicators will capture the different stages of implementation and will be based on bar charts that are already used by the Project Preparatory Facility. A generic chart depicting a typical flow of activities is shown in Figure 5.
Figure 6: Implementation Activities
9 Based on an average need of 0.6 meter of aggregate inputs into the sub-base, base course, and
wearing course, and an average carriageway width of 10 meters across all NRMP components, the supply would cover about 5,000 km of road works.
10 The rolling program should be updated annually by fresh condition and traffic data for the periodic HDM-4 analysis.
Feasibility & Design
Consultants RecruitmentFeasibility StudyEngineering
TENDER PROCESS
PrequalificationBiddingAwarding of ContractsMobilization of Contractor
Civil Works
ACTIVITY 5 6YEAR
1 2 3 4
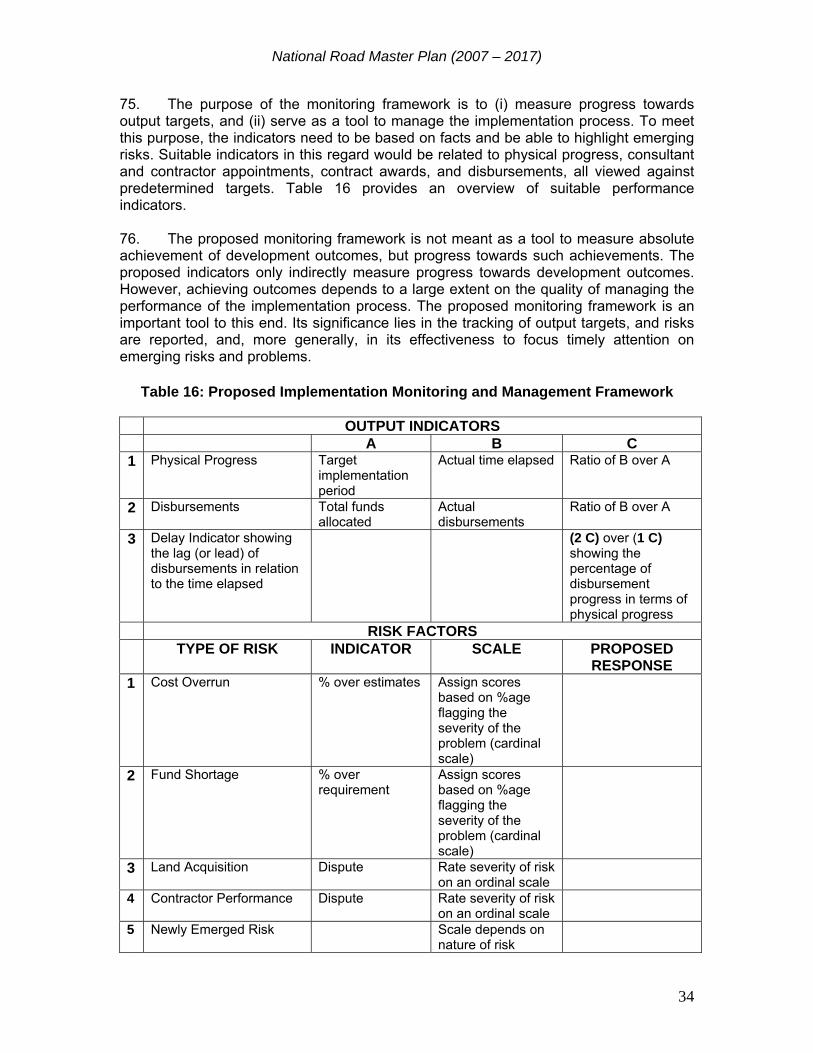
National Road Master Plan (2007 – 2017)
34
75. The purpose of the monitoring framework is to (i) measure progress towards output targets, and (ii) serve as a tool to manage the implementation process. To meet this purpose, the indicators need to be based on facts and be able to highlight emerging risks. Suitable indicators in this regard would be related to physical progress, consultant and contractor appointments, contract awards, and disbursements, all viewed against predetermined targets. Table 16 provides an overview of suitable performance indicators. 76. The proposed monitoring framework is not meant as a tool to measure absolute achievement of development outcomes, but progress towards such achievements. The proposed indicators only indirectly measure progress towards development outcomes. However, achieving outcomes depends to a large extent on the quality of managing the performance of the implementation process. The proposed monitoring framework is an important tool to this end. Its significance lies in the tracking of output targets, and risks are reported, and, more generally, in its effectiveness to focus timely attention on emerging risks and problems.
Table 16: Proposed Implementation Monitoring and Management Framework OUTPUT INDICATORS A B C 1 Physical Progress Target
implementation period
Actual time elapsed Ratio of B over A
2 Disbursements Total funds allocated
Actual disbursements
Ratio of B over A
3 Delay Indicator showing the lag (or lead) of disbursements in relation to the time elapsed
(2 C) over (1 C) showing the percentage of disbursement progress in terms of physical progress
RISK FACTORS TYPE OF RISK INDICATOR SCALE PROPOSED
RESPONSE 1 Cost Overrun % over estimates Assign scores
based on %age flagging the severity of the problem (cardinal scale)
2 Fund Shortage % over requirement
Assign scores based on %age flagging the severity of the problem (cardinal scale)
3 Land Acquisition Dispute Rate severity of risk on an ordinal scale
4 Contractor Performance Dispute Rate severity of risk on an ordinal scale
5 Newly Emerged Risk Scale depends on nature of risk
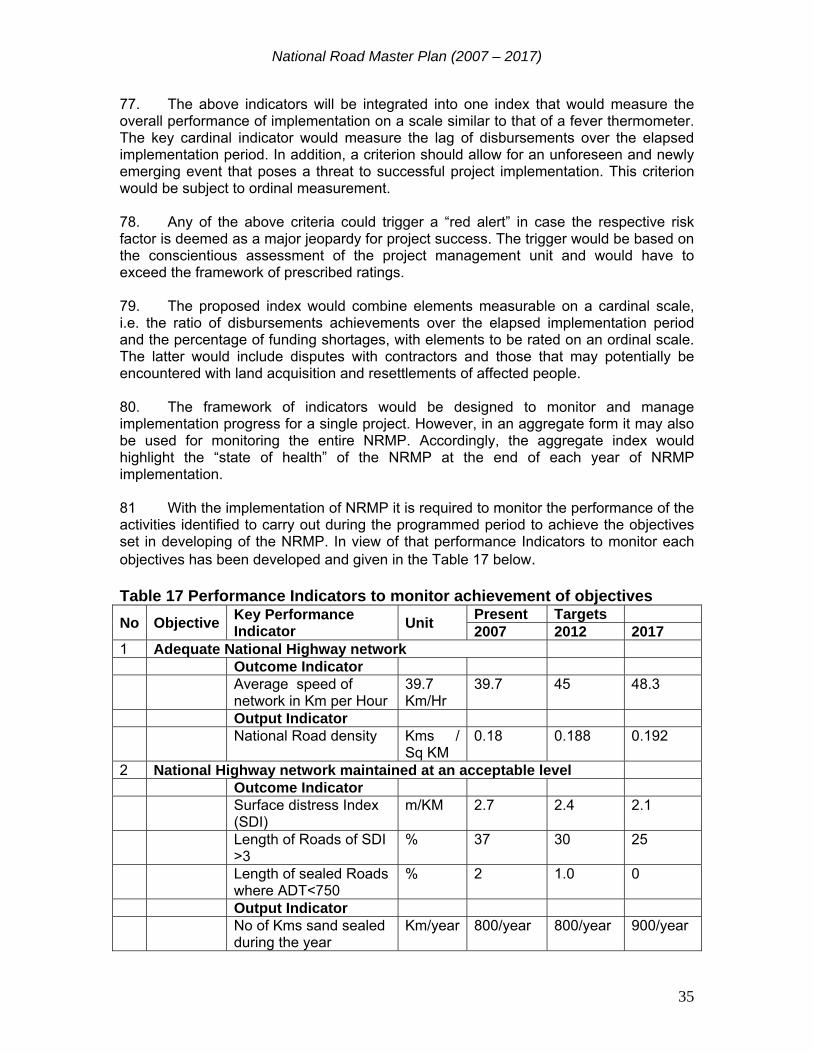
National Road Master Plan (2007 – 2017)
35
77. The above indicators will be integrated into one index that would measure the overall performance of implementation on a scale similar to that of a fever thermometer. The key cardinal indicator would measure the lag of disbursements over the elapsed implementation period. In addition, a criterion should allow for an unforeseen and newly emerging event that poses a threat to successful project implementation. This criterion would be subject to ordinal measurement. 78. Any of the above criteria could trigger a “red alert” in case the respective risk factor is deemed as a major jeopardy for project success. The trigger would be based on the conscientious assessment of the project management unit and would have to exceed the framework of prescribed ratings. 79. The proposed index would combine elements measurable on a cardinal scale, i.e. the ratio of disbursements achievements over the elapsed implementation period and the percentage of funding shortages, with elements to be rated on an ordinal scale. The latter would include disputes with contractors and those that may potentially be encountered with land acquisition and resettlements of affected people.
80. The framework of indicators would be designed to monitor and manage implementation progress for a single project. However, in an aggregate form it may also be used for monitoring the entire NRMP. Accordingly, the aggregate index would highlight the “state of health” of the NRMP at the end of each year of NRMP implementation. 81 With the implementation of NRMP it is required to monitor the performance of the activities identified to carry out during the programmed period to achieve the objectives set in developing of the NRMP. In view of that performance Indicators to monitor each objectives has been developed and given in the Table 17 below. Table 17 Performance Indicators to monitor achievement of objectives No Objective Key Performance
Indicator Unit Present Targets 2007 2012 2017
1 Adequate National Highway network Outcome Indicator Average speed of
network in Km per Hour 39.7 Km/Hr
39.7 45 48.3
Output Indicator National Road density Kms /
Sq KM 0.18 0.188 0.192
2 National Highway network maintained at an acceptable level Outcome Indicator Surface distress Index
(SDI) m/KM 2.7 2.4 2.1
Length of Roads of SDI >3
% 37 30 25
Length of sealed Roads where ADT<750
% 2 1.0 0
Output Indicator No of Kms sand sealed
during the year Km/year 800/year 800/year 900/year
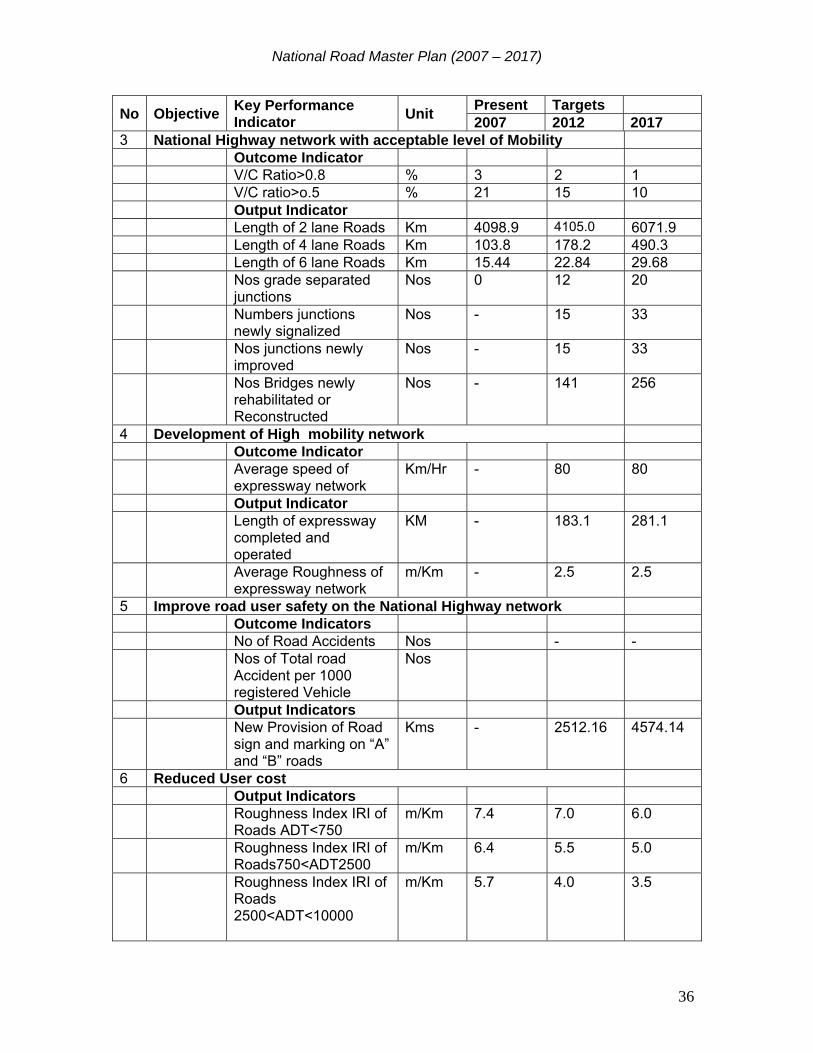
National Road Master Plan (2007 – 2017)
36
No Objective Key Performance Indicator Unit Present Targets
2007 2012 2017 3 National Highway network with acceptable level of Mobility Outcome Indicator V/C Ratio>0.8 % 3 2 1 V/C ratio>o.5 % 21 15 10 Output Indicator Length of 2 lane Roads Km 4098.9 4105.0 6071.9 Length of 4 lane Roads Km 103.8 178.2 490.3 Length of 6 lane Roads Km 15.44 22.84 29.68 Nos grade separated
junctions Nos 0 12 20
Numbers junctions newly signalized
Nos - 15 33
Nos junctions newly improved
Nos - 15 33
Nos Bridges newly rehabilitated or Reconstructed
Nos - 141 256
4 Development of High mobility network Outcome Indicator Average speed of
expressway network Km/Hr - 80 80
Output Indicator Length of expressway
completed and operated
KM - 183.1 281.1
Average Roughness of expressway network
m/Km - 2.5 2.5
5 Improve road user safety on the National Highway network Outcome Indicators No of Road Accidents Nos - - Nos of Total road
Accident per 1000 registered Vehicle
Nos
Output Indicators New Provision of Road
sign and marking on “A” and “B” roads
Kms - 2512.16 4574.14
6 Reduced User cost Output Indicators Roughness Index IRI of
Roads ADT<750 m/Km 7.4 7.0 6.0
Roughness Index IRI of Roads750<ADT2500
m/Km 6.4 5.5 5.0
Roughness Index IRI of Roads 2500<ADT<10000
m/Km 5.7 4.0 3.5
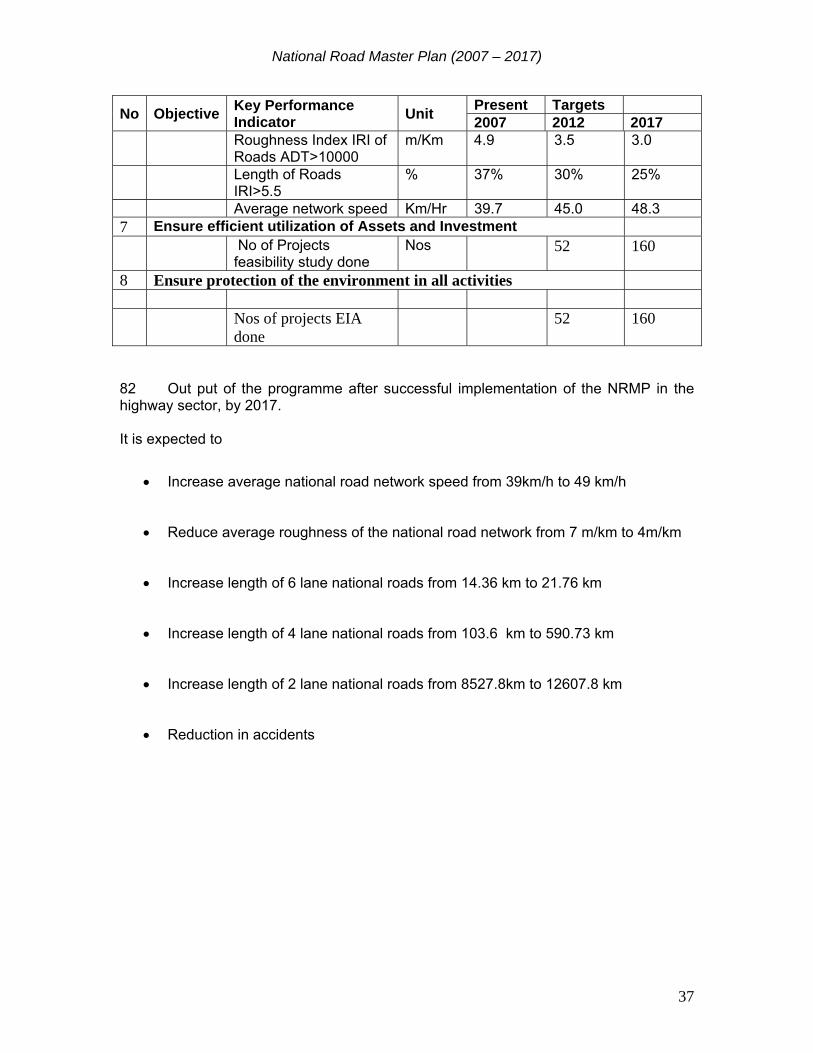
National Road Master Plan (2007 – 2017)
37
No Objective Key Performance Indicator Unit Present Targets
2007 2012 2017 Roughness Index IRI of
Roads ADT>10000 m/Km 4.9 3.5 3.0
Length of Roads IRI>5.5
% 37% 30% 25%
Average network speed Km/Hr 39.7 45.0 48.3 7 Ensure efficient utilization of Assets and Investment No of Projects
feasibility study done Nos 52 160
8 Ensure protection of the environment in all activities Nos of projects EIA
done 52 160
82 Out put of the programme after successful implementation of the NRMP in the highway sector, by 2017. It is expected to
• Increase average national road network speed from 39km/h to 49 km/h
• Reduce average roughness of the national road network from 7 m/km to 4m/km
• Increase length of 6 lane national roads from 14.36 km to 21.76 km
• Increase length of 4 lane national roads from 103.6 km to 590.73 km
• Increase length of 2 lane national roads from 8527.8km to 12607.8 km
• Reduction in accidents