national sample of agriculture 1992/93 volume ii
TRANSCRIPT

MALAWI GOVERNMENT
National Sample of Agriculture
1992/93
Volume II
Smallholder Garden Survey Report

PREFACE
This report contains the results of the Garden Survey which is one of
the modules of the National Sample Surveys of Agriculture (NSSA).
The NSSA was carried out in 1992/93 agricultural season from
October 1992 to September 1993. The data was collected from a
sample of rural smallholder households.
The survey was conducted on a collaborative basis between the
Ministry of Agriculture (MOA) and the National Statistical Office
(NSO). MOA provided 282 of the 700 enumerators and supervisors
from its existing permanent statistical staff in the Agriculture
Development Divisions (ADDs) while the rest were recruited by NSO
on temporary basis.
This report is one in series of five volumes in publishing the NSSA
survey results. The data presented in this report include information
on cropping pattern, production and yield of various crops and crop
husbandry practices. The first volume covers information on
smallholder farm population and units of labour, household
characteristics, hired farm labour and household off-farm economic
activities. The third volume covers information on livestock. The
fourth volume will cover information on health, employment status of
households head, migration and household assets. The fifth volume
will cover information on extension advice.
Acknowledgements are due to the Food and Agriculture organization
(FAO) of the United Nations and the Social Dimensions of Adjustment
(SDA) project of the Word Bank for their technical, material and
financial support. Acknowledgements are also due to the general
public for their co-operation and support during the preparation and
field activities of the survey.
L. F. Golosi
COMMISSIONER FOR CENSUS AND STATISTICS

TABLE OF CONTENTS
Page
Preface ( i )
List of Text Tables v
Introduction 1
Purpose of the NSSA 1
Survey Preparation 2
Recruitment an Training of Field Staff 2
Field Organization 3
Sample Design 3
Data Collection 4
Data Processing 4
Terms and Definitions 5
Summary of Results 6
List of Statistical Tables at National Level 27
List of Statistical Tables for Karonga A.D.D 91
List of Statistical Tables for Mzuzu A.D.D 125
List of Statistical Tables for Kasungu A.D.D 161
List of Statistical Tables for Salima A.D.D 199
List of Statistical Tables for Lilongwe A.D.D 235
List of Statistical Tables for Machinga A.D.D 281
List of Statistical Tables for Blantyre A.D.D 327
List of Statistical Tables for Shire Valley A.D.D 367
Appendices 399
iii

LIST OF TEXT TABLES
Table Table Title Page
A. Estimated Number and percentage of Gardens
by holding Size Category 6
B. Percentage of Cultivated Area By Source Permission
to use land 8
C. Number and Percentage of Plots by Maize Variety 9
D. Percentage of Maize Plots to which Fertilizer was
Applied Rice by Sex of Household Head and ADD 11
E. Total Estimated Cultivated Area by ADD and Sex
of Household Head 13
F. Total Estimated Cultivated Area by ADD and Sex
of Household Head 18
G. Total and Percentage of Cultivated Area of Major
Crops by ADD and Sex of Household Head 20
H. Total Estimated production of Maize by Sex of
Household Head and ADD 22
v

1. INTRODUCTION
Once every ten years, a National Sample Survey of Agriculture (NSSA) is
conducted to update bench mark data on the organization and structure of
smallholder agriculture sector of the country. Such information helps the
government to formulate plans to improve the productivity of the
smallholder sector.
The first NSSA was carried out in 1968/69 agriculture season. The second
one was carried out in the 1980/81 agriculture season the third one, which
is the subject of this report, was carried out in the 1992/93 agriculture
season from October 1992 to September 1993.
The 1992/93 NSSA collected data related to:-
(a) Household Composition
(b) Garden Details
(c) Health
(d) Employment Status of Household,
Migration and household Assets
(e) Extension
(f) Livestock
This report is one in series of five reports in publishing the results of the
1992/93 NSSA. This is the second report and it covers information on
cropping pattern, yield and production of various crops. The first report
covers the results of data collected under the Household Composition
Survey. The third report information on health, employment status of
household head, migration and household assets, whilst the fifth report
covers information on extension advice.
2. PURPOSE OF THE NSSA
The NSSA was intended to provide basic data requirements for:-
(a) estimation of national aggregates of crop production for use
in the compilation of national accounts.
(b) Monitoring the effect of agricultural extension programmes as
well as evaluation of the National Rural Development
Programmes ( NRDP ) at Rural Development Project (RDP),
Agriculture Development Division (ADD) and national levels
and
(c) establishment of priorities and formulation of social-economic
in the smallholder sector of the rural economy.
1

3. SURVEY PEPARATION
In preparation for the 1992/93 NSSA, several discussions were held
between the NSO and other Government Ministries/Departments on
the possibility of conducting this nationwide survey. The discussions
mainly centered on the modalities of the survey and funding.
Government Ministries/Departments and other organizations were
asked to submit their data needs to the NSO for inclusion in the
NSSA. These data needs to the NSO for by a brief explanation on
why that information was required and how it was going to be used.
The NSO scrutinized the various data requirements and assessed
whether the data was no already available and if not available
whether it was feasible to collect such data. Questionnaires were
then designed in line with the type of data to be collected and
meetings were held with the organizations concerned to discuss the
questionnaires.
After the questionnaires had been finalized, the NSO carried out a
pilot Survey in the smallholder agriculture sector of Machinga ADD
during the 1990/91 agriculture season from October 1990 to
September 1991.
The main objective of the Pilot Survey was to test the adequacy of
the questionnaires, the sampling techniques and to determine the
magnitude of various biases and errors which were likely to occur
under the field conditions in the main survey.
Before the main survey was launched, the NSO publicized the survey
through the District Commissioners in all the districts in the country.
A press release was also made available to the media to inform the
general public about the NSSA. These efforts were done in order to
get full cooperation of the people involved in the surveys so that it
could be conducted successfully.
4. RECRUITMENT AND TRAINING OF FIELD STAFF
The Ministry of Agriculture (MOA) provided 282 field personnel and
the balance, 418 field staff, was recruited by the NSO through Labour
Offices on a district basis. This was to ensure that the transportation
costs to their places of work were to a minimum.
Training for supervisors was carried out from the 16th to 28th August
1992 and was conducted simultaneously at a center in each of the
three regions. The enumerator’s training was simultaneously
conducted in 11 centres from the 6th to the 18th of September 1992.
2

5. FIELD ORGANISATION
There were 100 supervisors and 600 enumerators all residing in the
field in houses which the Government rented for them. The
enumerators resided in the respective selected Enumeration Areas
(Eas) so that they should be able to visit the sample households
frequently using push bicycles which were issued to them. The
supervisors were centrally located and each was responsible for six
enumerators on the average. The number of enumerators allocated to
a supervisor depended on the spread of Eas. In very isolated areas
fewer enumerators were allocated to a supervisor.
The NSO established Regional Offices in the 1980s, one in the
Southern, Central and Northern Region of the country. These
regional centres headed by a Regional officer, were responsible for
the coordination of the field work within the region.
6. SAMPLE DESIGN
The country is divided into eight ADDs which are in turn divided into
30 Rural Development Projects (RDPs). For sample selection
purposes, the country was divided into 107 strata. These strata were
based on features like soil type, cropping pattern and rainfall. The
stratum boundaries never crossed RDP and EA boundaries. This
ensured that all the strata contained a complete set of EAs while
RDPs contained a complete set of strata and each ADD contained
complete sets of RDPs.
The sampling methodology used was a two-stage stratified sample
design. The Primary Sampling Units (PSUs) were the Eas while the
Secondary Sampling Units (SSUs) were Households. The Eas were
selected with Probability Proportional to size (Pps) of the EA. The
measure of size being the total population of the EA as found in the
1987 Population and Housing Census, A simple random procedure
was employed in the selection of the sample households within the
selected EA.
There were a total of 8395 EAs nation-wide. Out of this total, 990
EAs covered forest reserves, cities and other establishments which
did not belong to the smallholder sector of the country.
The sample consider of 600 EAs. This sample was found to be
statistically adequate to give reliable results at the RDP level. The
number of EAs to be selected per stratum was determined by the
square-root of the size of stratum where the stratum size was given
by the sum of the population of all the Eas within the stratum.
3

Enumerators were sent to the selected EAs where they listed all the
households within the selected EA. This list, after removing those
households that did not have a garden or livestock, comprised the
frame for the selection of sample households. The procedure for the
selection of the households was invested under the responsibility of
supervisors. There were all together 12,000 households selected
with 20 households within each of the 600 sample EAs.
7. DATA COLLECTION
The garden Survey was conducted from December, 1992 to July,
1993. This involved measuring all the gardens of selected household,
laying yield sub-plots (YSPs), harvesting and weighing crops in the
YSPs. This exercise was carried out by using prismatic compasses,
measurement tapes, ranging rods, surveyors’ arrows, YSP cords and
Salter Scales. It should be pointed out that YSPs were laid in maize,
rice, groundnuts, wheat, millet, sorghum, pulse and sunflower
gardens/plots only.
After the gardens had been measured the supervisors checked the
forms for consistency and also calculated hectarage and closing error
right in the field before they could be sent to the office for coding
and editing. All gardens, whose closing error was 5 percent or more,
were rejected and sent back to the enumerators concerned for re-
measurement. Calculation of hectarage and closing error was done
by using programmable calculators called Fx-4000p.
8. MEASUREMENT OF YIELD
(i) For maize, rice wheat, soghum, millet, pulses and sunflower, the
crop in the YSPs was harvested, shelled or threshed and weighed
after drying it for at least 5 days.
(ii) For groundnuts the crop in the YSP was harvested in the same
way as was done with the other crops. The crop was weighed
after drying it for at least 5 days. Sub-sample of 2 kilograms or
more was shelled and used to estimate the yield of shelled nuts.
This was done by using the following formula.
Yield=Weight of unshelled nuts in the YSP*weight of sample kernels
Total weight of unshelled sub-sample
9. DATA PROCESSING
Coding and manual editing of Garden Survey questionnaires started
immediately after the Household Composition Survey questionnaires
had been completed. Data entry for this survey started two weeks
after manual editing had started and lasted for about three months.
4

There was one complete questionnaire for each garden and since a garden
may have one or more plots, each record entered represented information
for a single plot. The data entry program was designed in such away that
the identification and details pertaining to the garden to which that
particular plot belong automatically repeated for each plot within the
garden. The data set consisted of about 2,700 plots.
10. TERMS AND DEFINITIONS
(a) Household: this may be made of one person or a group of people,
related or unrelated who make common provision of food. The
members of a household may or may not sleep in the same house.
(b) Household Head: This is the person who makes day to day decision
in the household.
(c) Farming Household: This is a household which has at least one of its
members operating a garden or has livestock.
(d) Holding: This is a unit of agriculture production comprising all land
that was cultivated by a household during the 1992/93 agriculture
season from October, 1992 to September 1993.It may consist of one
or more parcels of land. This excludes all land belonging to the
household which was not cultivated in the said period.
(e) Enumeration Areas: These are areas drawn up for the 1987
Population And Housing Census whereby each area was to be
covered by one enumerator for a period of not more than three
weeks.
(f) Garden: This may be a small or large piece of land. It must be
continuous, that is, if a path, road or river of more than three meters
wide passes through it then this divides it into two gardens. One
garden may have several different crops growing in it.
(g) Plot: This is a part of a garden which contains a different crop or
crop mixture or is kept by a different operator in the same
household. It must be a continuous piece of land and should not be
split by a path of more than one meter in width.
(h) Yield Sub-Plot: This is a 50 square meter plot which is randomly laid
in some gardens with a view to estimating yield for that particular
crop.
(i) Closing Error: This is the gap between the start and end of a
garden/plot sides which resulted from errors in measuring angles and
lengths.
5

11. SUMMARY OF RESULTS*
(a) Garden and plot details
Table A below which is extracted from Table G1.0 (National) presents data
on number and percentage of gardens by holding size category and ADD.
The data show that at national level the estimated total number of gardens
cultivated by smallholder farmers in the 1992/93 agricultural season was
about 2.7 million, of which 68 percent were less than 1 hectare in size; 24
percent were between 1.00 and 1.99 hectares and 8 percent were 2
hectares or more in size.
Table A: Estimated Number and Percentage of Gardens by Holding Size
Category
ADD Total Est. Garden
Total (Percent)
Holding Size Category (HA)
<1.00 1.00 - 1.99
2.00 & Over
All Malawi 2738607 100 67.6 24.3 8.1 Karonga ADD 132493 100 73.5 23.7 2.8 Mzuzu ADD 238820 100 51.0 32.2 16.8 Kasungu ADD 305598 100 33.7 43.6 22.7 Salima ADD 153812 100 69.2 23 7.8 Lilongwe ADD 487285 100 64.8 27 8.2 Machinga ADD 610613 100 72.7 23.3 4 Blantyre ADD 646718 100 86.8 11.6 1.6 Shire V. ADD 163268 100 62.5 23.8 13.7
At ADD level the pattern is similar to that of the national level with the
exception of Kasungu ADD which shows that about 34 percent of the
gardens were less than 1 hectare in size. This implies that most of the
gardens in Kasungu ADD during the said period were 1 hectare or more in
size. This is slightly followed by Mzuzu ADD which has 49 percent of the
gardens which were 1 hectare or more in size. The data also show that
Blantyre ADD had the largest proportion of gardens which were less than 1
hectare in size (87 percent), followed by Karonga ADD (74 Percent),
Machinga ADD (73 Percent), Salima ADD (69 percent), Lilongwe ADD (65
percent) and Shire Valley ADD (63 percent).
* Percentages used in the text have been rounded up.
6

It is also observed that Blantyre ADD and Machinga ADD have the largest
number of gardens while Karonga ADD, Salima ADD and Shire Valley ADD
have the least of gardens. This is so presumably because the former have
the largest rural farming population (see smallholder Household
Composition Survey Report).
Table G2.0 (National) presents data on percentage of cultivated area by
ploughing method used. The data shows that at national level over 80
percent of the cultivated area was not ploughed.
At ADD level the situation is similar to that of the national level with the
exception of Karonga ADD and Shire Valley ADD where 52 percent and 58
percent of the cultivated area was not ploughed and 38 percent and 40
percent were tilled by hoeing respectively.
Table G3.0 (National) presents data on percentage of cultivated area by
ridging method used. The table shows that at national level 80 percent of
the cultivated area was ridged by hoeing, 4 percent was ridged by oxen and
15 percent was not ridged in this season. At ADD level Kasungu ADD,
Salima ADD, Lilongwe ADD, Machinga ADD and Blantyre ADD had over 80
percent of the cultivated area ridged by hoeing. Karonga ADD and Mzuzu
ADD had least proportions of the cultivated area which was ridged by
hoeing with 51 percent and 57 percent respectively. Shire Valley ADD had
86 percent of the cultivated area not ridged in this season. This is because
the ADD practices the system of flat planting whereby ridges are not
necessary. Karonga ADD also partly practices flat planting, hence the
reason for low proportion of ridged cultivated area.
Table G4.0 (National) presents data on percentage of cultivated area by
planting method used. The data show that at national level over 80 percent
of the cultivated area had crops planted on new ridges as compared to only
5 percent which used old ridges. The system of planting on new ridges is
also the same at ADD level except in Karonga and Shire Valley ADD. In
Karonga ADD 40 percent of the cultivated area was flat planted and 55
percent was planted on new ridges. The situation in Shire Valley is quite
different from all others in that 79 percent of the cultivated area was flat
planted as compared to only 11 percent which were planted on new ridges.
Table B below is extracted from Table G5.0 (National) and presents data on
percentage of cultivated area by source of permission to use land. The table
shows that at national level land which was cultivated during the 1992/93
agricultural season was borrowed (32 percent) and followed by those who
were given permission by their relatives by marriage (28 percent).
7

Table B: Percentage of cultivated Area by Source of Permission to use land.
ADD Total Relative by birth Relative by marriage Borrowed Estate scheme OtherAll Malawi 100 30.8 27.5 31.9 1.8 .0Karonga ADD 100 22.0 14.7 41.8 13.6 7.9Mzuzu ADD 100 40.5 25.6 30.2 0.4 3.2Kasungu ADD 100 39.3 29.0 26.3 2.1 3.2Salima ADD 100 27.5 25.0 40.9 0.4 6.1Lilongwe ADD 100 31.0 30.8 26.5 - 11.7Machinga ADD 100 28.0 33.7 27.5 4.0 6.8Blantyre ADD 100 30.5 24.5 38.1 - 6.8Shire V. ADD 100 17.7 16.6 48.2 0.7 16.8 At ADD level the situation varies from ADD to ADD in that some ADDs had
highest proportion of those who borrowed land and others who got
permission to use it from both relatives by birth and marriage. Shire Valley
ADD had the highest proportion of those who borrowed land in order to use
it (48 percent), this was followed by Karonga ADD (42 percent), Salima ADD
(41 percent), Blantyre ADD (38 percent), Mzuzu ADD (30 percent 0,
Machinga ADD (28 percent), Lilongwe ADD and Kasungu ADD (26 percent
each).
It is also noted that Mzuzu ADD had the highest proportion of those who got
permission from relatives by birth to use the land (41 percent).This was
followed by Kasungu ADD (39 percent), Blantyre ADD and Lilongwe ADD
(about 31 percent each), Machinga ADD and Salima ADD (28 percent each),
Karonga ADD (22 percent) and Shire Valley ADD (18 percent).
It is further noted that Machinga ADD had the highest proportion of those
who got permission to use the land from relatives by marriage (34
percent).This was followed by Lilongwe ADD (31 percent), Kasungu ADD
(29 percent),Mzuzu ADD (27 percent), Salima ADD and Karonga ADD (15
percent).
8

Table C below is extracted from Table G6.0 (National) and Table G7.0
(National) and presents data on number and percentage of plots by maize
variety. At national level the table shows that 65 percent of the plots were
planted with local maize. This was followed by hybrid maize (30 percent),
other type of maize (5 percent) and composite maize (1 percent).This
implies that smallholder farmers still cling to their traditional type of maize
despite numerous calls advising them to grow hybrid maize. Hybrid maize
matures fast and is a high yielding crop. Smallholder farmers still cling to
local maize presumably because of its hard flint which makes it poundable
and is not too husky.
Table C: Number and Percentage of Plots by Maize Variety
ADD Total Plots Total Percent Maize Variety
Hybrid Composite Local OtherMalawi 3539554 100 29.9 0.6 64.9 4.6Salima 179681 100 22.1 2.1 73.4 2.4Mzuzu 335113 100 32.4 0.2 64.5 2.9Kasungu 547318 100 38.2 - 56.7 5.1Salima 205170 100 35.3 - 58.0 6.7Lilongwe 652362 100 30.5 - 64.8 4.7Machinga 712774 100 29.2 0.2 64.4 6.2Blantyre 713176 100 26.8 2.0 67.6 3.6Shire V 193960 100 15.6 0.1 83.3 1.0
9

At ADD level the situation is that over 60 percent of plots were planted with
local maize except Kasungu ADD and Salima ADD which show that
proportions of plots with local maize were slightly lower than 60 percent.
This is because these two ADDs have higher proportions of plots which
were planted with hybrid maize, that is, Kasungu ADD (38 percent) and
Salima ADD (35 percent).
Table G8.0 (National) presents data on percentage of plots by source of
maize seed. At national level it is observed that about 38 percent of the
plots were planted with maize seed which was retained from last season’s
harvest. This is mainly for local maize seed which accounts for 34 percent
of the plots. At ADD level the pattern is similar to that at the national level
except in Shire Valley ADD which shows that 46 percent of the plots were
planted with maize seed which was bought locally. It is also observed that
most of the hybrid maize was obtained through credit from project/scheme.
(b) Fertilizer Application:
Table D below which is extracted from Table G 11.0 (National) and Table G
12.0 (National) presents data on percentage of plots to which fertilizer was
applied. The table shows that at national level 34 percent of the maize plots
received first application of some type as compared to 11 percent which
received second application. Of the 34 percent of the plots which received
first application of fertilizer, 27 percent of the plots belonged to male
headed households, and of the 11 percent of plots which received second
application of fertilizer, 9 percent belonged to male headed households.
At ADD level the proportions of plots which received first application of
fertilizer are below 50 percent except in Lilongwe ADD which registered
slightly over 50 percent. It is also observed that the two extreme ADDs,
Karonga and Shire Valley ADDs registered the lowest proportions of plots
which received first application of fertilizer of some type with 12 percent in
Karonga ADD and 2 percent in Shire Valley ADD. In general it should be
pointed out that low proportions of plots which received fertilizers indicate
that very few smallholder farmers apply fertilizer to their crops and they
apply it only once and for all. The most unfortunate are the plots in female
headed households which indicate that less than 10 percent were fertilized.
The same situation is also observed in maize plots as presented from Table
G 13.0 TO G 18.0 (National).
10

Table D: Percentage of Maize plots to which Fertilizer was applied by ADD
and sex of Household head.
ADD/sex of First Application Second Application household Total none Applied Total none Appliedhead applied some fert applied some fertAll Malawi 100.0 66.4 33.6 100.0 89.2 10.8Male 73.4 46.2 27.2 73.4 64.3 9.1Female 26.6 20.2 6.4 26.6 25.0 1.6
KarongaTotal 100.0 87.8 12.2 100.0 94.7 5.3Male 76.2 66.4 9.8 76.2 72.0 4.2Female 23.8 21.3 2.5 23.8 22.7 1.1
MzuzuTotal 100.0 61.4 38.6 100.0 82.8 17.2Male 82.4 49.5 32.9 82.4 67.7 14.7Female 17.6 11.9 5.7 17.6 15.1 2.5
KasunguTotal 100.0 55.9 44.1 100.0 84.0 16.0Male 81.6 43.1 38.5 81.6 67.4 14.2Female 18.4 12.8 5.6 18.4 16.7 1.7
SalimaTotal 100.0 76.7 23.3 100.0 92.3 7.7Male 71.7 53.4 18.3 71.7 65.5 6.2Female 28.3 23.3 5.0 28.3 26.8 1.5
LilongweTotal 100.0 47.3 52.7 100.0 82.0 18.0Male 77.8 34.2 43.6 77.8 62.2 15.6Female 22.2 13.2 9.0 22.2 19.8 2.4
MachingaTotal 100.0 68.9 31.1 100.0 91.5 8.5Male 68.7 44.2 24.5 68.7 61.9 6.8Female 31.3 24.7 6.6 31.3 29.6 1.7
BlantyreTotal 100.0 74.8 25.2 100.0 95.5 4.5Male 63.0 45.5 17.5 63.0 59.5 3.5Female 37.0 29.3 7.7 37.0 35.9 1.1
Shire ValleyTotal 100.0 97.8 2.2 100.0 99.5 0.5Male 74.2 72.7 1.5 74.2 73.8 0.4Female 25.8 25.1 0.7 25.8 25.7 0.1
11

Table E below is extracted from Tables G 19.0 and G 21.0 (National) and
presents data on application on area planted with maize and rice. The table
shows that male headed households cultivated 684.5 thousand hectares of
maize of which only 49 percent were fertilized. Female headed households
cultivated about 228.3 thousand hectares and 33 percent only were
fertilized. It is observed that hybrid maize had the largest proportion of
areas fertilized with 71 percent in male headed households and 59 percent
in female headed households.
Table E also shows that areas planted with rice were denied fertilizer as
evidenced by low proportions of areas fertilized. It is observed that male
headed households cultivated about 14.0 thousand hectares of rice of which
only 12 percent were fertilized compared to 16 percent in female headed
households which cultivated about 4.4 thousand hectares’ is also observed
that other type of rice had the largest proportions of areas fertilized with 29
percent in male headed households and 57 percent in female headed
households. It should be mentioned that female headed households
surpassed male headed households in having larger proportions of rice
areas fertilized. Perhaps this is because female headed households
cultivated less rice hectares than male headed households and presumably
larger proportions of the areas were fertilized.
At ADD level, Lilongwe ADD had the largest proportions of fertilized maize
areas in male headed households (63 percent), this was followed by Mzuzu
ADD (65 percent), Kasungu ADD (57 percent), Machinga ADD (42 percent),
Salima ADD (42 percent), Blantyre ADD (36 percent), Karonga ADD (29
percent), and Shire Valley ADD (5 percent). As the case is at national level,
hybrid maize had the largest proportions of fertilized areas in all the ADDs.
In female headed households Mzuzu ADD had the largest proportions of
fertilized maize areas (51 percent), this was followed by Lilongwe ADD (50
percent), Kasungu ADD (43 percent), Blantyre ADD (28 percent), Machinga
ADD (27 percent), Karonga ADD (19 percent), Salima ADD (18 percent) and
Shire Valley (4 percent).
12
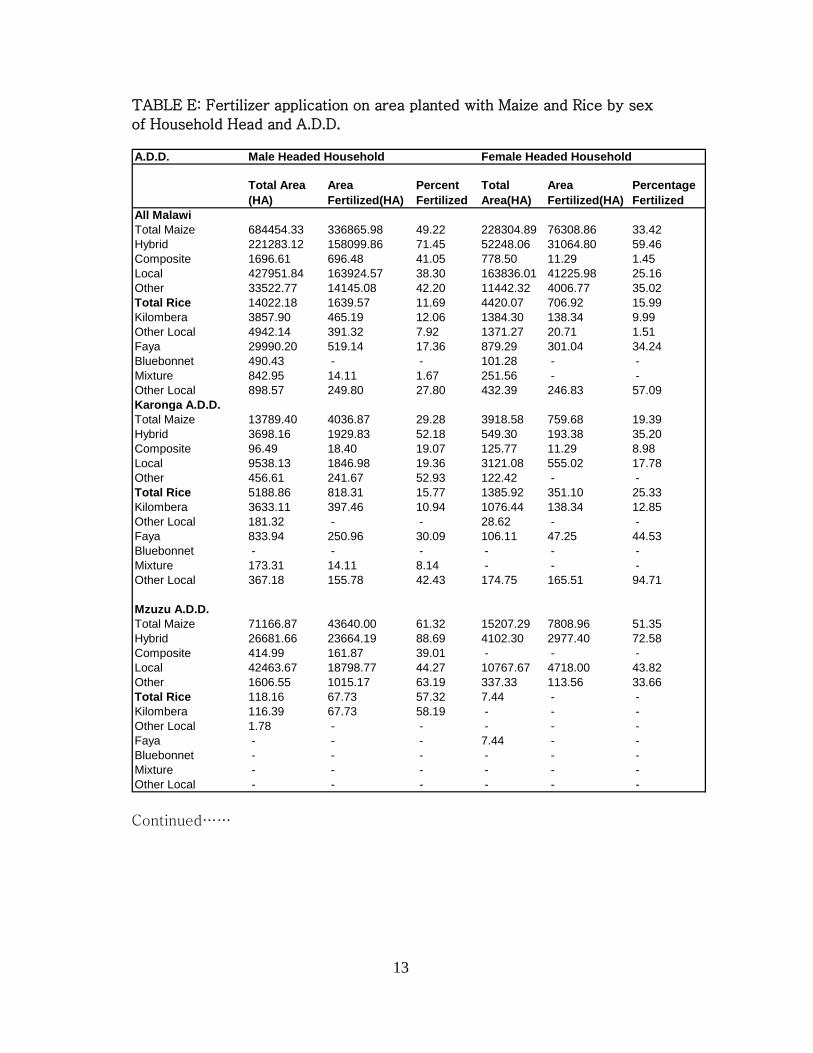
TABLE E: Fertilizer application on area planted with Maize and Rice by sex
of Household Head and A.D.D. A.D.D. Male Headed Household Female Headed Household
Total Area (HA)
Area Fertilized(HA)
Percent Fertilized
Total Area(HA)
Area Fertilized(HA)
Percentage Fertilized
All MalawiTotal Maize 684454.33 336865.98 49.22 228304.89 76308.86 33.42Hybrid 221283.12 158099.86 71.45 52248.06 31064.80 59.46Composite 1696.61 696.48 41.05 778.50 11.29 1.45Local 427951.84 163924.57 38.30 163836.01 41225.98 25.16Other 33522.77 14145.08 42.20 11442.32 4006.77 35.02Total Rice 14022.18 1639.57 11.69 4420.07 706.92 15.99Kilombera 3857.90 465.19 12.06 1384.30 138.34 9.99Other Local 4942.14 391.32 7.92 1371.27 20.71 1.51Faya 29990.20 519.14 17.36 879.29 301.04 34.24Bluebonnet 490.43 - - 101.28 - -Mixture 842.95 14.11 1.67 251.56 - -Other Local 898.57 249.80 27.80 432.39 246.83 57.09Karonga A.D.D.Total Maize 13789.40 4036.87 29.28 3918.58 759.68 19.39Hybrid 3698.16 1929.83 52.18 549.30 193.38 35.20Composite 96.49 18.40 19.07 125.77 11.29 8.98Local 9538.13 1846.98 19.36 3121.08 555.02 17.78Other 456.61 241.67 52.93 122.42 - -Total Rice 5188.86 818.31 15.77 1385.92 351.10 25.33Kilombera 3633.11 397.46 10.94 1076.44 138.34 12.85Other Local 181.32 - - 28.62 - -Faya 833.94 250.96 30.09 106.11 47.25 44.53Bluebonnet - - - - - -Mixture 173.31 14.11 8.14 - - -Other Local 367.18 155.78 42.43 174.75 165.51 94.71
Mzuzu A.D.D.Total Maize 71166.87 43640.00 61.32 15207.29 7808.96 51.35Hybrid 26681.66 23664.19 88.69 4102.30 2977.40 72.58Composite 414.99 161.87 39.01 - - -Local 42463.67 18798.77 44.27 10767.67 4718.00 43.82Other 1606.55 1015.17 63.19 337.33 113.56 33.66Total Rice 118.16 67.73 57.32 7.44 - -Kilombera 116.39 67.73 58.19 - - -Other Local 1.78 - - - - -Faya - - - 7.44 - -Bluebonnet - - - - - -Mixture - - - - - -Other Local - - - - - - Continued……
13

TABLE E: Fertilizer application on area planted with Maize and Rice by sex
of Household Head and A.D.D.
A.D.D. Male Headed Household Female Headed Household
Total Area (HA)
Area Fertilized(HA)
Percent Fertilized
Total Area(HA)
Area Fertilized(HA)
Percentage Fertilized
KASUNGU A.D.D.Total Maize 132664.77 75585.68 56.97 27081.84 11689.42 43.16Hybrid 50980.50 42372.24 83.11 7667.33 6088.13 79.40Composite - - - - - -Local 74045.41 29158.14 39.38 17582.28 4774.26 27.15Other 7638.85 4055.30 53.09 1832.23 827.03 45.14Total Rice 6.30 - - - - -Kilombera - - - - - -Other Local 6.30 - - - - -Faya - - - - - -Bluebonnet - - - - - -Mixture - - - - - -Other Local - - - - - -
SALIMA A.D.D.Total Maize 44549.93 18730.67 42.04 16776.76 3091.96 18.43Hybrid 14875.88 9356.71 62.90 3598.84 1635.88 25.46Composite - - - - - -Local 26632.86 8018.13 30.11 12359.14 1249.42 10.11Other 3041.19 1355.83 44.58 818.77 206.64 25.26Total Rice 2050.25 321.09 15.66 684.76 307.86 44.96Kilombera 1.35 - - 30.42 - -Other Local 251.38 - - 23.59 11.52 48.83Faya 1424.08 268.18 18.83 484.48 253.79 52.38Bluebonnet 207.11 - - - - -Mixture 100.25 - - 80.32 - -Other 66.08 52.90 80.05 65.95 42.55 64.52
Lilongwe A.D.DTotal Maize 151450.33 98647.61 65.14 42732.23 21658.28 50.48Hybrid 48493.10 40205.10 82.91 9695.00 7229.69 74.57Composite - - - - - -Local 96068.42 54319.49 56.54 31360.85 13190.18 42.06Other 6888.81 4122.25 59.84 1676.38 1238.40 73.87 Continued……….
14

TABLE E: Fertilizer application on area planted with Maize and Rice by sex
of Household Head and A.D.D. A.D.D. Male Headed Household Female Headed Household
Total Area (HA)
Area Fertilized(HA)
Percent Fertilized
Total Area(HA)
Area Fertilized(HA)
Percentage Fertilized
Machinga A.D.DTotal Maize 140840.14 59568.43 42.30 58832.86 16084.42 27.34Hybrid 46308.12 26350.43 56.90 12889.83 6541.83 50.75Composite 151.94 1.76 1.16 30.87 - -Local 84952.39 30907.37 36.38 41499.75 8580.04 20.67Other 9427.71 2308.87 24.49 4412.41 962.55 21.81Total Rice 4055.87 21.35 0.53 1584.76 - -Kilombera 29.56 - - 42.02 - -Other Local 3068.21 0.35 0.70 1002.98 - -Faya 589.23 - - 272.47 - -Bluebonnet 1.44 - - 43.86 - -Mixture 282.14 - - 82.50 - -Other Local 85.29 - - 140.94 - -
Blantyre A.D.D.Total Maize 99015.74 35258.62 35.61 52568.85 14766.07 28.09Hybrid 25739.01 13101.70 50.90 12423.95 6054.26 48.73Composite 992.37 514.45 51.84 621.86 - -Local 68255.13 20596.47 30.18 37311.73 8053.22 21.58Other 4029.24 1045.99 25.96 2211.32 658.59 29.78Total Rice 1655.56 369.97 22.35 504.58 9.19 1.82Kilombera 45.92 - - 235.42 - -Other Local 1179.69 369.97 31.36 248.40 9.19 3.70Faya 10.14 - - 8.79 - -Bluebonnet - - - - - -Mixture 96.72 - - - - -Other Local 323.09 - - 11.98 - -
Shire valley A.D.D.Total Maize 30977.15 1398.10 4.51 11186.48 450.07 4.02Hybrid 4506.69 1118.88 24.83 1321.51 344.23 26.05Composite 40.82 - - - - -Local 25995.83 279.22 1.07 9833.51 105.84 1.08Other 433.81 - - 31.46 - -Total Rice 947.18 41.12 4.34 252.61 38.77 15.35Kilombera 31.57 - - - - -Other Local 253.46 - - 67.68 - -Faya 132.81 - - - - -Bluebonnet 281.88 - - 57.42 - -Mixture 190.53 - - 88.74 - -Other Local 56.93 41.12 72.23 38.77 38.77 100.00
15

Table E further shows that at A.D.D. level, rice areas were denied fertilizer
as the case was at national level. In male headed households Mzuzu A.D.D.
had the largest proportions of rice areas fertilized (57 percent), this was
followed by Blantyre A.D.D. (22 percent), Salima A.D.D. and Karonga A.D.D.
(16 Percent each), Shire valley A.D.D. (5 Percent) and Machinga A.D.D. (1
Percent). In female headed households Salima A.D.D. had the largest
proportions of Fertilized Rice areas (45 Percent); this was followed by
Karonga A.D.D. (25 Percent), Shire valley A.D.D. (15 Percent) and Blantyre
A.D.D. (2 Percent).
Table G22.0 (National) presents data on percentage of plots to which
Fertilizer was applied by sex of household head and source of financing the
Fertilizer. The table shows that at national level, 16 percent of the plots
were applied with Fertilizer which was obtained through credit, of which 13
percent and 3 percent were plots belonging to Male and Female heads
respectively. This was followed by Fertilizer which the households obtained
on cash bases (15 percent) of which 12 percent were for Male and Female
headed households respectively.
At A.D.D. level, table G22.0 shows that financing for Fertilizer varied in that
Lilongwe A.D.D. fertilizer was mainly financed through credit (31 percent)
of which 26 Percent and 4 percent were Male and Female headed
households respectively. This was followed by Kasungu A.D.D. (20 percent)
of which 18 percent and 2 percent for Male headed and female headed
households, Salima ADD (12 percent) of which 10 percent and 2 percent for
male headed and female headed households and Shire Valley A.D.D. (2
percent) with 1 percent for both Male and Female headed households
respectively.
In Mzuzu A.D.D. fertilizer was mainly financed on cash basis (19 percent) of
which 16 percent and 3 percent of the plots which obtained fertilizer
through credit belonged to male and female headed households
respectively. This was followed by Machinga A.D.D. (16 percent) of which
13 percent and 3 percent were for male headed and female headed
households respectively, Blantyre A.D.D. (13 percent) of which 9 percent
and 4 percent were for male headed and female headed house holds
respectively and Karonga A.D.D. (7 percent) of which 6 percent and 1
percent were for male headed and female headed households respectively.
16

(c) Total cultivated Area and cropping pattern
Table F below presents data on total cultivated area and average cultivated
area per household. The table shows that the total estimated cultivated area
at national level is 1167.24 thousand hectares with an average of 0.75 of a
hectare per household. Of the total cultivated area only about 77 percent
was cultivated by male headed households with an average of 0.84 of a
hectare per household.
At A.D.D. level the data shows that Lilongwe A.D.D. had the largest
cultivated area (232.98 Thousand hectares) with an average of 0.75 of a
hectare per household. This was followed by Kasungu A.D.D. (225.89
thousand hectares) with an average of 1.37 hectares per household. Of this
cultivated area about 84 percent was for male headed households with an
average of 1.42 hectares per household. This implies that most of the
gardens in Kasungu A.D.D. were 1 hectare or more in size (see table A).
Machinga A.D.D. followed Kasungu A.D.D. with 224.09 thousand hectares
and an average of 0.67 hectare per household, then Blantyre A.D.D. (171.03
thousand hectares) with an average of 0.44 of hectare per household, Mzuzu
A.D.D. (108.76 thousand hectares) with an average of 0.93 of a hectare per
household, Shire valley A.D.D. (89.39 thousand hectares) with an average of
0.89 of a hectare per household, Salima A.D.D. (82.19 thousand hectares)
with an average of 0.90 of a hectare per household and lastly Karonga
A.D.D. (32.91 thousand hectares) with an average of 0.63 of a hectare per
household. It should be pointed out that average holding size in all the
A.D.Ds was above 0.50 of a hectare with the exception of Blantyre A.D.D.
which was 0.44 of a hectare only.
17

Table F: Total estimated cultivated area by A.D.D. and sex of Household Head.
A.D.D./Sex of household head
Total cultivated Area ( 000'HA)
Coefficient of variation
Percentage cultivated Area
Number of holdings ( '000)
Average cultivated area per holding (HA)
All Malawi 1167.24 2.46 100.00 1561.42 0.75Male 893.77 2.80 76.57 1059.50 0.84Female 273.47 5.35 23.43 501.92 0.54
Karonga A.D.D 32.91 8.80 100.00 52.48 0.63Male 26.33 8.96 80.01 38.43 0.69Female 6.58 13.22 19.99 14.05 0.47
Mzuzu A.D.D. 108.76 10.05 100.00 116.90 0.93Male 90.06 10.25 82.81 86.07 1.05Female 18.70 14.64 17.19 38.83 0.48
Kasungu A.D.D. 225.89 6.30 100.00 164.78 1.37Male 188.89 7.00 83.62 132.83 1.42Female 37.00 13.22 16.38 31.95 1.16
Salima A.D.D. 82.19 9.99 100.00 90.94 0.90Male 61.24 9.60 74.51 63.39 0.97Female 20.95 18.04 25.49 27.55 0.76
Lilongwe A.D.D. 232.98 3.96 100.00 310.59 0.75Male 185.08 4.60 79.44 222.67 0.83Female 47.90 7.13 20.56 87.92 0.54
Machinga A.D.D. 224.09 5.87 100.00 335.12 0.67Male 159.80 7.62 71.31 211.12 0.76Female 64.29 7.11 28.69 124.00 0.52
Blantyre A.D.D. 171.03 5.91 100.00 390.05 0.44Male 113.23 6.91 66.20 235.58 0.48Female 57.80 8.94 33.80 154.47 0.37
Shire valley A.D.D. 89.39 9.06 100.00 100.57 0.89Male 69.14 9.63 77.35 69.41 1.00Female 20.25 13.07 22.65 31.16 0.65
18

Table G below which is extracted from Tables G23, G25 and G26 presents
data on percentage of area devoted to major crops grown by smallholder
farmers. The table shows that at national level 78 percent of the cultivated
area was planted with maize and 24 percent was devoted to other food
crops. About 9 percent only was devoted to cash crops of tobacco and
cotton. This implies that smallholder farmers devote most of the available
land for cultivation to food crops only. It should be pointed out that
percentages for maize and other food crops are more than 100 percent
because maize is sometimes inter-planted with other food crops, hence
there is an element of double counting.
At ADD level the data also shows that smallholder farmers allocate more
land to maize than any other crop, with the exception of Karonga ADD and
Sire valley ADD. That is more than 70 percent of the land is devoted to
maize crop than any other crop. But in Karonga ADD 57 percent is devoted
to other food crops as compared to 54 percent which is devoted to maize
crop. This is because Karonga ADD allocated more land to rice and cassava
which fall under other food crops. In Shire valley ADD only 47 percent was
devoted to maize crop because more land is devoted to growing cotton,
sorghum and millet.
Table G also shows that female households do not devote a lot of land to
cash crops much as tobacco and cotton. This is presumably because these
crops need a lot of recourses in order for the crop to do well which may not
be easily accessible by the said households. At national level the data
shows that in female headed households, only 1 percent of the land
cultivated was devoted to the two mentioned crops i.e. cotton and tobacco
as compared to their counterparts who devoted 8 percent.
At ADD level female headed households in Shire valley ADD devoted the
largest proportion of land to growing cash crops (5 percent), this was
followed by Kasungu and Salima ADDs(1 percent each), Lilongwe and
Machinga ADD (0.8 percent each), Karonga ADD (0.4 percent) and lastly
Mzuzu and Blantyre ADD (0.01 percent each).
19

Table G: Total and percentage of cultivated area of major crops by ADD and
sex of Household Head.
Type of crops
ADD/sex of household
Total cultivate Area ( ' 000 'HA) Maize
Other food crops Tobacco Cotton
All MalawiAll Holdings 1167.24 78.20 24.48 5.32 3.38Male 893.77 58.65 18.31 4.81 2.76Female 273.47 19.55 6.17 0.51 0.62
Karonga ADDAll Holdings 32.91 53.84 57.43 0.40 5.08Male 26.33 41.90 45.18 0.36 4.68Female 6.58 11.94 12.25 0.04 0.40
Mzuzu ADDAll Holdings 108.76 79.42 22.90 0.87 0.01Male 90.06 65.45 18.96 0.86 0.01Female 18.70 13.97 3.94 0.01 0.00
Kasungu ADDAll Holdings 225.89 70.72 15.08 13.37 0.03Male 188.89 58.74 12.15 11.89 0.03Female 37.00 11.98 2.93 1.48 0.00
Salima ADDAll Holdings 82.19 74.62 21.13 1.62 7.87Male 61.24 54.23 15.35 1.57 6.74Female 20.95 20.40 5.78 0.04 1.13
Lilongwe ADDAll Holdings 232.98 83.35 26.62 9.77 0.02Male 185.08 65.01 20.35 8.92 0.02Female 47.90 18.34 6.27 0.85 0.00
Machinga ADDAll Holdings 224.09 89.11 16.34 2.29 2.70Male 159.80 62.84 11.19 0.06 0.12Female 64.29 26.26 5.15 0.85 0.58
Blantyre ADDAll Holdings 171.03 88.61 38.71 0.90 0.15Male 113.23 57.88 26.62 0.90 0.15Female 57.80 30.73 12.09 0.00 0.01
Shire valley ADDAll Holdings 89.39 47.19 28.71 0.02 27.82Male 69.14 34.67 22.51 0.02 22.35Female 20.25 12.52 6.20 0.00 5.47
20

(d) Maize production
Tables G27.0, G28.0 and G29.0 present data on production of selected
crops in all the households, male and female headed households
respectively. Table H below which is extracted from the above mentioned
tables presents data on production of maize. The table shows that at
national level, 1431.30 thousand tones of maize were produced in the
1992/93 agriculture season. This gives an average production of about 917
kilograms per household. Of the total production, about 79 percent were
produced in male headed households. This gives an average production of
about 1,070 kilograms per household and average production in female
headed households was 594 kilograms.
At ADD level , Lilongwe ADD produced largest amount of maize (339.50
thousand tones), followed by Kasungu ADD (294.70 thousand tones),
Machinga ADD (274.38 thousand tones), Blantyre ADD (181.04 thousand
tones ), Mzuzu ADD (162.41 thousand tones) , Salima ADD (87.19 thousand
tones), Shire valley (62.42 thousand tones) and Karonga ADD (29.66
thousand tones).
Although Lilongwe ADD produced largest amount of maize, Kasungu ADD
had the largest average amount produced per household (about 1788
kilograms), followed by Mzuzu ADD (about 1389 Kilograms), Lilongwe ADD
(about 1093 kilograms), Salima ADD (about 959 kilograms), Machinga ADD
(about 819 kilograms), Shire valley ADD (about 621 kilograms), Karonga
ADD (about 565 kilograms) and Blantyre ADD (464 kilograms). It should be
mentioned that female headed households produced between 381 and 1204
kilograms of maize with Blantyre ADD producing the least amount and
Kasungu ADD the largest amount.
21

Table H: Total Estimated production of maize by sex of household head and
ADD.
ADD/sex of household head
Total production (' 000 ' tonnes)
Coefficient of variation (percent)
Percentage production
Number of holdungs ( ' 000 ' )
Average production per holding (kg)
All Malawi 1431.30 3.86 100.0 1561.4 916.7Male 1133.19 4.11 79.2 1059.5 1069.6Female 298.11 5.45 20.8 501.9 594.0
Karonga ADD 29.66 13.33 100.0 52.5 564.0Male 24.22 12.91 81.6 38.5 629.1Female 5.44 21.43 18.4 14.0 388.6
Mzuzu ADD 162.41 19.90 100.0 1389.3 1389.3Male 130.34 18.90 80.3 86.1 1513.8Female 32.07 26.86 19.7 30.8 1014.2
Kasungu ADD 294.70 8.40 100.0 164.8 1788.2Male 256.17 8.83 86.9 132.8 1929.0Female 38.53 14.29 13.1 32.0 1204.1
Salima ADD 87.19 10.37 100.0 90.9 959.2Male 68.14 11.19 78.2 63.4 1074.8Female 19.05 18.08 21.8 27.5 692.7
Lilongwe ADD 339.50 5.23 100.0 310.6 1093.0Male 279.75 2.83 82.4 222.7 1256.2Female 59.75 8.69 17.4 87.9 679.7
Machinga ADD 274.38 9.39 100.0 335.1 818.8Male 205.20 11.07 74.8 211.1 972.1Female 69.18 11.09 25.2 124.0 557.9
Blantyre ADD 181.04 8.06 100.0 390.0 464.2Male 122.21 8.86 67.5 235.6 518.7Female 58.83 12.23 32.5 154.5 380.8
Shire Vallet ADD 62.42 14.77 100.0 100.6 620.5Male 47.16 15.07 75.6 69.4 679.5Female 15.26 19.59 24.2 31.2 489.1
22

11. CONCLUSION
This report gives data on garden/plot details, fertilizer application, cropping
pattern and yield/production of selected crops, as collected during the
1992/93 Garden survey of the NSSA.
The survey results show that smallholder farmers cultivated about 2.7
million gardens of which 68 percent were less than 1 hectare in size and 8
percent were 2 hectares or more in size.
The survey results also show that only 34 percent of maize plots received
first application of fertilizer and only 11 percent received second fertilizer
application. It is also noted that in female headed households only 6 percent
of the maize plots received first application of fertilizer while only 2 percent
received second application.
The results reveal that a total of 1,167.24 thousand hectares were
cultivated during the 1992/93 agriculture season. Of this total about 77
percent were cultivated by male headed households with an average of 0.84
of a hectare per household. It is also noted that Kasungu ADD had the
largest average cultivated area per household (1.37 ha).
The results further reveal that smallholder farmers produced about 1431.30
thousand tones of maize with an average production of about 917 Kilograms
per household. It is again noted that Kasungu ADD had the largest average
production of maize per household (about 1788 Kilograms). It is further
noted that of the total maize production, female headed households
produced only 21 percent with an average production of 594 Kilograms per
household.
23

24

STATISTICAL TABLES
FOR
NSSA 1992/93
NATIONAL TABLES
25

26

LIST OF STATISTICAL TABLES AT NATIONAL LEVEL
Table Table Title Page
G1.0 Number and Percentage of gardens by holding
size category 31
G2.0 Percentage of cultivated Area by ploughing method
used and holding size category. 32
G3.0 Percentage of cultivated area by ridging method
used and holding size category. 34
G4.0 Percentage of cultivated area by planting method
used and holding size category. 36
G5.0 Percentage of cultivated area by source of permission
to use land and A.D.D. 39
G6.0 Number of plots by holding size category and A.D.D 39
G7.0 Percentage of plots by Maize variety and A.D.D 40
G8.0 Percentage of plots by source of seed and Maize variety 41
G9.0 Percentage of plots to which fertilizer was applied by
Type of Fertilizer 43
G10.0 Percentage of plots to which fertilizer was applied
by type of fertilizer 43
G11.0 Percentage of maize plots to which fertilizer was applied
by type of fertilizer, A.D.D. and sex of household head. 44
G12.0 Percentage of maize plots which fertilizer was applied
to by type of fertilizer, A.D.D. and sex of household head 45
G13.0 Percentage of plots to which fertilizer was
applied by maize variety 46
G14.0 Percentage of maize plots to which fertilizer was
applied by maize variety 48
G15.0 Percentage of maize plots to which fertilizer was
applied by maize variety for male headed households 50
27

28

G16.0 Percentage of maize plots to which fertilizer was
applied by maize variety for male headed households 52
G17.0 Percentage of maize plots to which fertilizer was
applied by maize variety for female headed households. 54
G18.0 Percentage of maize plots to which fertilizer was
applied by maize variety for female headed households. 56
G19.0 Fertilizer application on area planted with maize and
Rice by A.D.D 58
G20.0 Fertilizer application on area planted with Maize and
Rice for Male headed households by A.D.D. 61
G21.0 Fertilizer application on area planted with Maize and
Rice for Female headed households by A.D.D. 64
G22.0 Percentage of plots to which fertilizer was applied by
sex of household Head and source of financing 67
G23.0 Cropping pattern by A.D.D. (Thousand Hectares) 68
G24.0 Percentage cropping pattern by A.D.D 70
G25.0 Cropping pattern for male headed households by A.D.D
(Thousand Hectares) 72
G26.0 Cropping pattern for female headed households by A.D.D
(Thousand Hectares) 74
G27.0 Production for selected crops by A.D.D. (Thousand Tones) 76
G28.0 Production for selected crops for male headed households
by A.D.D. (Thousand Tones) 78
G29.0 Production for selected crops for female headed households by
A.D.D. (Thousand Tones) 80
G30.0 Mean yield for selected crops by A.D.D. (Kilograms/Hectare) 82
G31.0 Mean yield for selected crops for male headed households
by A.D.D. (Kilograms/Hectare) 84
G32.0 Mean yield for selected crops for Female headed households
by A.D.D. (Kilograms/Hectares) 86
29
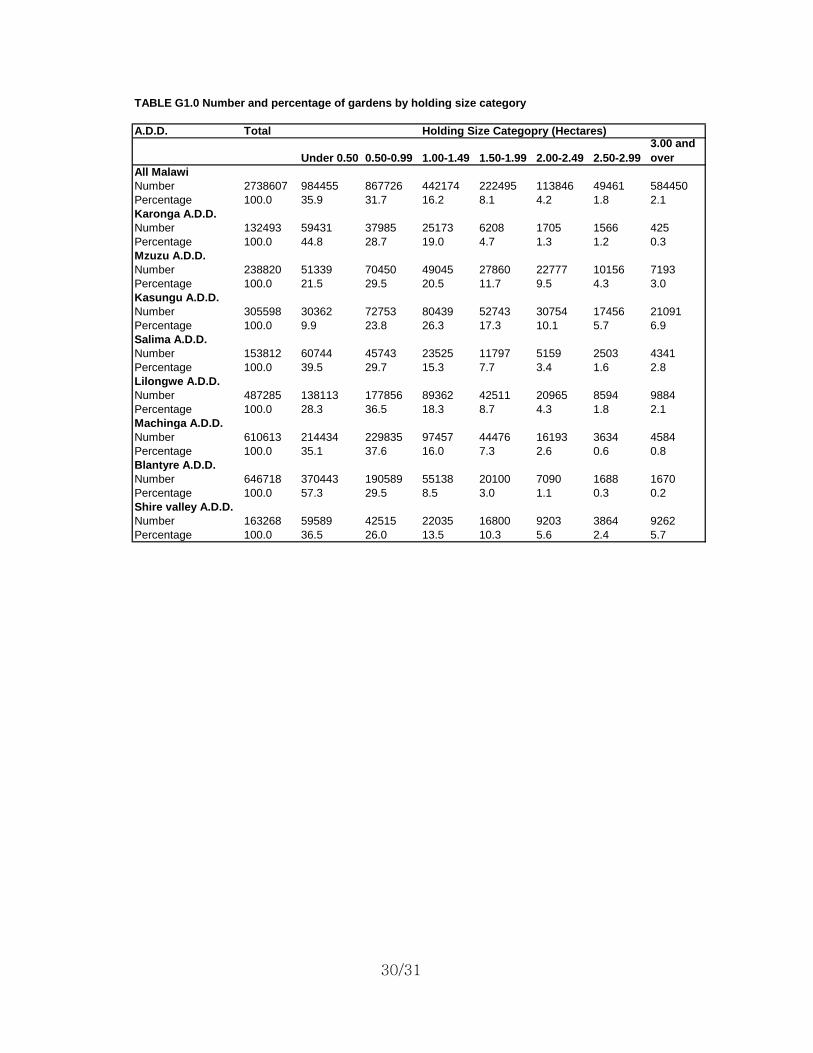
TABLE G1.0 Number and percentage of gardens by holding size category
A.D.D. Total Holding Size Categopry (Hectares)
Under 0.50 0.50-0.99 1.00-1.49 1.50-1.99 2.00-2.49 2.50-2.993.00 and over
All MalawiNumber 2738607 984455 867726 442174 222495 113846 49461 584450Percentage 100.0 35.9 31.7 16.2 8.1 4.2 1.8 2.1Karonga A.D.D.Number 132493 59431 37985 25173 6208 1705 1566 425Percentage 100.0 44.8 28.7 19.0 4.7 1.3 1.2 0.3Mzuzu A.D.D.Number 238820 51339 70450 49045 27860 22777 10156 7193Percentage 100.0 21.5 29.5 20.5 11.7 9.5 4.3 3.0Kasungu A.D.D.Number 305598 30362 72753 80439 52743 30754 17456 21091Percentage 100.0 9.9 23.8 26.3 17.3 10.1 5.7 6.9Salima A.D.D.Number 153812 60744 45743 23525 11797 5159 2503 4341Percentage 100.0 39.5 29.7 15.3 7.7 3.4 1.6 2.8Lilongwe A.D.D.Number 487285 138113 177856 89362 42511 20965 8594 9884Percentage 100.0 28.3 36.5 18.3 8.7 4.3 1.8 2.1Machinga A.D.D.Number 610613 214434 229835 97457 44476 16193 3634 4584Percentage 100.0 35.1 37.6 16.0 7.3 2.6 0.6 0.8Blantyre A.D.D.Number 646718 370443 190589 55138 20100 7090 1688 1670Percentage 100.0 57.3 29.5 8.5 3.0 1.1 0.3 0.2Shire valley A.D.D.Number 163268 59589 42515 22035 16800 9203 3864 9262Percentage 100.0 36.5 26.0 13.5 10.3 5.6 2.4 5.7
30/31

TABLE G2.0. Percentage of cultivated area by ploughing method used and holding size category. Ploughing Method Total Holding Size Category (Hectares)
Under 0.50 0.50-0.99 1.00-1.49 1.50-1.99 2.00-2.49 2.50-2.993.00 and over
All Malawi 100.0 16.6 30.1 21.3 13.5 7.9 4.1 6.5Not ploughed this season 89.6 15.0 27.2 19.2 12.1 7.1 3.4 5.6Tilled by hoeing 7.3 1.2 2.1 1.5 1.0 0.6 0.4 0.6Ploughed by oxen 2.6 0.3 0.6 0.6 0.3 0.3 0.3 0.3Other 0.4 0.1 0.1 0.1 0.1 0.0 - 0.1Karonga A.D.D.Total 100.0 22.3 31.1 29.3 9.3 3.9 3.2 0.9Not ploughed this season 52.3 11.1 16.1 15.0 4.9 2.2 2.2 0.8Tilled by hoeing 9.4 3.6 2.7 2.2 0.4 0.3 0.1 0.1Ploughed by oxen 38.2 7.5 12.3 12.1 4.1 1.5 0.9 - Other 0.0 0.0 - - - - - -Mzuzu A.D.DTotal 100.0 10.1 24.8 22.2 14.4 12.6 7.7 8.2Not ploughed this season 80.5 8.9 20.7 18.4 12.4 9.7 5.4 4.9Tilled by hoeing 6.7 0.7 2.0 2.0 0.5 0.5 0.6 0.5Ploughed by oxen 12.7 0.5 2.0 1.8 1.4 2.3 1.8 2.8Other 0.01 0.0 0.1 0.0 - - - -Kasungu A.D.D.Total 100.0 3.6 17.0 24.1 20.0 13.6 8.3 13.5Not ploughed this season 97.1 3.5 16.6 23.6 19.5 13.3 7.9 12.7Tilled by hoeing 2.1 0.1 0.3 0.4 0.4 0.2 0.1 0.6Ploughed by oxen 0.7 0.0 0.2 0.0 0.0 - 0.3 0.1Other 0.1 - 0.0 - 0.0 0.1 - -Salima A.D.D.Total 100.0 18.3 28.5 19.9 14.1 7.6 3.5 8.1Not ploughed this season 88.9 15.1 25.9 18.0 12.6 7.0 3.1 7.3Tilled by hoeing 10.0 3.1 2.4 1.9 1.5 0.6 0.2 0.4Ploughed by oxen 1.0 0.1 0.2 - - - 0.3 0.5Other 0.1 0.0 0.0 0.0 - - - -Lilongwe A.D.D.Total 100.0 14.5 34.6 23.6 13.0 7.0 2.6 4.7Not ploughed this season 92.3 13.9 32.1 21.4 11.8 6.3 2.3 4.5Tilled by hoeing 7.3 0.6 2.4 2.1 1.0 0.6 0.4 0.1Ploughed by oxen 0.5 0.1 0.2 0.1 0.1 0.0 - -Other 0.0 - 0.0 0.0 - - - -
Machinga A.D.D.Total 100.0 18.6 37.0 21.9 12.8 5.4 1.9 2.4Not ploughed this season 94.9 17.6 35.2 21.0 12.3 5.2 1.9 1.7Tilled by hoeing 4.2 0.8 1.6 0.7 0.3 0.2 0.0 0.6Ploughed by oxen 0.2 - 0.0 0.1 0.1 - - -Other 0.8 0.3 0.2 0.2 0.1 - - -Blantyre A.D.D.Total 100.0 35.7 38.4 14.7 6.1 2.8 1.1 1.3Not ploughed this season 97.4 35.0 37.3 14.3 5.8 2.7 1.1 1.3Tilled by hoeing 2.3 0.6 1.0 0.2 0.3 0.1 - -Ploughed by oxen 0.0 - - 0.0 - - - -Other 0.3 0.0 0.1 0.2 - - - -Shire valley A.D.D.Total 100.0 16.7 23.6 16.7 14.7 8.9 4.9 14.5Not ploughed this season 57.5 9.7 12.8 10.1 7.6 5.3 2.0 10.0Tilled by hoeing 39.7 6.6 10.0 6.4 6.4 3.6 3.0 3.7Ploughed by oxen 0.1 0.1 0.0 0.0 - - - -Other 2.7 0.3 0.8 0.1 0.7 - - 0.8 32/33

TABLE G3.0 Percentage of cultivated area by ridging method used and holding size categoryRidging method Total holding size category (hectares)
Under 0.50 0.50-0.99 1.00-1.49 1.50-1.99 2.00-2.49 2.50-2.993.00 and over
All Malawi 100.0 16.6 30.1 21.3 13.5 7.9 4.1 6.5Not ridged this season 15.4 2.6 4.0 3.2 2.2 1.4 0.7 1.4Ridged by hoeing 79.9 13.8 25.3 17.2 10.7 5.8 2.8 4.3Ridged by Oxen 4.4 0.2 0.7 0.9 0.6 0.6 0.6 0.8Other 0.3 0.1 0.1 0.0 0.0 0.0 0.0 0.0Karonga A.D.D.Total 100.0 22.3 31.1 29.3 9.3 3.9 3.2 0.9Not ridged this season 44.9 12.2 13.6 13.0 4.0 1.3 0.8 0.1Ridged by hoeing 51.0 9.8 16.3 14.8 5.0 2.2 2.1 0.8Ridged by Oxen 4.1 0.2 1.2 1.5 0.4 0.5 0.3 -Other 0.0 0.0 - - - - - -Mzuzu A.D.D.Total 100.0 10.1 24.8 22.2 14.4 12.6 7.7 8.2Not ridged this season 12.0 1.9 2.7 2.6 1.9 1.2 0.9 0.8Ridged by hoeing 56.6 6.5 16.6 13.2 7.4 5.7 3.5 3.6Ridged by Oxen 31.3 1.7 5.4 6.4 5.0 5.7 3.3 3.8Other 0.1 0.1 0.1 - - - - -Kasungu A.D.D.Total 100.0 3.6 17.0 24.1 20.0 13.6 8.3 13.5Not ridged this season 12.5 0.3 2.1 2.7 2.8 1.8 1.0 1.6Ridged by hoeing 81.2 3.1 14.1 20.3 16.8 11.2 6.1 9.5Ridged by Oxen 6.4 0.1 0.8 1.0 0.4 0.5 1.2 2.3Other 0.0 - - 0.0 - - - -Salima A.D.DTotal 100.0 18.3 28.5 19.9 14.1 7.6 3.5 8.1Not ridged this season 16.8 5.9 5.6 2.7 1.3 0.9 0.2 0.2Ridged by hoeing 82.3 12.3 22.9 17.1 12.8 6.7 3.0 7.4Ridged by Oxen 0.8 - 0.0 0.0 - - 0.3 0.5Other 0.2 0.1 0.0 0.1 0.0 - - -Lilongwe A.D.D.Total 100.0 14.5 34.6 23.6 13.0 7.0 2.6 4.7Not ridged this season 7.1 0.7 2.1 1.6 0.9 0.9 0.3 0.5Ridged by hoeing 92.3 13.7 32.2 21.8 11.9 6.0 2.4 4.2Ridged by Oxen 0.5 0.1 0.2 0.1 0.1 0.0 - -Other 0.2 0.1 0.0 0.1 - - - -
Machinga A.D.D.Total 100.0 18.6 37.0 21.9 12.8 5.4 1.9 2.4Not ridged this season 5.6 1.2 1.9 1.5 0.4 0.2 0.0 0.3Ridged by hoeing 93.9 17.3 34.9 20.3 12.4 5.0 1.9 2.1Ridged by Oxen 0.1 - - 0.1 - - - -Other 0.5 0.1 0.2 0.0 0.0 0.2 0.0 -Blantyre A.D.D.Total 100.0 35.7 38.4 14.7 6.1 2.8 1.1 1.3Not ridged this season 6.4 1.3 2.1 1.4 0.7 0.3 0.2 0.3Ridged by hoeing 93.2 34.3 36.1 13.1 5.4 2.5 0.9 0.9Other 0.3 0.1 0.1 0.1 - - - -Shire Valley A.D.D.Total 100.0 16.7 23.6 16.7 14.7 8.9 4.9 14.5Not ridged this season 86.4 14.9 20.7 14.9 12..9 8.0 4.3 10.6Ridged by hoeing 12.9 1.6 2.7 1.8 1.6 0.9 0.6 3.8Other 0.7 0.2 0.1 - 0.2 - - 0.2 34/34

TABLE G4.0. Percentage of cultivated Area by planting method used and holding size category
Planting method Total Holding size category (hectares)
Under 0.50 0.50-0.99 1.00-1.49 1.50-1.99 2.00-2.49 2.50-2.993.00 and over
All Malawi 100.0 16.6 30.1 21.3 13.5 7.9 4.1 6.5Flat planted 9.4 1.9 2.6 1.8 1.2 0.6 0.4 0.9Used last seasons ridges 5.4 0.5 1.3 1.3 1.0 0.6 0.3 0.5Used this seasons ridges 83.4 13.8 25.7 18.0 11.0 6.5 3.3 5.0Planted into holes 0.9 0.1 0.2 0.1 0.2 0.2 0.0 0.0Planted into mounds 0.5 0.2 0.2 0.1 0.0 0.0 - 0.0Other 0.4 0.1 0.1 0.1 0.1 0.0 0.0 0.0Karonga A.D.D.Total 100.0 22.3 31.1 29.3 9.4 3.9 3.2 0.9Flat planted 39.9 10.1 12.6 11.4 3.9 1.0 0.7 0.1Used last seasons ridges 2.5 1.3 0.4 0.7 0.1 - - -Used this seasons ridges 55.4 10.2 17.6 16.7 5.1 2.7 2.4 0.8Planted into holes 0.2 0.0 0.1 0.0 0.0 - 0.0 -Planted into mounds 0.3 0.0 0.0 0.2 - 0.0 - -Other 1.8 0.6 0.4 0.2 0.3 0.2 0.1 -Mzuzu A.D.D.Total 100.0 10.1 24.8 22.2 14.4 12.6 7.7 8.2Flat planted 6.9 0.5 1.3 1.1 1.3 1.1 0.8 0.8Used last seasons ridges 3.6 0.3 0.7 1.3 0.5 0.4 0.2 0.1Used this seasons ridges 87.0 8.2 22.1 19.4 12.3 11.1 6.6 7.2Planted into holes 0.4 0.1 0.2 0.1 0.0 0.0 - 0.0Planted into mounds 1.8 0.9 0.5 0.2 0.2 0.0 - -Other 0.3 0.1 0.1 0.1 - - - 0.0Kasungu A.D.D.Total 100.0 3.6 17.0 24.1 20.0 13.5 8.3 13.5Flat planted 0.9 0.0 0.1 0.1 0.2 0.2 0.1 0.2Used last seasons ridges 12.7 0.3 2.3 2.6 3.4 1.5 0.9 1.7Used this seasons ridges 86.2 3.2 14.6 21.3 16.4 11.7 7.3 11.6Planted into holes 0.1 - 0.0 0.1 - - - -Planted into mounds 0.0 0.0 - - - - - -Other 0.1 0.0 - - 0.0 0.1 - 0.0
36/37

TABLE G4.0. Percentage of cultivated Area by planting method used and holding size category
Planting method Total Holding size category (hectares)
Under 0.50 0.50-0.99 1.00-1.49 1.50-1.99 2.00-2.49 2.50-2.993.00 and over
Salima A.D.D.Total 100.0 18.3 28.5 19.9 14.1 7.6 3.5 8.1Flat planted 9.4 3.4 3.2 1.5 0.8 0.3 - 0.2Used last seasons ridges 2.5 0.7 0.7 0.3 0.4 0.4 - -Used this seasons ridges 84.0 12.4 22.9 17.8 12.7 6.9 3.5 7.9Planted into holes 0.1 0.0 0.0 - - - 0.0 -Planted into mounds 3.9 1.8 1.7 0.3 0.1 - - -Other 0.1 0.1 - - 0.1 - - -Lilongwe A.D.D.Total 100.0 14.5 34.6 23.6 13.0 7.0 2.6 4.7Flat planted 0.4 0.1 0.1 0.1 0.0 0.0 0.0 0.1Used last seasons ridges 6.7 0.7 2.0 1.7 0.9 0.8 0.2 0.5Used this seasons ridges 91.6 13.4 31.8 21.7 12.0 6.1 2.4 4.2Planted into holes 0.6 0.2 0.4 0.0 - - - -Planted into mounds 0.6 0.1 0.3 0.1 0.1 0.0 - 0.0Other 0.1 - - 0.0 - - - 0.0Machinga A.D.D.Total 100.0 18.6 37.0 21.9 12.8 5.4 1.9 2.4Flat planted 4.3 0.8 1.5 1.1 0.4 0.2 - 0.3Used last seasons ridges 3.0 0.5 1.0 0.7 0.1 0.2 0.0 0.4Used this seasons ridges 92.3 17.14 34.4 20.0 12.3 4.9 1.9 1.7Planted into holes 0.2 0.0 0.0 0.1 0.1 - - -Planted into mounds 0.1 0.0 - 0.1 - 0.0 - -Other 0.1 0.0 0.0 0.0 0.0 0.0 0.0 -Blantyre A.D.D.Total 100.0 35.7 38.4 14.6 6.1 2.8 1.1 1.3Flat planted 2.3 0.5 1.0 0.3 0.2 0.1 - 0.1Used last seasons ridges 2.5 0.6 0.8 0.6 0.2 0.0 0.3 -Used this seasons ridges 93.4 34.1 35.9 13.3 5.5 2.7 0.8 1.2Planted into holes 0.5 0.2 0.3 0.1 - -. 0.0 -
Planted into mounds 0.1 0.0 0.0 0.0 - - - -Other 1.2 0.3 0.4 0.3 0.2 - - 0.0
Shire valley A.D.D.Total 100.0 16.7 23.6 16.7 14.7 8.9 4.9 14.5Flat planted 79.4 15.2 20.0 14.0 11.1 5.0 3.8 10.3Used last seasons ridges 0.9 0.0 0.1 0.1 - 0.6 0.0 0.0Used this seasons ridges 11.1 1.0 2.2 1.4 1.3 0.8 0.6 3.9Planted into holes 7.6 0.4 0.9 1.1 2.1 2.5 0.5 0.1Other 1.0 0.0 0.4 0.1 0.3 - - 0.2
38

TABLE G5.0. Percentage of cultivated area by sourse of permission to use land and A.D.D.
A.D.D. TotalRelative by birth-male
Relative by birth-female
Relative by marriage-male
Relative by marriage-female Borrowed Estate/Scheme Other
All Malawi 100.0 18.8 12.0 13.4 14.1 31.9 1.8 8.0Karonga A.D.D. 100.0 18.6 3.4 10.8 3.9 41.8 13.6 7.9Mzuzu A.D.D. 100.0 33.5 7.0 19.3 6.3 30.2 0.4 3.2Kasungu A.D.D 100.0 31.2 8.1 18.3 10.7 26.3 2.1 3.2Salima A.D.D 100.0 13.4 14.1 11.3 13.7 40.9 0.4 6.1Lilongwe A.D.D. 100.0 14.3 16.7 11.7 19.1 26.5 . 11.7Machinga A.D.D. 100.0 13.1 14.9 10.0 23.7 27.5 4.0 6.8Blantyre A.D.D 100.0 11.2 19.3 10.1 14.4 38.1 . 6.8Shire valley A.D.D. 100.0 12.1 5.6 12.8 3.8 48.2 0.7 16.8
TABLE G6.0. Number of plots by holding size category and A.D.D.A.D.D. Total Holding Size category (Hectares)
Under 0.50 0.50-0.99 1.00-1.49 1.50-1.99 2.00-2.49 2.50-2.993.00 and over
All Malawi 3539554 1093285 1088811 623794 346387 185400 90347 111530Karonga A.D.D. 179681 73432 49971 39435 10472 3118 2743 510Mzuzu A.D.D. 335113 58514 94140 70141 39195 37262 19319 16542Kasungu A.D.D 547318 39809 113872 143222 105478 62771 38623 43543Salima A.D.D 205170 67683 58952 35138 20694 9326 4654 8723Lilongwe A.D.D. 652362 158575 239405 127091 63654 31528 12963 19146Machinga A.D.D. 712774 229422 269142 119861 60514 21946 5264 6625Blantyre A.D.D 713176 400405 213470 61602 23818 7578 2358 3945Shire valley A.D.D. 193960 65445 49859 27304 22562 11871 4423 12496
39

TABLE G7.0. Percentage of plots by Maize variety and A.D.D.
A.D.D. Total Type of Maize
Hybrid CompositeLocal pure stand Local/G-nuts
Local/Other crop Other
All Malawi 100.0 29.9 0.6 52.9 2.5 9.6 4.6Karonga A.D.D. 100.0 22.1 2.1 54.5 6.6 12.3 2.4Mzuzu A.D.D. 100.0 32.4 0.2 58.4 2.4 3.6 2.9Kasungu A.D.D 100.0 38.2 0.0 53.6 1.1 2.0 5.1Salima A.D.D 100.0 35.3 0.0 54.1 1.5 2.4 6.7Lilongwe A.D.D. 100.0 30.5 0.0 45.6 3.1 16.1 4.7Machinga A.D.D. 100.0 29.2 0.2 56.1 3.7 4.6 6.2Blantyre A.D.D 100.0 26.8 2.0 48.9 1.7 17.0 3.6Shire valley A.D.D. 100.0 15.6 0.1 79.9 0.2 3.1 1.0
40

TABLE G8.0 Percentage of plots by seed and maize variety.
Maize variety Total Source of seedRetained from last
Project/Scheme credit
As seed from ADMARC
As food from ADMARC
As food from a market
Bought locally Other
All maize 100.0 37.9 9.7 9.9 1.3 3.4 20.6 17.2Hybrid 29.9 2.6 9.0 7.7 0.2 0.2 3.0 7.2Composite 0.6 0.1 0.0 0.0 0.0 0.0 0.1 0.3Local pure stand 52.9 27.0 0.5 1.6 0.9 2.3 14.2 6.3Local /G-nuts 2.5 1.8 0.0 0.0 0.0 0.0 0.5 0.2Local/other crop 9.6 5.5 0.1 0.2 0.1 0.7 2.0 1.1Other 4.6 1.0 0.1 0.3 0.1 0.1 0.8 2.1Karonga A.D.D.All maize 100.0 64.2 2.7 6.4 1.1 1.3 6.5 18.0Hybrid 22.1 3.0 2.6 4.9 0.2 0.1 1.1 10.3Composite 2.1 0.7 0.0 0.1 0.0 0.0 0.2 1.1Local pure stand 54.5 42.7 0.1 0.8 0.9 1.1 4.3 4.7Local /G-nuts 6.6 5.4 0.0 0.1 0.0 0.0 0.3 0.7Local/other crop 12.3 10.8 0.1 0.5 0.0 0.1 0.1 0.7Other 2.4 1.4 0.0 0.0 0.0 0.0 0.5 0.5Mzuzu A.D.D.All maize 100.0 54.6 18.5 7.2 0.6 0.2 6.6 12.3Hybrid 32.4 2.7 17.6 6.7 0.2 0.0 1.3 4.0Composite 0.2 0.1 0.0 0.0 0.0 0.0 0.0 0.0Local pure stand 58.4 45.8 0.4 0.4 0.3 0.2 4.6 6.6Local /G-nuts 2.4 1.9 0.1 0.1 0.0 0.0 0.2 0.1Local/other crop 3.6 2.8 0.0 0.0 0.0 0.0 0.2 0.6Other 2.9 1.2 0.4 0.0 0.1 0.0 0.3 0.9Kasungu A.D.D.All maize 100.0 44.6 15.6 11.9 1.2 0.4 13.2 13.0Hybrid 38.2 3.9 14.7 10.3 0.3 0.0 4.4 4.6Local pure stand 53.6 36.9 0.9 1.2 0.8 0.3 7.1 6.3Local /G-nuts 1.1 0.6 0.0 0.0 0.0 0.0 0.3 0.2Local/other crop 2.0 1.4 0.0 0.0 0.0 0.0 0.4 0.2Other 5.1 1.8 0.1 0.3 0.1 0.0 1.1 1.8
41

TABLE G8.0 Percentage of plots by seed and maize variety.
Maize variety Total Source of seedRetained from last
Project/Scheme credit
As seed from ADMARC
As food from ADMARC
As food from a market
Bought locally Other
Salima A.D.D.All maize 100.0 31.3 9.4 9.7 1.4 0.8 23.3 24.1Hybrid 35.3 2.5 8.5 8.5 0.3 0.0 3.6 11.9Local pure stand 54.1 25.8 0.8 1.0 1.0 0.5 17.1 7.8Local /G-nuts 1.5 0.7 0.1 0.1 0.0 0.0 0.5 0.1Local/other crop 2.4 1.4 0.0 0.0 0.0 0.0 0.7 0.3Other 6.7 0.9 0.0 0.1 0.1 0.2 1.4 4.0Lilongwe A.D.D.All maize 100.0 45.0 14.8 9.8 1.6 2.0 14.9 12.0Hybrid 30.5 3.1 13.5 7.1 0.2 0.2 1.9 4.6Local pure stand 45.6 26.1 0.8 1.6 1.2 1.4 9.6 4.9Local /G-nuts 3.1 2.3 0.0 0.1 0.0 0.0 0.5 0.2Local/other crop 16.1 12.2 0.2 0.2 0.1 0.3 2.2 1.0Other 4.7 1.4 0.3 0.8 0.1 0.1 0.6 1.3Machinga A.D.D.All maize 100.0 33.4 7.9 9.6 1.3 3.9 24.2 19.6Hybrid 29.2 2.5 7.1 8.3 0.2 0.3 3.3 7.4Composite 0.2 0.0 0.0 0.0 0.0 0.0 0.0 0.2Local pure stand 56.1 24.4 0.5 0.7 1.0 3.3 17.8 8.4Local /G-nuts 3.7 2.8 0.0 0.0 0.1 0.0 0.6 0.2Local/other crop 4.6 2.9 0.1 0.1 0.0 0.1 1.0 0.4Other 6.2 0.8 0.2 0.4 0.1 0.1 1.6 3.0Blantyre A.D.D.All maize 100.0 27.0 3.0 10.5 0.9 7.7 28.5 22.5Hybrid 26.8 1.8 2.7 7.3 0.2 0.6 3.9 10.4Composite 2.0 0.3 0.0 0.1 0.0 0.1 0.3 1.1Local pure stand 48.9 17.5 0.3 2.5 0.5 4.2 18.4 5.4Local /G-nuts 1.7 0.8 0.0 0.0 0.0 0.1 0.6 0.2Local/other crop 17.0 6.1 0.0 0.3 0.2 2.5 5.0 2.9Other 3.6 0.5 0.0 0.1 0.0 0.2 0.3 2.5Shire valley A.D.D.All maize 100.0 19.3 2.2 10.7 3.1 5.1 16.4 13.2Hybrid 15.6 0.6 2.1 3.7 0.2 0.0 2.6 6.4Composite 0.1 0.0 0.0 0.0 0.0 0.0 0.0 0.1Local pure stand 79.9 17.3 0.0 6.8 2.9 1.9 42.9 5.1Local /G-nuts 0.2 0.2 0.0 0.0 0.0 0.0 0.0 0.0Local/other crop 3.1 1.3 0.1 0.1 0.0 0.2 0.4 1.1Other 1.0 0.0 0.0 0.0 0.0 0.0 0.6 0.4
42

TABLE G9.0. Percentage of plots to which fertilizer was applied by type of Fertilizer
A.D.D. First Application
Total None used 20:20:0Sulphate of Ammonia DAP 23:21:0+4s CAN UREA Mixture Other
All Malawi 100.0 66.4 2.2 0.7 5.8 3.3 4.7 7.9 8.5 0.6Karonga A.D.D. 100.0 87.8 1.6 2.1 3.1 1.1 0.8 1.2 1.9 0.4Mzuzu A.D.D. 100.0 61.4 1.4 0.4 8.6 0.9 2.3 5.3 18.2 1.5Kasungu A.D.D 100.0 55.9 2.1 0.4 7.5 6.5 4.3 6.5 15.4 1.6Salima A.D.D 100.0 76.7 1.8 2.1 5.0 2.5 4.2 4.4 3.2 0.1Lilongwe A.D.D. 100.0 47.3 5.2 0.9 9.3 5.9 5.8 11.4 14.0 0.2Machinga A.D.D. 100.0 68.9 1.7 0.7 6.0 1.8 4.5. 9.0 6.6 0.7Blantyre A.D.D 100.0 74.8 1.2 0.3 2.1 2.5 7.6 10.4 0.9 0.1Shire valley A.D.D. 100.0 97.8 0.0 0.0 0.0 0.2 0.0 1.8 0.0 0.0 TABLE G10.0. Percentage of plots to which fertilizer was applied by type of FertilizerA.D.D. Second Application
Total None used 20:20:0Sulphate of Ammonia DAP 23:21:0+4s CAN UREA Mixture 8 Other
All Malawi 100.0 89.2 0.1 0.2 0.2 0.1 3.6 5.4 1.2 0.0 0.0Karonga A.D.D. 100.0 94.7 0.0 1.4 0.1 0.0 1.5 2.1. 0.1 0.0 0.0Mzuzu A.D.D. 100.0 82.8 0.1 0.3 0.3 0.0 2.3 9.3 5.0 0.0 0.0Kasungu A.D.D 100.0 84.0 0.1 0.0 0.1 0.1 8.0 5.7 1.9 0.0 0.0Salima A.D.D 100.0 92.3 0.0 0.5 0.3 0.0 2.9 3.6 0.4 0.0 0.0Lilongwe A.D.D. 100.0 82.0 0.1 0.1 0.3 0.1 5.7 9.7 1.8 0.0 0.0Machinga A.D.D. 100.0 91.5 0.1 0.0 0.3 0.0 2.5 5.2 0.4 0.0 0.0Blantyre A.D.D 100.0 95.5 0.1 0.0 0.1 0.1 1.6 2.4 0.1 0.0 0.0Shire valley A.D.D. 100.0 99.5 0.0 0.0 0.2 0.0 0.0 0.2 0.0 0.0 0.0
43
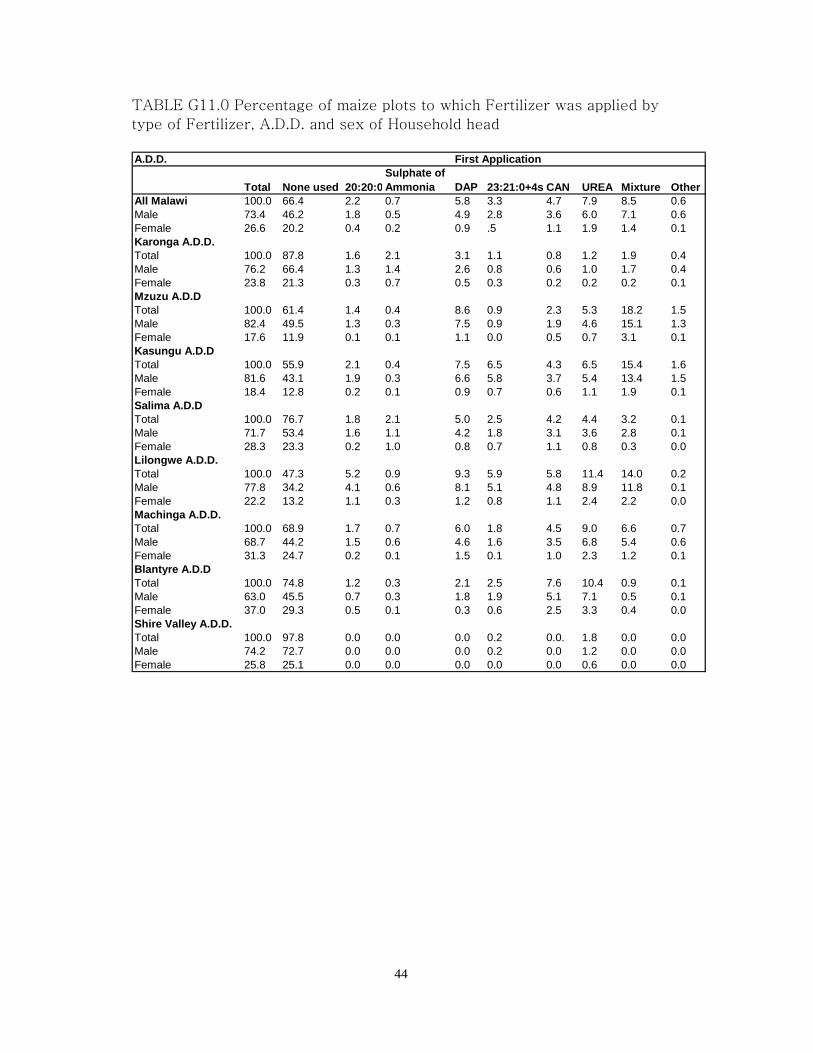
TABLE G11.0 Percentage of maize plots to which Fertilizer was applied by
type of Fertilizer, A.D.D. and sex of Household head
A.D.D. First Application
Total None used 20:20:0Sulphate of Ammonia DAP 23:21:0+4s CAN UREA Mixture Other
All Malawi 100.0 66.4 2.2 0.7 5.8 3.3 4.7 7.9 8.5 0.6Male 73.4 46.2 1.8 0.5 4.9 2.8 3.6 6.0 7.1 0.6Female 26.6 20.2 0.4 0.2 0.9 .5 1.1 1.9 1.4 0.1Karonga A.D.D.Total 100.0 87.8 1.6 2.1 3.1 1.1 0.8 1.2 1.9 0.4Male 76.2 66.4 1.3 1.4 2.6 0.8 0.6 1.0 1.7 0.4Female 23.8 21.3 0.3 0.7 0.5 0.3 0.2 0.2 0.2 0.1Mzuzu A.D.DTotal 100.0 61.4 1.4 0.4 8.6 0.9 2.3 5.3 18.2 1.5Male 82.4 49.5 1.3 0.3 7.5 0.9 1.9 4.6 15.1 1.3Female 17.6 11.9 0.1 0.1 1.1 0.0 0.5 0.7 3.1 0.1Kasungu A.D.DTotal 100.0 55.9 2.1 0.4 7.5 6.5 4.3 6.5 15.4 1.6Male 81.6 43.1 1.9 0.3 6.6 5.8 3.7 5.4 13.4 1.5Female 18.4 12.8 0.2 0.1 0.9 0.7 0.6 1.1 1.9 0.1Salima A.D.DTotal 100.0 76.7 1.8 2.1 5.0 2.5 4.2 4.4 3.2 0.1Male 71.7 53.4 1.6 1.1 4.2 1.8 3.1 3.6 2.8 0.1Female 28.3 23.3 0.2 1.0 0.8 0.7 1.1 0.8 0.3 0.0Lilongwe A.D.D.Total 100.0 47.3 5.2 0.9 9.3 5.9 5.8 11.4 14.0 0.2Male 77.8 34.2 4.1 0.6 8.1 5.1 4.8 8.9 11.8 0.1Female 22.2 13.2 1.1 0.3 1.2 0.8 1.1 2.4 2.2 0.0Machinga A.D.D.Total 100.0 68.9 1.7 0.7 6.0 1.8 4.5 9.0 6.6 0.7Male 68.7 44.2 1.5 0.6 4.6 1.6 3.5 6.8 5.4 0.6Female 31.3 24.7 0.2 0.1 1.5 0.1 1.0 2.3 1.2 0.1Blantyre A.D.DTotal 100.0 74.8 1.2 0.3 2.1 2.5 7.6 10.4 0.9 0.1Male 63.0 45.5 0.7 0.3 1.8 1.9 5.1 7.1 0.5 0.1Female 37.0 29.3 0.5 0.1 0.3 0.6 2.5 3.3 0.4 0.0Shire Valley A.D.D.Total 100.0 97.8 0.0 0.0 0.0 0.2 0.0. 1.8 0.0 0.0Male 74.2 72.7 0.0 0.0 0.0 0.2 0.0 1.2 0.0 0.0Female 25.8 25.1 0.0 0.0 0.0 0.0 0.0 0.6 0.0 0.0
44

Table G12.0.Percentage of maizePlots which Fertirizer was Applied to by Type of Fertirizer, A.D.D. and Sex of Household Head
A.D.D Second Aplication
Total None Used 20;20;0Sulphate of Ammonia DAP 23;21 0+4S CAN UREA Mixture 8 Other
All Malawi 100.0 89.2 .1 .2 .2 .1 3.6 5.4 1.2 .0 .0Male 73.4 64.3 .1 .1 .2 .1 3.1 4.5 1.1 .0 .0Female 26.6 25.0 .0 .0 .0 .0 .5 .9 .2 .0 .0
Karonga A.D.D.Total 100.0 94.7 .0 1.4 .1 .0 1.5 2.1 .1 .0 .0Male 76.2 72.0 .0 .9 .1 .0 1.3 1.7 .1 .0 .0Female 23.8 22.7 .0 .5 .0 .0 .2 .4 .0 .0 .0
Mzuzu A.D.D.Total 100.0 82.8 .1 .3 .3 .0 2.3 9.3 5.0 .0 .0Male 82.4 67.7 .1 .2 .2 .0 2.1 7.7 4.4 .0 .0Female 17.6 15.1 .0 .1 .1 .0 .2 1.6 .6 .0 .0
Kasungu A.D.D.Total 100.0 84.0 .1 .0 .1 .1 8.0 5.7 1.9 .0 .0Male 81.6 67.4 .1 .0 .1 .1 7.1 5.0 1.6 .0 .0Female 18.4 16.7 .0 .0 .0 .0 .9 .7 .2 .0 .0
Salima A.D.D.Total 100.0 92.3 .0 .5 .3 .0 2.9 3.6 .4 .0 .0Male 71.7 65.5 .0 .4 .2 .0 2.4 2.9 .3 .0 .0Female 28.3 26.8 .0 .1 .0 .0 .5 .7 .1 .0 .0
Lilongwe A.D.D.Total 100.0 82.0 .1 .1 .3 .1 5.7 9.7 1.8 .0 .0Male 77.8 62.2 .1 .1 .2 .1 5.1 8.4 1.5 .0 .0Female 22.2 19.8 .0 .0 .1 .0 .6 1.4 .3 .0 .0
Machinga A.D.D.Total 100.0 91.5 .1 .0 .3 .0 2.5 5.2 .4 .0 .0Male 68.7 61.9 .1 .0 .3 .0 2.0 4.0 .4 .0 .0Female 31.3 29.6 .0 .0 .0 .0 .5 1.2 .0 .0 .0
Blantyre A.D.D.Total 100.0 95.5 .1 .0 .1 .1 1.6 2.4 .1 .0 .0Male 63.0 59.5 .1 .0 .1 .1 1.0 2.1 .1 .0 .0Female 37.0 35.9 .0 .0 .0 .0 .7 .3 .0 .0 .0
Shire Valley A.D.D.Total 100.0 99.5 .0 .0 .2 .0 .0 .2 .0 .0 .0Male 74.2 73.8 .0 .0 .2 .0 .0 .1 .0 .0 .0Female 25.8 25.7 .0 .0 .0 .0 .0 .1 .0 .0 .0
45

Table G13.0. Percentageof plotstowhich fertirizer was appliedby maize variety
Maize Variety First Application
TotalNone Used 20;20;0
Sulphate of Ammonia DAP 23;21 0+4S CAN UREA Mixture Other
All Maize 100.0 60.2 2.6 .7 6.7 2.9 6.2 10.6 10.0 .2Hybrid 29.9 11.4 1.3 .2 4.6 1.6 2.0 3.5 5.1 .1Composite .6 .5 .0 .0 .0 .0 .0 .0 .0 .0Local pure stand 52.9 37.5 .7 .3 1.4 1.0 3.0 5.2 3.7 .1Local/G.nuts 2.5 1.6 .0 .1 .1 .0 .2 .3 .2 .0Local/other crop 9.6 6.2 .3 .1 .3 .2 .7 1.2 .6 .0Other 4.6 2.9 .2 .1 .2 .1 .3 .4 .3 .0Karonga A.D.D.All Maize 100.0 82.8 1.0 .8 5.9 1.4 1.4 2.5 4.1 .2Hybrid 22.1 14.4 .4 .5 3.1 .1 .4 .9 2.4 .0Composite 2.1 1.8 .0 .0 .2 .0 .1 .0 .0 .0Local pure stand 54.5 48.8 .3 .2 1.4 .7 .5 .8 1.3 .2Local/G.nuts 6.6 6.2 .1 .1 .1 .0 .1 .0 .0 .0Local/other crop 12.3 9.6 .1 .0 .8 .5 .3 .7 .3 .0Other 2.4 1.9 .0 .0 .3 .0 .0 .1 .2 .0Mzuzu A.D.D.All Maize 100.0 47.4 1.9 .4 12.9 1.2 3.0 7.4 25.3 .5Hybrid 32.4 4.9 .9 .1 9.4 .6 1.0 1.3 14.2 .1Composite .2 .1 .0 .0 .1 .0 .0 .0 .0 .0Local/pure stand 58.4 36.2 .6 .3 2.9 .5 1.7 5.5 10.4 .4Local/G.nuts 2.4 2.2 .0 .0 .1 .0 .0 .0 .1 .0Local/other crop 3.6 2.6 .1 .0 .2 .0 .1 .3 .3 .0Other 2.9 1.4 .2 .0 .2 .1 .2 .4 .3 .1Kasungu A.D.D.All Maize 100.0 47.2 2.3 .5 8.1 4.4 6.3 10.2 20.5 .7Hybrid 38.2 8.8 .9 .2 6.2 2.4 2.5 4.5 12.2 .4Local/pure stand 53.6 33.3 1.0 .2 1.7 1.7 3.4 4.8 7.2 .3Local/G.nuts 1.1 .9 .0 .0 .0 .0 .0 .1 .1 .0Local/other crop 2.0 1.3 .0 .0 .1 .0 .0 .2 .4 .0Other 5.1 2.8 .4 .1 .1 .2 .3 .6 .6 .0
Continued…..
46

Table G13.0. Percentage of plots to which fertilizer was applied by maize variety
` First Application
TotalNone Used 20;20;0
Sulphate of
Ammonia DAP 23;21 0+4S CAN UREA Mixture OtherSalima A.D.D.All Maize 100.0 67.4 2.9 1.9 7.4 3.6 5.9 6.7 4.1 .0Hybrid 35.3 17.3 2.0 .4 5.3 2.7 2.6 3.0 2.1 .0Local pure stand 54.1 42.6 .7 .7 1.6 .8 2.6 3.4 1.7 .0Local/G.nuts 1.5 1.1 .1 .2 .1 .0 .1 .0 .0 .0Local/other crop 2.4 2.0 .0 .2 .1 .0 .0 .0 .1 .0Other 6.7 4.5 .1 .4 .4 .2 .5 .4 .3 .0Lilongwe A.D.D.All Maize 100.0 43.4 5.9 1.0 9.9 5.0 6.9 13.9 14.0 .0Hybrid 3.05 7.1 2.8 .3 6.1 2.6 1.5 4.0 6.1 .0Local pure stand 45.6 25.5 1.4 .2 2.4 1.6 2.9 6.4 5.1 .0Local/G.nuts 3.1 1.7 .1 .1 .1 .1 .3 .5 .2 .0Local/other crop 16.1 7.2 1.1 .2 .9 .6 1.8 2.3 2.0 .0Other 4.7 1.9 .6 .1 .3 .1 .3 .7 .6 .0Machinga A.D.D.All Maize 100.0 64.1 1.7 .9 6.6 1.8 5.6 11.3 7.8 .1Hybrid 29.2 13.3 1.0 .1 5.0 .9 1.7 3.5 3.6 .1Composite .2 .2 .0 .0 .0 .0 .0 .0 .0 .0Local/pure stand 56.1 41.4 .4 .4 1.0 .7 3.2 5.9 3.0 .0Local/G.nuts 3.7 1.7 .0 .2 .1 .1 .4 .7 .5 .0Local/other crop 4.6 2.6 .1 .1 .2 .0 .1 1.0 .5 .0Other 6.2 4.9 .2 .0 .3 .0 .2 .2 .3 .0Blantyre A.D.D.All Maize 100.0 71.8 1.4 .3 2.1 2.7 8.8 11.9 1.1 .1Hybrid 26.8 15.0 .8 .1 1.2 1.6 3.2 4.3 .6 .1Composite 2.0 1.7 .0 .0 .0 .0 .1 .2 .0 .0Local/pure stand 48.9 37.6 .5 .1 .4 .9 3.8 5.2 .3 .0Lacol/G.nuts 1.7 1.3 .0 .0 .0 .0 .3 .1 .0 .0Local /other crop 17.0 13.5 .1 .1 .3 .1 1.1 1.8 .1 .0Other 3.6 2.6 .0 .0 .2 .0 .4 .4 .0 .0Shire Valley A.D.D.All Maize 100.0 97.1 .0 .0 .0 .4 .0 2.4 .0 .0Hybrid 15.6 13.7 .0 .0 .0 .3 .0 1.6 .0 .0Composite .1 .1 .0 .0 .0 .0 .0 .0 .0 .0Local/pure stand 79.9 79.0 .0 .0 .0 .1 .0 .8 .0 .0Local/G.nuts .2 .2 .0 .0 .0 .0 .0 .0 .0 .0Local/other crop 3.1 3.1 .0 .0 .0 .0 .0 .0 .0 .0Other 1.0 1.0 .0 .0 .0 .0 .0 .0 .0 .0
47

Table G14.0 Percentage of plots to which fertirizer was applied
Maize Variety Second Application
TotalNone Used 20;20;0
Sulphate of Ammonia DAP 23;21 0+4S CAN UREA Mixture
All Maize 100.0 88.5 .1 .1 .2 .1 2.9 6.7 1.3Hybrid 29.9 21.8 .1 .1 .2 .1 1.8 5.0 1.0Composite .6 .6 .0 .0 .0 .0 .0 .0 .0Local pure stand 52.9 50.6 .0 .0 .1 .0 .8 1.2 .3Local/G.nuts 2.5 2.5 .0 .0 .0 .0 .0 .0 .0Local/other crop 9.6 9.0 .0 .0 .0 .0 .2 .3 .0Other 4.6 4.0 .0 .0 .0 .0 .2 .2 .0Karonga A.D.D.All Maize 100.0 92.0 .1 .2 .0 .1 2.9 4.4 .3Hybrid 22.1 17.5 .1 .0 .0 .0 1.5 2.8 .3Composite 2.1 1.9 .0 .0 .0 .0 .2 .0 .0Local pure stand 54.5 52.4 .0 .2 .0 .0 1.0 .9 .1Local/G.nuts 6.6 6.6 .0 .0 .0 .0 .0 .0 .0Local/other crop 12.3 11.6 .0 .0 .0 .0 .2 .5 .0Other 2.4 2.0 .0 .0 .0 .1 .0 .3 .0Mzuzu A.D.D.All Maize 100.0 75.6 .1 .3 .4 .0 2.7 13.9 7.0Hybrid 32.4 13.6 .0 .1 .1 .0 1.8 11.6 5.3Composite .2 .1 .0 .0 .0 .0 .1 .0 .0Local/pure stand 58.4 54.0 .0 .1 .3 .0 .7 1.8 1.5Local/G.nuts 2.4 2.4 .0 .0 .0 .0 .0 .0 .1Local/other crop 3.6 3.3 .0 .0 .0 .0 .1 .2 .0Other 2.9 2.3 .1 .0 .0 .0 .0 .3 .1Kasungu A.D.D.All Maize 100.0 86.0 .2 .0 .2 .0 4.7 7.5 1.5Hybrid 38.2 28.3 .2 .0 .2 .0 2.6 5.9 1.0Local/pure stand 53.6 50.0 .0 .0 .0 .0 1.7 1.4 .4Local/G.nuts 1.1 1.1 .0 .0 .0 .0 .0 .0 .0Local/other crop 2.0 1.9 .0 .0 .0 .0 .0 .1 .0Other 5.1 4.7 .0 .0 .0 .0 .3 .1 .1
continued….
48

Table G14.0. Percentageof plotstowhich fertirizer was appliedby maize variety
Maize Variety First Application
TotalNone Used 20;20;0
Sulphate of
Ammonia DAP 23;21 0+4S CAN UREA MixtureSalima A.D.D.All Maize 100.0 88.7 .1 .6 .4 .0 4.1 5.6 4Hybrid 35.3 26.8 .0 .6 .4 .0 2.7 4.6 .3Local pure stand 54.1 51.9 .1 .0 .0 .0 1.1 .8 .1Local/G.nuts 1.5 1.4 .0 .0 .0 .0 .2 .0 .0Local/other crop 2.4 2.4 .0 .0 .0 .0 .0 .0 .0Other 6.7 6.2 .0 .1 .1 .0 .1 .2 .0Lilongwe A.D.D.All Maize 100.0 81.7 .1 .1 .3 .2 5.0 10.6 1.9Hybrid 30.5 19.0 .0 .1 .2 .1 2.9 6.8 1.4Local pure stand 45.6 41.7 .1 .0 .1 .0 1.3 2.2 .2Local/G.nuts 3.1 3.0 .0 .0 .0 .0 .0 .1 .0Local/other crop 16.1 14.4 .0 .0 .0 .0 .6 .9 .2Other 4.7 3.6 .0 .0 .0 .0 .3 .6 .1Machinga A.D.D.All Maize 100.0 91.4 .1 .0 .2 .0 1.8 6.0 .4Hybrid 29.2 22.8 .1 .0 .1 .0 1.1 4.8 .3Composite .2 .2 .0 .0 .0 .0 .0 .0 .0Local/pure stand 56.1 56.7 .0 .0 .1 .0 .4 .8 .1Local/G.nuts 3.7 3.7 .0 .0 .0 .0 .0 .0 .0Local/other crop 4.6 4.4 .0 .0 .0 .0 .0 .2 .0Other 6.2 5.7 .0 .0 .0 .0 .3 .2 .0Blantyre A.D.D.All Maize 100.0 95.3 .0 .0 .1 .2 1.7 2.6 .1Hybrid 26.8 23.7 .0 .0 .1 .1 1.1 1.7 .1Composite 2.0 2.0 .0 .0 .0 .0 .0 .0 .0Local/pure stand 48.9 48.0 .0 .0 .0 .0 .3 .5 .0Lacol/G.nuts 1.7 1.6 .0 .0 .0 .0 .0 .0 .0Local /other crop 17.0 16.6 .0 .0 .0 .0 .1 .3 .0Other 3.6 3.4 .0 .0 .0 .1 .1 .1 .0Shire Valley A.D.D.All Maize 100.0 99.4 .0 .0 .5 .1 .0 .0 .0Hybrid 15.6 15.0 .0 .0 .5 .1 .0 .0 .0Composite .1 .1 .0 .0 .0 .0 .0 .0 .0Local/pure stand 79.9 79.9 .0 .0 .0 .0 .0 .0 .0Local/G.nuts .2 .2 .0 .0 .0 .0 .0 .0 .0Local/other crop 3.1 3.1 .0 .0 .0 .0 .0 .0 .0Other 1.0 1.0 .0 .0 .0 .0 .0 .0 .0
49

Table G15.0 Percentage of maize plots to which fertilizer was applied by maize variety for male Headed Households
Maize Variety First Application
TotalNone Used 20;20;0
Sulphate of
Ammonia DAP 23;21 0+4S CAN UREA Mixture OtherAll Maize 100 55.8 2.8 .7 7.8 3.3 6.5 33.2 11.6 .2Hybrid 32.1 11.2 1.5 .2 5.5 1.9 2.1 3.7 6.1 .1Composite .4 .3 .0 .0 .0 .0 .0 .1 .0 .0Local pure stand 51.7 34.7 .8 .3 1.6 1.2 3.1 5.6 4.3 .1Local/G.nuts 2.4 1.5 .0 .1 .1 .1 .2 .3 .3 .0Local/other crop 8.9 5.4 .3 .1 .4 .2 .7 1.2 .7 .0Other 4.5 2.8 .3 .1 .3 .1 .3 .4 .3 .0Karonga A.D.D.All Maize 100.0 80.4 1.4 1.1 6.9 1.0 1.4 2.8 4.8 .2Hybrid 25.1 15.6 .5 .7 3.7 .1 .5 1.1 2.9 .0Composite 1.3 1.0 .0 .0 .3 .0 .0 .0 .0 .0Local pure stand 52.9 47.3 .6 .3 1.3 .6 .4 .9 1.3 .2Local/G.nuts 5.9 5.4 .1 .1 .1 .0 .1 .0 .0 .0Local/other crop 12.5 9.6 .3 .0 1.0 .3 .4 .8 .4 .0Other 2.1 1.4 .0 .0 .4 .0 .0 .1 .2 .0Mzuzu A.D.D.All Maize 100.0 46.1 2.0 .3 13.7 1.4 2.9 7.8 25.2 .5Hybrid 33.2 4.8 1.1 .1 10.2 .7 1.1 1.2 13.8 .1Composite .3 .1 .0 .0 .1 .0 .0 .0 .0 .0Local/pure stand 58.3 35.8 .6 .2 2.9 .6 1.5 5.8 10.6 .4Local/G.nuts 2.3 2.0 .0 .0 .1 .0 .0 .0 .1 .0Local/other crop 3.1 2.1 .1 .0 .1 .0 .1 .3 .3 .0Other 2.9 1.3 .2 .0 .3 .1 .2 .4 .3 .1Kasungu A.D.D.All Maize 100.0 44.0 2.5 .4 8.9 4.6 6.6 10.1 22.1 .8Hybrid 40.1 8.5 1.1 .2 6.9 2.5 2.8 4.2 13.4 .4Local/pure stand 52.1 31.0 1.1 .1 1.7 1.9 3.5 5.0 7.6 .4Local/G.nuts 1.2 .9 .0 .0 .0 .0 .0 .1 .2 .0Local/other crop 1.6 1.0 .0 .0 .1 .0 .0 .2 .3 .0Other 4.9 2.6 .3 .1 .1 .2 .3 .7 .6 .0
Continued……
50

Table G15.0 Percentage of maize plotstiwhich fertilizer was applied by maize variety for male Headed Households
Maize Variety First Application
TotalNone Used 20;20;0
Sulphate of
Ammonia DAP 23;21 0+4S CAN UREA Mixture OtherSalima A.D.D.All Maize 100.0 63.0 3.7 1.3 8.7 3.7 6.1 8.0 5.6 .0Hybrid 37.2 16.4 2.4 .4 6.1 2.5 3.0 3.6 2.8 .0Local pure stand 53.6 40.1 1.0 .5 2.2 1.0 2.5 3.9 2.3 .0Local/G.nuts 1.3 1.0 .1 .0 .1 .0 .1 .0 .0 .0Local/other crop 1.3 1.2 .0 .0 .0 .0 .0 .0 .1 .0Other 6.6 4.3 .1 .4 .3 .2 .4 .5 .6 .0Lilongwe A.D.D.All Maize 100.0 39.6 6.0 .9 11.2 5.4 7.3 14.4 15.2 .0Hybrid 33.1 7.2 2.8 .2 7.1 2.9 1.7 4.3 7.0 .0Local pure stand 44.1 23.0 1.3 .2 2.7 1.7 3.0 6.7 5.4 .0Local/G.nuts 2.7 1.4 .1 .0 .1 .1 .3 .4 .3 .0Local/other crop 15.4 6.1 1.1 .3 1.0 .6 1.9 2.3 2.0 .0Other 4.8 2.0 .7 .2 .1 .1 .4 .7 .5 .0Machinga A.D.D.All Maize 100.0 59.1 2.2 1.1 7.1 2.4 6.4 12.4 9.3 .0Hybrid 32.5 13.9 1.4 .1 5.5 1.2 2.0 4.1 4.3 .0Composite .2 .1 .0 .0 .0 .0 .0 .0 .0 .0Local/pure stand 53.3 36.8 .5 .6 1.0 1.0 3.7 6.3 3.6 .0Local/G.nuts 3.9 1.4 .0 .3 .1 .1 .4 .9 .6 .0Local/other crop 4.2 2.2 .1 .1 .3 .0 .1 .8 .6 .0Other 6.0 4.7 .2 .0 .2 .0 .2 .3 .2 .0Blantyre A.D.D.All Maize 100.0 69.0 1.3 .3 2.9 3.2 9.4 12.9 1.0 .0Hybrid 27.5 15.1 .8 .1 1.7 2.0 3.0 4.3 .5 .0Composite 1.6 1.2 .0 .0 .0 .0 .1 .2 .0 .0Local/pure stand 48.4 35.6 .4 .1 .5 1.1 4.2 6.2 .4 .0Lacol/G.nuts 1.8 1.4 .0 .0 .0 .0 .3 .0 .0 .0Local /other crop 17.2 13.3 .1 .1 .4 .1 1.2 1.9 .1 .0Other 3.5 2.5 .0 .0 .3 .0 .5 .2 .0 .0Shire Valley A.D.D.All Maize 100.0 97.4 .0 .0 .0 .5 .0 2.2 .0 .0Hybrid 15.7 13.9 .0 .0 .0 .5 .0 1.3 .0 .0Composite .1 .1 .0 .0 .0 .0 .0 .0 .0 .0Local/pure stand 79.8 79.0 .0 .0 .0 .0 .0 .8 .0 .0Local/G.nuts .2 .2 .0 .0 .0 .0 .0 .0 .0 .0Local/other crop 3.0 3.0 .0 .0 .0 .0 .0 .0 .0 .0Other 1.2 1.2 .0 .0 .0 .0 .0 .0 .0 .0
51

Table G16.0. Percentage of maize plots to which fertilizer was applied by maize variety for male Headed Households
Maize Variety First Application
TotalNone Used 20;20;0
Sulphate of
Ammonia DAP 23;21 0+4S CAN UREA MixtureAll Maize 100.0 86.7 .1 .1 .3 .1 3.3 7.8 1.6Hybrid 32.1 22.7 .1 .1 .2 .1 2.0 5.8 1.1Composite .4 .4 .0 .0 .0 .0 .0 .0 .0Local pure stand 51.7 49.1 .0 .0 .1 .0 .8 1.2 .3Local/G.nuts 2.4 2.4 .0 .0 .0 .0 .0 .0 .0Local/other crop 8.9 8.2 .0 .0 .0 .0 .2 .4 .0Other 4.5 3.9 .0 .0 .0 .0 .2 .3 .0Karonga A.D.D.All Maize 100.0 90.9 .0 .1 .0 .1 3.4 5.1 .4Hybrid 25.1 19.4 .0 .0 .0 .0 2.0 3.4 .4Composite 1.3 1.0 .0 .0 .0 .0 .3 .0 .0Local pure stand 52.9 51.1 .0 .1 .0 .0 .9 .8 .1Local/G.nuts 5.9 5.9 .0 .0 .0 .0 .0 .0 .0Local/other crop 12.5 11.8 .0 .0 .0 .0 .2 .5 .0Other 2.1 1.6 .0 .0 .0 .1 .0 .4 .0Mzuzu A.D.D.All Maize 100.0 74.8 .1 .2 .3 .0 3.0 14.1 7.5Hybrid 33.2 13.4 .0 .1 .1 .0 1.9 11.9 5.7Composite .3 .2 .0 .0 .0 .0 .1 .0 .0Local/pure stand 58.3 53.9 .0 .1 .2 .0 .8 1.8 1.6Local/G.nuts 2.3 2.1 .0 .0 .0 .0 .0 .0 .1Local/other crop 3.1 2.8 .0 .0 .0 .0 .2 .1 .0Other 2.9 2.4 .1 .0 .0 .0 .0 .3 .1Kasungu A.D.D.All Maize 100.0 84.8 .2 .0 .2 .1 4.7 8.4 1.6Hybrid 40.1 29.4 .2 .0 .2 .0 2.7 6.6 1.0Local/pure stand 52.1 48.1 .0 .0 .0 .0 1.9 1.6 .5Local/G.nuts 1.2 1.2 .0 .0 .0 .0 .0 .0 .0Local/other crop 1.6 1.5 .0 .0 .0 .0 .0 .1 .0Other 4.9 4.6 .0 .0 .0 .0 .2 .1 .1
continued……
52

Table G16.0. Percentage of maize plots to which fertilizer was applied by maize variety for male Headed Households
Maize Variety First Application
TotalNone Used 20;20;0
Sulphate of
Ammonia DAP 23;21 0+4S CAN UREA MixtureSalima A.D.D.All Maize 100.0 87.1 .1 .7 .6 .0 4.8 6.4 .4Hybrid 37.2 27.7 .0 .6 .5 .0 3.0 5.3 .2Local pure stand 53.6 50.9 .1 .0 .0 .0 1.4 1.0 .2Local/G.nuts 1.3 1.1 .0 .0 .0 .0 .2 .0 .0Local/other crop 1.3 1.3 .0 .0 .0 .0 .0 .0 .0Other 6.6 6.1 .0 .1 .1 .0 .1 .1 .0Lilongwe A.D.D.All Maize 100.0 79.8 .1 .2 .3 .2 5.7 11.7 1.9Hybrid 33.1 20.2 .1 .1 .2 .1 3.4 7.7 1.4Local pure stand 44.1 39.9 .1 .0 .1 .0 1.3 2.4 .3Local/G.nuts 2.7 2.6 .0 .0 .0 .0 .1 .0 .0Local/other crop 15.4 13.4 .0 .0 .0 .0 .7 1.0 .2Other 4.8 3.7 .0 .1 .1 .0 .3 .6 .1Machinga A.D.D.All Maize 100.0 90.2 .2 .0 .3 .0 2.0 6.7 .6Hybrid 32.5 25.0 .1 .0 .2 .0 1.2 5.6 .4Composite .2 .1 .0 .0 .0 .0 .0 .0 .0Local/pure stand 53.3 52.0 .1 .0 .1 .0 .4 .6 .1Local/G.nuts 3.5 3.8 .0 .0 .0 .0 .0 .0 .0Local/other crop 4.2 3.9 .0 .0 .0 .0 .1 .3 .0Other 6.0 5.5 .0 .0 .0 .0 .3 .2 .0Blantyre A.D.D.All Maize 100.0 94.4 .0 .1 .1 .3 1.4 3.6 .1Hybrid 27.5 23.8 .0 .0 .1 .1 1.0 2.3 .1Composite 1.6 1.5 .0 .0 .0 .0 .0 .0 .0Local/pure stand 48.4 47.6 .0 .0 .0 .1 .2 .6 .0Lacol/G.nuts 1.8 1.7 .0 .0 .0 .0 .0 .0 .0Local /other crop 17.2 16.6 .0 .0 .0 .0 .1 .5 .0Other 3.5 3.2 .0 .0 .0 .1 .0 .1 .0Shire Valley A.D.D.All Maize 100.0 99.2 .0 .0 .7 .1 .0 .0 .0Hybrid 15.7 14.9 .0 .0 .7 .1 .0 .0 .0Composite .1 .1 .0 .0 .0 .0 .0 .0 .0Local/pure stand 79.8 79.8 .0 .0 .0 .0 .0 .0 .0Local/G.nuts 0.2 .2 .0 .0 .0 .0 .0 .0 .0Local/other crop 3.0 3.0 .0 .0 .0 .0 .0 .0 .0Other 1.2 1.2 .0 .0 .0 .0 .0 .0 .0
53

Table G17.0. Percentage of maize plots to which fertilizer was applied by maize variety for Female Headed Households female Headed Households
Maize Variety First Application
TotalNone Used 20;20;0
Sulphate of Ammonia DAP 23;21 0+4S CAN UREA Mixture Other
All Maize 100.0 71.1 1.8 .7 3.8 1.9 5.4 9.1 6.0 .1Hybrid 24.2 11.9 .9 .2 2.5 1.0 1.8 3.1 2.8 .1Composite 1.0 1.0 .0 .0 .0 .0 .0 .0 .0 .0Local pure stand 56.0 44.5 .6 .3 .9 .7 2.7 4.1 2.2 .0Local/G.nuts 2.8 2.1 .0 .1 .1 .0 .2 .2 .1 .0Local/other crop 11.2 8.2 .2 .1 .1 .2 .5 1.3 .5 .0Other 4.7 3.3 .2 .1 .2 .1 .2 .4 .3 .0Karonga A.D.D.All Maize 100.0 89.3 .0 .0 3.1 2.6 1.5 1.4 2.1 .0Hybrid 13.9 11.3 .0 .0 1.2 .2 .2 .2 .8 .0Composite 4.1 3.8 .0 .0 .0 .0 .3 .0 .0 .0Local pure stand 58.8 52.9 .0 .0 1.7 1.2 1.0 .7 1.3 .0Local/G.nuts 8.4 8.4 .0 .0 .0 .0 .0 .0 .0 .0Local/other crop 11.7 9.7 .0 .0 .2 1.2 .0 .5 .0 .0Other 3.1 3.1 .0 .0 .0 .0 .0 .0 .0 .0Mzuzu A.D.D.All Maize 100.0 53.1 1.2 .6 9.3 .0 3.8 5.7 25.8 .6Hybrid 29.1 5.5 .0 .0 5.7 .0 .8 1.4 15.8 .0Local/pure stand 58.9 37.8 .9 .6 2.7 .0 2.9 4.2 9.2 .6Local/G.nuts 3.3 3.3 .0 .0 .0 .0 .0 .0 .0 .0Local/other crop 6.1 4.9 .0 .0 .7 .0 .2 .0 .3 .0Other 2.6 1.7 .2 .0 .2 .0 .0 .0 .5 .0Kasungu A.D.D.All Maize 100.0 61.3 1.4 .8 4.6 3.2 4.9 10.5 13.5 .0Hybrid 29.3 10.5 .0 .0 3.2 1.9 1.3 5.6 6.8 .0Local/pure stand 60.3 43.9 .6 .8 1.4 1.0 3.3 4.1 5.2 .0Local/G.nuts .9 .9 .0 .0 .0 .0 .0 .0 .0 .0Local/other crop 3.7 2.4 .0 .0 .0 .0 .0 .4 .9 .0Other 6.0 3.7 .8 .0 .0 .4 .0 .4 .4 .0Salima A.D.D.All Maize 100.0 77.4 1.1 3.2 4.6 3.6 5.5 3.8 .8 .0Hybrid 31.0 19.2 1.1 .3 3.5 3.0 1.8 1.6 .5 .0Local pure stand 55.2 48.1 .0 1.0 .4 .5 2.8 2.1 .3 .0Local/G.nuts 2.0 1.4 .0 .3 .0 .0 .2 .0 .0 .0Local/other crop 4.8 3.8 .0 .7 .2 .0 .0 .0 .0 .0Other 7.0 4.9 .0 .5 .5 .2 .8 .2 .0 .0
Continued…..
54

Table G17.0. Percentage of maize plots to which fertilizer was applied by maize variety for Female Headed Households female Headed Households
Maize Variety First Application
TotalNone Used 20;20;0
Sulphate of
Ammonia DAP 23;21 0+4S CAN UREA Mixture OtherLilongwe A.D.D.All Maize 100.0 55.4 5.6 1.3 5.5 3.8 5.7 12.4 10.3 .0Hybrid 22.4 6.9 2.8 .6 3.1 1.6 .9 3.2 3.3 .0Local pure stand 50.3 33.3 1.5 .3 1.5 1.3 2.7 5.6 4.0 .0Local/G.nuts 4.6 2.9 .2 .2 .2 .1 .4 .6 .1 .0Local/other crop 18.6 10.8 .9 .1 .4 .7 1.5 2.3 2.0 .0Other 4.1 1.6 .2 .0 .3 .1 .2 .8 .9 .0Machinga A.D.D.All Maize 100.0 74.8 .7 .5 5.5 .5 4.0 9.0 4.8 .2Hybrid 22.2 12.0 .2 .0 4.0 .3 1.1 2.2 2.1 .2Composite .2 .2 .0 .0 .0 .0 .0 .0 .0 .0Local/pure stand 62.1 51.3 .2 .1 .9 .2 2.3 5.0 2.0 .0Local/G.nuts 3.4 2.4 .0 .0 .2 .0 .4 .4 .2 .0Local/other crop 5.4 3.5 .0 .2 .0 .0 .1 1.3 .3 .0Other 6.7 5.4 .3 .1 .4 .0 .1 .1 .4 .0Blantyre A.D.D.All Maize 100.0 76.4 1.5 .3 .8 1.8 7.8 10.1 1.2 .1Hybrid 25.6 14.7 .9 .1 .4 1.0 3.4 4.1 .8 .1Composite 2.7 2.7 .0 .0 .0 .0 .0 .0 .0 .0Local/pure stand 49.6 41.0 .5 .1 .3 .7 3.2 3.5 .2 .0Lacol/G.nuts 1.5 1.3 .0 .0 .0 .0 .1 .1 .0 .0Local /other crop 16.7 13.8 .1 .1 .0 .0 .8 1.8 .2 .0Other 3.8 2.8 .0 .0 .1 .0 .2 .6 .1 .0Shire Valley A.D.D.All Maize 100.0 96.5 .0 .0 .0 .3 .0 3.2 .0 .0Hybrid 15.5 13.2 .0 .0 .0 .0 .0 2.3 .0 .0Local/pure stand 80.3 79.1 .0 .0 .0 .3 .0 .9 .0 .0Local/G.nuts .1 .1 .0 .0 .0 .0 .0 .0 .0 .0Local/other crop 3.6 3.6 .0 .0 .0 .0 .0 .0 .0 .0Other .5 .5 .0 .0 .0 .0 .0 .0 .0 .0
55

Table G18.0. Percentage of maize plots to which fertilizer was applied by maize variety for Female Headed Households
Maize Variety First Application
TotalNone Used 20;20;0
Sulphate of
Ammonia DAP 23;21 0+4S CAN UREA MixtureAll MalawiAll Maize 100.0 92.9 .0 .1 .1 .0 2.1 4.0 .7Hybrid 24.2 19.6 .0 .0 .1 .0 1.2 2.7 .6Composite 1.0 1.0 .0 .0 .0 .0 .0 .0 .0Local pure stand 56.0 54.3 .0 .0 .0 .0 .6 .9 .1Local/G.nuts 2.8 2.7 .0 .0 .0 .0 .0 .0 .0Local/other crop 11.2 10.9 .0 .0 .0 .0 .1 .2 .0Other 4.7 4.4 .0 .0 .0 .0 .2 .2 .0Karonga A.D.D.All Maize 100.0 94.9 .4 .4 .0 .0 1.6 2.7 .0Hybrid 13.9 12.3 .4 .0 .0 .0 .0 1.2 .0Composite 4.1 4.1 .0 .0 .0 .0 .0 .0 .0Local pure stand 58.8 55.9 .0 .4 .0 .0 1.4 1.1 .0Local/G.nuts 8.4 8.4 .0 .0 .0 .0 .0 .0 .0Local/other crop 11.7 11.1 .0 .0 .0 .0 .2 .4 .0Other 3.1 3.1 .0 .0 .0 .0 .0 .0 .0Mzuzu A.D.D.All Maize 100.0 79.4 .0 .5 .7 .0 1.5 13.3 4.6Hybrid 29.1 14.3 .0 .0 .0 .0 1.2 10.2 3.4Local/pure stand 58.9 54.3 .0 .5 .7 .0 .3 2.1 .9Local/G.nuts 3.3 3.3 .0 .0 .0 .0 .0 .0 .0Local/other crop 6.1 5.5 .0 .0 .0 .0 .0 .7 .0Other 2.6 2.0 .0 .0 .0 .0 .0 .2 .3Kasungu A.D.D.All Maize 100.0 91.2 .0 .0 .0 .0 4.2 3.4 1.1Hybrid 29.3 23.2 .0 .0 .0 .0 2.3 2.7 1.1Local/pure stand 60.3 58.4 .0 .0 .0 .0 1.1 .8 .0Local/G.nuts .9 .9 .0 .0 .0 .0 .0 .0 .0Local/other crop 3.7 3.7 .0 .0 .0 .0 .0 .0 .0Other 6.0 5.2 .0 .0 .0 .0 .8 .0 .0Salima A.D.D.All Maize 100.0 92.4 .0 .6 .1 .0 2.5 3.9 .5Hybrid 31.0 24.8 .0 .6 .1 .0 1.9 3.1 .5Local pure stand 55.2 54.3 .0 .0 .0 .0 .6 .3 .0Local/G.nuts 2.0 2.0 .0 .0 .0 .0 .0 .0 .0Local/other crop 4.8 4.8 .0 .0 .0 .0 .0 .0 .0Other 7.0 6.5 .0 .0 .0 .0 .0 .5 .0
continued…..
56

Table G18.0. Percentage of maize plots to which fertilizer was applied by maize variety for Female Headed Households
Maize Variety First Application
TotalNone Used 20;20;0
Sulphate of Ammonia DAP 23;21 0+4S CAN UREA Mixture
Lilongwe A.D.D.All Maize 100.0 88.0 .1 .0 .3 .1 2.7 7.1 1.7Hybrid 22.4 15.1 .0 .0 .3 .1 1.3 4.2 1.3Local pure stand 50.3 47.5 .0 .0 .0 .0 1.2 1.4 .2Local/G.nuts 4.6 4.4 .0 .0 .0 .0 .0 .2 .0Local/other crop 18.6 17.5 .1 .0 .0 .0 .1 .7 .2Other 4.1 3.5 .0 .0 .0 .0 .1 .5 .0Machinga A.D.D.All Maize 100.0 93.9 .0 .0 .0 .0 1.4 4.6 .0Hybrid 22.2 18.1 .0 .0 .0 .0 .8 3.2 .0Composite .2 .2 .0 .0 .0 .0 .0 .0 .0Local/pure stand 62.2 60.5 .0 .0 .0 .0 .3 1.3 .0Local/G.nuts 3.4 3.4 .0 .0 .0 .0 .0 .0 .0Local/other crop 5.4 5.4 .0 .0 .0 .0 .0 .0 .0Other 6.7 6.2 .0 .0 .0 .0 .3 .2 .0Blantyre A.D.D.All Maize 100.0 96.7 .0 .0 .0 .0 2.1 1.1 .1Hybrid 25.6 23.5 .0 .0 .0 .0 1.4 .7 .1Composite 2.7 2.7 .0 .0 .0 .0 .0 .0 .0Local/pure stand 49.6 48.7 .0 .0 .0 .0 .5 .4 .0Lacol/G.nuts 1.5 1.5 .0 .0 .0 .0 .0 .0 .0Local /other crop 16.7 16.6 .0 .0 .0 .0 .1 .0 .0Other 3.8 3.7 .0 .0 .0 .0 .1 .0 .0Shire Valley A.D.D.All Maize 100.0 100.0 .0 .0 .0 .0 .0 .0 .0Hybrid 15.5 15.5 .0 .0 .0 .0 .0 .0 .0Local/pure stand 80.3 80.3 .0 .0 .0 .0 .0 .0 .0Local/G.nuts .1 .1 .0 .0 .0 .0 .0 .0 .0Local/other crop 3.6 3.6 .0 .0 .0 .0 .0 .0 .0Other .5 .5 .0 .0 .0 .0 .0 .0 .0
57

Table G19.0 Fertilizer application on area planted with Maize and Rice by A.D.D.
A.D.DTotal Area (Hectares)
Area fertilized
(Hectares)Percentage
fertilizedKaronga A.D.D.Total Maize 17707.97 4796.55 27.09Hybrid 4247.47 2123.20 49.99Composite 222.25 29.69 13.36Local pure stand 92.4.07 1591.36 17.29Local/G.nuts 869.60 148.34 17.06Local/Pulses 2348.27 659.66 28.09Local/Millet 21.60 - -Local/Root crops 215.68 2.63 1.22Other 579.04 241.67 41.74Total Rice 6574.78 1169.41 17.79Kilombera 4709.55 535.80 11.38Other local 209.94 - -Faya 940.05 298.21 31.72Mixture 173.31 14.11 8.14Other 5410.93 321.29 59.29Mzuzu A.D.D.Total Maize 86374.16 51448.96 59.57Hybrid 30783.96 26641.59 86.54Composite 414.99 161.87 39.01Local pure stand 47704.18 21619.16 45.32Local/G.nuts 2023.70 293.30 14.49Local/Pulses 3465.28 1604.30 46.30Local/Root crops 38.18 - -Other 1943.87 1128.73 58.07Total Rice 125.60 67.73 53.93Kilombera 116.39 67.73 58.19Other local 1.78 - -Faya 7.44 - -Kasungu A.D.D.Total Maize 159746.60 87275.10 54.63Hybrid 58647.84 48460.36 82.63Loca pure stand 88255.18 32649.07 36.99Local/G.nuts 1690.55 265.24 15.69Loca/Pulses 1604.08 1018.09 63.47Local/Sorghum 77.88 - -Other 9471.07 4882.33 51.55Total Rice 6.30 - -Other local 6.30 - -
continued…
58

Table G19.0 Fertilizer application on Area palnted with Maize and Rice by A.D.D.
A.D.DTotal Area (Hectares)
Area fertilized
(Hectares)Percentage
fertilizedSalima A.D.DTotal Maize 61326.68 21822.62 35.58Hybrid 18474.72 10992.59 59.50Local pure stand 37120.79 8741.89 23.55Local/G.nuts 717.78 406.01 56.56Local/Pulses 192.28 100.33 52.18Local/Millet 915.27 19.33 2.11Local/Sorghum 27.73 - -Local/Other Grains 7.28 - -Local/Root crops 10.87 - -Other 3859.96 1562.48 40.48Total Rice 2735.00 628.95 23.00Kilombera 31.77 - -Other local 274.97 11.52 4.19Faya 1908.56 521.97 27.35Bluebonnet 207.11 - -Mixture 180.57 - -Other 132.03 95.45 72.29Lilongwe A.D.D.Total Maize 194182.56 120305.89 61.96Hybrid 58188.11 47435.57 81.52Local pure stand 93155.92 47307.48 50.78Local/G.nuts 4837.93 2400.22 49.61Local/Pulses 28300.92 17224.16 60.86Local/Millet 918.49 577.80 62.91Local/Other Grains 216.00 - -Other 8565.19 5360.65 62.59Machinga A.D.D.Total Maize 199673.00 75652.85 37.89Hybrid 59197.94 32892.26 55.56Composite 182.81 1.76 .96Local pure stand 112404.58 31852.30 28.34Local/G.nuts 7034.93 3956.56 56.24Loca/Pulses 4631.81 2764.66 59.69Local Millet 703.16 239.89 34.12Local/Sorghum 1313.97 467.01 35.54Local/Other Grains 323.08 199.53 61.76Local/Root crops 40.61 7.47 18.39
continued…
59

Table G19.0 Fertilizer application on Area planted with Maize and Rice by A.D.D.
A.D.DTotal Area (Hectares)
Area fertilized
(Hectares)Percentage
fertilizedMachinga A.D.D.Other 13840.12 3271.41 23.64Total Rice 5640.64 21.35 .38Kilombera 71.58 - -Other local 4071.18 21.35 .52Faya 861.70 - -Bluebonnet 45.30 - -Mixture 364.64 - -Other 226.23 - -Blantyre A.D.D.Total Maize 151584.59 50024.69 33.00Hybrid 38162.96 19155.96 50.20Composite 1614.32 514.45 31.87Local pure stand 76257.32 21755.94 28.53Local/G.nuts 3080.86 575.06 18.67Local/Pulses 18468.25 4910.83 26.59Local/Millet 644.24 338.06 52.47Local Sorghum 4270.27 620.34 14.53Local/Other Grains 2717.40 449.47 16.54Local/Root crops 128.50 - -Other 6240.56 1704.58 27.31Total Rice 2160.15 379.16 18.39Kilombera 281.34 - -Other local 1428.09 379.16 27.81Faya 18.93 - -Mixture 96.72 - -Other 335.07 - -Shire Valley A.D.D.Total Maize 42163.63 1848.17 4.38Hybrid 5828.20 1463.17 25.10Composite 40.82 - -Local pure stand 34372.71 385.06 1.12Local/G.nuts 82.67 - -Local/Pulses 635.10 - -Local/Millet 406.28 - -Local/Sorghum 332.60 - -Other 465.27 - -Total Rice 1199.79 79.89 6.66Kilombera 31.57 - -Other local 321.14 - -Faya 132.81 - -Bluebonnet 339.30 - -Mixture 279.27 - -Other 95.70 79.89 83.48
60

Table G20.0. Fertilizer Application on Area planted with Maize and Rice for Male Headed Households by A.D.D.
A.D.DTotal Area (Hectares)
Area fertilized
(Hectares)Percentage
fertilizedKaronga A.D.D.Total Maize 13789.4 4036.87 29.28Hybrid 3698.16 1929.83 52.18Composite 96.49 18.40 19.07Local pure stand 6915.93 1163.88 16.83Local/G.nuts 651.71 148.34 22.76Local/Pulses 1762.84 532.13 30.19Local/Millet 13.5 - -Local/Root crops 194.12 2.63 1.35Other 456.61 241.67 52.93Total Rice 5188.86 818.31 15.77Kilombera 3633.11 397.46 10.94Other local 181.32 - -Faya 833.94 250.96 30.09Mixture 173.31 14.11 8.14Other 367.18 155.78 42.43Mzuzu A.D.D.Total Maize 71166.87 43640.00 61.32Hybrid 26681.66 23664.19 88.69Composite 414.99 161.87 39.01Local pure stand 38248.13 17136.41 44.80Local/G.nuts 1581.87 293.30 18.54Local/Pulses 2595.49 1369.06 52.75Local/Root crops 38.18 - -Other 1606.55 1015.17 63.19Total Rice 118.16 67.73 57.32Kilombera 116.39 67.73 58.19Other local 1.78 - -
continued …
61

Table G20.0. Fertilizer Application on Area planted with Maize and Rice for Male Headed Households by A.D.D.
A.D.DTotal Area (Hectares)
Area fertilized
(Hectares)Percentage
fertilizedKasungu A.D.D.Total Maize 152664.77 75585.68 56.97Hybrid 50980.50 42372.24 83.11Loca pure stand 71511.51 28240.24 39.49Local/G.nuts 1432.39 265.24 18.52Loca/Pulses 1023.63 652.66 63.76Local/Sorghum 77.88 - -Other 7638.85 4055.30 53.09Total Rice 6.30 - -Other local 6.30 - -Salima A.D.DTotal Maize 44549.93 18730.67 42.04Hybrid 14875.88 9356.71 62.90Local pure stand 25480.99 7567.00 29.70Local/G.nuts 533.64 354.67 66.46Local/Pulses 188.42 96.46 51.19Local/Millet 426.22 - -Local/Root crops 3.59 - -Other 3041.19 1355.83 44.58Total Rice 2050.25 321.09 15.66Kilombera 1.35 - -Other local 251.38 - -Faya 1424.08 268.18 18.83Bluebonnet 207.11 - -Mixture 100.25 - -Other 66.08 52.00 80.05Lilongwe A.D.D.Total Maize 151450.33 98647.61 65.14Hybrid 48493.10 40205.88 82.91Local pure stand 70665.48 38608.86 54.64Local/G.nuts 5244.87 1635.07 50.39Local/Pulses 21204.91 13677.25 64.50Local/Millet 737.16 398.31 54.03Local/Other Grains 216.00 - -Other 6888.81 4122.25 59.84
continued …
62

Table G20.0. Fertilizer Application on Area planted with Maize and Rice for Male Headed Households by A.D.D.
A.D.DTotal Area (Hectares)
Area fertilized
(Hectares)Percentage
fertilizedMachinga A.D.D.Total Maize 140840.14 59568.43 42.30Hybrid 46308.12 26350.43 56.90Composite 151.94 1.76 1.16Local pure stand 75652.54 25180.98 33.29Local/G.nuts 4661.54 3157.58 67.74Loca/Pulses 3200.59 1878.19 58.68Local Millet 357.67 132.89 37.15Local/Sorghum 801.27 350.75 43.77Local/Other Grains 245.21 199.53 81.37Local/Root crops 33.57 7.47 22.25Other 9427.71 2308.87 24.49Total Rice 4055.87 21.35 .53Kilombera 29.56 - -Other local 3068.21 21.35 .70Faya 589.23 - -Bluebonnet 1.44 - -Mixture 282.14 - -Other 85.29 - -Blantyre A.D.D.Total Maize 99015.74 35258.62 35.61Hybrid 25739.01 13101.70 50.90Composite 992.37 514.45 51.84Local pure stand 47997.40 15507.42 32.31Local/G.nuts 2063.52 454.54 22.03Local/Pulses 12114.84 3534.99 29.18Local/Millet 396.33 246.21 62.12Local Sorghum 2978.79 403.84 13.56Local/Other Grains 2586.00 449.47 17.38Local/Root crops 118.25 - -Other 4029.24 1043.99 25.96Total Rice 1655.56 369.97 22.35Kilombera 45.92 - -Other local 1179.69 369.97 31.36Faya 10.14 - -Mixture 96.72 - -Other 323.09 - -Shire Valley A.D.D. Total Maize 30977.15 1398.10 4.51Hybrid 4506.69 1118.88 24.83Composite 4082 - -Local pure stand 24956.66 279.22 1.12Local/G.nuts 71.74 - -Local/Pulses 552.82 - -Local/Millet 361.04 - -Local/Sorghum 53.58 - -Other 433.80 - -Total Rice 947.18 41.12 4.34Kilombera 31.57 - -Other local 253.46 - -Faya 132.81 - -Bluebonnet 281.88 - -Mixture 190.53 - -Other 56.93 72.23 72.23 63

Table G.21.0. Fertilizer Applicationon Area planted with Maize and Rice for Female Headed Households byA.D.D.
A.D.D.Total Area (Hectares)
Area Fertilized
(Hectares)Percentage Fertilized
Karonga A.D.D.Total Maize 3918.58 759.68 19.39Hybrid 549.30 193.38 35.29Composite 125.77 11.29 8.98Local pure stand 2288.13 427.48 18.68Local/G.nuts 217.86 - -Local/Pulses 585.42 127.54 21.79Local/Millet 8.10 - -Local/Root crops 21.56 - -Other 122.42 - -Total Rice 1385.92 351.00 25.33Kilombera 1076.44 138.34 12.85Other local 28.62 - -Faya 106.11 47.25 44.53Other 174.75 165.51 94.71Mzuzu A.D.D.Total Maize 15207.29 7808.96 51.35Hybrid 4102.30 2977.40 72.58Local pure stand 9456.05 4482.76 47.41Local/G.nuts 441.83 - -Local/Pulses 869.79 235.24 27.05.Other 337.33 113.56 33.66Total Rice 7.44 - -Faya 7.44 - -Kasungu A.D.D.Total Maize 27081.84 11689.42 43.16Hybrid 7667.33 6088.13 79.40Loca pure stand 16743.68 4408.83 26.33Local/G.nuts 258.16 - -Loca/Pulses 580.44 365.43 62.96Other 1832.23 827.03 45.14Salima A.D.DTotal Maize 16776.76 3091.96 18.43Hybrid 3598.84 1635.88 45.46Local pure stand 11639.80 1174.89 10.09Local/G.nuts 184.13 51.34 27.88Local/Pulses 3.87 3.87 100.00Local/Millet 489.05 19.33 3.95Local/Sorghum 27.73 - -Local/Other Grains 7.28 - -Local/Root crops 7.28 - -Other 818.77 206.64 25.24
continued…
64

Table G.21.0. Fertilizer Applicationon Area planted with Maize and Rice for Female Headed Households byA.D.D.
A.D.D.Total Area (Hectares)
Area Fertilized
(Hectares)Percentage Fertilized
Total Rice 684.76 307.86 44.96Kilombera 30.42 - -Other local 23.59 11.52 48.83Faya 484.48 253.79 52.38Mixture 80.32 - -Other 65.95 42.55 64.52Lilongwe A.D.D.Total Maize 42732.23 21658.28 50.68Hybrid 9695.00 7229.69 74.57Local pure stand 22490.44 8698.62 38.68Local/G.nuts 1593.06 765.15 43.01Local/Pulses 7096.01 3546.91 49.98Local/Millet 181.34 179.50 98.96Other 1676.38 1238.40 73.79Machinga A.D.D.Total Maize 58832.86 16084.42 27.34Hybrid 12889.83 6541.83 50.75Composite 30.87 - -Local pure stand 36752.04 6671.32 18.15Local/G.nuts 2373.39 798.97 33.66Loca/Pulses 1431.22 886.47 61.94Local Millet 345.49 107.02 30.98Local/Sorghum 512.70 116.26 22.68Local/Other Grains 77.87 - -Local/Root crops 7.04 - -Other 4412.41 962.56 21.81Total Rice 1584.76 - -Kilombera 42.02 - -Other local 1002.98 - -Faya 272.47 - -Bluebonnet 43.86 - -Mixture 82.50 - -Other 140.94 - -Blantyre A.D.D.Total Maize 52568.85 14766.07 28.09Hybrid 12423.95 6054.26 48.73Composite 621.86 - -Local pure stand 28259.93 6248.52 22.11Local/G.nuts 1017.34 120.52 11.85Local/Pulses 6353.41 1375.84 21.66
continued…
65

Table G.21.0. Fertilizer Applicationon Area planted with Maize and Rice for Female Headed Households byA.D.D.
A.D.D.Total Area (Hectares)
Area Fertilized
(Hectares)Percentage Fertilized
Local/Millet 247.91 91.85 37.05Local Sorghum 1291.48 216.50 16.76Local/Other Grains 131.41 - -Local/Root crops 10.25 - -Other 2211.32 658.59 29.78Total Rice 504.58 9.19 1.82Kilombera 235.42 - -Other local 248.40 9.19 3.70Faya 8.79 - -Other 11.98 - -Shire Valley A.D.D.Total Maize 11186.48 450.07 4.02Hybrid 1321.51 344.23 26.05Local pure stand 9416.04 105.84 1.12Local/G.nuts 10.93 - -Local/Pulses 82.28 - -Local/Millet 45.24 - -Local/Sorghum 279.02 - -Other 31.46 - -Total Rice 252.61 38.77 15.35Other local 67.68 - -Bluebonnet 57.42 - -Mixture 88.74 - -Other 38.77 38.77 100.00
66

Table G.22.0. Percentage of plots in which fertilizer was applied by sex of Household Head and source of financing
A.D.D. Source of financing fertilizerTotal None used Cash Credit Combination Gift Other
All Malawi 100.0 66.4 14.6 16.0 .9 1.5 .6Male 73.4 46.2 11.7 13.4 .8 .9 .4Female 26.6 20.2 3.0 2.6 .1 .5 .1Karonga A.D.D.Total 100.0 87.8 6.8 4.9 .1 .2 .1Male 76.2 66.4 5.5 3.9 .0 .2 .1Female 23.8 21.3 1.3 1.0 .0 .0 .0Mzuzu A.D.D.Total 100.0 61.4 18.6 17.8 .7 1.2 .2Male 82.4 49.5 15.8 15.4 .6 .9 .2Female 17.6 11.9 2.8 2.5 .1 .4 .0Kasungu A.D.D.Total 100.0 55.9 19.2 19.9 1.4 2.0 1.4Male 81.6 43.1 16.7 17.7 1.4 1.6 1.2Female 18.4 12.8 2.6 2.3 .0 .5 .2Salima A.D.D.Total 100.0 76.7 7.2 12.3 .4 2.4 1.1Male 71.7 53.4 5.5 10.1 .4 1.5 .9Female 28.3 23.3 1.7 2.2 .0 .9 .2Lilongwe A.D.D.Total 100.0 47.4 18.0 30.8 2.0 1.4 .5Male 77.8 34.2 14.2 26.4 1.7 .9 .4Female 22.2 13.2 3.8 4.4 .3 .5 .1Machinga A.D.D.Total 100.0 68.9 16.2 12.6 .6 1.2 .5Male 68.7 44.2 12.8 10.3 .3 .6 .3Female 31.3 24.7 3.4 2.3 .1 .6 .2Blantyre A.D.D.Total 100.0 74.8 12.6 9.9 .6 1.8 .3Male 63.0 45.5 8.8 7.1 .3 1.2 .1Female 37.0 29.3 3.7 2.8 .3 .7 .2Shire Valley A.D.D.Total 100.0 97.8 05 1.5 .0 .0 .1Male 74.2 72.7 .4 1.0 .0 .0 .1Female 25.8 25.1 .1 .6 .0 .0 .0
67

Table G23.0. Cropping pattern by A.D.D. (Thousand Hectares)
CropAll Malawi
Karonga A.D.D.
Mzuzu A.D.D.
Kasungu A.D.D.
Salima A.D.D.
Lilongwe A.D.D.
Machinga A.D.D.
Blantyre A.D.D.
Shire Valley A.D.D.
Total Maize 91280 17.72 86.38 159.76 61.33 194.20 199.68 151.55 42.8
Hybrid 273.51 4.25 30.77 58.64 18.48 58.19 59.20 38.15 5.83Composite 2.47 .23 .41 - - - .18 1.61 .04Local pure stand 498.52 9.21 47.73 88.26 37.12 93.16 112.41 76.25 34.38Local/G.nuts 20.35 .87 2.03 1.70 .71 4.84 7.04 3.08 .08Local/pulses 59.65 2.35 3.46 1.61 .19 28.31 4.63 18.47 .63Local/Millet 3.6 .02 - - .92 .92 .69 .64 .41Local/Sorghum 6.03 - - .08 .03 - 1.31 4.27 .34Local/Other grains 3.27 - - - .01 .22 .33 2.71 - Local/Root crops 0.44 .21 .04 - .01 - .05 .13 -Other 44.96 .58 1.94 9.47 3.86 8.56 13.84 6.24 .47
Total G/nuts 58.18 1.36 6.31 20.20 4.28 12.61 9.54 3.53 .35
Chalimbana 39.77 .55 3.01 15.01 2.28 9.32 6.91 2.64 .05Manipinta 2.08 .28 0.05 .46 .39 .40 .35 .15 -Malimba 3.84 .20 .19 1.75 .12 .79 .47 .11 .21Chitembana 0.09 .00 .04 - - .02 .03 - -Mawanga 1.18 .01 - .13 .99 - - .05 -Other Local variety 7.19 .32 2.09 1.50 .037 1.32 1.16 .36 .07Mixture 3.47 .00 .88 1.33 .07 .69 .34 .16 -Other/unknown 0.54 - .05 .02 .06 .07 .26 .06 .02
Total Rice 18.48 6.59 .15 .01 2.72 - 5.66 2.17 1.20
Kilombera 5.27 4.72 .12 - .03 - .08 .29 .03Other local 6.61 .21 .00 .01 .27 - 4.08 1.72 .32Faya 3.86 .94 .01 - 1.90 - .86 .02 .13Bluebonnet .59 - - - .20 - .05 - .34Mixture 1.09 .17 - - .18 - .36 .10 .28Other 1.06 .55 - - .14 - .23 .04 .10
Total Pulses 108.79 3.59 7.96 5.66 .41 43.52 10.67 35.28 1.70
Soya beans 9.96 .01 .50 2.17 .08 7.16 .03 .01 -Mixed beans 35.77 3.33 3.42 1.87 .04 20.86 3.98 2.26 .01Pegion peas 23.19 .03 - - - .12 1.86 21.09 .09White haricot 3.60 - .10 .50 - 2.15 .22 .63 -Dolichos beans 1.44 - .04 .01 - .61 .09 .69 -Other 34.83 .22 3.90 1.11 .29 12.62 4.49 10.60 1.60
continued…..
68

Table G23.0. Cropping pattern by A.D.D. (Thousand Hectares)
Crop All MalawiKaronga A.D.D.
Mzuzu A.D.D.
Kasungu A.D.D.
Salima A.D.D.
Lilongwe A.D.D.
Machinga A.D.D.
Blantyre A.D.D.
Shire Valley A.D.D.
Total Millet 21.95 .56 3.90 .34 1.67 2.76 1.58 1.23 9.91
Finger 11.13 .55 3.74 .34 1.67 2.76 .91 .90 .26Bullrush 10.44 .01 .16 - - - .51 .33 9.43Mixture 0.33 - - - - - .13 - .20Other 0.05 - - - - - .03 - .02
Total Sorghum 23.64 - - .08 .09 .04 2.85 8.23 12.35
Local 20.59 - - .08 .06 - 2.73 6.22 11.50Selected local 0.01 - - - - - - - .01Improved 0.34 - - - - - - - .34Brewing Sorghum 2.38 - - - .03 .04 .12 2.01 .18Mixture 0.19 - - - - - - - .19Qther .13 - - - - - - - .13
Cassava 29.77 6.25 4.34 .73 6.82 .46 3.38 7.71 .08Sweet potatoes 11.30 .55 .65 2.37 1.24 1.83 2.27 2.32 .07Irish potatoes .33 - - .03 - .20 - .10 -Yam .01 - - - - - - .01 -
Sunflower 12.17 - 1.62 4.63 .14 .59 .66 4.53 -Wheat 1.11 - - .01 - - - 1.10 -
Cotton 39.44 1.67 .01 .06 6.47 .05 6.05 .26 24.87
Total Tobacco 62.08 .13 .95 30.20 1.33 22.77 5.14 1.54 .02
Dark Fired 9.52 .04 .04 4.23 .02 4.46 .31 .42 -Sun/Air 1.56 .02 .03 1.26 .07 .06 - .12 -Burley 48.97 .05 .43 24.67 1.11 18.01 3.70 .98 .02Flue cured .28 - - .03 - .20 .05 - -Oriental .64 .02 .45 .01 .13 - .01 .02 -Other 1.11 - - .00 - .04 1.07 - -
69

Table G24.0. Percentage cropping pattern by A.D.D.
CropAll Malawi
Karonga A.D.D.
Mzuzu A.D.D.
Kasungu A.D.D.
Salima A.D.D.
Lilongwe A.D.D.
Machinga A.D.D.
Blantyre A.D.D.
Shire Valley A.D.D.
Total Maize 100.0 100.0 100.0 100.0 100.0 100.0 100.0 100.0 100.0
Hybrid 30 24 35.6 36.7 30.1 30.0 29.7 25.2 13.8Composite .3 1.3 .5 - - - .1 1.1 .1Local pure stand 54.6 52 55.3 55.3 60.5 48.0 56.3 50.3 81.5Local/G.nuts 2.2 4.9 2.4 1.1 1.2 2.5 3.5 2.0 .2Local/pulses 6.5 13.3 4.0 1.0 .3 14.6 2.3 12.2 1.5Local/Millet .4 .1 - - 1.5 .5 .4 .4 1.0Local/Sorghum .7 - - .1 .1 - .7 2.8 .8Local/Other grains .4 - - - .2 .1 .2 1.8 -Local/Root crops .1 1.2 .1 - .2 - .0 .1 -Other 4.9 3.3 2.3 5.9 6.3 4.4 6.9 4.1 1.1
Total G/nuts 100.0 100.0 100.0 100.0 100.0 100.0 100.0 100.0 100.0
Chalimbana 68.4 40.4 47.7 74.3 53.3 73.9 72.4 74.8 14.3Manipinta 3.6 20.6 .8 2.3 9.1 3.2 3.7 4.3 -Malimba 6.6 14.7 3.0 8.7 2.8 6.3 4.9 3.1 60.0Chitembana .2 .0 .6 - - .2 .3 - -Mawanga 2.0 .7 - .6 23.1 - - 1.4 -Other Local Variety 12.4 23.5 33.1 7.4 8.6 10.5 12.2 10.2 20.0Mixture 6.0 .0 14.0 6.6 1.6 5.5 3.6 4.5 -Other/Unknown .9 - .8 .1 1.4 .6 2.7 1.7 5.7
Total Rice 100.0 100.0 100.0 100.0 100.0 - 100.0 100.0 100.0
Kilombera 28.5 71.6 92.3 - 1.1 - 1.4 13.4 2.5Other local 35.8 3.2 .0 100.0 9.9 - 72.1 79.3 26.7Faya 20.9 14.3 7.7 - 69.9 - 15.2 .9 10.8Bluebonnet 3.2 - - - 7.4 - .9 - 28.3Mixture 5.9 2.6 - - 6.6 - 6.4 4.6 23.3Other 5.7 8.4 - - 5.2 - 4.1 1.8 8.3
Total Pulses 100 100.0 100.0 100.0 100.0 100.0 100.0 100.0 100.0
Soya beans 9.2 .3 6.3 38.3 19.5 16.5 .3 .0 -Mixed beans 32.9 92.8 43.0 33.0 9.8 47.9 37.3 6.4 .6Pegion peas 21.3 .8 - - - .3 17.4 59.8 5.3White haricot 3.3 - 1.3 8.8 - 4.9 2.1 1.8 -Dolichos beans 1.3 - .5 .2 - 1.4 .8 2.0 -Other 32 6.1 49.0 19.6 70.7 29.0 42.1 30.1 94.1
continued….
70

Table G24.0. Percentage cropping pattern by A.D.D.
Crop All MalawiKaronga A.D.D.
Mzuzu A.D.D.
Kasungu A.D.D.
SalimaA.D.D.
Lilongwe A.D.D.
Machinga A.D.D.
Blantyre A.D.D.
Shire Valley A.D.D.
Total Millet 100 100.0 100.0 100.0 100.0 100.0 100.0 100.0 100.0
Finger 50.7 98.2 95.9 100.0 100.0 100.0 57.6 73.2 2.6Bullrush 47.6 1.8 4.1 - - - 32.3 26.8 95.2Mixture 1.5 - - - - - 8.2 - 2.0Other .2 - - - - - 1.9 - .2
Total Sorghum 100.0 - - 100.0 100.0 100.0 100.0 100.0 100.0
Local 87.1 - - 100.0 66.7 - 95.8 75.6 93.1Selected local .0 - - - - - - - .1Improved 1.4 - - - - - - - 2.8Brewing Sorghum 10.1 - - - 33.3 100.0 4.2 24.4 1.5Mixture .8 - - - - - - - 1.5Qther .6 - - - - - - - 1.1
Cassava 100.0 100.0 100.0 100.0 100.0 100.0 100.0 100.0 100.0Sweet potatoes 100.0 100.0 100.0 100.0 100.0 - 100.0 100.0 100.0Irish potatoes 100.0 - - - - 100.0 - 100.0 -Yam 100.0 - - - - - - 100.0 -Mixture 100.0 - - - - - 100.0 - -Sunflower 100.0 - 100.0 100.0 100.0 100.0 100.0 100.0 -Wheat 100.0 - - 100.0 - - - 100.0 100.0Cotton 100.0 100.0 100.0 100.0 100.0 100.0 100.0 100.0 100.0
Total Tobacco 100.0 100.0 100.0 100.0 100.0 100.0 100.0. 100.0 100.0
Dark Fired 15.3 30.8 4.2 14.0 1.5 19.6 6.0 27.3 -Sun/Air 2.5 15.4 3.2 4.2 5.3 .3 - 7.8 -Burley 78.9 38.5 45.3 81.7 83.5 79.1 72.0 63.6 100.0Flue Cured .5 - - .1 - .9 1.0 - -Oriental 1.0 15.4 47.4 .0 9.8 - .2 1.3 -Other 1.8 - - .0 - .2 20.8 - -
71

Table G25.0. Cropping pattern for Male Headed Households by A.D.D. (Thousand Hectares)
Crop All MalawiKaronga A.D.D.
Mzuzu A.D.D.
Kasungu A.D.D.
SalimaA.D.D.
Lilongwe A.D.D.
Machinga A.D.D.
Blantyre A.D.D.
Shire Valley A.D.D.
Total Maize 684.53 13.79 71.18 132.68 44.57 151.48 140.84 99.00 30.99
Hybrid 221.3 3.70 26.68 50.98 14.89 48.50 46.31 25.73 4.51Composite 1.69 .10 .41 - - - .15 .99 .04Local pure stand 361.46 6.92 38.26 71.51 25.49 70.67 75.66 47.99 24.96Local/G.nuts 14.25 .65 1.59 1.44 .53 3.25 4.66 2.06 .07Local/pulses 42.65 1.76 2.59 1.03 .19 21.21 3.20 12.12 .55Local/Millet 2.29 .01 - - .43 .74 .35 .40 .36Local/Sorghum 3.91 - - .08 - - .79 2.98 .06Local/Other grains 3.05 - - - - .22 .25 2.58 -Local/Root crops .39 .19 .04 - .00 - .04 .12 -Other 33.54 .46 1.61 7.64 3.04 6.89 9.43 4.03 .44
Total G/nuts 43.64 .98 4.88 15.89 3.23 9.26 6.79 2.30 .31
Chalimbana 30.54 .43 2.50 12.15 1.64 7.02 5.15 1.60 .05Manipinta 1.50 .20 .05 .25 .29 .25 .31 .15 -Malimba 2.58 .12 .16 1.04 .09 .52 .36 .09 .20Mawanga 1.11 .01 - .13 .92 - - .05 -Chitembana 0.07 .00 .02 - - .02 .03 - -Other Local Variety 4.80 .23 1.31 1.27 .18 .89 .67 .19 .06Mixture 2.84 .00 .79 1.03 .05 .54 .27 .16 -Other/Unknown 0.21 .00 .05 .02 .06 .02 - .06 -
Total Rice 14.03 5.19 .12 .01 2.04 - 4.06 1.67 .94
Kilombera 3.87 3.64 .12 - .00 - .03 .05 .03Other local 5.24 .18 .00 .01 .25 - 3.07 1.48 .25Faya 2.98 .83 - - 1.42 - .59 .01 .13Bluebonnet .48 - - - .20 - .00 - .28Mixture .84 .17 - - .10 - .28 .10 .19Other .62 .57 - - .07 - .09 .03 .06
Total Pulses 78.23 2.88 6.76 4.40 .31 33.21 6.61 22.70 1.36
Soya beans 7.97 .01 .49 1.90 .04 5.50 .02 .01 -Mixed beans 26.15 2.68 2.59 1.21 - 16.01 1.70 1.95 .01Pegion peas 15.17 .03 - - - .12 1.56 13.37 .09White haricot 2.75 - .08 .50 - 1.57 .06 .54 -Dolichos beans 1.26 - .04 .01 - .55 .07 .59 -Other 24.93 .16 3.56 .78 .27 9.46 3.20 6.24 1.26
continued….
72

Table G25.0. Cropping pattern for Male Headed Households by A.D.D. (Thousand Hectares)
Crop All MalawiKaronga A.D.D.
Mzuzu A.D.D.
Kasungu A.D.D.
SalimaA.D.D.
Lilongwe A.D.D.
Machinga A.D.D.
Blantyre A.D.D.
Shire Valley A.D.D.
Total Millet 16.77 .46 3.53 .30 .98 2.11 .94 .68 7.77
Finger 8.37 .46 3.40 .30 .98 2.11 .51 .44 .17Bullrush 8.19 - .13 - - - .27 .24 7.55Mixture .16 - - - - - .13 - .03Other .05 - - - - - .03 - .02
Total Sorghum 17.73 - - .08 .03 .04 1.89 6.07 9.62
Local 15.73 - - .08 - - 1.88 4.59 9.18Selected local .01 - - - - - - - .01Improved .19 - - - - - - - .19Brewing Sorghum 1.61 - - - .03 .04 .01 1.48 .05Mixture .10 - - - - - - - .10Qther .09 - - - - - - - .09
Wheat .98 - - .01 - - - .97 -Sunflower 11.28 - 1.38 4.31 .13 .59 .58 4.29 -Cassava 22.09 4.88 3.49 .66 4.75 .44 2.62 5.17 0.08Sweet potatoes 8.65 .48 .46 1.76 1.15 1.59 1.58 1.59 .04Irish potatoes .28 - - .03 - .17 - .08 -Yam .02 - - - - - .01 .01 -
Cotton 32.18 1.54 .01 .06 5.54 .05 4.75 .25 19.98
Total Tobacco 56.16 .12 .94 26.86 1.29 20.79 4.61 1.54 .01
Dark Fired 8.66 .04 .04 3.72 .02 4.11 .31 .42 -Sun/Air 1.46 .02 .03 1.16 .07 .06 - .12 -Burley 44.06 .05 .43 21.94 1.07 16.41 3.17 .98 .01Flue Cured .25 - - .03 - .17 .05 - -Oriental .62 .01 .44 .01 .13 - .01 .02 -Other 1.11 - - .00 - .04 1.07 - -
73

TABLE G26.0. Cropping pattern for Female Headed Households by A.D.D. (Thousand Hectares)
Crop All MalawiKaronga A.D.D.
Mzuzu A.D.D.
Kasungu A.D.D.
Salima A.D.D.
Lilongwe A.D.D.
Machinga A.D.D.
Blantyre A.D.D.
Shire Valley A.D.D.
Total Maize 228.27 3.92 15.20 27.08 16.77 42.72 58.84 52.55 11.19
Hybrid 52.22 .55 4.09 7.66 3.6 9.69 12.89 12.42 1.32Composite .78 .13 - - -. - .03 .62 -Local pure stand 137.06 2.29 9.47 16.75 11.63 22.49 36.75 28.26 9.42Local/G.nuts 6.10 .22 .44 .26 .18 1.59 2.38 1.02 .01Local/pulses 17.00 .59 .87 .58 .00 7.10 1.43 6.35 .08Local/Millet 1.31 .01 - - .49 .18 .34 .24 .05Local/Sorghum 2.12 - - - .03 - .52 1.29 .28Local/Other grains .22 - - - .01 - .08 .13 -Local/Root crops .05 .02 - - .01 - .01 .01 -Other 11.42 .12 .33 1.83 .82 1.67 4.41 2.21 .03
Total G/nuts 14.54 .38 1.43 4.31 1.05 3.35 2.75 1.23 .04
Chalimbana 9.23 .12 .51 2.86 .64 2.30 1.76 1.04 -Manipinta 1.26 .08 .03 .71 .03 .27 .11 .02 .01Malimba 0.58 .08 - .21 .10 .15 .04 - -Mawanga .07 - - - .07 - - - -Chitembana .02 - .02 - - - - - -Other Local Variety 2.39 .09 .78 .23 .19 .43 .49 .17 .01Mixture .63 - .09 .30 .02 .15 .07 - -Other/Unknown .33 - - - .00 .05 .26 - .02
Total Rice 4.45 1.40 .01 - .68 - 1.60 .50 .26
Kilombera 1.40 1.08 - - .03 - .05 .24 -Other local 1.37 .03 - - .02 - 1.01 .24 .07Faya .88 .11 .01 - .48 - .27 .01 -Bluebonnet .11 - - - - - .05 - .06Mixture .25 - - - .08 - .08 - .09Other .44 .18 - - .07 - .14 .01 .04
Total Pulses 30.56 .71 1.20 1.26 .10 10.31 4.06 12.58 .34
Soya beans 1.99 - .01 .27 .04 1.66 .01 .00 -Mixed beans 9.62 .65 .83 .66 .04 4.85 2.28 .31 .00Pegion peas 8.02 - - - - - .30 7.26 -White haricot .85 - .02 - - .58 .16 .09 -Dolichos beans .18 - - - - .06 .02 .10 -Other 9.90 .06 .34 .33 .02 3.16 1.29 4.36 .34
continued…
74

TABLE G26.0.Cropping pattern for Female Headed Households by A.D.D. (Thousand Hectares)
Crop All MalawiKaronga A.D.D.
Mzuzu A.D.D.
Kasungu A.D.D.
SalimaA.D.D.
Lilongwe A.D.D.
Machinga A.D.D.
Blantyre A.D.D.
Shire Valley A.D.D.
Total Millet 5.18 .10 .37 .04 .69 .65 .64 .55 2.14
Finger 2.76 .09 .34 .04 .69 .65 .40 .46 .09Bullrush 2.25 .01 .03 - - - .24 .09 1.88Mixture 0.17 - - - - - - - .17
Total Sorghum 5.91 - - - .06 - .96 2.16 2.73
Local 4.86 - - - .06 - .85 1.63 2.32Improved .15 - - - - - - - .15Brewing Sorghum .77 - - - - - .11 .53 .13Mixture .09 - - - - - - - .09Local .04 - - - - - - - .04
Wheat .13 - - - - - - .13 -Sunflower .89 - .24 .32 .01 - .08 .24 -Cassava 7.68 1.37 .85 .07 2.07 .02 .76 2.54 -Sweet Potatoes 2.65 .07 .19 .61 .09 .24 .69 .73 .03Irish Potatoes .05 - - .00 - .03 - .02 -
Cotton 7.26 .13 - - .93 - 1.30 .01 4.89Total Tobacco 5.91 .01 .01 3.34 .03 1.99 .53 - .00
Oriental .02 01 .01 - - - - - -Flue-cured .03 - - - - .03 - - -Dark-fired .86 - - .51 - .35 - - -Sun/Air .11 - - .11 - - - - -Burley 4.90 - - 2.73 .03 1.61 .53 - .00
75

TABLE 27.0. Production for selected crops by A.D.D. (Thousand Tonnes)
CropAll Malawi
Karonga A.D.D.
Mzuzu A.D.D.
Kasungu A.D.D.
SalimaA.D.D.
Lilongwe A.D.D.
Machinga A.D.D.
Blantyre A.D.D.
Shire Valley A.D.D.
Total Maize 1431.30 29.66 162.41 294.70 87.19 339.50 274.38 181.04 62.42
Hybrid 601.23 9.06 78.37 152.55 34.99 145.35 110.10 60.73 10.08Composite 3.83 .36 .73 - - - .49 2.16 .09Local pure stand 701.64 14.34 74.61 138.17 49.43 136.73 146.21 90.68 51.47Local/G.nuts 23.16 .79 1.26 1.71 1.02 5.94 9.07 3.37 .00Local/pulses 97.33 5.07 7.44 2.27 .97 50.04 7.90 23.12 .52Local/Millet 4.11 .04 - - .78 1.44 .61 .98 .26Local/Sorghum .00 - - .00 .00 - .00 .00 .00Local/Other grains .00 - - - .00 .00 .00 .00 -Local/Root crops .00 .00 .00 - .00 - .00 .00 -Other .00 .00 .00 .00 .00 .00 .00 .00 .00
Total G/nuts 34.29 .45 2.46 14.54 2.91 9.09 2.95 1.77 .12
Chalimbana 23.14 .15 .88 9.83 1.24 7.17 2.24 1.60 .03Manipinta 1.19 .12 .02 .50 .25 .23 .03 .04 -Malimba 3.67 .13 .08 2.58 .05 .63 .14 .04 .02Chitembana .01 - .00 - - .01 - - -Mawanga 1.09 .00 - .11 .98 - - .00 -Other local variety 3.50 .05 1.21 .75 .31 .57 .46 .09 .06Mixture 1.58 .00 .26 .75 .06 .43 .08 .00 -Other/unknown .11 - .01 .02 .02 .05 .00 .00 .01
Total Rice 43.70 20.81 .32 .00 8.29 - 10.47 2.28 1.53
Kilombera 15.97 14.49 .32 - .02 - .16 .86 .12Other local 11.10 .41 .00 .00 .62 - 8.30 1.22 .55Faya 10.53 3.46 .00 - 6.22 - .71 .01 .13Bluebonnet .92 - - - .54 - .12 - .26Mixture 2.06 .65 - - .59 - .61 .15 .06Other 3.12 1.80 - - .30 - .57 .04 .41
Total Pulses 49.72 3.56 2.95 3.30 .49 18.80 10.75 8.64 1.23
Soya beans 7.88 .00 1.37 2.12 .09 4.50 .00 .00 -Mixed beans 19.27 3.37 1.56 .49 .03 8.28 2.98 2.56 .00Pegion peas 3.51 .00 - - - .00 .32 3.19 .00White haricot 1.41 - .01 .15 - 1.15 .07 .03 -Dorichos beans .57 - .01 .01 - .26 .04 .25 -Other 17.08 .19 .20 .53 .37 4.61 7.34 2.61 1.23
continued…
76
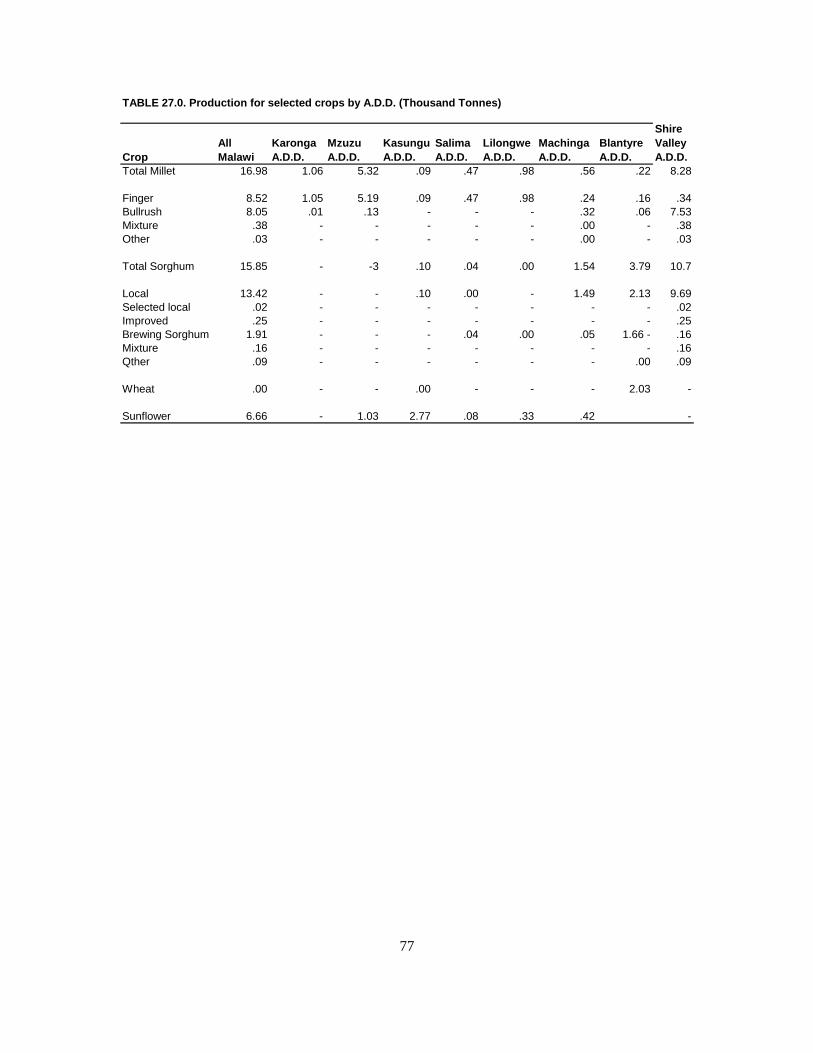
TABLE 27.0. Production for selected crops by A.D.D. (Thousand Tonnes)
CropAll Malawi
Karonga A.D.D.
Mzuzu A.D.D.
Kasungu A.D.D.
Salima A.D.D.
Lilongwe A.D.D.
Machinga A.D.D.
Blantyre A.D.D.
Shire Valley A.D.D.
Total Millet 16.98 1.06 5.32 .09 .47 .98 .56 .22 8.28
Finger 8.52 1.05 5.19 .09 .47 .98 .24 .16 .34Bullrush 8.05 .01 .13 - - - .32 .06 7.53Mixture .38 - - - - - .00 - .38Other .03 - - - - - .00 - .03
Total Sorghum 15.85 - -3 .10 .04 .00 1.54 3.79 10.7
Local 13.42 - - .10 .00 - 1.49 2.13 9.69Selected local .02 - - - - - - - .02Improved .25 - - - - - - - .25Brewing Sorghum 1.91 - - - .04 .00 .05 1.66 - .16Mixture .16 - - - - - - - .16Qther .09 - - - - - - .00 .09
Wheat .00 - - .00 - - - 2.03 -
Sunflower 6.66 - 1.03 2.77 .08 .33 .42 -
77
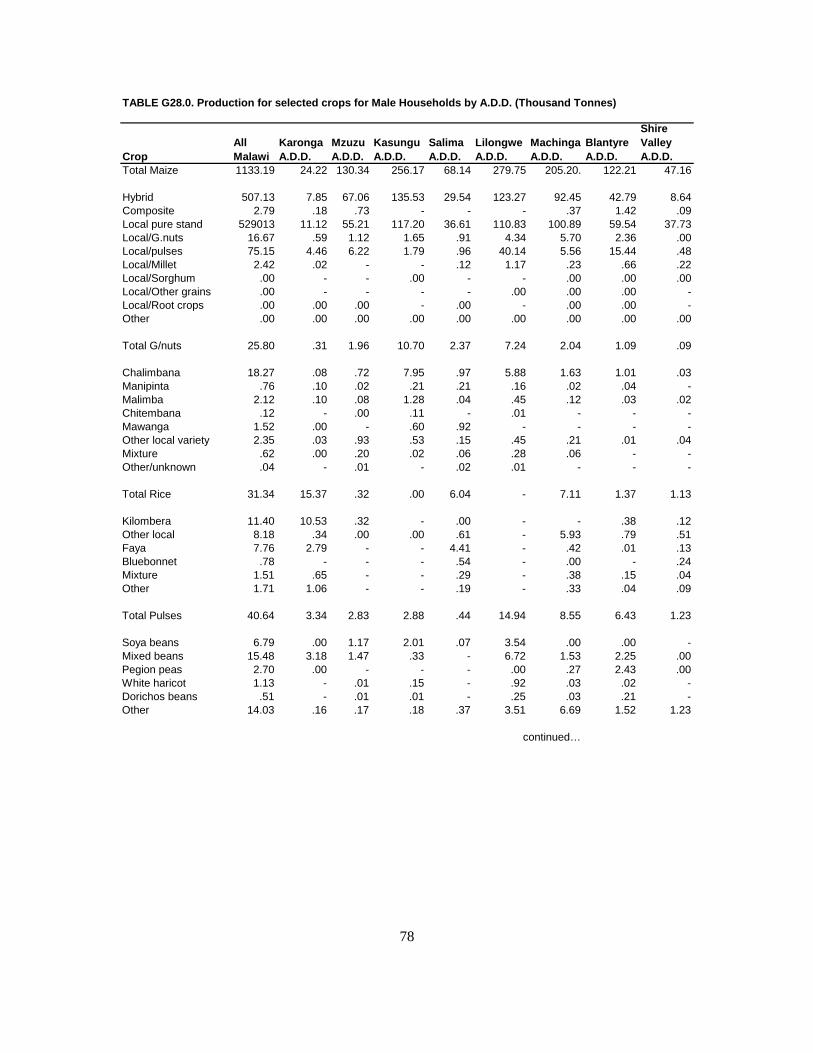
TABLE G28.0. Production for selected crops for Male Households by A.D.D. (Thousand Tonnes)
CropAll Malawi
Karonga A.D.D.
Mzuzu A.D.D.
Kasungu A.D.D.
Salima A.D.D.
Lilongwe A.D.D.
Machinga A.D.D.
Blantyre A.D.D.
Shire Valley A.D.D.
Total Maize 1133.19 24.22 130.34 256.17 68.14 279.75 205.20. 122.21 47.16
Hybrid 507.13 7.85 67.06 135.53 29.54 123.27 92.45 42.79 8.64Composite 2.79 .18 .73 - - - .37 1.42 .09Local pure stand 529013 11.12 55.21 117.20 36.61 110.83 100.89 59.54 37.73Local/G.nuts 16.67 .59 1.12 1.65 .91 4.34 5.70 2.36 .00Local/pulses 75.15 4.46 6.22 1.79 .96 40.14 5.56 15.44 .48Local/Millet 2.42 .02 - - .12 1.17 .23 .66 .22Local/Sorghum .00 - - .00 - - .00 .00 .00Local/Other grains .00 - - - - .00 .00 .00 -Local/Root crops .00 .00 .00 - .00 - .00 .00 -Other .00 .00 .00 .00 .00 .00 .00 .00 .00
Total G/nuts 25.80 .31 1.96 10.70 2.37 7.24 2.04 1.09 .09
Chalimbana 18.27 .08 .72 7.95 .97 5.88 1.63 1.01 .03Manipinta .76 .10 .02 .21 .21 .16 .02 .04 -Malimba 2.12 .10 .08 1.28 .04 .45 .12 .03 .02Chitembana .12 - .00 .11 - .01 - - -Mawanga 1.52 .00 - .60 .92 - - - -Other local variety 2.35 .03 .93 .53 .15 .45 .21 .01 .04Mixture .62 .00 .20 .02 .06 .28 .06 - -Other/unknown .04 - .01 - .02 .01 - - -
Total Rice 31.34 15.37 .32 .00 6.04 - 7.11 1.37 1.13
Kilombera 11.40 10.53 .32 - .00 - - .38 .12Other local 8.18 .34 .00 .00 .61 - 5.93 .79 .51Faya 7.76 2.79 - - 4.41 - .42 .01 .13Bluebonnet .78 - - - .54 - .00 - .24Mixture 1.51 .65 - - .29 - .38 .15 .04Other 1.71 1.06 - - .19 - .33 .04 .09
Total Pulses 40.64 3.34 2.83 2.88 .44 14.94 8.55 6.43 1.23
Soya beans 6.79 .00 1.17 2.01 .07 3.54 .00 .00 -Mixed beans 15.48 3.18 1.47 .33 - 6.72 1.53 2.25 .00Pegion peas 2.70 .00 - - - .00 .27 2.43 .00White haricot 1.13 - .01 .15 - .92 .03 .02 -Dorichos beans .51 - .01 .01 - .25 .03 .21 -Other 14.03 .16 .17 .18 .37 3.51 6.69 1.52 1.23
continued…
78

TABLE G28.0. Production for selected crops for Male Households by A.D.D. (Thousand Tonnes)
CropAll Malawi
Karonga A.D.D.
Mzuzu A.D.D.
Kasungu A.D.D.
Salima A.D.D.
Lilongwe A.D.D.
Machinga A.D.D.
Blantyre A.D.D.
Shire Valley A.D.D.
Total Millet 13.23 .58 5.16 .08 .16 .82 .38 .13 5.92
Finger 7.22 .58 5.06 .08 .16 .82 .20 .09 .23Bullrush 5.94 - .10 - - - .08 .04 5.62Mixture .04 - - - - - .00 - .04Other .03 - - - - - .00 - .03
Total Sorghum 11.95 - - .10 .04 .00 .88 3.11 7.82
Local 10.32 - - .10 - - .88 1.80 7.54Selected local .02 - - - - - - - .02Improved .11 - - - - - - - .11Brewing Sorghum 1.39 - - - .04 .00 .00 1.31 .04Mixture .06 - - - - - - - .06Qther .05 - - - - - - - .05
Wheat .00 - - .00 - - - .00 -
Sunflower 6.27 - .89 2.60 .08 .33 .37 2.00 -
79

TABLE G29.0. Production for selected crops for Female HeadedHouseholds by A.D.D. (Thousand Tonnes)
CropAll Malawi
Karonga A.D.D.
Mzuzu A.D.D.
Kasungu A.D.D.
Salima A.D.D.
Lilongwe A.D.D.
Machinga A.D.D.
Blantyre A.D.D.
Shire Valley A.D.D.
Total Maize 298.11 5.44 32.07 38.53 19.50 59.75 69.18 58.83 15.26
Hybrid 94.11 1.21 11.31 17.03 5.45 22.08 17.65 17.94 1.44Composite 1.04 .18 - - - - .12 .74 -Local pure stand 172.51 3.22 19.40 20.97 12.82 25.90 45.32 31.14 13.74Local/G.nuts 6.49 .20 .14 .06 .11 1.60 3.37 1.01 .00Local/pulses 22.27 .61 1.22 .47 .01 9.90 2.34 7.68 .04Local/Millet 1.69 .02 - - .66 .27 .38 .32 .04Local/Sorghum .00 - - - .00 - .00 .00 .00Local/Other grains .00 - - - .00 - .00 .00 -Local/Root crops .00 .00 - .00 .00 - .00 .00 -Other .00 .00 .00 .00 .00 .00 .00 .00 .00
Total G/nuts 8.49 .14 .50 3.84 .54 1.85 .91 .68 .03
Chalimbana 4.87 .07 .16 1.88 .27 1.29 .61 .59 -Manipinta .43 .02 - .29 .04 .07 .01 - -Malimba 1.55 .03 .00 1.30 .01 .18 .02 .01 .00Chitembana - - - - - - - - -Mawanga .06 - - - .06 - - - -Other local variety 1.08 .02 .28 .15 .16 .12 .25 .08 .02Mixture .45 - .06 .22 .00 .15 .02 - -Other/unknown 0.05 - - - .00 .04 - - .01
Total Rice 12.37 5.44 .00 - 2.25 - 3.36 .91 .40
Kilombera 4.57 3.96 - - .02 - .11 .48 -Other local 2.92 .07 - - .01 - 2.37 .43 .04Faya 2.77 .67 .00 - 1.81 - .29 .00 -Bluebonnet .14 - - - - - .12 - .02Mixture .55 - - - .30 - .23 - .02Other 1.41 .74 - - .11 - .24 .00 .32
Total Pulses 9.08 .22 .12 .42 .05 3.86 2.20 2.21 .00
Soya beans 1.09 - .00 .11 .02 .96 .00 .00 -Mixed beans 3.79 .19 .09 .16 .03 1.56 1.45 .31 .00Pegion peas .81 - - - - - .05 .76 -White haricot .28 - .00 - - .23 .04 .01 -Dorichos beans .06 - - - - .01 .01 .04 -Other 3.05 .03 .03 .15 .00 1.10 .65 1.09 .00
80

TABLE G29.0. Production for selected crops for Female Headed Households by A.D.D. (Thousand Tonnes)
CropAll Malawi
Karonga A.D.D.
Mzuzu A.D.D.
Kasungu A.D.D.
Salima A.D.D.
Lilongwe A.D.D.
Machinga A.D.D.
Blantyre A.D.D.
Shire Valley A.D.D.
Total Millet 3.75 .48 .16 .01 .31 .16 .18 .09 2.36
Finger 1.30 .47 .13 .01 .31 .16 .04 .07 .11Bullrush 2.11 .01 .03 - - - .14 .02 1.91Mixture .34 - - - - - - - .34
Total Sorghum 3.89 - - - .00 - .66 .68 2.55
Local 3.09 - - - .00 - .61 .33 2.15Improved .14 - - - - - - - .14Brewing Sorghum .52 - - - - - .05 .35 .12Mixture .10 - - - - - - - .10Qther .04 - - - - - - - .04
Wheat .00 - - - - - - .00 -
Sunflower .39 - .14 .17 .00 .00 .05 .03 -
81

TABLE G30.0. Mean yield for selected crops by A.D.D. (Kilograms/Hectare)
CropAll Malawi
Karonga A.D.D.
Mzuzu A.D.D.
Kasungu A.D.D.
Salima A.D.D.
Lilongwe A.D.D.
Machinga A.D.D.
Blantyre A.D.D.
Shire Valley A.D.D.
Total Maize 1568.03 1673.81 1880.18 1844.64 1421.65 1748.20 1374.00 1194.59 1479.85
Hybrid 2198.20 2131.76 2546.96 2601.47 1892.86 2497.85 1859.80 1591.87 1728.99Composite 1550.61 1565.22 1780.49 - - - 2722.22 1341.61 2250.00Local pure stand 1407.45 1557.00 1563.63 1565.49 1353.45 1467.69 1300.68 1189.25 1497.09Local/G.nuts 1138.08 908.05 620.69 1005.88 1436.62 1227.27 1288.35 1094.16 .00Local/pulses 1631.68 2157.45 2150.29 1409.94 5105.26 1767.57 1706.26 1251.76 825.40Local/Millet 1141.67 2000.00 - - 847.83 1565.22 884.06 1531.25 634.15Local/Sorghum .00 - - .00 .00 .00 - .00 .00Local/Other grains .00 .00 .00 .00 .00 .00 - .00 -Local/Root crops .00 .00 .00 .00 .00 - - .00 .00Other .00 - - .00 .00 - - .00 -
Total G/nuts 589.38 330.88 389.86 719.80 679.91 720.86 309.22 501.42 342.86
Chalimbana 581.85 272.73 292.36 654.90 543.86 769.31 324.17 606.06 600.00Manipinta 572.12 428.57 400.00 1086.96 641.03 575.00 85.71 266.67 -Malimba 955.73 650.00 421.05 1474.29 416.67 797.47 297.87 363.64 95.24Chitembana 111.11 - .00 - - 500.00 - - -Mawanga 923.73 .00 - 846.15 989.90 - - .00 -Other local variety 486.79 156.25 578.95 500.00 837.84 431.82 396.55 250.00 857.14Mixture 455.55 .00 295.45 563.91 857.14 623.19 235.29 .00 -Other/unknown 203.70 - 200.00 1000.00 333.33 714.29 .00 .00 500.00
Total Rice 2364.72 3157.81 2461.54 .00 3047.79 - 1849.82 1050.59 1275.00
Kilombera 3030.36 3069.92 2666.67 - 666.67 - 2000.00 2965.52 4000.00Other local 1679.27 1952.38 .00 .00 2296.30 - 2034.31 709.30 1718.75Faya 2727.98 3680.85 .00 - 3273.68 - 825.58 500.00 1000.00Bluebonnet 1559.42 - - - 2700.00 - 2400.00 - 764.71Mixture 1889.91 3823.53 - - 3277.78 - 1694.44 1500.00 214.29Other 2943.40 3272.73 - - 2142.86 - 2478 1000.00 4100.00
Total Pulses 457.03 991.64 370.60 583.04 1195.12 431.99 244.90 723.53
Soya beans 791.16 .00 2340.00 976.96 1125.00 628.49 .00 -Mixed beans 538.72 1012.01 456.14 262.03 750.00 396.93 1132.74 .00Pegion peas 151.36 .00 - - - .00 151.26 .00White haricot 391.67 - 100.00 300.00 - 534.88 47.62 -Dorichos beans 395.83 - 250.00 1000.00 - 426.23 362.32 -Other 490.38 863.64 51.28 477.48 1275.86 365.29 246.23 768.75
82

TABLE G30.0. Mean yield for Selected Crops by A.D.D. (kilograms/Hectare)
CropAll Malawi
Karonga A.D.D.
Mzuzu A.D.D.
Kasungu A.D.D.
Salima A.D.D.
Lilongwe A.D.D.
Machinga A.D.D.
Blantyre A.D.D.
Shire valley A.D.D.
Total millet 773.58 1892.86 1364.10 264.71 281.44 355.07 354.43 178.86 835.52
Finger 765.50 1909.09 1387.70 264.71 281.44 355.07 263.74 177.78 1307.69bullrush 771.07 1000.00 812.50 - - - 627.45 181.82 798.52Mixture 1151.52 - - - - - 0.00 - 1900.00Other 600.00 - - - - - 0.00 - 1500.00
Total sorghum 670.47 - - 1250.00 444.44 0.00 540.35 460.51 839.68
Local 651.77 - - 1250.00 0.00 - 545.79 342.44 842.61Selected Local 2000.00 - - - - - - - 2000.00imroved 735.29 - - - - -0.00 - - 735.29Brewing sorghum 802.52 - - - 1333.33 - 416.67 825.87 888.89Mixture 842.11 - - - - - - - 842.11Other 692.31 - - - - - - - 692.31
Wheat 0.00 - - 0.00 - - - 0.00 -
Sunflower 547.25 - 635.80 598.27 571.43 559.32 636.36 448.12 -
83

TABLE G31.0. Mean yield for selected crops for Male households by A.D.D. (kilograms/Hectare)
CROPALL MALAWI
KARONGA A.D.D.
MZUZU A.D.D.
KASUNGU A.D.D.
SALIMA A.D.D.
LILONGWE A.D.D.
MACHINGA A.D.D.
BLANTYRE A.D.D.
SHIRE VALLEY A.D.D.
Total maize 1655.43 1756.35 1831.13 1930.74 1528.83 1846.78 1456.97 1234.44 1521.78Hybrid 2291.60 2121.62 2513.49 2658.49 1983.88 2541.65 1996.33 1663.04 1915.74Composite 1650.89 1800.00 1780.49 - - - 2466.67 1434.34 2250.00Local pure stand 1463.87 1606.94 1443.02 1638.93 1436.25 1568.28 1333.47 1240.68 1511.62Local /G-nuts 1169.82 907.69 704.40 1145.83 1716.98 1335.38 1223.18 1145.63 0.00Local /pulses 1762.82 2534.09 2401.54 1737.86 5052.63 1892.50 1737.50 1273.93 872.73Local /millet 1056.77 2000.00 - - 279.07 1581.08 657.14 1650.00 611.11Local /sorghum 0.00 - - 0.00 - - 0.00 0.00 0.00Local /other grains 0.00 - - - - 0.00 0.00 0.00 -Local /root crops 0.00 0.00 0.00 - 0.00 - 0.00 0.00 -Other 0.00 0.00 0.00 0.00 0.00 0.00 0.00 0.00 0.00
Total G /nuts 591.20 316.33 401.64 673.38 733.75 781.86 300.44 473.91 290.32Chalimbana 598.23 186.05 288.00 654.32 591.46 837.61 316.50 631.25 600.00Manipinta 505.67 500.00 400.00 840.00 724.14 640.00 64.52 266.67 -Malimba 821.71 833.33 500.00 1230.77 444.44 865.38 333.33 333.33 100.00Chitembana 1714.29 0.00 0.00 - - 500.00 - - -Mawanga 1369.37 0.00 - 4615.38 1000.00 - - 0.00 -Other local variety 489.58 130.43 709.92 417.32 833.33 505.62 313.43 52.63 666.67Mixture 218.31 0.00 253.16 19.42 1200.00 518.52 222.22 0.00 -Other /unknown 190.48 - 200.00 1000.00 333.33 500.00 - 0.00 -
Total rice 2233.78 2961.46 2666.67 0.00 2960.78 - 1751.23 820.36 1202.13Kilombera 2945.74 2892.86 2666.67 - 0.00 - 0.00 7600.00 4000.00Other local 1561.07 1888.89 0.00 0.00 04440.00 - 1931.60 533.78 2040.00Faya 2604.03 3361.45 - - 3105.63 - 711.86 1000.00 1000.00Bluebonnet 1625.00 - - - 2700.00 - - - 857.14Mixture 1797.62 3823.53 - - 2900.00 - 1357.14 1500.00 210.53Other 2758.06 2864.86 - - 2714.29 - 3666.67 1333.33 1500.00
Total pulses 519.49 1159.72 418.64 654.55 1419.35 449.86 1293.49 283.26 904.41Soya beans 851.94 0.00 2387.76 1057.89 1750.00 643.64 - 0.00 -Mixed beans 591.97 1186.57 567.57 272.73 - 419.74 900.00 1153.85 0.00Pegion peas 177.98 0.00 - - - 0.00 173.08 181.75 0.00White haricot 410.91 - 125.00 300.00 - 585.99 500.00 37.04 -Dolichos beans 404.76 - 250.00 1000.00 - 454.55 428.97 355.93 -Other 562.78 1000.00 47.75 487.18 1370.37 371.04 2090.63 243.59 976.19
continued...
84

TABLE G31.0. Mean yield for selected Crops for Male Households by A.D.D.(kilograms/Hectare)
CROPALL MALAWI
KARONGA A.D.D.
MZUZU A.D.D.
KASUNGU A.D.D.
SALIMA A.D.D.
LILONGWE A.D.D.
MACHINGA A.D.D.
BLANTYRE A.D.D.
SHIRE VALLEY A.D.D.
Total millet 788.91 1260.87 1461.76 266.67 163.27 388.63 404.26 191.18 761.9Finger 862.60 1260.87 1488.24 266.67 163.27 388.63 392.16 204.55 1352.94Bullrush 725.27 - 769.23 - - - 296.30 166.67 744.37Mixture 250.00 - - - - - .00 - 1333.33Other 600.00 - - - - - .00 - 1500.00
Total sorghum 600.00 - - 1250.00 1333.33 .00 465.61 512.36 812.89Local 656.07 - - 1250.00 - - 468.09 392.16 821.35Selected local 2000.00 - - - - - - - 2000.00Improved 578.95 - - - - - - - 578.95Brewing sorghum 863.35 - - - 1333.33 .00 .00 885.14 800.00Mixture 600.00 - - - - - - - 600.00Other 555.56 - - - - - - - 555.56Wheat .00 - - .00 - - - .00 -Sunflower 555.85 - 644.93 603.25 615.38 559.32 637.93 466.20 -
85

TABLE G32.0 Mean yield for Selected Crops for Male Headed Households by A.D.D. (Kilograms/Hectare)
CROPALL
MALAWI KARONGA MZUZU KASUNGU SALIMA LILONGWE MACHINGA BLANTYRESHIRE VALLEY
A.D.D. A.D.D. A.D.D. A.D.D. A.D.D. A.D.D. A.D.D. A.D.D.Total maize 1306.00 1387.76 2109.87 1422.82 1135.96 1398.64 1175.73 1119.51 1363.72
Hybrid 1802.18 2200.00 2765.28 2223.24 1513.89 2278.64 1369.28 1444.44 1090.91Composite 1333.33 1384.62 - - - - 4000.00 1193.55 -Local pure stand 1258.65 1406.11 2048.57 1251.94 1102.32 1151.62 1233.20 1101.91 1458.60Local /G-nuts 1063.93 909.09 318.18 230.77 611.11 1006.29 1415.97 990.20 .00Local /pulses 1310.00 1033.90 1402.30 810.34 .00 1394.37 1636.36 1209.45 .00Local /millet 1290.08 2000.00 - - 1346.94 1500.00 1117.65 1333.33 800.00Local /sorghum .00 - - - .00 - - .00 .00Local /other grains .00 - - - .00 - - .00 -Local /root crops .00 .00 - .00 .00 - - .00 -Other .00 .00 .00 - .00 .00 - .00 .00
Total G /nuts 583.91 368.42 349.65 890.95 514.29 552.24 330.91 552.85 750.00
Chalimbana 527.63 583.33 313.73 657.34 421.88 560.87 346.59 567.31 -Manipinta 741.38 250.00 - 1380.95 400.00 466.67 250.00 - -Malimba 1230.16 375.00 .00 1830.99 333.33 666.67 181.82 500.00 .00Chitembana .00 - - - - - - - -Mawanga 857.14 - - - 857.14 - - - -Other local variety 451.88 222.22 358.97 652.17 842.11 279.07 510.20 470.59 2000.00Mixture 714.29 - 666.67 733.33 .00 1000.00 285.71 - -Other /unknown 151.52 - - - .00 800.00 - - 500.00
Total rice 2777.53 3885.71 .00 - 3308.82 - 2100.00 1820.00 1538.46
Kilombera 3264.29 3666.67 .00 - 666.67 - 2200.00 2000.00 -Other local 2131.39 2333.33 - - 500.00 - 2346.53 1791.67 571.43Faya 3147.73 6090.91 - - 3770.83 - 1074.07 .00 -Bluebonnet 1272.73 - - - - - 2400.00 - 333.33Mixture 2200.00 - - - 3750.00 - 2875.00 - 222.22Other 3204.55 4111.11 - - 1571.43 - 1714.29 .00 8000.00
Total pulses 297.12 309.86 100.00 333.33 500.00 374.39 541.87 175.68 .00
Soya beans 547.74 - .00 407.41 500.00 578.31 .00 .00 .00Mixed beans 393.97 292.31 108.43 242.42 750.00 321.65 635.96 1000.00 -Pegion peas 101.00 - - - - - 166.67 104.68 -White haricot 329.41 - .00 - - 396.55 250.00 111.11 -Dolichos beans 333.33 - - - - 166.67 500.00 400.00 -Other 308.08 500.00 88.24 454.55 .00 348.10 503.88 250.00 .00
continued…
86

TABLE G32.0 Mean yield for Selected Crops for Male Headed Households by A.D.D. (Kilograms/Hectare)
CROPALL
MALAWI KARONGA MZUZU KASUNGU SALIMA LILONGWE MACHINGA BLANTYRESHIRE VALLEY
A.D.D. A.D.D. A.D.D. A.D.D. A.D.D. A.D.D. A.D.D. A.D.D.Total millet 723.94 4800.00 432.43 250.00 449.28 246.15 281.25 163.64 1102.80
Finger 471.01 5222.22 382.35 250.00 449.28 246.15 100.00 152.17 1222.22Bullrush 937.78 1000.00 1000.00 - - - 583.33 222.22 1015.96Mixture 2000.00 - - - - - - - 2000.00
Total sorghum 658.21 - - - .00 - 687.50 314.81 934.07
Local 635.80 - - - .00 - 717.65 202.45 926.72Improved 933.33 - - - - - - - 933.33Brewing sorghum 675.32 - - - - - 454.55 660.38 923.09Mixture 1111.11 - - - - - - - 1111.11Other 1000.00 - - - - - - - 1000.00
Wheat .00 - - - - - - .00 -
Sunflower 438.20 - 583.33 531.25 .00 .00 625.00 125.00 -
87

STATISTICAL TABLES
FOR
NSSA 1992/93
KARONGA A.D.D.
88/89/90

LIST OF STATISTICAL TABLES FOR KARONGA A.D.D. Table Table title page Number G1.0 Number and percentage of gardens by holding size 95 category G2.0 Percentage of cultivated area by ploughing method 95 Used and holding size category G3.0 Percentage of cultivated area by ridging method used 96 And holding size category G4.0 Percentage of cultivated area by planting method used 97 And holding size category G5.0 Percentage of cultivated area by source of permission 98 To use land and R.D.P. G6.0 Number of plots by holding size category and R.D.P. 98 G7.0 Percentage of plots by maize variety and R.D.P 98 G8.0 Percentage of plots by source of seed and maize variety 99 G9.0 Percentage of plots to which fertilizer was applied by type 99 Of fertilizer G10.0 Percentage of plots to which fertilizer was applied by type 100 Of fertilizer G11.0 Percentage of maize plots to which fertilizer was applied by 100 Type of fertilizer, R.D.P. and sex of household head G12.0 Percentage of maize plots to which fertilizer was applied to 101 By type of fertilizer, R.D.P. and sex of household head G13.0 Percentage of plots to which fertilizer was applied by maize 102 Variety G14.0 Percentage of plots to which fertilizer was applied by maize 103 Variety G15.0 Percentage of maize plots to which fertilizer was applied by 104 Maize variety for male headed households
91

G16.0 Percentage of maize plots to which fertilizer was applied by 105 Maize variety for male headed households G17.0 Percentage of maize plots to which fertilizer was applied by 106 Maize variety for female headed households G18.0 Percentage of maize plots to which fertilizer was applied by 107 Maize variety for female headed households G19.0 Fertilizer application on area planted with maize and rice by 108 R.D.P. G20.0 Fertilizer application on area planted with maize and rice for 109 Female headed households by R.D.P. G21.0 Fertilizer application on area planted with maize and rice for 110 Female headed households by R.D.P. G22.0 Percentage of plots to which fertilizer was applied by sex of 111 Household head and source of financing G23.0 Cropping pattern by R.D.P. (Thousand Hectares) 112 G24.0 Percentage cropping pattern by R.D.P. 113 G25.0 Cropping pattern for male headed households by R.D.P. 114 ( Thousand Hectares ) G26.0 Cropping pattern for female headed households by R.D.P. 115 (Thousand Hectares) G27.0 Production for selected crops by R.D.P. (Thousand Tones) 116 G28.0 Production for selected crops for male headed households by 117 R.D.P. (Thousand Tones) G29.0 Production for selected crops for female headed households 118 By R.D.P. (Thousand Tones) G30.0 Mean yield for selected crops by R.D.P. (Kilograms/Hectare) 119 G31.0 Mean yield for selected crops for male headed households by 120 R.D.P (Kilograms/Hectare) G32.0 Mean yield for selected crops for female headed households by 121 R.D.P. (Kilograms/Hectare)
92/93/94

TABLE G1.0 Number and Percentage of Gardens by Holding Size Category
A.D.D/R.D.P. Total
under 0.50 0.50-0.99 1.00-1.49 1.50-1.99 2.00-2.49 2.50-2.993.00 and
overKaronga A.D.D. Number 132493 59431 37985 25173 6208 1705 1566 425
Percentage 100.0 44.9 28.7 19.0 4.7 1.3 1.2 .3
Chitipa R.D.P. Number 44812 15606 14614 9087 27.3 889 1488 425
Percentage 100.0 34.8 32.6 20.3 6.0 2.0 3.3 .9
Karonga R.D.P. Number 87681 43825 23371 16086 3505 816 78 0
Percentage 100.0 50.0 26.7 18.3 4.0 .9 .1 .0
Holding Size Category (Hectares)
TABLE G2.0. Percentage of Cultivated Area by Ploughing Method Used and Holding Size Category
A.D.D/R.D.P. Total
under 0.50 0.50-0.99 1.00-1.49 1.50-1.99 2.00-2.49 2.50-2.993.00 and
overKaronga A.D.D. Total 100.0 22.3 31.1 29.3 9.3 3.9 3.2 .9 Not ploughed this season 52.3 11.1 16.1 15.0 4.9 2.2 2.2 .8 Tilled by hoeing 9.4 3.6 2.7 2.2 .4 .3 .1 .1 Ploughed by oxen 38.2 7.5 12.3 12.1 4.1 1.5 .9 - Other .0 .0 - - - - - -
Chitipa R.D.P. Total 100.0 16.2 30.8 29.3 10.8 5.0 5.9 2.1 Not ploughed this season 87.7 14.3 27.5 25.6 9.2 4.2 5.1 1.9 Tilled by hoeing 7.2 1.7 2.3 1.7 .9 .2 .2 .2 Ploughed by oxen 5.1 .2 1.0 2.0 .7 .6 .6 - OtherKaronga R.D.P. Total 100.0 27.0 31.3 29.3 8.2 3.1 1.1 - Not ploughed this season 24.6 8.7 7.2 6.7 1.4 .6 - - Tilled by hoeing 11.1 5.1 3.1 2.6 .1 .3 - - Ploughed by oxen 64.2 13.2 21.1 19.9 6.7 2.2 1.1 - Other .0 .0 - - - - - -
Holding Size Category (Hectares)
95

Ridging Method Total
under 0.50 0.50-0.99 1.00-1.49 1.50-1.99 2.00-2.49 2.50-2.993.00 and
overKaronga A.D.D. Total 100.0 22.3 31.1 29.3 9.3 3.9 3.2 .9 Not ridged this season 44.9 12.2 13.6 13.0 4.0 1.3 .8 .1 Ridged by hoeing 51.0 9.8 16.3 14.8 5.0 2.2 2.1 .8 Ridged by oxen 4.1 .2 1.2 1.5 .4 .5 .3 -Other .0 .0 - - - - - -Chitipa R.D.P. Total 100.0 16.2 30.8 29.3 10.8 5.0 5.9 2.1 Not ridged this season 12.1 4.6 2.5 3.6 .4 .3 .4 .2 Ridged by hoeing 85.4 11.4 27.9 25.0 9.6 4.7 4.8 1.9 Ridged by oxen 2.5 .2 .3 .7 .7 - .6 -Other .0 .0 - - - - - -Karonga R.D.P. Total 100.0 27.0 31.3 29.3 8.2 3.1 1.1 - Not ridged this season 70.6 18.2 22.2 20.4 6.7 2.0 1.1 - Ridged by hoeing 24.0 8.5 7.2 6.7 1.4 .2 - - Ridged by oxen 5.4 .3 1.9 2.1 .1 .9 - -Other .1 .1 - - - - - -
Holding Size Category (Hectares)
TABLE G3.0. Percentage of Cultivated Area by Ridging Method Used and Holding Size Category
96
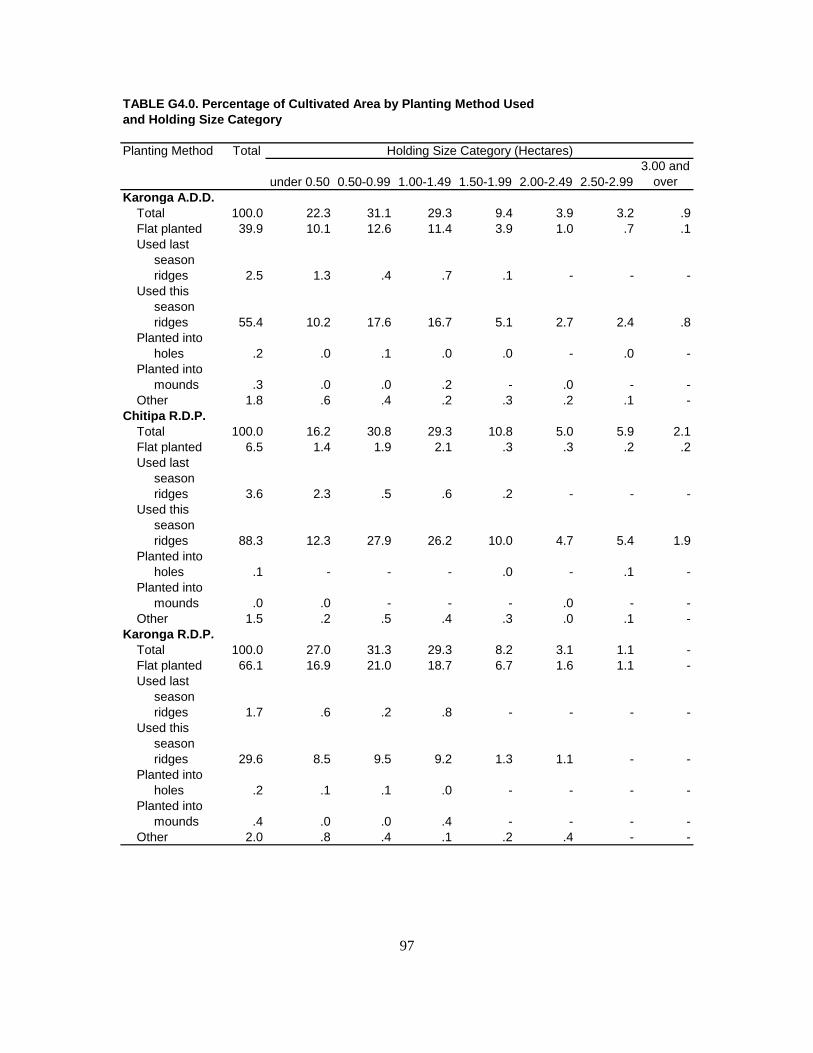
TABLE G4.0. Percentage of Cultivated Area by Planting Method Used and Holding Size Category
Planting Method Total
under 0.50 0.50-0.99 1.00-1.49 1.50-1.99 2.00-2.49 2.50-2.993.00 and
overKaronga A.D.D. Total 100.0 22.3 31.1 29.3 9.4 3.9 3.2 .9 Flat planted 39.9 10.1 12.6 11.4 3.9 1.0 .7 .1 Used last season ridges 2.5 1.3 .4 .7 .1 - - - Used this season ridges 55.4 10.2 17.6 16.7 5.1 2.7 2.4 .8 Planted into holes .2 .0 .1 .0 .0 - .0 - Planted into mounds .3 .0 .0 .2 - .0 - - Other 1.8 .6 .4 .2 .3 .2 .1 -Chitipa R.D.P. Total 100.0 16.2 30.8 29.3 10.8 5.0 5.9 2.1 Flat planted 6.5 1.4 1.9 2.1 .3 .3 .2 .2 Used last season ridges 3.6 2.3 .5 .6 .2 - - - Used this season ridges 88.3 12.3 27.9 26.2 10.0 4.7 5.4 1.9 Planted into holes .1 - - - .0 - .1 - Planted into mounds .0 .0 - - - .0 - - Other 1.5 .2 .5 .4 .3 .0 .1 -Karonga R.D.P. Total 100.0 27.0 31.3 29.3 8.2 3.1 1.1 - Flat planted 66.1 16.9 21.0 18.7 6.7 1.6 1.1 - Used last season ridges 1.7 .6 .2 .8 - - - - Used this season ridges 29.6 8.5 9.5 9.2 1.3 1.1 - - Planted into holes .2 .1 .1 .0 - - - - Planted into mounds .4 .0 .0 .4 - - - - Other 2.0 .8 .4 .1 .2 .4 - -
Holding Size Category (Hectares)
97

TABLE G5.0. Percentage of Cultivated Area by Source of Permission to Use Land and R.D.P.
A.D.D./R.D.P TOTAL Relative by birth-male
Relative by birth-female
Relative by marriage-male
Relative by marriage-female Borrowed Estate/Scheme Other
Karonga A.D.D. 100.0 18.6 3.4 10.8 3.9 41.8 13.6 7.9Chitipa R.D.P. 100.0 42.4 3.9 . 1.5 37.2 . 15.1Karonga R.D.P. 100.0 12.5 3.3 13.6 4.6 43.0 17.1 6.1 TABLE G6.0. Number of Plots by Holding Size Category and R.D.P.
A.D.D./R.D.P Total
Under 0.50 0.50-0.99 1.00-1.49 1.50-1.99 2.00-2.49 2.50-2.993.00 and over
Karonga A.D.D. 179681 73432 49971 39435 10472 3118 2743 510Chitipa R.D.P. 60074 17814 18638 13668 4951 1984 2509 510Karonga R.D.P. 119607 55618 31333 25767 5521 1134 234 0
Holding Size Category (Hectares)
TABLE G7.0. Percentage of Plots by Maize Variety and R.D.P.
A.D.D./R.D.P. TotalHybrid Composite Local pure Local/G-nuts Local/Other Other
stand cropKaronga A.D.D. 100.0 22.1 2.1 54.5 6.6 12.3 2.4Chitipa R.D.P. 100.0 16.1 .9 56.5 6.5 19.0 1.0Karonga R.D.P. 100.0 27.5 3.1 52.7 6.7 6.4 3.6
Type of Maize
98

TABLE G8.0. Percentage of Plots by Source of Seed and Maize Variety
Maize Variety TotalRetained from Project/scheme As seed from As food from As food from Bought Otherlast season credit ADMARC ADMARC a market locally
Karonga A.D.D.All maize 100.0 64.2 2.7 6.4 1.1 1.3 6.5 18.0Hybrid 22.1 3.0 2.6 4.9 .2 .1 1.1 10.3Composite 2.1 .7 .0 .1 .0 .0 .2 1.1Local pure stand 54.5 42.7 .1 .8 .9 1.1 4.3 4.7Local/G-nuts 6.6 5.4 .0 .1 .0 .0 .3 .7Local/other crop 12.3 10.8 .1 .5 .0 .1 .1 .7Other 2.4 1.4 .0 .0 .0 .0 .5 .5Chitipa R.D.P.All maize 100.0 76.5 4.9 8.8 .0 .2 4.2 5.5Hybrid 16.1 3.4 4.6 6.4 .0 .0 .1 1.5Composite .9 .2 .0 .2 .0 .0 .0 .5Local pure stand 56.5 48.6 .1 1.1 .0 .2 3.3 3.2Local/G-nuts 6.5 6.1 .0 .0 .0 .0 .2 .1Local/other crop 19.0 17.3 .1 1.1 .0 .0 .3 .2Other 1.0 .8 .0 .0 .0 .0 .2 .0Karonga R.D.P.All maize 100.0 53.4 .8 4.3 2.0 2.2 8.5 28.9Hybrid 27.5 2.7 .8 3.5 .4 .2 1.9 18.0Composite 3.1 1.1 .0 .0 .0 .0 .3 1.6Local pure stand 52.7 37.6 .0 .6 1.6 1.9 5.1 6.0Local/G-nuts 6.7 4.8 .0 .2 .0 .0 .4 1.2Local/other crop 6.4 5.2 .0 .0 .0 .2 .0 1.0Other 3.6 1.9 .0 .0 .0 .0 .8 .9
Source of Seed
TABLE G9.0. Percentage of Plots to which Fertilizer was Applied by Type of Fertilizer
A.D.D./R.D.P. TotalNone used 20:20:00 Sulphate of DAP 23:21 O+4S CAN UREA Mixture Other
AmmoniaKaronga A.D.D. 100.0 87.8 1.6 2.1 3.1 1.1 .8 1.2 1.9 .4
Chitipa R.D.P. 100.0 76.8 1.5 .0 8.3 2.4 2.0 2.7 5.0 1.3Karonga R.D.P. 100.0 93.3 1.6 3.1 .5 .5 .2 .5 .4 .0
First Application
99

TABLE G10.0. Percentage of Plots to which Fertilizer was Applied by Type of Fertilizer
A.D.D./R.D.P.Total None used 20:20:00 Sulphate of DAP 23:21 O+4S CAN UREA Mixture
AmmoniaKaronga A.D.D. 100.0 94.7 .0 1.4 .1 .0 1.5 2.1 .1
Chitipa R.D.P. 100.0 87.9 .1 .5 .4 .1 4.4 6.2 .4Karonga R.D.P. 100.0 98.1 .0 1.8 .0 .0 .1 .0 .0
Second Application
TABLE G11.0. Percentage of Maize Plots to which Fertilizer was Applied by Type of Fertilizer, R.D.P. and Sex of Household Head
A.D.D./R.D.P.Total None used 20:20:00 Sulphate of DAP 23:21 O+4S CAN UREA Mixture Other
ammoniaKaronga A.D.D.
Total 100.0 87.8 1.6 2.1 3.1 1.1 .8 1.2 1.9 .4
Male 76.2 66.4 1.3 1.4 2.6 .8 .6 1.0 1.7 .4Female 23.8 21.3 .3 .7 .5 .3 .2 .2 .2 .1
Chitipa R.D.P.
Total 100.0 76.8 1.5 .0 8.3 2.4 2.0 2.7 5.0 1.3Male 78.3 59.4 1.5 .0 6.9 1.4 1.4 2.2 4.2 1.1Female 21.7 17.3 .0 .0 1.4 1.0 .6 .5 .7 .2
Karonga R.D.P.
Total 100.0 93.3 1.6 3.1 .5 .5 .2 .5 .4 .0
Male 75.2 70.0 1.1 2.1 .5 .5 .1 .5 .4 .0Female 24.8 23.4 .5 1.0 .0 .0 .0 .0 .0 .0
First Application
100

TABLE G12.0. Percentage of Maize Plots to which Fertilizer was Applied by Type of Fertilizer, R.D.P. and Sex of Household Head
A.D.D./R.D.P. SECOND APPLICATIONTotal None used 20:20:00 Sulphate of DAP 23:21 O+4S CAN UREA Mixture
AmmoniaKaronga A.D.D.
Total 100.0 94.7 .0 1.4 .1 .0 1.5 2.1 .1
Male 76.2 72.0 .0 .9 .1 .0 1.3 1.7 .1Female 23.8 22.7 .0 .5 .0 .0 .2 .4 .0
Chitipa R.D.P.
Total 100.0 87.9 .1 .5 .4 .1 4.4 6.2 .4
Male 78.3 68.3 .0 .4 .2 .1 3.8 5.2 .4Female 21.7 19.6 .1 .1 .1 .0 .6 1.1 .0
Karonga R.D.P.
Total 100.0 98.1 .0 1.8 .0 .0 .1 .0 .0
Male 75.2 73.9 .0 1.1 .0 .0 .1 .0 .0Female 24.8 24.2 .0 .6 .0 .0 .0 .0 .0
101

TABLE G13.0. Percentage of Plots to which Fertilizer was Applied by Maize Variety
Maize VarietyTotal None used 20:20:00 Sulphate of DAP 23:21 O+4S CAN UREA Mixture Other
AmmoniaKaronga A.D.D.
All maize 100.0 82.8 1.0 .8 5.9 1.4 1.4 2.5 4.1 .2
Hybrid 22.1 14.4 .4 .5 3.1 .1 .4 .9 2.4 .0Composite 2.1 1.8 .0 .0 .2 .0 .1 .0 .0 .0Local pure stand 54.5 48.8 .5 .2 1.4 .7 .5 .8 1.3 .2Local /G-nuts 6.6 6.2 .1 .1 .1 .0 .1 .0 .0 .0Local /other crop 12.3 9.6 .1 .0 .8 .5 .3 .7 .3 .0Other 2.4 1.9 .0 .0 .3 .0 .0 .1 .2 .0
Chitipa R.D.P.
All maize 100.0 67.8 2.1 .0 12.4 3.1 2.4 4.0 7.8 .4
Hybrid 16.1 2.9 .8 .0 6.3 .3 .5 1.2 4.1 .0Composite .9 .5 .0 .0 .5 .0 .0 .0 .0 .0Local pure stand 56.5 45.0 1.0 .0 3.0 1.6 1.2 1.6 2.8 .4Local /G-nuts 6.5 5.8 .2 .0 .2 .0 .2 .0 .0 .0Local /other crop 19.0 13.6 .2 .0 1.7 1.1 .6 1.2 .6 .0Other 1.0 .0 .0 .0 .7 .0 .0 .0 .3 .0
Karonga R.D.P.
All maize 100.0 95.8 .0 1.5 .2 .0 .5 1.1 .8 .0
Hybrid 27.5 24.6 .0 .9 .2 .0 .4 .6 .8 .0Composite 3.1 3.0 .0 .0 .0 .0 .1 .0 .0 .0Local pure stand 52.7 52.1 .0 .4 .0 .0 .0 .1 .0 .0Local /G-nuts 6.7 6.5 .0 .2 .0 .0 .0 .0 .0 .0Local /other crop 6.4 6.2 .0 .0 .0 .0 .0 .2 .0 .0Other 3.6 3.5 .0 .0 .0 .0 .0 .1 .0 .0
First Application
102

TABLE G14.0. Percentage of Plots to which Fertilizer was Applied by Maize Variety
Maize VarietyTotal None used 20:20:00 Sulphate of 23:21 O+4S CAN UREA Mixture
AmmoniaKaronga A.D.D.
All maize 100.0 92.0 .1 .2 .1 2.9 4.4 .3
Hybrid 22.1 17.5 .1 .0 .0 1.5 2.8 .3Composite 2.1 1.9 .0 .0 .0 .2 .0 .0Local /pure stand 54.5 52.4 .0 .2 .0 1.0 .9 .1Local /G-nuts 6.6 6.6 .0 .0 .0 .0 .0 .0Local /other crop 12.3 11.6 .0 .0 .0 .2 .5 .0Other 2.4 2.0 .0 .0 .1 .0 .3 .0
Chitipa R.D.P.
All maize 100.0 83.1 .2 .4 .1 6.0 9.5 .7
Hybrid 16.1 6.4 .2 .0 .0 2.9 6.0 .6Composite .9 .5 .0 .0 .0 .5 .0 .0Local /pure stand 56.5 52.0 .0 .4 .0 2.1 1.8 .1Local /G-nuts 6.5 6.5 .0 .0 .0 .0 .0 .0Local /other crop 19.0 17.6 .0 .0 .0 .4 1.0 .0Other 1.0 .2 .0 .0 .1 .0 .7 .0
Karonga R.D.P.
All maize 100.0 99.8 .0 .0 .0 .2 .0 .0
Hybrid 27.5 27.3 .0 .0 .0 .2 .0 .0Composite 3.1 3.1 .0 .0 .0 .0 .0 .0Local /pure stand 52.7 52.7 .0 .0 .0 .0 .0 .0Local /G-nuts 6.7 6.7 .0 .0 .0 .0 .0 .0Local /other crop 6.4 6.4 .0 .0 .0 .0 .0 .0Other 3.6 3.6 .0 .0 .0 .0 .0 .0
Second Application
103

TABLE G15.0 Percentage of Maize Plots to which Fertilizer was Applied by Maize Variety for Male Headed Households
Maize VarietyTotal NONE 20:20:00 Sulphate of DAP 23:21 O+4S CAN UREA Mixture Other
USED AmmoniaKaronga A.D.D.
All maize 100.0 80.4 1.4 1.1 6.9 1.0 1.4 2.8 4.8 .2
Hybrid 25.1 15.6 .5 .7 3.7 .1 .5 1.1 2.9 .0Composite 1.3 1.0 .0 .0 .3 .0 .0 .0 .0 .0Local pure stand 52.9 47.3 .6 .3 1.3 .6 .4 .9 1.3 .2Local /G-nuts 5.9 5.4 .1 .1 .1 .0 .1 .0 .0 .0Local /other crop 12.5 9.6 .1 .0 1.0 .3 .4 .8 .4 .0Other 2.1 1.4 .0 .0 .4 .0 .0 .1 .2 .0
Chitipa R.D.P.
All maize 100.0 65.5 2.8 .0 13.9 2.0 2.3 4.2 8.8 .5
Hybrid 17.8 2.4 1.0 .0 7.4 .2 .5 1.4 4.8 .0Composite 1.2 .6 .0 .0 .6 .0 .0 .0 .0Local pure stand 54.3 43.6 1.3 .0 2.6 1.2 .7 1.6 2.8 .0Local /G-nuts 7.0 6.1 .3 .0 .3 .0 .3 .0 .0 .0Local /other crop 18.4 12.7 .3 .0 2.1 .6 .8 1.3 .8 .0Other 1.3 .0 .0 .0 .9 .0 .0 .0 .4 .0
Karonga R.D.P.
All maize 100.0 94.3 .0 2.2 .3 .0 .5 1.6 1.2 .0Hybrid 32.1 27.9 .0 1.3 .3 .0 .5 .9 1.2 .0Composite 1.4 1.4 .0 .0 .0 .0 .0 .0 .0 .0Local pure stand 51.6 50.8 .0 .6 .0 .0 .0 .2 .0 .0Local /G-nuts 5.0 4.7 .0 .3 .0 .0 .0 .0 .0 .0Local /other crop 7.0 6.7 .0 .0 .0 .0 .0 .3 .0 .0Other 2.9 2.7 .0 .0 .0 .0 .0 .2 .0 .0
First Application
204

TABLE G16.0 Percentage of Maize Plots to which Fertilizer was Applied by Maize variety for Male Headed Households
Maize variety Second ApplicationTotal None Sulphate of 23:21 O+4S CAN UREA Mixture
used AmmoniaKaronga A.D.D.All maize 100.0 90.9 .1 .1 3.4 5.1 .4Hybrid 25.1 19.4 .0 .0 2.0 3.4 .4Composite 1.3 1.0 .0 .0 .3 .0 .0Local pure stand 52.9 51.1 .1 .0 .9 .8 .1Local /G-nuts 5.9 5.9 .0 .0 .0 .0 .0Local /other crop 12.5 11.8 .0 .0 .2 .5 .0Other 2.1 1.6 .0 .1 .0 .4 .0Chitipa R.D.P.All maize 100.0 81.6 .3 .1 6.7 10.4 .9Hybrid 17.8 6.2 .0 .0 3.9 7.0 .7Composite 1.2 .6 .0 .0 .6 .0 .0Local pure stand 54.3 50.5 .3 .0 1.8 1.6 .1Local /G-nuts 7.0 7.0 .0 .0 .0 .0 .0Local /other crop 18.4 17.0 .0 .0 .4 1.0 .0Other 1.3 .3 .0 .1 .0 .9 .0Karonga R.D.P.All maize 100.0 99.7 .0 .0 .3 .0 .0Hybrid 32.1 31.8 .0 .0 .3 .0 .0Composite 1.4 1.4 .0 .0 .0 .0 .0Local pure stand 51.6 51.6 .0 .0 .0 .0 .0Local /G-nuts 5.0 5.0 .0 .0 .0 .0 .0Local /other crop 7.0 7.0 .0 .0 .0 .0 .0Other 2.9 2.9 .0 .0 .0 .0 .0
106

TABLE G17.0 Percentage of Maize Plots to which Fertilizer was Applied by Maize variety for Female Headed Households
Maize variety First ApplicationTotal None used DAP 23:21 O+4S CAN UREA Mixture
Karonga A.D.D.All maize 100.0 89.3 3.1 2.6 1.5 1.4 2.1Hybrid 13.9 11.3 1.2 .2 .2 .2 .8Composite 4.1 3.8 .0 .0 .3 .0 .0Local pure stand 58.8 52.9 1.7 1.2 1.0 .7 1.3Local /G-nuts 8.4 8.4 .0 .0 .0 .0 .0Local /other crop 11.7 9.7 .2 1.2 .0 .5 .0Other 3.1 3.1 .0 .0 .0 .0 .0Chitipa R.D.P.All maize 100.0 75.0 7.5 6.3 2.9 3.4 4.9Hybrid 10.5 4.3 2.9 .5 .5 .5 1.9Local pure stand 63.6 49.5 4.1 2.8 2.4 1.7 3.0Local /G-nuts 5.0 5.0 .0 .0 .0 .0 .0Local /other crop 20.9 16.3 .5 .0 1.1 .0Karonga R.D.P.All maize 100.0 99.5 .0 .0 .5 .0 .0Hybrid 16.4 16.4 .0 .0 .0 .0 .0Composite 7.1 6.6 .0 .0 .5 .0 .0Local pure stand 55.3 55.3 .0 .0 .0 .0 .0Local /G-nuts 10.8 10.8 .0 .0 .0 .0 .0Local /other crop 5.0 5.0 .0 .0 .0 .0 .0Other 5.4 5.4 .0 .0 .0 .0 .0
106

TABLE G18.0 Percentage of Maize Plots to which Fertilizer was Applied by Maize variety for Female Headed HouseholdsMaize Variety Second Application
Total None 20:20:0 Sulphate of CAN UREAused Ammonia
Karonga A.D.D.All maize 100.0 94.9 .4 .4 1.6 2.7Hybrid 13.9 12.3 .4 .0 .0 1.2Composite 4.1 4.1 .0 .0 .0 .0Local pure stand 58.8 55.9 .0 .4 1.4 1.1Local /G-nuts 8.4 8.4 .0 .0 .0 .0Local /other crop 11.7 11.1 .0 .0 .2 .4Other 3.1 3.1 .0 .0 .0 .0Chitipa R.D.P.All maize 100.0 87.8 1.0 1.0 3.8 6.5Hybrid 10.5 6.7 1.0 .0 .0 2.8Local pure stand 63.6 56.7 .0 1.0 3.3 2.7Local /G-nuts 5.0 5.0 .0 .0 .0 .0Local /other crop 20.9 19.4 .0 .0 .5 1.0Karonga R.D.P.All maize 100.0 100.0 .0 .0 .0 .0Hybrid 16.4 16.4 .0 .0 .0 .0Composite 7.1 7.1 .0 .0 .0 .0Local pure stand 55.3 55.3 .0 .0 .0 .0Local /G-nuts 10.8 10.8 .0 .0 .0 .0Local /other crop 5.0 5.0 .0 .0 .0 .0Other 5.4 5.4 .0 .0 .0 .0
107

TABLE G19.0. Fertilizer Application on Area Planted with Maize and Rice by R.D.P.
R.D.P Total Area Area Fertilizer Percentage( Hectares ) ( Hectares ) Fertilized
Chitipa R.D.P.
Total maize 11525.33 4557.70 39.55
Hybrid 2047.28 1913.06 93.44Composite 59.8 18.40 30.77Local pure stand 6269.87 1584.30 25.27Local /G-nuts 655.40 141.24 21.55Local /other crop 2253.68 661.40 29.35Other 239.29 239.29 100.00Total rice 78.77 28.42 36.08Kilombera 43.98 25.71 58.46Other local 11.50 - -Faya 2.71 2.71 100.00Other 20.58 - -
Karonga R.D.P.
Total maize 6182.64 238.85 3.86
Hybrid 2200.18 210.14 9.55Composite 162.45 11.29 6.95Local pure stand 2934.20 7.05 .24Local /G-nuts 214.20 7.10 3.31Local /other crop 331.87 .89 .27Other 339.74 2.38 .70Total rice 6496.01 1140.99 17.56Kilombera 4665.57 510.09 10.93Other local 198.44 - -Faya 937.35 295.51 31.53Mixture 173.31 14.11 8.14Other 521.35 321.29 61.63
108

TABLE G20.0. Fertilizer Application on Area Planted with Maize and Rice for Male Headed Households by R.D.P.
R.D.P. Total Area Area Fertilizer Percentage( Hectares ) ( Hectares ) Fertilized
Chitipa R.D.P
Total maize 9152.11 3809.31 41.62
Hybrid 1808.74 1719.68 95.08Composite 59.80 18.40 30.77Local pure stand 4790.32 1156.82 24.15Local /G-nuts 570.11 141.24 24.77Local /other crop 1683.84 533.87 31.71Other 239.29 239.29 100.00Total Rice 51.26 28.42 55.44Kilombera 25.71 25.71 100.00Other local 11.50 - -Faya 2.71 2.71 100.00Other 11.34 - -
Karonga R.D.P.
Total maize 4637.29 227.56 4.91
Hybrid 1889.42 210.14 11.12Composite 36.69 - -Local pure stand 2125.61 7.05 .33Local /G-nuts 81.62 7.10 8.70Local /other crop 286.63 .89 .31Other 217.32 2.38 1.10Total Rice 5137.60 789.89 15.37Kilombera 3607.40 371.75 10.31Other local 169.82 - -Faya 831.23 248.26 29.87Mixture 173.31 14.11 8.14Other 355.84 155.78 43.78
109

TABLE G21.0. Fertilizer Application on Area Planted with Maize and Rice for Female Headed Households by R.D.P.
R.D.P. Total Area Area Fertilizer Percentage( Hectares ) ( Hectares ) Fertilised
Chitipa R.D.P
Total maize 2373.22 748.39 31.53
Hybrid 238.54 193.38 81.07Local pure stand 1479.55 427.48 28.89Local /G-nuts 85.29 - -Local /other crop 569.84 127.54 22.38Total Rice 27.51 - -Kilombera 18.27 - -Other 9.24 - -
Karonga R.D.P.
Total maize 1545.36 11.29 0.73
Hybrid 310.76 - -Composite 125.77 11.29 8.98Local pure stand 808.59 - -Local /G-nuts 132.57 - -Local /other crop 45.25 - -Other 122.42 - -Total Rice 1358.41 351.10 28.85Kilombera 1058.17 138.34 13.07Other local 28.62 - -Faya 106.11 47.25 44.53Other 165.51 165.51 100.00
110

TABLE G22.0 Percentage of Plots to Which Fertilizer was Applied by sex of Household Head and Source of Financing
A.D.D./R.D.P. Source of Financing FertilizerTotal None used Cash Credit Combination Gift Other
Karonga A.D.D.
Total 100.0 87.8 6.8 4.9 .1 .2 .1
Male 76.2 66.4 5.5 3.9 .0 .2 .1Female 23.8 21.3 1.3 1.0 .0 .0 .0
Chitipa R.D.P.
Total 100.0 76.8 14.3 8.3 .3 .2 .1
Male 78.3 59.4 11.5 6.9 .1 .2 .1Female 21.7 17.3 2.8 1.4 .1 .1 .0
Karonga R.D.P.
Total 100.0 93.3 3.1 3.2 .0 .3 .1
Male 75.2 70.0 2.5 2.3 .0 .3 .1Female 24.8 23.4 .6 .9 .0 .0 .0
111

TABLE G23.0 Cropping Pattern By R.D.P. (Thousand Hectares)
Crop Karonga Chitipa KarongaA.D.D. R.D.P R.D.P
Total maize 17.72 11.53 6.19Hybrid 4.25 2.05 2.20Composite .23 .06 .17Local pure stand 9.21 6.27 2.94Local /G-nuts .87 .66 .21Local /pulses 2.35 2.21 .14Local /millet .02 .02 -Local /root crops .21 .02 .19Other .58 .24 .34
Total G-nuts 1.36 .81 .55Chalimbana .55 .48 .07Manipinta .28 .08 .20Malimba .20 .02 .18Chitembana .00 - .00Mawanga .01 .01 -Other local variety .32 .22 .10Mixture .00 .00 -
Total rice 6.59 .08 6.51Kilombera 4.72 .05 4.67Other local .21 .01 .20Faya .94 .00 .94Mixture .17 - .17Other .55 .02 .53
Total pulses 3.59 3.50 .09Soya beans .01 .01 -Mixed beans 3.33 3.32 .01Pegion peas .03 - .03Other .22 .17 .05
Total millet .56 .56 -Finger .55 .55 -Bullrush .01 .01 -Cassava 6.25 .90 5.35Sweet potatoes .55 .43 .12Cotton 1.67 - 1.67
Total tobacco .13 .13 -Dark-fired .04 .04 -Sun /air .02 .02 -Burley .05 .05 -Oriental .02 .02 -
112

TABLE G24.0. Percentage Cropping Pattern by R.D.P.(Thousand Hectares)
Crop Karonga Chitipa KarongaA.D.D. R.D.P R.D.P
Total maize 100.0 100.0 100.0Hybrid 24.0 17.8 35.5Composite 1.3 .5 2.8Local pure stand 52.0 54.4 47.5Local /G-nuts 4.9 5.7 3.4Local /pulses 13.3 19.2 2.3Local /millet .1 .2 -Local /root crops 1.2 .2 3.1Other 3.3 2.1 5.5
Total G-nuts 100.0 100.0 100.0Chalimbana 40.4 59.3 12.7Manipinta 20.6 9.9 36.4Malimba 14.7 2.5 32.7Chitembana .0 .0 -Mawanga .7 1.2 -Other local variety 23.5 27.2 18.2Mixture .0 .0 -
Total rice 100.0 100.0 100.0Kilombera 71.6 62.5 71.7Other local 3.2 12.5 3.1Faya 14.3 .0 14.4Mixture 2.6 - 2.6Other 8.4 25.0 8.1
Total pulses 100.0 100.0 100.0Soya beans .3 .3 -Mixed beans 92.8 94.9 11.1Pegion peas .8 - 33.3Other 6.1 4.9 55.6
Total millet 100.0 100.0 -Finger 98.2 98.2 -Bullrush 1.8 1.8 -Cassava 100.0 100.0 100.0Sweet potatoes 100.0 100.0 100.0Cotton 100.0 100.0 100.0
Total tobacco 100.0 100.0 100.0Dark-fired 30.8 30.8 -Sun /air 15.4 15.4 -Burley 38.5 38.5 -Oriental 15.4 15.4 -
113

TABLE G25.0. Cropping Pattern for Male Headed Households by R.D.P. (Thousand hectares)
Crop Karonga Chitipa KarongaA.D.D. R.D.P R.D.P
Total maize 13.79 9.15 4.64Hybrid 3.70 1.81 1.89Composite .10 .06 .04Local pure stand 6.92 4.79 2.13Local /G-nuts .65 .57 .08Local /pulses 1.76 1.65 .12Local /millet .01 .01 -Local /root crops .19 .02 .17Other .46 .24 .22
Total G-nuts .98 .67 .31Chalimbana .43 .40 .03Manipinta .20 .06 .14Malimba .12 .02 .10Chitembana .00 - .00Mawanga .01 .01 -Other local variety .23 .18 .05Mixture .00 .00 -
Total rice 5.19 .05 5.14Kilombera 3.63 .03 3.61Other local .18 .01 .17Faya .83 .00 .83Mixture .17 - .17Other .37 .01 .36
Total pulses 2.88 2.79 .09Soya beans .01 .01 -Mixed beans 2.68 2.67 .01Pegion peas .03 - .03Other .16 .11 .05
Total millet .46 .46 -Finger .46 .46 -Cassava 4.88 .80 4.08Sweet potatoes .48 .36 .12Cotton 1.54 - 1.54
Total tobacco .12 .12 -Dark-fired .04 .04 -Sun /air .02 .02 -Burley .05 .05 -Oriental .01 .01 -
114

TABLE G26.0. Cropping Pattern for Female Headed Hou by R.D.P.(Thousand hectares)
Crop Karonga Chitipa KarongaA.D.D. R.D.P R.D.P
Total maize 3.92 2.37 1.55Hybrid .55 0.24 .31Composite .13 - .13Local pure stand 2.29 1.48 0.81Local /G-nuts .22 .09 .13Local /pulses 0.59 0.56 .02Local /millet .01 .01 -Local /root crops .02 - .02Other .12 - .12
Total G-nuts .39 .15 .24Chalimbana .12 .08 .04Manipinta .08 .02 .06Malimba .08 - .08Other local variety .10 .04 .05
Total rice 1.39 .03 1.36Kilombera 1.08 .02 1.06Other local .03 - .03Faya .11 - .11Other .18 .01 .17
Total pulses .71 .71 .00Mixed beans .65 .65 -Other .06 .06 .00
Total millet .10 .10 -Finger .09 .09 -Bullrush .01 .01 -Cassava 1.37 .10 1.27Sweet potatoes .07 .07 -Cotton .13 - .13
Total tobacco .01 .01 -Oriental .01 .01 -
115
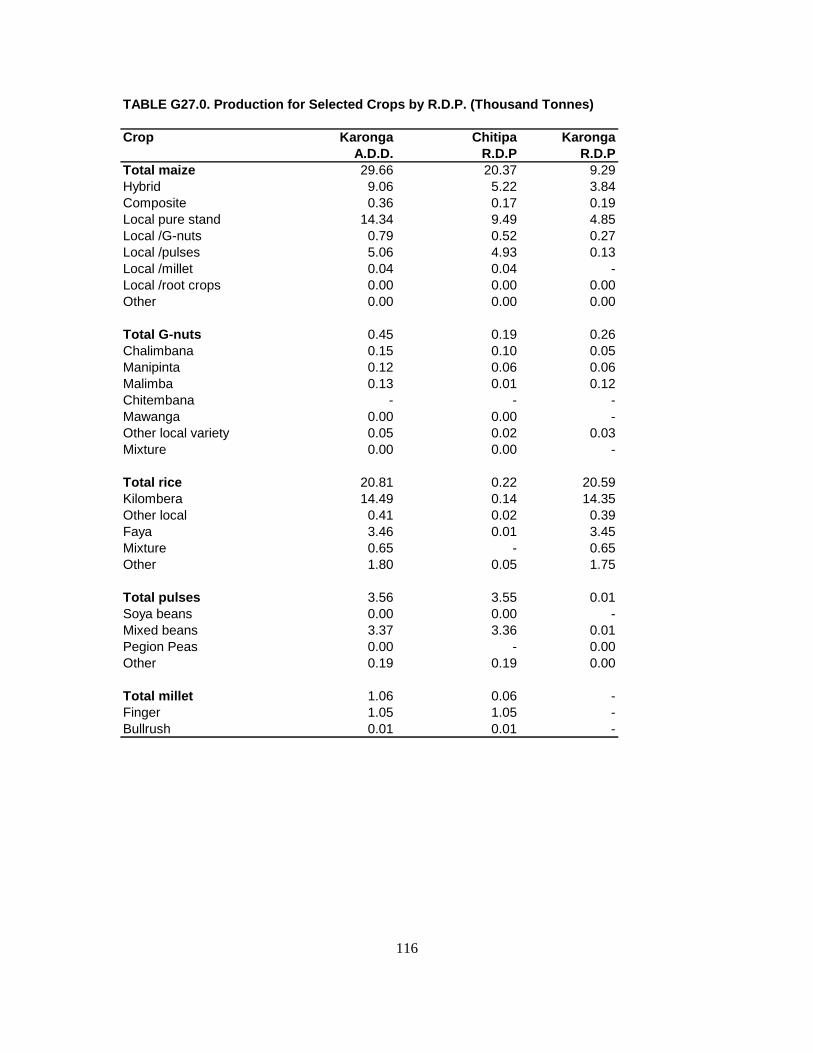
TABLE G27.0. Production for Selected Crops by R.D.P. (Thousand Tonnes)
Crop Karonga Chitipa KarongaA.D.D. R.D.P R.D.P
Total maize 29.66 20.37 9.29Hybrid 9.06 5.22 3.84Composite 0.36 0.17 0.19Local pure stand 14.34 9.49 4.85Local /G-nuts 0.79 0.52 0.27Local /pulses 5.06 4.93 0.13Local /millet 0.04 0.04 -Local /root crops 0.00 0.00 0.00Other 0.00 0.00 0.00
Total G-nuts 0.45 0.19 0.26Chalimbana 0.15 0.10 0.05Manipinta 0.12 0.06 0.06Malimba 0.13 0.01 0.12Chitembana - - -Mawanga 0.00 0.00 -Other local variety 0.05 0.02 0.03Mixture 0.00 0.00 -
Total rice 20.81 0.22 20.59Kilombera 14.49 0.14 14.35Other local 0.41 0.02 0.39Faya 3.46 0.01 3.45Mixture 0.65 - 0.65Other 1.80 0.05 1.75
Total pulses 3.56 3.55 0.01Soya beans 0.00 0.00 -Mixed beans 3.37 3.36 0.01Pegion Peas 0.00 - 0.00Other 0.19 0.19 0.00
Total millet 1.06 0.06 -Finger 1.05 1.05 -Bullrush 0.01 0.01 -
116

TABLE G28.0. Production for Selected Crops for Male Householdsby R.D.P. (Thousand Tonnes)
Crop Karonga Chitipa KarongaA.D.D. R.D.P R.D.P
Total maize 24.22 16.92 7.30Hybrid 7.85 4.57 3.28Composite .18 .17 .01Local pure stand 11.13 7.42 3.7Local /G-nuts .59 .40 .19Local /pulses 4.46 4.34 .12Local /millet .02 .02 -Local /root crops .00 .00 .00Other .00 .00 .00
Total G-nuts .31 .13 .18Chalimbana .08 .06 .02Manipinta .10 .05 .05Malimba .10 .01 .09Chitembana - - -Mawanga .00 .00 .00Other local variety .03 .01 .02Mixture .00 .00 -
Total rice 15.37 .15 15.22Kilombera 10.53 .10 10.43Other local .34 .02 .32Faya 2.79 .01 2.78Mixture .65 - .65Other 1.06 .02 1.04
Total pulses 3.34 3.33 .01Soya beans .00 .00 -Mixed beans 3.18 3.17 .01Pegion peas .00 - .00Other .16 .16 .00
Total millet .58 .58 -Finger .58 .58 -
117
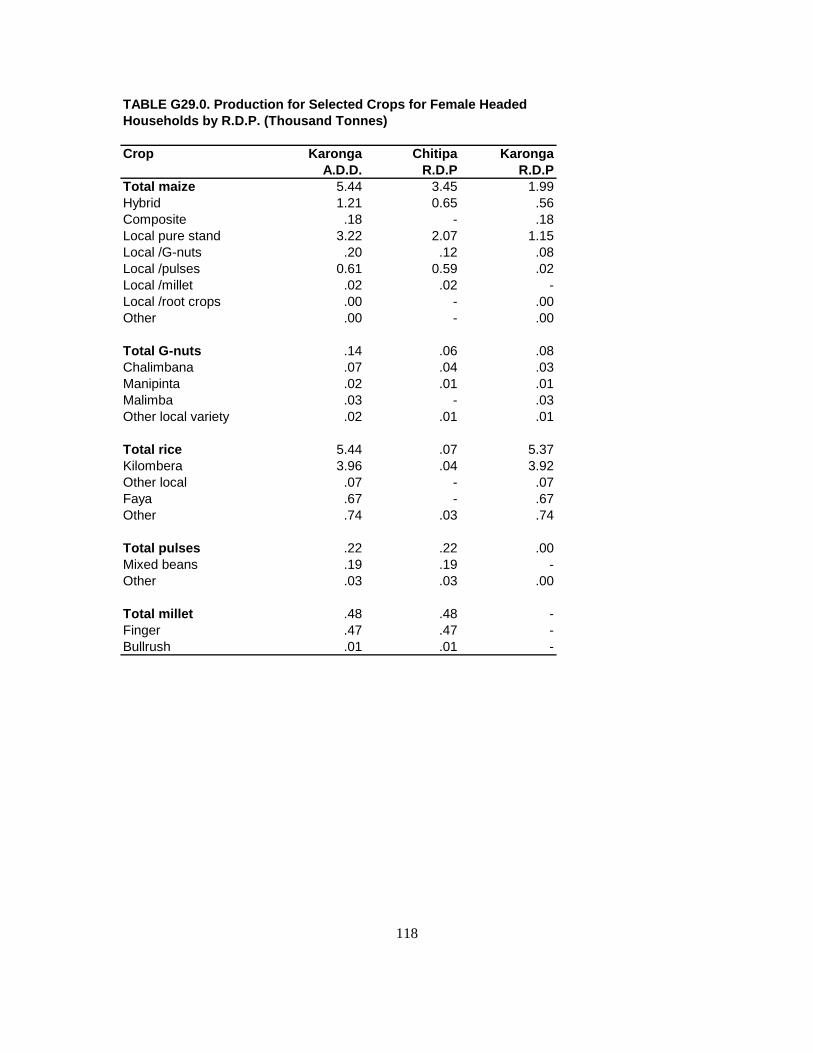
TABLE G29.0. Production for Selected Crops for Female Headed Households by R.D.P. (Thousand Tonnes)
Crop Karonga Chitipa KarongaA.D.D. R.D.P R.D.P
Total maize 5.44 3.45 1.99Hybrid 1.21 0.65 .56Composite .18 - .18Local pure stand 3.22 2.07 1.15Local /G-nuts .20 .12 .08Local /pulses 0.61 0.59 .02Local /millet .02 .02 -Local /root crops .00 - .00Other .00 - .00
Total G-nuts .14 .06 .08Chalimbana .07 .04 .03Manipinta .02 .01 .01Malimba .03 - .03Other local variety .02 .01 .01
Total rice 5.44 .07 5.37Kilombera 3.96 .04 3.92Other local .07 - .07Faya .67 - .67Other .74 .03 .74
Total pulses .22 .22 .00Mixed beans .19 .19 -Other .03 .03 .00
Total millet .48 .48 -Finger .47 .47 -Bullrush .01 .01 -
118

TABLE G30.0. Mean Yield For Selected Crops by R.D.P.(Kilograms per
Crop Karonga Chitipa KarongaA.D.D. R.D.P R.D.P
Total maize 1673.81 1766.70 1500.81Hybrid 2131.76 2546.34 1745.45Composite 1565.22 2833.33 1117.65Local pure stand 1557.00 1513.56 1649.66Local /G-nuts 908.05 787.88 1285.71Local /pulses 2153.19 2230.77 928.57Local /millet 2000.00 2000.00 -Local /root crops .00 .00 .00Other .00 .00 .00Total G-nuts 330.88 234.57 472.73Chalimbana 272.73 208.33 514.29Manipinta 428.57 750.00 300.00Malimba 650.00 500.00 631.58Chitembana - - -Mawanga .00 .00 -Other local variety 156.25 90.91 300.00Mixture - - -Total rice 3157.81 2750.00 3162.81Kilombera 3069.92 2800.00 3072.81Other local 1952.38 2000.00 1950.00Faya 3680.85 4194.00 3670.21Mixture 3823.53 - 3823.53Other 3272.73 2500.00 3301.89Total pulses 991.64 1014.29 111.11Soya beans .00 .00 -Mixed beans 1012.01 1012.05 1000.00Pegion peas .00 - .00Other 863.64 1117.65 -Total millet 1892.86 1892.86 -Finger 1909.09 1909.09 -Bullrush 1000.00 1000.00 -
119

TABLE G31.0. Mean Yield For Selected Crops by R.D.P. for MaleHeaded Households (kilograms pre Hectare)
Crop Karonga Chitipa KarongaA.D.D. R.D.P R.D.P
Total maize 1756.35 1849.18 1573.28Hybrid 2121.62 2524.86 1735.45Composite 1800.00 2833.33 250.00Local pure stand 1608.38 1549.06 1737.09Local /G-nuts 907.69 701.75 2375.00Local /pulses 2534.09 2630.3 1000.00Local /millet 2000.00 2000.00 -Local /root crops .00 .00 .00Other .00 .00 .00
Total G-nuts 316.33 194.03 580.65Chalimbana 186.05 150.00 666.67Manipinta 500.00 833.33 357.14Malimba 833.33 500.00 900.00Chitembana .00 - .00Mawanga .00 .00 -Other local variety 130.43 55.56 400.00Mixture .00 .00 -
Total rice 2961.46 3000.00 2961.09Kilombera 2900.83 3333.33 2889.2Other local 1888.89 2000.00 1882.35Faya 3361.45 .00 3349.40Mixture 3823.53 - 3823.53Other 2864.86 2000.00 2888.89
Total pulses 1159.72 1193.35 111.11Soya beans .00 .00 -Mixed beans 1186.57 1187.27 1000.00Pegion peas .00 - .00Other 1000.00 1454.55 .00
Total/Millet 1260.87 1260.87 -Finger 1260.87 1260.87 -
120

Table G32.0. Mean yield for selected crops by R.D.P. for Female Headed Households (Kilograms/Hectares)
CROP KARONGA CHITIPA KARONGAA.D.D. R.D.P R.D.P
Total maize 1387.76 1455.70 1283.87Hybrid 2200.00 2708.33 1806.45Composite 1384.62 - 1384.62Local pure stand 1406.11 1398.65 1419.75Local /G-nuts 909.09 1333.33 615.38Local /pulses 1033.9 1053.57 1000.00Local /millet 2000.00 2000.00 -Local /root crops .00 - .00Other .00 - .00
Total G-nuts 358.97 400.00 333.33Chalimbana 583.33 500.00 750.00Manipinta 250.00 500.00 166.67Malimba 375.00 - 375.00Other local variety 200.00 250.00 200.00
Total rice 3913.67 2333.33 3948.53Kilombera 3666.67 2000.00 3698.11Other local 2333.33 - 2333.33Faya 6090.91 - 6090.91Other 4111.11 3000.00 4176.47
Total pulses 309.86 309.86 .00Mixed beans 292.31 292.31 .00Other 500.00 500.00 -
Total millet 4800.00 4800.00 -Finger 5222.22 5222.22 -Bullrush 1000.00 1000.00 -
121

STATISTICAL TABLES
FOR
NSSA 1992/93
MZUZU A.D.D.
122/123/124

LIST OF STATISTICAL TABLES FOR MZUZU A.D.D. Table Table title page Number G1.0 Number and percentage of gardens by holding size 129 category G2.0 Percentage of cultivated area by ploughing method 130 Used and holding size category G3.0 Percentage of cultivated area by ridging method used 131 And holding size category G4.0 Percentage of cultivated area by planting method used 132 And holding size category G5.0 Percentage of cultivated area by source of permission 134 To use land and R.D.P. G6.0 Number of plots by holding size category and R.D.P. 134 G7.0 Percentage of plots by maize variety and R.D.P 134 G8.0 Percentage of plots by source of seed and maize variety 135 G9.0 Percentage of plots to which fertilizer was applied by type 136 Of fertilizer G10.0 Percentage of plots to which fertilizer was applied by type 136 Of fertilizer G11.0 Percentage of maize plots to which fertilizer was applied by 137 Type of fertilizer, R.D.P. and sex of household head G12.0 Percentage of maize plots to which fertilizer was applied to 138 By type of fertilizer, R.D.P. and sex of household head G13.0 Percentage of plots to which fertilizer was applied by maize 139 Variety G14.0 Percentage of plots to which fertilizer was applied by maize 140 Variety G15.0 Percentage of maize plots to which fertilizer was applied by 141 Maize variety for male headed households
125

G16.0 Percentage of maize plots to which fertilizer was applied by 142 Maize variety for male headed households G17.0 Percentage of maize plots to which fertilizer was applied by 143 Maize variety for female headed households G18.0 Percentage of maize plots to which fertilizer was applied by 143 Maize variety for female headed households G19.0 Fertilizer application on area planted with maize and rice by 145 R.D.P. G20.0 Fertilizer application on area planted with maize and rice for 146 Female headed households by R.D.P. G21.0 Fertilizer application on area planted with maize and rice for 147 Female headed households by R.D.P. G22.0 Percentage of plots to which fertilizer was applied by sex of 148 Household head and source of financing G23.0 Cropping pattern by R.D.P. (Thousand Hectares) 149 G24.0 Percentage cropping pattern by R.D.P. 150 G25.0 Cropping pattern for male headed households by R.D.P. 151 ( Thousand Hectares ) G26.0 Cropping pattern for female headed households by R.D.P. 152 (Thousand Hectares) G27.0 Production for selected crops by R.D.P. (Thousand Tones) 153 G28.0 Production for selected crops for male headed households by 154 R.D.P. (Thousand Tones) G29.0 Production for selected crops for female headed households 155 By R.D.P. (Thousand Tones) G30.0 Mean yield for selected crops by R.D.P. (Kilograms/Hectare) 156 G31.0 Mean yield for selected crops for male headed households by 157 R.D.P (Kilograms/Hectare) G32.0 Mean yield for selected crops for female headed households by 158 R.D.P. (Kilograms/Hectare)
126/127/128

TABLE G1.0 Number and Percentage of Gardens by Holding Size Category
Total Holding Size Category (Hectares)
A.D.D./R.D.P. Under 0.50 0.50-0.99 1.00-1.49 1.50-1.99 2.00-2.49 2.50-2.993.00 and
overMzuzu A.D.D.Number 238820 51339 70450 49045 27860 22777 10156 7193Percentage 100.0 21.5 29.5 20.5 11.7 9.5 4.3 3.0
Nkhatabay R.D.PNumber 19340 13472 3589 1199 443 273 364 0Percentage 100.0 69.7 18.6 6.2 2.3 1.4 1.9 .0
Rumphi/N.Mzimba R.D.P.Number 55817 19909 22176 8922 3347 1070 393 0Percentage 100.0 35.7 39.7 16.0 6.0 1.9 .7 .0
Central Mzimba R.D.P.Number 87689 11381 22437 24121 12176 8439 4981 4154Percentage 100.0 13.0 25.6 27.5 13.9 9.6 5.7 4.7
South Mzimba R.D.P.Number 75974 6577 22248 14803 11894 12995 4418 3039Percentage 100.0 8.7 29.3 19.5 15.7 17.1 5.8 4.0
129

TABLE G2.0 Percentage of Cultivated Area by Ploughing Method Used and Holding Size Category
Ploughing Method Total Holding Size Category ( Hectares)
Under 0.50 0.50 - 0.99 1.00 - 1.49 1.50 - 1.99 2.00 - 2.49 2.50 - 2.993.00 and
overMzuzu A.D.D.Total 100.0 10.1 24.8 22.2 14.4 12.6 7.7 8.2Not ploughed this season 80.5 8.9 20.7 18.4 12.4 9.7 5.4 4.9Tilled by hoeing 6.7 .7 2 2 .5 .5 .6 .5Ploughed by oxen 12.7 .5 2.0 1.8 1.4 2.3 1.8 2.8Other .1 .0 .1 .0 - - - -
Nkhatabay R.D.P.Total 100.0 40.3 28.2 14.2 8.5 4.1 4.7 -Not ploughed this season 76.6 32.9 21.4 8.8 4.7 4.1 4.7 -Tilled by hoeing 23.4 7.3 6.8 5.4 3.8 - - -
Rumphi/N.Mzimba R.D.P.Total 100.0 19.7 43.4 23.4 9.5 2.8 1.3 -Not ploughed this season 89.6 17.7 38.2 20.2 9.5 2.8 1.2 -Tilled by hoeing 7.9 1.2 3.6 3.1 0 0 .1 -Ploughed by oxen 2.4 .8 1.6 .1 - - - -Other .1 .0 .1 - - - - -
Central Mzimba R.D.PTotal 100.0 5.5 18.6 26.4 15.1 12.8 9.3 12.2Not ploughed this season 75.8 4.8 14.3 21.4 11.8 8.8 6.4 8.3Tilled by hoeing 6.2 .0 1.4 1.9 .5 .6 .6 1.1Ploughed by oxen 18.0 .7 2.9 3.0 2.8 3.5 2.3 2.8Other .0 - - .0 - - - -
South Mzimba R.D.PTotal 100.0 4.5 19.3 17.3 17.7 20.4 10.7 10.0Not ploughed this season 80.8 4.3 16.7 14.8 16.5 16.8 7.1 4.7Tilled by hoeing 3.9 .1 .8 .8 .4 .8 1.0 .1Ploughed by oxen 15.0 .1 1.5 1.7 .8 2.9 2.6 5.3Other .3 - .3 - - - - -
130

TABLE G3.0 Percentage of cultivated Area by Ridging Method Used and Holding Size Category
Ridging Method Total
Under 0.50 0.50 - 0.99 1.00 - 1.49 1.50 - 1.99 2.00 - 2.49 2.50 - 2.993.00 and
overMzimba A.D.D.Total 100.0 10.1 24.8 22.2 14.4 12.6 7.7 8.2Not ridged this season 12.0 1.9 2.7 2.6 1.9 1.2 .9 .8Ridged by hoeing 56.6 6.5 16.6 13.2 7.4 5.7 3.5 3.6Ridged by oxen 31.3 1.7 5.4 6.4 5.0 5.7 3.3 3.8Other .1 .1 .1 - - - - -
Nkhatabay R.D.P.Total 100.0 40.3 28.2 14.2 8.5 4.1 4.7 -Not ridged this season 63.0 28.1 13.2 7.4 6.5 3.5 4.5 -Ridged by hoeing 35.8 11.1 15.1 6.8 2.0 .6 .2 -Other 1.1 1.1 - - - - - -
Rumphi/ N.Mzimba R.D.PTotal 100.0 19.7 43.4 23.4 9.5 2.8 1.3 -Not ridged this season 6.7 .9 2.3 2.6 .9 .0 .1 -Ridged by hoeing 91.1 18.2 39.6 20.7 8.6 2.8 1.2 -Ridged by oxen 2.2 .6 1.5 0.1 - - - -Other .0 .0 - - - - - -
Central Mzimba R.D.P.Total 100.0 5.5 18.6 26.4 15.1 12.8 9.3 12.2Not ridged this season 9.4 .3 1.5 2.9 1.6 .8 .5 1.8Ridged by hoeing 56.8 3.0 9.5 17 7.2 7.8 4.6 7.7Ridged by oxen 33.7 2.2 7.5 6.5 6.3 4.2 4.3 2.8Other .1 - .1 - - - - -
South Mzimba R.D.P.Total 100.0 4.5 19.3 17.3 17.7 20.4 10.7 10.0Not ridged this season 11.0 .4 3.0 1.4 2.3 2.1 1.5 .3Ridged by hoeing 35.6 2.1 10.0 4.2 7.6 5.9 4.3 1.5Ridged by oxen 53.4 1.9 6.4 11.7 7.8 12.5 4.8 8.3
Holding Size Category ( Hectares )
131

TABLE G4.0 Percentage of cultivated Area by Planting Method Used and Holding Size Category
Planting Method Total Holding Size Category ( Hectares )
Under 0.50 0.50 - 0.99 1.00-1.49 1.50-1.99 2.00-2.49 2.50-2.993.00 and over
Mzuzu A.D.D.Total 100.0 10.1 24.8 22.2 14.4 12.6 7.7 8.2Flat planted 6.9 .5 1.3 1.1 1.3 1.1 .8 .8Used last season ridges 3.6 .3 .7 1.3 .5 .4 .2 .1Used this season ridges 87.0 8.2 22.1 19.4 12.3 11.1 6.6 7.2Planted into holes .4 .1 .2 .1 .0 .0 - .0Planted into mounds 1.8 .9 .5 .2 .2 .0 - -Other .3 .1 .1 .1 .1 - - .0
Nkhatabay R.D.P.Total 100.0 40.3 28.2 14.2 8.5 4.1 4.7 -Flat planted 21.8 4.7 3.3 2.1 3.8 3.5 4.5 -Used last season ridges 5.3 3.8 1.4 - - - - -Used this season ridges 34.6 12.7 12.2 6.9 2 0.6 0.2 -Planted into holes 2.5 1.1 1.3 - - - -Planted into mounds 32.4 16.3 9.1 4.4 2.7 - - -Other 3.4 1.7 .9 .8 - - - -
Rumphi/ N. Mzimba R.D.P.Total 100.0 19.6 43.5 23.4 9.5 2.8 1.3 -Flat planted 2.3 .7 1.0 .5 .0 .0 .1 -Used last season ridges 5.0 .4 1.1 2.3 1.1 - .0 -Used this season ridges 92.0 18.4 40.9 20.5 8.2 2.8 1.2 -Planted into holes .4 - .3 - .1 - - -Planted into mounds .0 - - - .0 - - -Other .2 .0 .1 - - - - -
continued…
132

TABLE G4.0. Percentage of Cultivated Area by Planting Method Used and Holding Size Category
Planting Method Total Holding Size Category (Hectares)
Under 0.50 0.50-0.99 1.00-1.49 1.50-1.99 2.00-2.49 2.50-2.993.00 and over
Central MzimbaR.D.PTotal 100.0 5.5 18.6 26.4 15.1 12.8 9.3 12.2FlatPlanted 6.8 0.1 1.1 1.7 1.0 0.8 0.3 1.6Used last season ridges 3.1 0.1 0.2 1.3 0.5 0.4 0.2 0.3Used this season ridges 89.6 5.3 17.1 23.1 13.5 11.6 8.8 10.2
Planted into holes 0.4 - 0.2 0.2 - - - -Planted into mounds 0.1 - - - 0.1 - - -Other 0.1 0.0 - 0.0 - - - 0.0
South Mzimba R.D.P.Total 100.0 4.5 19.4 17.3 17.7 20.4 10.7 10.0FlatPlanted 8.0 0.2 1.6 0.5 2.2 1.7 1.4 0.4Used last season ridges 3.1 0.0 0.8 0.9 0.1 0.8 0.5 -Used this season ridges 88.6 4.1 17.0 15.9 15.4 17.8 8.7 9.6
Planted into holes 0.1 - - 0.1 0.0 0.0 - 0.0Planted into mounds 0.2 0.1 - - - 0.1 - -
133

TABLE G5.0. Percentage of Cultivated Area by Source of Permission to use land and R.D.P.
A.D.D./R.D.PTotal Relative by
birth-male Relative by birth female
Relative by Marriage-male
Relative by marriage-female Borrowed
Estate/ scheme Other
Mzuzu A.D.D 100.0 33.5 7.0 19.3 6.3 30.2 0.4 3.2Nkhata bay R.D.P. 100.0 - - 62.3 6.3 31.4 - -Rumphi/ N.Mzimba R.D.P 100.0 36.0 1.7 8.1 5.4 38.5 1.5 8.8Central MzimbaR.D.P. 100.0 45.5 9.5 24.3 3.3 17.5 - -South Mzimba R.D.P 100.0 21.9 9.9 15.8 10.8 38.8 - 2.7
TABLE G6.0. Number of Plots by Holding size Category and R.D.P.
Holding Size Category (Hectares)
A.D.D,/R.D.P. TOTAL Under 0.50 0.50-0.99 1.00-1.49 1.50-1.99 2.00-2.49 2.50-2.993.00 and over
Mzuzu A.D.D 335113 58514 94140 70141 39195 37262 19319 16542Nkhata bay R.D.P. 20302 13646 3937 1463 619 273 364 0Rumphi/ N.Mzimba R.D.P 75430 23242 30584 12882 5786 2150 786 0Central MzimbaR.D.P. 145722 14252 34233 37881 17678 17488 12545 11645South Mzimba R.D.P 93659 7374 25386 17915 15112 17351 5624 4897
TABLE G7.0.Percentage of Plots by Maize Variety and R.D.P.
A.D.D./R.D.P. Total Type of Maize
Hybrid CompositeLocal Pure Stand Local/G.nuts
Local/ Other Crop Other
Mzuzu A.D.D 100.0 32.4 0.2 58.4 2.4 3.6 2.9Nkhata bay R.D.P. 100.0 32.1 7.0 55.3 2.8 2.8 0.0Rumphi/ N.Mzimba R.D.P 100.0 44.6 0.2 43.2 1.4 5.8 4.8Central MzimbaR.D.P. 100.0 29.6 0.0 61.5 4.0 3.0 1.8South Mzimba R.D.P 100.0 26.9 0.3 66.3 0.8 2.8 2.9
134
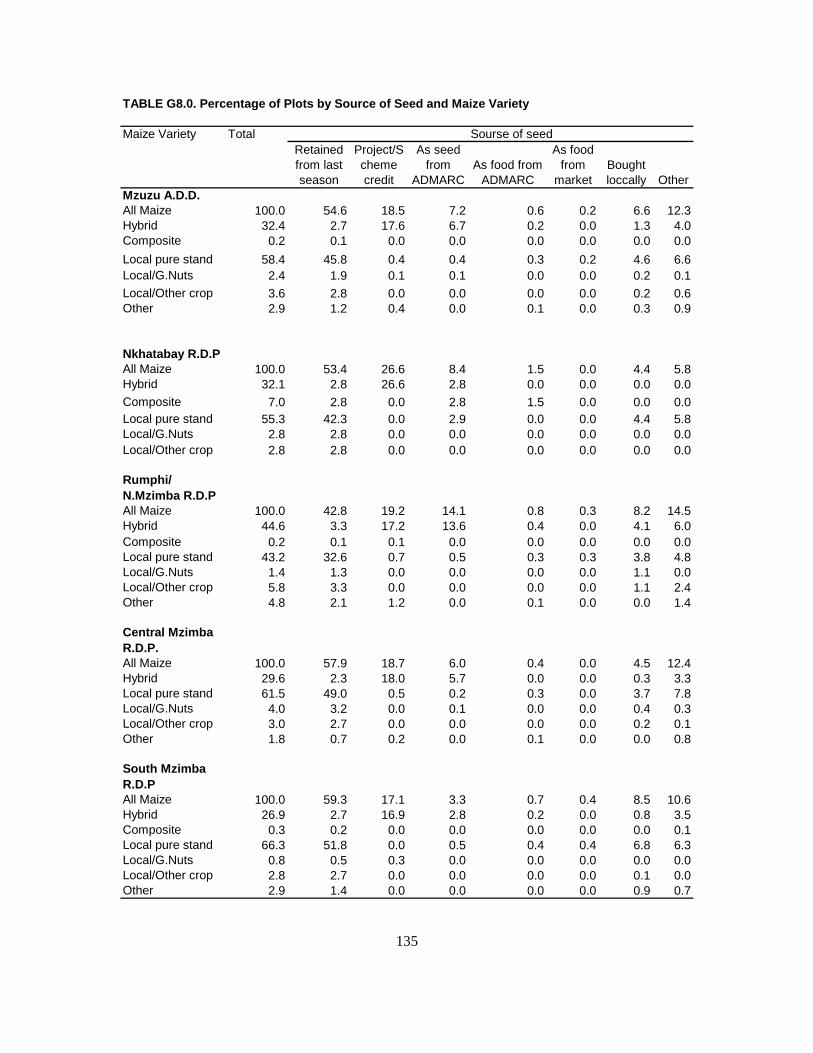
TABLE G8.0. Percentage of Plots by Source of Seed and Maize Variety
Maize Variety Total Sourse of seedRetained from last season
Project/Scheme credit
As seed from
ADMARCAs food from
ADMARC
As food from
marketBought loccally Other
Mzuzu A.D.D.All Maize 100.0 54.6 18.5 7.2 0.6 0.2 6.6 12.3Hybrid 32.4 2.7 17.6 6.7 0.2 0.0 1.3 4.0Composite 0.2 0.1 0.0 0.0 0.0 0.0 0.0 0.0Local pure stand 58.4 45.8 0.4 0.4 0.3 0.2 4.6 6.6Local/G.Nuts 2.4 1.9 0.1 0.1 0.0 0.0 0.2 0.1Local/Other crop 3.6 2.8 0.0 0.0 0.0 0.0 0.2 0.6Other 2.9 1.2 0.4 0.0 0.1 0.0 0.3 0.9
Nkhatabay R.D.PAll Maize 100.0 53.4 26.6 8.4 1.5 0.0 4.4 5.8Hybrid 32.1 2.8 26.6 2.8 0.0 0.0 0.0 0.0Composite 7.0 2.8 0.0 2.8 1.5 0.0 0.0 0.0Local pure stand 55.3 42.3 0.0 2.9 0.0 0.0 4.4 5.8Local/G.Nuts 2.8 2.8 0.0 0.0 0.0 0.0 0.0 0.0Local/Other crop 2.8 2.8 0.0 0.0 0.0 0.0 0.0 0.0
Rumphi/ N.Mzimba R.D.PAll Maize 100.0 42.8 19.2 14.1 0.8 0.3 8.2 14.5Hybrid 44.6 3.3 17.2 13.6 0.4 0.0 4.1 6.0Composite 0.2 0.1 0.1 0.0 0.0 0.0 0.0 0.0Local pure stand 43.2 32.6 0.7 0.5 0.3 0.3 3.8 4.8Local/G.Nuts 1.4 1.3 0.0 0.0 0.0 0.0 1.1 0.0Local/Other crop 5.8 3.3 0.0 0.0 0.0 0.0 1.1 2.4Other 4.8 2.1 1.2 0.0 0.1 0.0 0.0 1.4
Central Mzimba R.D.P.All Maize 100.0 57.9 18.7 6.0 0.4 0.0 4.5 12.4Hybrid 29.6 2.3 18.0 5.7 0.0 0.0 0.3 3.3Local pure stand 61.5 49.0 0.5 0.2 0.3 0.0 3.7 7.8Local/G.Nuts 4.0 3.2 0.0 0.1 0.0 0.0 0.4 0.3Local/Other crop 3.0 2.7 0.0 0.0 0.0 0.0 0.2 0.1Other 1.8 0.7 0.2 0.0 0.1 0.0 0.0 0.8
South Mzimba R.D.PAll Maize 100.0 59.3 17.1 3.3 0.7 0.4 8.5 10.6Hybrid 26.9 2.7 16.9 2.8 0.2 0.0 0.8 3.5Composite 0.3 0.2 0.0 0.0 0.0 0.0 0.0 0.1Local pure stand 66.3 51.8 0.0 0.5 0.4 0.4 6.8 6.3Local/G.Nuts 0.8 0.5 0.3 0.0 0.0 0.0 0.0 0.0Local/Other crop 2.8 2.7 0.0 0.0 0.0 0.0 0.1 0.0Other 2.9 1.4 0.0 0.0 0.0 0.0 0.9 0.7
135

TABLEG9.0. Percentage of Plots to which Fertilizer was applied by Type of Fertilizer
A.D.D/R.D.P First Application
Total None used 20:20:0 Sulphate of Ammonia DAP 23:21:0+CAN UREA Mixture
Mzuzu A.D.D. 100.0 61.4 1.4 0.4 8.6 0.9 2.3 2.3 18.2Nkhatabay R.D.P. 100.0 92.9 0.0 1.6 1.5 0.9 0.2 0.0 2.8Rumphi/N.Mzimba R.D.P. 100.0 52.7 2.3 0.7 19.2 0.6 5.1 5.9 11.7Central Mzimba R.D.P. 100.0 61.3 1.8 0.3 6.5 1.3 1.5 7.6 18.0South Mzimba R.D.P. 100.0 61.7 0.5 0.0 4.8 0.6 1.8 2.5 27.2
TABLEG10.0. Percentage of Plots to which Fertilizer was Applied by Type of Fertilizer
A.D.D/R.D.P Second Application
Total None used 20:20:0 Sulphate of Ammonia DAP CAN UREA Mixture Other
Mzuzu A.D.D. 100.0 82.8 0.1 0.3 0.3 2.3 9.3 5.0 0.0Nkhatabay R.D.P. 100.0 96.2 0.0 0.9 0.0 0.4 1.6 0.9 0.0Rumphi/N.Mzimba R.D.P. 100.0 78.1 0.2 0.7 0.4 5.8 13.7 1.0 0.0Central Mzimba R.D.P. 100.0 82.4 0.0 0.1 0.2 0.3 11.2 5.7 0.1South Mzimba R.D.P. 100.0 84.5 0.0 0.0 0.3 2.9 4.5 7.9 0.0
136

TABLE G11.0. Percentage of Maize Plots to which Fertilizer was Applied by Type of Fertilizer, R.D.P. and Sex of Household Head
A.D.D./R.D.P First Application
Total None used 20:20:0 Sulphate of Ammonia DAP 23:21:0+4s CAN UREA Mixture Other
Mzuzu A.D.DTotal 100.0 61.4 1.4 0.4 8.6 0.9 2.3 5.3 18.2 1.5Male 82.4 49.5 1.3 0.3 7.5 0.9 1.9 4.6 15.1 1.3Female 17.6 11.9 0.1 0.1 1.1 0.0 0.5 0.7 3.1 0.1Nkhatabay R.D.P.Total 100.0 92.9 0.0 1.6 1.5 0.9 0.2 0.0 2.8 0.0Male 79.1 72.9 0.0 1.2 1.5 0.9 0.2 0.0 2.4 0.0Female 20.9 20.0 0.0 0.4 0.0 0.0 0.0 0.0 0.4 0.0
Rumphi/N.MzimbaR.D.PTotal 100.0 52.7 2.3 0.7 19.2 0.6 5.1 5.9 11.7 2.0Male 77.1 38.0 2.1 0.7 15.6 0.6 4.0 5.2 9.2 1.7Female 22.9 14.7 0.2 0.0 3.6 0.0 1.1 0.7 2.4 0.3
Central Mzimba R.D.P.Total 100.0 61.3 1.8 0.3 6.5 1.3 1.5 7.6 18.0 1.7Male 78.4 47.4 1.6 0.2 5.9 1.3 1.1 6.3 13.1 1.6Female 21.6 13.9 0.2 0.1 0.7 0.0 0.4 1.3 4.9 0.1
South Mzimba R.D.P.Total 100.0 61.7 0.5 0.0 4.8 0.6 1.8 2.5 27.2 0.9Male 93.6 57.0 0.5 0.0 4.8 0.6 1.7 2.4 25.6 0.9Female 6.4 4.6 0.0 0.0 0.0 0.0 0.1 0.1 1.6 0.0
137

TABLEG12.0.Percentage of Maize Plots to which Fertilizer was Applied to by Type of Fertilizer, R.D.P. and Sex of Household Head
A.D.D./R.D.P Second Application
Total None used 20:20:0Sulphate of Ammonia DAP CAN UREA Mixture Other
Mzuzu A.D.DTotal 100.0 82.8 0.1 0.3 0.3 2.3 9.3 5.0 0.0Male 82.4 67.7 0.1 0.2 0.2 2.1 7.7 4.4 0.0Female 17.6 15.1 0.0 0.1 0.1 0.2 1.6 0.6 0.0
Nkhatabay R.D.P.Total 100.0 96.2 0.0 0.9 0.0 0.4 1.6 0.9 0.0Male 79.1 75.3 0.0 0.9 0.0 0.4 1.6 0.9 0.0Female 20.9 20.9 0.0 0.0 0.0 0.0 0.0 0.0 0.0
Rumphi/N.MzimbaR.D.PTotal 100.0 78.1 0.2 0.7 0.4 5.8 13.7 1.0 0.0Male 77.1 58.9 0.2 0.7 0.4 5.0 10.8 1.0 0.0Female 22.9 19.2 0.0 0.0 0.0 0.8 2.9 0.0 0.0
Central Mzimba R.D.P.Total 100.0 82.4 0.0 0.1 0.2 0.3 11.2 5.7 1.1Male 78.4 64.1 0.0 0.0 0.0 0.3 9.3 4.6 1.1Female 21.6 18.3 0.0 0.1 0.2 0.0 1.9 1.1 0.0
South Mzimba R.D.P.Total 100.0 84.5 0.0 0.0 0.3 2.9 4.5 7.9 0.0Male 93.6 78.8 0.0 0.0 0.3 2.9 4.1 7.5 0.0Female 6.4 5.7 0.0 0.0 0.0 0.0 0.3 0.4 0.0
138

TABLE G13.0 Percentage of Plots to Which Fertilizer was Applied by Maize Variety`
Maize variety First Application
Total None used 20:20:0Sulphate of
Ammonia DAP 23:21:0+4s CAN UREA Mixture OtherMzuzu A.D.D.All Maize 100.0 47.4 1.9 0.4 12.9 1.2 3.0 7.4 25.3 0.5Hybrid 32.4 4.9 0.9 0.1 9.4 0.6 1.0 1.3 14.2 0.1Composite 0.2 0.1 0.0 0.0 0.1 0.0 0.0 0.0 0.0 0.0Local pure stand 58.4 36.2 0.6 0.3 2.9 0.5 1.7 5.5 10.4 0.4Local/G.Nuts 2.4 2.2 0.0 0.0 0.1 0.0 0.0 0.0 0.1 0.0Local/Other crop 3.6 2.6 0.1 0.0 0.2 0.0 0.1 0.3 0.3 0.0Other 2.9 1.4 0.2 0.0 0.2 0.1 0.2 0.4 0.3 0.1
Nkhatabay R.D.PAll Maize 100.0 66.3 0.0 2.8 10.0 2.8 1.5 0.0 16.7 0.0Hybrid 32.1 5.6 0.0 0.0 10.0 2.8 0.0 0.0 13.8 0.0Composite 7.0 5.5 0.0 0.0 0.0 0.0 1.5 0.0 0.0 0.0Local pure stand 55.3 49.7 0.0 2.8 0.0 0.0 0.0 0.0 2.9 0.0Local/G.Nuts 2.8 2.8 0.0 0.0 0.0 0.0 0.0 0.0 0.0 0.0Local/Other crop 2.8 2.8 0.0 0.0 0.0 0.0 0.0 0.0 0.0 0.0
Rumphi/ N.Mzimba R.D.PAll Maize 100.0 37.9 2.9 0.9 27.0 0.7 6.4 8.0 15.1 1.2Hybrid 44.6 6.9 1.9 0.3 20.1 0.7 2.8 2.3 9.4 0.3Composite 0.2 0.1 0.0 0.0 0.1 0.0 0.0 0.0 0.0 0.9Local pure stand 43.2 24.4 0.4 0.6 5.6 0.0 3.3 3.7 4.1 0.0Local/G.Nuts 1.4 1.3 0.0 0.0 0.0 0.0 0.0 0.1 0.0 0.0Local/Other crop 5.8 2.3 0.4 0.0 1.0 0.0 0.0 1.2 1.0 0.0Other 4.8 3.0 0.2 0.0 0.2 0.0 0.4 0.6 0.5 0.0
Central Mzimba R.D.P.All Maize 100.0 50.2 2.1 0.3 9.5 1.7 1.9 10.1 23.7 0.5Hybrid 29.6 4.7 0.9 0.1 7.5 0.8 0.6 1.4 13.6 0.0Local pure stand 61.5 38.4 0.9 0.1 1.8 0.7 1.2 8.2 9.8 0.4Local/G.Nuts 4.0 3.9 0.0 0.0 0.1 0.0 0.0 0.0 0.0 0.0Local/Other crop 3.0 2.7 0.0 0.0 0.0 0.0 0.1 0.0 0.1 0.0Other 1.8 0.4 0.4 0.0 0.1 0.3 0.0 0.5 0.1 0.1
South Mzimba R.D.PAll Maize 100.0 50.0 0.7 0.0 6.7 0.7 2.1 3.2 36.6 0.0Hybrid 26.9 304 0.2 0.0 3.6 0.1 0.4 0.3 18.8 0.0Composite 0.3 0.1 0.0 0.0 0.2 0.0 0.0 0.0 0.0 0.0Local pure stand 66.3 41.7 0.5 0.0 2.5 0.5 1.4 3.0 16.8 0.0Local/G.Nuts 0.8 0.4 0.0 0.0 0.0 0.0 0.0 0.0 0.4 0.0Local/Other crop 2.8 2.7 0.0 0.0 0.0 0.0 0.1 0.0 0.0 0.0Other 2.9 1.7 0.0 0.0 0.4 0.0 0.2 0.0 0.6 0.0
139

TABLE G14.0. Percentage of Plots to which Fertilizer was Applied by Maize VarietyMaize variety Second Application
Total None used 20:20:0 Sulphate of Ammonia DAP CAN UREA Mixture
Mzuzu A.D.D.All Maize 100.0 75.6 0.1 0.3 0.4 2.7 13.9 7.0Hybrid 32.4 13.6 0.0 0.1 0.1 1.8 11.6 5.3Composite 0.2 0.1 0.0 0.0 0.0 0.1 0.0 0.0Local pure stand 58.4 54.0 0.0 0.1 0.3 0.7 1.8 1.5Local/G.Nuts 2.4 2.4 0.0 0.0 0.0 0.0 0.0 0.1Local/Other crop 3.6 3.3 0.0 0.0 0.0 0.1 0.2 0.0Other 2.9 2.3 0.1 0.0 0.0 0.0 0.3 0.1Nkhatabay R.D.PAll Maize 100.0 81.6 0.0 2.8 0.0 2.8 10.1 2.8Hybrid 32.1 16.6 0.0 2.8 0.0 2.8 7.2 2.8Composite 7.0 7.0 0.0 0.0 0.0 0.0 0.0 0.0Local pure stand 55.3 52.4 0.0 0.0 0.0 0.0 2.9 0.0Local/G.Nuts 2.8 2.8 0.0 0.0 0.0 0.0 0.0 0.0Local/Other crop 2.8 2.8 0.0 0.0 0.0 0.0 0.0 0.0
Rumphi/ N.Mzimba R.D.PAll Maize 100.0 70.7 0.4 0.6 0.5 6.9 19.7 1.3Hybrid 44.6 22.7 0.0 0.3 0.2 4.3 16.2 0.8Composite 0.2 0.1 0.0 0.0 0.0 0.1 0.0 0.0Local pure stand 43.2 38.0 0.0 0.2 0.3 1.9 2.4 0.4Local/G.Nuts 1.4 1.4 0.0 0.0 0.0 0.0 0.0 0.0Local/Other crop 5.8 4.4 0.0 0.0 0.0 0.6 0.8 0.0Other 4.8 4.1 0.4 0.0 0.0 0.0 0.3 0.1Central Mzimba R.D.P.All Maize 100.0 75.7 0.0 0.2 0.3 0.3 16.0 7.5Hybrid 29.6 10.5 0.0 0.0 0.0 0.1 13.5 5.5Local pure stand 61.5 57.0 0.0 0.2 0.3 0.2 1.9 1.9Local/G.Nuts 4.0 4.0 0.0 0.0 0.0 0.0 0.0 0.0Local/Other crop 3.0 3.0 0.0 0.0 0.0 0.0 0.0 0.0Other 1.8 1.2 0.0 0.0 0.0 0.0 0.6 0.1South Mzimba R.D.PAll Maize 100.0 79.2 0.0 0.0 0.5 3.1 6.3 10.9Hybrid 26.9 10.8 0.0 0.0 0.1 2.3 5.1 8.6Composite 0.3 0.1 0.0 0.0 0.0 0.2 0.0 0.0Local pure stand 66.3 62.3 0.0 0.0 0.4 0.6 1.2 1.7Local/G.Nuts 0.8 0.5 0.0 0.0 0.0 0.0 0.0 0.3Local/Other crop 2.8 2.8 0.0 0.0 0.0 0.0 0.0 0.0Other 2.9 2.7 0.0 0.0 0.0 0.0 0.0 0.2
140

TABLEG15.0. Percent of Maize Plots to which Fertilizer was Applied by Maize variety for Male Headed Households
Maize variety
Total None used 20:20:0 Sulphate of Ammonia DAP 23:21:0+4s CAN UREA Mixture Other
Mzuzu A.D.D.All Maize 100.0 46.1 2.0 0.3 13.7 1.4 2.9 7.8 25.2 0.5Hybrid 33.2 4.8 1.1 0.1 10.2 0.7 1.1 1.2 13.8 0.1
Composite 0.3 0.1 0.0 0.0 0.1 0.0 0.0 0.0 0.0 0.0
Local pure stand 58.3 35.8 0.6 0.2 2.9 0.6 1.5 5.8 10.6 0.4
Local/G.Nuts 2.3 2.0 0.0 0.0 0.1 0.0 0.0 0.0 0.1 0.0Local/Other crop 3.1 2.1 0.1 0.0 0.1 0.0 0.1 0.3 0.3 0.0Other 2.9 1.3 0.2 0.0 0.3 0.1 0.2 0.4 0.3 0.1Nkhatabay R.D.PAll Maize 100.0 64.3 0 0 12.6 3.5 1.8 0.0 17.7 0.0Hybrid 37.2 7.0 0 0 12.6 3.5 0.0 0.0 14.0 0.0Composite 8.8 7.0 0 0 0 0 1.8 0.0 0.0 0.0
Local pure stand 46.9 43.2 0 0 0 0 0.0 0.0 3.7 0.0
Local/G.Nuts 3.5 3.5 0 0 0 0 0.0 0.0 0.0 0.0Local/Other crop 3.5 3.5 0 0 0 0 0.0 0.0 0.0 0.0Rumphi/ N.Mzimba R.D.PAll Maize 100.0 34.2 3.4 1.1 28.7 0.9 6.4 9.3 15.0 1.0Hybrid 46.9 5.9 2.4 0.3 22.4 0.9 2.8 2.4 9.3 0.4Composite 0.3 0.1 0.0 0.0 0.1 0 0.0 0.0 0.0 0.0Local pure stand 40.9 21.8 0.5 0.8 5.4 0 3.0 4.4 4.3 0.6Local/G.Nuts 1.9 1.7 0.0 0.0 0.0 0 0.0 0.2 0.0 0.0Local/Other crop 6.1 2.4 0.5 0.0 0.6 0 0.0 1.5 1.0 0.0Other 4.1 2.2 0.0 0.0 0.2 0 0.5 0.8 0.5 0.0Central Mzimba R.D.P.All Maize 100.0 49.4 2.3 0.1 11.0 2.2 1.7 10.8 21.7 0.7Hybrid 30.7 5.2 1.2 0.1 8.7 1.0 0.8 1.4 12.3 0.0Local pure stand 61.7 38.9 0.7 0.0 2.0 0.9 0.8 8.8 9.2 0.6Local/G.Nuts 3.5 3.4 0.0 0.0 0.1 0.0 0.0 0.0 0.0 0.0Local/Other crop 1.9 1.5 0.0 0.0 0.0 0.0 0.2 0.0 0.2 0.0Other 2.2 0.5 0.5 0.0 0.2 0.3 0.0 0.6 0.0 0.1South Mzimba R.D.PAll Maize 100.0 49.2 0.7 0.0 7.1 0.7 2.1 3.3 36.8 0.0Hybrid 26.9 3.3 0.3 0.0 3.8 0.1 0.4 0.3 18.7 0.0Composite 0.3 0.1 0.0 0.0 0.3 0.0 0.0 0.0 0.0 0.0Local pure stand 66.2 41.0 0.5 0.0 2.6 0.6 1.4 3.0 17.7 0.0Local/G.Nuts 0.8 0.4 0.0 0.0 0.0 0.0 0.0 0.0 0.4 0.0Local/Other crop 2.5 2.5 0.0 0.0 0.0 0.0 0.0 0.0 0.0 0.0Other 3.2 1.8 0.0 0.0 0.4 0.0 0.3 0.0 0.7 0.0
First Application
141

TABLE G16.0. Percent of Maize plots to which Fertilizer was applied by Maize variety for Male Headed Households
Maize variety
Total None used 20:20:0 Sulphate of Ammonia DAP CAN UREA Mixture
Mzuzu A.D.D.All Maize 100.0 74.8 0.1 0.2 0.3 3.0 14.1 7.5Hybrid 33.2 13.4 0.0 0.1 0.1 1.9 11.9 5.7Composite 0.3 0.2 0.0 0.0 0.0 0.1 0.0 0.0Local pure stand 58.3 53.9 0.0 0.1 0.2 0.8 1.8 1.6Local/G.Nuts 2.3 2.1 0.0 0.0 0.0 0.0 0.0 0.1Local/Other crop 3.1 2.8 0.0 0.0 0.0 0.2 0.1 0.0Other 2.9 2.4 0.1 0.0 0.0 0.0 0.3 0.1Nkhatabay R.D.PAll Maize 100.0 76.7 0.0 3.5 0.0 3.5 12.7 3.5Hybrid 37.2 17.5 0.0 3.5 0.0 3.5 9.1 3.5Composite 8.8 8.8 0.0 0.0 0.0 0.0 0.0 0.0Local pure stand 46.9 43.2 0.0 0.0 0.0 0.0 3.7 0.0Local/G.Nuts 3.5 3.5 0.0 0.0 0.0 0.0 0.0 0.0Local/Other crop 3.5 3.5 0.0 0.0 0.0 0.0 0.0 0.0Rumphi/ N.Mzimba R.D.PAll Maize 100.0 68.8 0.5 0.7 0.7 7.5 20.1 1.7Hybrid 46.9 22.8 0.0 0.4 0.3 4.5 17.8 1.1Composite 0.3 0.1 0.0 0.0 0.0 0.1 0.0 0.0Local pure stand 40.9 35.8 0.0 0.3 0.4 2.1 1.8 0.5Local/G.Nuts 1.9 1.9 0.0 0.0 0.0 0.0 0.0 0.0Local/Other crop 6.1 5.0 0.0 0.0 0.0 0.8 0.3 0.0Other 4.1 3.3 0.5 0.0 0.0 0.0 0.2 0.1Central Mzimba R.D.P.All Maize 100.0 74.7 0.0 0.0 0.0 0.4 17.1 7.8Hybrid 30.7 10.4 0.0 0.0 0.0 0.2 14.3 5.8Local pure stand 61.7 57.4 0.0 0.0 0.0 0.2 2.1 2.0Local/G.Nuts 3.5 3.5 0.0 0.0 0.0 0.0 0.0 0.0Local/Other crop 1.9 1.9 0.0 0.0 0.0 0.0 0.0 0.0Other 2.2 1.5 0.0 0.0 0.0 0.0 0.7 0.0South Mzimba R.D.PAll Maize 100.0 78.8 0.0 0.0 0.5 3.4 6.3 11.0Hybrid 26.9 10.8 0.0 0.0 0.1 2.4 4.9 8.6Composite 0.3 0.1 0.0 0.0 0.0 0.3 0.0 0.0Local pure stand 66.2 61.9 0.0 0.0 0.4 0.7 1.3 1.9Local/G.Nuts 0.8 0.5 0.0 0.0 0.0 0.0 0.0 0.3Local/Other crop 2.5 2.5 0.0 0.0 0.0 0.0 0.0 0.0Other 3.2 2.9 0.0 0.0 0.0 0.0 0.0 0.3
Second Application
142

TABLE G17.0. Percent of Maize Plots to which Fertilizer was Applied by Maize Variety for Female Headed Households
Maize variety
Total None used 20:20:0 Sulphate of Ammonia DAP CAN UREA Mixture Other
Mzuzu A.D.D.All Maize 100.0 53.1 1.2 0.6 9.3 3.8 5.7 25.8 0.6Hybrid 29.1 5.5 0.0 0.0 5.7 0.8 1.4 15.8 0.0Local pure stand 58.9 37.8 0.9 0.6 2.7 2.9 4.2 9.2 0.6Local/G.Nuts 3.3 3.3 0.0 0.0 0.0 0.0 0.0 0.0 0.0Local/Other crop 6.1 4.9 0.0 0.0 0.7 0.2 0.0 0.3 0.0Other 2.6 1.7 0.2 0.0 0.2 0.0 0.0 0.5 0.0Nkhatabay R.D.PAll Maize 100.0 73.8 0.0 13.1 0.0 0.0 0.0 13.1 0.0Hybrid 13.1 0.0 0.0 0.0 0.0 0.0 0.0 13.1 0.0Local pure stand 86.9 73.8 0.0 13.1 0.0 0.0 0.0 0.0 0.0Rumphi/ N.Mzimba R.D.PAll Maize 100.0 49.9 1.0 0.0 21.7 6.6 3.7 15.2 1.9Hybrid 37.1 10.0 0.0 0.0 12.5 2.5 2.1 10.0 0.0Local pure stand 50.6 32.8 0.2 0.0 6.5 4.1 1.5 3.6 1.9Local/Other crop 4.9 1.6 0.0 0.0 2.2 0.0 0.0 1.1 0.0Other 7.4 5.5 0.8 0.0 0.5 0.0 0.0 0.5 0.0Central Mzimba R.D.P.All Maize 100.0 52.7 1.5 0.7 4.5 2.6 7.6 30.4 0.0Hybrid 25.9 3.2 0.0 0.0 3.2 0.0 1.4 18.1 0.0Local pure stand 60.9 36.9 1.5 0.7 1.3 2.6 6.2 11.8 0.0Local/G.Nuts 5.8 5.8 0.0 0.0 0.0 0.0 0.0 0.0 0.0Local/Other crop 6.9 6.9 0.0 0.0 0.0 0.0 0.0 0.0 0.0Other 0.5 0.0 0.0 0.0 0.0 0.0 0.0 0.5 0.0
South Mzimba R.D.PAll Maize 100.0 61.0 0.0 0.0 0.0 2.9 2.3 33.8 0.0Hybrid 25.9 5.4 0.0 0.0 0.0 0.0 0.0 20.5 0.0Local pure stand 67.3 50.7 0.0 0.0 0.0 0.9 2.3 13.3 0.0Local/Other crop 6.8 4.8 0.0 0.0 0.0 1.9 0.0 0.0 0.0
First Application
143

TABLEG18.0. Percentage of Maize Plots to which Fertilizer was Applied by Maize Variety for Female Headed Households
Maize variety Second Application
Total None usedSulphate of Ammonia DAP CAN UREA Mixture
Mzuzu A.D.D.All Maize 100.0 79.4 0.5 0.7 1.5 13.3 4.6Hybrid 29.1 14.3 0.0 0.0 1.2 10.2 3.4Local pure stand 58.9 54.3 0.5 0.7 0.3 2.1 0.9Local/G.Nuts 3.3 3.3 0.0 0.0 0.0 0.0 0.0Local/Other crop 6.1 5.5 0.0 0.0 0.0 0.7 0.0Other 2.6 2.0 0.0 0.0 0.0 0.2 0.3
Nkhatabay R.D.PAll Maize 100.0 100.0 0.0 0.0 0.0 0.0 0.0Hybrid 13.1 13.1 0.0 0.0 0.0 0.0 0.0Local pure stand 86.9 86.9 0.0 0.0 0.0 0.0 0.0Rumphi/ N.Mzimba R.D.PAll Maize 100.0 76.8 0.0 0.0 5.0 18.2 0.0Hybrid 37.1 22.4 0.0 0.0 3.9 10.8 0.0Local pure stand 50.6 45.1 0.0 0.0 1.1 4.4 0.0Local/Other crop 4.9 2.7 0.0 0.0 0.0 2.2 0.0Other 7.4 6.6 0.0 0.0 0.0 0.8 0.0Central Mzimba R.D.P.All Maize 100.0 79.3 0.9 1.3 0.0 12.2 6.3Hybrid 25.9 10.8 0.0 0.0 0.0 10.8 4.3Local pure stand 60.9 55.9 0.9 1.3 0.0 1.4 1.5Local/G.Nuts 5.8 5.8 0.0 0.0 0.0 0.0 0.0Local/Other crop 6.9 6.9 0.0 0.0 0.0 0.0 0.0Other 0.5 0.0 0.0 0.0 0.0 0.0 0.5
South Mzimba R.D.PAll Maize 100.0 84.2 0.0 0.0 0.0 7.0 8.9Hybrid 25.9 10.1 0.0 0.0 0.0 7.0 8.9Local pure stand 67.3 67.3 0.0 0.0 0.0 0.0 0.0Local/Other crop 6.8 6.8 0.0 0.0 0.0 0.0 0.0
144

TABLE G19.0 Fertilizer Application on Area Planted with Maize and Rice by R.D.P.
R.D.P.Total Area (Hectares)
Area Fertilised (Hectares)
Percentage Fertilised
Nkhatabay R.D.PTotal Maize 1851.99 457.53 24.70Hybrid 558.95 428.22 76.61Composite 192.21 0.47 0.24Local pure stand 1033.34 28.85 2.79Local/G-nuts 29.30 - -Local/Other crop 38.18 - -Total Rice 125.60 67.73 53.93Kilombera 116.39 67.73 58.19Other local 1.78 - -Faya 7.44 - -Rumphi/N.Mzimba R.D.PTotal Maize 23865.30 14991.81 62.82Hybrid 10148.97 8380.81 82.58Composite 91.00 42.64 46.86Local pure stand 10724.57 4847.73 45.20Local /G-nuts 79.90 0.68 0.85Local/Other crop 1997.49 1366.04 68.39Other 823.37 353.91 42.98Central Mzimba R.D.PTotal Maize 33923.41 19877.57 58.60Hybrid 11510.27 9892.72 85.95Local pure stand 19412.24 9173.72 47.26Local /G-nuts 1618.17 60.02 3.71Local/Other crop 701.09 184.93 26.38Other 681.64 566.18 83.06
South Mzimba R.D.PTotal Maize 26733.46 16122.06 60.31Hybrid 8565.77 7939.85 92.69Composite 131.78 118.76 90.12Local pure stand 16534.03 7568.87 45.78Local /G-nuts 296.33 232.61 78.50Local/Other crop 766.70 53.33 6.96Other 438.86 208.64 47.54
145

TABLEG20.0 Fertilizer application on Area planted withMaize and Rice for Male Headed Households by R.D.P
`Total Area (Hectares)
Area Fertilised (Hectares)
Percentage Fertilised
Nkhatabay R.D.PTotal Maize 1370.81 358.07 26.12Hybrid 485.48 354.74 73.07Composite 192.21 0.47 0.24Local pure stand 625.63 2.86 0.46Local/G-nuts 29.30 - -Local/Other crop 38.18 - -Total Rice 118.16 67.73 57.32Kilombera 116.39 67.73 58.19Other local 1.78 - -Rumphi/N.Mzimba R.D.PTotal Maize 18521.65 12277.43 66.29Hybrid 8564.69 7532.60 87.95Composite 91.00 42.64 46.86Local pure stand 7647.88 3243.20 42.41Local /G-nuts 79.90 0.68 0.85Local/Other crop 1618.31 1184.13 73.17Other 519.88 274.18 52.74Central Mzimba R.D.PTotal Maize 26440.63 15923.24 60.22Hybrid 9617.60 8312.53 86.43Local pure stand 14636.57 6833.41 46.69Local /G-nuts 1176.34 60.02 5.10Local/Other crop 362.30 184.93 51.04Other 647.81 532.35 82.18South Mzimba R.D.PTotal Maize 24833.78 15081.26 60.73Hybrid 8013.88 7464.32 93.14Composite 131.78 118.76 90.12Local pure stand 15338.05 7056.94 46.01Local /G-nuts 296.33 232.61 78.50Local/Other crop 614.88 - -Other 438.86 208.64 47.54
146

TABLE G21.0. Fertilizer Application on Area Planted with Maize and Rice for Female Headed Households by R.D.P
R.D.P.Total Area (Hectares)
Area Fertilised (Hectares)
Percentage Fertilised
Nkhatabay R.D.PTotal Maize 481.18 99.46 20.67Hybrid 73.47 73.47 100.00Local pure stand 407.71 25.98 6.37Total Rice 7.44 - -Faya 7.44 - -Rumphi/N.Mzimba R.D.PTotal Maize 5343.64 2714.38 50.80Hybrid 1584.28 848.21 53.54Local pure stand 3076.69 1604.53 52.15Local/Other crop 379.18 181.91 47.97Other 303.50 79.73 26.27Central Mzimba R.D.PTotal Maize 7482.79 3954.33 52.85Hybrid 1892.67 1580.19 83.49Local pure stand 4775.67 2340.31 49.00Local /G-nuts 441.83 - -Local/Other crop 338.79 - -Other 33.83 33.83 100.0South Mzimba R.D.PTotal Maize 1899.68 1040.80 54.79Hybrid 551.88 475.53 86.17Local pure stand 1195.98 511.94 42.81Local/Other crop 151.82 53.33 35.13
147

TABLEG22.0. Percentage of Plots to which Fertilizer was Applied by Sex of Household Head and Source of Financing
A.D.D/R.D.P Source of financing fertilizerTotal None used Cash Credit Combination Gift Other
Mzuzu A.D.D.Total 100.0 61.4 18.6 17.8 0.7 1.2 0.2Male 82.4 49.5 15.8 15.4 0.6 0.9 0.2Female 17.6 11.9 2.8 2.5 0.1 0.4 0.0Nkhatabay R.D.P.Total 100.0 92.9 1.8 4.6 0.0 0.7 0.0Male 79.1 72.9 1.8 4.2 0.0 0.2 0.0Female 20.9 20.0 0.0 0.4 0.0 0.4 0.0Rumphi/N.Mzimba R.D.P.Total 100.0 52.7 21.1 22.1 0.6 3.0 0.5Male 77.1 38.0 17.4 18.8 0.5 109 0.5Female 22.9 14.7 3.7 3.3 0.1 101 0.0Central Mzimba R.D.P.Total 100.0 61.3 19.1 17.6 0.6 1.0 0.3Male 78.4 47.4 15.1 14.3 0.5 0.8 0.3Female 21.6 13.9 4.0 3.3 0.1 0.3 0.0South Mzimba R.D.P.Total 100.0 61.7 19.4 17.6 1.0 0.3 0.0Male 93.6 57.0 18.6 16.7 1.0 0.3 0.0Female 6.4 4.6 0.9 0.9 0.0 0.0 0.0
148

TABLE G23.0 Cropping Pattern by R.D.P. (Thousand Hectares)
CropMzuzu A.D.D.
Nkhatabay R.D.P.
Rumphi/N.Mzimba R.D.P.
Central Mzimba R.D.P.
South Mzimba R.D.P
Total Maize 86.38 1.86 23.86 33.93 26.73Hybrid 30.77 0.56 10.14 11.51 8.56Composite 0.41 019 0.09 - 0.13Local pure stand 47.73 1.04 10.73 19.42 16.54Local/G-nuts 2.03 0.03 0.08 1.62 0.30Local/purses 3.46 - 2.00 0.70 0.76Local/Root crops 0.04 0.04 - - -Other 1.94 - 0.82 0.63 0.44Total/G-nuts 6.31 0.11 0.97 3.33 1.90Chalimbana 3.01 0.3 0.84 1.30 0.84Manipinta 0.05 0.00 0.05 0.00 0.00Malimba 0.19 - - 0.08 0.11Chitembana 0.04 - 0.02. 0.02 -Other local variety 2.09 0.08 0.06 1.08 .87Mixture 0.88 - - 0.80 .08Other/unknown 0.05 - - 0.05 -Total Rice 0.13 0.13 - - -Kilombera 0.12 0.12 - - -Other local 0.00 0.00 - - -Faya 0.01 0.01 - - -Total pulses 7.96 - 4.63 1.41 1.92Soya beans 0.50 - 0.04 0.07 0.39Mixed Beans 3.42 - 1.32 1.14 0.96White haricot 0.10 - 0.01 0.09 -Dolichos beans 0.04 - 0.04 0.00 -Other 3.90 - 3.22 0.11 0.57Total Millet 3.90 0.15 0.16 2.05 1.09Finger 3.74 0.12 0.60 2.05 0.97Bullrush 0.16 0.03 0.01 - 0.12Sunflower 1.62 - - 0.12 1.50Cassava 4.34 3.16 0.70 0.22 0.26Sweet potatoes 0.65 0.02 0.22 0.27 0.14Cotton 0.01 - 0.01 - -Total Tobbaco 0.95 - 0.36 0.37 0.22Dark fired 0.04 - - - 0.04Sun/Air 0.03 - - 0.03 -Burley 0.43 - 0.30 0.07 0.06Oriental 0.45 - 0.06 0.27 0.12
149

TABLE G25.0.Cropping Pattern for Male Headed Households by R.D.P. (Thousand Hectares)
CropMzuzu A.D.D.
Nkhatabay R.D.P.
Rumphi/N.Mzimba R.D.P.
Central Mzimba R.D.P.
South Mzimba R.D.P
Total Maize 71.18 1.38 18.52 26.45 24.83Hybrid 26.68 0.49 8.56 9.62 8.01Composite 0.41 0.19 0.09 - 0.13Local pure stand 38.26 .63 7.65 14.64 15.34Local/G-nuts 1.59 0.03 0.08 1.18 0.30Local/purses 2.59 - 1.62 0.36 0.61Local/Root crops 0.04 0.04 - - -Other 1.61 - 0.52 0.65 0.44Total/G-nuts 4.88 0.11 0.83 2.29 1.65Chalimbana 2.50 0.03 0.70 1.00 0.77Manipinta 0.05 0.00 0.05 0.00 0.00Malimba 0.16 - - 0.07 0.09Chitembana 0.02 - 0.02 - -Other local variety 1.31 0.08 0.06 0.46 0.71Mixture 0.79 - - 0.71 0.08Other/unknown 0.05 - - 0.05 -Total Rice 0.12 0.12 - - -Kilombera 0.12 0.12 - - -Other local 0.00 0.00 - - -Total pulses 6.76 - 4.19 0.83 1.74Soya beans 0.49 - 0.03 0.07 0.36Mixed Beans 2.59 - 1.11 0.67 0.81White haricot 0.08 - 0.01 0.07 -Dolichos beans 0.04 - 0.04 0.00 -Other 3.56 - 3.00 0.02 0.54Total Millet 3.53 0.12 0.60 1.72 1.09Finger 3.40 0.12 0.59 1.72 0.97Bullrush 0.13 - 0.01 - 0.12Sunflower 1.38 - - 0.10 1.28Cassava 3.49 2.43 0.62 0.18 0.26Sweet potatoes 0.46 0.02 0.15 0.15 0.14Cotton 0.01 - 0.01 - -Total Tobbaco 0.94 - 0.36 0.36 0.22Dark fired 0.04 - - - 0.04Sun/Air 0.03 - - 0.03 -Burley 0.43 - 0.30 0.07 0.06Oriental 0.44 - 0.06 0.26 0.12
150

TABLE G25.0.Cropping Pattern for Male Headed Households by R.D.P. (Thousand Hectares)
CropMzuzu A.D.D.
Nkhatabay R.D.P.
Rumphi/N.Mzimba R.D.P.
Central Mzimba R.D.P.
South Mzimba R.D.P
Total Maize 71.18 1.38 18.52 26.45 24.83
Hybrid 26.68 0.49 8.56 9.62 8.01Composite 0.41 0.19 0.09 - 0.13Local pure stand 38.26 .63 7.65 14.64 15.34Local/G-nuts 1.59 0.03 0.08 1.18 0.30Local/purses 2.59 - 1.62 0.36 0.61Local/Root crops 0.04 0.04 - - -Other 1.61 - 0.52 0.65 0.44
Total/G-nuts 4.88 0.11 0.83 2.29 1.65
Chalimbana 2.50 0.03 0.70 1.00 0.77Manipinta 0.05 0.00 0.05 0.00 0.00Malimba 0.16 - - 0.07 0.09Chitembana 0.02 - 0.02 - -Other local variety 1.31 0.08 0.06 0.46 0.71Mixture 0.79 - - 0.71 0.08Other/unknown 0.05 - - 0.05 -
Total Rice 0.12 0.12 - - -
Kilombera 0.12 0.12 - - -Other local 0.00 0.00 - - -
Total pulses 6.76 - 4.19 0.83 1.74
Soya beans 0.49 - 0.03 0.07 0.36Mixed Beans 2.59 - 1.11 0.67 0.81White haricot 0.08 - 0.01 0.07 -Dolichos beans 0.04 - 0.04 0.00 -Other 3.56 - 3.00 0.02 0.54
Total Millet 3.53 0.12 0.60 1.72 1.09
Finger 3.40 0.12 0.59 1.72 0.97Bullrush 0.13 - 0.01 - 0.12Sunflower 1.38 - - 0.10 1.28Cassava 3.49 2.43 0.62 0.18 0.26Sweet potatoes 0.46 0.02 0.15 0.15 0.14Cotton 0.01 - 0.01 - -
Total Tobbaco 0.94 - 0.36 0.36 0.22
Dark fired 0.04 - - - 0.04Sun/Air 0.03 - - 0.03 -Burley 0.43 - 0.30 0.07 0.06Oriental 0.44 - 0.06 0.26 0.12
151

TABLEG26.0 Cropping Pattern for Female Headed Households by R.D.P. (Thousand Hectares)
CropMzuzu A.D.D.
Nkhatabay R.D.P.
Rumphi/N.Mzimba R.D.P.
Central Mzimba R.D.P.
South Mzimba R.D.P
Total Maize 15.20 0.48 5.34 7.48 1.90
Hybrid 4.09 0.07 1.58 1.89 0.55Local pure stand 9.47 0.41 3.08 4.78 1.20Local/G-nuts 0.44 - - 0.44 -Local/other crop 0.87 - 0.38 0.34 0.15Other 0.33 - 0.30 0.03 -
Total/G-nuts 1.43 - 0.14 1.04 0.25
Chalimbana 0.51 - 0.14 0.30 0.07Malimba 0.03 - - 0.01 0.02Chitembana 0.02 - - 0.02 -Other local variety 0.78 - 0.00 0.62 0.16Mixture 0.09 - - 0.09 -Total Rice 0.01 0.01 - - -Faya 0.01 0.01 - - -
Total pulses 1.20 - 0.44 0.58 0.18
Soya beans 0.01 - 0.01 - -Mixed Beans 0.83 - 0.21 0.47 0.15White haricot 0.02 - - 0.02 -Other 0.34 - 0.22 0.09 .03.
Total Millet 0.37 0.03 0.01 0.33 -
Finger 0.34 - 0.01 0.33 -Bullrush 0.03 0.03 - - -Sunflower 0.24 - - 0.02 0.22Cassava 0.85 0.73 0.08 0.04 -Sweet potatoes 0.19 - 0.07 0.12 -Total Tobbaco 0.01 - - 0.01 -Oriental 0.01 - - 0.01 -
152
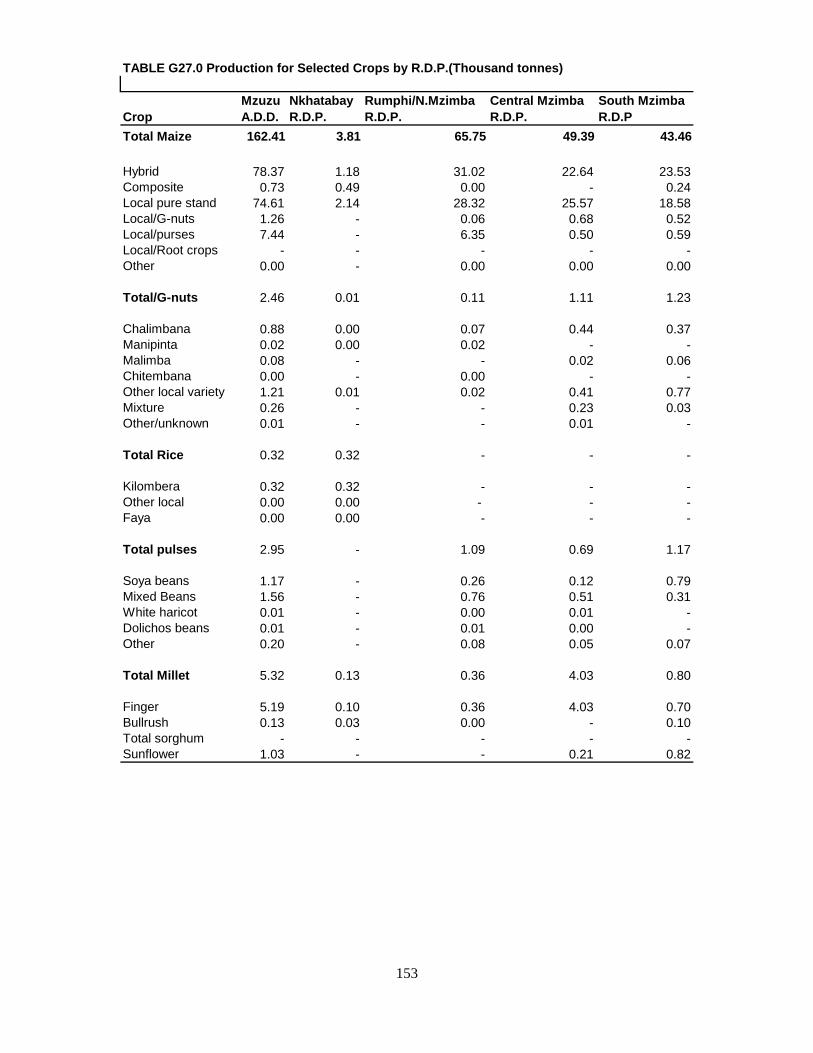
TABLE G27.0 Production for Selected Crops by R.D.P.(Thousand tonnes)
CropMzuzu A.D.D.
Nkhatabay R.D.P.
Rumphi/N.Mzimba R.D.P.
Central Mzimba R.D.P.
South Mzimba R.D.P
Total Maize 162.41 3.81 65.75 49.39 43.46
Hybrid 78.37 1.18 31.02 22.64 23.53Composite 0.73 0.49 0.00 - 0.24Local pure stand 74.61 2.14 28.32 25.57 18.58Local/G-nuts 1.26 - 0.06 0.68 0.52Local/purses 7.44 - 6.35 0.50 0.59Local/Root crops - - - - -Other 0.00 - 0.00 0.00 0.00
Total/G-nuts 2.46 0.01 0.11 1.11 1.23
Chalimbana 0.88 0.00 0.07 0.44 0.37Manipinta 0.02 0.00 0.02 - -Malimba 0.08 - - 0.02 0.06Chitembana 0.00 - 0.00 - -Other local variety 1.21 0.01 0.02 0.41 0.77Mixture 0.26 - - 0.23 0.03Other/unknown 0.01 - - 0.01 -
Total Rice 0.32 0.32 - - -
Kilombera 0.32 0.32 - - -Other local 0.00 0.00 - - -Faya 0.00 0.00 - - -
Total pulses 2.95 - 1.09 0.69 1.17
Soya beans 1.17 - 0.26 0.12 0.79Mixed Beans 1.56 - 0.76 0.51 0.31White haricot 0.01 - 0.00 0.01 -Dolichos beans 0.01 - 0.01 0.00 -Other 0.20 - 0.08 0.05 0.07
Total Millet 5.32 0.13 0.36 4.03 0.80
Finger 5.19 0.10 0.36 4.03 0.70Bullrush 0.13 0.03 0.00 - 0.10Total sorghum - - - - -Sunflower 1.03 - - 0.21 0.82
153

TABLE G28.0 Production for Selected Crops for Male Households by R.D.P. (Thousand Tonnes)
Crop Mzuzu A.D.D.
Nkhatabay R.D.P.
Rumphi/N.Mzimba R.D.P.
Central Mzimba R.D.P.
South Mzimba R.D.P
Total Maize 130.34 2.47 51.94 35.93 40.00
Hybrid 67.06 0.94 25.81 18.76 21.55Composite 0.73 0.49 0.00 - 0.24Local pure stand 55.21 1.04 20.47 16.47 17.23Local/G-nuts 1.12 0.00 0.06 0.54 0.52Local/purses 6.22 - 5.60 0.16 0.46Local/Root crops 0.00 0.00 - - -Other 0.00 - 0.00 0.00 0.00
Total/G-nuts 1.96 0.01 0.10 0.65 1.20
Chalimbana 0.72 0.00 0.06 0.32 0.34Manipinta 0.02 0.00 0.02 - -Malimba 0.08 - - 0.02 0.06Chitembana 0.00 - 0.00 - -Other local variety 0.93 0.01 0.02 0.13 0.77Mixture 0.20 - - 0.17 0.03Other/unknown 0.01 - - 0.01 -
Total Rice 0.32 0.32 - - -
Kilombera 0.32 0.32 - - -Other local 0.00 0.00 - - -
Total pulses 2.83 - 1.09 0.61 1.13
Soya beans 1.17 - 0.26 0.12 0.79Mixed Beans 1.47 - 0.74 0.46 0.27White haricot 0.01 - 0.00 0.01 -Dolichos beans 0.01 - 0.01 0.00 -Other 0.17 - 0.08 0.02 0.07
Total Millet 5.16 0.10 0.35 3.91 0.80
Finger 5.06 0.10 0.35 3.91 0.70Bullrush 0.10 - 0.00 - 0.10Sunflower 0.89 - - 0.20 0.69
154

TABLE G29.0 Production for Selected Crops for Female Headed Householdsby R.D.P. (Thousand Tonens)
CropMzuzu A.D.D.
Nkhatabay R.D.P.
Rumphi/N.Mzimba
Central Mzimba R.D.P.
South Mzimba R.D.P
Total Maize 32.07 1.34 13.81 13.46 3.46
Hybrid 11.31 0.24 5.21 3.88 1.98Local pure stand 19.40 1.10 7.85 9.10 1.35Local/G-nuts 0.14 - - 0.14 -Local/purses 1.22 - 0.75 0.34 0.13Local/Root crops - - - - -Other 0.00 - 0.00 0.00 -
Total/G-nuts 0.50 - 0.01 0.46 0.03
Chalimbana 0.16 - 0.01 0.12. 0.03Malimba 0.00 - - - 0.00Chitembana - - - - -Other local variety 0.28 - 0.00 0.28 0.00Mixture 0.06 - - 0.06. -
Total Rice 0.00 0.00 - - -
Faya 0.00 0.00 - - -
Total pulses 0.12 - 0.00 0.08 0.04
Soya beans 0.00 - 0.00 - -Mixed Beans 0.09 - 0.00 0.05 0.04White haricot 0.00 - - 0.00 -Other 0.03 - 0.00 0.03 0.00
Total Millet 0.16 0.03 0.01 0.12 -
Finger 0.13 - 0.01 0.12 -Bullrush 0.03 0.03 - - -Sunflower 0.14 - - 0.01 0.13
155

TABLEG30.0 Mean Yield for Selected by Crops by R.D.P.(Kilograms/Hectare)
Crop Mzuzu A.D.D.
Nkhatabay R.D.P.
Rumphi/N.Mzimba R.D.P.
Central Mzimba R.D.P.
South Mzimba R.D.P
Total Maize 1880.18 2048.39 2755.66 1455.64 1625.89
Hybrid 2546.96 2107.14 3059.17 1966.99 2745.62Composite 1780.49 2578.95 0.00 - 1846.15Local pure stand 1563.17 2057.69 2639.33 1306.68 1124.02Local/G-nuts 620.69 0.00 750.00 419.75 1733.33Local/purses 2150.29 - 3175.00 714.29 779.29Local/Root crops 0.00 0.00 - - -Other 0.00 - 0.00 0.00 0.00
Total/G-nuts 389.86 90.91 113.40 333.33 647.37
Chalimbana 292.36 0.00 83.33 338.46 440.48Manipinta 400.00 0.00 400.00 - -Malimba 421.05 - - 250.00 545.45Chitembana 0.00 - 0.00 - -Other local variety 578.95 125.00 333.33 379.63 885.06Mixture 295.45 - - 287.50 375.00Other/unknown 200.00 - - 200.00 -
Total Rice 2461.54 2461.54 - - -
Kilombera 2666.67 2666.67 - - -Other local 0.00 0.00 - - -Faya 0.00 0.00 - - -
Total pulses 370.00 - 235.42 489.36 609.38
Soya beans 2340.00 - 6500.00 1714.29 2025.64Mixed Beans 456.14 - 560.61 447.37 322.92White haricot 100.00 - 0.00 111.11 -Dolichos beans 250.00 - 250.00 0.00 -Other 51.28 - 24.84 454.55 122.81
Total Millet 1364.10 866.67 590.16 1965.85 733.94
Finger 1387.70 833.33 600.00 1965.85 721.65Bullrush 812.50 1000.00 - - 833.33Sunflower 635.80 - - 1750.00 546.67
156

TABLEG31.0 Mean Yield for Selected by Crops for Male Households by R.D.P. (Kilograms/Hectare)
CropMzuzu A.D.D.
Nkhatabay R.D.P.
Rumphi/N.Mzimba R.D.P.
Central Mzimba R.D.P.
South Mzimba R.D.P
Total Maize 1831.13 1789.86 2804.54 1358.41 1610.95
Hybrid 2513.49 1918.37 3015.19 1950.10 2690.39Composite 1780.49 2578.95 0.00 - 1846.39Local pure stand 1443.02 1650.79 3675.82 1125.00 1123.21Local/G-nuts 704.40 0.00 750.00 457.63 1733.33Local/purses 2401.54 - 3456.79 444.44 754.10Local/Root crops 0.00 0.00 - - -Other 0.00 - 0.00 0.00 0.00
Total/G-nuts 401.64 90.91 120.48 283.84 727.27
Chalimbana 288.00 0.00 85.71 320.00 441.56Manipinta 400.00 0.00 400.00 - -Malimba 500.00 - - 285.71 666.67Chitembana 0.00 - 0.00 - -Other local variety 709.92 125.00 333.33 282.61 1084.51Mixture 253.16 - - 239.44 375.00Other/unknown 200.00 - - 200.00 -
Total Rice 2666.67 2666.67 - - -
Kilombera 2666.67 2666.67 - - -Other local 0.00 0.00 - - -
Total pulses 418.64 - 260.14 734.94 649.43
Soya beans 2387.76 - 8666.67 1714.29 2025.64Mixed Beans 567.57 - 666.67 686.57 333.33White haricot 125.00 - 0.00 - -Dolichos beans 250.00 - 250.00 0.00 -Other 47.75 - 26.67 1000.00 129.63
Total Millet 1461.76 833.33 583.33 2273.26 733.94
Finger 1488.24 833.33 593.22 2273.26 721.65Bullrush 769.23 - 0.00 - 833.33Sunflower 644.93 - - 2000.00 539.06
157

TABLEG32.0 Mean Yield for Selected by Crops for Female Headed Households by R.D.P. (Kilograms/Hectare)
CropMzuzu A.D.D.
Nkhatabay R.D.P.
Rumphi/N.Mzimba R.D.P.
Central Mzimba R.D.P.
South Mzimba R.D.P
Total Maize 2109.87 2791.67 2586.14 1799.47 1821.05
Hybrid 2765.28 3428.57 3297.47 2052.91 3600.00Local pure stand 2048.57 2682.93 2548.70 1903.77 1125.00Local/G-nuts 318.18 - - 318.18 -Local/purses 1402.30 - 1973.68 1000.00 866.67Other 0.00 - 0.00 0.00 -
Total/G-nuts 349.65 - 71.43 442.31 120.00
Chalimbana 313.73 - 71.43 400.00 428.57Malimba 0.00 - - 0.00 0.00Chitembana - - - 0.00 -Other local variety 358.97 - 0.00 451.61 0.00Mixture 666.67 - - 666.67 -
Total Rice 0.00 0.00 - - -
Faya 0.00 0.00 - - -
Total pulses 100.00 - 0.00 137.93 222.22
Soya beans 0.00 - 0.00 - -Mixed Beans 108.43 - 0.00 106.38 266.67White haricot 0.00 - - 0.00 -Other 88.24 - 0.00 333.33 0.00
Total Millet 432.43 1000.00 1000.00 363.64 -
Finger 382.35 - 1000.00 363.64 -Bullrush 1000.00 1000.00 - - -Sunflower 583.33 - - 500.00 590.91
158

STATISTICAL TABLES
FOR
NSSA 1992/93
KASUNGU A.D.D.
159/160

LIST OF STATISTICAL TABLES FOR MZUZU A.D.D. Table Table title page Number G1.0 Number and percentage of gardens by holding size 165 category G2.0 Percentage of cultivated area by ploughing method 166 Used and holding size category G3.0 Percentage of cultivated area by ridging method used 167 And holding size category G4.0 Percentage of cultivated area by planting method used 169 And holding size category G5.0 Percentage of cultivated area by source of permission 171 To use land and R.D.P. G6.0 Number of plots by holding size category and R.D.P. 171 G7.0 Percentage of plots by maize variety and R.D.P 171 G8.0 Percentage of plots by source of seed and maize variety 172 G9.0 Percentage of plots to which fertilizer was applied by type 173 Of fertilizer G10.0 Percentage of plots to which fertilizer was applied by type 173 Of fertilizer G11.0 Percentage of maize plots to which fertilizer was applied by 174 Type of fertilizer, R.D.P. and sex of household head G12.0 Percentage of maize plots to which fertilizer was applied to 175 By type of fertilizer, R.D.P. and sex of household head G13.0 Percentage of plots to which fertilizer was applied by maize 176 Variety G14.0 Percentage of plots to which fertilizer was applied by maize 177 Variety G15.0 Percentage of maize plots to which fertilizer was applied by 179 Maize variety for male headed households
161

G16.0 Percentage of maize plots to which fertilizer was applied by 180 Maize variety for male headed households G17.0 Percentage of maize plots to which fertilizer was applied by 181 Maize variety for female headed households G18.0 Percentage of maize plots to which fertilizer was applied by 182 Maize variety for female headed households G19.0 Fertilizer application on area planted with maize and rice by 183 R.D.P. G20.0 Fertilizer application on area planted with maize and rice for 184 Female headed households by R.D.P. G21.0 Fertilizer application on area planted with maize and rice for 185 Female headed households by R.D.P. G22.0 Percentage of plots to which fertilizer was applied by sex of 186 Household head and source of financing G23.0 Cropping pattern by R.D.P. (Thousand Hectares) 187 G24.0 Percentage cropping pattern by R.D.P. 188 G25.0 Cropping pattern for male headed households by R.D.P. 189 ( Thousand Hectares ) G26.0 Cropping pattern for female headed households by R.D.P. 190 (Thousand Hectares) G27.0 Production for selected crops by R.D.P. (Thousand Tones) 191 G28.0 Production for selected crops for male headed households by 192 R.D.P. (Thousand Tones) G29.0 Production for selected crops for female headed households 193 By R.D.P. (Thousand Tones) G30.0 Mean yield for selected crops by R.D.P. (Kilograms/Hectare) 194 G31.0 Mean yield for selected crops for male headed households by 195 R.D.P (Kilograms/Hectare) G32.0 Mean yield for selected crops for female headed households by 196 R.D.P. (Kilograms/Hectare)
162/163/164

TABLE G1.0. Number and Percentage of Garden by Holding Size Category.
Total Holding size category (Hectares)
A.D.D./R.D.P. Under 0.50 0.50-0.99 1.00-1.49 1.50-1.99 2.00-2.49 2.50-2.993.00 and over
Kasungu A.D.D.Number 305598 30362 72753 80439 52743 30754 17456 21091Percentage 100.0 9.9 23.8 26.3 17.3 10.1 5.7 6.9
Kasungu R.D.P.Number 74461 7338 17920 16638 10843 7753 6139 7830Percentage 100.0 9.9 24.1 22.3 14.6 10.4 8.2 10.5
Ntchisi R.D.P.Number 30450 2904 7126 10703 4034 2369 1308 2006Percentage 100.0 9.5 23.4 35.1 13.2 7.8 4.3 6.6
Dowa West R.D.P.Number 73091 4400 16105 22213 13095 8339 4433 4506Percentage 100.0 6.0 22.0 30.4 17.9 11.4 6.1 6.2
Dowa EastNumber 50379 6749 11298 13003 8454 6896 3019 960Percentage 100.0 13.4 22.4 25.8 16.8 13.7 6.0 1.9
Mchinji R.D.P.Number 77217 8971 20304 17882 16317 5397 2557 5789Percentage 100.0 11.6 26.3 23.2 21.1 7.0 3.3 7.5
165

TABLE G2.0. Percentage of Cultivated Area by Ploughing Method used and Holding Size Category.
Ploughing Method Total Holding Size Category(Hectares)
Under 0.50 0.50-0.99 1.00-1.49 1.50-1.99 2.00-2.49 2.50-2.993.00 and over
Kasungu A.D.D.Total 100.0 3.6 17.0 24.0 19.9 13.6 8.3 13.5Not ploughed this season 97.0 3.5 16.6 23.6 19.5 13.3 7.9 12.7Tilled by Hoeing 2.1 0.1 0.3 0.4 0.4 0.2 0.1 0.6Ploughed by Oxen 0.7 0.0 0.2 0.0 0.0 - 0.3 0.1Other 0.1 - 0.0 - 0.0 0.1 - -Kasungu R.D.P.Total 100.0 3.9 16.5 21.6 15.2 15.2 10.4 17.3Not ploughed this season 94.9 3.5 15.9 20.4 14.8 14.6 9.4 16.3Tilled by Hoeing 3.4 0.2 0.2 1.1 0.2 0.6 0.4 0.8Ploughed by Oxen 1.7 0.2 0.5 0.1 0.2 - 0.6 0.2Ntchisi R.D.P.Total 100.0 3.7 19.1 30.9 14.8 12.0 7.3 12.2Not ploughed this season 98.2 3.7 19.1 30.0 14.6 12.0 7.3 11.6Tilled by Hoeing 1.3 - - 1.0 0.2 - - 0.1Ploughed by Oxen 0.4 - - - - - - 0.4Dowa west R.D.P.Total 100.0 2.1 15.4 26.1 19.7 15.2 8.8 12.7Not ploughed this season 98.5 2.1 15.0 25.9 19.6 15.0 8.2 12.7Tilled by Hoeing 0.9 - 0.4 0.1 0.1 0.2 0.1 -Ploughed by Oxen 0.6 - - 0.1 - - 0.5 -Dowa East R.D.P. Total 100.0 4.8 17.4 25.3 21.1 16.2 9.6 5.5Not ploughed this season 99.0 4.8 17.4 25.3 20.7 15.8 9.6 5.5Tilled by Hoeing 0.1 0.0 0.0 - 0.1 - - -Other 0.9 - 0.2 - 0.3 0.4 - -Mchinji R.D.P.Total 100.0 4.1 18.0 20.4 26.5 9.5 5.6 15.8Not ploughed this season 96.1 4.1 17.3 20.2 25.4 9.5 5.6 14.0Tilled by Hoeing 3.7 0.1 0.4 0.2 1.2 0.0 - 1.8Ploughed by Oxen 0.3 - 0.3 - - - - -
166

TABLE G3.0. Percentage of Cultivated Area by Ridging Method Used and Holding Size Category
Ridging Method Total Holding size category (Hectares)
Under 0.50 0.50-0.99 1.00-1.49 1.50-1.99 2.00-2.49 2.50-2.993.00 and over
Kasungu A.D.D.Total 100.0 3.6 17.0 24.0 19.9 13.6 8.3 13.5Not ridged this season 12.4 0.3 2.1 2.7 2.8 1.8 1.0 1.6Ridged by hoeing 81.1 3.1 14.1 20.3 16.8 11.2 6.1 9.5Ridged by oxen 6.3 0.1 0.8 1.0 0.4 0.5 1.2 2.3Other 0.0 - - 0.0 - - - -Ridged by hoeing 0.0 0.0 - - - 0.0 - -Kasungu R.D.P.Total 100.0 3.9 16.5 21.6 15.2 15.2 10.4 17.3Not ridged this season 9.1 0.6 1.6 1.5 1.8 1.3 0.9 1.6Ridged by hoeing 65.0 2.7 11.6 15.9 11.8 11.9 5.2 6.0Ridged by oxen 25.8 0.6 3.4 4.2 1.6 2.1 4.3 9.6Ntchisi R.D.PTotal 100.0 3.7 19.1 30.9 14.8 12.0 7.3 12.2Not ridged this season 12.0 0.5 1.8 2.7 2.0 1.9 1.4 1.6Ridged by hoeing 87.1 3.2 17.3 28.3 12.8 10.0 5.5 10.1Ridged by oxen 0.9 - - - - - 0.4 0.4
Dowa West R.D.P.Total 100.0 2.1 15.4 26.1 19.7 15.2 8.8 12.7Not ridged this season 19.0 0.2 4.1 4.4 4.5 2.3 1.3 2.3Ridged by hoeing 80.3 1.9 11.3 21.6 15.2 12.9 7.0 10.4Ridged by oxen 0.5 - - - - - 0.5 -Other 0.1 - - 0.1 - - - -Dowa East R.D.P.Total 100.0 4.8 17.4 25.3 21.1 16.2 9.6 5.5Not ridged this season 15.6 0.1 1.4 3.3 3.2 4.5 1.3 1.7Ridged by hoeing 84.4 4.7 16.0 21.9 17.9 11.7 8.4 3.8Mchinji R.D.P.Total 100.0 4.1 18.0 20.4 26.5 9.5 5.6 15.8Not ridged this season 7.1 0.3 1.2 1.6 2.1 0.3 0.7 0.9Ridged by hoeing 92.9 3.9 16.8 18.7 24.4 9.2 5.0 15.0Other 0.0 - - 0.0 - - - -
167/168

TABLE G4.0. Percentage of Cultivated Area by Planting Method used and Holding Size Category
Planting Method Total Holding size category (Hectares)
Under 0.50 0.50-0.99 1.00-1.49 1.50-1.99 2.00-2.49 2.50-2.993.00 and over
Kasungu A.D.D.Total 100.0 3.6 17.0 24.1 20.0 13.5 8.3 13.5Flat planted 0.9 0.0 0.1 0.1 0.2 0.2 0.1 0.2used last seasons ridges 12.7 0.3 2.3 2.6 3.4 1.5 0.9 1.7Used this seasons ridges 86.1 3.2 14.6 21.3 16.4 11.7 7.3 11.6Planted into holes 0.1 - 0.0 0.1 - - - -Planted into mounds 0.0 0.0 - - - - - -Other 0.1. 0.0 - - 0.0 0.1 - 0.0Kasungu R.D.P.Total 100.0 3.9 16.5 21.6 15.2 15.2 10.4 17.3Flat planted 2.6 0.0 0.4 0.3 0.3 0.8 0.1 0.7used last seasons ridges 6.1 0.5 1.0 0.9 1.7 0.6 0.9 0.4Used this seasons ridges 91.2 3.3 15.1 20.4 13.1 13.8 9.4 16.1Other 0.1 0.1 - - - - - 0.0Ntchisi West R.D.P.Total 100.0 3.7 19.3 31.3 15.0 11.2 7.1 12.3used last seasons ridges 10.3 0.5 2.5 1.7 2.6 0.6 1.0 1.4Used this seasons ridges 89.7 3.2 16.8 29.6 12.4 10.6 6.1 10.9
Dowa West R.D.P.Total 100.0 2.1 15.4 26.1 19.7 15.2 8.8 12.7Flat planted 0.4 0.1 - - - - 0.3 -used last seasons ridges 19.6 0.1 4.3 5.0 4.8 2.3 1.0 2.1Used this seasons ridges 79.6 1.9 11.1 21.1 14.9 12.5 7.5 10.6Other 0.4 - - - - 0.4 - 0.0
continued…
169

TABLE G4.0. Percentage of Cultivated Area by Planting Method used and Holding Size Category
Planting Method Total Holding size category (Hectares)
Under 0.50 0.50-0.99 1.00-1.49 1.50-1.99 2.00-2.49 2.50-2.993.00 and over
Dowa East R.D.P.Total 100.0 4.8 17.4 25.3 21.1 16.2 9.6 5.5Flat planted 1.0 - - 0.2 0.7 - 0.1 -Used last seasons ridges 15.4 0.1 1.3 3.2 4.5 3.4 1.3 1.6Used this seasons ridges 82.9 4.7 16.1 21.3 15.9 12.8 8.3 4.0Planted into holes 0.6 - 0.1 0.6 - - - -Planted into mounds 0.1 0.1 - - - - - -Other 0.0 - - - 0.0 - - -Mchinji R.D.P.Total 100.0 4.1 18.0 20.4 26.5 9.5 5.6 15.8Flat planted 0.1 0.0 0.1 - 0.0 - 0.0 -Used last seasons ridges 11.4 0.3 2.1 1.7 3.2 0.9 0.5 2.8Used this seasons ridges 88.5 3.8 15.9 18.6 23.3 8.7 5.2 13.0Planted into holes 0.0 - - 0.0 - - - -
170

TABLE G5.0. Percentage of Cultivated Area by Source of Permission to use land and R.D.P.
A.D.D./R.D.P TotalRelative by birth-male
Relative by birth-female
Relative by marriage-male
Relative by marriage-female Borrowed Estate/Scheme Other
Kasungu A.D.D. 100.0 31.2 8.1 18.3 10.7 26.3 2.1 3.2Kasungu R.D.P. 100.0 33.8 12.7 21.5 6.7 21.8 1.1 2.4Ntchisi R.D.P. 100.0 46.2 2.4 23.8 3.6 23.9 - -Dowa west R.D.P. 100.0 28.1 10.2 11.4 7.2 38.6 - 4.4Dowa East R.D.P. 100.0 14.3 15.5 7.4 32.8 26.5 - 3.4Mchinji R.D.P. 100.0 33.5 3.5 24.4 13.5 16.7 5.4 3.0 TABLE G6.0. Number of Plots by Holding Size Category and R.D.P.
A.D.D./R.D.P. Total Holding Size Category(Hectares)
Under 0.50 0.50-0.99 1.00-1.49 1.50-1.99 2.00-2.49 2.50-2.993.00 and over
Kasungu A.D.D. 547318 39809 113872 143222 105478 62771 38623 43243Kasungu R.D.P. 126060 9683 25847 27877 21122 15797 11729 14005Ntchisi R.D.P. 57891 4181 12872 19738 8027 4609 3942 4522Dowa west R.D.P. 131874 5174 25870 38483 23781 16945 9817 11804Dowa East R.D.P. 77831 7927 15969 20624 15228 11696 4309 2085Mchinji R.D.P. 153928 12958 33321 36500 37320 13876 8826 11127 TABLE G7.0 Percentage of Plots by Maize Variety and R.D.P.
A.D.D./R.D.P. Total Type of Maize
HybridLocal Pure Stand Local/G.nuts
Local/Other crop Other
Kasungu A.D.D. 100.0 38.2 53.6 1.1 2.0 5.1Kasungu R.D.P. 100.0 39.4 51.6 0.0 3.0 6.0Ntchisi R.D.P. 100.0 31.3 65.4 0.0 0.5 2.7Dowa west R.D.P. 100.0 38.0 54.7 0.0 0.0 7.4Dowa East R.D.P. 100.0 36.7 54.5 0.4 0.9 7.5Mchinji R.D.P. 100.0 40.7 49.5 3.8 3.9 2.1
171

TABLE G8.0. Percentage of Plots by Sourse of Seed and Maize Variety.
Maize variety Total Source of seed Retained from last season
Project/Sheme credit
As seed from ADMARC
As food from ADMARC
As food from a market
Bought loccally Other
Kasungu A.D.D.All Maize 100.0 44.6 15.6 11.9 1.2 0.4 13.2 13.0Hybrid 38.2 3.9 14.7 10.3 0.3 0.0 4.4 4.6Local Pure Stand 53.6 36.9 0.9 1.2 0.8 0.3 7.1 6.3Local/G-nuts 1.1 0.6 0.0 0.0 0.0 0.0 0.3 0.2Local/Other crop 2.0 1.4 0.0 0.0 0.0 0.0 0.4 0.2Other 5.1 1.8 0.1 0.3 0.1 0.0 1.1 1.8Kasungu R.D.P.All Maize 100.0 46.4 19.8 12.2 0.1 0.0 8.3 7.6Hybrid 39.4 4.2 18.8 10.2 0.0 0.0 3.4 0.0Local Pure Stand 51.6 37.4 1.0 1.2 0.1 0.0 4.2 0.4Local/G-nuts 0.0 0.0 0.0 0.0 0.0 0.0 0.0 2.2Local/Other crop 3.0 2.6 0.0 0.0 0.0 0.0 0.0 8.9Other 6.0 2.2 0.0 0.8 0.0 0.0 0.7 5.5Ntchisi R.D.P.All Maize 100.0 62.9 10.0 9.6 1.6 0.3 6.7 8.9Hybrid 31.3 4.6 9.1 9.6 0.6 0.0 1.9 5.5Local Pure Stand 65.4 55.8 0.9 0.0 1.0 0.3 4.3 3.1Local/Other crop 0.5 0.5 0.0 0.0 0.0 0.0 0.0 0.0Other 2.7 2.0 0.0 0.0 0.0 0.0 0.5 0.3Dowa west R.D.P.All Maize 100.0 37.1 13.9 11.9 3.1 0.7 14.5 18.7Hybrid 38.0 4.9 13.5 10.1 0.6 0.0 4.3 4.6Local Pure Stand 54.7 29.8 0.4 1.1 2.6 0.7 9.8 10.2Other 7.4 2.4 0.0 0.7 0.0 0.0 0.4 3.9.Dowa East R.D.P.All Maize 100.0 49.7 14.1 11.7 0.0 0.8 19.5 4.1Hybrid 36.7 3.8 13.5 11.0 0.0 0.0 6.9 1.5Local Pure Stand 54.5 42.6 0.1 0.7 0.0 0.8 8.5 1.6Local/G-nuts 0.4 0.3 0.0 0.0 0.0 0.0 0.1 0.0Local/Other crop 0.9 0.7 0.0 0.0 0.0 0.0 0.3 0.0Other 7.5 2.3 0.5 0.0 0.0 0.0 3.7 1.0Mchinji R.D.P.All Maize 100.0 38.9 16.3 12.8 1.3 0.1 15.1 15.5Hybrid 40.7 2.5 14.7 10.5 0.5 0.0 4.7 7.7Local Pure Stand 49.5 31.5 1.7 2.1 0.5 0.1 7.6 6.0Local/G-nuts 3.8 2.1 0.0 0.1 0.0 0.0 1.0 0.7Local/Other crop 3.9 2.3 0.0 0.0 0.0 0.0 1.2 0.3Other 2.1 0.5 0.0 0.0 0.2 0.0 0.6 0.8
172

TABLE G9.0. Percentage of Plots to which Fertilizer was Applied by Type of Fertilizer.
A.D.D./R.D.P. First Application
Total None used 20:20:0Sulphate of Ammonia DAP 23:21:0+4S CAN UREA Mixture Other
Kasungu A.D.D. 100.0 55.9 2.1 0.4 7.5 6.5 4.3 6.5 15.4 1.6Kasungu R.D.P. 100.0 46.8 3.5 0.3 9.6 3.2 7.1 6.1 20.5 2.8Ntchisi R.D.P. 100.0 50.8 2.7 0.1 3.3 19.2 4.7 5.7 13.0 0.4Dowa west R.D.P. 100.0 57.6 2.3 0.4 9.4 7.5 3.2 9.2 9.3 1.1Dowa East R.D.P. 100.0 66.2 1.5 0.1 8.4 3.2 2.3 8.6 9.6 0.2Mchinji R.D.P. 100.0 58.6 0.7 0.6 5.1 5.3 3.7 3.8 20.1 2.1 TABLE G10.0. Percentage of Plots to which Fertilizer was Applied by Type of Fertilizer.
A.D.D./R.D.P. First Application
TotalNone used 20:20:0
Sulphate of Ammonia DAP 23:21:0+4S CAN UREA Mixture 8 Other
Kasungu A.D.D. 100.0 84.0 0.1 0.0 0.1 0.1 8.0 5.7 1.9 0.0 0.0Kasungu R.D.P. 100.0 79.6 0.2 0.0 0.4 0.0 10.6 5.3 3.8 0.0 0.0Ntchisi R.D.P. 100.0 80.9 0.0 0.3 0.0 0.0 8.6 10.0 0.2 0.0 0.0Dowa west R.D.P. 100.0 83.1 0.4 0.0 0.0 0.0 8.7 6.2 1.4 0.1 0.0Dowa East R.D.P. 100.0 89.3 0.0 0.0 0.2 0.0 4.9 5.7 0.0 0.0 0.0Mchinji R.D.P. 100.0 86.9 0.0 0.0 0.0 0.2 6.6 3.9 0.0 0.0 0.0
173

TABLE G11.0. Percentage of Maize plots to which Fertilizer was applied by type of Fertilizer, R.D.P. and Sex of Household Head
A.D.D./R.D.P. First Application
TotalNone used 20:20:0
Sulphate of ammonia DAP 23:21:0+4s CAN UREA Mixture Other
Kasungu A.D.D.Total 100.0 55.9 2.1 0.4 7.5 6.5 4.3 6.5 15.4 1.6Male 81.5 43.3 1.9 0.3 6.6 5.8 3.7 5.4 13.4 1.5Female 18.4 12.8 0.2 0.1 0.9 0.7 0.6 1.1 1.9 0.1Kasungu R.D.P.Total 100.0 46.8 3.5 0.3 9.6 3.2 7.1 6.1 20.5 2.8Male 81.4 36.6 2.8 0.3 8.8 2.7 5.8 4.7 17.0 2.8Female 18.6 10.2 0.6 0.0 0.8 0.6 1.3 1.5 3.5 0.0Ntchisi R.D.P.Total 100.0 50.8 2.7 0.1 3.3 19.2 4.7 5.7 13.0 0.4.Male 79.8 37.1 2.7 0.1 2.8 17.3 4.2 5.5 10.0 0.0Female 20.2 13.7 0.0 0.0 0.5 1.9 0.5 0.2 3.0 0.4Dowa West R.D.P.Total 100.0 57.6 2.3 0.4 9.4 7.5 3.2 9.2 9.3 1.1Male 78.8 43.2 2.3 0.2 7.4 6.9 2.9 6.7 8.2 1.1Female 21.2 14.4 0.1 0.2 2.1 0.6 0.3 2.5 1.1 0.0Dowa East R.D.P.Total 100.0 66.2 1.5 0.1 8.4 3.2 2.3 8.6 9.6 0.2Male 89.3 57.7 1.5 0.1 7.7 2.8 2.1 8.0 9.1 0.2Female 10.7 8.5 0.0 0.0 0.6 0.4 0.2 0.6 0.4 0.0Mchinji R.D.P.Total 100.0 58.6 0.7 0.6 5.1 5.3 3.7 3.8 20.1 2.1Male 80.8 43.1 0.6 0.5 5.0 4.7 3.2 3.4 18.4 1.9Female 19.2 15.5 0.1 0.1 0.2 0.6 0.5 0.4 1.7 0.1
174

TABLE G12.0. Percentage of Maize plots which Fertilizer was Applied to by type of Fertilizer, R.D.P. and Sex of Household Head
A.D.D./R.D.P. First Application
TotalNone used 20:20:0
Sulphate of ammonia DAP 23:21:0+4s CAN UREA Mixture 8 Other
Kasungu A.D.D.Total 100.0. 84.0 0.1 0.0 0.1 0.1 8.0 5.7 1.9 0.0 0.0
Male 81.5 67.3 0.1 0.0 0.1 0.1 7.1 1.6 1.6 0.0 0.0Female 18.4 16.6 0.0 0.0 0.0 0.0 0.9 0.2 0.2 0.0 0.0
Kasungu R.D.P.Total 100.0 79.6 0.2 0.0 0.4 0.0 10.6 3.8 3.8 0.0 0.0
Male 81.4 64.0 0.2 0.0 0.4 0.0 8.8 3.1 3.1 0.0 0.0Female 18.6 15.6 0.0 0.0 0.0 0.0 1.8 0.7 0.7 0.0 0.0
Ntchisi R.D.P.Total 100.0 80.9 0.0 0.3 0.0 0.0 8.6 0.2 0.2 0.0 0.0
Male 79.8 62.1 0.0 0.3 0.0 0.0 7.9 0.2 0.2 0.0 0.0Female 20.2 18.8 0.0 0.0 0.0 0.0 0.7 0.0 0.0 0.0 0.0
Dowa West R.D.P.Total 100.0 83.1 0.4 0.0 0.0 0.0 8.7 1.4 1.4 0.1 0.0
Male 78.8 64.7 0.4 0.0 0.0 0.0 7.7 1.1 1.1 0.1 0.0Female 21.2 18.4 0.0 0.0 0.0 0.0 1.1 0.3 0.3 0.0 0.0
Dowa East R.D.P.Total 100.0 89.3 0.0 0.0 0.2 0.0 4.9 0.0 0.0 0.0 0.0
Male 89.3 79.3 0.0 0.0 0.2 0.0 4.6 0.0 0.0 0.0 0.0Female 10.7 9.9 0.0 0.0 0.0 0.0 0.3 0.0 0.0 0.0 0.0
Mchinji R.D.P.Total 100.0 86.9 0.0 0.0 0.0 0.2 6.6 2.3 2.3 0.0 0.0
Male 80.8 68.3 0.0 0.0 0.0 0.2 6.3 2.3 2.3 0.0 0.0Female 19.2 18.6 0.0 0.0 0.0 0.0 0.3 0.0 0.0 0.0 0.0
175

TABLE G13.0 Percentage of Plots to which Fertilizer was Applied by Maize Variety.
Maize Variety First Application
TotalNone used 20:20:0
Sulphate of Ammonia DAP 23:21:0+4S CAN UREA Mixture Other
Kasungu A.D.D.All maize 100.0 47.2 2.3 0.5 8.1 4.4 6.3 10.2 20.5 0.7Hybrid 38.2 8.8 0.9 0.2 6.2 2.4 2.5 4.5 12.2 0.4Local Pure Stand 53.6 33.3 1.0 0.2 1.7 1.7 3.4 4.8 7.2 0.3Local/G-nuts 1.1 0.9 0.0 0.0 0.0 0.0 0.0 0.1 0.1 0.0Local/other crop 2.0 1.3 0.0 0.0 0.1 0.0 0.0 0.2. 0.4 0.0Other 5.1 2.8 0.4 0.1 0.1 0.2 0.3 0.6 0.6 0.0Kasungu R.D.P.All maize 100.0 30.8 3.9 0.6 11.7 3.2 11.2 9.8 28.3 0.6Hybrid 39.4 3.6 1.8 0.3 10.3 2.1 4.2 3.7 13.1 0.3Local Pure Stand 51.6 24.3 1.3 0.0 1.1 1.1 6.2 4.7 12.5 0.3Local/G-nuts 0.0 0.0 0.0 0.0 0.0 0.0 0.0 0.0 0.0 0.0Local/other crop 3.0 0.5 0.0 0.0 0.3 0.0 0.0 1.0 1.2 0.0Other 6.0 2.3 0.7 0.3 0.0 0.0 0.8 0.4 1.5 0.0Ntchisi R.D.P.All maize 100.0 39.3 3.5 0.2 4.9 17.6 5.1 9.5 19.9 0.0Hybrid 31.3 3.9 2.0 0.2 3.0 8.3 1.4 2.2 10.3 0.0Local Pure Stand 65.4 34.7 1.5 0.0 1.8 8.5 3.7 5.8 9.6 0.0Local/other crop 0.5 0.5 0.0 0.0 0.0 0.0 0.0 0.0 0.0 0.0Other 2.7 0.3 0.0 0.0 0.0 0.9 0.0 1.6 0.0 0.0Dowa West R.D.P.All maize 100.0 56.7 1.9 0.7 9.2 2.8 4.3 14.2 9.8 0.4Hybrid 38.0 12.0 0.0 0.4 6.2 1.7 2.8 7.4 7.5 0.0Local Pure Stand 54.7 39.1 0.8 0.4 2.9 1.1 1.5 6.1 2.4 0.4Other 7.4 5.6 1.1 0.0 0.0 0.0 0.0 0.7 0.0 0.0Dowa East R.D.P.All maize 100.0 60.1 2.0 0.2 9.1 2.2 3.2 12.4 10.7 0.0Hybrid 36.7 10.5 1.5 0.0 8.0 0.7 1.8 6.4 7.9 0.0Local Pure Stand 54.5 44.7 0.6 0.2 0.6 0.6 0.8 4.8 2.2 0.0Local/G-nuts 0.4 0.4 0.0 0.0 0.0 0.0 0.0 0.0 0.0 0.0Local/other crop 0.9 0.8 0.0 0.0 0.0 0.0 0.0 0.0 0.1 0.0Other 7.5 3.7 0.0 0.0 0.6 0.9 0.6 1.2 0.5 0.0Mchinji R.D.P.All maize 100.0 49.7 0.9 0.5 4.5 2.9 5.6 6.3 28.0 1.5Hybrid 40.7 12.1 0.0 0.0 2.7 2.1 1.7 2.5 18.6 1.0Local Pure Stand 49.5 29.4 0.9 0.5 1.7 0.8 4.0 3.5 8.2 0.5Local/G-nuts 3.8 3.2 0.0 0.0 0.0 0.0 0.0 0.2 0.5 0.0Local/other crop 3.9 3.6 0.0 0.0 0.0 0.0 0.0 0.0 0.3 0.0Other 2.1 1.4 0.0 0.0 0.0 0.0 0.0 0.1 0.5 0.0
176

TABLE G14.0 Percentage of Plots to which Fertilizer was Applied by Maize Variety.
Maize Variety Second Application
TotalNone used 20:20:0 DAP 23:21:0+4S CAN UREA Mixture
Kasungu A.D.D.All maize 100.0 85.9 0.2 0.2 0.0 4.7 7.5 1.5Hybrid 38.2 28.3 0.2 0.2 0.0 2.6 5.9 1.0Local Pure Stand 53.6 50.0 0.0 0.0 0.0 1.7 1.4 0.4Local/G-nuts 1.1 1.1 0.0 0.0 0.0 0.0 0.0 0.0Local/other crop 2.0 1.9 0.0 0.0 0.0 0.0 0.1 0.0Other 5.1 4.7 0.0 0.0 0.0 0.3 0.1 0.1Kasungu R.D.P.All maize 100.0 78.7 0.0 0.5 0.0 8.6 7.7 4.5Hybrid 39.4 22.4 0.0 0.5 0.0 6.4 6.8 3.3Local Pure Stand 51.6 48.6 0.0 0.0 0.0 1.4 0.7 0.9Local/G-nuts 0.0 0.0 0.0 0.0 0.0 0.0 0.0 0.0Local/other crop 3.0 2.7 0.0 0.0 0.0 0.0 0.3 0.0Other 6.0 4.9 0.0 0.0 0.0 0.8 0.0 0.3Ntchisi R.D.P.All maize 100.0 78.8 0.0 0.0 0.0 7.0 14.3 0.0Hybrid 31.3 18.8 0.0 0.0 0.0 3.0 9.5 0.0Local Pure Stand 65.4 57.6 0.0 0.0 0.0 4.0 3.9 0.0Local/other crop 0.5 0.5 0.0 0.0 0.0 0.0 0.0 0.0Other 2.7 1.9 0.0 0.0 0.0 0.0 0.9 0.0Dowa West R.D.P.All maize 100.0 89.0 0.7 0.0 0.0 2.5 7.4 0.4Hybrid 38.0 31.0 0.7 0.0 0.0 1.0 5.2 0.0Local Pure Stand 54.7 50.6 0.0 0.0 0.0 1.5 2.1 0.4Other 7.4 7.4 0.0 0.0 0.0 0.0 0.0 0.0Dowa East R.D.P. .All maize 100.0 89.1 0.0 0.3 0.0 3.2 7.4 0.0Hybrid 36.7 27.6 0.0 0.3 0.0 1.7 7.1 0.0Local Pure Stand 54.5 53.1 0.0 0.0 0.0 1.0 0.4 0.0Local/G-nuts 0.4 0.4 0.0 0.0 0.0 0.0 0.0 0.0Local/other crop 0.9 0.9 0.0 0.0 0.0 0.0 0.0 0.0Other 7.5 6.9 0.0 0.0 0.0 0.5 0.0 0.0Mchinji R.D.P.All maize 100.0 91.1 0.0 0.0 0.0 2.8 4.7 1.2Hybrid 40.7 35.5 0.0 0.0 0.0 1.0 3.4 0.7Local Pure Stand 49.5 46.0 0.0 0.0 0.0 1.8 1.2 0.5Local/G-nuts 3.8 3.8 0.0 0.0 0.0 0.0 0.0 0.0Local/other crop 3.9 3.8 0.0 0.0 0.0 0.0 0.0 0.0Other 2.1 2.0 0.0 0.0 0.0 0.0 0.0 0.0
177/178
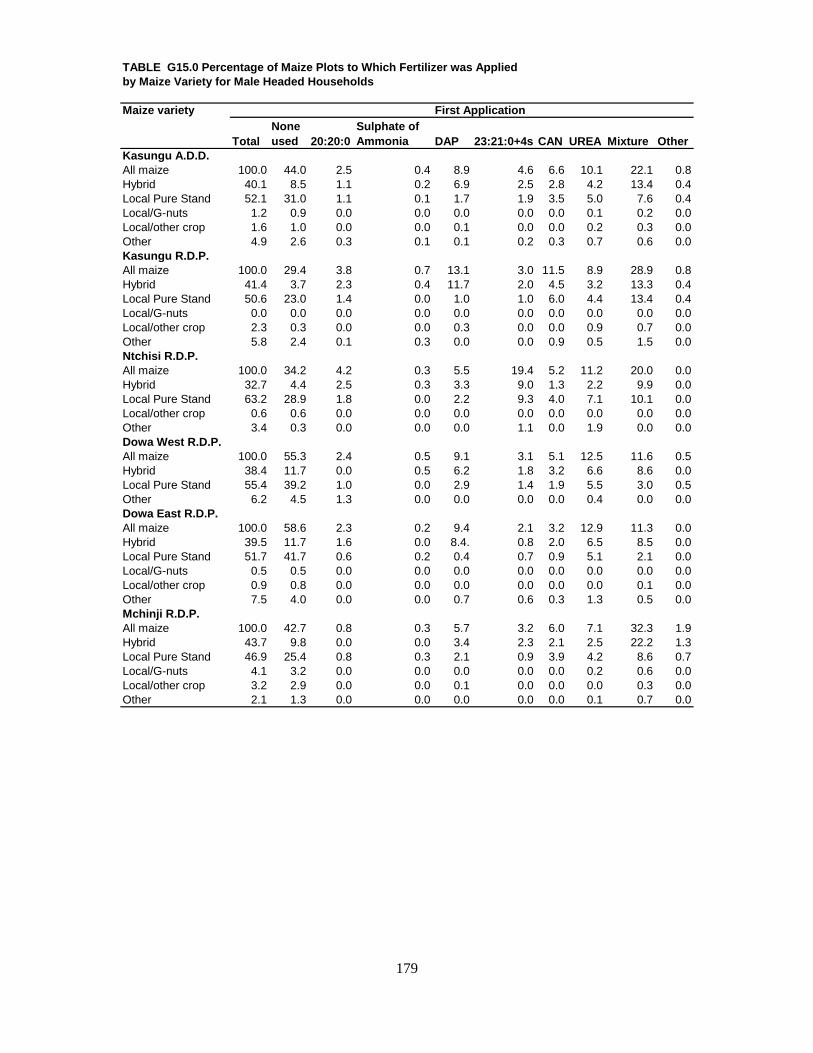
TABLE G15.0 Percentage of Maize Plots to Which Fertilizer was Applied by Maize Variety for Male Headed Households
Maize variety First Application
Total None used 20:20:0
Sulphate of Ammonia DAP 23:21:0+4s CAN UREA Mixture Other
Kasungu A.D.D.All maize 100.0 44.0 2.5 0.4 8.9 4.6 6.6 10.1 22.1 0.8Hybrid 40.1 8.5 1.1 0.2 6.9 2.5 2.8 4.2 13.4 0.4Local Pure Stand 52.1 31.0 1.1 0.1 1.7 1.9 3.5 5.0 7.6 0.4Local/G-nuts 1.2 0.9 0.0 0.0 0.0 0.0 0.0 0.1 0.2 0.0Local/other crop 1.6 1.0 0.0 0.0 0.1 0.0 0.0 0.2 0.3 0.0Other 4.9 2.6 0.3 0.1 0.1 0.2 0.3 0.7 0.6 0.0Kasungu R.D.P.All maize 100.0 29.4 3.8 0.7 13.1 3.0 11.5 8.9 28.9 0.8Hybrid 41.4 3.7 2.3 0.4 11.7 2.0 4.5 3.2 13.3 0.4Local Pure Stand 50.6 23.0 1.4 0.0 1.0 1.0 6.0 4.4 13.4 0.4Local/G-nuts 0.0 0.0 0.0 0.0 0.0 0.0 0.0 0.0 0.0 0.0Local/other crop 2.3 0.3 0.0 0.0 0.3 0.0 0.0 0.9 0.7 0.0Other 5.8 2.4 0.1 0.3 0.0 0.0 0.9 0.5 1.5 0.0Ntchisi R.D.P.All maize 100.0 34.2 4.2 0.3 5.5 19.4 5.2 11.2 20.0 0.0Hybrid 32.7 4.4 2.5 0.3 3.3 9.0 1.3 2.2 9.9 0.0Local Pure Stand 63.2 28.9 1.8 0.0 2.2 9.3 4.0 7.1 10.1 0.0Local/other crop 0.6 0.6 0.0 0.0 0.0 0.0 0.0 0.0 0.0 0.0Other 3.4 0.3 0.0 0.0 0.0 1.1 0.0 1.9 0.0 0.0Dowa West R.D.P.All maize 100.0 55.3 2.4 0.5 9.1 3.1 5.1 12.5 11.6 0.5Hybrid 38.4 11.7 0.0 0.5 6.2 1.8 3.2 6.6 8.6 0.0Local Pure Stand 55.4 39.2 1.0 0.0 2.9 1.4 1.9 5.5 3.0 0.5Other 6.2 4.5 1.3 0.0 0.0 0.0 0.0 0.4 0.0 0.0Dowa East R.D.P.All maize 100.0 58.6 2.3 0.2 9.4 2.1 3.2 12.9 11.3 0.0Hybrid 39.5 11.7 1.6 0.0 8.4. 0.8 2.0 6.5 8.5 0.0Local Pure Stand 51.7 41.7 0.6 0.2 0.4 0.7 0.9 5.1 2.1 0.0Local/G-nuts 0.5 0.5 0.0 0.0 0.0 0.0 0.0 0.0 0.0 0.0Local/other crop 0.9 0.8 0.0 0.0 0.0 0.0 0.0 0.0 0.1 0.0Other 7.5 4.0 0.0 0.0 0.7 0.6 0.3 1.3 0.5 0.0Mchinji R.D.P.All maize 100.0 42.7 0.8 0.3 5.7 3.2 6.0 7.1 32.3 1.9Hybrid 43.7 9.8 0.0 0.0 3.4 2.3 2.1 2.5 22.2 1.3Local Pure Stand 46.9 25.4 0.8 0.3 2.1 0.9 3.9 4.2 8.6 0.7Local/G-nuts 4.1 3.2 0.0 0.0 0.0 0.0 0.0 0.2 0.6 0.0Local/other crop 3.2 2.9 0.0 0.0 0.1 0.0 0.0 0.0 0.3 0.0Other 2.1 1.3 0.0 0.0 0.0 0.0 0.0 0.1 0.7 0.0
179

TABLE G16.0 Percentage of Maize Plots to which Fertilizer was Applied by Maize Variety for Male Headed Households
Maize variety Second Application
Total None used 20:20:0 DAP 23:21:0+4s CAN UREA Mixture
Kasungu A.D.D.All maize 100.0 84.8 0.2 0.2 0.1 4.7 8.4 1.6Hybrid 40.1 29.4 0.2 0.2 0.0 2.7 6.6 1.0Local Pure Stand 52.1 48.1 0.0 0.0 0.0 1.9 1.6 0.5Local/G-nuts 1.2 1.2 0.0 0.0 0.0 0.0 0.0 0.0Local/other crop 1.6 1.5 0.0 0.0 0.0 0.0 0.1 0.0Other 4.9 4.6 0.0 0.0 0.0. 0.2 0.1 0.1Kasungu R.D.P.All maize 100.0 78.0 0.0 0.7 0.0 8.2 8.6 4.5Hybrid 41.4 23.4 0.0 0.7 0.0 6.7 7.6 3.0Local Pure Stand 50.6 47.5 0.0 0.0 0.0 1.2 0.7 1.1Local/G-nuts 0.0 0.0 0.0 0.0 0.0 0.0 0.0 0.0Local/other crop 2.3 1.9 0.0 0.0 0.0 0.0 0.3 0.0Other 5.8 5.2 0.0 0.0 0.0 0.2 0.0 0.3Ntchisi R.D.P.All maize 100.0 75.1 0.0 0.0 0.0 8.0 17.0 0.0Hybrid 32.7 18.5 0.0 0.0 0.0 3.1 11.1 0.0Local Pure Stand 63.2 53.6 0.0 0.0 0.0 4.9 4.7 0.0Local/other crop 0.6 0.6 0.0 0.0 0.0 0.0 0.0 0.0Other 3.4 2.3 0.0 0.0 0.0 0.0 1.1 0.0Dowa West R.D.P.All maize 100.0 89.1 0.9 0.0 0.0 1.9 7.6 0.5Hybrid 38.4 31.8 0.9 0.0 0.0 0.4 5.3 0.0Local Pure Stand 55.4 51.1 0.0 0.0 0.0 1.5 2.3 0.5Other 6.2 6.2 0.0 0.0 0.0 0.0 0.0 0.0Dowa East R.D.P.All maize 100.0 88.6 0.0 0.3 0.0 3.6 7.5 0.0Hybrid 39.5 29.9 0.0 0.3 0.0 1.9 7.3 0.0Local Pure Stand 51.7 50.4 0.0 0.0 0.0 1.1 0.2 0.0Local/G-nuts 0.5 0.5 0.0 0.0 0.0 0.0 0.0 0.0Local/other crop 0.9 0.9 0.0 0.0 0.0 0.0 0.0 0.0Other 7.5 6.9 0.0 0.0 0.0 0.6 0.0 0.0Mchinji R.D.P.All maize 100.0 89.0 0.0 0.0 0.2 3.4 5.9 1.5Hybrid 43.7 37.1 0.0 0.0 0.1 1.3 4.3 0.9Local Pure Stand 46.9 42.6 0.0 0.0 0.0 2.1 1.5 0.7Local/G-nuts 4.1 4.1 0.0 0.0. 0.0 0.0 0.0 0.0Local/other crop 3.2 3.1 0.0 0.0 0.0 0.0 0.1 0.0Other 2.1 2.0 0.0 0.0 0.1 0.0 0.0 0.0
180

TABLE G17.0 Percentage of Maize Plots to which Fertilizer was Applied by Maize Variety for Female Headed Households
Maize variety First Application
Total None used 20:20:0
Sulphate of Ammonia DAP 23:21:0+4s CAN UREA Mixture
Kasungu A.D.D.All maize 99.9 61.3 1.4 0.8 4.6 3.2 4.9 10.5 13.3Hybrid 29.2 10.5 0.0 0.0 3.2 1.9 1.3 5.6 6.8Local Pure Stand 60.2 43.8 0.6 0.8 1.4 1.0 3.3 4.1 5.2Local/G-nuts 0.9 0.9 0.0 0.0 0.0 0.0 0.0 0.0 0.0Local/other crop 3.7 2.4 0.0 0.0 0.0 0.0 0.0 0.4 0.9Other 6.0 3.7 0.8 0.0 0.0 0.4 0.2 0.4 0.4Kasungu R.D.P.All maize 100.0 37.2 4.2 0.0 5.5 3.9 9.8 13.6 25.8Hybrid 30.9 3.2 0.0 0.0 3.9 2.5 2.9 6.1 12.4Local Pure Stand 56.0 30.5 1.0 0.0 1.6 1.4 6.9 6.0 8.6Local/other crop 6.1 1.5 0.0 0.0 0.0 0.0 0.0 1.5 3.1Other 7.0 2.1 3.3 0.0 0.0 0.0 0.0 0.0 1.7Ntchisi R.D.P.All maize 100.0 62.3 0.0 0.0 2.0 9.6 4.7 2.0 19.4Hybrid 24.7 1.5 0.0 0.0 2.0 4.8 2.3 2.0 12.1Local Pure Stand 75.3 60.8 0.0 0.0 0.0 4.8 2.4 0.0 7.3Dowa West R.D.P.All maize 100.0 61.8 0.0 1.8 9.5 1.5 1.6 20.9 3.0Hybrid 36.4 13.1 0.0 0.0 6.4 1.5 1.6 10.8 3.0Local Pure Stand 51.9 38.7 0.0 1.8 3.1 0.0 0.0 8.4 0.0Other 11.7 10.0 0.0 0.0 0.0 0.0 0.0 1.7 0.0Dowa East R.D.P.All maize 100.0 73.3 0.0 0.0 6.7 3.8 2.5 8.5 5.3Hybrid 13.0 0.0 0.0 0.0 4.5 0.0 0.0 5.6 2.8Local Pure Stand 78.2 70.7 0.0 0.0 2.1 0.0 0.0 2.8 2.5Local/other crop 1.3 1.3 0.0 0.0 0.0 0.0 0.0 0.0 0.0Other 7.6 1.3 0.0 0.0 0.0 3.8 2.5 0.0 0.0Mchinji R.D.P.All maize 100.0 76.9 1.2 1.1 0.1 1.7 4.3 3.3 11.4Hybrid 29.0 20.9 0.0 0.0 0.0 1.3 0.0 2.2 4.6Local Pure Stand 59.7 44.9 1.2 1.1 0.1 0.4 4.3 1.1 6.6Local/G-nuts 2.8 2.8 0.0 0.0 0.0 0.0 0.0 0.0 0.0Local/other crop 6.5 6.3 0.0 0.0 0.0 0.0 0.0. 0.0 0.2Other 2.0 2.0 0.0 0.0 0.0 0.0 0.0 0.0 0.0
181

TABLE G18.0. Percentage of Maize Plots to which Fertilizer was Applied by Maize Variety for Female Headed Households
Maize variety Second ApplicationTotal None used CAN UREA Mixture
Kasungu A.D.D.All maize 99.9 91.1 4.2 3.4 1.1Hybrid 29.2 23.2 2.3 2.7 1.1Local Pure Stand 60.2 58.3 1.1 0.7 0.0Local/G-nuts 0.9 0.9 0.0 0.0 0.0Local/other crop 3.7 3.7 0.0 0.0 0.0Other 6.0 5.1 0.8 0.0 0.0Kasungu R.D.P.All maize 100.0 81.4 10.4 3.7 4.4Hybrid 30.9 18.4 4.8 3.2 4.4Local Pure Stand 56.0 53.2 2.3 0.5 0.0Local/other crop 6.1 6.1 0.0 0.0 0.0Other 7.0 3.8 3.3 0.0 0.0Ntchisi R.D.P.All maize 100.0 95.6 2.4 2.0 0.0Hybrid 24.7 20.3 2.4 2.0 0.0Local Pure Stand 75.3 75.3 0.0 0.0 0.0Dowa West R.D.P.All maize 100.0 88.4 5.0 6.5 0.0Hybrid 36.4 28.1 3.3 4.9 0.0Local Pure Stand 51.9 48.6 1.8 1.6 0.0Other 11.7 11.7 0.0 0.0 0.0Dowa East R.D.P.All maize 100.0 93.3 0.0 6.7 0.0Hybrid 13.0 8.4 0.0 4.5 0.0Local Pure Stand 78.2 76.1 0.0 2.1 0.0Local/other crop 1.3 1.3 0.0 0.0 0.0Other 7.6 7.6 0.0 0.0 0.0Mchinji R.D.P.All maize 100.0 99.4 0.4 0.1 0.0Hybrid 29.0 29.0 0.0 0.0 0.0Local Pure Stand 59.7 59.1 0.4 0.1 0.0Local/G-nuts 2.8 2.8 0.0 0.0 0.0Local/other crop 6.5 6.5 0.0 0.0 0.0Other 2.0 2.0 0.0 0.0 0.0
182

TABLE G19.0. Fertilizer Application on Area Planted with Maize and Rice by R.D.P.
R.D.P.Total Area (Hectares)
Area Fertilised (Hectares)
Percentage Fertilized
Kasungu R.D.P.Total Maize 42795.03 28667.24 66.99Hybrid 16022.91 14576.80 90.97Local Pure Stand 22488.47 11122.36 49.46Local/G-nuts 340.20 - -Local/other crop 1067.97 900.66 84.33Other 2875.47 2067.42 71.90Ntchisi R.D.P.Total Maize 18170.89 11549.36 63.56Hybrid 5347.95 4681.32 87.53Local Pure Stand 11947.79 6082.52 50.91Local/other crop 62.32 - -Other 812.82 785.52 96.64Dowa West R.D.P.Total Maize 35595.63 16101.90 45.24Hybrid 13123.21 9776.59 74.50Local Pure Stand 18809.75 5114.20 27.19Other 3662.66 1211.11 33.07Dowa East R.D.P.Total Maize 24777.76 9358.44 37.77Hybrid 8320.50 6328.10 76.05Local Pure Stand 14588.54 2357.44 16.16Local G-nuts 236.93 - -Local/other crop 182.17 0.67 0.37Other 1449.62 672.23 46.37Mchinji R.D.P.Total Maize 38407.30 21598.17 56.23Hybrid 15833.27 13097.56 82.72Local Pure Stand 20420.62 7972.56 39.04Local/G-nuts 1113.42 265.24 23.82Local/other crop 369.50 116.76 31.60Other 670.49 146.05 21.78
Total Rice 6.30 - -Other local 6.30 - -
183
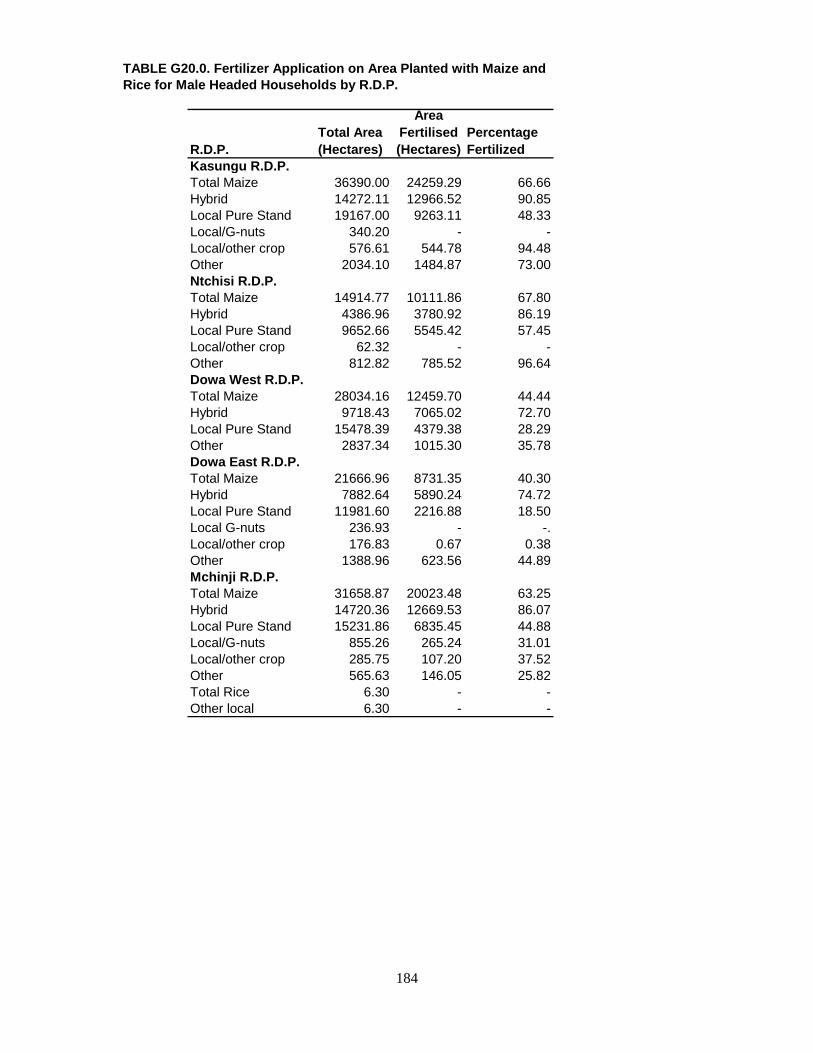
TABLE G20.0. Fertilizer Application on Area Planted with Maize and Rice for Male Headed Households by R.D.P.
R.D.P.Total Area (Hectares)
Area Fertilised (Hectares)
Percentage Fertilized
Kasungu R.D.P.Total Maize 36390.00 24259.29 66.66Hybrid 14272.11 12966.52 90.85Local Pure Stand 19167.00 9263.11 48.33Local/G-nuts 340.20 - -Local/other crop 576.61 544.78 94.48Other 2034.10 1484.87 73.00Ntchisi R.D.P.Total Maize 14914.77 10111.86 67.80Hybrid 4386.96 3780.92 86.19Local Pure Stand 9652.66 5545.42 57.45Local/other crop 62.32 - -Other 812.82 785.52 96.64Dowa West R.D.P.Total Maize 28034.16 12459.70 44.44Hybrid 9718.43 7065.02 72.70Local Pure Stand 15478.39 4379.38 28.29Other 2837.34 1015.30 35.78Dowa East R.D.P.Total Maize 21666.96 8731.35 40.30Hybrid 7882.64 5890.24 74.72Local Pure Stand 11981.60 2216.88 18.50Local G-nuts 236.93 - -.Local/other crop 176.83 0.67 0.38Other 1388.96 623.56 44.89Mchinji R.D.P.Total Maize 31658.87 20023.48 63.25Hybrid 14720.36 12669.53 86.07Local Pure Stand 15231.86 6835.45 44.88Local/G-nuts 855.26 265.24 31.01Local/other crop 285.75 107.20 37.52Other 565.63 146.05 25.82Total Rice 6.30 - -Other local 6.30 - -
184

TABLE G21.0. Fertilizer Application on area planted with Maize and. Rice for Female Headed Households by R.D.P
R.D.P.Total Area(Hectares)
Area Fertilised (Hectares)
Percentage Fertilised
Kasungu R.D.P.Total Maize 6405.02 4407.96 68.82Hybrid 1750.81 1610.28 91.97Local Pure Stand 3321.48 1859.25 55.98Local/other crop 491.36 355.88 72.43Other 841.38 582.55 69.24Ntchisi R.D.P.Total Maize 3256.12 1437.49 44.15Hybrid 960.99 900.40 93.70Local Pure Stand 2295.13 537.09 23.40Dowa West R.D.P.Total Maize 7561.46 3642.20 48.17Hybrid 3404.78 2711.56 79.64Local Pure Stand 3331.36 734.82 22.06Other 825.32 195.82 23.73Dowa East R.D.P.Total Maize 3110.80 627.08 20.16Hybrid 437.86 437.86 100.00Local Pure Stand 2606.95 140.56 5.39Local/other crop 5.33 - -Other 60.67 48.67 80.22Mchinji R.D.P.Total Maize 6748.43 1574.69 23.33Hybrid 1112.91 428.03 38.46Local Pure Stand 5188.76 1137.10 21.91Local/G-nuts 258.16 - -Local/other crop 83.75 9.56 11.41Other 104.86 - -
185

TABLE G22.0. Percentage of plots to which Fertilizer was Applied by Sex of Household Head and Source of Financing
A.D.D./R.D.P. Source of Financing FerilizerTotal None used Cash Credit Combination Gift Other
Kasungu A.D.D.Total 100.0 55.9 19.2 19.9 1.4 2.0 1.4
Male 81.5 43.0 16.6 17.6 1.4 1.6 1.2Female 18.4 12.8 2.6 2.3 0.0 0.5 0.2
Kasungu R.D.P.Total 100.0 46.8 27.9 21.0 1.3 1.7 1.3
Male 81.4 36.6 23.3 17.8 1.3 1.3 1.2Female 18.6 10.2 4.6 3.2 0.0 0.4 0.1
Ntchisi R.D.P.Total 100.0 50.8 20.8 23.0 2.1 0.7 2.5
Male 79.8 37.1 16.7 21.2 2.1 0.7 2.1Female 20.2 13.7 4.2 1.9 0.0 0.0 0.4
Dowa WestTotal 100.0 57.6 19.5 16.7 2.1 1.8 2.4
Male 78.8 43.2 17.6 12.7 1.9 1.4 2.1Female 21.2 14.4 1.9 4.0 0.2 0.4 0.3
Dowa East R.D.PTotal 100.0 66.2 12.3 17.8 0.5 2.4 0.9
Male 89.3 57.7 11.3 16.8 0.5 2.1 0.8Female 10.7 8.5 0.9 0.9 0.0. 0.3 0.1
Mchinji R.D.P.Total 100.0 58.6 14.8 21.7 1.4 2.9 0.6
Male 80.8 43.1 13.1 20.9 1.4 2.0 0.5Female 19.2 15.5 1.7 0.8 0.0 1.0 0.1
186

TABLE G23.0. Cropping Pattern by R.D.P. (Thousand Hectares)
CropKasungu A.D.D.
Kasungu R.D.P.
Ntchisi R.D.P.
Dowa West R.D.P.
Dowa East R.D.P.
Mchinji R.D.P.
Total Maize 159.76 42.79 18.17 35.60 24.79 38.41Hybrid 58.64 16.02 5.35 13.12 8.32 15.83Local pure stand 88.26 22.49 11.95 18.81 14.59 20.42Local/G-nuts 1.70 0.34 - - 0.24 1.12Local/purses 1.61 1.07 0.06 - 0.19 0.29Local/Sorghum 0.08 - - - - 0.08Other 9.47 2.87 0.81 3.67 1.45 0.67Total/G-nuts 20.20 5.88 1.95 3.66 1.74 6.97Chalimbana 15.01 3.59 1.66 2.47 1.31 5.98Manipinta 0.46 0.26 - 0.17 0.02 0.01Malimba 1.75 0.22 - 1.02 0.06 0.45Mawanga 0.13 - 0.02 - 0.11 -Other local variety 1.50 1.00 0.22 - 0.08 0.20Mixture 1.33 0.81 0.05 - 0.16 0.31Other/unknown 0.02 - - - - 0.02Total Rice 0.01 - - - - 0.01Other local 0.01 - - - - 0.01Total pulses 5.66 2.96 0.63 0.59 0.56 092Soya beans 2.17 0.79 0.57 0.31 0.13 0.37Mixed Beans 1.87 1.71 0.00 0.05 0.02 0.09White haricot 0.50 0.16 0.00 - 0.34 0.00Dolichos beans 0.01 0.01 - - - -Other 1.11 0.29 0.06 0.23 0.07 0.46Total Millet 0.34 0.31 - - - 0.03Finger 0.34 0.31 - - - 0.03Total Sorghum 0.08 - - - - 0.08Local 0.08 - - - - 0.08Wheat 0.01 - - 0.01 - -Sunflower 4.63 4.46 - - - 0.17Cassava 0.73 0.35 0.02 - 0.09 0.27Sweet potatoes 2.37 0.33 0.07 0.55 0.54 0.88Irish Potatoes 0.03 - - - - 0.03Cotton 0.06 - .06 - - -Total Tobbaco 30.20 5.20 3.18 11.98 2.39 7.45Dark fired 4.23 0.24 1.34 0.91 1.72 0.02Sun/Air 1.26 0.05 0.04 - - 1.17Burley 24.67 4.90 1.77 11.07 0.67 6.26Flue cured 0.03 - 0.03 - - -Oriental 0.01 0.01 - - - -Other 0.00 - - - - 0.00
187

TABLE G24.0. Percentage Cropping Pattern by R.D.P.
CropKasungu A.D.D.
Kasungu R.D.P.
Ntchisi R.D.P.
Dowa West R.D.P.
Dowa East R.D.P.
Mchinji R.D.P.
Total Maize 100.0 100.0 100.0 100.0 100.0 100.0Hybrid 36.7 37.4 29.4 36.9 33.6 41.2Local pure stand 55.3 52.6 65.8 52.8 58.9 53.2Local/G-nuts 1.1 0.8 - - 1.0 2.9Local/purses 1.0 2.5 0.3 - 0.8 0.8Local/Sorghum 0.1 - - - - 0.2Other 5.9 6.7 4.5 10.3 5.9 1.7Total/G-nuts 100.0 100.0 100.0 100.0 100.0 100.0Chalimbana 74.3 61.1 85.1 67 75.3 85.6Manipinta 2.3 4.4 - 5 1.2 0.1Malimba 8.7 3.7 - 4.6 3.5 6.5Mawanga 0.6 - 1.0 27.9 6.3 -Other local variety 7.4 17.0 11.3 - 4.6 2.9Mixture 6.6 13.8 2.6 - 9.2 4.5Other/unknown 0.1 - - - - 0.3Total Rice 100.0 - - - - 100.0Other local 100.0 - - - - 100.0Total pulses 100.0 100.0 100.0 100.0 100.0 100.0Soya beans 38.3 26.7 90.5 52.5 23.2 40.2Mixed Beans 33.0 57.8 - 8.5 3.6 9.8White haricot 8.8 5.4 - - 60.7 -Dolichos beans 0.2 0.4 - - - -Other 19.6 9.8 9.5 39.0 12.5 50.0Total Millet 100.0 100.0 - - - 100.0Finger 100.0 100.0 - - - 100.0Total Sorghum 100.0 - - - - 100.0Local 100.0 - - - - 100.0Wheat 100.0 - - 100.0 - -Sunflower 100.0 100.0 - - - 100.0Cassava 100.0 100.0 100.0 - 100.0 100.0Sweet potatoes 100.0 100.0 100.0 100.0 100.0 100.0Irish Potatoes 100.0 - - - - 100.0Cotton 100.0 - 100.0 - - -Total Tobbaco 100.0 100.0 100.0 100.0 100.0 100.0Dark fired 14.0 4.6 42.1 7.6 72.0 0.3Sun/Air 4.2 1.0 1.3 - - 15.7Burley 81.7 94.2 55.7 92.4 28.0 84.0Flue cured 0.1 - 0.9 - - -Oriental 0.0 0.2 - - - -Other 0.0 - - - - 0.0
188

TABLE G25.0. Crooping Pattern for Male Headed households by R.D.P. (Thousand Hectares)
CropKasungu A.D.D.
Kasungu R.D.P.
Ntchisi R.D.P.
Dowa west R.D.P.
Dowa East R.D.P.
Mchinji R.D.P.
Total Maize 132.68 36.39 14.91 28.04 21.67 31.67Hybrid 50.98 14.27 4.39 9.72 7.88 14.72Local pure stand 71.51 19.17 9.65 15.48 11.98 15.23Local/G-nuts 1.44 .34 - - 0.24 0.86Local/purses 1.03 0.58 0.06 - 0.18 0.21Local/Sorghum 0.08 - - - - 0.08Other 7.64 2.03 0.81 2.84. 1.39 0.57Total/G-nuts 15.89 4.68 1.55 2.49 1.51 5.66Chalimbana 12.15 3.01 1.29 1.84 1.51 4.86Manipinta 0.25 0.05 - 0.17 0.02 0.01Malimba 1.04 0.19 - 0.48 0.06 0.31Mawanga 0.13 - 0.02 - 0.11 -Other local variety 1.27 0.81 0.19 - 0.08 0.19Mixture 1.03. 0.62 0.05 - 0.09 0.27Other/unknown 0.02 - - - - 0.02Total Rice 0.01 - - - - 0.01Other local 0.01 - - - - 0.01Total pulses 4.40 2.27 0.43 0.51 0.49 0.70Soya beans 1.90 0.77 0.40 0.29 0.09 0.35Mixed Beans 1.21 1.14 0.00 0.02 0.01 0.04White haricot 0.50 0.16 0.00 - 0.34 0.00Dolichos beans 0.01 0.01 - - - -Other 0.78 0.19 0.03 0.20 0.05 0.31Total Millet 0.30 0.29 - - - 0.01Finger 0.30 0.29 - - - 0.01Total Sorghum 0.08 - - - - 0.08Local 0.08 - - - - 0.08Wheat 0.01 - - 0.01 - -Sunflower 4.31 4.14 - - - 0.17Cassava 0.66 0.28 0.02 - 0.09 0.27Sweet potatoes 1.76 0.31 0.06 0.39 0.36 0.64Irish Potatoes 0.03 - - - - 0.03Cotton 0.06 - 0.06 - - -Total Tobbaco 26.86 4.71 2.61 10.21 2.34 6.99Dark fired 3.72 0.24 0.93 0.87 1.67 0.02Sun/Air 1.16 0.01 0.04 - - 1.11Burley 21.94 4.45 1.62 9.34 0.67 5.87Flue cured 0.03 - 0.03 - - -Oriental 0.01 0.01 - - - -Other 0.00 - - - - 0.00
189

TABLE G26.0. Crooping Pattern for Female Headed Households by R.D.P. (Thousand Hectares)
CropKasungu A.D.D.
Kasungu R.D.P.
Ntchisi R.D.P.
Dowa west R.D.P.
Dowa East R.D.P.
Mchinji R.D.P.
Total Maize 27.08 6.40 3.26 7.56 3.12 6.74Hybrid 7.66 1.75 0.96 3.40 0.44 1.11Local pure stand 16.75 3.32 2.30 3.33 2.61 5.19Local/G-nuts 0.26 - - - - 0.26Local/purses 0.58 0.49 - - 0.01 0.08Other 1.83 0.84 - 0.83 0.06 0.10Total/G-nuts 4.31 1.20 0.40 1.17 0.23 1.31Chalimbana 2.86 0.58 0.37 0.63 0.16 1.12Manipinta 0.21 0.21 - - - 0.00Malimba 0.71 0.03 - 0.54 - 0.14Other local variety 0.23 0.19 0.03 - - 0.01Mixture 0.30 0.19 - - 0.07 0.04Total pulses 1.26 0.69 0.20 0.08 0.07 0.22Soya beans 0.27 0.02 0.17 0.02 0.04 0.02Mixed Beans 0.66 0.57 - 0.03 0.01 0.05Other 0.33 0.10 0.03 0.03 0.02 0.15Total Millet 0.04 0.02 - - - 0.02Finger 0.04 0.02 - - - 0.02Sunflower 0.32 0.32 - - - -Cassava 0.07 0.07 - - - -Sweet Potatoes 0.61 0.02 0.01 0.16 0.18 0.24Irish Potatoes 0.00 - - - - 0.00Total Tobacco 3.34 0.49 0.57 1.77 0.05 0.46Dark Fired 0.51 - 0.41 0.04 0.05 -Sun/Air 0.11 0.04 - - - 0.06Burley 2.73 0.45 0.16 1.73 - 0.39
190

TABLE G27.0. Production for selected Crops by R.D.P. (Thousand Tonnes)
CropKasunguA.D.D.
Kasungu R.D.P.
Ntchisi R.D.P.
Dowa West R.D.P.
Dowa East R.D.P.
Mchinji R.D.P.
Total Maize 294.70 70.46 39.70 67.82 40.92 75.80Hybrid 152.55 40.80 17.00 31.85 22.03 40.87Local pure stand 138.17 28.46 22.51 35.96 17.90 33.34Local/G-nuts 1.71 0.24 - - 0.50 0.97Local/purses 2.27 0.96 0.19 - 0.50 0.62Local/Sorghum 0.00 - - - - 0.00Other 0.00 0.00 0.00 0.00 0.00 -Total/G-nuts 14.54 3.36 1.0 24 3.42 1.43 5.09Chalimbana 9.83 2.14 1.11 1.82 1.06 3.70Manipinta 0.50 0.29 - 0.16 0.04 0.01Malimba 2.58 0.05 - 1.44 0.07 1.02Mawanga 0.11 - 0.01 - 0.10 -Other local variety 0.75 0.52 0.12 - 0.02 0.09Mixture 0.75 0.36 0.00 - 0.14 0.25Other/unknown 0.02 - - - - 0.02Total Rice 0.00 - - - - 0.00Other local 0.00 - - - - 0.00Total pulses 3.30 1.24 0.54 0.59 0.21 0.72Soya beans 2.12 0.73 0.52 0.28 0.08 0.51Mixed Beans 0.49 0.39 0.00 0.02 0.00 0.08White haricot 0.15 0.08 0.00 - 0.07 0.00Dolichos beans 0.01 0.01 - - - -Other 0.53 0.03 0.02 0.29 0.06 0.13Total Millet 0.09 0.07 - - - 0.02Finger 0.09 0.07 - - - 0.02Total Sorghum 0.11 - - - - 0.11Local 0.11 - - - - 0.11Wheat 0.00 - - 0.00 - -Sunflower 2.77 2.45 - - - 0.32
191
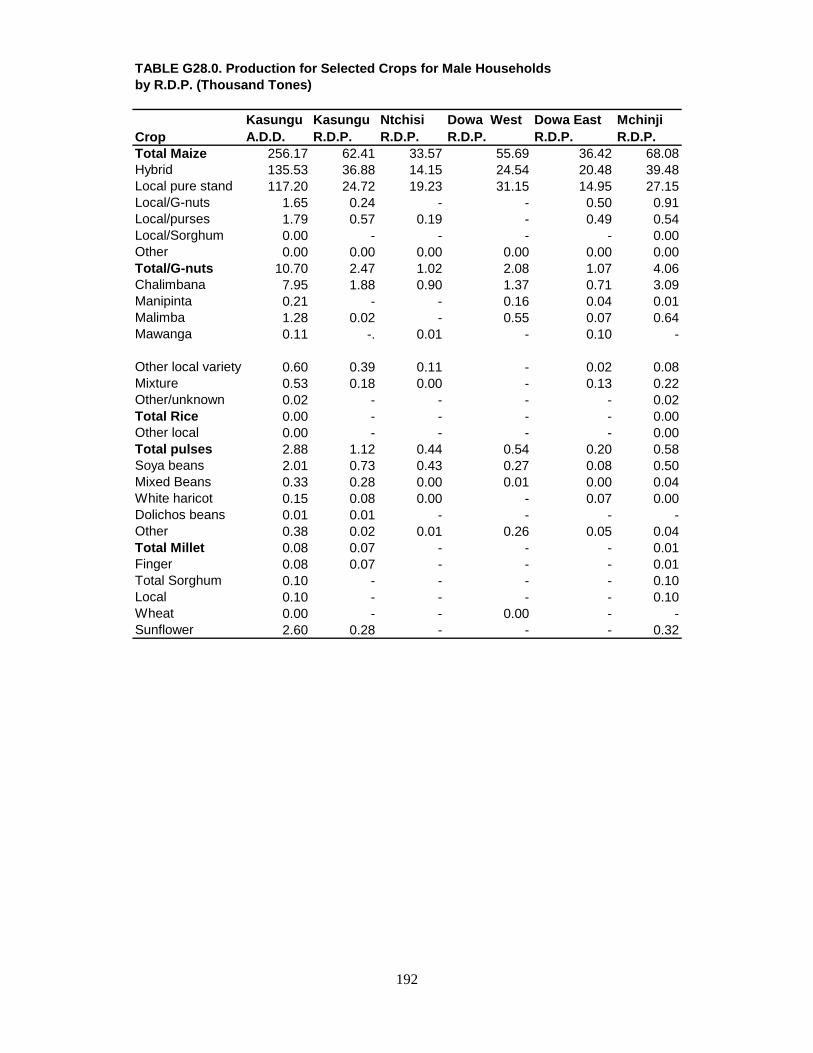
TABLE G28.0. Production for Selected Crops for Male Households by R.D.P. (Thousand Tones)
CropKasunguA.D.D.
Kasungu R.D.P.
Ntchisi R.D.P.
Dowa West R.D.P.
Dowa East R.D.P.
Mchinji R.D.P.
Total Maize 256.17 62.41 33.57 55.69 36.42 68.08Hybrid 135.53 36.88 14.15 24.54 20.48 39.48Local pure stand 117.20 24.72 19.23 31.15 14.95 27.15Local/G-nuts 1.65 0.24 - - 0.50 0.91Local/purses 1.79 0.57 0.19 - 0.49 0.54Local/Sorghum 0.00 - - - - 0.00Other 0.00 0.00 0.00 0.00 0.00 0.00Total/G-nuts 10.70 2.47 1.02 2.08 1.07 4.06Chalimbana 7.95 1.88 0.90 1.37 0.71 3.09Manipinta 0.21 - - 0.16 0.04 0.01Malimba 1.28 0.02 - 0.55 0.07 0.64Mawanga 0.11 -. 0.01 - 0.10 -
Other local variety 0.60 0.39 0.11 - 0.02 0.08Mixture 0.53 0.18 0.00 - 0.13 0.22Other/unknown 0.02 - - - - 0.02Total Rice 0.00 - - - - 0.00Other local 0.00 - - - - 0.00Total pulses 2.88 1.12 0.44 0.54 0.20 0.58Soya beans 2.01 0.73 0.43 0.27 0.08 0.50Mixed Beans 0.33 0.28 0.00 0.01 0.00 0.04White haricot 0.15 0.08 0.00 - 0.07 0.00Dolichos beans 0.01 0.01 - - - -Other 0.38 0.02 0.01 0.26 0.05 0.04Total Millet 0.08 0.07 - - - 0.01Finger 0.08 0.07 - - - 0.01Total Sorghum 0.10 - - - - 0.10Local 0.10 - - - - 0.10Wheat 0.00 - - 0.00 - -Sunflower 2.60 0.28 - - - 0.32
192

TABLE G29.0. Production for Selected Crops for Female Headed Households by R.D.P.(Thousand Tones)
CropKasunguA.D.D.
Kasungu R.D.P.
Ntchisi R.D.P.
Dowa West R.D.P.
Dowa East R.D.P.
Mchinji R.D.P.
Total Maize 38.53 8.05 6.13 12.13 4.50 7.72Hybrid 17.03 3.92 2.85 7.32 1.55 1.39Local pure stand 20.97 3.74 3.28 4.81 2.95 6.19Local/G-nuts 0.06 - - - - 0.06Local/purses 0.47 0.39 - - 0.00 0.08Other 0.00 0.00 - 0.00 0.00 0.00Total/G-nuts 3.84 0.89 0.22 1.34 0.36 1.03Chalimbana 1.88 0.26 0.21 0.45 0.35 0.61Manipinta 0.29 0.29 - - - 0.00Malimba 1.30 0.03 - 0.89 - 0.8
Other local variety 0.15 0.13 0.01 - - 0.01Mixture 0.22 0.18 - - 0.01 0.03Total pulses 0.42 0.12 0.10 0.05 0.01 0.14Soya beans 0.11 0.00 0.09 0.01 0.00 0.01Mixed Beans 0.16 0.11 - 0.01 0.00 0.04Other 0.15 0.01 0.01 0.03 0.01 0.09Total Millet 0.01 0.00 - - - 0.01Finger 0.01 0.00 - - - 0.01Sunflower 0.17 0.17 - - - -
193

TABLE G30.0. Mean Yield for Selected Crops by R.D.P.(Kilograms/Hectare)
CropKasunguA.D.D.
Kasungu R.D.P.
Ntchisi R.D.P.
Dowa West R.D.P.
Dowa East R.D.P.
Mchinji R.D.P.
Total Maize 1844.64 1646.65 2184.92 1905.06 1650.67 1973.44Hybrid 2601.47 2546.82 3177.57 2427.59 2647.84 2581.81Local pure stand 1565.49 1265.45 1883.68 1911.75 1226.87 1632.71Local/G-nuts 1005.88 705.88 - - 2083.33 866.07Local/purses 1409.94 897.20 3166.67 - 2631.58 2137.93Local/Sorghum 0.00 - - - - 0.00Other 0.00 0.00 0.00 0.00 0.00 0.00Total/G-nuts 719.80 571.43 635.90 934.43 821.84 730.27Chalimbana 654.90 596.10 668.67 736.84 809.16 618.73Manipinta 1086.96 1115.38 - 941.18 2000.00 1000.00Malimba 1474.29 227.27 - 1411.76 1166.67 2266.67Mawanga 846.15 - 500.00 - 909.09 -Other local variety 500.00 520.00 545.45 - 250.00 450.00Mixture 563.91 444.44 0.00 - 875.00 806.45Other/unknown 1000.00 - - - - 1000.00Total Rice 0.00 - - - - 0.00Other local 0.00 - - - - 0.00Total pulses 583.04 418.82 857.14 1000.00 375.00 782.61Soya beans 976.96 924.05 912.28 903.23 615.38 1378.38Mixed Beans 262.03 228.07 0.00 400.00 0.00 888.89White haricot 300.00 500.00 0.00 - 205.88 0.00Dolichos beans 100.00 1000.00 - - - -Other 477.48 103.45 333.33 1360.87 857.14 282.61Total Millet 264.71 22581 - - - 666.67Finger 264.71 225.81 - - - 666.67Total Sorghum 1375.00 - - - - 1375.00Local 1375.00 - - - - 1375.00Wheat 0.00 - - 0.00 - -Sunflower 598.27 549.33 - - - 1882.35
194

TABLE G31.0. Mean Yield for Selected Crops for Male Households by R.D.P. (kilograms/Hectare)
CropKasunguA.D.D.
Kasungu R.D.P.
Ntchisi R.D.P.
Dowa West R.D.P.
Dowa East R.D.P.
Mchinji R.D.P.
Total Maize 1930.74 1715.03 2251.51 1986.09 1680.66 2149.67Hybrid 2658.49 2584.44 3223.23 2524.69 2598.98 2682.07Local pure stand 1638.93 1289.51 1992.75 2012.27 1247.91 1782.67Local/G-nuts 1145.83 705.88 - - 2083.33 1058.14Local/purses 1137.86 982.76 3166.67 - 2722.22 2571.43Local/Sorghum 0.00 - - - - 0.00Other 0.00 0.00 0.00 0.00 0.00 0.00Total/G-nuts 673.38 527.78 658.67 835.34 708.61 717.31Chalimbana 654.32 624.58 - 744.57 617.39 635.80Manipinta 840.00 - - 941.18 2000.00 1000.00Malimba 1230.77 105.26 500.00 1145.83 1166.67 2064.52Mawanga 846.15 - 578.95 - 909.09 -Other local variety 472.44 481.48 0.00 - 250.00 421.05Mixture 514.56 290.32 - - 1444.44 814.81Other/unknown 1000.00 - - - - 1000.00Total Rice 0.00 - - - - 0.00Other local 0.00 - - 0.00Total pulses 654.55 493.39 1023.26 408.16 828.57Soya beans 1057.89 948.05 1075.00 888.89 1428.57Mixed Beans 272.73 245.61 0.00 0.00 1000.00White haricot 300.00 500.00 0.00 205.88 0.00Dolichos beans 1000.00 1000.00 - - -Other 487.18 105.26 333.33 1000.00 129.03Total Millet 266.67 241.38 - - 1000.00Finger 266.67 241.38 - - 1000.00Total Sorghum 1250.00 - - - 1250.00Local 1250.00 - - - 1250.00Wheat 603.25 550.72 - - 1882.35Sunflower 0.00 - - - -
195

TABLE G32.0. Mean Yield for Selected Crops for Female Headed Households by R.D.P. (Kilograms/Hectare)
CropKasunguA.D.D.
Kasungu R.D.P.
Ntchisi R.D.P.
Dowa West R.D.P.
Dowa East R.D.P.
Mchinji R.D.P.
Total Maize 1422.82 1257.81 1880.37 1604.50 1442.31 1145.40Hybrid 2223.24 2240.00 2968.75 2152.94 3522.73 1252.25Local pure stand 1251.94 1126.51 1426.09 1444.44 1130.27 1192.68Local/G-nuts 230.77 - - - - 230.77Local/purses 810.34 795.92 - - 0.00 1000.00Other 0.00 0.00 - 0.00 0.00 0.00Total/G-nuts 890.95 741.67 550.00 1145.30 1565.22 786.26Chalimbana 657.34 448.28 567.57 714.29 2187.50 544.64Manipinta 1380.95 1380.95 - - - 0.00Malimba 1830.99 1000.00 - 1648.15 - 2714.29Other local variety 652.17 684.21 333.33 - - 1000.00Mixture 733.33 947.37 - - 142.86 750.00Total pulses 333.33 173.91 500.00 625.00 142.86 636.36Soya beans 407.41 0.00 529.41 500.00 0.00 500.00Mixed Beans 242.42 192.98 - 333.33 0.00 800.00Other 454.55 100.00 333.33 1000.00 500.00 600.00Total Millet 250.00 0.00 - - - 500.00Finger 250.00 0.00 - - - 500.00Sunflower 531.25 531.25 - - - -
196

STATISTICAL TABLES
FOR
NSSA 1992/93
SALIMA A.D.D.
197/1198

LIST OF STATISTICAL TABLES FOR MZUZU A.D.D. Table Table title page Number G1.0 Number and percentage of gardens by holding size 203 category G2.0 Percentage of cultivated area by ploughing method 204 Used and holding size category G3.0 Percentage of cultivated area by ridging method used 205 And holding size category G4.0 Percentage of cultivated area by planting method used 206 And holding size category G5.0 Percentage of cultivated area by source of permission 207 To use land and R.D.P. G6.0 Number of plots by holding size category and R.D.P. 207 G7.0 Percentage of plots by maize variety and R.D.P 207 G8.0 Percentage of plots by source of seed and maize variety 208 G9.0 Percentage of plots to which fertilizer was applied by type 209 Of fertilizer G10.0 Percentage of plots to which fertilizer was applied by type 209 Of fertilizer G11.0 Percentage of maize plots to which fertilizer was applied by 210 Type of fertilizer, R.D.P. and sex of household head G12.0 Percentage of maize plots to which fertilizer was applied to 211 By type of fertilizer, R.D.P. and sex of household head G13.0 Percentage of plots to which fertilizer was applied by maize 212 Variety G14.0 Percentage of plots to which fertilizer was applied by maize 213 Variety G15.0 Percentage of maize plots to which fertilizer was applied by 214 Maize variety for male headed households
199

G16.0 Percentage of maize plots to which fertilizer was applied by 215 Maize variety for male headed households G17.0 Percentage of maize plots to which fertilizer was applied by 216 Maize variety for female headed households G18.0 Percentage of maize plots to which fertilizer was applied by 217 Maize variety for female headed households G19.0 Fertilizer application on area planted with maize and rice by 218 R.D.P. G20.0 Fertilizer application on area planted with maize and rice for 219 Female headed households by R.D.P. G21.0 Fertilizer application on area planted with maize and rice for 220 Female headed households by R.D.P. G22.0 Percentage of plots to which fertilizer was applied by sex of 221 Household head and source of financing G23.0 Cropping pattern by R.D.P. (Thousand Hectares) 222 G24.0 Percentage cropping pattern by R.D.P. 223 G25.0 Cropping pattern for male headed households by R.D.P. 224 ( Thousand Hectares ) G26.0 Cropping pattern for female headed households by R.D.P. 225 (Thousand Hectares) G27.0 Production for selected crops by R.D.P. (Thousand Tones) 226 G28.0 Production for selected crops for male headed households by 227 R.D.P. (Thousand Tones) G29.0 Production for selected crops for female headed households 228 By R.D.P. (Thousand Tones) G30.0 Mean yield for selected crops by R.D.P. (Kilograms/Hectare) 229 G31.0 Mean yield for selected crops for male headed households by 230 R.D.P (Kilograms/Hectare) G32.0 Mean yield for selected crops for female headed households by 231 R.D.P. (Kilograms/Hectare)
200/201/202

TABLE G1.0. Number and Percentage of Gardens by Holding Size Category
Total Holding Size Category ( Hectares )A.D.D./R.D.P Under 0.50 0.50-0.99 1.00-1.49 1.50-1.99 2.00-2.49 2.50-2.99 3.00 and over
Salima A.D.D.Number 153812 60744 45743 23525 11797 5159 2503 4341Percent 100.0 39.5 29.7 15.3 7.7 3.4 1.6 2.8
Salima R.D.P.Number 46727 19328 15164 6152 4284 1201 552 46Percent 100.0 41.4 32.5 13.2 9.2 2.6 1.2 .1
Bwanje Valley R.D.PNumber 54596 18416 15103 8584 4597 2278 1323 4295Percent 100.0 33.7 27.7 15.7 8.4 4.2 2.4 7.9
Nkhotakota R.D.P.Number 52489 23000 15476 8789 2916 1680 628 0Percent 100.0 43.8 29.5 16.7 5.6 3.2 1.2 .0
203

TABLE G2.0. Percentage of Cultivated area by Ploughing Method Used and Holding Size Category PLOUGHING METHOD TOTAL HOLDING SIZE CATEGORY ( HECTARES )
Under 0.50 0.50 - 0.99 1.00 - 1.49 1.50 - 1.99 2.00 - 2.49 2.50 - 2.99 3.00 and overSalima A.D.D.Total 100.0 18.3 28.5 19.9 14.1 7.6 3.5 8.1Not ploughed this season 88.9 15.1 25.9 18.0 12.6 7.0 3.1 7.3Tilled by hoeing 10.0 3.1 2.4 1.9 1.5 .6 2 .4Ploughed by oxen 1.0 .1 .2 - - - .3 .5Other .1 .0 .0 .0 - - - -
Salima R.D.P.Total 100.0 19.8 35.7 19.0 16.2 5.7 2.9 .8Not ploughed this season 85.8 14.5 31.7 17.3 15.8 4.6 2.0 -Tilled by hoeing 12.8 5.0 3.9 1.7 .4 1.2 - .8Ploughed by oxen 1.4 .4 .2 - - - 9 -
Bwanje Valley R.D.P.Total 100.0 15.2 22.9 18.4 14.7 7.1 4.3 17.5Not ploughed this season 91.6 14.0 21.4 16.7 12.1 7.1 4.0 16.2Tilled by hoeing 7.2 1.2 1.2 1.6 2.6 - .4 .3Ploughed by oxen 1.3 - .2 - - - - 1.0
Nkhotakota R.D.P.Total 100.0 22.5 29.3 24.2 9.9 11.3 2.9 -Not ploughed this season 88.1 18.1 26.4 21.4 9.0 10.4 2.9 -Tilled by hoeing 11.5 4.1 2.9 2.7 .9 .9 - -Other .4 .2 .1 .1 - - -
204

TABLE G3.0. Percentage of Cultivated area by Ridging Method Used and Holding Size Category Ridging Method Total Holding Size Category ( Hectares )
Under 0.50 0.50 - 0.99 1.00 - 1.49 1.50 - 1.99 2.00 - 2.49 2.50 - 2.99 3.00 and overSalima A.D.D.Total 100.0 18.3 28.5 19.9 14.1 7.6 3.5 8.1Not ridged this season 16.8 5.9 5.6 2.7 1.3 .9 .2 .2Ridged by hoeing 82.3 12.3 22.9 17.1 12.8 6.7 3.0 7.4Ridged by oxen .8 - .0 .0 - - .3 .5Other .2 .1 .0 .1 .0 - - -
Salima R.D.P.Total 100.0 19.8 35.7 19.0 16.2 5.7 2.9 .8Not ridged this season 15.7 6.1 5.2 2.1 .8 .2 .6 .8Ridged by hoeing 83.4 13.7 30.5 16.9 15.4 5.5 1.4 -Ridged by oxen .9 - - - - - .9 -
Bwanje Valley R.D.P.Total 100.0 15.2 22.9 18.4 14.7 7.1 4.3 17.5Not ridged this season 9.6 3.3 3.1 2.0 .8 .4 - -Ridged by hoeing 89.3 11.9 19.7 16.4 13.8 6.7 4.3 16.5Ridged by oxen 1.1 - .0 - - - - 1.0
Nkhotakota R.D.P.Total 100.0 22.5 29.3 24.2 9.9 11.3 2.9 -Not ridged this season 32.5 11.1 10.9 4.8 2.9 2.8 - -Ridged by hoeing 66.7 11.1 18.4 18.9 7.0 8.4 2.9 -Ridged by oxen .1 - - .1 - - - -Other .7 .3 .0 .4 .1 - - -
205

TABLE G4.0. Percentage of Cultivated Area by Planting Method Used and Holding Size Category Planting Method Total Holding Size Category ( Hectares )
Under 0.50 0.50 - 0.99 1.00-1.49 1.50-1.99 2.00-2.49 2.50-2.99 3.00 and overSalima A.D.D. 100.0 18.3 28.5 19.9 14.1 7.6 3.5 8.1Flat planted 9.4 3.4 3.2 1.5 .8 .3 - .2Used last season ridges 2.5 .7 .7 .3 .4 .4 - -Used this season ridges 84.0 12.4 22.9 17.8 12.7 6.9 3.5 7.9Planted into holes .1 .0 .0 - - - .0 -Planted into rounds 3.9 1.8 1.7 .3 .1 - - -Other .1 .1 - - .1 - - -
Salima R.D.P.Total 100.0 19.8 35.7 19.0 16.2 5.7 2.9 .8Flat planted 12.6 5.9 4.1 1.5 .4 - - .8Used last season ridges 2.4 .6 1.0 .0 .6 .1 - -Used this season ridges 84.6 13.2 30.4 17.2 15.2 5.6 2.9 -Planted into holes .1 - .1 - - - -Planted into rounds .3 .1 - .2 - - - -
Bwanje Valley R.D.P.Total 100.0 15.2 22.9 18.4 14.7 7.1 4.3 17.5Flat planted 5.7 1.4 2.7 .4 .8 .4 - -Used last season ridges 1.5 .9 .2 .4 - - - -Used this season ridges 92.8 12.9 20.0 17.5 13.8 6.7 4.3 17.5Planted into holes .0 .0 - - - - .0 -
Nkhotakota R.D.P.Total 100.0 22.5 29.3 24.2 9.9 11.3 2.9 -Flat planted 12.3 3.8 3.1 3.6 1.2 .6 - -Used last season ridges 4.4 .6 .9 .4 .7 1.7 - -Used this season ridges 65.6 10.0 17.7 19.2 7.0 8.9 2.9 -Planted into rounds 17.0 7.8 7.6 1.0 .6 - - -Other .7 .2 - - .4 - - -
206
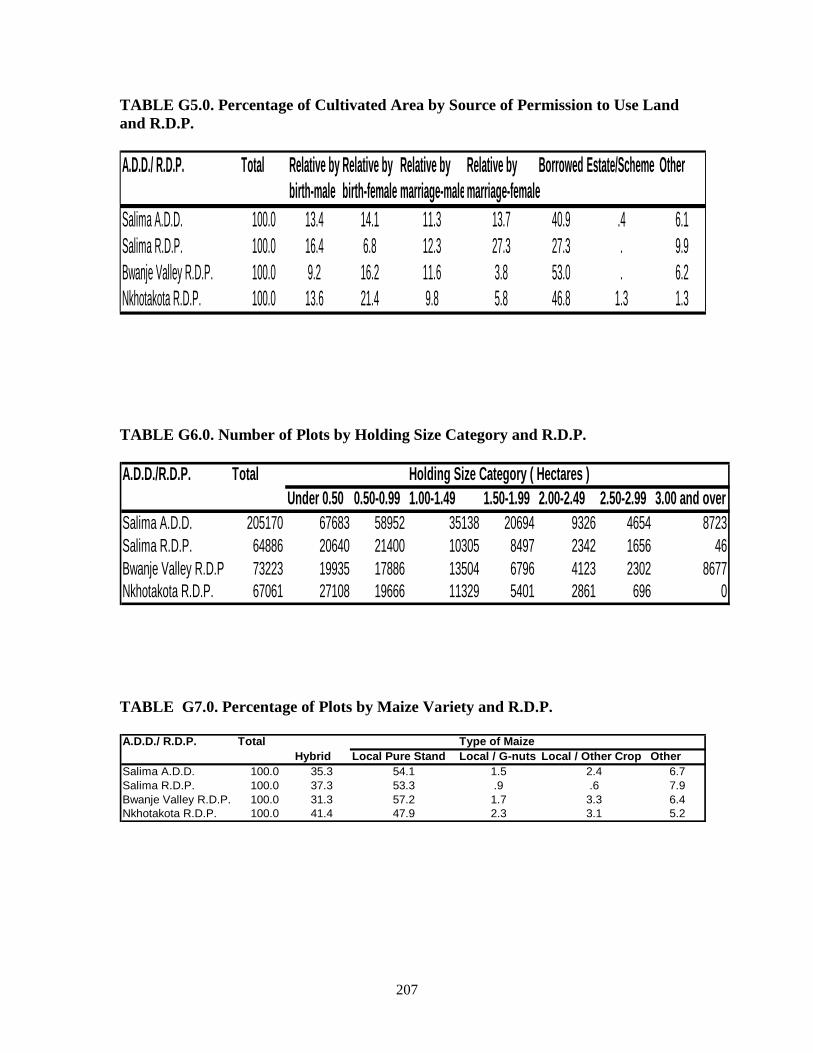
TABLE G5.0. Percentage of Cultivated Area by Source of Permission to Use Land and R.D.P. A.D.D./ R.D.P. Total Relative by Relative by Relative by Relative by Borrowed Estate/Scheme Other
birth-male birth-female marriage-male marriage-femaleSalima A.D.D. 100.0 13.4 14.1 11.3 13.7 40.9 .4 6.1Salima R.D.P. 100.0 16.4 6.8 12.3 27.3 27.3 . 9.9Bwanje Valley R.D.P. 100.0 9.2 16.2 11.6 3.8 53.0 . 6.2Nkhotakota R.D.P. 100.0 13.6 21.4 9.8 5.8 46.8 1.3 1.3 TABLE G6.0. Number of Plots by Holding Size Category and R.D.P. A.D.D./R.D.P. Total Holding Size Category ( Hectares )
Under 0.50 0.50-0.99 1.00-1.49 1.50-1.99 2.00-2.49 2.50-2.99 3.00 and overSalima A.D.D. 205170 67683 58952 35138 20694 9326 4654 8723Salima R.D.P. 64886 20640 21400 10305 8497 2342 1656 46Bwanje Valley R.D.P 73223 19935 17886 13504 6796 4123 2302 8677Nkhotakota R.D.P. 67061 27108 19666 11329 5401 2861 696 0 TABLE G7.0. Percentage of Plots by Maize Variety and R.D.P. A.D.D./ R.D.P. Total Type of Maize
Hybrid Local Pure Stand Local / G-nuts Local / Other Crop OtherSalima A.D.D. 100.0 35.3 54.1 1.5 2.4 6.7Salima R.D.P. 100.0 37.3 53.3 .9 .6 7.9Bwanje Valley R.D.P. 100.0 31.3 57.2 1.7 3.3 6.4Nkhotakota R.D.P. 100.0 41.4 47.9 2.3 3.1 5.2
207

TABLE G8.0. Percentage of Plots by Source of Seed and Maize Variety. Maize Variety Total Source of Seed
Retained from Project/scheme As seed from As food from As food from Bought Otherlast season credit ADMARC ADMARC a market locally
Salima A.D.D.All maize 100.0 31.3 9.4 9.7 1.4 .8 23.3 24.1Hybrid 35.3 2.5 8.5 8.5 .3 .0 3.6 11.9Local pure stand 54.1 25.8 .8 1.0 1.0 .5 17.1 7.8Local / G-nuts 1.5 .7 .1 .1 .0 .0 .5 .1Local / other crop 2.4 1.4 .0 .0 .0 .0 .7 .3Other 6.7 .9 .0 .1 .1 .2 1.4 4.0
Salima R.D.P.All maize 100.0 26.6 7.7 6.9 1.9 1.4 21.0 34.5Hybrid 37.3 1.8 6.3 5.6 .3 .1 2.8 20.4Local pure stand 53.3 22.5 1.1 1.3 1.4 1.3 16.0 9.6Local / G-nuts .9 .2 .2 .0 .0 .0 .2 .2Local / other crop .6 .2 .0 .0 .0 .0 .4 .0Other 7.9 1.9 .0 .0 .1 .0 1.5 4.3
Bwanje Valley R.D.P.All maize 100.0 33.8 8.3 11.0 1.3 .4 29.5 15.7Hybrid 31.3 3.0 7.7 9.7 .3 .0 4.9 5.8Local pure stand 57.2 28.0 .6 1.0 1.0 .2 21.7 4.7Local / G-nuts 1.7 .7 .0 .1 .0 .0 .8 .0Local / other crop 3.3 1.7 .0 .0 .0 .0 1.2 .4Other 6.4 .3 .0 .2 .1 .2 .9 4.8
Nkhotakota R.D.P.All maize 100.0 33.7 15.1 11.4 .7 .7 12.3 26.1Hybrid 41.4 2.5 14.3 10.8 .3 .0 1.8 11.7Local pure stand 47.9 26.3 .7 .7 .5 .0 7.8 11.9Local / G-nuts 2.3 1.6 .0 .0 .0 .0 .4 .4Local / other crop 3.1 2.7 .0 .0 .0 .0 .0 .4Other 5.2 .5 .0 .0 .0 .7 2.3 1.7
208
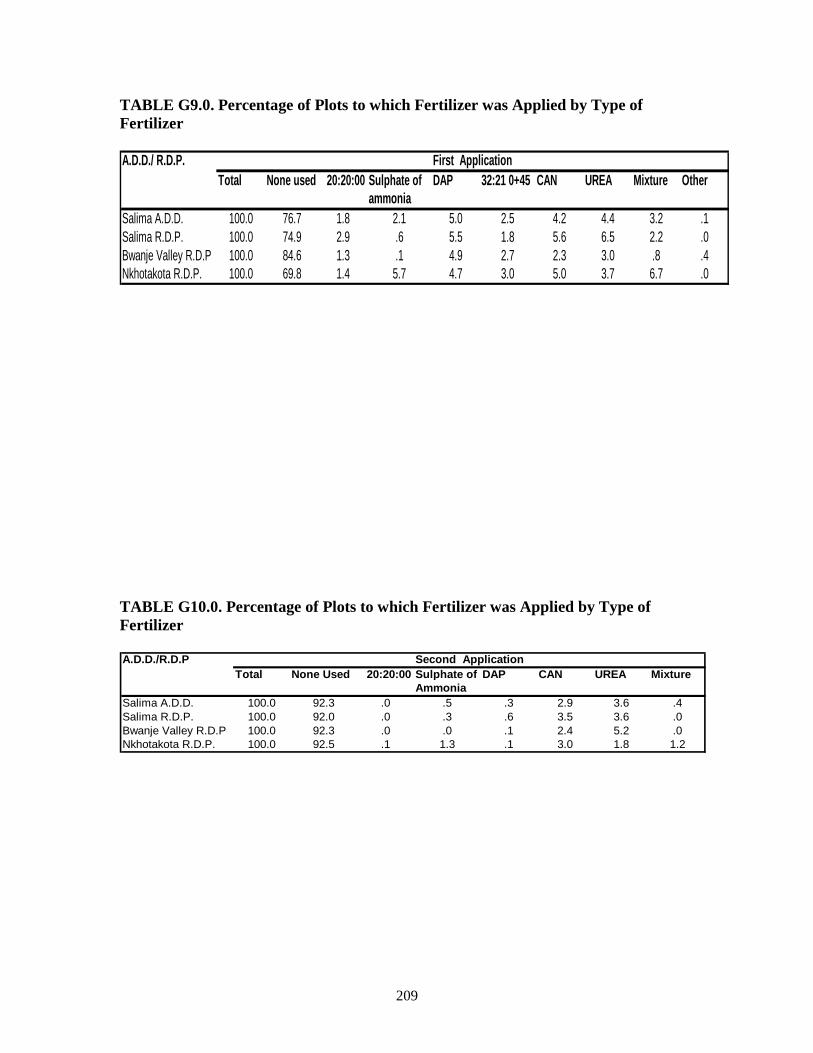
TABLE G9.0. Percentage of Plots to which Fertilizer was Applied by Type of Fertilizer A.D.D./ R.D.P. First Application
Total None used 20:20:00 Sulphate of DAP 32:21 0+45 CAN UREA Mixture Otherammonia
Salima A.D.D. 100.0 76.7 1.8 2.1 5.0 2.5 4.2 4.4 3.2 .1Salima R.D.P. 100.0 74.9 2.9 .6 5.5 1.8 5.6 6.5 2.2 .0Bwanje Valley R.D.P 100.0 84.6 1.3 .1 4.9 2.7 2.3 3.0 .8 .4Nkhotakota R.D.P. 100.0 69.8 1.4 5.7 4.7 3.0 5.0 3.7 6.7 .0 TABLE G10.0. Percentage of Plots to which Fertilizer was Applied by Type of Fertilizer A.D.D./R.D.P Second Application
Total None Used 20:20:00 Sulphate of DAP CAN UREA MixtureAmmonia
Salima A.D.D. 100.0 92.3 .0 .5 .3 2.9 3.6 .4Salima R.D.P. 100.0 92.0 .0 .3 .6 3.5 3.6 .0Bwanje Valley R.D.P 100.0 92.3 .0 .0 .1 2.4 5.2 .0Nkhotakota R.D.P. 100.0 92.5 .1 1.3 .1 3.0 1.8 1.2
209

TABLE G11.0. Percentage of Maize Plots to which Fertilizer was Applied by Type of Fertilizer, R.D.P. and Sex of Household Head A.D.D./R.D.P. FIRST APPLICATION
Total None Used 20:20:00 Sulphate of DAP 23:21 0+4S CAN UREA MIXTURE OTHERAmmonia
Salima A.D.D.Total 100.0 76.7 1.8 2.1 5.0 2.5 4.2 4.4 3.2 .1Male 71.7 53.4 1.6 1.1 4.2 1.8 3.1 3.6 2.8 .1Female 28.3 23.3 .2 1.0 .8 .7 1.1 .8 .3 .0
Salima R.D.P.Total 100.0 74.9 2.9 .6 5.5 1.8 5.6 6.5 2.2 .0Male 82.4 60.7 2.8 .6 5.1 1.4 4.1 5.5 2.2 .0Female 17.6 14.1 .1 .0 .4 .4 1.5 1.0 .0 .0
Bwanje Valley R.D.PTotal 100.0 84.6 1.3 .1 4.9 2.7 2.3 3.0 .8 .4Male 62.6 50.4 1.0 .1 4.2 2.1 1.7 2.1 .8 .4Female 37.4 34.2 .4 .0 .7 .6 .6 1.0 .0 .0
Nkhotakota R.D.P.Total 100.0 69.8 1.4 5.7 4.7 3.0 5.0 3.7 6.7 .0Male 71.3 49.5 1.2 2.8 3.2 1.8 3.7 3.4 5.7 .0Female 28.7 20.3 .2 3.0 1.5 1.2 1.3 .3 1.0 .0
210

TABLE G12.0. Percentage of Maize Plots which Fertilizer was Applied to by Type of Fertilizer, R.D.P. and Sex of Household Head A.D.D./R.D.P. Second Application
Total None Used 20:20:00 Sulphate of DAP CAN UREA MixtureAmmonia
Salima A.D.D.Total 100.0 92.3 .0 .5 .3 2.9 3.6 .4Male 71.7 65.5 .0 .4 .2 2.4 2.9 .3Female 28.3 26.8 .0 .1 .0 .5 .7 .1
Salima R.D.P.Total 100.0 92.0 .0 .3 .6 3.5 3.6 .0Male 82.4 75.3 .0 .3 .6 3.2 3.0 .0Female 17.6 16.6 .0 .0 .0 .3 .6 .0
Bwanje Valley R.D.PTotal 100.0 92.3 .0 .0 .1 2.4 5.2 .0Male 62.6 56.4 .0 .0 .1 1.7 4.4 .0Female 37.4 35.9 .0 .0 .0 .7 .8 .0
Nkhotakota R.D.P.Total 100.0 92.5 .1 1.3 .1 3.0 1.8 1.2Male 71.3 65.9 .1 .9 .0 2.4 1.1 .9Female 28.7 26.6 .0 .3 .1 .6 .8 .3
211

TABLE G13.0. Percentage of Plots to which Fertilizer was Applied by Maize Variety MAIZE VARIETY FIRST APPLICATION
Total None Used 20:20:00 Sulphate of DAP 23:21 0+4S CAN UREA MixtureAmmonia
Salima A.D.D.All maize 100.0 67.4 2.9 1.9 7.4 3.6 5.9 6.7 4.1Hybrid 35.3 17.3 2.0 .4 5.3 2.7 2.6 3.0 2.1Local pure stand 54.1 42.6 .7 .7 1.6 .8 2.6 3.4 1.7Local/G-nuts 1.5 1.1 .1 .2 .1 .0 .1 .0 .0Local/other crop 2.4 2.0 .0 .2 .1 .0 .0 .0 .1Other 6.7 4.5 .1 .4 .4 .2 .5 .4 .3
Salima R.D.P.All maize 100.0 65.0 4.5 .9 8.0 2.6 7.5 8.8 2.8Hybrid 37.3 19.5 2.6 .2 4.8 1.2 3.5 4.5 1.0Local pure stand 53.3 40.0 1.7 .5 2.3 .9 3.3 3.3 1.4Local/G-nuts .9 .4 .0 .0 .2 .0 .2 .0 .0Local/other crop .6 .6 .0 .0 .0 .0 .0 .0 .0Other 7.9 4.4 .3 .2 .6 .5 .5 1.0 .4
Bwanje Valley R.D.P.All maize 100.0 81.5 1.7 .1 6.0 3.5 2.6 3.8 .7Hybrid 31.3 18.2 1.3 .0 5.2 3.1 .9 2.1 .6Local pure stand 57.2 52.9 .3 .0 .5 .4 1.4 1.6 .1Local/G-nuts 1.7 1.4 .2 .0 .0 .0 .1 .0 .0Local/other crop 3.3 3.3 .0 .0 .0 .0 .0 .0 .0Other 6.4 5.6 .0 .1 .4 .0 .2 .1 .0
Nkhotakota R.D.P.All maize 100.0 38.1 2.8 7.9 9.8 5.9 11.1 10.1 14.4Hybrid 41.4 11.2 2.8 1.9 6.2 4.1 5.2 2.4 7.7Local pure stand 47.9 22.3 .0 2.6 3.2 1.8 4.5 7.7 5.8Local/G-nuts 2.3 1.6 .0 .8 .0 .0 .0 .0 .0Local/other crop 3.1 1.2 .0 1.2 .4 .0 .0 .0 .4Other 5.2 1.8 .0 1.4 .0 .0 1.4 .0 .6
212

TABLE G14.0. Percentage of Plots to which Fertilizer was Applied by Maize Variety MAIZE VARIETY SECOND APPLICATION
Total None Used 20:20:00 Sulphate of DAP CAN UREA MixtureAmmonia
Salima A.D.D.All maize 100.0 88.7 .1 .6 .4 4.1 5.6 .4Hybrid 35.3 26.8 .0 .6 .4 2.7 4.6 .3Local pure stand 54.1 51.9 .1 .0 .0 1.1 .8 .1Local /G-nuts 1.5 1.4 .0 .0 .0 .2 .0 .0Local /other crop 2.4 2.4 .0 .0 .0 .0 .0 .0Other 6.7 6.2 .0 .1 .1 .1 .2 .0
Salima R.D.P.All maize 100.0 88.0 .0 .5 .9 5.3 5.2 .0Hybrid 37.3 29.7 .0 .5 .7 2.7 3.7 .0Local pure stand 53.3 50.0 .0 .0 .0 2.1 1.2 .0Local /G-nuts .9 .6 .0 .0 .0 .2 .0 .0Local /other crop .6 .6 .0 .0 .0 .0 .0 .0Other 7.9 7.0 .0 .0 .2 .3 .3 .0
Bwanje Valley R.D.P.All maize 100.0 90.7 .0 .0 .2 2.6 6.6 .0Hybrid 31.3 23.3 .0 .0 .2 2.0 5.8 .0Local pure stand 57.2 56.4 .0 .0 .0 .4 .5 .0Local /G-nuts 1.7 1.5 .0 .0 .0 .2 .0 .0Local /other crop 3.3 3.3 .0 .0 .0 .0 .0 .0Other 6.4 6.2 .0 .0 .0 .0 .2 .0
Nkhotakota R.D.P.All maize 100.0 85.3 .3 2.3 .2 5.5 4.2 2.2Hybrid 41.4 30.3 .0 2.1 .2 4.1 3.3 1.4Local pure stand 47.9 44.6 .3 .0 .0 1.3 .9 .8Local /G-nuts 2.3 2.3 .0 .0 .0 .0 .0 .0Local /other crop 3.1 3.1 .0 .0 .0 .0 .0 .0Other 5.2 5.0 .0 .3 .0 .0 .0 .0
213

TABLE G15.0. Percentage of Maize Plots to which Fertilizer was Applied by Maize Variety for Male Headed Households MAIZE VARIETY FIRST APPLICATION
Total None Used 20:20:00 Sulphate of DAP 23:21 0+4S CAN UREA MixtureAmmonia
Salima A.D.D.All maize 100.0 63.0 3.7 1.3 8.7 3.7 6.1 8.0 5.6Hybrid 37.2 16.4 2.4 .4 6.1 2.5 3.0 3.6 2.8Local pure stand 53.6 40.1 1.0 .5 2.2 1.0 2.5 3.9 2.3Local /G-nuts 1.3 1.0 .1 .0 .1 .0 .1 .0 .0Local /other crop 1.3 1.2 .0 .0 .0 .0 .0 .0 .1Other 6.6 4.3 .1 .4 .3 .2 .4 .5 .4
Salima R.D.P.All maize 100.0 63.7 5.3 1.1 8.9 2.3 6.2 9.0 3.5Hybrid 37.7 18.9 2.9 .3 5.6 1.1 2.9 4.8 1.2Local pure stand 51.7 38.4 2.1 .6 2.5 .7 2.4 3.3 1.7Local /G-nuts 1.1 .5 .0 .0 .3 .0 .3 .0 .0Local /other crop .5 .5 .0 .0 .0 .0 .0 .0 .0Other 9.0 5.4 .4 .2 .6 .4 .6 1.0 .5
Bwanje Valley R.D.P.All maize 100.0 75.7 2.1 .2 8.8 4.6 3.2 4.4 1.1Hybrid 34.8 17.2 1.3 .0 7.7 3.9 1.3 2.5 .9Local pure stand 55.9 50.4 .5 .0 .8 .7 1.6 1.7 .2Local /G-nuts 1.1 .8 .3 .0 .0 .0 .0 .0 .0Local /other crop 2.2 2.2 .0 .0 .0 .0 .0 .0 .0Other 6.0 5.0 .0 .2 .2 .0 .3 .2 .0
Nkhotakota R.D.P.All maize 100.0 35.6 3.6 4.0 8.1 4.7 11.9 13.3 18.9Hybrid 41.2 9.7 3.6 1.5 3.8 2.5 6.9 3.4 9.9Local pure stand 52.8 22.5 .0 .0 .0 .0 .0 .0 .0Local /G-nuts 2.2 2.2 .0 .0 .0 .0 .0 .0 .0Local /other crop 1.1 .6 .0 .0 .0 .0 .0 .0 .5Other 2.7 .6 .0 .9 .0 .0 .3 .0 .9
214

TABLE G16.0. Percentage of Plots to which Fertilizer was Applied by Maize Variety for Male Headed Households MAIZE VARIETY SECOND APPLICATION
Total None Used 20:20:00 Sulphate of DAP CAN UREA MixtureAmmonia
Salima A.D.D.All maize 100.0 87.1 .1 .7 .6 4.8 6.4 .4Hybrid 37.2 27.7 .0 .6 .5 3.0 5.3 .2Local pure stand 53.6 50.9 .1 .0 .0 1.4 1.0 .2Local / G-nuts 1.3 1.1 .0 .0 .0 .2 .0 .0Local / other crop 1.3 1.3 .0 .0 .0 .0 .0 .0Other 6.6 6.1 .0 .1 .1 .1 .1 .0
Salima R.D.P.All maize 100.0 87.3 .0 .6 1.1 5.9 5.1 .0Hybrid 37.7 29.5 .0 .6 .8 3.0 3.8 .0Local pure stand 51.7 48.4 .0 .0 .0 2.2 1.1 .0Local / G-nuts 1.1 .8 .0 .0 .0 .3 .0 .0Local / other crop .5 .5 .0 .0 .0 .0 .0 .0Other 9.0 8.1 .0 .0 .3 .4 .2 .0
Bwanje Valley R.D.P.All maize 100.0 87.4 .0 .0 .3 2.9 9.4 .0Hybrid 34.8 24.0 .0 .0 .3 2.0 8.6 .0Local pure stand 55.9 54.4 .0 .0 .0 .6 .8 .0Local / G-nuts 1.1 .8 .0 .0 .0 .3 .0 .0Local / other crop 2.2 2.2 .0 .0 .0 .0 .0 .0Other 6.0 6.0 .0 .0 .0 .0 .0 .0
Nkhotakota R.D.P.All maize 100.0 86.2 .5 2.1 .0 6.3 3.0 2.0Hybrid 41.2 31.8 .0 1.7 .0 5.0 1.7 .9Local pure stand 52.8 48.7 .5 .0 .0 1.2 1.3 1.1Local / G-nuts 2.2 2.2 .0 .0 .0 .0 .0 .0Local / other crop 1.1 1.1 .0 .0 .0 .0 .0 .0Other 2.7 2.3 .0 .4 .0 .0 .0 .0
215
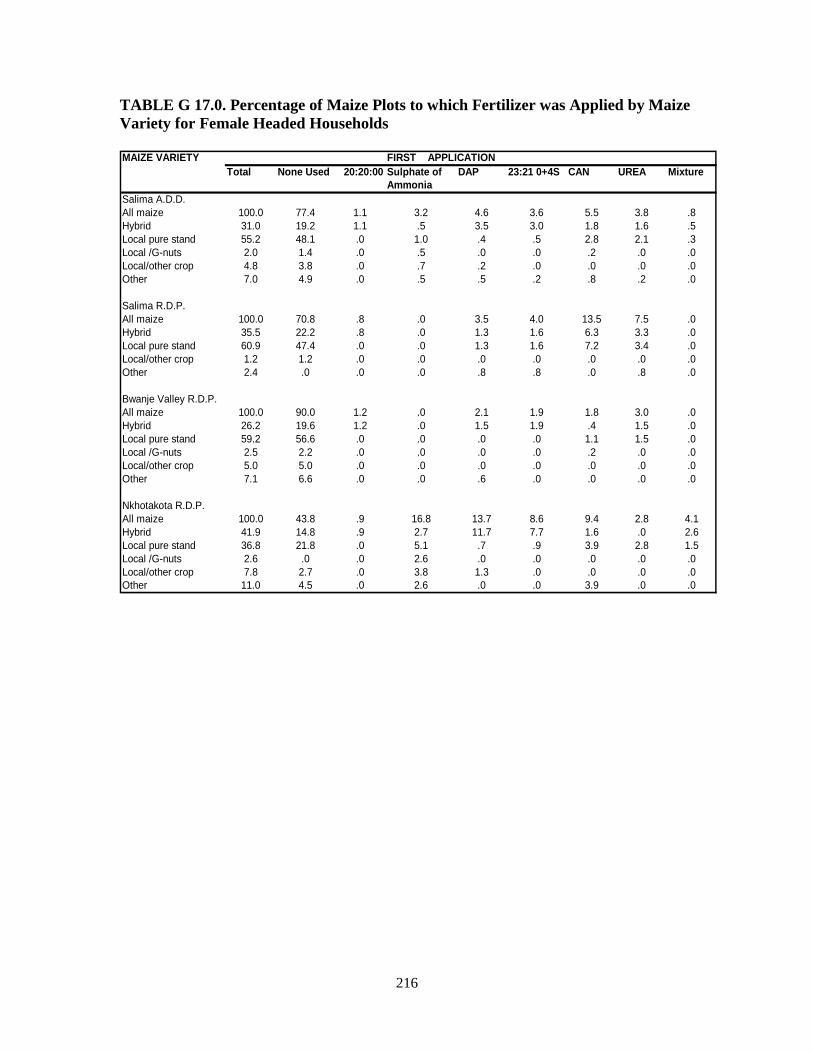
TABLE G 17.0. Percentage of Maize Plots to which Fertilizer was Applied by Maize Variety for Female Headed Households MAIZE VARIETY FIRST APPLICATION
Total None Used 20:20:00 Sulphate of DAP 23:21 0+4S CAN UREA MixtureAmmonia
Salima A.D.D.All maize 100.0 77.4 1.1 3.2 4.6 3.6 5.5 3.8 .8Hybrid 31.0 19.2 1.1 .5 3.5 3.0 1.8 1.6 .5Local pure stand 55.2 48.1 .0 1.0 .4 .5 2.8 2.1 .3Local /G-nuts 2.0 1.4 .0 .5 .0 .0 .2 .0 .0Local/other crop 4.8 3.8 .0 .7 .2 .0 .0 .0 .0Other 7.0 4.9 .0 .5 .5 .2 .8 .2 .0
Salima R.D.P.All maize 100.0 70.8 .8 .0 3.5 4.0 13.5 7.5 .0Hybrid 35.5 22.2 .8 .0 1.3 1.6 6.3 3.3 .0Local pure stand 60.9 47.4 .0 .0 1.3 1.6 7.2 3.4 .0Local/other crop 1.2 1.2 .0 .0 .0 .0 .0 .0 .0Other 2.4 .0 .0 .0 .8 .8 .0 .8 .0
Bwanje Valley R.D.P.All maize 100.0 90.0 1.2 .0 2.1 1.9 1.8 3.0 .0Hybrid 26.2 19.6 1.2 .0 1.5 1.9 .4 1.5 .0Local pure stand 59.2 56.6 .0 .0 .0 .0 1.1 1.5 .0Local /G-nuts 2.5 2.2 .0 .0 .0 .0 .2 .0 .0Local/other crop 5.0 5.0 .0 .0 .0 .0 .0 .0 .0Other 7.1 6.6 .0 .0 .6 .0 .0 .0 .0
Nkhotakota R.D.P.All maize 100.0 43.8 .9 16.8 13.7 8.6 9.4 2.8 4.1Hybrid 41.9 14.8 .9 2.7 11.7 7.7 1.6 .0 2.6Local pure stand 36.8 21.8 .0 5.1 .7 .9 3.9 2.8 1.5Local /G-nuts 2.6 .0 .0 2.6 .0 .0 .0 .0 .0Local/other crop 7.8 2.7 .0 3.8 1.3 .0 .0 .0 .0Other 11.0 4.5 .0 2.6 .0 .0 3.9 .0 .0
216

TABLE G18.0. Percentage of Plots to which Fertilizer was Applied by Maize Variety for Female Headed Households MAIZE VARIETY SECOND APPLICATION
Total None Used Sulphate of DAP CAN UREA MixtureAmmonia
Salima A.D.D.All maize 100.0 92.4 .6 .1 2.5 3.9 .5Hybrid 30.0 24.8 .6 .1 1.9 3.1 .5Local pure stand 55.2 54.3 .0 .0 .6 .3 .0Local /G-nuts 2.0 2.0 .0 .0 .0 .0 .0Local /other crop 4.8 4.8 .0 .0 .0 .0Other 7.0 6.5 .0 .0 .0 .5 .0
Salima R.D.P.All maize 100.0 91.7 .0 .0 2.7 5.6 .0Hybrid 35.5 31.0 .0 .0 1.3 3.2 .0Local pure stand 60.9 57.9 .0 .0 1.3 1.6 .0Local /other crop 1.2 1.2 .0 .0 .0 .0 .0Other 2.4 1.6 .0 .0 .0 .8 .0
Bwanje Valley R.D.P.All maize 100.0 95.4 .0 .0 2.1 2.4 .0Hybrid 26.2 22.2 .0 .0 2.1 1.9 .0Local pure stand 59.2 59.2 .0 .0 .0 .0 .0Local /G-nuts 2.5 2.5 .0 .0 .0 .0 .0Local /other crop 5.0 5.0 .0 .0 .0 .0 .0Other 7.1 6.6 .0 .0 .0 .6 .0
Nkhotakota R.D.P.All maize 100.0 83.4 2.9 .6 3.6 6.9 2.6Hybrid 41.9 26.9 2.9 .6 2.0 6.9 2.6Local pure stand 36.8 35.2 .0 .0 1.6 .0 .0Local /G-nuts 2.6 2.6 .0 .0 .0 .0 .0Local /other crop 7.8 7.8 .0 .0 .0 .0 .0Other 11.0 11.0 .0 .0 .0 .0 .0
217

TABLE G19.0. Fertilizer Application on Area Planted with Maize and Rice by R.D.P. R.D.P Total Area Area Fertilised Percentage
(Hectares) (Hectares) FertilizedSalima R.D.P.Total maize 18986.21 8456.51 44.54Hybrid 6024.14 3573.98 59.33Local pure stand 10999.74 3846.35 34.97Local /G-nuts 259.73 238.19 91.71Local /pulse 90.67 - -Local /sorghum 27.73 - -Other 1584.21 797.99 50.37Total rice 591.72 - -Other local 179.49 - -Faya 179.25 - -Bluebonnet 82.13 - -Mixture 143.38 - -Other 7.47 - -Bwanje Valley R.D.P.Total maize 34615.25 7016.06 20.27Hybrid 9332.93 4592.98 49.21Local pure stand 21964.65 1750.23 7.97Local /G-nuts 383.91 152.36 39.69Local /millet 944.78 - -Local /other grains 9.1 - -Local /root crops 3.59 - -Other 1976.29 520.49 26.34Total rice 151.41 38.87 25.67Kilombera 30.42 - -Other local 11.96 - -Faya 69.01 38.87 56.33Bluebonnet 40.02 - -
Nkhotakota R.D.P.Total maize 7914.97 6350.06 80.23Hybrid 3079.47 2825.63 91.76Local pure stand 4344.68 3145.31 72.39Local /G-nuts 85.52 15.46 18.08Local /pulse 82.32 - -Local /millet 21.91 19.33 88.22Local /root crops 7.28 - -Other 293.79 244.00 83.05Total rice 2004.76 590.08 29.43Kilombera 1.35 - -Other local 83.52 11.52 13.79Faya 1665.18 483.1 29.01Bluebonnet 92.96 - -Mixture 37.19 - -Other 124.56 95.45 76.63
218

TABLE 20.0. Fertiliser Application on Area planted with Maize and Rice for Male Headed Households by R.D.P.
R.D.PTotal Area (Hectares)
Area Fertilised (Hectares)
Percentage Fertilised
Salima R.D.PTotal Maize 15916.09 7305.21 45.90Hybrid 5029.06 3050.33 60.65Local pure stand 8995.10 3282.71 36.45Local/G-nuts 259.73 238.19 91.71Local/Pulses 90.67 - -Other 1541.54 797.99 50.37Total Rice 493.01 - -Other local 167.42 - -Faya 156.81 - -Bluebonnet 82.13 - -Mixture 79.18 - -Other 7.47 - -Bwanje Valley R.D.P.Total Maize 22002.81 5949.66 27.04Hybrid 7066.41 3781.28 53.51Local pure stand 12946.09 1585.42 12.25Local/G-nuts 229.92 116.48 50.66Local/Millet 426.22 - -Local/Root crops 3.59 - -Other 1330.58 466.49 35.06Total Rice 120.99 38.87 32.13Other local 11.96 - -Faya 69.01 38.87 56.33Bluebonnet 40.02 - -Nkhotakota R.D.P.Total Maize 6430.48 5475.79 85.15Hybrid 2637.99 2525.10 95.72Local pure stand 3506.64 2698.88 76.96Local/G-nuts 44.0 - -Local/Pulses 78.46 - -Other 163.40 155.36 95.08Total Rice 1449.85 282.22 19.47Kilombera 1.35 - -Other local 72.00 - -Faya 1203.85 229.31 19.05Bluebonnet 92.96 - -Mixture 21.07 - -Other 58.61 52.90 90.26
219

TABLE 21.0. Fertiliser Application on Area planted with Maize and Rice for Female Headed Households by R.D.P.
R.D.PTotal Area (Hectares)
Area Fertilised (Hectares)
Percentage Fertilised
Salima R.D.PTotal Maize 3070.13 1151.30 37.50Hybrid 995.08 523.65 52.62Local pure stand 2004.64 563.65 28.12Local/Sorghum 27.73 - -Other 42.67 - -Total Rice 98.70 - -Other Local 12.07 - -Faya 22.45 - -Mixture 64.20 - -Bwanje Valley R.D.P.Total Maize 12612.44 1066.39 8.46Hybrid 2266.53 811.70 35.81Local pure stand 9018.56 164.81 1.83Local/G-nuts 153.99 35.88 23.30Local/Millet 518.56 - -Local/other grains 9.10 - -Other 645.71 54.00 8.36Total Rice 3042 - -Kilombera 30.42 - -Nkhotakota R.D.P.Total Maize 1484.49 874.27 58.89Hybrid 441.48 300.53 68.07Local pure stand 838.04 446.44 53.27Local/G-nuts 41.52 15.46 37.24Local/Pulses 3.87 - -Local Millet 21.91 19.33 88.22local/Root crops 7.28 - -Other 130.40 88.64 67.98Total Rice 555.63 307.86 55.41Kilombera 30.42 - -Other Local 11.52 11.52 100.00Faya 461.33 253.79 55.01Mixture 16.12 - -Other 65.95 42.55 64.52
220

TABLE G22.0. Percentage of plots to which Fertiliser was Applied by sex of Household Head and source of financing
A.D.D./R.D.P. Source of financing Fertiliser
TotalNone used Cash Credit Combination Gift Other
Salima A.D.D.
Total 100.0 76.7 7.2 12.3 .4 2.4 1.1
Male 71.7 53.4 5.5 10.1 .4 1.5 .9Female 28.3 23.3 1.7 2.2 .0 .9 .2
Salima R.D.P.
Total 100.0 74.9 8.9 12.3 .6 2.0 1.3
Male 82.4 60.7 8.2 10.5 .6 1.5 .9Female 17.6 14.1 .7 1.8 .0 .5 .4
Bwanje valley R.D.P.
Total 100.0 84.6 3.9 8.3 .1 2.9 .2
Male 62.6 50.4 3.1 6.8 .0 2.2 .2Female 37.4 34.2 .8 1.6 .1 .7 .0
Nkhotakota R.D.D.
Total 100.0 69.8 9.1 16.5 .5 2.2 1.8
Male 71.3 49.5 5.5 13.3 .5 .8 1.7Female 28.7 20.3 3.6 3.2 .0 1.4 .2
221

TABLE G23.0. Cropping pattern by R.D.P. (Thousand Hectares)
CropSalima A.D.D.
Salima R.D.P.
Bwanje Valley R.D.P.
Nkhotakota R.D.P.
Total Maize 61.33 18.99 33.81 8.53Hybrid 18.48 6.03 9.14 3.31Local pure stand 37.12 11.00 21.41 4.71Local/ G-nuts .71 .26 .37 .08Local/Pulses .19 .09 - .10Local/Millet .92 - .90 .02Local/Sorghum .03 .03 - -Local/Other grains .01 - .01 -Local/Root crops .01 - - .01Other 3.86 1.58 1.98 .30
Total G-nuts 4.28 1.30 1.70 1.28Chalimbana 2.28 .49 1.46 .33Manipinta .39 .08 .09 .22Malimba .12 .07 .03 .02Mawanga .99 .33 - .66Other local variety .37 .23 .09 .05Mixture .07 .04 .03 -Other /unknown .06 .06 - -
Total Rice 2.72 .59 .13 2.00Kilombera .03 - .03 -Other local .27 .18 .01 .08Faya 1.90 .18 .06 1.66Bluebonnet .20 .08 .03 .09Mixture .18 .14 - .04Other .14 .01 - .13
Total pulses .41 .16 .09 .16Soya beans .08 .01 .05 .02Mixed beans .04 - .04 -Other .29 .15 - .14
Total Millet 1.67 .00 1.65 .02Finger 1.67 .00 1.65 .02
Total Sorghum .09 .06 .03 -Local .06 .03 .03 -Brewing Sorghum .03 .03 - -
Sunflower .14 - .14 -Cassava 6.82 1.29 .02 5.51Sweet potatoes 1.24 .47 .60 .17Cotton 6.47 2.17 3.71 .59
Total Tobacco 1.33 .52 .11 .70
Dark-fired .02 .02 - -Sun/Air .07 .01 .04 .02Burley 1.11 .49 .07 .55Oriental .13 - - .15
222
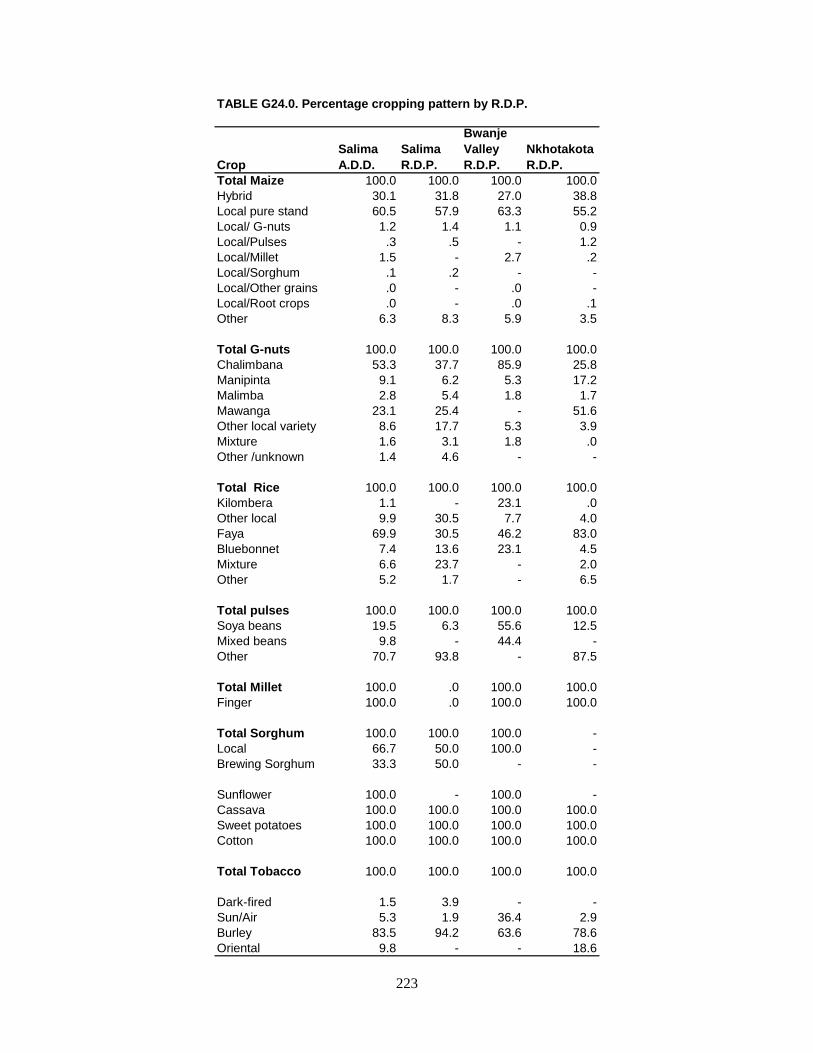
TABLE G24.0. Percentage cropping pattern by R.D.P.
CropSalima A.D.D.
Salima R.D.P.
Bwanje Valley R.D.P.
Nkhotakota R.D.P.
Total Maize 100.0 100.0 100.0 100.0Hybrid 30.1 31.8 27.0 38.8Local pure stand 60.5 57.9 63.3 55.2Local/ G-nuts 1.2 1.4 1.1 0.9Local/Pulses .3 .5 - 1.2Local/Millet 1.5 - 2.7 .2Local/Sorghum .1 .2 - -Local/Other grains .0 - .0 -Local/Root crops .0 - .0 .1Other 6.3 8.3 5.9 3.5
Total G-nuts 100.0 100.0 100.0 100.0Chalimbana 53.3 37.7 85.9 25.8Manipinta 9.1 6.2 5.3 17.2Malimba 2.8 5.4 1.8 1.7Mawanga 23.1 25.4 - 51.6Other local variety 8.6 17.7 5.3 3.9Mixture 1.6 3.1 1.8 .0Other /unknown 1.4 4.6 - -
Total Rice 100.0 100.0 100.0 100.0Kilombera 1.1 - 23.1 .0Other local 9.9 30.5 7.7 4.0Faya 69.9 30.5 46.2 83.0Bluebonnet 7.4 13.6 23.1 4.5Mixture 6.6 23.7 - 2.0Other 5.2 1.7 - 6.5
Total pulses 100.0 100.0 100.0 100.0Soya beans 19.5 6.3 55.6 12.5Mixed beans 9.8 - 44.4 -Other 70.7 93.8 - 87.5
Total Millet 100.0 .0 100.0 100.0Finger 100.0 .0 100.0 100.0
Total Sorghum 100.0 100.0 100.0 -Local 66.7 50.0 100.0 -Brewing Sorghum 33.3 50.0 - -
Sunflower 100.0 - 100.0 -Cassava 100.0 100.0 100.0 100.0Sweet potatoes 100.0 100.0 100.0 100.0Cotton 100.0 100.0 100.0 100.0
Total Tobacco 100.0 100.0 100.0 100.0
Dark-fired 1.5 3.9 - -Sun/Air 5.3 1.9 36.4 2.9Burley 83.5 94.2 63.6 78.6Oriental 9.8 - - 18.6
223

TABLE G25.0. Cropping pattern for Male Headed Household by R.D.P. (Thousand Hectares)
CropSalima A.D.D.
Salima R.D.P.
Bwanje Valley R.D.P.
Nkhotakota R.D.P.
Total Maize 44.56 15.92 21.60 7.04
Hybrid 14.88 5.03 6.98 2.87Local pure stand 25.49 9.00 12.63 3.86Local/ G-nuts .53 .26 .23 .04Local/Pulses .19 .09 - .10Local/Millet .43 - .43 -Local/Root crops - - - -Other 3.04 1.54 1.33 .17
Total G-nuts 3.23 1.12 .96 1.15
Chalimbana 1.64 .42 .95 .27Manipinta .29 .07 - .22Malimba .09 .07 .00 .02Mawanga .92 .29 - .63Other local variety .18 .17 .00 .01Mixture .05 .04 .01 -Other /unknown .06 .06 - -
Total Rice 2.04 .50 .01 3.44
Kilombera .00 - - .00Other local .25 .17 .01 .07Faya 1.42 .16 .06 1.20Bluebonnet .20 .08 .03 .09Mixture .10 .08 - .02Other .07 .01 - .06
Total pulses .31 .15 .03 .13
Soya beans .04 - .03 .01Other .27 .15 - .12
Total Millet .98 .00 .98 -Finger .98 .00 .98 -
Total Sorghum .03 .05 - -Brewing Sorghum .03 .03 - -Cassava 4.75 1.01 .02 3.72Sweet potatoes 1.15 .45 .57 .15Sunflower .13 - .13 -
Cotton 5.54 1.74 3.21 .59
Total Tobacco 1.29 .51 .11 .66
Dark-fired .02 .02 - -Sun/Air .07 .01 .04 .02Burley 1.07 .49 .07 .52Oriental .13 - - .13
224

TABLE G26.0 Cropping pattern for Female Headed Households by R.D.P. (Thousand Hectares)
CropSalima A.D.D.
Salima R.D.P.
Bwanje Valley R.D.P.
Nkhotakota R.D.P.
Total Maize 16.77 3.07 12.21 1.49
Hybrid 3.60 1.00 2.16 .44Local pure stand 11.63 2.00 8.78 .85Local/ G-nuts .18 - .14 .04Local/Pulses .00 - - .00Local/Millet .49 - .47 .02Local/Sorghum .03 .03 - -Local/other Grains .01 - .01 -Local/Root crops .01 - - .01Other .82 .04 .65 .13
Total G-nuts 1.05 .18 .74 .13
Chalimbana .64 .07 .51 .06Manipinta .10 .01 .09 -Malimba .03 - .03 -Mawanga .07 .04 - .03Other local variety .19 .06 .09 .04Mixture .02 - .02 .00Other /unknown .00 .00 - -
Total Rice .68 .09 .03 .56
Kilombera .03 - .03 -Other local .02 .01 - .01Faya .48 .02 - .46Mixture .08 .06 - .02Other .07 - - .07
Total pulses .10 .01 .06 .03
Soya beans .04 .01 .02 .01Mixed beans .04 - .04 -Other .02 - - .02
Total Millet .69 - .67 .02Finger .69 - .67 .02
Total Sorghum .06 .03 .03 -Local .06 .03 .03 -
Sunflower .01 - .01 -Cassava 2.07 .28 .00 1.79Sweet potatoes 0.09 .04 .03 .02
Cotton .93 .43 .50 -
Total Tobacco .03 - - .03Burley .03 - - .03 225

TABLE G27.0. Production of selected crops by R.D.P. (Thousand Tonnes)
CropSalima A.D.D.
Salima R.D.P.
Bwanje Valley R.D.P.
Nkhotakota R.D.P.
Total Maize 87.19 32.87 16.19 18.93
Hybrid 34.99 11.27 15.05 8.67Local pure stand 49.43 19.77 20.21 9.45Local/ G-nuts 1.02 .82 .17 .03Local/Pulses .97 .21 - .76Local/Millet .78 - .76 .02Local/Sorghum .00 .00 - -Local/other Grains .00 - .00 -Local/Root crops .00 - .00 .00Other .00 .00 .00 .00
Total G-nuts 2.91 .88 .81 1.22
Chalimbana 1.24 .33 .71 .20Manipinta .25 .04 .03 .18Malimba .05 .03 .01 .01Mawanga .98 .22 - .76Other local variety .31 .19 .05 .07Mixture .06 .05 .01 -Other /unknown .02 .02 - -
Total Rice 8.29 1.26 .28 6.75
Kilombera .02 - .02 .00Other local .62 .43 .08 .11Faya 6.22 .39 .14 5.69Bluebonnet .54 .00 .04 .50Mixture .59 .44 - .15Other .30 .00 - .30
Total pulses .49 .17 .10 .22
Soya beans .09 .01 .07 .01Mixed beans .03 - .05 -Other .37 .16 - .21
Total Millet .47 .00 .47 .00Finger .47 .00 .47 .00
Total Sorghum .04 .04 .00 -Local .00 .00 .00 -Brewing Sorghum .04 .04 - -Sunflower .08 - .08 -
226

TABLE G28.0. Production for selected crops for Male Households by R.D.P. (Thousand Tonnes)
CropSalima A.D.D.
Salima R.D.P.
Bwanje Valley R.D.P.
Nkhotakota R.D.P.
Total Maize 68.14 27.17 24.72 16.25
Hybrid 29.54 9.98 11.83 7.73Local pure stand 36.61 16.16 12.69 7.76Local/ G-nuts .91 .82 .08 .01Local/Pulses .96 .21 - .75Local/Millet .12 - .12 -Local/Root crops .00 - .00 -Other .00 .00 .00 .00
Total G-nuts 2.37 .72 .51 1.14
Chalimbana .97 .28 .50 .19Manipinta .21 .03 - .18Malimba .04 .03 .00 .01Mawanga .92 .17 - .75Other local variety .15 .14 .00 .01Mixture .06 .05 .01 -Other /unknown .02 .02 - -
Total Rice 6.04 .99 .26 4.79
Kilombera .00 - - .00Other local .61 .43 .08 .10Faya 4.41 .35 .14 3.92Bluebonnet .54 .00 .04 .50Mixture .29 .21 - .08Other .19 .00 - .19
Total pulses .44 .16 .06 .22Soya beans .07 .00 .06 .01Other .37 .16 - .21
Total Millet .16 .00 .16 -Finger .16 .00 .16 -
Total Sorghum .04 .04 - -Brewing Sorghum .04 .04 - -
Sunflower .08 - .08 -
227

TABLE G29.0. Production for selected Crops for female Headed Households by R.D.P. (Thousand Tonnes)
CropSalima A.D.D
Salima R.D.P.
Bwanje Valley R.D.P.
Nkhotakota R.D.P.
Total Maize 19.05 4.90 11.47 2.68
Hybrid 5.45 1.29 3.22 .94Local pure stand 12.82 3.61 7.52 1.69Local/G_nuts .11 - .09 .02Local/Pulses .01 - - .01Local/Millet .66 - .64 .02Local/Sorghum .00 .00 - -Local/Other Grains .00 - .00 -Local/Root Crops .00 - - -Other .00 .00 .00 .00
Total G/nuts .54 .16 .30 .08
Chalimbana .27 .05 .21 .01Manipinta .04 .01 .03 -Malimba .01 - .01 -Mawanga .06 .05 - .01Other local Variety .16 .05 .05 .06Mixture .00 - .00 -Other/Unknown .00 .00 - -
Total Rice 2.35 .27 .02 1.96
Kilombera .02 - .02 -Other local .01 .00 - .01Faya 1.81 .04 - 1.77Mixture .30 .23 - .07Other .11 - - .11
Total Pulses .05 .01 .04 .00
Soya beans .02 .01 .01 .00Mixed beans .03 - .03 -Other .00 - - .00
Total millet .31 - .31 .00Finger .31 - .31 .00
Total Sorghum .00 .00 .00 -Local .00 .00 .00 -
Sunflower .00 - .00 -
228

TABLE G30.0. Mean Yield for selected crops by R.D.P (Kilograms/Hectares)
CropSalima A.D.D
Salima R.D.P.
Bwanje Valley R.D.P.
Nkhotakota R.D.P.
Total Maize 1421.65 1730.91 1070.39 2219.23
Hybrid 1893.4 1868.99 1646.61 2619.34Local pure stand 1331.63 1797.27 943.95 2006.37Local/Pulses 51.5.26 2333.33 - 7600.00Local/Millet 847.83 - 844.44 1000.00Local/Sorghum .00 .00 - -Local/Other grains .00 - .00 -Local/Root Crops .00 - .00 .00Other .00 .00 .00 .00
Total G/nuts 679.91 676.92 476.47 953.13
Chalimbana 543.86 673.47 486.30 606.06Manipinta 641.03 500.00 333.33 818.18Malimba 416.67 428.57 333.33 500.00Mawanga 989.90 666.67 - 1151.52Other local Variety 837.84 826.09 555.56 1400.00Mixture 857.14 1250.00 333.33 .00other/Unknown 333.33 333.33 - -
Total Rice 3047.79 2135.59 2153.85 3375.00
Kilombera 666.67 - 666.67 -Other local 2296.30 2388.89 8000.00 1375.00Faya 3273.68 2166.67 2333.33 3427.71Bluebonnet 2700.00 .00 1333.33 5555.56Mixture 3277.78 3142.86 - 3750.00Other 2142.86 - - 23.7.69
Total Pulses 1195.12 1062.50 1111.11 1375.00
Soya beans 1125.00 100.00 1400.00 500.00Mixed beans 750.00 - 750.00 -Other 1275.86 1066.67 - 1500.00
Total millet 281.44 .00 284.85 .00
Finger 281.44 .00 284.85 12.00
Total Sorghum 444.44 666.67 .00 -Local .00 .00 .00 -Brewing Sorghum 1333.33 1333.33 - -
Sunflower 571.43 - 571.43 -
229

TABLE G31.0. Mean yield for selected crops for Male Households byR.D.P. (Kilograms/Hectares)
CropSalima A.D.D
Salima R.D.P.
Bwanje Valley R.D.P.
Nkhotakota R.D.P.
Total Maize 1529.17 1706.66 1144.44 2308.24
Hybrid 1985.22 1984.10 1694.84 2693.38Local pure stand 1436.26 1795.56 1004.75 2010.36Local/G-nuts 1716.98 3153.85 347.83 250.00Local/Pulses 5052.63 2333.33 - 7500.00Local/Millet 279.07 - 279.07 -Local/Root Crops .00 - .00 -Other .00 .00 .00 .00
Total G/nuts 733.75 642.86 531.25 991.30
Chalimbana 591.46 666.67 526.32 703.70Manipinta 724.14 428.57 - 818.18Malimba 444.44 428.57 .00 500.00Mawanga 1000.00 586.21 - 1190.48Other local Variety 833.33 823.53 - 1000.00Mixture 1200.00 1250.00 1000.00 -Other/Unknown 333.33 333.33 - -
Total Rice 2960.78 1980.00 2600.00 3326.57
Kilombera .00 - - .00Other local 2440.00 2529.41 8000.00 1428.57Faya 3105.63 2187.50 2333.33 3266.67Bluebonnet 2700.00 .00 1333.33 5555.56Mixture 2900.00 2625.00 - 4000.00Other 2714.29 .00 - 3166.67
Total Pulses 1419.35 1066.67 2000.00 1692.31
Soya beans 1750.00 .00 2000.00 1000.00Other 1370.37 1066.67 - 1750.00
Total millet 163.27 .00 163.27 -
Finger 163.27 .00 163.27 -
Total Sorghum 1333.33 1333.33 - -Brewing Sorghum 1333.33 1333.33 - -
Sunflower 615.38 - 615.38 -
230

TABLE G32.0. Mean yield for selected crops for Female Headed Household by R.D.P. (Kilograms/Hectare)
CropSalima A.D.D
Salima R.D.P.
Bwanje Valley R.D.P.
Nkhotakota R.D.P.
Total Maize 1135.96 1596.09 939.39 1798.66
Hybrid 1513.89 1290.00 1490.74 2136.36Local pure stand 1102.32 1805.00 856.49 1988.24Local /G-nuts 611.11 - 642.86 500.00Local/Pulses .00 - - .00Local/Millet 1346.94 - 1361.70 1000.00Local/Sorghum .00 - - -Local/Other grains .00 - .00 -Local/Root Crops .00 - - .00Other .00 .00 .00 .00
Total G/nuts 514.29 888.89 405.41 615.38
Chalimbana 421.88 714.29 411.76 166.67Manipinta 400.00 1000.00 333.33 -Malimba 333.33 - 333.33 -Mawanga 857.14 1250.00 - 333.33Other local Variety 842.11 833.33 555.56 1500.00Mixture .00 - .00 .00Other/Unknown .00 .00 - -
Total Rice 33.8.82 3000.00 666.67 3500.00
Kilombera 666.67 - 667.67 -Other local 500.00 .00 - 1000.00Faya 3770.83 2000.00 - 3847.83Mixture 3750.00 3833.33 - 3500.00Other 1571.43 - - 1571.43
Total Pulses 500.00 1000.00 666.67 .00
Soya beans 500.00 1000.00 500.00 .00Mixed beans 750.00 - 750.00 -Other .00. - - .00
Total millet 449.28 - 462.69 .00Finger 449.28 - 462.69 .00
Total Sorghum .00 .00 .00 .00Local .00 .00 .00 .00
Sunflower .00 - .00 .00
231/232

STATISTICAL TABLES
FOR
NSSA 1992/93
LILONGWE A.D.D.
233/234

LIST OF STATISTICAL TABLES FOR LILONGWE A.D.D. Table Table title page Number G1.0 Number and percentage of gardens by holding size 239 category G2.0 Percentage of cultivated area by ploughing method 240 Used and holding size category G3.0 Percentage of cultivated area by ridging method used 241 And holding size category G4.0 Percentage of cultivated area by planting method used 243 And holding size category G5.0 Percentage of cultivated area by source of permission 245 To use land and R.D.P. G6.0 Number of plots by holding size category and R.D.P. 245 G7.0 Percentage of plots by maize variety and R.D.P 246 G8.0 Percentage of plots by source of seed and maize variety 247 G9.0 Percentage of plots to which fertilizer was applied by type 249 Of fertilizer G10.0 Percentage of plots to which fertilizer was applied by type 249 Of fertilizer G11.0 Percentage of maize plots to which fertilizer was applied by 250 Type of fertilizer, R.D.P. and sex of household head G12.0 Percentage of maize plots to which fertilizer was applied to 251 By type of fertilizer, R.D.P. and sex of household head G13.0 Percentage of plots to which fertilizer was applied by maize 252 Variety G14.0 Percentage of plots to which fertilizer was applied by maize 254 Variety G15.0 Percentage of maize plots to which fertilizer was applied by 256 Maize variety for male headed households
235

G16.0 Percentage of maize plots to which fertilizer was applied by 258 Maize variety for male headed households G17.0 Percentage of maize plots to which fertilizer was applied by 260 Maize variety for female headed households G18.0 Percentage of maize plots to which fertilizer was applied by 262 Maize variety for female headed households G19.0 Fertilizer application on area planted with maize and rice by 264 R.D.P. G20.0 Fertilizer application on area planted with maize and rice for 265 Female headed households by R.D.P. G21.0 Fertilizer application on area planted with maize and rice for 266 Female headed households by R.D.P. G22.0 Percentage of plots to which fertilizer was applied by sex of 267 Household head and source of financing G23.0 Cropping pattern by R.D.P. (Thousand Hectares) 268 G24.0 Percentage cropping pattern by R.D.P. 268 G25.0 Cropping pattern for male headed households by R.D.P. 270 ( Thousand Hectares ) G26.0 Cropping pattern for female headed households by R.D.P. 271 (Thousand Hectares) G27.0 Production for selected crops by R.D.P. (Thousand Tones) 272 G28.0 Production for selected crops for male headed households by 273 R.D.P. (Thousand Tones) G29.0 Production for selected crops for female headed households 274 By R.D.P. (Thousand Tones) G30.0 Mean yield for selected crops by R.D.P. (Kilograms/Hectare) 275 G31.0 Mean yield for selected crops for male headed households by 276 R.D.P (Kilograms/Hectare) G32.0 Mean yield for selected crops for female headed households by 277 R.D.P. (Kilograms/Hectare)
236/237/238

Table G1.0. Number and Percentage of Gardens by Holding Size Category
A.D.D. Total Holding Size Category(Hectares)
Under 0.50 0.50-0.99 1.00-1.49 1.50-1.99 2.00-2.49 2.50-2.993.00 and over
Lilongwe A.D.D.Number 487285 138113 177856 89362 42511 20945 8594 9884Percent 100.0 28.3 36.5 18.3 8.7 4.3 1.8 2.0
Lilongwe West R.D.P.Number 172792 35665 62579 38267 18064 8438 4685 5094Percent 100.0 20.6 36.2 22.1 10.5 4.9 2.7 2.9
Lilongwe East R.D.P.Number 88394 28418 36069 13224 7362 1848 621 852Percent 100.0 32.1 40.8 15.0 8.3 2.1 0.7 1.0
Thiwi/Lifidzi R.D.P.Number 84567 22310 31120 14267 7181 4670 2192 2827Percent 100.0 26.4 36.8 16.9 8.5 5.5 2.6 3.3
Dedza Hills R.D.PNumber 66751 16855 26005 13173 4532 4348 820 1018Percent 100.0 25.3 39.0 19.7 6.8 6.5 1.2 1.5
Ntcheu R.D.P.Number 74781 34865 22083 10431 5372 1661 276 93Percent 100.0 46.6 29.5 13.9 7.2 2.2 0.4 0.1
239

TABLE G2.0 Percentage of Cultivated Area by Ploughing Method used and Holding Size Categoryand Holding Size Category
Ploughing method Total Holding size category (Hectares)
Under 0.50 0.50-0.99 1.00-1.49 1.50-1.99 2.00-2.49 2.50-2.993.00and over
Lilongwe A.D.D.Total 100.0 14.5 34.6 23.6 13.0 6.9 2.6 4.7Not ploughed this season 92.3 13.9 32.1 21.4 11.8 6.3 2.3 4.5Tilled by hoeing 7.3 0.6 2.4 2.1 1.0 0.6 0.4 0.1Ploughed by oxen 0.5 0.1 0.2 0.1 0.1 0.0 - -Other 0.0 - 0.0 0.0 - - - -Lilongwe west R.D.P.Total 100.0 11.1 31.9 25.9 14.1 7.4 3.9 5.8Not ploughed this season 87.2 10.3 28.5 21.4 12.3 6.4 2.9 5.4Tilled by hoeing 11.8 0.7 3.1 4.3 1.5 1.0 1.0 0.4Ploughed by oxen 0.9 0.2 0.3 0.2 0.3 - - -Other 0.1 - 0.0 0.0 - - - -Lilongwe East R.D.P.Total 100.0 17.1 41.4 19.0 14.1 4.8 1.2 2.5Not ploughed this season 96.7 16.8 39.6 18.2 13.6 4.8 1.2 2.5Tilled by hoeing 3.1 0.3 1.7 0.7 0.5 - - -Ploughed by oxen 0.1 - 0.1 0.1 - - - -
Thiwi/Lifidzi R.D.P.Total 100.0 13.8 33.2 21.8 12.1 8.1 3.3 7.7Not ploughed this season 98.9 13.8 32.4 21.6 12.1 8.0 3.3 7.7Tilled by hoeing 1.1 0.1 0.7 0.2 0.0 0.1 - -Dedza Hills R.D.P.Total 100.0 12.6 35.2 26.5 9.7 9.3 2.0 4.6Not ploughed this season 96.4 12.3 34.2 26.3 8.8 8.2 2.0 4.6Tilled by hoeing 3.6 0.4 1.0 0.3 0.9 1.1 - -Ntcheu R.D.P.Total 100.0 23.9 35.0 22.3 12.5 4.6 0.6 0.9Not ploughed this season 89.5 22.1 30.3 20.9 10.8 3.9 0.6 0.9Tilled by hoeing 10.0 1.8 4.5 1.4 1.8 0.6 - -Ploughed by oxen 0.5 - 0.3 - - 0.2 - -
240

TABLE G3.0. Percentage of Cultivated Area by Ridging Method Used and Holding Size Category
Ridging Method Total Holding Size Category (Hectares)
Under 0.50 0.50-0.99 1.00-1.49 1.50-1.99 2.00-2.49 2.50-2.993.00 and Over
Lilongwe A.D.DTotal 100.0 14.5 34.6 23.6 13.0 6.9 2.6 4.7Not ridged this season 7.1 0.7 2.1 1.6 0.9 0.9 0.3 0.5Ridged by hoeing 92.2 13.7 32.3 21.8 11.9 5.9 2.4 4.2Ridged by Oxen 0.5 0.1 .2 0.1 0.1 0.0 - -Other 0.2 0.1 0.0 0.1 - - - -Lilongwe West R.D.P.Total 100.0 11.1 31.9 25.9 14.1 7.4 3.9 5.8Not ridged this season 12.9 0.9 3.5 3.2 1.8 2.1 0.5 0.9Ridged by hoeing 85.9 10.0 28.1 22.3 12.0 5.3 3.4 4.9Ridged by Oxen 1.0 0.2 0.3 0.2 0.3 - - -Other 0.2 - 0.0 0.2 - - - -Lilongwe East R.D.P.Total 100.0 17.1 41.4 19.0 14.1 4.8 1.2 2.5Not ridged this season 8.3 1.5 3.6 1.2 1.2 0.0 0.3 0.5Ridged by hoeing 91.0 15.2 37.5 17.7 12.9 4.7 1.0 2.0Ridged by Oxen 0.2 - 0.2 - - - - -Other 0.5 0.3 0.1 0.1 - - - -
Thiwi/Lifidzi R.D.P.Total 100.0 13.8 33.2 21.8 12.1 8.1 3.3 7.7Not ridged this season 1.4 0.1 0.3 0.1 0.1 0.5 - 0.3Ridged by hoeing 98.6 13.7 32.9 21.7 12.0 7.6 3.3 7.4
Dedza Hills R.D.P.Total 100.0 12.6 35.2 26.5 9.7 9.3 2.0 4.6Not ridged this season 1.4 0.1 0.5 0.8 0.0 - - 0.0Ridged by hoeing 98.6 12.5 34.7 25.8 9.6 9.3 2.0 4.6Ntcheu R.D.P.Total 100.0 23.9 35.0 22.3 12.5 4.6 0.6 0.9Not ridged this season 0.4 0.1 0.0 0.1 0.0 0.1 - -Ridged by hoeing 98.9 23.8 34.7 22.3 12.5 4.2 0.6 0.9Ridged by Oxen 0.6 - 0.3 - - 0.3 - -
241/2

TABLE G4.0. Percentage of Cultivated Area by Planting Method used and Holding Size Category
Planting method Total Holding Size Category (Hectares)
Under 0.50 0.50-0.99 1.00-1.49 1.50-1.99 2.00-2.49 2.50-2.993.00 and over
Lilongwe A.D.D.Total 100.0 14.5 34.6 23.6 13.0 6.9 2.6 4.7Flat planted 0.4 0.1 0.1 0.1 0.0 0.0 0.0 0.1Used last seasons ridges 6.7 0.7 2.0 1.7 0.9 0.8 0.2 0.5Used this seasons ridges 91.5 13.4 31.8 21.7 12.0 6.1 2.4 4.2Planted into holes 0.6 0.2 0.4 0.0 - - - -Played into mounds 0.6 0.1 0.3 0.1 0.1 0.0 - 0.0Other 0.1 - - 0.0 - - - 0.0Lilongwe West R.D.P.Total 100.0 11.1 31.9 25.9 14.1 7.4 3.9 5.8Flat planted 0.5 0.1 0.1 0.1 - - 0.1 0.2Used last seasons ridges 13.6 1.0 3.8 3.8 1.8 1.9 0.4 0.8Used this seasons ridges 85.2 9.8 27.5 22.0 12.3 5.4 3.4 4.8Planted into holes 0.5 0.1 0.4 - - - - -Planted into mounds 0.1 0.0 0.0 - - 0.0 - -Other 0.1 - - 0.0 - - - 0.1Lilongwe East R.D.P.Total 100.0 17.1 41.4 19.0 14.1 4.8 1.2 2.5Flat planted 0.3 - 0.3 - - - - -Used last seasons ridges 5.6 1.3 1.7 0.7 0.9 0.2 0.3 0.5Used this seasons ridges 88.3 14.0 36.2 17.7 12.8 4.6 1.0 2.0Planted into holes 2.4 1.0 1.3 0.2 - - - -Planted into mounds 3.4 0.8 1.9 0.4 0.4 - - -Thiwi/Lifidzi R.D.P.Total 100.0 13.8 33.2 21.8 12.1 8.1 3.3 7.7Flat planted 0.1 - - 0.0 0.0 0.0 - -Used last seasons ridges 0.7 0.1 0.3 0.0 0.1 - - 0.2Used this seasons ridges 99.2 13.7 32.9 21.8 11.9 8.1 3.3 7.5
Planted into holes 0.0 0.0 - - - - - -Played into mounds 0.0 - - - - - - 0.0Dedza Hills R.D.P.Total 100.0 12.6 35.2 26.5 9.7 9.3 2.0 4.6Flat planted 0.3 - 0.2 0.1 0.0 - - -Used last seasons ridges 0.6 0.1 0.3 0.2 - - - -Used this seasons ridges 99.0 12.5 34.8 26.1 9.6 9.3 2.0 4.6Other 0.2 - - 0.2 - - - -Ntcheu R.D.P.Total 100.0 23.9 35.0 22.3 12.5 4.6 0.6 0.9Flat planted 0.6 0.3 0.1 0.1 0.0 0.0 - -Used last seasons ridges 1.2 0.3 0.7 0.2 - - - -Used this seasons ridges 98.2 23.3 34.2 22.0 12.5 4.6 0.6 0.9Planted into holes 0.1 0.1 - - - - - - 243/244

TABLE G5.0. Percentage of Cultivated Area by Source of Permissionto use land and R.D.P.
A.D.D./R.D.P. TotalRelative by birth-male
Relative by birth-female
Relative by marriage-male
Relative by marriage-female Borrowed Other
Lilongwe A.D.D. 100.0 14.3 16.7 11.7 19.1 26.5 11.7Lilongwe west R.D.P. 100.0 19.6 15.6 9.5 20.0 31.4 3.9Lilongwe East R.D.P. 100.0 13.4 20.4 8.2 16.4 23.6 18.0Thiwi/Lifidzi R.D.P. 100.0 15.1 9.0 9.9 5.7 32.5 27.8Dedza Hills R.D.P. 100.0 4.5 10.6 20.3 49.4 14.9 0.4Ntcheu R.D.P. 100.0 6.3 31.3 22.3 18.1 17.4 4.6
TABLE G6.0. Number of Plots by Holding Size Category and R.D.P.
A.D.D/R.D.P. Total Holding size category (Hectares)
Under 0.50 0.50-0.99 1.00-1.49 1.50-1.99 2.00-2.49 2.50-2.993.00 and over
Lilongwe A.D.D. 652096 158461 239405 127091 63654 31376 12963 19146Lilongwe west R.D.P. 236345 40026 84954 53618 25769 13686 7895 10397Lilongwe East R.D.P. 108316 30371 44678 18036 10952 2494 697 1088Thiwi/Lifidzi R.D.P. 123593 29571 46222 20189 12047 7265 2884 5415Dedza Hills R.D.P. 93445 19548 37726 20806 6261 5947 1004 2153Ntcheu R.D.P. 90397 38945 25825 14442 8625 1984 483 93
245

TABLE G7.0. Percentage of Plots by Maize Variety and R.D.P.
A.D.D./R.D.P. Total Type of Maize
HybridLocal pure stand Local/G-nuts
Local other crop Other
Lilongwe A.D.D. 100.0 30.5 45.6 3.1 16.1 4.7Lilongwe west R.D.P. 100.0 39.8 57.5 0.4 0.1 2.2Lilongwe East R.D.P. 100.0 40.3 49.7 0.2 3.8 6.0Thiwi/Lifidzi R.D.P. 100.0 24.2 28.5 6.5 37.1 3.6Dedza Hills R.D.P. 100.0 24.0 35.9 3.8 30.7 5.6Ntcheu R.D.P. 100.0 18.3 51.8 5.8 15.8 8.3
246

TABLE G8.0. Percentage of plots by Source of Seed and Maize Variety
Maize variety Total Source of seedRetained from last season
Project/Scheme credit
As seed from ADMARC
As food from ADMARC
As food from a market
Bought locally Other
Lilongwe A.D.D.All maize 100.0 45.0 14.7 9.8 1.6 2.0 14.9 12.0hybrid 30.5 3.1 13.5 7.1 0.2 0.2 1.9 4.6Local Pure Stand 45.6 26.1 0.8 1.6 1.2 1.4 9.6 4.9Local/G-nuts 3.1 2.3 0.0 0.1 0.0 0.0 0.5 0.2Local/Other crop 16.1 12.2 0.2 0.2 0.1 0.3 2.2 1.0Other 4.7 1.4 0.3 0.8 0.1 0.1 0.6 1.3Lilongwe West R.D.P.All maize 100.0 34.4 19.0 12.1 1.5 1.1 14.9 17.1hybrid 39.8 2.9 17.1 9.1 0.1 0.3 4.2 6.2Local Pure Stand 57.5 30.6 1.8 2.4 1.4 0.7 10.1 10.5Local/G-nuts 0.4 0.2 0.0 0.0 0.0 0.0 0.0 0.1Local/Other crop 0.1 0.0 0.0 0.0 0.0 0.0 0.0 0.0Other 2.2 0.6 0.2 0.6 0.0 0.1 0.4 0.3Lilongwe East R.D.P.All maize 100.0 30.5 18.6 12.8 3.2 4.1 14.3 16.5hybrid 40.3 2.5 18.0 9.3 0.6 0.4 1.3 8.3Local Pure Stand 49.7 23.7 0.3 3.1 2.5 3.4 11.8 5.0Local/G-nuts 0.2 0.2 0.0 0.1 0.0 0.0 0.0 0.0Local/Other crop 3.8 2.8 0.2 0.0 0.0 0.0 0.8 0.0Other 6.0 1.4 0.1 0.4 0.1 0.3 0.4 3.3Thiwi/LifidziAll maize 100.0 55.1 15.1 9.7 0.9 0.7 12.7 5.8hybrid 24.2 2.9 13.3 6.2 0.0 0.0 1.1 0.7Local Pure Stand 28.5 18.8 0.7 0.4 0.5 0.2 5.5 2.5Local/G-nuts 6.5 4.5 0.0 0.2 0.1 0.0 1.3 0.4Local/Other crop 37.1 28.2 0.5 0.9 0.3 0.5 4.6 2.2Other 3.6 0.7 0.5 2.0 0.0 0.0 0.3 0.0Dedza HillsAll maize 100.0 62.1 11.9 5.3 0.2 1.1 11.7 7.7hybrid 24.0 4.7 11.3 4.4 0.0 0.0 0.9 2.8Local Pure Stand 35.9 27.2 0.1 0.7 0.1 0.6 5.9 1.3Local/G-nuts 3.8 3.3 0.0 0.0 0.0 0.0 0.3 0.2Local/Other crop 30.7 24.6 0.4 0.1 0.1 0.4 3.3 1.9Other 5.6 2.4 0.1 0.1 0.0 0.1 1.4 1.4Ntcheu R.D.P.All maize 100.0 49.3 5.6 7.0 2.6 3.7 21.6 10.3hybrid 18.3 3.0 4.9 5.0 0.2 0.0 0.7 4.5Local Pure Stand 51.8 28.8 0.3 1.3 1.6 2.7 15.5 1.6Local/G-nuts 5.8 4.2 0.0 0.0 0.1 0.2 0.9 0.4Local/Other crop 15.8 10.6 0.0 0.0 0.0 0.7 3.3 1.1Other 8.3 2.5 0.5 0.7 0.7 0.1 1.0 2.7
247/248

TABLE G9.0. Percentage of Plots to which Fertilizer was Appliedby Type of Fertilizer
A.D.D/R.D.P. First Application
TotalNone used 20:20:0
Sulphate of Ammonia DAP 23:21:0+4s CAN UREA Mixture Other
Lilongwe A.D.D. 100.0 47.3 5.2 0.9 9.3 5.9 5.9 11.4 14.0 0.2Lilongwe west R.D.P. 100.0 42.0 3.0 0.3 10.1 7.2 4.0 13.9 19.6 0.0Lilongwe East R.D.P. 100.0 54.9 2.5 0.3 10.2 3.8 7.5 9.0 11.7 0.1Thiwi/Lifidzi R.D.P 100.0 38.1 9.3 1.1 10.5 7.6 8.8 12.2 12.1 0.2Dedza Hills R.D.P. 100.0 53.7 7.0 0.2 9.1 5.2 4.2 9.0 11.5 0.1Ntcheu R.D.P. 100.0 58.1 6.6 3.2 4.8 3.5 6.2 9.0 7.4 0.6
TABLE G10.0. Percentage of plots to which Fertilizer was Appliedby Type of Fertilizer
A.D.D./R.D.P. Second Application
TotalNone used 20:20:0
Sulphate of Ammonia DAP 23:21:0+4s CAN UREA Mixture Other
Lilongwe A.D.D. 100.0 82.0 0.1 0.1 0.3 0.1 5.7 9.7 1.8 0.0Lilongwe west R.D.P. 100.0 81.3 0.0 0.1 0.4 0.0 5.4 10.8 2.1 0.1Lilongwe East R.D.P. 100.0 85.0 0.0 0.0 0.6 0.1 5.2 7.2 1.8 0.0Thiwi/Lifidzi R.D.P 100.0 73.1 0.3 0.0 0.2 0.2 8.2 15.4 2.6 0.0Dedza Hills R.D.P. 100.0 86.9 0.3 0.2 0.2 0.3 5.2 5.9 1.0 0.0Ntcheu R.D.P. 100.0 87.3 0.0 0.6 0.1 0.1 4.3 6.3 1.2 0.1
249

TABLE G11.0. Percentage of Maize Plots to which Fertilizer was Applied by Type of Fertilizer,R.D.P. and Sex of Household Head
A.D.D/R.D.P. First application
TotalNone used 20:20:0
Sulphate of ammonia DAP 23:21:0+4s CAN UREA Mixture Other
Lilongwe A.D.D.Total 100.0 47.3 5.2 0.9 9.3 5.9 5.9 11.4 14.0 0.2
Male 77.8 34.2 4.1 0.6 8.1 5.1 4.8 8.9 11.8 0.1Female 22.2 13.2 1.1 0.3 1.2 0.8 1.1 2.4 2.2 0.0
Lilongwe West R.D.P.Total 100.0 42.0 3.0 0.3 10.1 7.2 4.0 13.9 19.6 0.0
Male 84.2 33.3 2.4 0.3 9.2 6.8 3.4 11.3 17.4 0.0Female 15.8 8.8 0.5 0.0 0.9 0.4 0.6 2.5 2.1 0.0
Lilongwe East R.D.P.Total 100.0 54.9 2.5 0.3 10.2 3.8 7.5 9.0 11.7 0.1
Male 79.8 41.8 2.2 0.2 8.7 3.6 6.1 7.0 10.2 0.1Female 20.2 13.1 0.3 0.1 1.5 0.3 1.4 2.0 1.6 0.0
Thiwi/Lifidzi R.D.P.Total 100.0 38.1 9.3 1.1 10.5 7.6 8.8 12.2 12.1 0.2
Male 76.7 24.9 8.1 0.9 9.2 6.7 7.7 9.6 9.5 0.2Female 23.3 13.2 1.2 0.3 1.3 1.0 1.1 2.6 2.6 0.0
Dedza HillsTotal 100.0 53.7 7.0 0.2 9.1 5.2 4.2 9.0 11.5 0.1
Male 71.7 37.3 4.8 0.1 7.6 3.0 3.0 7.1 8.5 0.0Female 28.3 16.4 2.2 0.2 1.5 1.2 1.2 1.8 2.9 0.1
Ntcheu R.D.P.Total 100.0 58.1 6.6 3.2 4.8 3.5 6.5 9.0 7.4 0.6
Male 66.7 36.9 4.6 2.1 3.9 2.4 4.7 6.0 5.5 0.6Female 33.3 21.2 2.0 1.1 1.0 1.1 1.8 3.0 2.0 0.0
250

TABLE G12.0. Percentage of maize Plots to which Fertilizer was Applied by Type of Fertilizer,R.D.P. and Sex of Household Head
A.D.D/R.D.P. Second application
TotalNone used 20:20:0
Sulphate of ammonia DAP 23:21:0+4s CAN UREA Mixture Other
Lilongwe A.D.D.Total 100.0 82.0 0.1 0.1 0.3 0.1 5.7 9.7 1.8 0.0
Male 77.8 62.2 0.1 0.1 0.2 0.1 5.1 8.4 1.5 0.0Female 22.2 19.7 0.0 0.0 0.1 0.0 0.6 1.4 0.3 0.0
Lilongwe West R.D.P.Total 100.0 81.3 0.0 0.1 0.4 0.0 5.4 10.8 2.1 0.1
Male 84.2 67.2 0.0 0.0 0.3 0.0 5.0 9.9 1.7 0.1Female 15.8 14.1 0.0 0.1 0.1 0.0 0.4 0.9 0.3 0.0
Lilongwe East R.D.P.Total 100.0 85.0 0.0 0.0 0.6 0.1 5.2 7.2 1.8 0.0
Male 79.8 66.9 0.0 0.0 0.2 0.1 4.8 6.2 1.5 0.0Female 20.2 18.1 0.0 0.0 0.4 0.0 0.4 1.0 0.3 0.0
Thiwi/Lifidzi R.D.P.Total 100.0 73.1 0.3 0.0 0.2 0.2 8.2 15.4 2.6 0.0
Male 76.7 53.4 0.3 0.0 0.2 0.2 7.2 13.0 2.4 0.0Female 23.3 19.7 0.0 0.0 0.0 0.0 1.0 2.3 0.2 0.0
Dedza HillsTotal 100.0 86.9 0.3 0.2 0.2 0.3 5.2 5.9 1.0 0.0
Male 71.7 60.9 0.2 0.2 0.2 0.2 4.7 4.8 0.6 0.0Female 28.3 26.0 0.1 0.0 0.0 0.1 0.5 1.1 0.4 0.0
Ntcheu R.D.P.Total 100.0 87.3 0.0 0.6 0.1 0.1 4.3 6.3 1.2 0.1
Male 66.7 57.3 0.0 0.6 0.1 0.1 3.2 4.2 1.0 0.1Female 33.3 30.3 0.0 0.0 0.0 0.0 1.1 2.1 0.2 0.0
251

TABLE G13.0. Percentage of plots to which Fertilizer was applied by Maize variety
Maize variety First application
TotalNone used 20:20:0
Sulphate of ammonia DAP 23:21:0+4s CAN UREA Mixture Other
Lilongwe A.D.D.All maize 100.0 43.4 5.9 1.0 9.9 5.0 6.9 13.9 14.0 0.0hybrid 30.5 7.1 2.8 0.3 6.1 2.6 1.5 4.0 6.1 0.0Local Pure Stand 45.6 25.5 1.4 0.2 2.4 1.6 2.9 6.4 5.1 0.0Local/G-nuts 3.1 1.7 0.1 0.1 0.1 0.1 0.3 0.5 0.2 0.0Local/Other crop 16.1 7.2 1.1 0.2 0.9 0.6 1.8 2.3 2.0 0.0Other 4.7 1.9 0.6 0.1 0.3 0.1 0.3 0.7 0.6 0.0Lilongwe West R.D.P.All maize 100.0 40.2 2.8 0.1 9.3 4.3 4.2 19.5 19.6 0.0hybrid 39.8 11.7 1.7 0.1 5.9 2.1 1.4 7.5 9.6 0.0Local Pure Stand 57.5 27.2 1.1 0.0 3.4 2.3 2.7 11.6 9.2 0.0Local/G-nuts 0.4 0.2 0.0 0.0 0.0 0.0 0.0 0.1 0.1 0.0Local/Other crop 0.1 0.1 0.0 0.0 0.0 0.0 0.0 0.0 0.0 0.0Other 2.2 1.0 0.0 0.0 0.0 0.0 0.1 0.4 0.7 0.0Lilongwe East R.D.P.All maize 100.0 48.0 2.7 0.3 12.5 3.7 9.2 10.9 12.6 0.0hybrid 40.3 11.3 2.3 0.3 10.1 2.0 3.5 3.6 7.3 0.0Local Pure Stand 49.7 31.3 0.1 0.0 2.1 1.6 4.2 5.8 4.6 0.0Local/G-nuts 0.2 0.2 0.0 0.0 0.0 0.0 0.0 0.0 0.0 0.0Local/Other crop 3.8 1.8 0.1 0.0 0.2 0.0 1.2 0.5 0.0 0.0Other 6.0 3.4 0.2 0.0 0.2 0.2 0.3 1.1 0.7 0.0Thiwi/LifidziAll maize 100.0 31.8 10.1 1.3 11.7 7.3 10.0 14.3 13.5 0.1hybrid 24.2 1.1 3.4 0.5 5.7 5.2 1.3 2.2 4.7 0.1Local Pure Stand 28.5 13.5 3.2 0.1 3.0 0.7 2.3 2.7 3.1 0.0Local/G-nuts 6.5 3.5 0.1 0.0 0.1 0.2 0.8 1.4 0.3 0.0Local/Other crop 37.1 13.1 1.5 0.4 2.4 1.2 5.3 8.0 5.3 0.0Other 3.6 0.6 1.8 0.2 0.5 0.0 0.2 0.0 0.1 0.0Dedza HillsAll maize 100.0 46.8 8.1 0.3 10.6 5.7 4.9 10.5 13.2 0.0hybrid 24.0 3.3 4.1 0.2 6.0 1.4 1.0 2.8 5.0 0.0Local Pure Stand 35.9 23.1 0.9 0.0 1.3 1.2 2.0 3.9 3.4 0.0Local/G-nuts 3.8 1.9 0.2 0.0 0.4 0.4 0.2 0.4 0.2 0.0Local/Other crop 30.7 15.7 2.9 0.1 1.9 2.4 1.5 2.7 3.6 0.0Other 5.6 2.6 0.0 0.0 1.0 0.3 0.1 0.8 0.9 0.0Ntcheu R.D.P.All maize 100.0 55.9 7.2 3.5 5.0 3.8 7.2 10.1 7.2 0.0hybrid 18.3 6.3 2.9 0.6 2.9 1.8 0.2 2.0 1.6 0.0Local Pure Stand 51.8 34.2 1.4 1.2 1.4 1.9 3.8 5.1 2.6 0.0Local/G-nuts 5.8 3.3 0.2 0.4 0.2 0.0 0.6 0.6 0.5 0.0Local/Other crop 15.8 9.3 1.6 0.9 0.3 0.0 1.4 0.6 1.6 0.0Other 8.3 2.9 1.0 0.4 0.2 0.0 1.2 1.7 0.9 0.0
252/253
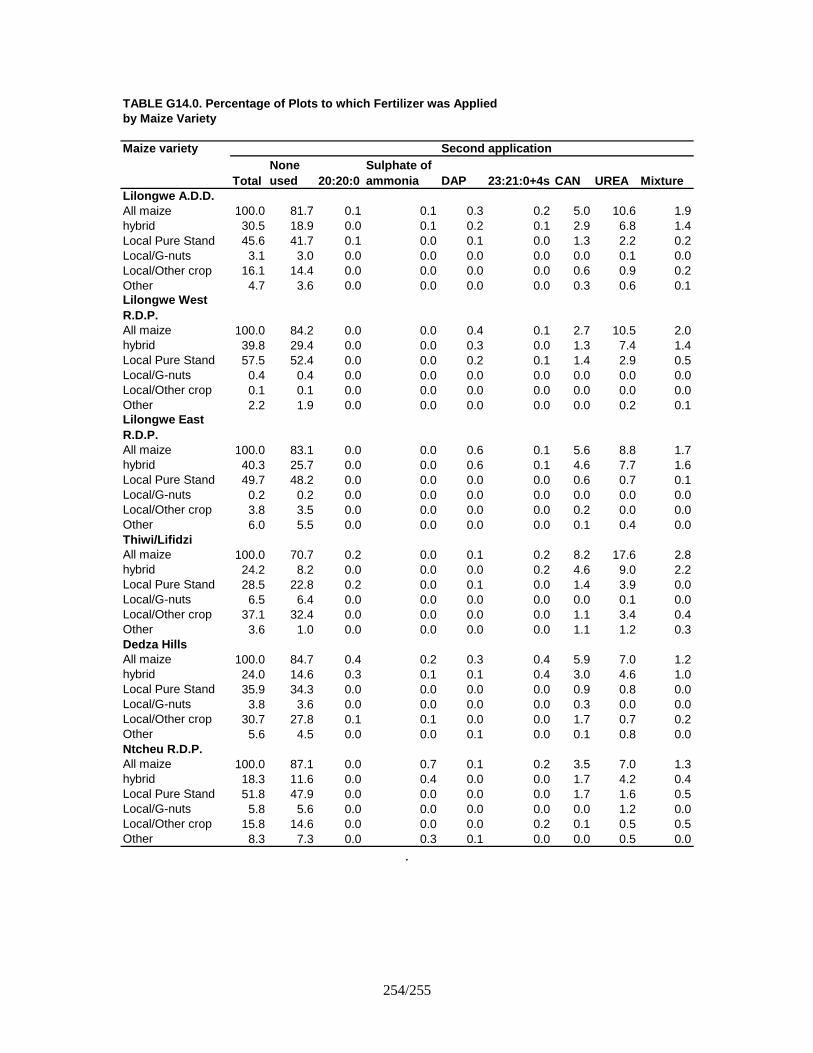
TABLE G14.0. Percentage of Plots to which Fertilizer was Applied by Maize Variety
Maize variety Second application
TotalNone used 20:20:0
Sulphate of ammonia DAP 23:21:0+4s CAN UREA Mixture
Lilongwe A.D.D.All maize 100.0 81.7 0.1 0.1 0.3 0.2 5.0 10.6 1.9hybrid 30.5 18.9 0.0 0.1 0.2 0.1 2.9 6.8 1.4Local Pure Stand 45.6 41.7 0.1 0.0 0.1 0.0 1.3 2.2 0.2Local/G-nuts 3.1 3.0 0.0 0.0 0.0 0.0 0.0 0.1 0.0Local/Other crop 16.1 14.4 0.0 0.0 0.0 0.0 0.6 0.9 0.2Other 4.7 3.6 0.0 0.0 0.0 0.0 0.3 0.6 0.1Lilongwe West R.D.P.All maize 100.0 84.2 0.0 0.0 0.4 0.1 2.7 10.5 2.0hybrid 39.8 29.4 0.0 0.0 0.3 0.0 1.3 7.4 1.4Local Pure Stand 57.5 52.4 0.0 0.0 0.2 0.1 1.4 2.9 0.5Local/G-nuts 0.4 0.4 0.0 0.0 0.0 0.0 0.0 0.0 0.0Local/Other crop 0.1 0.1 0.0 0.0 0.0 0.0 0.0 0.0 0.0Other 2.2 1.9 0.0 0.0 0.0 0.0 0.0 0.2 0.1Lilongwe East R.D.P.All maize 100.0 83.1 0.0 0.0 0.6 0.1 5.6 8.8 1.7hybrid 40.3 25.7 0.0 0.0 0.6 0.1 4.6 7.7 1.6Local Pure Stand 49.7 48.2 0.0 0.0 0.0 0.0 0.6 0.7 0.1Local/G-nuts 0.2 0.2 0.0 0.0 0.0 0.0 0.0 0.0 0.0Local/Other crop 3.8 3.5 0.0 0.0 0.0 0.0 0.2 0.0 0.0Other 6.0 5.5 0.0 0.0 0.0 0.0 0.1 0.4 0.0Thiwi/LifidziAll maize 100.0 70.7 0.2 0.0 0.1 0.2 8.2 17.6 2.8hybrid 24.2 8.2 0.0 0.0 0.0 0.2 4.6 9.0 2.2Local Pure Stand 28.5 22.8 0.2 0.0 0.1 0.0 1.4 3.9 0.0Local/G-nuts 6.5 6.4 0.0 0.0 0.0 0.0 0.0 0.1 0.0Local/Other crop 37.1 32.4 0.0 0.0 0.0 0.0 1.1 3.4 0.4Other 3.6 1.0 0.0 0.0 0.0 0.0 1.1 1.2 0.3Dedza HillsAll maize 100.0 84.7 0.4 0.2 0.3 0.4 5.9 7.0 1.2hybrid 24.0 14.6 0.3 0.1 0.1 0.4 3.0 4.6 1.0Local Pure Stand 35.9 34.3 0.0 0.0 0.0 0.0 0.9 0.8 0.0Local/G-nuts 3.8 3.6 0.0 0.0 0.0 0.0 0.3 0.0 0.0Local/Other crop 30.7 27.8 0.1 0.1 0.0 0.0 1.7 0.7 0.2Other 5.6 4.5 0.0 0.0 0.1 0.0 0.1 0.8 0.0Ntcheu R.D.P.All maize 100.0 87.1 0.0 0.7 0.1 0.2 3.5 7.0 1.3hybrid 18.3 11.6 0.0 0.4 0.0 0.0 1.7 4.2 0.4Local Pure Stand 51.8 47.9 0.0 0.0 0.0 0.0 1.7 1.6 0.5Local/G-nuts 5.8 5.6 0.0 0.0 0.0 0.0 0.0 1.2 0.0Local/Other crop 15.8 14.6 0.0 0.0 0.0 0.2 0.1 0.5 0.5Other 8.3 7.3 0.0 0.3 0.1 0.0 0.0 0.5 0.0
.
254/255

TABLE G15.0. Percentage of Maize Plots to which Fertilizer was Applied by Maize Variety for Male Headed Households
Maize variety First application
TotalNone used 20:20:0
Sulphate of ammonia DAP 23:21:0+4s CAN UREA Mixture Other
Lilongwe A.D.D.All maize 100.0 39.6 6.0 0.9 11.2 5.4 7.3 14.4 15.2 0.0hybrid 33.1 7.2 2.8 0.2 7.1 2.9 1.7 4.3 7.0 0.0Local Pure Stand 44.1 23.0 1.3 0.2 2.7 1.7 3.0 6.7 5.4 0.0Local/G-nuts 2.7 1.4 0.1 0.0 0.1 0.1 0.3 0.4 0.3 0.0Local/Other crop 15.4 6.1 1.1 0.3 1.0 0.6 1.9 2.3 2.0 0.0Other 4.8 2.0 0.7 0.2 0.3 0.1 0.4 0.7 0.5 0.0Lilongwe West R.D.P.All maize 100.0 37.6 2.6 0.1 10.2 4.8 4.2 19.5 21.0 0.0hybrid 40.8 11.4 1.5 0.1 6.5 2.3 1.3 7.5 10.4 0.0Local Pure Stand 56.8 25.0 1.1 0.0 3.8 2.5 2.8 11.7 9.8 0.0Local/G-nuts 0.3 0.1 0.0 0.0 0.0 0.0 0.0 0.1 0.1 0.0Other 2.1 1.1 0.0 0.0 0.0 0.0 0.1 0.2 0.7 0.0Lilongwe East R.D.P.All maize 100.0 45.9 2.9 0.2 13.3 4.2 9.3 10.6 13.6 0.0hybrid 43.0 12.2 2.4 0.2 11.3 2.5 3.8 3.2 7.6 0.0Local Pure Stand 47.3 28.4 0.2 0.0 1.8 1.6 4.0 6.1 5.3 0.0Local/Other crop 3.4 1.5 0.1 0.0 0.2 0.0 1.1 0.4 0.0 0.0Other 6.3 3.7 0.3 0.0 0.1 0.2 0.3 0.9 0.7 0.0Thiwi/LifidziAll maize 100.0 25.8 11.3 1.3 13.3 8.3 11.3 14.7 13.8 0.2hybrid 26.9 0.6 4.1 0.3 6.6 6.3 1.6 2.4 4.9 0.2Local Pure Stand 26.1 10.6 3.0 0.2 3.2 0.6 2.4 2.9 3.1 0.0Local/G-nuts 5.9 2.7 0.1 0.0 0.2 0.1 0.9 1.4 0.4 0.0Local/Other crop 37.1 11.4 1.7 0.5 2.8 1.3 6.1 8.0 5.4 0.0Other 4.0 0.5 2.4 0.3 0.5 0.0 0.3 0.0 0.0 0.0Dedza HillsAll maize 100.0 44.6 7.9 0.1 12.4 5.1 4.8 11.6 13.6 0.0hybrid 25.5 2.5 3.8 0.0 7.1 1.0 1.2 3.4 6.7 0.0Local Pure Stand 34.5 22.6 0.8 0.0 1.5 1.1 2.0 3.8 2.6 0.0Local/G-nuts 3.4 1.8 0.2 0.0 0.4 0.5 0.0 0.4 0.2 0.0Local/Other crop 30.8 14.6 3.1 0.1 2.3 2.4 1.5 3.0 3.8 0.0Other 5.8 3.1 0.0 0.0 1.1 0.2 0.1 1.1 0.3 0.0Ntcheu R.D.P.All maize 100.0 52.2 7.6 3.7 6.3 3.9 8.0 10.3 8.0 0.0hybrid 20.1 6.5 3.0 0.6 3.5 1.5. 0.3 2.5 2.2 0.0Local Pure Stand 49.1 31.2 1.3 1.1 2.1 2.3 4.3 4.8 2.1 0.0Local/G-nuts 5.7 3.4 0.2 0.1 0.0 0.0 0.7 0.5 0.8 0.0Local/Other crop 15.7 8.2 1.9 1.1 0.4 0.0 1.5 0.7 1.8 0.0Other 9.4 2.9 1.1 0.7 0.3 0.1 1.4 2.0 1.1 0.0
256/257

TABLE G16.0. Percentage of Maize Plots to which Fertilizer Was Applied by Maize Variety for Male Headed Households
Maize variety Second application
TotalNone used 20:20:0
Sulphate of ammonia DAP 23:21:0+4s CAN UREA Mixture
Lilongwe A.D.D.All maize 100.0 79.8 0.1 0.2 0.3 0.2 5.7 11.7 1.9hybrid 33.1 20.2 0.1 0.1 0.2 0.1 3.4 7.7 1.4Local Pure Stand 44.1 39.9 0.1 0.0 0.1 0.0 1.3 2.4 0.3Local/G-nuts 2.7 2.6 0.0 0.0 0.0 0.0 0.1 0.0 0.0Local/Other crop 15.4 13.4 0.0 0.0 0.0 0.0 0.7 1.0 0.2Other 4.8 3.7 0.0 0.1 0.1 0.0 0.3 0.6 0.1Lilongwe West R.D.P.All maize 100.0 83.3 0.0 0.0 0.5 0.1 2.9 11.5 1.7hybrid 40.8 30.0 0.0 0.0 0.3 0.0 1.3 8.1 1.1Local Pure Stand 56.8 51.1 0.0 0.0 0.2 0.1 1.7 3.2 0.5Local/G-nuts 0.3 0.3 0.0 0.0 0.0 0.0 0.0 0.0 0.0Other 2.1 1.9 0.0 0.0 0.0 0.0 0.0 0.2 0.1Lilongwe East R.D.P.All maize 100.0 82.1 0.0 0.0 0.3 0.2 6.3 9.4 0.7hybrid 43.0 27.2 0.0 0.0 0.3 0.2 5.4 8.4 0.5Local Pure Stand 47.3 46.0 0.0 0.0 0.0 0.0 0.3 0.7 0.2Local/Other crop 3.4 3.1 0.0 0.0 0.0 0.0 0.3 0.0 0.0Other 6.3 5.8 0.0 0.0 0.0 0.0 0.2 0.4 0.0Thiwi/LifidziAll maize 100.0 66.9 0.3 0.0 0.2 0.3 9.5 19.4 3.4hybrid 26.9 8.2 0.0 0.0 0.0 0.3 5.5 10.3 2.6Local Pure Stand 26.1 20.3 0.3 0.0 0.2 0.0 1.2 4.0 0.0Local/G-nuts 5.9 5.8 0.0 0.0 0.0 0.0 0.0 0.2 0.0Local/Other crop 37.1 31.9 0.0 0.0 0.0 0.0 1.3 3.4 0.5Other 4.0 0.8 0.0 0.0 0.0 0.0 1.4 1.5 0.3Dedza HillsAll maize 100.0 82.3 0.4 0.3 0.4 0.3 7.5 7.9 1.0hybrid 25.5 14.7 0.4 0.2 0.2 0.3 3.7 5.2 0.9Local Pure Stand 34.5 32.5 0.0 0.0 0.0 0.0 1.1 1.0 0.0Local/G-nuts 3.4 3.0 0.0 0.0 0.0 0.0 0.4 0.0 0.0Local/Other crop 30.8 27.1 0.0 0.1 0.0 0.0 2.4 1.0 0.1Other 5.8 4.9 0.0 0.0 0.2 0.0 0.0 0.7 0.0Ntcheu R.D.P.All maize 100.0 85.8 0.0 1.0 0.2 0.2 3.7 7.3 1.7hybrid 20.1 12.8 0.0 0.6 0.0 0.0 1.9 4.2 0.6Local Pure Stand 49.1 44.7 0.0 0.1 0.0 0.0 1.7 2.0 0.6Local/G-nuts 5.7 5.7 0.0 0.0 0.0 0.0 0.0 0.0 0.0Local/Other crop 15.7 14.3 0.0 0.0 0.0 0.2 0.1 0.5 0.5Other 9.4 8.2 0.0 0.4 0.2 0.0 0.0 0.6 0.0
258/259

TABLE G17.0. Percentage of Maize Plots to which Fertilizer Was Applied by Maize Variety for Female Headed Households
Maize variety First application
TotalNone used 20:20:0
Sulphate of ammonia DAP 23:21:0+4s CAN UREA Mixture
Lilongwe A.D.D.All maize 100.0 55.4 5.6 1.3 5.5 3.8 5.7 12.4 10.3hybrid 22.3 6.8 2.8 0.6 3.1 1.6 0.9 3.2 3.3Local Pure Stand 50.3 33.3 1.5 0.3 1.5 1.3 2.7 5.6 4.0Local/G-nuts 4.6 2.9 0.2 0.2 0.2 0.0 0.4 0.6 0.1Local/Other crop 18.6 10.8 0.9 0.1 0.4 0.7 1.5 2.3 2.0Other 4.1 1.6 0.2 0.0 0.3 0.1 0.2 0.8 0.9Lilongwe West R.D.P.All maize 100.0 53.3 3.8 0.0 4.7 2.0 4.2 19.5 12.6hybrid 35.1 13.1 2.8 0.0 3.0 1.0 1.9 7.4 5.9Local Pure Stand 61.1 38.1 1.0 0.0 1.7 1.0 2.3 10.9 6.2Local/G-nuts 0.9 0.9 0.0 0.0 0.0 0.0 0.0 0.0 0.0Local/Other crop 0.5 0.5 0.0 0.0 0.0 0.0 0.0 0.0 0.0Other 2.4 0.7 0.0 0.0 0.0 0.0 0.0 1.1 0.5Lilongwe East R.D.P.All maize 100.0 56.7 1.8 0.8 9.2 1.7 8.9 12.4 8.6hybrid 29.5 7.7 1.8 0.8 5.4 0.0 2.4 5.0 6.4Local Pure Stand 59.3 43.1 0.0 0.0 3.3 1.7 5.0 4.7 1.6Local/G-nuts 1.1 1.1 0.0 0.0 0.0 0.0 0.0 0.0 0.0Local/Other crop 5.3 2.8 0.0 0.0 0.0 0.0 1.6 0.8 0.0Other 4.8 2.0 0.0 0.0 0.5 0.0 0.0 1.8 0.5Thiwi/LifidziAll maize 100.0 51.3 6.0 1.1 6.6 3.9 5.6 12.9 12.7hybrid 15.6 2.6 1.3 1.1 2.8 1.7 0.5 1.5 4.2Local Pure Stand 36.4 22.9 3.6 0.0 2.3 1.0 1.8 2.1 2.8Local/G-nuts 8.6 6.2 0.0 0.0 0.0 0.5 0.4 1.5 0.0Local/Other crop 37.3 18.6 1.1 0.0 1.0 0.8 2.8 7.9 5.1Other 2.1 1.1 0.0 0.0 0.5 0.0 0.0 0.0 0.5Dedza HillsAll maize 100.0 52.2 8.8 0.8 6.0 7.3 5.0 7.7 12.2hybrid 20.1 5.5 5.1 0.8 3.5 2.5 0.5 1.4 0.9Local Pure Stand 39.4 24.6 0.9 0.0 0.8 1.7 2.1 4.0 5.3Local/G-nuts 4.8 2.3 0.4 0.0 0.4 0.0 0.8 0.5 0.4Local/Other crop 30.6 18.5 2.3 0.0 0.7 2.6 1.6 1.8 3.1Other 5.0 1.4 0.0 0.0 0.7 0.5 0.0 0.0 2.4Ntcheu R.D.P.All maize 100.0 62.7 6.5 3.3 2.8 3.5 5.8 9.7 5.8hybrid 15.0 5.9 2.7 0.5 1.8 2.2 0.0 1.3 0.6Local Pure Stand 56.6 39.6 1.6 1.4 0.4 1.2 3.0 5.8 3.6Local/G-nuts 6.1 3.1 0.3 0.9 0.5 0.0 0.5 0.8 0.0Local/Other crop 16.0 11.3 1.0 0.6 0.1 0.0 1.4 0.6 1.1Other 6.3 2.9 0.9 0.0 0.0 0.0 0.8 1.2 0.5
260/261

TABLE G18.0. Percentage of Maize Plots to which Fertilizer was Applied by Maize Variety for Female Headed Households
Maize variety Second application
TotalNone used 20:20:0 DAP 23:21:0+4s CAN UREA Mixture
Lilongwe A.D.D.All maize 100.0 88.0 0.1 0.3 0.1 2.7 7.1 1.7hybrid 22.3 15.1 0.0 0.3 0.1 1.3 4.2 1.3Local Pure Stand 50.3 47.5 0.0 0.0 0.0 1.2 1.4 0.2Local/G-nuts 4.6 4.4 0.0 0.0 0.0 0.0 0.2 0.0Local/Other crop 18.6 17.5 0.1 0.0 0.0 0.1 0.7 0.2Other 4.1 3.5 0.0 0.0 0.0 0.1 0.5 0.0Lilongwe West R.D.P.All maize 100.0 88.9 0.0 0.3 0.0 1.6 5.8 3.4hybrid 35.1 26.6 0.0 0.3 0.0 1.3 4.1 2.8Local Pure Stand 61.1 58.6 0.0 0.0 0.0 0.3 1.7 0.5Local/G-nuts 0.9 0.9 0.0 0.0 0.0 0.0 0.0 0.0Local/Other crop 0.5 0.5 0.0 0.0 0.0 0.0 0.0 0.0Other 2.4 2.4 0.0 0.0 0.0 0.0 0.0 0.0Lilongwe East R.D.P.All maize 100.0 87.0 0.0 1.9 0.0 2.7 6.4 2.0hybrid 29.5 19.6 0.0 1.9 0.0 1.0 5.0 2.0Local Pure Stand 59.3 56.7 0.0 0.0 0.0 1.7 0.9 0.0Local/G-nuts 1.1 1.1 0.0 0.0 0.0 0.0 0.0 0.0Local/Other crop 5.3 5.3 0.0 0.0 0.0 0.0 0.0 0.0Other 4.8 4.3 0.0 0.0 0.0 0.0 0.5 0.0Thiwi/LifidziAll maize 100.0 83.2 0.0 0.0 0.0 4.1 11.6 1.2hybrid 15.6 8.1 0.0 0.0 0.0 1.7 4.7 1.2Local Pure Stand 36.4 31.1 0.0 0.0 0.0 2.0 3.3 0.0Local/G-nuts 8.6 8.6 0.0 0.0 0.0 0.0 0.0 0.0Local/Other crop 37.3 33.9 0.0 0.0 0.0 0.3 3.1 0.0Other 2.1 1.6 0.0 0.0 0.0 0.0 0.5 0.0Dedza HillsAll maize 100.0 91.0 0.4 0.0 0.4 1.8 4.6 1.7hybrid 20.1 14.2 0.0 0.0 0.4 1.1 3.1 1.2Local Pure Stand 39.4 38.7 0.0 0.0 0.0 0.4 0.3 0.0Local/G-nuts 4.8 4.8 0.0 0.0 0.0 0.0 0.0 0.0Local/Other crop 30.6 29.7 0.4 0.0 0.0 0.0 0.0 0.5Other 5.0 3.5 0.0 0.0 0.0 0.3 1.1 0.0Ntcheu R.D.P.All maize 100.0 89.6 0.0 0.0 0.0 3.1 6.5 0.7hybrid 15.0 9.4 0.0 0.0 0.0 1.4 4.2 0.0Local Pure Stand 56.6 53.8 0.0 0.0 0.0 1.7 0.8 0.2Local/G-nuts 6.1 5.4 0.0 0.0 0.0 0.0 0.7 0.0Local/Other crop 16.0 15.2 0.0 0.0 0.0 0.0 0.3 0.5Other 6.3 5.8 0.0 0.0 0.0 0.0 0.5 0.0
262/263

TABLE G19.0. Fertilizer Application on Area Plantedwith Maize and Rice by R.D.P.
R.D.P.Total Area (Hectares)
Area Fertilised (Hectares)
Percentage Fertilised
Lilongwe West R.D.P.Total Maize 67387.69 43837.54 65.05Hybrid 25635.76 18588.89 76.41Local pure stand 40089.72 23480.29 58.57Local/G-nuts 209.94 79.20 37.73Local/pulses 92.34 - -Other 1359.93 689.16 50.68Lilongwe East R.D.P.Total Maize 34642.85 20203.73 58.32Hybrid 13250.05 10476.85 79.07Local pure stand 17757.55 7826.69 44.08Local/G-nuts 30.07 - -Local/pulses 1448.10 870.89 60.14Other 2157.09 1029.30 47.72Thiwi/Lifidzi R.D.P.Total Maize 34673.07 24812.68 71.56Hybrid 8711.90 8313.20 95.42Local pure stand 9197.02 5116.48 55.63Local/G-nuts 1918.89 1144.46 59.64Local/other 13590.82 9076.70 66.79Local/millet 304.06 286.15 94.11Other 950.38 875.68 92.14Dedza Hills R.D.P.Total Maize 28772.90 17678.68 61.44Hybrid 6640.21 6227.81 93.79Local pure stand 10340.86 4400.99 42.56Local/G-nuts 488.01 231.40 47.42Local/pulses 9625.77 5765.89 59.90Local/millet 84.71 56.24 66.39Other 1593.34 - -Ntcheu R.D.P.Total Maize 28706.04 13773.26 47.98Hybrid 3950.18 2828.82 71.61Local pure stand 15770.77 6483.02 41.11Local/G-nuts 2191.03 945.16 43.14Local/pulses 3543.89 1510.68 42.63Local/millet 529.72 - -Local/other Grains 216.00 - -Other 2504.45 1770.17 70.68
264

TABLE G20.0. Fertilizer Application on Area Alanted with Maize and Rice for Male Headed Households by R.D.P.
R.D.P.Total Area (Hectares)
Area Fertilised (Hectares)
Percentage Fertilised
Lilongwe West R.D.P.Total Maize 57048.32 38338.97 67.20Hybrid 22969.33 17165.38 77.35Local pure stand 33640.80 20597.71 61.23Local/G-nuts 117.60 79.20 67.35Other 1097.97 496.68 45.24Lilongwe East R.D.P.Total Maize 27716.79 16838.05 60.75Hybrid 11015.37 8795.81 79.85Local pure stand 13837.96 6613.57 47.79Local/pulses 1064.03 613.49 57.66Other 1799.44 815.17 45.30Thiwi/Lifidzi R.D.P.Total Maize 26618.44 20592.51 77.36Hybrid 7396.22 7173.85 96.99Local pure stand 6226.20 4035.51 64.81Local/G-nuts 1297.61 926.81 71.42Local/pulses 10605.45 7416.69 94.84Other 817.42 778.34 95.22
Dedza Hills R.D.P.Total Maize 20703.30 13174.96 63.64Hybrid 5160.32 4975.72 96.42Local pure stand 7011.71 2942.36 41.96Local/G-nuts 238.97 106.38 44.52Local/pulses 7006.70 4497.23 64.18Local/millet 84.71 56.24 66.39Other 1200.88 - -Ntcheu R.D.P.Total Maize 19363.48 9703.12 50.11Hybrid 2729.26 2095.12 76.77Local pure stand 9948.80 4419.70 44.42Local/G-nuts 1590.69 522.68 32.86Local/pulses 2528.73 1149.84 45.47Local/millet 376.90 - -Local/other Grains 216.00 - -Other 1973.10 1435.04 72.73
265

TABLE G21.0. Fertilizer Application on Area Planted with Maize and Rice for Female Headed Households by R.D.P.
R.D.P.Total Area (Hectares)
Area Fertilised (Hectares)
Percentage Fertilised
Lilongwe West R.D.P.Total Maize 10339.37 5498.57 53.18Hybrid 3443.81 2423.52 70.37Local pure stand 6448.92 2882.57 44.70Local/G-nuts 92.34 - -Local/pulses 92.34 - -Other 261.96 192.48 73.48Lilongwe East R.D.P.Total Maize 6926.06 3365.69 48.59Hybrid 2234.69 1681.04 75.22Local pure stand 3919.59 1213.12 30.95Local/G-nuts 30.07 - -Local/pulses 384.65 257.40 67.02Other 357.65 214.13 59.87Thiwi/Lifidzi R.D.P.Total Maize 8054.63 4220.17 52.39Hybrid 1315.69 1139.35 86.60Local pure stand 2970.81 1080.97 36.39Local/G-nuts 621.28 217.65 35.03Local/pulses 2985.35 1660.01 55.60Local/millet 25.52 24.84 87.10Other 132.96 97.34 73.21Dedza Hills R.D.P.Total Maize 8069.60 4503.72 55.81Hybrid 1479.89 1252.09 84.61Local pure stand 3329.15 1458.63 43.81Local/G-nuts 249.03 125.02 50.20Local/pulses 2619.07 1268.66 48.44Other 392.46 - -Ntcheu R.D.P.Total Maize 9342.57 4070.14 43.57Hybrid 1220.92 733.70 60.09Local pure stand 5821.97 2063.33 35.44Local/G-nuts 600.34 422.48 70.37Local/pulses 1015.17 360.84 35.54Local/millet 152.82 - -Other 531.35 335.13 63.07
266

TABLE G22.0. Percentage of Plots to which Fertilizer was Applied by Sex of Household Head and Source of Financing
A.D.D./R.D.P. Source of financing fertilizer
TotalNone used Cash Credit Combination Gift Other
Lilongwe A.D.D.Total 100.0 47.4 18.0 30.8 2.0 1.4 0.5Male 77.8 34.2 14.2 26.4 1.7 0.9 0.4Female 22.2 13.2 3.8 4.4 0.3 0.5 0.1Lilongwe west R.D.P.Total 100.0 42.1 16.9 35.7 2.4 2.2 0.7Male 84.2 33.3 14.3 32.4 1.5 1.5 0.6Female 15.8 8.8 2.6 3.3 0.2 0.7 0.1Lilongwe East R.D.P. Total 100.0 54.9 12.5 30.1 1.4 0.9 0.2Male 79.8 41.8 10.2 26.0 1.2 0.6 0.1Female 20.2 13.1 2.3 4.2 0.2 0.3 0.1Thiwi/Lifidzi R.D.P.Total 100.0 38.1 16.8 41.1 2.8 0.8 0.4Male 76.7 24.9 13.8 34.6 2.4 0.5 0.4Female 23.3 13.2 3.0 6.5 0.4 0.3 0.0Dedza Hills R.D.P.Total 100.0 53.7 20.1 24.3 1.2 0.3 0.4Male 71.7 37.3 14.6 18.5 0.9 0.1 0.3Female 28.3 16.4 5.5 5.8 0.3 0.2 0.1Ntcheu R.D.P.Total 100.0 58.1 27.1 11.3 1.5 1.6 0.3Male 66.7 36.9 19.1 8.1 1.3 1.0 0.2Female 33.3 21.2 8.0 3.2 0.2 0.6 0.1
267
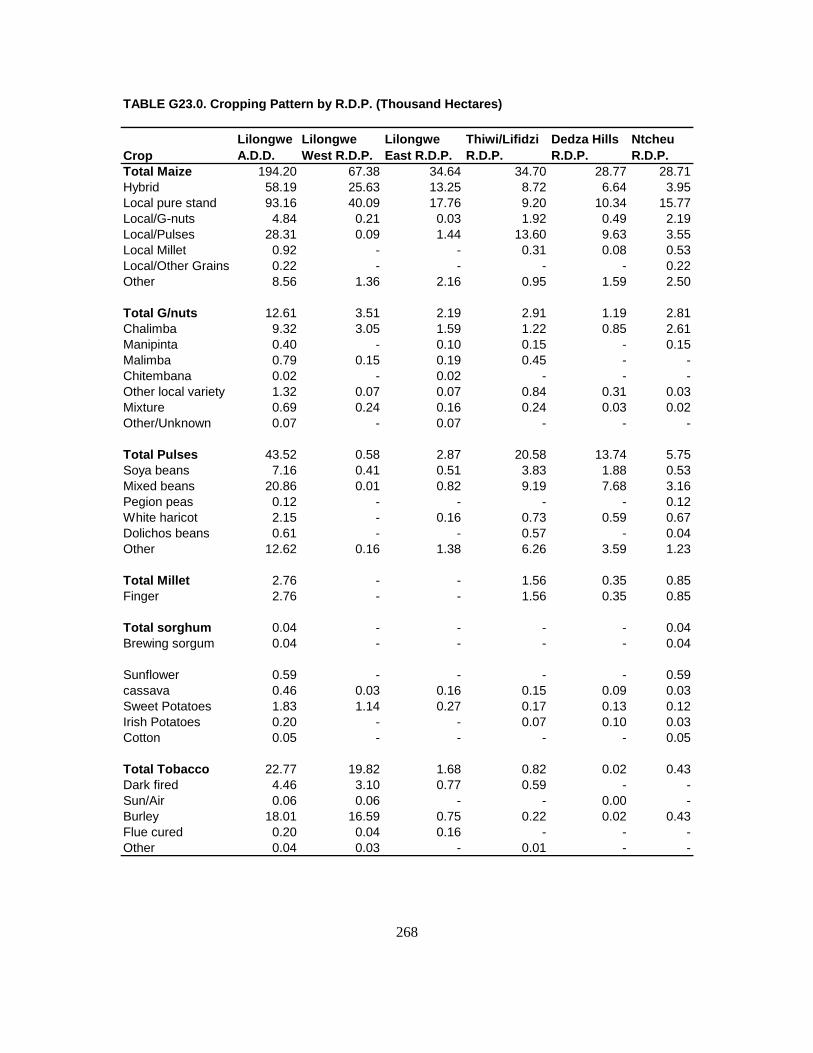
TABLE G23.0. Cropping Pattern by R.D.P. (Thousand Hectares)
CropLilongwe A.D.D.
Lilongwe West R.D.P.
Lilongwe East R.D.P.
Thiwi/Lifidzi R.D.P.
Dedza Hills R.D.P.
Ntcheu R.D.P.
Total Maize 194.20 67.38 34.64 34.70 28.77 28.71Hybrid 58.19 25.63 13.25 8.72 6.64 3.95Local pure stand 93.16 40.09 17.76 9.20 10.34 15.77Local/G-nuts 4.84 0.21 0.03 1.92 0.49 2.19Local/Pulses 28.31 0.09 1.44 13.60 9.63 3.55Local Millet 0.92 - - 0.31 0.08 0.53Local/Other Grains 0.22 - - - - 0.22Other 8.56 1.36 2.16 0.95 1.59 2.50
Total G/nuts 12.61 3.51 2.19 2.91 1.19 2.81Chalimba 9.32 3.05 1.59 1.22 0.85 2.61Manipinta 0.40 - 0.10 0.15 - 0.15Malimba 0.79 0.15 0.19 0.45 - -Chitembana 0.02 - 0.02 - - -Other local variety 1.32 0.07 0.07 0.84 0.31 0.03Mixture 0.69 0.24 0.16 0.24 0.03 0.02Other/Unknown 0.07 - 0.07 - - -
Total Pulses 43.52 0.58 2.87 20.58 13.74 5.75Soya beans 7.16 0.41 0.51 3.83 1.88 0.53Mixed beans 20.86 0.01 0.82 9.19 7.68 3.16Pegion peas 0.12 - - - - 0.12White haricot 2.15 - 0.16 0.73 0.59 0.67Dolichos beans 0.61 - - 0.57 - 0.04Other 12.62 0.16 1.38 6.26 3.59 1.23
Total Millet 2.76 - - 1.56 0.35 0.85Finger 2.76 - - 1.56 0.35 0.85
Total sorghum 0.04 - - - - 0.04Brewing sorgum 0.04 - - - - 0.04
Sunflower 0.59 - - - - 0.59cassava 0.46 0.03 0.16 0.15 0.09 0.03Sweet Potatoes 1.83 1.14 0.27 0.17 0.13 0.12Irish Potatoes 0.20 - - 0.07 0.10 0.03Cotton 0.05 - - - - 0.05
Total Tobacco 22.77 19.82 1.68 0.82 0.02 0.43Dark fired 4.46 3.10 0.77 0.59 - -Sun/Air 0.06 0.06 - - 0.00 -Burley 18.01 16.59 0.75 0.22 0.02 0.43Flue cured 0.20 0.04 0.16 - - -Other 0.04 0.03 - 0.01 - -
268

TABLE G24.0. Percentage Cropping Pattern by R.D.P.
CropLilongwe A.D.D.
Lilongwe West R.D.P.
Lilongwe East R.D.P.
Thiwi/Lifidzi R.D.P.
Dedza Hills R.D.P.
Ntcheu R.D.P.
Total Maize 100.0 100.0 100.0 100.0 100.0 100.0Hybrid 30.0 38.0 38.2 25.1 23.1 13.8Local pure stand 48.0 59.5 51.3 26.5 35.9 55.0Local/G-nuts 2.5 0.3 0.1 5.5 1.7 7.6Local/Pulses 14.6 0.1 4.2 39.2 33.5 12.4Local Millet 0.5 - - 0.9 0.3 1.9Local/Other Grains 0.1 - - - - 0.8Other 4.4 2.0 6.2 2.7 5.5 8.7
Total G/nuts 100.0 100.0 100.0 100.0 100.0 100.0Chalimba 73.9 86.9 72.6 42.0 70.8 92.9Manipinta 3.2 - 4.6 5.2 - 5.3Malimba 6.3 4.3 8.7 15.5 - -Chitembana 0.2 - 0.9 - - -Other local variety 10.5 2.0 3.2 29.0 25.8 1.1Mixture 5.6 6.9 7.3 8.3 3.3 0.7Other/Unknown 0.6 - 3.2 - - -
Total Pulses 100.0 100.0 100.0 100.0 100.0 100.0Soya beans 16.5 70.7 17.8 18.6 13.7 9.2Mixed beans 47.9 1.7 28.6 44.7 55.9 55.0Pegion peas 0.3 - - - - 2.1White haricot 4.9 0.0 5.6 3.6 4.3 11.7Dolichos beans 1.4 - - 2.8 - 0.7Other 29.0 27.1 48.1 30.4 26.1 21.4
Total Millet 100.0 - - 100.0 100.0 100.0Finger 100.0 - - 100.0 100.0 100.0
Total sorghum 100.0 - - - - 100.0Brewing sorgum 100.0 - - - - 100.0
Sunflower 100.0 - - - - 100.0cassava 100.0 100.0 100.0 100.0 100.0 100.0Sweet Potatoes 100.0 100.0 100.0 100.0 100.0 100.0Irish Potatoes 100.0 100.0 100.0 100.0 100.0 100.0Cotton 100.0 100.0 100.0 100.0 100.0 100.0
Total Tobacco 100.0 100.0 100.0 100.0 100.0 100.0Dark fired 19.6 15.6 45.8 71.9 - -Sun/Air 0.3 0.3 - - 0.0 -Burley 79.1 83.7 44.6 27.0 100.0 100.0Flue cured 0.9 0.2 9.5 - - -Other 0.2 0.2 - 1.2 - -
269
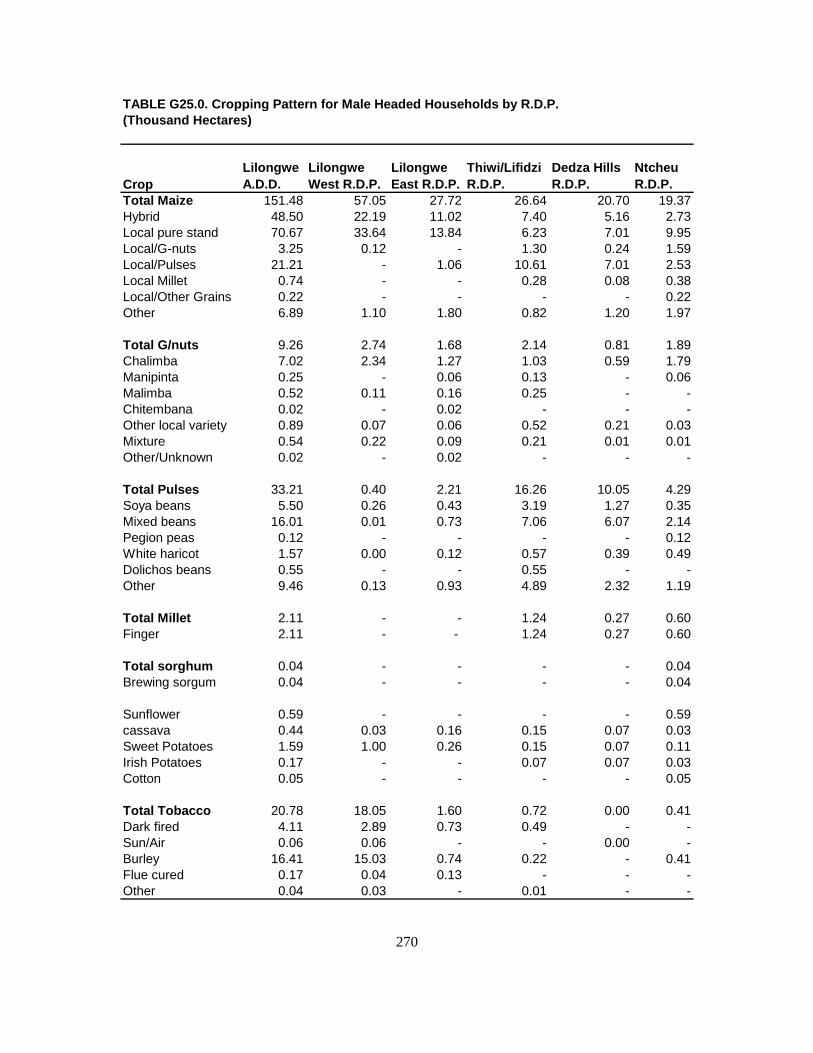
TABLE G25.0. Cropping Pattern for Male Headed Households by R.D.P.(Thousand Hectares)
CropLilongwe A.D.D.
Lilongwe West R.D.P.
Lilongwe East R.D.P.
Thiwi/Lifidzi R.D.P.
Dedza Hills R.D.P.
Ntcheu R.D.P.
Total Maize 151.48 57.05 27.72 26.64 20.70 19.37Hybrid 48.50 22.19 11.02 7.40 5.16 2.73Local pure stand 70.67 33.64 13.84 6.23 7.01 9.95Local/G-nuts 3.25 0.12 - 1.30 0.24 1.59Local/Pulses 21.21 - 1.06 10.61 7.01 2.53Local Millet 0.74 - - 0.28 0.08 0.38Local/Other Grains 0.22 - - - - 0.22Other 6.89 1.10 1.80 0.82 1.20 1.97
Total G/nuts 9.26 2.74 1.68 2.14 0.81 1.89Chalimba 7.02 2.34 1.27 1.03 0.59 1.79Manipinta 0.25 - 0.06 0.13 - 0.06Malimba 0.52 0.11 0.16 0.25 - -Chitembana 0.02 - 0.02 - - -Other local variety 0.89 0.07 0.06 0.52 0.21 0.03Mixture 0.54 0.22 0.09 0.21 0.01 0.01Other/Unknown 0.02 - 0.02 - - -
Total Pulses 33.21 0.40 2.21 16.26 10.05 4.29Soya beans 5.50 0.26 0.43 3.19 1.27 0.35Mixed beans 16.01 0.01 0.73 7.06 6.07 2.14Pegion peas 0.12 - - - - 0.12White haricot 1.57 0.00 0.12 0.57 0.39 0.49Dolichos beans 0.55 - - 0.55 - -Other 9.46 0.13 0.93 4.89 2.32 1.19
Total Millet 2.11 - - 1.24 0.27 0.60Finger 2.11 - - 1.24 0.27 0.60
Total sorghum 0.04 - - - - 0.04Brewing sorgum 0.04 - - - - 0.04
Sunflower 0.59 - - - - 0.59cassava 0.44 0.03 0.16 0.15 0.07 0.03Sweet Potatoes 1.59 1.00 0.26 0.15 0.07 0.11Irish Potatoes 0.17 - - 0.07 0.07 0.03Cotton 0.05 - - - - 0.05
Total Tobacco 20.78 18.05 1.60 0.72 0.00 0.41Dark fired 4.11 2.89 0.73 0.49 - -Sun/Air 0.06 0.06 - - 0.00 -Burley 16.41 15.03 0.74 0.22 - 0.41Flue cured 0.17 0.04 0.13 - - -Other 0.04 0.03 - 0.01 - -
270

TABLE G26.0. Cropping Pattern for Female Headed Households by R.D.P.(Thousand Hectares)
CropLilongwe A.D.D.
Lilongwe West R.D.P.
Lilongwe East R.D.P.
Thiwi/Lifidzi R.D.P.
Dedza Hills R.D.P. Ntcheu R.D.P.
Total Maize 42.72 10.33 6.92 8.06 8.07 9.34Hybrid 9.69 3.44 2.23 1.32 1.48 1.22Local pure stand 22.49 6.45 3.92 2.97 3.33 5.82Local/G-nuts 1.59 0.09 0.03 0.62 0.25 0.60Local/Pulses 7.10 0.09 0.38 2.99 2.62 1.02Local Millet 0.18 - - 0.03 - 0.15Other 1.67 0.26 0.36 0.13 0.39 0.53
Total G/nuts 3.35 0.77 0.51 0.77 0.38 0.92Chalimba 2.30 0.71 0.31 0.20 0.26 0.82Manipinta 0.15 - 0.04 0.02 - 0.09Malimba 0.27 0.04 0.03 0.20 - -Other local variety 0.43 - 0.01 0.32 0.10 0.00Mixture 0.15 0.02 0.07 0.03 0.02 0.01Other/Unknown 0.05 - 0.05 - - -
Total Pulses 10.31 0.18 0.66 4.32 3.69 1.46Soya beans 1.66 0.15 0.08 0.64 0.61 0.18Mixed beans 4.85 - 0.09 2.13 1.61 1.02White haricot 0.58 - 0.04 0.16 0.20 0.18Dolichos beans 0.06 - - 0.02 - 0.04Other 3.16 0.03 0.45 1.37 1.27 0.04
Total Millet 0.65 - - 0.32 0.08 0.25Finger 0.65 - - 0.32 0.08 0.25
cassava 0.02 - - - 0.02 -Sweet Potatoes 0.24 0.14 0.01 0.02 0.06 0.01Irish Potatoes 0.03 - - 0.00 0.03 0.00
Total Tobacco 1.99 1.77 0.08 0.10 0.02 0.02Dark fired 0.35 0.21 0.04 0.10 - -Burley 1.61 1.56 0.01 0.00 0.02 0.02Flue cured 0.03 - 0.03 - - -
271

TABLE G27.0. Production for Selected crops by R.D.P. (Thousand Tonnens)
CropLilongwe A.D.D.
Lilongwe West R.D.P.
Lilongwe East R.D.P.
Thiwi/Lifidzi R.D.P.
Dedza Hills R.D.P.
Ntcheu R.D.P.
Total Maize 339.50 129.83 59.33 77.59 40.98 31.77Hybrid 145.35 59.32 31.38 31.94 14.66 8.05Local pure stand 136.73 70.12 25.53 13.84 11.91 15.33Local/G-nuts 5.94 0.18 0.01 2.97 0.41 2.37Local/Pulses 50.04 0.21 2.41 28.16 13.91 5.35Local Millet 1.44 - - 0.68 0.09 0.67Local/Other grains 0.00 - - - - 0.00Other 0.00 0.00 0.00 0.00 0.00 0.00
Total G/nuts 9.09 2.21 1.90 1.63 0.50 2.85Chalimba 7.17 2.02 1.38. 0.71 0.26 2.80Manipinta 0.23 - 0.11 0.09 - 0.03Malimba 0.63 0.06 0.13 0.44 - -Chitembana 0.01 - 0.01 - - -Other local variety 0.57 0.04 0.06 0.22 0.21 0.02Mixture 0.43 0.09 0.16 0.16 0.02 0.00Other/Unknown 0.05 - 0.05 - - -
Total Pulses 18.80 0.50 1.19 7.96 7.46 1.69Soya beans 4.50 0.37 0.38 1.77 1.70 0.28Mixed beans 8.28 0.00 0.28 3.27 3.91 0.82Pigion peas - - - - - 0.00White haricot 1.15 0.00 0.00 0.60 0.36 0.19Dolichos beans 0.26 - - 0.26 - 0.00Other 4.61 0.13 0.53 2.06 1.49 0.40
Total Millet 0.98 - - 0.39 0.11 0.48Finger 0.98 - - 0.39 0.11 0.48
Sunflower 0.33 - - - - 0.33
272
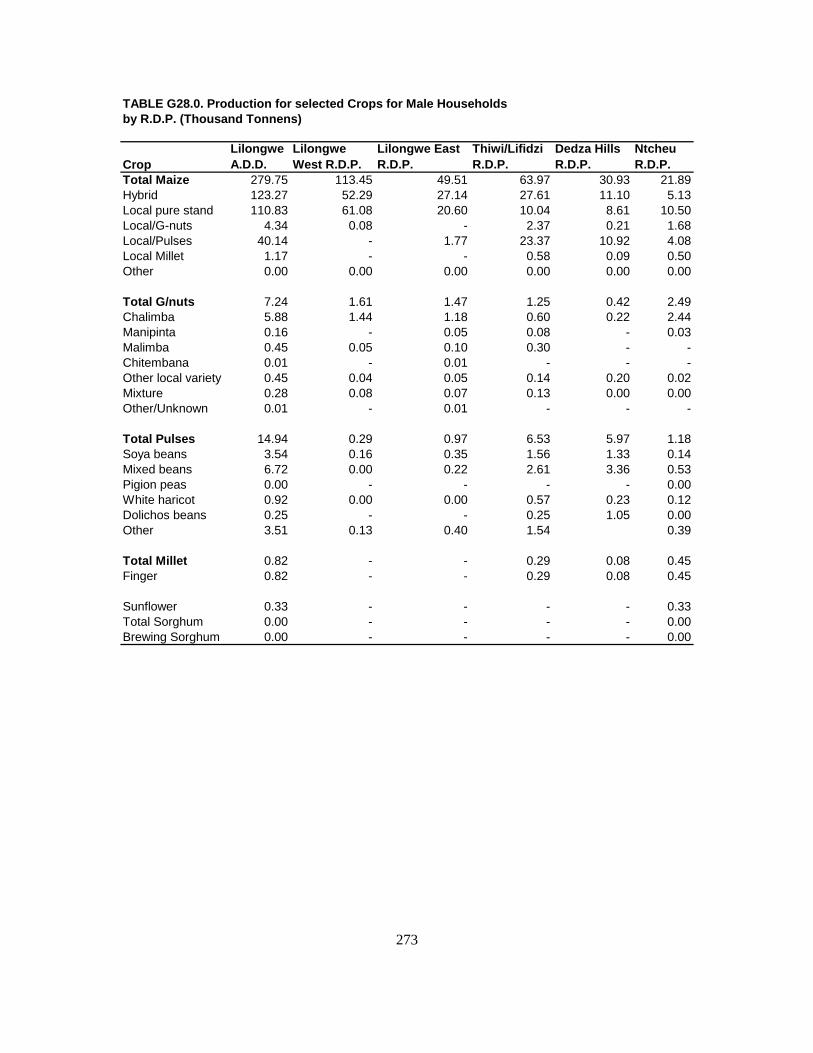
TABLE G28.0. Production for selected Crops for Male Households by R.D.P. (Thousand Tonnens)
CropLilongwe A.D.D.
Lilongwe West R.D.P.
Lilongwe East R.D.P.
Thiwi/Lifidzi R.D.P.
Dedza Hills R.D.P.
Ntcheu R.D.P.
Total Maize 279.75 113.45 49.51 63.97 30.93 21.89Hybrid 123.27 52.29 27.14 27.61 11.10 5.13Local pure stand 110.83 61.08 20.60 10.04 8.61 10.50Local/G-nuts 4.34 0.08 - 2.37 0.21 1.68Local/Pulses 40.14 - 1.77 23.37 10.92 4.08Local Millet 1.17 - - 0.58 0.09 0.50Other 0.00 0.00 0.00 0.00 0.00 0.00
Total G/nuts 7.24 1.61 1.47 1.25 0.42 2.49Chalimba 5.88 1.44 1.18 0.60 0.22 2.44Manipinta 0.16 - 0.05 0.08 - 0.03Malimba 0.45 0.05 0.10 0.30 - -Chitembana 0.01 - 0.01 - - -Other local variety 0.45 0.04 0.05 0.14 0.20 0.02Mixture 0.28 0.08 0.07 0.13 0.00 0.00Other/Unknown 0.01 - 0.01 - - -
Total Pulses 14.94 0.29 0.97 6.53 5.97 1.18Soya beans 3.54 0.16 0.35 1.56 1.33 0.14Mixed beans 6.72 0.00 0.22 2.61 3.36 0.53Pigion peas 0.00 - - - - 0.00White haricot 0.92 0.00 0.00 0.57 0.23 0.12Dolichos beans 0.25 - - 0.25 1.05 0.00Other 3.51 0.13 0.40 1.54 0.39
Total Millet 0.82 - - 0.29 0.08 0.45Finger 0.82 - - 0.29 0.08 0.45
Sunflower 0.33 - - - - 0.33Total Sorghum 0.00 - - - - 0.00Brewing Sorghum 0.00 - - - - 0.00
273

TABLE G29.0. Production for Selected Crops for Female Headed Headed Households by R.D.P. (Thousand Tonnens)
CropLilongwe A.D.D.
Lilongwe West R.D.P.
Lilongwe East R.D.P.
Thiwi/Lifidzi R.D.P.
Dedza Hills R.D.P.
Ntcheu R.D.P.
Total Maize 59.75 16.38 9.82 13.62 10.05 9.88Hybrid 22.08 7.03 4.24 4.33 3.56 2.92Local pure stand 25.90 9.04 4.93 3.80 3.30 4.83Local/G-nuts 1.60 0.10 0.01 0.60 0.20 0.69Local/Pulses 9.90 0.21 0.64 4.79 2.99 1.27Local Millet 0.27 - - 0.10 - 0.17Other 0.00 0.00 0.00 0.00 0.00 0.00
Total G/nuts 1.85 0.60 0.43 0.38 0.08 0.36Chalimba 1.29 0.58 0.20 0.11 0.04 0.36Manipinta 0.07 - 0.06 0.01 - 0.00Malimba 0.18 0.01 0.03 0.14 - -Other local variety 0.12 - 0.01 0.09 0.02 0.00Mixture 0.15 0.01 0.09 0.03 0.02 0.00Other/Unknown 0.04 - 0.04 - - -
Total Pulses 3.86 0.21 0.22 1.43 1.49 0.51Soya beans 0.96 0.21 0.03 0.21 0.37 0.14Mixed beans 1.56 - 0.06 0.66 0.55 0.29White haricot 0.23 - 0.00 0.03 0.13 0.07Dolichos beans 0.01 - - 0.01 - 0.00Other 1.10 0.00 0.13 0.52 0.44 0.01
Total Millet 0.16 - - 0.10 0.03 0.03Finger 0.16 - - 0.10 0.03 0.03
Sunflower 0.00 - - - 0.00 -
274

TABLE G30.0. Mean Yield for Selected Crops by R.D.P. (Kilograms/Hectare)
CropLilongwe A.D.D.
Lilongwe West R.D.P.
Lilongwe East R.D.P.
Thiwi/Lifidzi R.D.P.
Dedza Hills R.D.P.
Ntcheu R.D.P.
Total Maize 1748.20 1926.83 1712.76 2236.02 1424.40 1106.58Hybrid 2497.85 2314.48 2368.30 3662.84 2207.83 2037.97Local pure stand 1467.69 1749.06 1437.50 1504.35 1151.84 972.10Local/G-nuts 1227.27 857.14 333.33 1546.88 836.73 1082.19Local/Pulses 1767.57 2333.33 1673.61 2070.59 1444.44 1507.04Local Millet 1565.22 - - 2193.55 1125.00 1264.15Local/Other grains 0.00 - - - - 0.00Other 0.00 0.00 0.00 0.00 0.00 0.00
Total G/nuts 720.86 629.63 867.58 560.14 420.17 1014.23Chalimba 769.31 662.30 867.92 581.97 305.88 1072.80Manipinta 575.00 - 1100.00 600.00 - 200.00Malimba 797.47 400.00 684.21 977.78 - -Chitembana 500.00 - 500.00 - - -Other/Local variety 431.82 571.43 857.14 261.90 677.42 666.67Mixture 623.19 375.00 1000.00 666.67 666.67 0.00Other/unknown 714.29 - 714.29 - - -
Total Pulses 431.99 862.07 414.63 386.78 542.94 293.91Soya beans 628.49 902.44 745.10 462.14 904.26 528.30Mixed beans 396.93 - 341.46 355.82 509.11 259.49Pegion peas 0.00 - - - - 0.00White haricot 534.88 0.00 0.00 821.92 610.17 283.58Dolichos beans 426.23 - - 456.14 - 0.00Other 365.29 812.50 384.06 329.07 415.04 325.20
Total Millet 355.07 - - 250.00 314.29 564.71Finger 355.07 - - 250.00 314.29 564.71Sunflower 559.32 - - - - 559.32
275
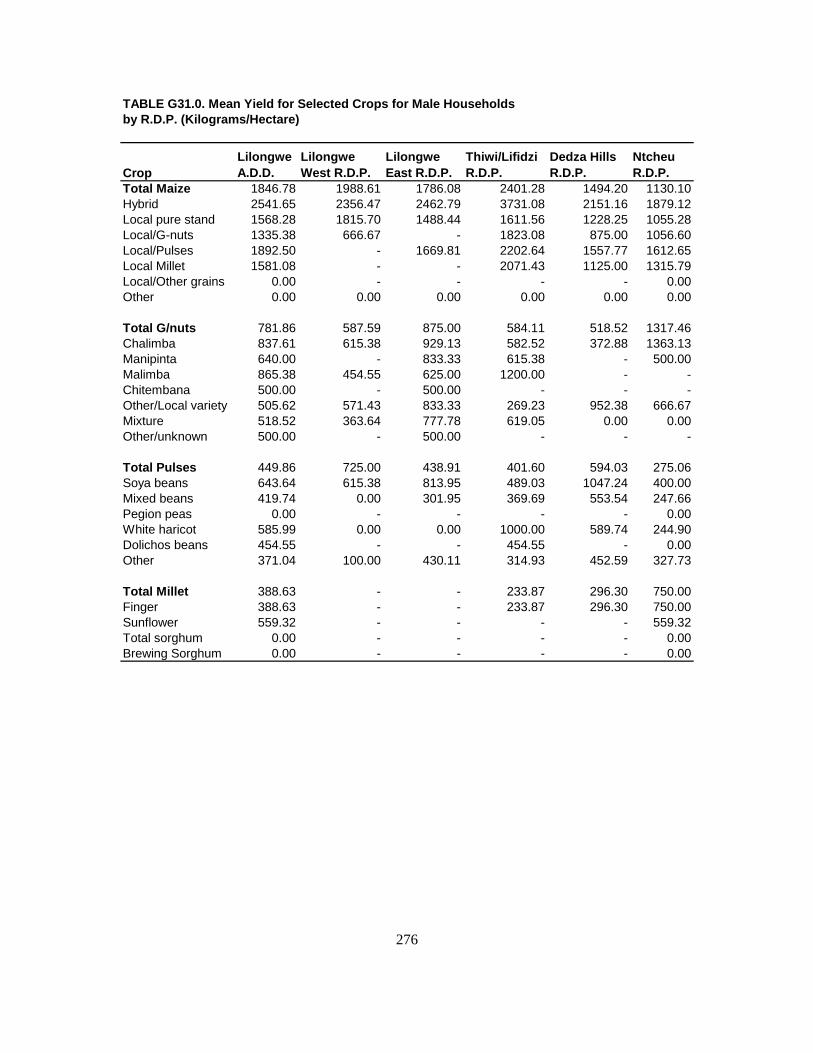
TABLE G31.0. Mean Yield for Selected Crops for Male Households by R.D.P. (Kilograms/Hectare)
CropLilongwe A.D.D.
Lilongwe West R.D.P.
Lilongwe East R.D.P.
Thiwi/Lifidzi R.D.P.
Dedza Hills R.D.P.
Ntcheu R.D.P.
Total Maize 1846.78 1988.61 1786.08 2401.28 1494.20 1130.10Hybrid 2541.65 2356.47 2462.79 3731.08 2151.16 1879.12Local pure stand 1568.28 1815.70 1488.44 1611.56 1228.25 1055.28Local/G-nuts 1335.38 666.67 - 1823.08 875.00 1056.60Local/Pulses 1892.50 - 1669.81 2202.64 1557.77 1612.65Local Millet 1581.08 - - 2071.43 1125.00 1315.79Local/Other grains 0.00 - - - - 0.00Other 0.00 0.00 0.00 0.00 0.00 0.00
Total G/nuts 781.86 587.59 875.00 584.11 518.52 1317.46Chalimba 837.61 615.38 929.13 582.52 372.88 1363.13Manipinta 640.00 - 833.33 615.38 - 500.00Malimba 865.38 454.55 625.00 1200.00 - -Chitembana 500.00 - 500.00 - - -Other/Local variety 505.62 571.43 833.33 269.23 952.38 666.67Mixture 518.52 363.64 777.78 619.05 0.00 0.00Other/unknown 500.00 - 500.00 - - -
Total Pulses 449.86 725.00 438.91 401.60 594.03 275.06Soya beans 643.64 615.38 813.95 489.03 1047.24 400.00Mixed beans 419.74 0.00 301.95 369.69 553.54 247.66Pegion peas 0.00 - - - - 0.00White haricot 585.99 0.00 0.00 1000.00 589.74 244.90Dolichos beans 454.55 - - 454.55 - 0.00Other 371.04 100.00 430.11 314.93 452.59 327.73
Total Millet 388.63 - - 233.87 296.30 750.00Finger 388.63 - - 233.87 296.30 750.00Sunflower 559.32 - - - - 559.32Total sorghum 0.00 - - - - 0.00Brewing Sorghum 0.00 - - - - 0.00
276

TABLE G32.0. Mean Yield for Selected Crops for Female HeadedHouseholds by R.D.P. (Kilograms/Hectare)
CropLilongwe A.D.D.
Lilongwe West R.D.P.
Lilongwe East R.D.P.
Thiwi/Lifidzi R.D.P.
Dedza Hills R.D.P.
Ntcheu R.D.P.
Total Maize 1398.64 1585.67 1419.08 1689.83 1245.35 1057.82Hybrid 2278.64 2043.60 1901.35 3280.30 2405.41 2393.44Local pure stand 1151.62 1401.55 1257.65 1279.46 990.99 829.90Local/G-nuts 1006.29 1111.11 333.33 967.74 800.00 1150.00Local/Pulses 1394.37 2333.33 1684.21 1602.01 1141.22 1245.10Local Millet 1500.00 - - 3333.33 - 1133.33Other 0.00 0.00 0.00 0.00 0.00 0.00
Total G/nuts 552.24 779.22 843.14 493.51 210.53 391.30Chalimba 560.87 816.90 645.16 550.00 153.85 439.02Manipinta 466.67 - 1500.00 500.00 0.00 -Malimba 666.67 250.00 1000.00. 700.00 - -Other/Local variety 279.07 - 1000.00 281.25 200.00 0.00Mixture 1000.00 500.00 1285.71 1000.00 1000.00 0.00Other/unknown 800.00 - 800.00 - - -
Total Pulses 374.39 1166.67 333.33 331.02 403.79 349.32Soya beans 578.31 1400.00 375.00 328.13 606.56 777.78Mixed beans 321.65 - 666.67 309.86 341.61 284.31White haricot 396.55 - 0.00 187.50 650.00 388.89Dolichos beans 166.67 - - 500.00 0.00 0.00Other 348.10 0.00 288.89 379.56 346.46 250.00
Total Millet 246.15 - - 312.50 375.00 120.00Finger 246.15 - - 312.50 375.00 120.00Sunflower 0.00 - - - - 0.00
277/278

STATISTICAL TABLES
FOR
NSSA 1992/93
MACHINGA A.D.D.
159/160

LIST OF STATISTICAL TABLES FOR MACHINGA A.D.D. Table Table title page Number G1.0 Number and percentage of gardens by holding size 285 category G2.0 Percentage of cultivated area by ploughing method 286 Used and holding size category G3.0 Percentage of cultivated area by ridging method used 287 And holding size category G4.0 Percentage of cultivated area by planting method used 288 And holding size category G5.0 Percentage of cultivated area by source of permission 290 To use land and R.D.P. G6.0 Number of plots by holding size category and R.D.P. 290 G7.0 Percentage of plots by maize variety and R.D.P 290 G8.0 Percentage of plots by source of seed and maize variety 291 G9.0 Percentage of plots to which fertilizer was applied by type 293 Of fertilizer G10.0 Percentage of plots to which fertilizer was applied by type 293 Of fertilizer G11.0 Percentage of maize plots to which fertilizer was applied by 294 Type of fertilizer, R.D.P. and sex of household head G12.0 Percentage of maize plots to which fertilizer was applied to 295 By type of fertilizer, R.D.P. and sex of household head G13.0 Percentage of plots to which fertilizer was applied by maize 296 Variety G14.0 Percentage of plots to which fertilizer was applied by maize 298 Variety G15.0 Percentage of maize plots to which fertilizer was applied by 300 Maize variety for male headed households
280/281

G16.0 Percentage of maize plots to which fertilizer was applied by 302 Maize variety for male headed households G17.0 Percentage of maize plots to which fertilizer was applied by 304 Maize variety for female headed households G18.0 Percentage of maize plots to which fertilizer was applied by 306 Maize variety for female headed households G19.0 Fertilizer application on area planted with maize and rice by 307 R.D.P. G20.0 Fertilizer application on area planted with maize and rice for 309 Female headed households by R.D.P. G21.0 Fertilizer application on area planted with maize and rice for 311 Female headed households by R.D.P. G22.0 Percentage of plots to which fertilizer was applied by sex of 313 Household head and source of financing G23.0 Cropping pattern by R.D.P. (Thousand Hectares) 314 G24.0 Percentage cropping pattern by R.D.P. 315 G25.0 Cropping pattern for male headed households by R.D.P. 317 ( Thousand Hectares ) G26.0 Cropping pattern for female headed households by R.D.P. 318 (Thousand Hectares) G27.0 Production for selected crops by R.D.P. (Thousand Tones) 319 G28.0 Production for selected crops for male headed households by 320 R.D.P. (Thousand Tones) G29.0 Production for selected crops for female headed households 321 By R.D.P. (Thousand Tones) G30.0 Mean yield for selected crops by R.D.P. (Kilograms/Hectare) 322 G31.0 Mean yield for selected crops for male headed households by 323 R.D.P (Kilograms/Hectare) G32.0 Mean yield for selected crops for female headed households by 324 R.D.P. (Kilograms/Hectare)
282/283/284

TABLE G1.0. Number and Percentage of Gardens by Holding Size Category.
A.D.D/R.D.P. Total Holding Size Category (Hectares)
Under 0.50 0.50-0.99 1.00-1.49 1.50-1.99 2.00-2.49 2.50-2.993.00 and over
Machinga A.D.D.Number 610613 214434 229835 97457 44476 16193 3634 4584Percent 100.0 35.1 37.6 16.0 7.3 2.7 0.6 0.8Mangochi R.D.P.Number 86317 40631 25966 9743 5266 1580 729 2402Percent 100.0 47.1 30.1 11.3 6.1 1.8 0.8 2.8Namwera R.D.P.Number 76932 22164 31597 13138 5989 2911 1009 124Percent 100.0 28.8 41.1 17.1 7.8 3.8 1.3 0.2Balaka R.D.PNumber 84548 23298 28263 18989 10040 2356 1602 0.0Percent 100.0 27.6 33.4 22.5 11.9 2.8 1.9 0.0Kawinga R.D.P.Number 119975 30283 51143 26261 8218 2516 294 1260Percent 100.0 25.2 42.6 21.9 6.8 2.1 0.2 1.1Zomba R.D.P.Number 242841 98058 92866 29326 14963 6830 0.0 798Percent 100.0 40.4 38.2 12.1 6.2 2.8 0.0 0.3
285

TABLE G2.0. Percentage of Cultivated Area by Ploughing Method used and Holding Size Category
Ploughing Method Total Holding Size Category(Hectares)
Under 0.50 0.50-0.99 1.00-1.49 0.50-1.99 2.00-2.49 2.50-2.993.00 and over
Machinga A.D.D.Total 100.0 18.6 37.0 21.9 12.8 5.4 1.9 2.4Not ploughed this season 94.9 17.6 35.2 21.0 12.3 5.2 1.9 1.7Tilled by hoeing 4.2 0.8 1.6 0.7 0.3 0.2 0.0 0.6Ploughed by oxen 0.2 - 0.0 0.1 0.1 - - -Other 0.8 0.3 0.2 0.2 0.1 - - -Mangochi R.D.P.Total 100.0 23.8 33.3 15.8 11.6 4.8 2.2 8.6Not ploughed this season 90.0 22.3 31.4 15.1 10.4 4.0 2.2 4.6Tilled by hoeing 10.0 1.5 1.8 0.6 1.2 0.8 - 4.0Namwera R.D.P.Total 100.0 13.0 41.0 20.9 12.5 6.3 5.2 1.1Not ploughed this season 98.9 13.0 40.9 20.5 12.1 6.3 5.0 1.1Tilled by hoeing 1.1 0.0 0.1 0.4 0.4 - 0.2 -Balaka R.D.P.Total 100.0 14.1 30.5 29.8 16.2 5.3 4.0 -Not ploughed this season 99.0 13.7 30.2 29.5 16.2 5.3 4.0 -Tilled by hoeing 1.0 0.4 0.3 0.3 0.0 0.0 - -Kawinga R.D.P.Total 100.0 13.8 39.8 29.5 9.9 4.3 0.4 2.4Not ploughed this season 95.6 13.2 38.2 27.9 9.5 4.2 0.4 2.4Tilled by hoeing 3.6 0.6 1.5 1.3 0.1 0.1 - -Ploughed by oxen 0.8 - 0.1 0.3 0.4 - - -Zomba R.D.P.Total 100.0 23.8 38.8 17.1 13.4 5.8 - 1.2Not ploughed this season 92.7 22.0 35.1 15.8 12.9 5.7 - 1.2Tilled by hoeing 4.9 1.1 3.0 0.7 0.1 0.0 - - Other 2.4 0.8 0.7 0.6 0.4 - - -
286
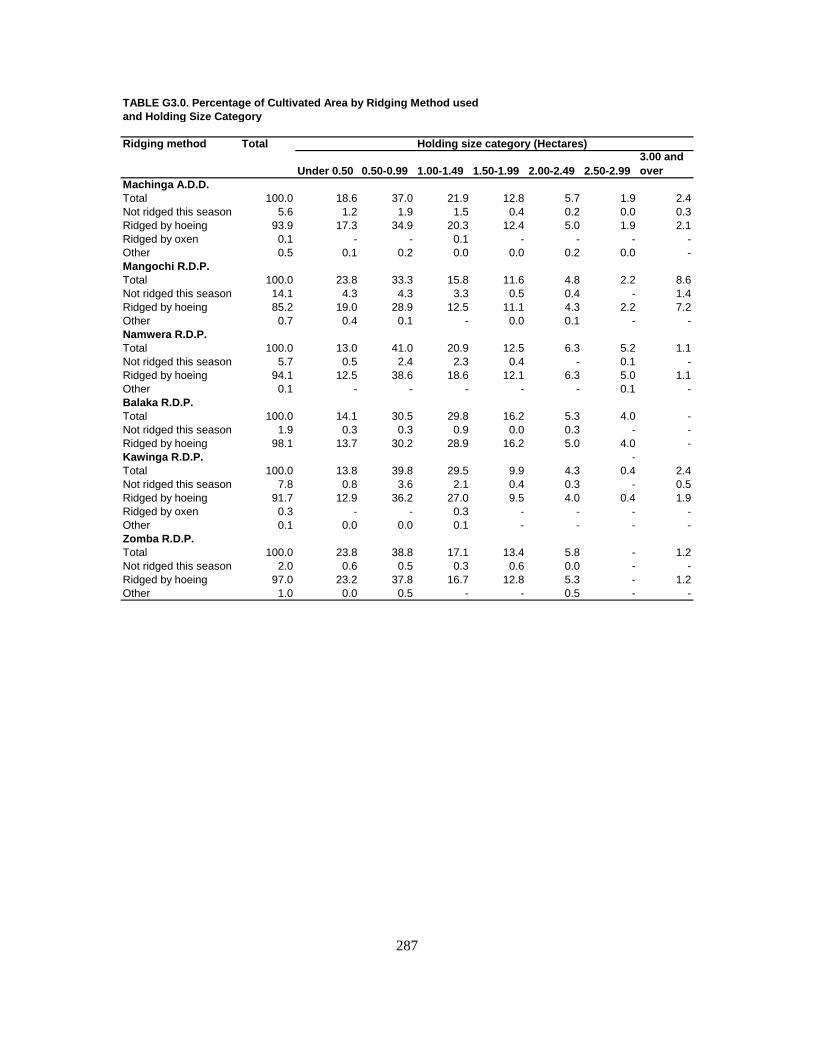
TABLE G3.0. Percentage of Cultivated Area by Ridging Method used and Holding Size Category
Ridging method Total Holding size category (Hectares)
Under 0.50 0.50-0.99 1.00-1.49 1.50-1.99 2.00-2.49 2.50-2.993.00 and over
Machinga A.D.D.Total 100.0 18.6 37.0 21.9 12.8 5.7 1.9 2.4Not ridged this season 5.6 1.2 1.9 1.5 0.4 0.2 0.0 0.3Ridged by hoeing 93.9 17.3 34.9 20.3 12.4 5.0 1.9 2.1Ridged by oxen 0.1 - - 0.1 - - - -Other 0.5 0.1 0.2 0.0 0.0 0.2 0.0 -Mangochi R.D.P.Total 100.0 23.8 33.3 15.8 11.6 4.8 2.2 8.6Not ridged this season 14.1 4.3 4.3 3.3 0.5 0.4 - 1.4Ridged by hoeing 85.2 19.0 28.9 12.5 11.1 4.3 2.2 7.2Other 0.7 0.4 0.1 - 0.0 0.1 - -Namwera R.D.P.Total 100.0 13.0 41.0 20.9 12.5 6.3 5.2 1.1Not ridged this season 5.7 0.5 2.4 2.3 0.4 - 0.1 -Ridged by hoeing 94.1 12.5 38.6 18.6 12.1 6.3 5.0 1.1Other 0.1 - - - - - 0.1 -Balaka R.D.P.Total 100.0 14.1 30.5 29.8 16.2 5.3 4.0 -Not ridged this season 1.9 0.3 0.3 0.9 0.0 0.3 - -Ridged by hoeing 98.1 13.7 30.2 28.9 16.2 5.0 4.0 -Kawinga R.D.P. -Total 100.0 13.8 39.8 29.5 9.9 4.3 0.4 2.4Not ridged this season 7.8 0.8 3.6 2.1 0.4 0.3 - 0.5Ridged by hoeing 91.7 12.9 36.2 27.0 9.5 4.0 0.4 1.9Ridged by oxen 0.3 - - 0.3 - - - -Other 0.1 0.0 0.0 0.1 - - - -Zomba R.D.P.Total 100.0 23.8 38.8 17.1 13.4 5.8 - 1.2Not ridged this season 2.0 0.6 0.5 0.3 0.6 0.0 - -Ridged by hoeing 97.0 23.2 37.8 16.7 12.8 5.3 - 1.2Other 1.0 0.0 0.5 - - 0.5 - -
287

TABLE G4.0. Percentage of Cultivated Area by Planting Method used and Holding Size Category
Planting Method Total Holding size category (Hectares)
Under 0.50 0.50-0.99 1.00-1.49 1.50-1.99 2.00-2.49 2.50-2.993.00 and over
Machinga A.D.D.Total 100.0 18.6 37.0 21.9 12.8 5.4 1.9 2.4Flat planted 4.3 0.8 1.5 1.1 0.4 0.2 - 0.3Used last seasons ridges 3.0 0.5 1.0 0.7 0.1 0.2 0.0 0.4Used this seasons ridges 92.3 17.1 34.4 20.0 12.3 4.9 1.9 1.7Planted into holes 0.2 0.0 0.0 0.1 0.1 - - -Planted into mounds 0.1 0.0 - 0.1 - 0.0 - -Other 0.1 0.0 0.0 0.0 0.0 0.0 0.0 -Mangochi R.D.P.Total 100.0 23.8 33.3 15.8 11.6 4.8 2.2 8.6Flat planted 12.8 3.5 3.8 3.0 0.7 0.4 - 1.4Used last seasons ridges 5.4 1.7 1.9 0.5 0.0 - - 1.3Used this seasons ridges 81.4 18.5 27.6 11.9 10.9 4.4 2.2 5.9Planted into mounds 0.3 - - 0.3 - - - -Other 0.1 0.1 - - - - - -Namwera R.D.P.Total 100.0 13.0 41.0 20.9 12.5 6.3 5.2 1.1Flat planted 1.3 0.0 0.1 0.2 0.4 0.6 - -Used last seasons ridges 6.3 0.1 1.3 2.8 0.1 0.8 0.1 1.1Used this seasons ridges 92.0 12.7 36.6 17.9 12.0 4.9 4.9 0.0Planted into holes 0.0 0.0 - - - - - -Planted into mounds 0.2 0.2 - 0.0 - 0.0 - -Other 0.2 - 0.0 0.0 - 0.0 0.1 -Balaka R.D.P.Total 100.0 14.1 30.5 29.8 16.2 5.3 4.0 -Flat planted 0.5 0.0 0.1 0.3 0.0 0.0 - -Used last seasons ridges 3.4 0.8 1.6 0.5 0.3 0.1 - -Used this seasons ridges 95.0 13.2 28.7 28.5 15.4 5.2 4.0 -Planted into holes 0.9 - 0.0 0.5 0.4 - - -Planted into mounds 0.0 0.0 - - - - - -Other 0.1 - 0.1 - 0.0 - - -Kawinga R.D.P.Total 100.0 13.8 39.8 29.5 9.9 4.3 0.4 2.4Flat planted 7.9 0.6 3.7 2.2 0.5 0.4 - 0.5Used last seasons ridges 1.5 0.2 0.7 0.5 - 0.1 0.1 -Used this seasons ridges 90.3 12.8 35.3 26.7 9.3 3.8 0.3 1.9Planted into holes 0.2 0.1 0.1 0.1 - - - -Zomba R.D.P.Total 100.0 23.8 38.8 17.1 13.4 5.8 - 1.2Flat planted 1.8 0.5 0.7 0.3 0.4 0.0 - -Used last seasons ridges 0.7 0.2 0.4 0.1 - 0.0 - -Used this seasons ridges 97.4 23.1 37.7 16.7 13.0 5.7 - 1.2Planted into holes 0.1 0.0 0.0 - - - - -
288/289

TABLE G5.0. Percentage of Cultivated Area by Source of Permission to use land and R.D.P.
AD.D./R.D.P. TotalRelative by birth-male
Relative by birth-female
Relative by marriage-male
Relative by marriage-female Borrowed
Estate/Scheme Other
Machinga A.D.D. 100.0 13.1 14.9 10.0 23.7 27.5 4.0 6.8Mangochi R.D.P. 100.0 11.8 12.8 3.0 20.8 43.2 - 8.4Namwera R.D.P. 100.0 18.8 16.4 11.9 21.4 23.8 1.4 6.3Balaka R.D.P. 100.0 14.2 30.3 2.9 8.2 39.0 - 5.3Kawinga R.D.P. 100.0 10.1 11.1 0.8 3.1 41.9 27.6 5.3Zomba R.D.P. 100.0 12.1 12.0 18.8 37.8 11.1 1.4 6.9
TABLE G6.0. Number of Plots by Holding Size Category and R.D.P.
A.D.D./R.D.P. Total Holding size category (Hectares)
Under 0.50 0.50-0.99 1.00-1.49 1.50-1.99 2.00-2.49 2.50-2.993.00 and over
Machinga A.D.D. 712774 229422 269142 119861 60514 21946 5264 6625Mangochi R.D.P. 92634 41373 28295 10214 5848 1882 969 4053Namwera R.D.P. 95037 24145 39552 16627 7983 4666 1816 248Balaka R.D.P. 105284 25725 33614 25794 15017 2998 2136 0Kawinga R.D.P. 133996 31019 58083 30805 9868 2618 343 1260Zomba R.D.P. 285823 107160 109598 36421 21798 9782 0 1064
TABLE G7.0. Percentage of Plots by Maize Variety and R.D.P.
A.D.D./R.D.P. Total Type of Maize
Hybrid CompositeLocal pure stand Local/G-nuts
Local/other crop Other
Machinga A.D.D. 100.0 29.2 0.2 56.1 3.7 4.6 6.2Mangochi R.D.P. 100.0 34.5 0.4 54.6 0.7 0.3 9.5Namwera R.D.P. 100.0 34.2 0.0 48.5 2.5 7.1 7.7Balaka R.D.P. 100.0 24.2 0.4 56.9 1.8 1.1 15.5Kawinga R.D.P. 100.0 26.7 0.0 61.4 2.3 4.6 5.0Zomba R.D.P. 100.0 28.9 0.2 56.4 6.4 6.5 1.7
290

TABLE G8.0. Percentage of Plots by Source of Seed and Maize Variety
Maize variety Total Source of seedRetained from last season
Project/scheme credit
As seed from ADMARC
As food from ADMARC
As food a from Market
Bought locally Other
Machinga A.D.D.All Maize 100.0 33.4 7.9 9.6 1.3 3.9 24.3 19.6Hybrid 29.2 2.5 7.1 8.3 0.2 0.3 3.3 7.4Composite 0.2 0.0 0.0 0.0 0.0 0.0 0.0 0.2Local pure stand 56.1 24.4 0.5 0.7 1.0 3.3 17.8 8.4Local/G-nuts 3.7 2.8 0.0 0.0 0.1 0.0 0.6 0.2Local/Other crop 4.6 2.9 0.1 0.1 0.0 0.1 1.0 0.4Other 6.2 0.8 0.2 0.4 0.1 0.1 1.6 3.0Mangochi R.D.P.All Maize 100.0 15.3 3.3 15.1 2.5 0.5 33.0 30.4Hybrid 34.5 2.0 3.0 13.4 0.5 0.2 6.6 8.8Composite 0.4 0.0 0.0 0.0 0.0 0.0 0.0 0.4Local pure stand 54.6 12.4 0.0 0.4 1.7 0.1 23.4 16.6Local/G-nuts 0.7 0.4 0.0 0.0 0.0 0.0 0.3 0.0Local/Other crop 0.3 0.0 0.0 0.0 0.0 0.0 0.2 0.0Other 9.5 0.4 0.2 1.4 0.3 0.2 2.5 4.5Namwera R.D.P.All Maize 100.0 37.0 14.1 11.7 0.6 0.3 21.5 14.8Hybrid 34.2 4.4 12.0 10.3 0.3 0.0 2.5 4.7Local pure stand 48.5 25.1 1.4 0.1 0.3 0.3 13.4 8.0Local/G-nuts 2.5 1.7 0.1 0.0 0.0 0.0 0.3 0.3Local/Other crop 7.1 4.0 0.0 0.0 0.0 0.0 2.5 0.6Other 7.7 1.9 0.6 1.3 0.0 0.0 2.8 1.2Balaka R.D.P.All Maize 100.0 18.2 7.5 8.2 0.9 6.9 38.3 19.9Hybrid 24.2 1.1 6.9 6.9 0.2 0.3 2.3 6.5Composite 0.4 0.0 0.0 0.0 0.0 0.0 0.0 0.4Local pure stand 56.9 14.3 0.4 1.1 0.5 6.2 30.2 4.3Local/G-nuts 1.8 0.5 0.0 0.0 0.0 0.2 1.1 0.0Local/Other crop 1.1 0.3 0.0 0.0 0.0 0.0 0.7 0.0Other 15.5 2.0 0.2 0.2 0.2 0.2 4.0 8.7Kawinga R.D.P.All Maize 100.0 31.6 9.0 10.5 2.2 1.4 19.5 25.7Hybrid 26.7 2.3 7.8 9.2 0.3 0.0 0.5 6.5Local pure stand 61.4 25.2 0.9 1.3 1.9 1.0 17.1 14.0Local/G-nuts 2.3 1.6 0.0 0.0 0.0 0.0 0.5 0.2Local/Other crop 4.6 2.2 0.0 0.0 0.0 0.2 1.0 1.2Other 5.0 0.4 0.3 0.0 0.0 0.2 0.4 3.8Zomba R.D.P.All Maize 100.0 44.3 7.2 7.3 1.0 5.9 19.0 15.1Hybrid 28.9 2.8 6.7 6.2 0.0 0.5 4.1 8.5Composite 0.2 0.0 0.0 0.1 0.0 0.0 0.0 0.1Local pure stand 56.4 31.3 0.2 0.7 0.7 5.2 13.0 5.3Local/G-nuts 6.4 5.3 0.0 0.0 0.2 0.0 0.6 0.2Local/Other crop 6.5 4.6 0.2 0.3 0.0 0.2 0.9 0.4Other 1.7 0.3 0.1 0.0 0.0 0.1 0.5 0.7
291/292
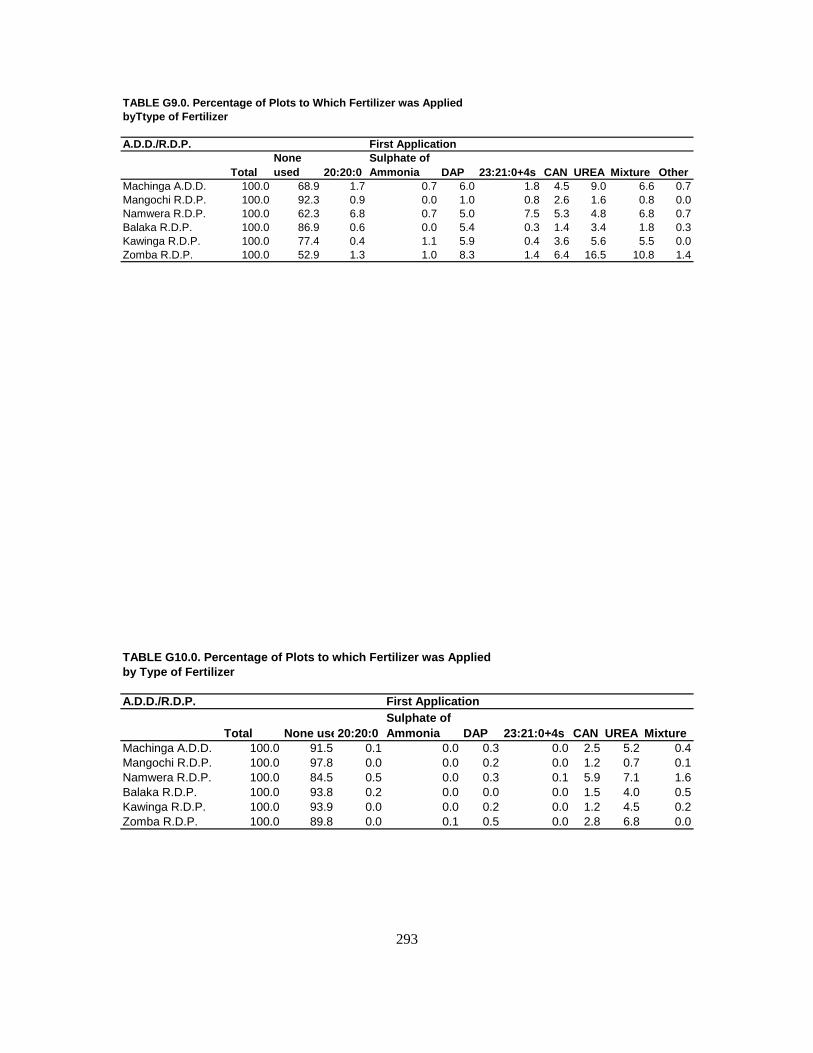
TABLE G9.0. Percentage of Plots to Which Fertilizer was Applied byTtype of Fertilizer
A.D.D./R.D.P. First Application
TotalNone used 20:20:0
Sulphate of Ammonia DAP 23:21:0+4s CAN UREA Mixture Other
Machinga A.D.D. 100.0 68.9 1.7 0.7 6.0 1.8 4.5 9.0 6.6 0.7Mangochi R.D.P. 100.0 92.3 0.9 0.0 1.0 0.8 2.6 1.6 0.8 0.0Namwera R.D.P. 100.0 62.3 6.8 0.7 5.0 7.5 5.3 4.8 6.8 0.7Balaka R.D.P. 100.0 86.9 0.6 0.0 5.4 0.3 1.4 3.4 1.8 0.3Kawinga R.D.P. 100.0 77.4 0.4 1.1 5.9 0.4 3.6 5.6 5.5 0.0Zomba R.D.P. 100.0 52.9 1.3 1.0 8.3 1.4 6.4 16.5 10.8 1.4
TABLE G10.0. Percentage of Plots to which Fertilizer was Applied by Type of Fertilizer
A.D.D./R.D.P. First Application
Total None use20:20:0Sulphate of Ammonia DAP 23:21:0+4s CAN UREA Mixture
Machinga A.D.D. 100.0 91.5 0.1 0.0 0.3 0.0 2.5 5.2 0.4Mangochi R.D.P. 100.0 97.8 0.0 0.0 0.2 0.0 1.2 0.7 0.1Namwera R.D.P. 100.0 84.5 0.5 0.0 0.3 0.1 5.9 7.1 1.6Balaka R.D.P. 100.0 93.8 0.2 0.0 0.0 0.0 1.5 4.0 0.5Kawinga R.D.P. 100.0 93.9 0.0 0.0 0.2 0.0 1.2 4.5 0.2Zomba R.D.P. 100.0 89.8 0.0 0.1 0.5 0.0 2.8 6.8 0.0
293

TABLE G11.0. Percentage of Maize Plots to which Fertlizer was Applied by Type of Fertilizer, R.D.P. and Sex of Household Head
A.D.D./R.D.P. First Application
TotalNone used 20:20:0
Sulphate of Ammonia DAP 23:21:0+4S CAN UREA MIXTURE Other
Machinga A.D.D.Total 100.0 68.9 1.7 0.7 6.0 1.8 4.5 9.0 6.6 0.7Male 68.7 44.2 1.5 0.6 4.6 1.6 3.5 6.8 5.4 0.6Female 31.3 24.7 0.2 0.1 1.5 0.1 1.0 2.3 1.2 0.1Mangochi R.D.P.Total 100.0 92.3 0.9 0.0 1.0 0.8 2.6 1.6 0.8 0.0Male 65.7 60.3 0.5 0.0 0.6 0.5 2.1 1.3 0.3 0.0Female 34.3 32.0 0.4 0.0 0.4 0.3 0.5 0.3 0.5 0.0Namwera R.D.P.Total 100.0 62.3 6.8 0.7 5.1 7.5 5.3 4.8 6.8 0.7Male 74.8 44.2 6.1 0.1 4.5 7.0 4.1 2.7 5.8 0.3Female 25.2 18.1 0.7 0.6 0.6 0.4 1.2 2.1 1.0 0.4Balaka R.D.P.Total 100.0 86.9 0.6 0.0 5.4 0.3 1.4 3.4 1.8 0.3Male 66.9 58.0 0.6 0.0 2.8 0.3 1.2 2.4 1.5 0.1Female 33.1 28.8 0.0 0.0 2.6 0.0 0.2 1.0 0.3 0.1Kawinga R.D.P.Total 100.0 77.4 0.4 1.1 5.9 0.4 3.6 5.6 5.5 0.0Male 65.9 48.9 0.4 1.0 4.3 0.4 2.7 3.5 4.6 0.0Female 34.1 28.5 0.0 0.2 1.5 0.0 0.9 2.1 0.9 0.0Zomba R.D.P.Total 100.0 52.9 1.3 1.0 8.3 1.4 6.4 16.5 10.8 1.4Male 69.7 31.7 1.1 1.0 6.6 1.3 4.8 13.1 8.7 1.4Female 30.3 21.2 0.3 0.0 1.6 0.1 1.5 3.5 2.0 0.1
294
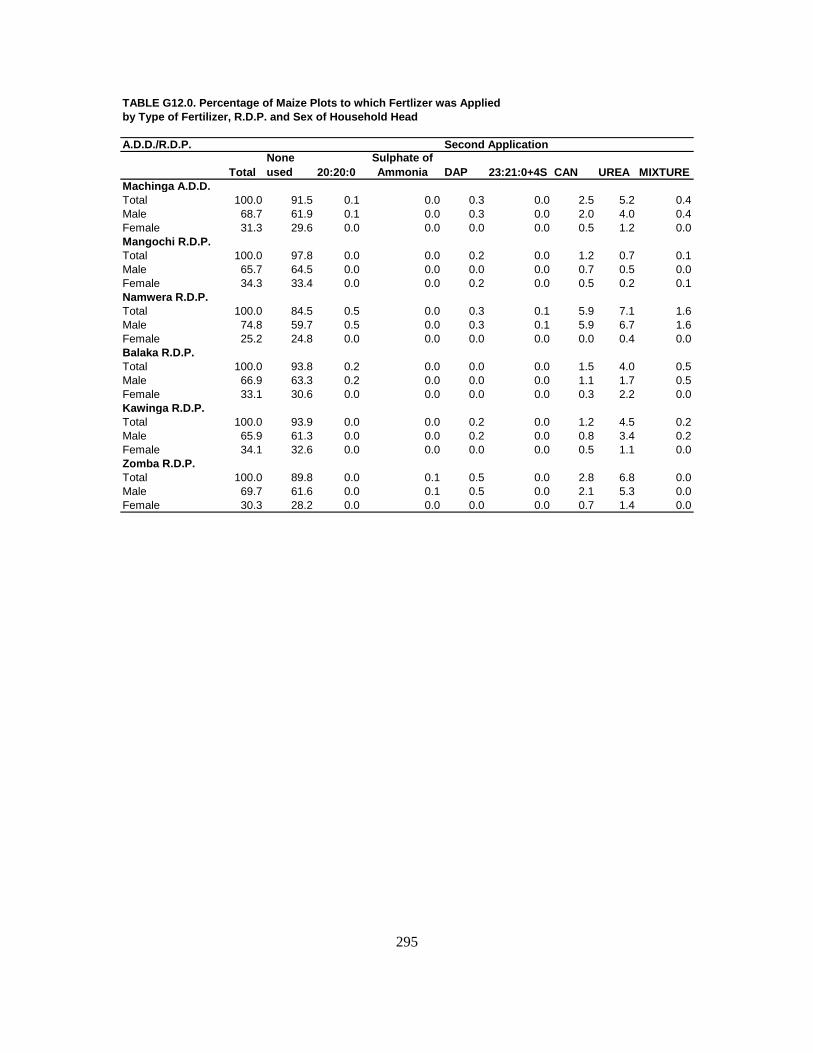
TABLE G12.0. Percentage of Maize Plots to which Fertlizer was Applied by Type of Fertilizer, R.D.P. and Sex of Household Head
A.D.D./R.D.P. Second Application
TotalNone used 20:20:0
Sulphate of Ammonia DAP 23:21:0+4S CAN UREA MIXTURE
Machinga A.D.D.Total 100.0 91.5 0.1 0.0 0.3 0.0 2.5 5.2 0.4Male 68.7 61.9 0.1 0.0 0.3 0.0 2.0 4.0 0.4Female 31.3 29.6 0.0 0.0 0.0 0.0 0.5 1.2 0.0Mangochi R.D.P.Total 100.0 97.8 0.0 0.0 0.2 0.0 1.2 0.7 0.1Male 65.7 64.5 0.0 0.0 0.0 0.0 0.7 0.5 0.0Female 34.3 33.4 0.0 0.0 0.2 0.0 0.5 0.2 0.1Namwera R.D.P.Total 100.0 84.5 0.5 0.0 0.3 0.1 5.9 7.1 1.6Male 74.8 59.7 0.5 0.0 0.3 0.1 5.9 6.7 1.6Female 25.2 24.8 0.0 0.0 0.0 0.0 0.0 0.4 0.0Balaka R.D.P.Total 100.0 93.8 0.2 0.0 0.0 0.0 1.5 4.0 0.5Male 66.9 63.3 0.2 0.0 0.0 0.0 1.1 1.7 0.5Female 33.1 30.6 0.0 0.0 0.0 0.0 0.3 2.2 0.0Kawinga R.D.P.Total 100.0 93.9 0.0 0.0 0.2 0.0 1.2 4.5 0.2Male 65.9 61.3 0.0 0.0 0.2 0.0 0.8 3.4 0.2Female 34.1 32.6 0.0 0.0 0.0 0.0 0.5 1.1 0.0Zomba R.D.P.Total 100.0 89.8 0.0 0.1 0.5 0.0 2.8 6.8 0.0Male 69.7 61.6 0.0 0.1 0.5 0.0 2.1 5.3 0.0Female 30.3 28.2 0.0 0.0 0.0 0.0 0.7 1.4 0.0
295

TABLE G13.0. Percentage of Plots to which Fertilizer was Applied by Maize Variety
Maize variety First Application
TotalNone used 20:20:0
Sulphate of Ammonia DAP 23:21:0+4s CAN UREA Mixture Other
Machinga A.D.D.All Maize 100.0 64.1 1.7 0.9 6.6 1.8 5.6 11.3 7.8 0.1Hybrid 29.2 13.3 1.0 0.1 5.0 0.9 1.7 3.5 3.6 0.1Composite 0.2 0.2 0.0 0.0 0.0 0.0 0.0 0.0 0.0 0.0Local pure stand 56.1 41.4 0.4 0.4 1.0 0.7 3.2 5.9 3.0 0.0Local/G-nuts 3.7 1.7 0.0 0.2 0.1 0.1 0.4 0.7 0.5 0.0Local/Other crop 4.6 2.6 0.1 0.1 0.2 0.0 0.1 1.0 0.5 0.0Other 6.2 4.9 0.2 0.0 0.3 0.0 0.2 0.2 0.3 0.0Mangochi R.D.P.All Maize 100.0 90.8 0.9 0.0 0.8 0.8 3.4 2.0 1.1 0.0Hybrid 34.5 29.0 0.4 0.0 0.6 0.8 1.7 1.3 0.6 0.0Composite 0.4 0.4 0.0 0.0 0.0 0.0 0.0 0.0 0.0 0.0Local pure stand 54.6 53.0 0.3 0.0 0.0 0.0 0.8 0.3 0.2 0.0Local/G-nuts 0.7 0.7 0.0 0.0 0.0 0.0 0.0 0.0 0.0 0.0Local/Other crop 0.3 0.3 0.0 0.0 0.0 0.0 0.0 0.0 0.0 0.0Other 9.5 7.4 0.2 0.0 0.2 0.0 0.9 0.4 0.2 0.0Namwera R.D.P.All Maize 100.0 58.3 7.2 0.8 5.9 6.5 7.1 6.4 7.3 0.6Hybrid 34.2 13.2 4.3 0.0 5.4. 3.8 1.4 1.4 4.1 0.6Local pure stand 48.5 33.4 1.3 0.0 0.5 2.4 4.3 4.1 2.6 0.0Local/G-nuts 2.5 1.5 0.1 0.0 0.0 0.0 0.6 0.3 0.0 0.0Local/Other crop 7.1 5.4 0.1 0.6 0.0 0.0 0.1 0.7 0.2 0.0Other 7.7 4.8 1.4 0.3 0.0 0.3 0.6 0.0 0.5 0.0Balaka R.D.P.All Maize 100.0 84.5 0.7 0.0 6.6 0.4 1.7 4.1 2.0 0.0Hybrid 24.2 13.3 0.5 0.0 4.8 0.4 0.8 3.2 1.3 0.0Composite 0.4 0.4 0.0 0.0 0.0 0.0 0.0 0.0 0.0 0.0Local pure stand 56.9 53.5 0.2 0.0 1.3 0.0 0.8 0.8 0.2 0.0Local/G-nuts 1.8 1.8 0.0 0.0 0.0 0.0 0.0 0.0 0.0 0.0Local/Other crop 1.1 1.0 0.0 0.0 0.0 0.0 0.0 0.1 0.0 0.0Other 15.5 14.5 0.0 0.0 0.5 0.0 0.0 0.0 0.5 0.0Kawinga R.D.P.All Maize 100.0 69.4 0.5 1.6 7.9 0.3 4.9 7.7 7.7 0.0Hybrid 26.7 10.5 0.3 0.4 6.2 0.1 2.1 2.9 4.1 0.0Local pure stand 61.4 48.8 0.2 0.8 1.2 0.2 2.2 4.0 3.0 0.0Local/G-nuts 2.3 1.4 0.0 0.0 0.1 0.0 0.4 0.3 0.1 0.0Local/Other crop 4.6 3.7 0.0 0.3 0.0 0.0 0.2 0.2 0.1 0.0Other 5.0 4.0 0.0 0.0 0.3 0.0 0.0 0.4 0.3 0.0Zomba R.D.P.All Maize 100.0 47.8 1.2 1.3 8.1 1.7 7.7 19.9 12.3 0.0Hybrid 28.9 9.6 0.6 0.0 5.9 0.6 2.0 5.2 4.9 0.0Composite 0.2 0.1 0.1 0.0 0.0 0.0 0.0 0.0 0.0 0.0Local pure stand 56.4 32.3 0.3 0.7 1.2 0.9 5.0 10.8 5.1 0.0Local/G-nuts 6.4 2.1 0.0 0.5 0.2 0.2 0.6 1.6 1.1 0.0Local/Other crop 6.5 2.6 0.2 0.0 0.5 0.0 0.2 2.1 1.1 0.0Other 1.7 1.0 0.0 0.0 0.3 0.0 0.0 0.2 0.1 0.0
296/297

TABLE G14.0. Percentage of Plots to which Fertilizer was Applied by Maize Variety
Maize variety Second Application
TotalNone used 20:20:0
Sulphate of Ammonia DAP 23:21:0+4s CAN UREA Mixture
Machinga A.D.D.All Maize 100.0 91.4 0.1 0.0 0.2 0.0 1.8 6.0 0.4Hybrid 29.2 22.8 0.1 0.0 0.1 0.0 1.1 4.8 0.3Composite 0.2 0.2 0.0 0.0 0.0 0.0 0.0 0.0 0.0Local pure stand 56.1 54.7 0.0 0.0 0.1 0.0 0.4 0.8 0.1Local/G-nuts 3.7 3.7 0.0 0.0 0.0 0.0 0.0 0.0 0.0Local/Other crop 4.6 4.4 0.0 0.0 0.0 0.0 0.0 0.2 0.0Other 6.2 5.7 0.0 0.0 0.0 0.0 0.3 0.2 0.0Mangochi R.D.P.All Maize 100.0 97.8 0.0 0.0 0.0 0.0 1.4 0.6 0.1Hybrid 34.5 33.0 0.0 0.0 0.0 0.0 0.9 0.4 0.1Composite 0.4 0.4 0.0 0.0 0.0 0.0 0.0 0.0 0.0Local pure stand 54.6 54.4 0.0 0.0 0.0 0.0 0.3 0.0 0.0Local/G-nuts 0.7 0.7 0.0 0.0 0.0 0.0 0.0 0.0 0.0Local/Other crop 0.3 0.3 0.0 0.0 0.0 0.0 0.0 0.0 0.0Other 9.5 9.0 0.0 0.0 0.0 0.0 0.2 0.2 0.0Namwera R.D.P.All Maize 100.0 85.5 0.7 0.0 0.3 0.1 2.7 9.1 1.5Hybrid 34.2 22.7 0.7 0.0 0.3 0.1 1.2 8.1 1.0Local pure stand 48.5 46.9 0.0 0.0 0.0 0.0 0.3 0.9 0.5Local/G-nuts 2.5 2.3 0.0 0.0 0.0 0.0 0.1 0.0 0.0Local/Other crop 7.1 7.0 0.0 0.0 0.0 0.0 0.0 0.1 0.0Other 7.7 6.5 0.0 0.0 0.0 0.0 1.2 0.0 0.0Balaka R.D.P.All Maize 100.0 92.8 0.2 0.0 0.0 0.0 1.4 4.8 0.7Hybrid 24.2 18.9 0.0 0.0 0.0 0.0 0.9 3.7 0.7Composite 0.4 0.4 0.0 0.0 0.0 0.0 0.0 0.0 0.0Local pure stand 56.9 55.6 0.2 0.0 0.0 0.0 0.2 0.9 0.0Local/G-nuts 1.8 1.8 0.0 0.0 0.0 0.0 0.0 0.0 0.0Local/Other crop 1.1 1.1 0.0 0.0 0.0 0.0 0.0 0.0 0.0Other 15.5 15.0 0.0 0.0 0.0 0.0 0.3 0.2 0.0Kawinga R.D.P.All Maize 100.0 92.0 0.0 0.0 0.3 0.0 1.2 6.2 0.3Hybrid 26.7 20.0 0.0 0.0 0.2 0.0 1.0 5.1 0.3Local pure stand 61.4 60.4 0.0 0.0 0.0 0.0 0.2 0.8 0.0Local/G-nuts 2.3 2.3 0.0 0.0 0.0 0.0 0.0 0.0 0.0Local/Other crop 4.6 4.6 0.0 0.0 0.0 0.0 0.0 0.0 0.0Other 5.0 4.7 0.0 0.0 0.0 0.0 0.0 0.3 0.0Zomba R.D.P.All Maize 100.0 90.5 0.0 0.0 0.2 0.0 2.0 7.2 0.0Hybrid 28.9 22.2 0.0 0.0 0.1 0.0 1.1 5.5 0.0Composite 0.2 0.1 0.0 0.0 0.0 0.0 0.0 0.1 0.0Local pure stand 56.4 54.6 0.0 0.0 0.1 0.0 0.6 1.0 0.0Local/G-nuts 6.4 6.3 0.0 0.0 0.0 0.0 0.0 0.0 0.0Local/Other crop 6.5 6.0 0.0 0.0 0.0 0.0 0.1 0.4 0.0Other 1.7 1.4 0.0 0.0 0.0 0.0 0.1 0.2 0.0
298/299

TABLE G15.0. Percentage of Maize Plots to which Fertilizer was Applied by Maize Variety for Male Headed Households
Maize Variety Second Application
TotalNone used 20:20:0
Sulphate of Amonia DAP 23:21 0+4S CAN UREA Mixture
Machinga ADDAll Maize 100.0 59.1 2.2 1.1 7.1 2.4 6.4 12.4 9.3Hybrid 32.0 13.9 1.4 0.1 5.5 1.2 2.0 4.1 4.3Composite 0.2 0.1 .0 .0 .0 .0 .0 .0 .0Local Pure Stand 53.3 36.8 0.5 6 1.0 1.0 3.7 6.3 3.6Local/G-nuts 3.9 1.4 .0 .3 .1 .1 .4 .9 .6Local /Other Crop 4.2 2.2 0.1 1 .3 .0 .1 .8 .6Other 6.0 4.7 0.2 0 .2 0 .2 .3 .2Mangochi R.D.PAll Maize 100.0 89.4 1.1 0 1.2 .9 4.2 2.5 .7Hybrid 38.7 32.0 0.7 0 .9 .9 2.1 1.6 .5Composite 0.7 0.7 .0 0 .0 .0 .0 .0 .0Local Pure Stand 50.0 48.1 0.4 0 .0 .0 1.0 .3 .2Local/G-nuts 0.7 0.7 .0 0 .0 .0 .0 .0 .0Local /Other Crop 0.4 0.4 .0 0 .0 .0 .0 .0 .0Other 9.6 7.5 .0 0 .4 .0 1.1 .6 .0Namwera R.D.PAll Maize 100.0 54.0 9.5 0 7.2 8.3 7.8 5.0 8.2Hybrid 40.2 15.5 6.1 0 6.4 4.5 1.7 1.3 4.7Local Pure Stand 44.7 27.5 1.8 0 .7 3.4 4.6 3.4 3.3Local/G-nuts 2.4 1.4 0.2 0 .0 .0 .5 .4 .0Local /Other Crop 5.9 5.3 0.2 0 .0 .0 .2 .0 .2Other 6.7 4.3 1.3 0 .0 .4 .8 .0 .0Balaka R.D.PAll Maize 100.0 84.3 1.1 0 5.1 .6 2.2 4.3 2.4Hybrid 23.1 12.1 .7 0 3.4 .6 1.0 3.4 1.9Composite 0.2 0.2 .0 0 .0 .0 .0 .0 .0Local Pure Stand 58.0 54.5 0.3 0 1.0 .0 1.2 .9 .0Local/G-nuts 1.6 1.6 .0 0 .0 .0 .0 .0 .0Local /Other Crop 0.7 0.7 .0 0 .0 .0 1.2 .0 .0Other 16.3 15.1 .0 0 .7 .0 .0 .0 .5Kawinga R.D.PAll Maize 100.0 65.7 0.8 2.1 8.6 .5 5.5 7.2 9.7Hybrid 30.5 11.2 0.5 .7 6.7 .2 2.6 3.3 5.3Local Pure Stand 58.8 46.4 0.4 .9 1.4 .3 2.3 3.5 3.7Local/G-nuts 2.6 1.8 .0 .0 .0 .0 .6 .1 .2Local /Other Crop 3.7 3.0 .0 .5 .0 .0 .0 .0 .2Other 4.4 3.3 .0 .0 .5 .0 .0 .3 .4ZOMBA R.D.PAll Maize 100.0 39.9 1.3 1.9 9.0 2.3 8.6 22.7 14.4Composite 32.4 9.7 0.7 .1 6.9 .8 2.2 6.3 5.7Hybrid 0.1 .0 0.1 .0 .0 .0 .0 .0 .0Local Pure Stand 53.1 26.1 0.2 1.1 1.2 1.1 5.6 12.0 5.9Local/G-nuts 6.6 1.4 .0 .7 .2 .3 .6 2.0 1.4Local /Other Crop 6.3 1.9 0.2 .0 .7 .0 .2 2.0 1.3Other 1.5 0.9 .0 .1 .0 .0 .0 .3 .2
300/301

TABLE G16.0. Percentage of Maize Plots to which Fertilizer was Applied by Maize Variety for Male Headed Households
Maize Variety Second Application
TotalNone used 20:20:0
Sulphate of Amonia DAP 23:21 0+4S CAN UREA Mixture
Machinga ADDAll Maize 100.0 90.2 .2 .0 .3 .0 2.0 6.7 .6Hybrid 32.0 25.0 .1 .0 .2 .0 1.2 5.6 .4Composite 0.2 .1 .0 .0 .0 .0 .0 .0 .0
Local Pure Stand 53.3 52.0 .1 .0 .1 .0 .4 .6 .1Local/G-nuts 3.9 3.8 .0 .0 .1 .0 .0 .0 .0Local /Other Crop 4.2 3.9 .0 .0 .0 .0 .1 .3 .0Other 6.0 5.5 .0 0 .0 0 .3 .2 .0Mangochi R.D.PAll Maize 100.0 97.6 .0 0 .0 0 1.5 .9 .0Hybrid 38.7 37.0 .0 0 .0 0 1.1 .7 .0Composite 0.7 .7 .0 0 .0 0 .0 .0 .0
Local Pure Stand 50.0 49.6 .0 0 .0 .0 .4 .0 .0Local/G-nuts 0.7 .7 .0 0 .0 .0 .0 .0 .0Local /Other Crop 0.4 .4 .0 0 .0 .0 .0 .0 .0Other 9.6 9.3 .0 0 .0 .0 .0 .3 .0Namwera R.D.PAll Maize 100.0 80.3 1.0 0 .5 .2 3.8 12.1 2.1Hybrid 40.2 24.8 1.0 0 .5 .2 1.7 10.7 1.4
Local Pure Stand 44.7 42.5 .0 0 .0 .0 .4 1.2 .7Local/G-nuts 2.4 2.3 .0 0 .0 .0 .2 .0 .0Local /Other Crop 5.9 5.7 .0 0 .0 .0 .0 .2 .0Other 6.7 5.1 .0 0 .0 .0 1.6 .0 .0Balaka R.D.PAll Maize 100.0 93.7 .3 0 .1 .0 1.8 3.1 1.0Hybrid 23.1 18.6 .0 0 .1 .0 1.0 2.5 1.0Composite 0.2 .2 .0 0 .0 .0 .0 .0 .0
Local Pure Stand 58.0 56.9 .3 0 .0 .0 .3 .4 .0Local/G-nuts 1.6 1.6 .0 0 .0 .0 .0 .0 .0Local /Other Crop 0.7 .7 .0 0 .0 .0 .0 .0 .0Other 16.3 15.6 .0 0 .0 .0 .5 .2 .5Kawinga R.D.PAll Maize 100.0 91.1 .0 .0 .3 .0 1.0 7.1 .5Hybrid 30.5 23.4 .0 .0 .3 .0 .6 5.6 .5
Local Pure Stand 58.8 57.5 .0 .0 .0 .0 .3 .9 .0Local/G-nuts 2.6 2.6 .0 .0 .0 .0 .0 .0 .0Local /Other Crop 3.7 3.7 .0 .0 .0 .0 .0 .0 .0Other 4.4 3.9 .0 .0 .0 .0 .0 .5 .0ZOMBA R.D.PAll Maize 100.0 89.6 .0 .1 .4 .0 2.0 7.8 .1Composite 32.4 24.4 .0 .0 .2 .0 1.3 6.5 .0Hybrid 0.1 .0 .0 .0 .0 .0 .0 .1 .0
Local Pure Stand 53.1 51.8 .0 1 .2 .0 .5 .5 .0Local/G-nuts 6.6 6.5 .0 .0 .0 .0 .0 .1 .1Local /Other Crop 6.3 5.5 .0 .0 .0 .0 .2 .6 .0Other 1.5 1.4 .0 .0 .0 .0 .0 .1 .0
302/303

TABLE G17.0. Percentage of Maize Plots to which Fertilizer was Applied by Maize Variety for Female Headed Households
Maize Variety Second Application
TotalNone used 20:20:0
Sulphate of Amonia DAP 23:21 0+4S CAN UREA Mixture Other
Machinga ADDAll Maize 100.0 74.8 .7 .5 5.5 .5 4.0 9.0 4.8 0.2Hybrid 22.2 12.0 .2 .0 4.0 .3 1.1 2.2 2.1 0.2Composite .2 .2 .0 .0 .0 .0 .0 .0 .0 .0
Local Pure Stand 62.1 51.3 .2 .1 .9 .2 2.3 5.0 2.0 .0Local/G-nuts 3.4 2.4 .0 .0 .2 .0 .4 .4 .2 .0Local /Other Crop 5.4 3.5 .0 .2 .0 .1 1.3 .3 .0Other 6.7 5.4 .3 .1 .4 .0 .1 .1 .4 .0Mangochi R.D.PAll Maize 100.0 93.7 .7 .0 .0 .6 1.9 1.1 2.0 .0Hybrid 26.3 23.1 .0 .0 .0 .6 .9 .8 .9 .0
Local Pure Stand 63.7 62.5 .0 .0 .0 .0 .5 .4 .4 .0Local/G-nuts .8 .8 .0 .0 .0 .0 .0 .0 .0 .0Other 9.2 7.3 .7 .0 .0 .0 .5 .0 .7 .0Namwera R.D.PAll Maize 100.0 68.7 1.6 2.9 2.8 2.0 5.3 9.9 4.8 2.0Hybrid 19.3 7.5 .0 .0 2.8 2.0 .8 1.8 2.5 2.0
Local Pure Stand 57.9 47.8 .0 .0 .0 .0 3.6 5.7 .8 .0Local/G-nuts 2.5 1.6 .0 .0 .0 .0 1.0 .0 .0 .0Local /Other Crop 10.3 5.8 .0 2.0 .0 .0 .0 2.4 .0 .0Other 10.0 6.0 1.6 .9 .0 .0 .0 .0 1.6 .0Balaka R.D.PAll Maize 100.0 85.0 .0 .0 9.6 .0 .6 3.6 1.1 .0Hybrid 26.4 15.5 .0 .0 7.6 .0 .6 2.7 .0 .0Composite .7 .7 .0 .0 .0 .0 .0 .0 .0 .0
Local Pure Stand 54.9 51.6 .0 .0 2.0 .0 .0 .7 .6 .0Local/G-nuts 2.3 2.3 .0 .0 .0 .0 .0 .0 .0 .0Local /Other Crop 1.7 1.5 .0 .0 .0 .0 .0 .2 .0 .0Other 13.9 13.4 .0 .0 .0 .0 .0 .0 .5 .0Kawinga R.D.PAll Maize 100.0 76.8 .0 .7 6.4 .0 3.6 8.8 3.8 .0Hybrid 19.2 9.0 .0 .0 5.2 .0 1.2 2.0 1.9 .0
Local Pure Stand 66.5 56.4 .0 .7 .9 .0 1.9 4.9 1.8 .0Local/G-nuts 1.8 .8 .0 .0 .3 .0 .0 .7 .0 .0Local /Other Crop 6.2 5.1 .0 .0 .0 .0 .5 .6 .0 .0Other 6.3 5.6 .0 .0 .0 .0 .0 .6 .1 .0ZOMBA R.D.PAll Maize 100.0 65.2 1.0 .0 6.0 .5 5.8 13.7 7.7 .0Composite 21.2 9.6 .5 .0 3.8 .0 1.4 2.7 3.2 .0Hybrid .3 .3 .0 .0 .0 .0 .0 .0 .0 .0
Local Pure Stand 63.6 46.3 .5 .0 1.1 .5 3.6 8.2 3.5 .0Local/G-nuts 5.8 3.8 .0 .0 .2 .0 .8 .6 .4 .0Local /Other Crop 7.0 4.0 .0 .0 .0 .0 .0 2.3 .7 .0Other 2.2 1.3 .0 .0 .9 .0 .0 .0 .0 .0
304/305

TABLE G18.0. Percentage of Maize Plots to which Fertilizer was Applied by Maize Variety for Female Headed Households
Maize VarietyTotal None used DAP CAN UREA Mixture
Machinga ADDAll Maize 100.0 93.9 .0 1.4 4.6 .0Hybrid 22.2 18.1 .0 .8 3.2 .0Composite .2 .2 .0 .0 .0 .0Local Pure Stand 62.1 60.5 .0 .3 1.3 .0Local/G-nuts 3.4 3.4 .0 .0 .0 .0Local /Other Crop 5.4 5.4 .0 .0 .0 .0Other 6.7 6.2 .0 .3 .2 .0Mangochi R.D.P .0All Maize 100.0 98.3 .0 1.3 .0 .4Hybrid 26.3 25.3 .0 .6 .0 .4Local Pure Stand 63.7 63.7 .0 .0 .0 .0Local/G-nuts .8 .8 .0 .0 .0 .0Other 9.2 8.5 .0 .7 .0 .0Namwera R.D.P .0All Maize 100.0 98.2 .0 .0 1.8 .0Hybrid 19.3 17.5 .0 .0 1.8 .0Local Pure Stand 57.9 57.9 .0 .0 .0 .0Local/G-nuts 2.5 2.5 .0 .0 .0 .0Local /Other Crop 10.3 10.3 .0 .0 .0 .0Other 10.0 10.0 .0 .0 .0 .0Balaka R.D.P .0All Maize 100.0 91.2 .0 .6 8.2 .0Hybrid 26.4 19.6 .0 .6 6.2 .0Composite .7 .7 .0 .0 .0 .0Local Pure Stand 54.9 52.9 .0 .0 2.0 .0Local/G-nuts 2.3 2.3 .0 .0 .0 .0Local /Other Crop 1.7 1.7 .0 .0 .0 .0Other 13.9 13.9 .0 .0 .0 .0Kawinga R.D.P .0All Maize 100.0 93.7 .0 1.7 4.4 .0Hybrid 19.2 13.5 .0 1.7 4.0 .0Local Pure Stand 66.5 66.0 .0 .0 .4 .0Local/G-nuts 1.8 1.8 .0 .0 .0 .0Local /Other Crop 6.2 6.2 .0 .0 .0 .0Other 6.3 6.3 .0 .0 .0 .0ZOMBA R.D.P .0All Maize 100.0 92.4 .0 2.0 5.7 .0Composite 21.2 17.2 .0 .8 3.2 .0Hybrid .3 .3 .0 .0 .0 .0Local Pure Stand 63.6 60.8 .0 .7 2.1 .0Local/G-nuts 5.8 5.8 .0 .0 .0 .0Local /Other Crop 7.0 7.0 .0 0 .0 .0Other 2.2 1.3 .0 .5 .4 .0
First Application
306
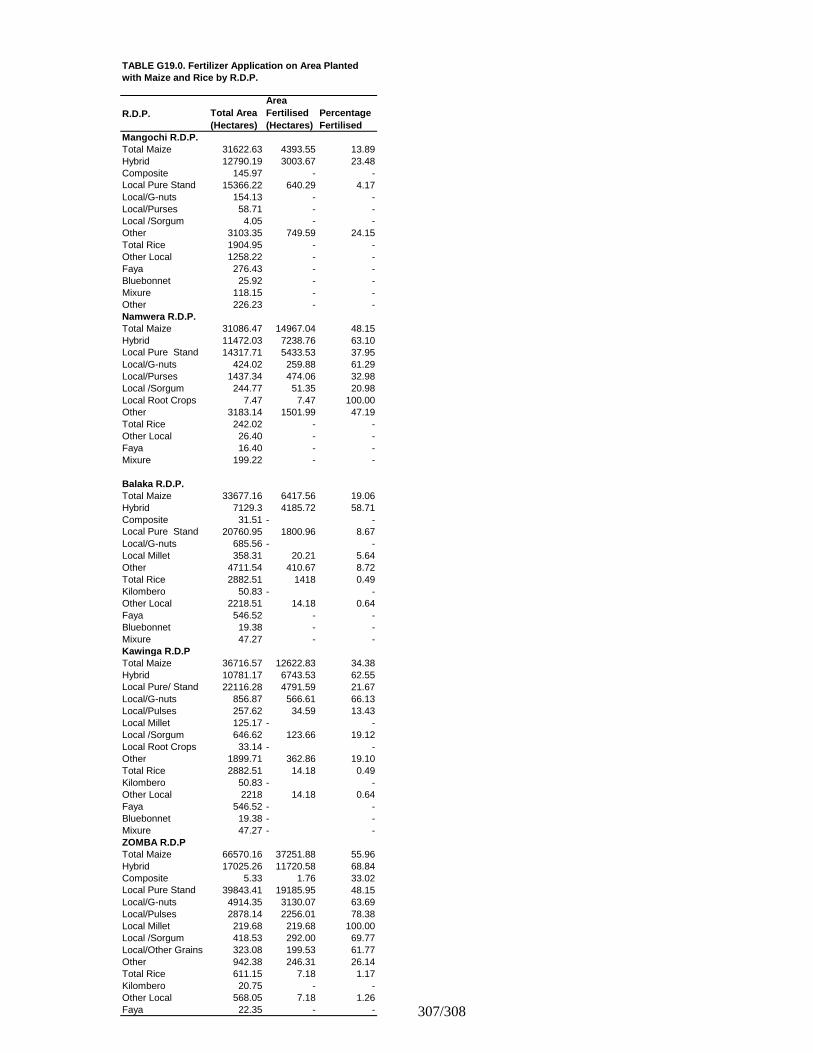
TABLE G19.0. Fertilizer Application on Area Plantedwith Maize and Rice by R.D.P.
R.D.P. Total Area (Hectares)
Area Fertilised (Hectares)
Percentage Fertilised
Mangochi R.D.P.Total Maize 31622.63 4393.55 13.89Hybrid 12790.19 3003.67 23.48Composite 145.97 - -Local Pure Stand 15366.22 640.29 4.17Local/G-nuts 154.13 - -Local/Purses 58.71 - -Local /Sorgum 4.05 - -Other 3103.35 749.59 24.15Total Rice 1904.95 - -Other Local 1258.22 - -Faya 276.43 - -Bluebonnet 25.92 - -Mixure 118.15 - -Other 226.23 - -Namwera R.D.P.Total Maize 31086.47 14967.04 48.15Hybrid 11472.03 7238.76 63.10Local Pure Stand 14317.71 5433.53 37.95Local/G-nuts 424.02 259.88 61.29Local/Purses 1437.34 474.06 32.98Local /Sorgum 244.77 51.35 20.98Local Root Crops 7.47 7.47 100.00Other 3183.14 1501.99 47.19Total Rice 242.02 - -Other Local 26.40 - -Faya 16.40 - -Mixure 199.22 - -
Balaka R.D.P.Total Maize 33677.16 6417.56 19.06Hybrid 7129.3 4185.72 58.71Composite 31.51 - -Local Pure Stand 20760.95 1800.96 8.67Local/G-nuts 685.56 - -Local Millet 358.31 20.21 5.64Other 4711.54 410.67 8.72Total Rice 2882.51 1418 0.49Kilombero 50.83 - -Other Local 2218.51 14.18 0.64Faya 546.52 - -Bluebonnet 19.38 - -Mixure 47.27 - -Kawinga R.D.PTotal Maize 36716.57 12622.83 34.38Hybrid 10781.17 6743.53 62.55Local Pure/ Stand 22116.28 4791.59 21.67Local/G-nuts 856.87 566.61 66.13Local/Pulses 257.62 34.59 13.43Local Millet 125.17 - -Local /Sorgum 646.62 123.66 19.12Local Root Crops 33.14 - -Other 1899.71 362.86 19.10Total Rice 2882.51 14.18 0.49Kilombero 50.83 - -Other Local 2218 14.18 0.64Faya 546.52 - -Bluebonnet 19.38 - -Mixure 47.27 - -ZOMBA R.D.PTotal Maize 66570.16 37251.88 55.96Hybrid 17025.26 11720.58 68.84Composite 5.33 1.76 33.02Local Pure Stand 39843.41 19185.95 48.15Local/G-nuts 4914.35 3130.07 63.69Local/Pulses 2878.14 2256.01 78.38Local Millet 219.68 219.68 100.00Local /Sorgum 418.53 292.00 69.77Local/Other Grains 323.08 199.53 61.77Other 942.38 246.31 26.14Total Rice 611.15 7.18 1.17Kilombero 20.75 - -Other Local 568.05 7.18 1.26Faya 22.35 - - 307/308

TABLE G20.0. Fertilizer Application on Area Planted withwith Maize and Rice for Male Headed Household by R.D.P.
R.D.P.Total Area (Hectares)
Area Fertilised (Hectares)
Percentage Fertilised
Mangochi R.D.P.Total Maize 22485.39 3621.38 16.11Hybrid 10543.07 2552.81 24.21Composite 145.97 - -Local PureStand 9602.48 471.63 4.91Local/G-nuts 94.61 - -Local/Purses 773.75 - -Local /Sorgum 4.05 - -Other 2036.50 596.95 29.31Total Rice 1323.35 - -Other Local 999.24 - -Faya 190.48 - -Mixure 48.34 - -Other 85.29 - -Namwera R.D.P.Total Maize 23310.53 11919.66 51.13Hybrid 9869.49 6410.68 64.95LocalPure Stand 10025.42 4254.86 42.44Local/G-nuts 337.97 205.12 60.69Local/Purses 773.75 - -Local /Sorgum 244.77 51.35 20.98Local Root Crops 7.47 7.47 100.00Other 2051.68 990.18 48.26Total Rice 242.02 - -Other Local 26.40 - -Faya 16.40 - -Mixure 199.22 - -Balaka R.D.P.Total Maize 23200.45 4214.62 18.17Hybrid 4688.50 2790.72 59.52Composite 4.21 - -Local Pure Stand 14489.63 1087.15 7.50Local/G-nuts 386.12 - -Local Millet 163.80 - -Other 3468.52 336.75 9.71Total Rice 2136.26 14.18 0.66Kilombero 15.73 - -Other Local 1722.38 14.18 0.82Faya 362.13 - -Bluebonnet 1.44 - -Mixure 34.58 - -
continued…
309

TABLE G20.0. Fertilizer Application on Area Planted withwith Maize and Rice for Male Headed Household by R.D.P.
R.D.P.Total Area (Hectares)
Area Fertilised (Hectares)
Percentage Fertilised
Kawinga R.D.PTotal Maize 25260.77 9307.97 36.85Hybrid 8190.76 5190.46 63.37Local Pure/ Stand 14717.51 3521.07 23.92Local/G-nuts 504.74 259.63 51.44Local/Pulses 161.83 34.59 21.37Local Millet 61.00 - -Local /Sorgum 240.99 7.40 3.07Local Root Crop 26.10 - -Other 1357.84 294.82 21.71Total Rice 2136.26 14.18 0.66Kilombero 15.73 - -Other Local 1722.38 14.18 0.82Faya 362.13 - -Bluebonnet 1.44 - -Mixure 34.58 - -ZOMBA R.D.PTotal Maize 45683.00 30504.79 64.48Hybrid 13016.29 9405.75 72.26Composite 1.76 1.76 100.00Local Pure Stand 26817.83 15846.28 59.09Local/G-nuts 3338.10 2692.83 80.67Local/Pulses 2206.30 1843.60 83.56Local Millet 132.87 132.87 100.00Local /Sorgum 311.47 292.00 93.75Local/Other Grains 245.21 199.53 81.37Other 513.18 90.17 17.57Total Rice 354.25 7.18 2.03Kilombero 13.83 - -Other Local 320.18 7.18 2.24Faya 20.23 - -
310
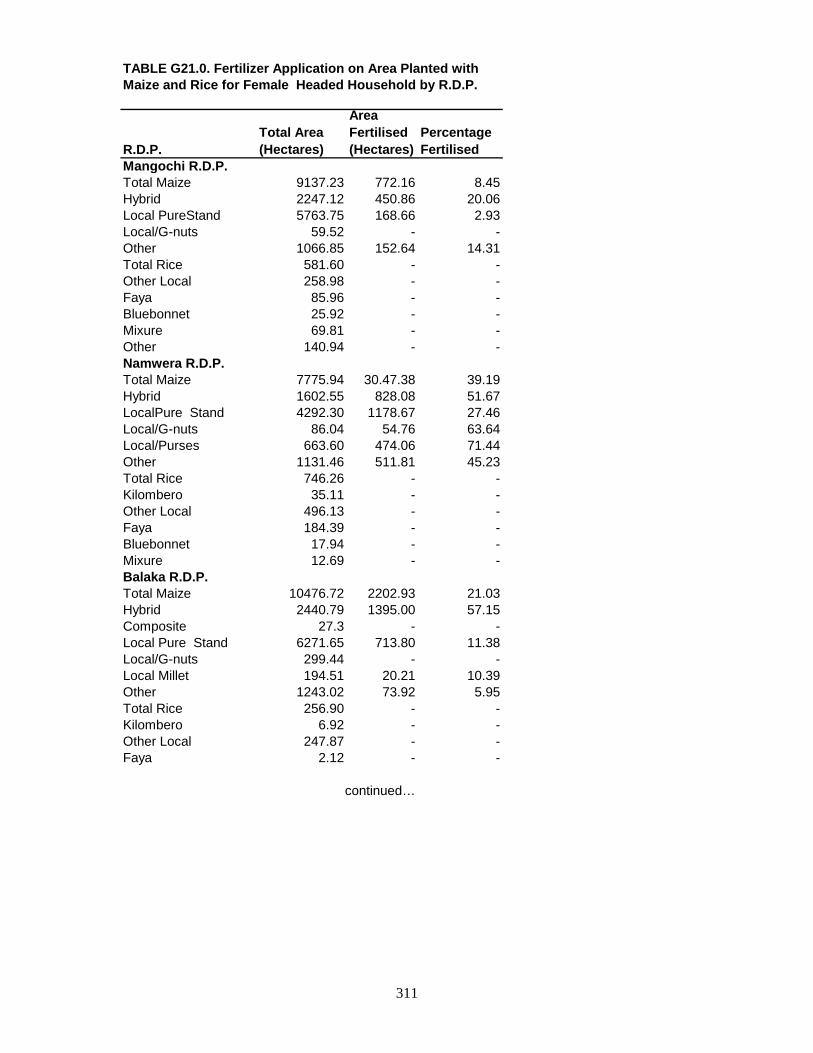
TABLE G21.0. Fertilizer Application on Area Planted withMaize and Rice for Female Headed Household by R.D.P.
R.D.P.Total Area (Hectares)
Area Fertilised (Hectares)
Percentage Fertilised
Mangochi R.D.P.Total Maize 9137.23 772.16 8.45Hybrid 2247.12 450.86 20.06Local PureStand 5763.75 168.66 2.93Local/G-nuts 59.52 - -Other 1066.85 152.64 14.31Total Rice 581.60 - -Other Local 258.98 - -Faya 85.96 - -Bluebonnet 25.92 - -Mixure 69.81 - -Other 140.94 - -Namwera R.D.P.Total Maize 7775.94 30.47.38 39.19Hybrid 1602.55 828.08 51.67LocalPure Stand 4292.30 1178.67 27.46Local/G-nuts 86.04 54.76 63.64Local/Purses 663.60 474.06 71.44Other 1131.46 511.81 45.23Total Rice 746.26 - -Kilombero 35.11 - -Other Local 496.13 - -Faya 184.39 - -Bluebonnet 17.94 - -Mixure 12.69 - -Balaka R.D.P.Total Maize 10476.72 2202.93 21.03Hybrid 2440.79 1395.00 57.15Composite 27.3 - -Local Pure Stand 6271.65 713.80 11.38Local/G-nuts 299.44 - -Local Millet 194.51 20.21 10.39Other 1243.02 73.92 5.95Total Rice 256.90 - -Kilombero 6.92 - -Other Local 247.87 - -Faya 2.12 - -
continued…
311

TABLE G21.0. Fertilizer Application on Area Planted withMaize and Rice for Female Headed Household by R.D.P.
R.D.P.Total Area (Hectares)
Area Fertilised (Hectares)
Percentage Fertilised
Kawinga R.D.PTotal Maize 11455.80 3314.86 28.94Hybrid 2590.40 1553.07 59.95Local Pure/ Stand 7398.77 1270.52 17.17Local/G-nuts 352.13 306.97 87.18Local/Pulses 95.78 - -Local Millet 64.17 - -Local /Sorgum 405.64 116.26 28.66Local Root Crop 7.04 - -Other 541.87 68.04 12.56Total Rice 746.26 - -Kilombero 35.11 - -Other Local 496.13 - -Faya 184.36 - -Bluebonnet 17.94 - -Mixure 12.69 - -ZOMBA R.D.PTotal Maize 19987.16 6747.09 33.76Hybrid 4008.97 2314.82 57.74Composite 3.57 - -Local Pure Stand 13025.58 3339.67 25.64Local/G-nuts 1576.26 437.25 27.74Local/Pulses 671.84 412.41 61.39Local Millet 86.81 86.81 100.00Local /Sorgum 107.07 - -Local/Other Grains 77.87 - -Other 429.21 156.14 36.38Total Rice 256.90 - -Kilombero 6.92 - -Other Local 247.87 - -Faya 2.12 - -
312

TABLE G22.0. Percentage of Plots to which Fertilizer was Applied by Sex of Household Head and Source of Financing
A.D.D./R.D.P. Source of Financing Fertilizer
TotalNone used Cash Credit Combination Gift Other
Machinga A.D.D.Total 100.0 68.9 16.2 12.6 0.6 1.2 0.5
Male 68.7 44.2 12.8 10.3 0.5 0.6 0.3Female 31.3 24.7 3.4 2.3 0.1 0.6 0.2
Mangochi R.D.P.Total 100.0 92.3 3.6 3.2 0.2 0.5 0.2
Male 65.7 60.3 3.1 1.7 0.2 0.1 0.2Female 34.3 32.0 0.4 1.5 0.0 0.4 0.0
Namwera R.D.P.Total 100.0 62.3 16.9 16.8 0.8 2.8 0.4
Male 74.8 44.2 13.7 14.9 0.8 1.0 0.1Female 25.2 18.1 3.2 1.8 0.0 1.8 0.3
Balaka R.D.PTotal 100.0 86.9 2.7 10.0 0.0 0.3 0.1
Male 66.9 58.0 1.9 6.9 0.0 0.1 0.0Female 33.1 28.8 0.9 3.1 0.0 0.1 0.1
Kawinga R.D.P.Total 100.0 77.4 12.2 9.3 0.2 0.7 0.2
Male 65.9 48.9 9.2 7.0 0.2 0.5 0.0Female 34.1 28.5 3.0 2.3 0.0 0.2 0.2
Zomba R.D.P.Total 100.0 52.9 26.9 16.7 1.0 1.4 1.0
Male 69.7 31.7 21.3 14.2 0.9 0.9 0.7Female 30.3 21.2 5.7 2.5 0.2 0.6 0.2
313

TABLE G23.0. Cropping pattern by R.D.P. (Thousand Hectares)
CropMachinga A.D.D.
Mangochi R.D.P.
Namwera R.D.P.
Balaka R.D.P.
Kawinga R.D.P.
Zomba R.D.P.
Total Maize 199.68 31.62 31.08 33.67 36.72 66.59Hybrid 59.20 12.79 11.47 7.13 10.78 17.03Composite 0.18 0.15 - 0.03 - 0.00Local pure stand 112.41 15.36 14.32 20.76 22.12 39.85Local/G-nuts 7.04 0.15 0.43 0.69 0.85 4.92Local/Pulses 4.63 0.06 1.43 - 0.26 2.88Local/millet 0.69 - - 0.35 0.12 0.22Local/sorghum 1.31 0.00 0.24 - 0.65 0.42Local/other Grains 0.33 - - - - 0.33Local/Root crops 0.05 - 0.01 - 0.04 -Other 13.84 3.11 3.18 4.71 1.90 0.94
Total G/nut 9.54 0.42 1.34 1.01 1.20 5.57Chalimbana 6.91 0.42 1.14 0.55 0.66 4.15Manipinta 0.35 - - - 0.01 0.34malimba 0.47 - - - 0.04 0.43Chitembana 0.03 - - 0.03 - -Other local variety 1.16 - 0.07 0.40 0.17 0.52Mixture 0.34 - 0.13 0.03 0.06 0.12Other/unknown 0.26 - - - 0.26 -
Total Rice 5.66 1.92 0.25 - 2.88 0.61Kilombera 0.08 - - - 0.06 0.02Other local variety 4.08 1.26 0.03 - 2.22 0.57Faya 0.86 0.28 0.02 - 0.54 0.02Bluebonet 0.05 0.03 - - 0.02 -Mixture 0.36 0.12 0.20 - 0.04 -Other 0.23 0.23 - - - -
Total Pulses 10.67 0.11 5.20 0.09 0.82 4.45Soya beans 0.03 - - 0.01 - 0.02Mixed beans 3.98 - 3.50 - - 0.48Pegion peas 1.86 - 0.04 0.02 0.41 1.39white haricot 0.22 - - - - 0.22Dolichos beans 0.09 - 0.09 - 0.00 -Other 4.49 0.11 1.57 0.06 0.41 2.34
Total millet 1.58 0.00 0.09 0.48 0.37 0.64Finger 0.91 0.00 0.01 0.48 - 0.42Bullrush 0.51 - 0.05 - 0.37 0.09Mixture 0.13 - - - 0.00 0.13Other 0.03 - 0.03 - - -
Total sorghum 2.85 0.13 0.81 0.02 1.02 0.87Local 2.73 0.13 0.81 0.02 0.90 0.87
Brewing Sorghum 0.12 - - 0.00 0.12 -Sunflower 0.66 - - 0.07 - 0.59Cassava 3.38 0.43 0.35 0.12 0.42 2.06Sweet potatoes 2.27 0.22 0.49 0.19 0.74 0.63Cotton 6.05 0.94 - 3.60 0.81 0.70
Total Tobacco 5.12 0.17 1.18 0.01 0.47 3.30Dark fired 0.31 - - - - 0.31Burley 3.70 0.17 1.18 0.01 0.46 1.87Flue cured 0.05 - - - - 0.05Oriental 0.01 - - - 0.01 -Other 1.07 - - - - 1.07 314
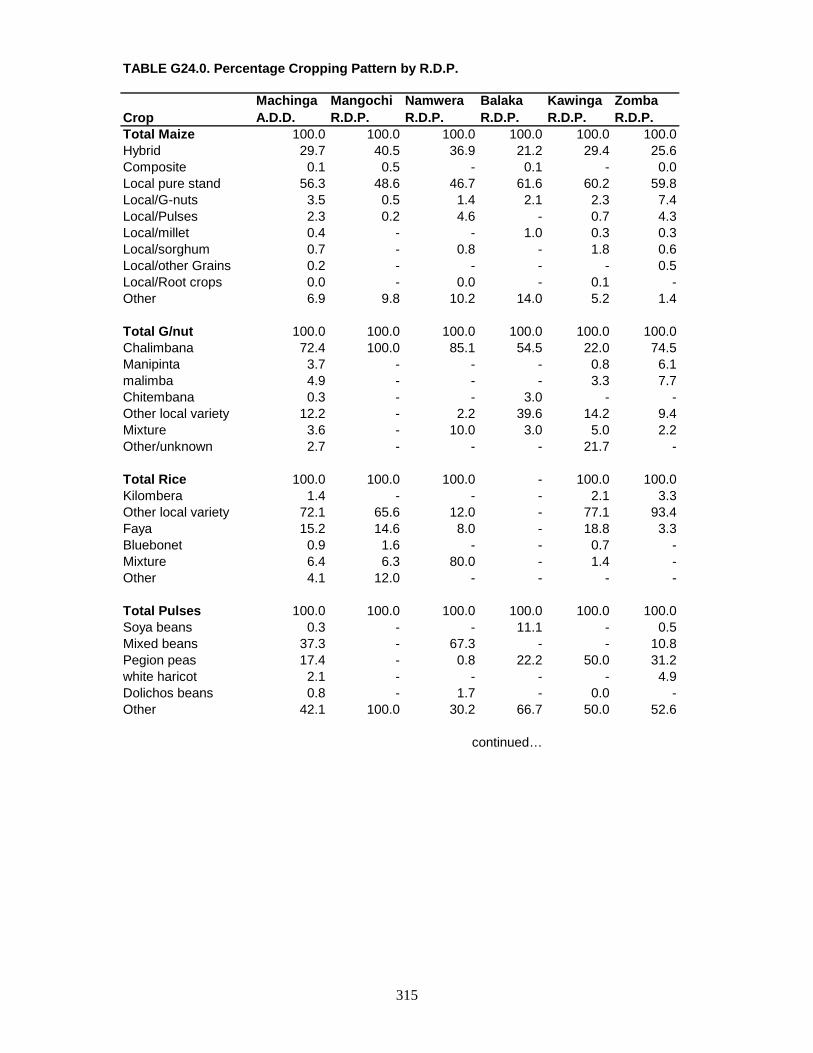
TABLE G24.0. Percentage Cropping Pattern by R.D.P.
CropMachinga A.D.D.
Mangochi R.D.P.
Namwera R.D.P.
Balaka R.D.P.
Kawinga R.D.P.
Zomba R.D.P.
Total Maize 100.0 100.0 100.0 100.0 100.0 100.0Hybrid 29.7 40.5 36.9 21.2 29.4 25.6Composite 0.1 0.5 - 0.1 - 0.0Local pure stand 56.3 48.6 46.7 61.6 60.2 59.8Local/G-nuts 3.5 0.5 1.4 2.1 2.3 7.4Local/Pulses 2.3 0.2 4.6 - 0.7 4.3Local/millet 0.4 - - 1.0 0.3 0.3Local/sorghum 0.7 - 0.8 - 1.8 0.6Local/other Grains 0.2 - - - - 0.5Local/Root crops 0.0 - 0.0 - 0.1 -Other 6.9 9.8 10.2 14.0 5.2 1.4
Total G/nut 100.0 100.0 100.0 100.0 100.0 100.0Chalimbana 72.4 100.0 85.1 54.5 22.0 74.5Manipinta 3.7 - - - 0.8 6.1malimba 4.9 - - - 3.3 7.7Chitembana 0.3 - - 3.0 - -Other local variety 12.2 - 2.2 39.6 14.2 9.4Mixture 3.6 - 10.0 3.0 5.0 2.2Other/unknown 2.7 - - - 21.7 -
Total Rice 100.0 100.0 100.0 - 100.0 100.0Kilombera 1.4 - - - 2.1 3.3Other local variety 72.1 65.6 12.0 - 77.1 93.4Faya 15.2 14.6 8.0 - 18.8 3.3Bluebonet 0.9 1.6 - - 0.7 -Mixture 6.4 6.3 80.0 - 1.4 -Other 4.1 12.0 - - - -
Total Pulses 100.0 100.0 100.0 100.0 100.0 100.0Soya beans 0.3 - - 11.1 - 0.5Mixed beans 37.3 - 67.3 - - 10.8Pegion peas 17.4 - 0.8 22.2 50.0 31.2white haricot 2.1 - - - - 4.9Dolichos beans 0.8 - 1.7 - 0.0 -Other 42.1 100.0 30.2 66.7 50.0 52.6
continued…
315

TABLE G24.0. Percentage Cropping Pattern by R.D.P.
CropMachinga A.D.D.
Mangochi R.D.P.
Namwera R.D.P.
Balaka R.D.P.
Kawinga R.D.P.
Zomba R.D.P.
Total millet 100.0 0.0 100.0 100.0 100.0 100.0Finger 57.6 0.0 11.1 100.0 - 65.6Bullrush 32.3 - 55.6 - 100.0 14.1Mixture 8.2 - - - 0.0 20.3Other 1.9 - 33.3 - - -
Total sorghum 100.0 100.0 100.0 100.0 100.0 100.0Local 95.8 100.0 100.0 100.0 88.2 100.0Brewing Sorghum 4.2 - - 0.0 11.8 -Sunflower 100.0 - - 100.0 - 100.0Cassava 100.0 100.0 100.0 100.0 100.0 100.0Sweet potatoes 100.0 100.0 100.0 100.0 100.0 100.0Mixture 100.0 - - - - 100.0Cotton 100.0 100.0 - 100.0 100.0 100.0
Total Tobacco 100.0 100.0 100.0 100.0 100.0 100.0Dark fired 6.1 - - - - 9.4Burley 72.3 100.0 100.0 100.0 97.9 56.7Flue cured 1.0 - - - - 1.5Oriental 0.2 - - - 2.1 -Other 20.9 - - - - 32.4
316

TABLE G25.0. Cropping Pattern for Male Headed Households by R.D.P.(Thousand Hectares)
CropMachinga A.D.D.
Mangochi R.D.P.
Namwera R.D.P.
Balaka R.D.P.
Kawinga R.D.P.
Zomba R.D.P.
Total Maize 140.84 22.48 23.31 23.20 25.26 46.59Hybrid 46.31 10.54 9.87 4.69 8.19 13.02Composite 0.15 0.15 - 0.00 - 0.00Local pure stand 75.66 9.60 10.03 14.49 14.72 26.82
Local/G-nuts 4.66 0.09 0.34 0.39 0.50 3.34Local/pulses 3.20 0.06 0.77 - 0.16 2.21Local/millet 0.35 - - 0.16 0.06 0.13Local/sorghum 0.79 0.00 0.24 - 0.24 0.31Local/other Grains 0.25 - - - - 0.25Local/Root crops 0.04 - 0.01 - 0.03 -Other 9.43 2.04 2.05 3.47 1.36 0.51
Total G/nuts 6.79 0.30 1.24 0.55 0.79 3.91Chalimbana 5.15 0.30 1.11 0.30 0.52 2.92Manipinta 0.31 - - - 0.01 0.30Malimba 0.36 - - - 0.03 0.33Chitembana 0.03 - - 0.03 - -Other local variety 0.67 - 0.07 0.19 0.17 0.24Mixture 0.27 - 0.06 0.03 0.06 0.12
Total Rice 4.06 1.33 0.25 - 2.13 0.35Kilombera 0.03 - - - 0.02 0.01Other local variety 3.07 1.00 0.03 - 1.72 0.32Faya 0.59 0.19 0.02 - 0.36 0.02Bleubonnet 0.00 - - - 0.00 -Mixture 0.28 0.05 0.20 - 0.03 -Other 0.09 0.09 - - - -
Total pulses 6.61 0.11 2.53 0.01 0.71 3.25Soya beans 0.02 - - - - 0.02Mixed beans 1.70 - 1.60 - - 0.10Pegion peas 1.56 - 0.04 0.01 0.36 1.15White haricot 0.06 - - - - 0.06Dolichos beans 0.07 - 0.07 - 0.00 -Other 3.20 0.11 0.82 0.00 0.35 1.92
Total millet 0.94 0.00 0.09 0.17 0.15 0.53Finger 0.51 0.00 0.01 0.17 - 0.33Bullrush 0.27 - 0.05 - 0.15 0.07Mixture 0.13 - - - 0.00 0.13Other 0.03 - 0.03 - - -
Total sorgthum 1.89 0.11 0.75 0.00 0.40 0.63Local 1.88 0.11 0.75 - 0.39 0.63Brewing millet 0.01 - - 0.00 0.01 -Sunflower 0.58 - - 0.07 - 0.51Cassava 2.62 0.38 0.35 0.12 0.25 1.52Sweet potatoes 1.58 0.19 0.42 0.13 0.38 0.46Cotton 4.75 0.77 - 2.90 0.66 0.42
Total Tobacco 4.59 - 1.18 0.00 0.44 2.97Dark fired 0.31 - - - - 0.31Burley 3.17 - 1.18 0.00 0.44 1.55Flue cured 0.05 - - - - 0.05Oriental 0.01 - - - 0.01 -Other 1.07 - - - - 1.07 317
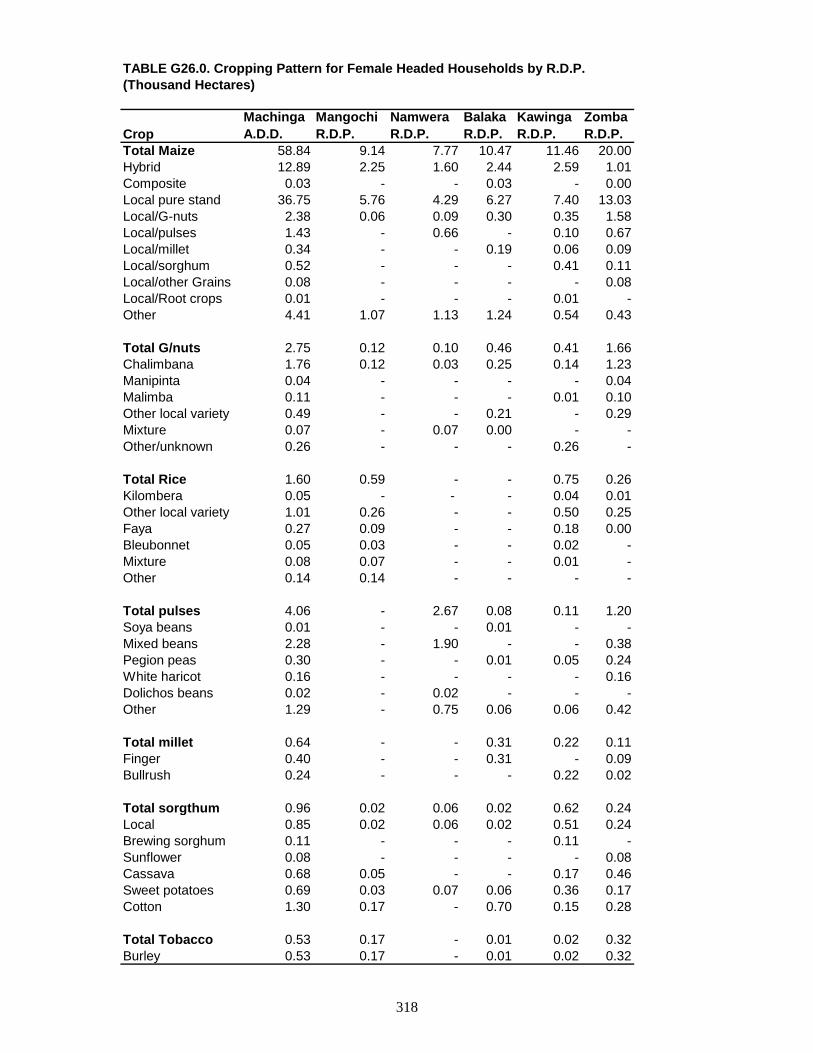
TABLE G26.0. Cropping Pattern for Female Headed Households by R.D.P. (Thousand Hectares)
CropMachinga A.D.D.
Mangochi R.D.P.
Namwera R.D.P.
Balaka R.D.P.
Kawinga R.D.P.
Zomba R.D.P.
Total Maize 58.84 9.14 7.77 10.47 11.46 20.00Hybrid 12.89 2.25 1.60 2.44 2.59 1.01Composite 0.03 - - 0.03 - 0.00Local pure stand 36.75 5.76 4.29 6.27 7.40 13.03Local/G-nuts 2.38 0.06 0.09 0.30 0.35 1.58Local/pulses 1.43 - 0.66 - 0.10 0.67Local/millet 0.34 - - 0.19 0.06 0.09Local/sorghum 0.52 - - - 0.41 0.11Local/other Grains 0.08 - - - - 0.08Local/Root crops 0.01 - - - 0.01 -Other 4.41 1.07 1.13 1.24 0.54 0.43
Total G/nuts 2.75 0.12 0.10 0.46 0.41 1.66Chalimbana 1.76 0.12 0.03 0.25 0.14 1.23Manipinta 0.04 - - - - 0.04Malimba 0.11 - - - 0.01 0.10Other local variety 0.49 - - 0.21 - 0.29Mixture 0.07 - 0.07 0.00 - -Other/unknown 0.26 - - - 0.26 -
Total Rice 1.60 0.59 - - 0.75 0.26Kilombera 0.05 - - - 0.04 0.01Other local variety 1.01 0.26 - - 0.50 0.25Faya 0.27 0.09 - - 0.18 0.00Bleubonnet 0.05 0.03 - - 0.02 -Mixture 0.08 0.07 - - 0.01 -Other 0.14 0.14 - - - -
Total pulses 4.06 - 2.67 0.08 0.11 1.20Soya beans 0.01 - - 0.01 - -Mixed beans 2.28 - 1.90 - - 0.38Pegion peas 0.30 - - 0.01 0.05 0.24White haricot 0.16 - - - - 0.16Dolichos beans 0.02 - 0.02 - - -Other 1.29 - 0.75 0.06 0.06 0.42
Total millet 0.64 - - 0.31 0.22 0.11Finger 0.40 - - 0.31 - 0.09Bullrush 0.24 - - - 0.22 0.02
Total sorgthum 0.96 0.02 0.06 0.02 0.62 0.24Local 0.85 0.02 0.06 0.02 0.51 0.24Brewing sorghum 0.11 - - - 0.11 -Sunflower 0.08 - - - - 0.08Cassava 0.68 0.05 - - 0.17 0.46Sweet potatoes 0.69 0.03 0.07 0.06 0.36 0.17Cotton 1.30 0.17 - 0.70 0.15 0.28
Total Tobacco 0.53 0.17 - 0.01 0.02 0.32Burley 0.53 0.17 - 0.01 0.02 0.32
318

TABLE G27.0. Production for Selected Crops by R.D.P. (Thousand Tonnes)
Machinga A.D.D.
Mangochi R.D.P.
Namwera R.D.P.
Balaka R.D.P.
Kawinga R.D.P.
Zomba R.D.P.
Total Maize 274.386 50.09 37.84 46.05 34.94 105.46Hybrid 110.10 25.64 22.87 13.80 13.33 34.46Composite 0.49 0.37 - 0.12 - 0.00Local pure stand 146.21 23.76 12.13 31.11 20.39 58.82Local/G-nuts 9.07 0.18 0.25 0.86 1.02 6.76Local/pulses 7.90 0.14 2.59 - 0.16 5.01Local/millet 0.61 - - 0.16 0.04 0.41Local/sorghum 0.00 0.00 0.00 - 0.00 0.00Local/other grains 0.00 - - - - 0.00Local/root crops 0.00 - 0.00 - 0.00 -Other 0.00 0.00 0.00 0.00 0.00 0.00
Total G/nuts 2.95 0.32 0.49 0.09 0.37 1.68Chalimbana 2.24 0.32 0.45 0.08 0.26 1.13Manipinta 0.03 - - - 0.00 0.03Malimba 0.14 - - - 0.03 0.11Chitembana - - - - - -Other local variety 0.46 - 0.00 - 0.05 0.41Mixture 0.08 - 0.04 0.01 0.03 -Other /Unknown - - - - - -
Total Rice 10.47 4.17 0.27 - 4.96 1.07Kilombera 0.16 - - - 0.13 0.03Other local 8.30 2.63 0.03 - 4.62 1.02Faya 0.71 0.59 0.02 - 0.08 0.02Bluebonnet 0.12 0.05 - - 0.07 -Mixture 0.61 0.33 0.22 - 0.06 -Other local 0.57 0.57 - - - -
Total pulses 10.75 1.20 3.73 0.05 0.44 5.33Soya beans 0.00 - - 0.00 - 0.00Mixed Beans 2.98 - 2.51 - - 0.47Pegion Peas 0.32 - 0.01 0.00 0.01 0.30White haricot 0.07 - - - - 0.07Dolichos Beans 0.04 - 0.04 - 0.00 -Other 7.34 1.20 1.17 0.05 0.43 4.49
Total Millet 0.56 0.00 0.08 0.04 0.21 0.23Finger 0.24 0.00 0.00 0.04 - 0.20Bullrush 0.32 - 0.08 - 0.21 0.03Mixture 0.00 - - - 0.00 0.00
Total Sorghum 1.54 0.13 0.38 0.01 0.64 0.38Local 1.49 0.13 0.38 0.01 0.59 0.38Brewing Sorghum 0.05 - - 0.00 0.05 -
Sunflower 0.42 - - 0.08 - 0.34
319

TABLE G28.0. Production for Selected Crops for Male Households by R.D.P. (Thousand Tonnes)
CropMachinga A.D.D.
Mangochi R.D.P.
Namwera R.D.P.
Balaka R.D.P.
Kawinga R.D.P.
Zomba R.D.P.
Total Maize 205.20 36.65 33.21 34.66 23.80 76.88Hybrid 92.45 21.21 21.59 10.44 10.36 28.85Composite 0.37 0.37 - 0.00 - 0.00Local pure stand 100.89 14.84 9.85 23.58 13.16 39.46Local/G-nuts 5.70 0.09 0.21 0.64 0.23 4.53Local/pulses 5.56 0.14 1.56 - 0.04 3.82Local/millet 0.23 - - 0.00 0.01 0.22Local/sorghum 0.00 0.00 0.00 - 0.00 0.00Local/other grains 0.00 - - - - 0.00Local/root crops 0.00 - 0.00 - 0.00 -Other 0.00 0.00 0.00 0.00 0.00 0.00
Total G/nuts 2.04 0.25 0.47 0.06 0.34 0.92Chalimbana 1.63 0.25 0.45 0.05 0.24 0.64Manipinta 0.02 - - - 0.00 0.02Malimba 0.12 - - - 0.02 0.10Chitembana - - - - - -Other local variety 0.21 - 0.00 - 0.05 0.16Mixture 0.06 - 0.02 0.01 0.03 -
Total Rice 7.11 2.59 0.27 - 3.57 0.68Kilombera 0.05 - - - 0.03 0.02Other local 5.93 1.79 0.03 - 3.46 0.65Faya 0.42 0.36 0.02 - 0.03 0.01Bluebonnet 0.00 - - - 0.00 -Mixture 0.38 0.11 0.22 - 0.05 -Other local 0.33 0.33 - - - -
Total pulses 8.55 1.20 2.15 0.00 0.37 4.83Soya beans 0.00 - - - - 0.00Mixed Beans 1.53 - 1.47 - - 0.06Pegion Peas 0.27 - 0.01 0.00 0.00 0.26White haricot 0.03 - - - - 0.03Dolichos Beans 0.03 - 0.03 - 0.00 -Other 6.69 1.20 0.64 0.00 0.37 4.48
Total Millet 0.38 0.00 0.08 0.00 0.08 0.22Finger 0.20 0.00 0.00 0.00 - 0.20Bullrush 0.18 - 0.08 - 0.08 0.02Mixture 0.00 - - - 0.00 0.00Other 0.00 - 0.00 - - -
Total Sorghum 0.08 0.37 - 0.18 0.25Local 0.88 0.08 0.37 - 0.18 0.25Brewing Sorghum 0.88 - - 0.00 0.00 -
Sunflower 0.37 - - 0.08 - 0.29
320

TABLE G29.0. Production for Selected Crops for Female Headed Households by R.D.P. (Thousand Tonnes)
CropMachinga A.D.D.
Mangochi R.D.P.
Namwera R.D.P.
Balaka R.D.P.
Kawinga R.D.P.
Zomba R.D.P.
Total Maize 69.18 13.44 4.63 11.39 11.14 28.58Hybrid 17.65 4.43 1.28 3.36 2.97 5.61Composite 0.12 - - 0.12 - 0.00Local pure stand 45.32 8.92 2.28 7.53 7.23 19.36Local/G-nuts 3.37 0.09 0.04 0.22 0.79 2.23Local/pulses 2.34 - 1.03 - 0.12 1.19Local/millet 0.38 - - 0.16 0.03 0.19Local/sorghum 0.00 - - - 0.00 0.00Local/other grains 0.00 - - - - 0.00Local/root crops 0.00 - - - 0.00 -Other 0.00 0.00 0.00 0.00 0.00 0.00
Total G/nuts 0.91 0.07 0.02 0.03 0.03 0.76Chalimbana 0.61 0.07 0.00 0.03 0.02 0.49Manipinta 0.01 - - - - 0.01Malimba 0.02 - - - 0.01 0.01Other local variety 0.25 - - - - 0.25Mixture 0.02 - 0.02 0.00 - -Other /unknown - - - - - -Total Rice 3.36 4.58 - - 1.39 0.39Kilombera 0.11 - - - 0.10 0.01Other local 2.37 0.84 - - 1.16 0.37Faya 0.29 0.23 - - 0.05 0.01Bluebonnet 0.12 0.05 - - 0.07 -Mixture 0.23 0.22 - - 0.01 -Other local 0.24 0.24 - - - -
Total pulses 2.20 - 1.58 0.05 0.07 0.50Soya beans 0.00 - - 0.00 - -Mixed Beans 1.45 - 1.04 - - 0.41Pegion Peas 0.05 - - 0.00 0.01 0.04White haricot 0.04 - - - - 0.04Dolichos Beans 0.01 - 0.01 - - -Other 0.65 - 0.53 0.05 0.06 0.01
Total Millet 0.18 - - 0.04 0.13 0.01Finger 0.04 - - 0.04 - 0.01Bullrush 0.14 - - - 0.13 0.00
Total Sorghum 0.66 0.05 0.01 0.01 0.46 0.01Local 0.61 0.05 0.01 0.01 0.41 0.13Brewing Sorghum 0.05 - - - 0.05 0.13
-Sunflower 0.05 - - - - 0.05
321
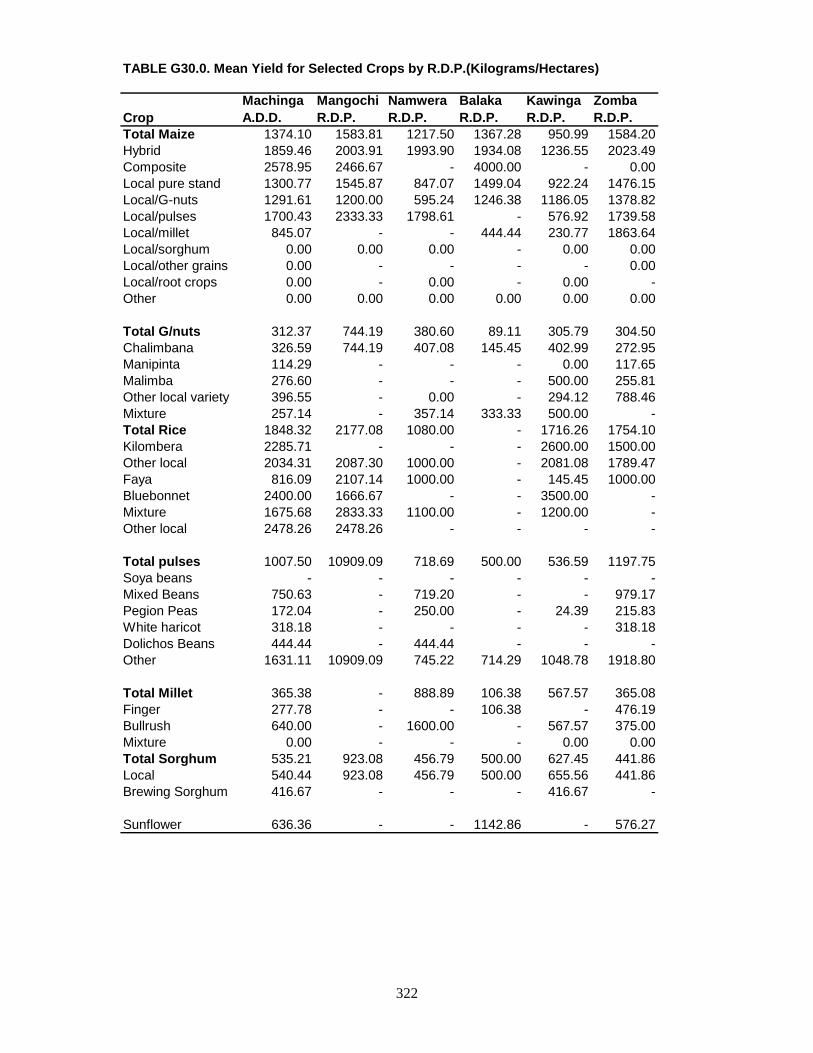
TABLE G30.0. Mean Yield for Selected Crops by R.D.P.(Kilograms/Hectares)
CropMachinga A.D.D.
Mangochi R.D.P.
Namwera R.D.P.
Balaka R.D.P.
Kawinga R.D.P.
Zomba R.D.P.
Total Maize 1374.10 1583.81 1217.50 1367.28 950.99 1584.20Hybrid 1859.46 2003.91 1993.90 1934.08 1236.55 2023.49Composite 2578.95 2466.67 - 4000.00 - 0.00Local pure stand 1300.77 1545.87 847.07 1499.04 922.24 1476.15Local/G-nuts 1291.61 1200.00 595.24 1246.38 1186.05 1378.82Local/pulses 1700.43 2333.33 1798.61 - 576.92 1739.58Local/millet 845.07 - - 444.44 230.77 1863.64Local/sorghum 0.00 0.00 0.00 - 0.00 0.00Local/other grains 0.00 - - - - 0.00Local/root crops 0.00 - 0.00 - 0.00 -Other 0.00 0.00 0.00 0.00 0.00 0.00
Total G/nuts 312.37 744.19 380.60 89.11 305.79 304.50Chalimbana 326.59 744.19 407.08 145.45 402.99 272.95Manipinta 114.29 - - - 0.00 117.65Malimba 276.60 - - - 500.00 255.81Other local variety 396.55 - 0.00 - 294.12 788.46Mixture 257.14 - 357.14 333.33 500.00 -Total Rice 1848.32 2177.08 1080.00 - 1716.26 1754.10Kilombera 2285.71 - - - 2600.00 1500.00Other local 2034.31 2087.30 1000.00 - 2081.08 1789.47Faya 816.09 2107.14 1000.00 - 145.45 1000.00Bluebonnet 2400.00 1666.67 - - 3500.00 -Mixture 1675.68 2833.33 1100.00 - 1200.00 -Other local 2478.26 2478.26 - - - -
Total pulses 1007.50 10909.09 718.69 500.00 536.59 1197.75Soya beans - - - - - -Mixed Beans 750.63 - 719.20 - - 979.17Pegion Peas 172.04 - 250.00 - 24.39 215.83White haricot 318.18 - - - - 318.18Dolichos Beans 444.44 - 444.44 - - -Other 1631.11 10909.09 745.22 714.29 1048.78 1918.80
Total Millet 365.38 - 888.89 106.38 567.57 365.08Finger 277.78 - - 106.38 - 476.19Bullrush 640.00 - 1600.00 - 567.57 375.00Mixture 0.00 - - - 0.00 0.00Total Sorghum 535.21 923.08 456.79 500.00 627.45 441.86Local 540.44 923.08 456.79 500.00 655.56 441.86Brewing Sorghum 416.67 - - - 416.67 -
Sunflower 636.36 - - 1142.86 - 576.27
322

TABLE G31.0. Mean Yield for Selected Crops for Male Households by R.D.P. (Kilograms/Hectare)
CropMachinga A.D.D.
Mangochi R.D.P.
Namwera R.D.P.
Balaka R.D.P.
Kawinga R.D.P.
Zomba R.D.P.
Total Maize 1456.97 1630.34 1424.71 1493.97 942.20 1650.14Hybrid 1996.11 2012.33 2187.44 2226.01 1264.96 2215.82Composite 2466.67 2466.67 - - - 0.00Local pure stand 1333.47 1545.83 982.05 1627.33 894.02 1471.29
Local/G-nuts 1225.32 1000.00 607.65 1641.03 460.00 1356.29Local/pulses 1737.50 2333.33 2025.97 - 250.00 1728.51Local/millet 657.14 - - - 166.67 1692.31Local/sorghum 0.00 0.00 0.00 - 0.00 0.00Local/other grains 0.00 - - - - 0.00Local/root crops 0.00 - 0.00 - 0.00 0.00Other 0.00 0.00 0.00 0.00 0.00 0.00
Total G/nuts 300.44 833.33 379.03 109.09 430.38 235.29Chalimbana 316.50 833.33 405.41 166.67 461.54 219.18Manipinta 64.52 - - - - 66.67Malimba 333.33 - - - 666.67 303.03Chitembana - - - - - -Other local variety 313.43 - - - 294.12 666.67Mixture 222.22 - 333.33 333.33 500.00 -Total Rice 1751.23 1947.37 1080.00 - 1676.06 1942.86Kilombera 1666.67 - - - 1500.00 2000.00Other local 1931.60 1790.00 1000.00 - 2011.63 2031.25Faya 711.86 1894.74 1000.00 - 83.33 500.00Bluebonnet - - - - - -Mixture 1357.14 2200.00 1100.00 - 1666.67 -Other local 3666.67 3666.67 - - - -
Total pulses 1293.49 10909.09 849.80 - 521.13 1486.15Soya beans - - - - - -Mixed Beans 900.00 - 918.75 - - 600.00Pegion Peas 166.67 - 250.00 - - 226.09White haricot 500.00 - - - - -Dolichos Beans 4.29 - 4.29 - - -Other 2093.75 10909.09 780.49 - 1057.14 2333.33
Total Millet 404.28 - 888.89 - 533.33 415.09Finger 392.16 - - - - 606.06Bullrush 666.67 - 1600.00 - 533.33 285.71Mixture 0.00 - - - - 0.00Total Sorghum 465.61 727.27 493.33 - 450.00 396.83Local 468.09 727.27 493.33 - 461.54 396.83Brewing Sorghum - - - - - -
Sunflower 637.93 - - 1142.86 - 568.63
323

TABLE G32.0. Mean yield for selected crops for Female Headed Households by R.D.P. (Kilograms/Hectare)
CropMachinga A.D.D.
Mangochi R.D.P.
Namwera R.D.P.
Balaka R.D.P.
Kawinga R.D.P.
Zomba R.D.P.
Total Maize 1175.73 1470.46 595.88 1087.87 972.08 1429.00Hybrid 1368.50 1968.89 800.00 1377.05 11146.72 1399.00Composite 4000.00 - - 4000.00 - 0.00Local pure stand 1233.47 1548.61 531.47 1200.96 977.03 1485.80
Local/G-nuts 1415.97 1500.00 444.44 733.33 2257.14 1411.39Local/pulses 1636.36 - 1560.61 - 1200.00 1776.12Local/millet 1117.65 - - 842.11 500.00 2111.11Local/sorghum 0.00 - - - 0.00 0.00Local/other grains 0.00 - - - - 0.00Local/root crops 0.00 - - - 0.00 0.00Other 0.00 0.00 0.00 0.00 0.00 0.00
Total G/nuts 330.91 583.33 200.00 65.22 73.17 457.83Chalimbana 352.27 583.33 - 120.00 142.86 398.37Manipinta 250.00 - - - - 250.00Malimba 90.91 - - 1000.00 100.00 100.00Other local variety 510.20 - - - - 862.07Mixture 285.71 - 285.71 - - -Other/unknown - - - - - -Total Rice 2100.00 2677.97 - - 1853.33 1500.00Kilombera 2200.00 - - - 2500.00 1000.00Other local 2346.53 3230.77 - - 2320.00 1480.00Faya 1074.74 2555.56 - - 277.78 -Bluebonnet 2400.00 1666.67 - - 3500.00 -Mixture 2875.00 3142.86 - - 1000.00 -Other local 1714.29 1714.29 - - - -
Total pulses 541.87 - 591.76 625.00 636.36 416.67Soya beans 0.00 - - 0.00 - -Mixed Beans 635.96 - 547.37 - - 1078.95Pegion Peas 166.67 - - 0.00 200.00 166.67White haricot 250.00 - - - - 250.00Dolichos Beans 500.00 - 500.00 - - -Other 503.88 - 706.67 833.33 1000.00 23.81
Total Millet 281.25 - - 129.03 590.91 90.91Finger 100.00 - - 129.03 - -Bullrush 583.33 - - - 590.91 500.00Total Sorghum 687.50 2500.00 166.67 500.00 741.94 541.67Local 717.65 2500.00 166.67 500.00 803.92 541.67Brewing Sorghum 454.55 - - - 454.55 -
Sunflower 625.00 - - - - 625.00
324

STATISTICAL TABLES
FOR
NSSA 1992/93
BLANTYRE A.D.D.
325/326

LIST OF STATISTICAL TABLES FOR BLANTYRE A.D.D.
Table Table title page Number G1.0 Number and percentage of gardens by holding size 331 category G2.0 Percentage of cultivated area by ploughing method 332 Used and holding size category G3.0 Percentage of cultivated area by ridging method used 333 And holding size category G4.0 Percentage of cultivated area by planting method used 334 And holding size category G5.0 Percentage of cultivated area by source of permission 336 To use land and R.D.P. G6.0 Number of plots by holding size category and R.D.P. 336 G7.0 Percentage of plots by maize variety and R.D.P 336 G8.0 Percentage of plots by source of seed and maize variety 337 G9.0 Percentage of plots to which fertilizer was applied by type 338 Of fertilizer G10.0 Percentage of plots to which fertilizer was applied by type 338 Of fertilizer G11.0 Percentage of maize plots to which fertilizer was applied by 339 Type of fertilizer, R.D.P. and sex of household head G12.0 Percentage of maize plots to which fertilizer was applied to 340 By type of fertilizer, R.D.P. and sex of household head G13.0 Percentage of plots to which fertilizer was applied by maize 341 Variety G14.0 Percentage of plots to which fertilizer was applied by maize 342 Variety G15.0 Percentage of maize plots to which fertilizer was applied by 343 Maize variety for male headed households
327/328

G16.0 Percentage of maize plots to which fertilizer was applied by 344 Maize variety for male headed households G17.0 Percentage of maize plots to which fertilizer was applied by 345 Maize variety for female headed households G18.0 Percentage of maize plots to which fertilizer was applied by 346 Maize variety for female headed households G19.0 Fertilizer application on area planted with maize and rice by 347 R.D.P. G20.0 Fertilizer application on area planted with maize and rice for 349 Female headed households by R.D.P. G21.0 Fertilizer application on area planted with maize and rice for 350 Female headed households by R.D.P. G22.0 Percentage of plots to which fertilizer was applied by sex of 351 Household head and source of financing G23.0 Cropping pattern by R.D.P. (Thousand Hectares) 352 G24.0 Percentage cropping pattern by R.D.P. 354 G25.0 Cropping pattern for male headed households by R.D.P. 356 ( Thousand Hectares ) G26.0 Cropping pattern for female headed households by R.D.P. 358 (Thousand Hectares) G27.0 Production for selected crops by R.D.P. (Thousand Tones) 359 G28.0 Production for selected crops for male headed households by 360 R.D.P. (Thousand Tones) G29.0 Production for selected crops for female headed households 361 By R.D.P. (Thousand Tones) G30.0 Mean yield for selected crops by R.D.P. (Kilograms/Hectare) 362 G31.0 Mean yield for selected crops for male headed households by 363 R.D.P (Kilograms/Hectare) G32.0 Mean yield for selected crops for female headed households by 364 R.D.P. (Kilograms/Hectare)
328/329/330
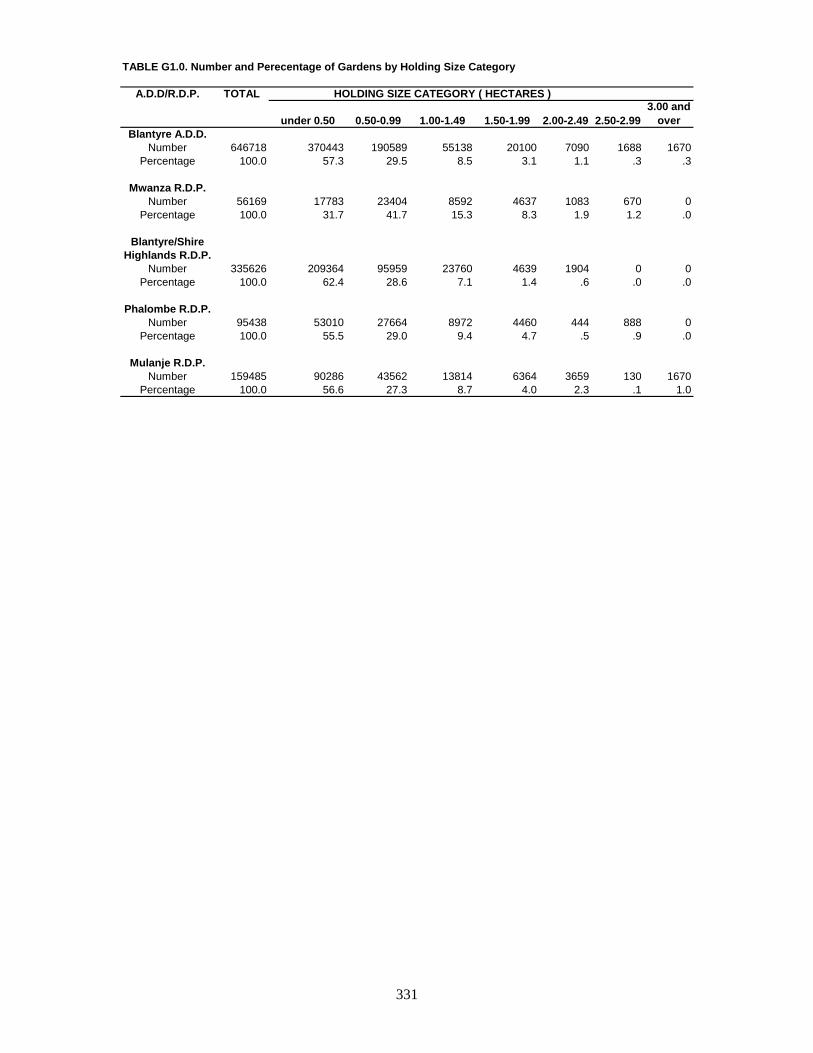
TABLE G1.0. Number and Perecentage of Gardens by Holding Size Category
A.D.D/R.D.P. TOTAL HOLDING SIZE CATEGORY ( HECTARES )
under 0.50 0.50-0.99 1.00-1.49 1.50-1.99 2.00-2.49 2.50-2.993.00 and
overBlantyre A.D.D.
Number 646718 370443 190589 55138 20100 7090 1688 1670Percentage 100.0 57.3 29.5 8.5 3.1 1.1 .3 .3
Mwanza R.D.P.Number 56169 17783 23404 8592 4637 1083 670 0
Percentage 100.0 31.7 41.7 15.3 8.3 1.9 1.2 .0
Blantyre/ShireHighlands R.D.P.
Number 335626 209364 95959 23760 4639 1904 0 0Percentage 100.0 62.4 28.6 7.1 1.4 .6 .0 .0
Phalombe R.D.P.Number 95438 53010 27664 8972 4460 444 888 0
Percentage 100.0 55.5 29.0 9.4 4.7 .5 .9 .0
Mulanje R.D.P.Number 159485 90286 43562 13814 6364 3659 130 1670
Percentage 100.0 56.6 27.3 8.7 4.0 2.3 .1 1.0
331

TABLE G2.0. Perecentage of Cultivated Area by Ploughing Method Used and Monitoring Size Category
PLOUGHING METHOD TOTAL
Under 0.50 0.50 - 0.99 1.00 - 1.49 1.50 - 1.99 2.00 - 2.49 2.50 - 2.993.00 and over
Blantyre A.D.D.Total 100.0 35.7 38.4 14.7 6.1 2.8 1.1 1.3Not ploughed this season 97.4 35.0 37.3 14.3 5.8 2.7 1.1 1.3Tilled by hoeing 2.3 .6 1.0 .2 .3 .1 - -Ploughed by oxen .0 - - .0 - - - -Other .3 .0 .1 .2 - - - -
Mwanza R.D.P.Total 100.0 18.3 38.7 20.7 12.3 5.2 4.8 -Not ploughed this season 94.2 17.8 35.9 19.9 11.4 4.4 4.8 -Tilled by hoeing 5.7 .5 2.8 .7 .9 .7 - -Ploughed by oxen .1 - - .1 - - - -
Blantyre/ShireHighlands R.D.P.Total 100.0 43.1 39.5 12.3 3.4 1.6 - -Not ploughed this season 98.9 42.7 39.0 12.2 3.4 1.6 - -Tilled by hoeing .9 .4 .4 .1 - - - -Other .1 - .1 - - - - -
Phalombe R.D.P.Total 100.0 33.4 41.1 14.2 7.2 1.8 2.2 -Not ploughed this season 94.9 31.6 39.0 13.8 6.5 1.8 2.2 -Tilled by hoeing 5.1 1.8 2.1 .4 .8 - - -
Mulanje R.D.PTotal 100.0 31.3 33.9 16.6 7.4 4.7 .8 5.4Not ploughed this season 97.9 30.8 33.3 15.9 7.1 4.7 .8 5.4Tilled by hoeing 1.2 .2 .6 - .3 - - -Other .9 .2 - .7 - - - -
Holding Size Category (hectares)
332

TABLE G3.0 Perecentage of Cultivated Area by Ridging Method Used and Holding Size Category
Ridging Method Total Holding Size Category ( Hectares )
Under 0.50 0.50 - 0.99 1.00 - 1.49 1.50 - 1.99 2.00 - 2.49 2.50 - 2.993.00 and over
Blantyre A.D.D.Total 100.0 35.7 38.4 14.7 6.1 2.8 1.1 1.3Not ridged this season 6.4 1.3 2.1 1.4 .7 .3 .2 .3Ridged by hoeing 93.2 34.3 36.1 13.1 5.4 2.5 .9 .9Other .3 .1 .1 .1 - - - -
Mwanza R.D.P.Total 100.0 18.3 38.7 20.7 12.3 5.2 4.8 -Not ridged this season 6.1 .3 3.3 2.0 - .5 .1 -Ridged by hoeing 93.1 18.0 34.6 18.8 12.3 4.7 4.7 -Other .8 - .8 - - - - -
Blantyre/ShireHighlands R.D.P.Total 100.0 43.1 39.5 12.3 3.4 1.6 - -Not ridged this season 2.6 1.4 1.0 .3 - - - -Ridged by hoeing 97.2 41.7 38.4 12.0 3.4 1.6 - -Other .2 .0 .1 .0 - - - -
Phalombe R.D.P.Total 100.0 33.4 41.1 14.2 7.2 1.8 2.2 -Not ridged this season 9.6 .8 2.2 2.7 1.2 1.7 1.1 -Ridged by hoeing 90.4 32.6 38.9 11.5 6.1 .2 1.1 -
Mulanje R.D.P.Total 100.0 31.3 33.9 16.6 7.4 4.7 .8 5.4Not ridged this season 11.9 2.2 3.6 2.6 2.1 - - 1.4Ridged by hoeing 87.5 28.9 30.3 13.6 5.2 4.7 .8 4.0Other .6 .2 - .4 - - - -
333

TABLE G4.0 Mean Yield for Selected Crops by R.D.P. (Kilograms/Hectare)
Planting Method Total Holding Size Category (Hectares)
Under 0.50 0.50 - 0.99 1.00-1.49 1.50-1.99 2.00-2.49 2.50-2.993.00 and over
Blantyre A.D.D.Total 100.0 35.7 38.4 14.6 6.1 2.8 1.1 1.3Flat planted 2.3 .5 1.0 .3 .2 .1 - .1Used last season ridges 2.5 .6 .8 .6 .2 .0 .3 -Used this season ridges 93.4 34.1 35.9 13.3 5.5 2.7 .8 1.2Planted into holes .5 .2 .3 .1 - - .0 -Planted into mounds .1 .0 .0 .0 - - - -Other 1.2 .3 .4 .3 .2 - - .0
Mwanza R.D.P.Total 100.0 18.3 38.7 20.7 12.3 5.2 4.8 -Flat planted 8.4 .4 4.3 2.0 1.2 .5 - -Used last season ridges .2 - - .2 - - - -Used this season ridges 90.8 17.9 34.4 18.1 11.1 4.7 4.7 -Planted into holes .5 - - .5 - - .1Planted into mounds .0 .0 - - - - - -
Blantyre/ShireHighlands R.D.P.Total 100.0 43.1 39.5 12.3 3.4 1.6 - -Flat planted .8 .4 .2 .0 - .2 - -Used last season ridges 1.0 .4 .4 .2 - - - -Used this season ridges 97.4 41.8 38.6 12.1 3.4 1.5 - -Planted into holes .5 .3 .2 - - - - -Planted into mounds .1 .1 - - - - -Other .0 .0 .0 - - - - -
Phalombe R.D.P.Total 100.0 33.4 41.1 14.2 7.2 1.8 2.2 -Flat planted 2.4 .8 1.5 - .1 - - -Used last season ridges 7.7 1.0 2.4 2.1 .6 - 1.7 -Used this season ridges 90.0 31.7 37.2 12.1 6.6 4.7 .5 -
Mulanje R.D.P.Total 100.0 31.4 34.0 16.4 7.4 4.7 .8 5.4Flat planted 2.0 .4 .7 .3 .1 - - .5Used last season ridges 2.7 .9 .8 .4 .5 .1 - -Used this season ridges 89.3 28.6 30.2 14.1 6.0 4.6 .8 4.9Planted into holes .9 .2 .7 - - - - -Other 5.2 1.3 1.7 1.5 .7 - - .0
334/335

TABLE G5.0. Percentage of Cultivated Area by Source of Permission to use land and RDP
ADD TotalRelative by birth-male
Relative by birth-female
Relative by marriage-male
Relative by marriage-female Borrowed Other
Blantyre ADD 100.0 12.2 19.3 10.1 14.4 38.1 6.8Mwanza RDP 100.0 14.5 5.5 3.4 15.2 58.7 2.8Blantyre/Shire Highlands RDP 100.0 8.5 18.1 17.6 15 27.6 13.2Phalombe RDP 100.0 23.8 32.8 . 4.7 37.3 1.6Mulanje RDP 100.0 4.1 31.9 8.3 19.4 36.3 . TABLE G6.0 Number of Plots by Holding Size Category and R.D.P.
A.D.D./R.D.P Total Holding Size Category (Hectares )
Under 0.50 0.50 - 0.99 1.00 - 1.49 1.50 - 1.99 2.00 - 2.49 2.50 - 2.993.00 and over
Blantyre ADD 713176 400405 213470 61602 23818 7578 2358 3945Mwanza RDP 58877 18518 23824 8886 5126 1183 1340 0Blantyre/Shire Highlands RDP 358136 218297 105977 26309 5261 2292 0 0Phalombe RDP 98823 54348 29711 8972 4460 444 888 0Mulanje RDP 197340 109242 53958 17435 8971 3659 130 3945 TABLE G7.0 Percentage of Plots by Maize Variety and R.D.P.
A.D.D/R.D.P Total TYPE OF MAIZEHybrid Composite Local pure Local /G-nuts Local /other Other
stand cropBlantyre A.D.D. 100.0 26.8 2.0 48.9 1.7 17.0 3.6Mwanza R.D.P. 100.0 19.1 .0 64.1 .5 13.1 3.3Blantyre/ ShireHighlands R.D.P. 100.0 29.3 .4 49.4 2.1 14.2 4.6Phalombe R.D.P. 100.0 18.8 .7 55.1 1.6 23.2 .6Mulanje R.D.P. 100.0 27.8 7.3 39.0 1.0 21.8 3.1
336

TABLE G8.0. Percentage of Plots by Source of Seed and Maize Variety
Maize Variety Total Sorce of SeedRetained from Project /Scheme As seed from As food from As food from Bought Other
last season credit ADMARC ADMARC a market locallyBlantyre A.D.D.All maize 100.0 27.0 3.0 10.5 .9 7.7 28.5 22.5Hybrid 26.8 1.8 2.7 7.3 .2 .6 3.9 10.4Composite 2.0 .3 .0 .1 .0 .1 .3 1.1Local pure stand 48.9 17.5 .3 2.5 .5 4.2 18.4 5.4Local /G-nuts 1.7 .8 .0 .0 .0 .1 .6 .2Local /other crop 17.0 6.1 .0 .3 .2 2.5 5.0 2.9Other 3.6 .5 .0 .1 .0 .2 .3 2.5Mwanza R.D.PAll maize 100.0 38.6 3.2 4.5 .6 .9 19.4 32.9Hybrid 19.1 2.5 2.3 3.5 .3 .0 .8 9.7Local pure stand 64.1 29.9 .9 .7 .0 .6 15.1 16.8Local /G-nuts .5 .2 .0 .0 .0 .0 .3 .0Local /other crop 13.1 5.7 .0 .2 .2 .2 2.8 3.9Other 3.3 .3 .0 .0 .0 .0 .4 2.6Blantyre /ShireHighlands R.D.PAll maize 100.0 26.2 4.0 13.7 1.1 8.9 27.6 18.6Hybrid 29.3 1.6 3.7 9.2 .3 .7 4.6 9.1Composite .4 .1 .0 .2 .0 .1 .0 .0Local pure stand 49.4 17.1 .2 3.7 .7 5.6 17.9 4.3Local /G-nuts 2.1 1.4 .0 .0 .0 .1 .4 .2Local /other crop 14.2 5.5 .0 .4 .1 2.1 4.3 1.8Other 4.6 .6 .0 .2 .1 .3 .4 3.2Phalombe R.D.P.All maize 100.0 25.3 1.6 11.2 1.6 7.3 42.2 10.8Hybrid 18.8 1.4 1.0 7.6 .2 1.0 4.2 3.4Composite .7 .0 .0 .3 .0 .0 .0 .3Local pure stand 55.1 18.0 .3 2.7 .6 2.7 25.2 5.6Local /G-nuts 1.6 .0 .0 .0 .0 1.5 .1Local /other crop 23.2 5.6 .3 .5 .8 3.6 11.1 1.3Other .6 .3 .0 .0 .0 .0 .3 .0Mulanje R.D.P.All maize 100.0 25.9 1.3 4.3 .3 7.2 26.0 35.0Hybrid 27.8 2.2 1.2 4.0 .0 .0 2.9 17.7Composite 7.3 .8 .0 .0 .0 .4 1.3 4.7Local pure stand 39.0 14.2 .1 .4 .1 3.2 16.7 4.2Local /G-nuts 1.0 .1 .0 .0 .0 .0 .7 .2Local /other crop 21.8 8.1 .0 .0 .1 3.4 4.2 6.0Other 3.1 .4 .0 .0 .0 .0 .2 2.2
337

TABLE G9.0 Percentage of Plots to which Fertilizer was Applied by Type of Fertilizer
A.D.D/R.D.P Total FIRST APPLICATIONNone used 20:20:00 Sulphate DAP 23:21 O+4S CAN UREA Mixture Other
of ammonia cropBlantyre A.D.D. 100.0 78.4 1.2 .3 2.1 2.5 7.6 10.4 .9 .1Mwanza R.D.P. 100.0 83.2 .6 .4 2.1 7.0 4.8 1.7 .3 .0Blantyre/ ShireHighlands R.D.P. 100.0 67.0 1.8 .0 2.7 1.8 10.8 14.2 1.4 .2Phalombe R.D.P. 100.0 66.3 1.0 1.6 3.5 6.3 9.2 11.0 1.2 .0Mulanje R.D.P. 100.0 90.6 .3 .2 .3 .5 1.9 5.9 .1 .1 TABLE G10.0 Percentage of Plots to which Fertilizer was Applied by Type of Fertilizer
A.D.D/R.D.P Total SECOND APPLICATIONNone used 20:20:00 Sulphate DAP 23:21 O+4S CAN UREA Mixture 8 Other
of ammonia cropBlantyre A.D.D. 100.0 95.5 .1 .0 .1 .1 1.6 2.4 .1 .0 .0Mwanza R.D.P. 100.0 97.7 .0 .0 .3 .0 1.7 .3 .0 .0 .0Blantyre/ ShireHighlands R.D.P. 100.0 93.6 .0 .0 .1 .2 2.3 3.6 .2 .0 .0Phalombe R.D.P. 100.0 93.4 .5 .2 .0 .3 1.7 3.6 .0 .2 .0Mulanje R.D.P. 100.0 99.3 .0 .0 .0 .0 .3 .5 .0 .1 .0
338

TABLE G11.0. Percentage of Maize Plots to which Fertilizer was Applied by Type of Fertilizer, R.D.P. and Sex of Household Head
A.D.D. /R.D.P. Total FIRST APPLICATIONNone used 20:20:00 Sulphate DAP 23:21 O+4S CAN UREA Mixture Other
of ammonia cropBlantyre A.D.D.Total 100.0 74.8 1.2 .3 2.1 2.5 7.6 10.4 .9 .1Male 63.0 45.5 .7 .3 1.8 1.9 5.1 7.1 .5 .1Female 37.0 29.3 .5 .1 .3 .6 2.5 3.3 .4 .0
Mwanza R.D.P.Total 100.0 83.2 .6 .4 2.1 7.0 4.8 1.7 .3 .0Male 66.7 55.0 .0 .4 .9 6.4 2.9 .9 .3 .0Female 33.3 28.3 .6 .0 1.1 .6 1.9 .8 .0 .0
Blantyre/ ShireHighlands R.D.P.Total 100.0 67.0 1.8 .0 2.7 1.8 10.8 14.2 1.4 .2Male 60.9 38.6 1.1 .0 2.4 1.1 7.0 9.9 .6 .2Female 39.1 28.4 .7 .0 .2 .7 3.8 4.3 .7 .1
Phalombe R.D.P.Total 100.0 66.3 1.0 1.6 3.5 6.3 9.2 11.0 1.2 .0Male 71.7 45.0 .7 1.4 3.0 5.1 7.1 8.2 1.1 .0Female 28.3 21.3 .3 .2 .4 1.2 2.1 2.7 .1 .0
Mulanje R.D.P.Total 100.0 90.6 .3 .2 .3 .5 1.9 5.9 .1 .1Male 61.4 55.4 .2 .0 .3 .5 1.4 3.4 .1 .1Female 38.6 35.2 .1 .2 .0 .0 .5 2.5 .0 .0
339

TABLE G12.0. Percentage of Maize Plots which Fertilizer was Applied to by Type of Fertilizer, R.D.P. and Sex of Household Head
A.D.D. /R.D.P. Total SECOND APPLICATIONNone used 20:20:00 Sulphate DAP 23:21 O+4S CAN UREA Mixture 8 Other
of ammonia cropBlantyre A.D.D.Total 100.0 95.5 .1 .0 .1 .1 1.6 2.4 .1 .0 .0Male 63.0 59.5 .1 .0 .1 .1 1.0 2.1 .1 .0 .0Female 37.0 35.9 .0 .0 .0 .0 .7 .3 .0 .0 .0
Mwanza R.D.P.Total 100.0 97.7 .0 .0 .3 .0 1.7 .3 .0 .0 .0Male 66.7 65.6 .0 .0 .3 .0 .5 .3 .0 .0 .0Female 33.3 32.1 .0 .0 .0 .0 1.1 .0 .0 .0 .0
Blantyre/ ShireHighlands R.D.P.Total 100.0 93.6 .0 .0 .1 .2 2.3 3.6 .2 .0 .0Male 60.9 56.1 .0 .0 .1 .2 1.3 3.1 .1 .0 .0Female 39.1 37.5 .0 .0 .0 .0 1.0 .4 .1 .0 .0
Phalombe R.D.P.Total 100.0 93.4 .5 .2 .0 .3 1.7 3.6 .0 .2 .0Male 71.7 66.2 .5 .2 .0 .3 1.4 2.8 .0 .2 .0Female 28.3 27.2 .0 .0 .0 .0 .3 .8 .0 .0 .0
Mulanje R.D.P.Total 100.0 99.3 .0 .0 .0 .0 .3 .5 .0 .0 .0Male 61.4 60.7 .0 .0 .0 .0 .3 .5 .0 .0 .0Female 38.6 38.6 .0 .0 .0 .0 .0 .0 .0 .0 .0
340

TABLE G13.0. Percentage of Plots to which Fertilizer was Applied by Maize Variety
Maize Variety First ApplicationTotal None Used 20:20:0 Sulphate of DAP 23:21:0+4s CAN UREA Mixture Other
AmmoniaBlantyre A.D.D.All maize 100.0 71.8 1.4 0.3 2.1 2.7 8.8 11.9 1.1 0.1Hybrid 26.8 15.0 0.8 0.1 1.2 1.6 3.2 4.3 0.6 0.1Composite 2.0 1.7 0.0 0.0 0.0 0.0 0.1 0.2 0.0 0.0Local pure stand 48.9 37.6 0.5 0.1 0.4 0.9 3.8 5.2 0.3 0.0Local /G-nuts 1.7 1.3 0.0 0.0 0.0 0.0 0.3 0.1 0.0 0.0Local /other crop 17.0 13.5 0.1 0.1 0.3 0.1 1.1 1.8 0.1 0.0Other 3.6 2.6 0.0 0.0 0.2 0.0 0.4 0.4 0.0 0.0Mwanza R.D.PAll maize 100.0 81.2 0.7 0.5 2.7 7.2 5.5 1.8 0.3 0.0Hybrid 19.1 8.5 0.0 0.0 1.5 6.2 1.2 1.3 0.3 0.0Local pure stand 64.0 57.6 0.7 0.0 0.7 1.0 4.1 0.0 0.0 0.0Local /G-nuts 0.5 0.5 0.0 0.0 0.0 0.0 0.0 0.0 0.0 0.0Local /other crop 13.1 12.0 0.0 0.3 0.2 0.0 0.3 0.3 0.0 0.0Other 3.3 2.6 0.0 0.2 0.3 0.0 0.0 0.3 0.0 0.0Blantyre /ShireHighlands R.D.PAll maize 100.0 64.9 2.0 0.1 2.8 1.9 11.6 15.2 1.5 0.1Hybrid 29.3 13.7 1.5 0.1 1.8 1.5 4.3 5.3 1.0 0.1Composite 0.4 0.1 0.0 0.0 0.0 0.0 0.1 0.2 0.0 0.0Local pure stand 49.4 35.8 0.3 0.0 0.4 0.2 5.1 7.2 0.3 0.0Local /G-nuts 2.1 1.8 0.0 0.0 0.0 0.0 0.2 0.1 0.0 0.0Local /other crop 14.2 10.4 0.2 0.0 0.3 0.1 1.2 1.9 0.1 0.0Other 4.6 3.0 0.0 0.0 0.3 0.0 0.7 0.5 0.1 0.0Phalombe R.D.P.All maize 100.0 63.7 1.3 1.2 1.9 6.7 10.5 13.3 1.4 0.0Hybrid 18.8 9.8 0.0 0.3 0.5 1.4 3.3 3.3 0.3 0.0Composite 0.7 0.7 0.0 0.0 0.0 0.0 0.0 0.0 0.0 0.0Local pure stand 55.1 35.4 1.3 0.5 1.2 5.2 4.3 6.4 0.7 0.0Local /G-nuts 1.6 0.9 0.0 0.0 0.0 0.0 0.7 0.0 0.0 0.0Local /other crop 23.2 16.9 0.0 0.4 0.3 0.1 2.1 3.0 0.3 0.0Other 0.6 0.0 0.0 0.0 0.0 0.0 0.0 0.6 0.0 0.0Mulanje R.D.P.All maize 100.0 89.8 0.3 0.3 0.2 0.7 2.2 6.3 0.1 0.0Hybrid 27.8 23.0 0.1 0.2 0.0 0.4 0.9 3.2 0.0 0.0Composite 7.3 6.9 0.0 0.0 0.0 0.0 0.1 0.2 0.0 0.0Local pure stand 39.0 36.5 0.2 0.1 0.0 0.3 0.5 1.3 0.0 0.0Local /G-nuts 1.0 0.9 0.0 0.0 0.0 0.0 0.1 0.0 0.0 0.0Local /other crop 21.8 19.4 0.0 0.0 0.2 0.0 0.5 1.6 0.1 0.0Other 3.1 3.1 0.0 0.0 0.0 0.0 0.0 0.0 0.0 0.0
341

TABLE G14.0. Percentage of Plots to which Fertilizer was Applied by Maize Variety
Maize Variety Second ApplicationTotal None Used Sulphate of DAP 23:21 O+4S CAN UREA Mixture
ammoniaBlantyre A.D.D.
All maize 100.0 95.3 .0 .1 .2 1.7 2.6 .1Hybrid 26.8 23.7 .0 .1 .1 1.1 1.7 .1
Composite 2.0 2.0 .0 .0 .0 .0 .0 .0Local pure stand 48.9 48.0 .0 .0 .0 .3 .5 .0
Local /G-nuts 1.7 1.6 .0 .0 .0 .0 .0 .0Local /other crop 17.0 16.6 .0 .0 .0 .1 .3 .0
Other 3.6 3.4 .0 .0 .1 .1 .1 .0Mwanza R.D.P
All maize 100.0 97.1 .0 .4 .0 2.2 .4 .0Hybrid 19.1 17.1 .0 .4 .0 1.2 .4 .0
Local pure stand 64.1 63.6 .0 .0 .0 .5 .0 .0Local /G-nuts .5 .5 .0 .0 .0 .0 .0 .0
Local /other crop 13.1 13.1 .0 .0 .0 .0 .0 .0Other 3.3 2.8 .0 .0 .0 .5 .0 .0
Blantyre /ShireHighlands R.D.P
All maize 100.0 93.4 .0 .1 .2 2.4 3.7 .2Hybrid 29.3 24.5 .0 .1 .1 1.8 2.6 .2
Composite .4 .3 .0 .0 .0 .0 .0 .0Local pure stand 49.4 48.6 .0 .0 .0 .3 .4 .0
Local /G-nuts 2.1 2.1 .0 .0 .0 .0 .0 .0Local /other crop 14.2 13.5 .0 .0 .0 .2 .4 .1
Other 4.6 4.3 .0 .0 .1 .1 .2 .0Phalombe R.D.P.
All maize 100.0 94.6 .3 .0 .4 .6 4.1 .0Hybrid 18.8 17.0 .2 .0 .1 .0 1.6 .0
Composite .7 .7 .0 .0 .0 .0 .0 .0Local pure stand 55.1 52.2 .0 .0 .3 .6 2.0 .0
Local /G-nuts 1.6 1.6 .0 .0 .0 .0 .0 .0Local /other crop 23.2 22.5 .1 .0 .0 .0 .6 .0
Other .6 .6 .0 .0 .0 .0 .0 .0Mulanje R.D.P.
All maize 100.0 99.7 .0 .0 .0 .3 .0 .0Hybrid 27.8 27.6 .0 .0 .0 .3 .0 .0
Composite 7.3 7.3 .0 .0 .0 .0 .0 .0Local pure stand 39.0 39.0 .0 .0 .0 .0 .0 .0
Local /G-nuts 1.0 1.0 .0 .0 .0 .0 .0 .0Local /other crop 21.8 21.8 .0 .0 .0 .0 .0 .0
Other 3.1 3.1 .0 .0 .0 .0 .0 .0
342

TABLE G15.0. Percentage of Maize Plots to which Fertilizer was Applied by Maize Variety for Male Headed Households
Maize Variety FIRST APPLICATIONTotal None Used 20:20:00 Sulphate of DAP 23:21 O+4S CAN UREA Mixture
ammoniaBlantyre A.D.D.All maize 100.0 69.0 1.3 .3 2.9 3.2 9.4 12.9 1.0Hybrid 27.5 15.1 .8 .1 1.7 2.0 3.0 4.3 .5Composite 1.6 1.2 .0 .0 .0 .0 .1 .2 .0Local pure stand 48.4 35.6 .4 .1 .5 1.1 4.2 6.2 .4Local /G-nuts 1.8 1.4 .0 .0 .0 .0 .3 .0 .0Local /other crop 17.2 13.3 .1 .1 .4 .1 1.2 1.9 .1Other 3.5 2.5 .0 .0 .3 .0 .5 .2 .0Mwanza R.D.PAll maize 100.0 79.3 .0 .8 1.9 11.2 5.0 1.2 .6Hybrid 25.0 11.9 .0 .0 1.2 9.9 .7 0.8 .6Local pure stand 56.9 51.0 .0 .0 .4 1.3 4.3 .0 .0Local /G-nuts .4 .4 .0 .0 .0 .0 .0 .0 .0Local /other crop 15.1 13.8 .0 .6 .4 .0 .0 .4 .0Other 2.6 2.3 .0 .3 .0 .0 .0 .0 .0Blantyre /ShireHighlands R.D.PAll maize 100.0 61.4 1.9 .1 4.1 1.8 12.4 17.2 1.1Hybrid 29.9 13.5 1.4 .1 2.7 1.5 4.4 5.6 .7Composite .6 .1 .0 .0 .0 .0 .1 .3 .0Local pure stand 48.2 32.8 .2 .0 .5 .1 5.5 8.8 .4Local /G-nuts 2.2 1.8 .0 .0 .0 .0 .2 .1 .0Local /other crop 14.4 10.2 .2 .0 .4 .2 1.3 2.1 .0Other 4.8 3.0 .0 .0 .5 .0 .9 .4 .0Phalombe R.D.P.All maize 100.0 59.8 1.3 1.3 2.5 7.5 11.5 14.1 1.9Hybrid 19.3 9.5 .0 .4 .5 1.6 2.9 3.9 .5Composite .5 .5 .0 .0 .0 .0 .0 .0 .0Local pure stand 52.7 31.4 1.3 .6 1.7 5.8 4.8 6.2 .9Local /G-nuts 2.2 1.2 .0 .0 .0 .0 1.0 .0 .0Local /other crop 25.3 17.2 .0 .3 .4 .1 2.8 4.0 .5Mulanje R.D.P.All maize 100.0 89.9 .5 .0 .4 1.1 2.3 5.7 .1Hybrid 28.0 23.9 .2 .0 .0 .6 .5 2.8 .0Composite 5.1 4.5 .0 .0 .0 .0 .2 .3 .0Local pure stand 43.2 39.6 .4 .0 .0 .4 .7 2.0 .0Local /G-nuts 1.1 .9 .0 .0 .0 .0 .2 .0 .0Local /other crop 19.7 18.1 .0 .0 .4 .0 .6 .5 .1Other 2.8 2.8 .0 .0 .0 .0 .0 .0 .0
343

TABLE G16.0. Percentage of Maize Plots to which Fertilizer was Applied by Maize Variety for Male Headed Households
Maize Variety Second ApplicationTotal None UsedSulphate oDAP 23:21:0+4s CAN UREA Mixture
AmmoniaBlantyre A.D.D.All maize 100.0 94.4 0.1 0.1 0.3 1.4 3.6 0.1Hybrid 27.5 23.8 0.0 0.1 0.1 1.0 2.3 0.1Composite 1.6 1.5 0.0 0.0 0.0 0.0 0.0 0.0Local pure stand 48.4 47.6 0.0 0.0 0.1 0.2 0.6 0.0Local /G-nuts 1.8 1.7 0.0 0.0 0.0 0.0 0.0 0.0Local /other crop 17.2 16.6 0.0 0.0 0.0 0.1 0.5 0.0Other 3.5 3.2 0.0 0.0 0.1 0.0 0.0 0.0Mwanza R.D.PAll maize 100.0 97.7 0.0 0.6 0.0 1.1 0.6 0.0Hybrid 25.0 23.01 0.0 0.6 0.0 0.7 0.6 0.0Local pure stand 56.9 56.6 0.0 0.0 0.0 0.4 0.0 0.0Local /G-nuts 0.4 0.4 0.0 0.0 0.0 0.0 0.0 0.0Local /other crop 15.1 15.1 0.0 0.0 0.0 0.0 0.0 0.0Other 2.6 2.6 0.0 0.0 0.0 0.0 0.0 0.0Blantyre /ShireHighlands R.D.PAll maize 100.0 92.0 0.0 0.1 0.3 2.1 5.3 0.2Hybrid 29.9 24.1 0.0 0.1 0.2 1.6 3.7 0.1Composite 0.6 0.6 0.0 0.0 0.0 0.0 0.0 0.0Local pure stand 48.2 47.4 0.0 0.0 0.0 0.2 0.6 0.0Local /G-nuts 2.2 2.1 0.0 0.0 0.0 0.0 0.1 0.0Local /other crop 14.4 13.4 0.0 0.0 0.0 0.2 0.6 0.1Other 4.8 4.3 0.0 0.0 0.2 0.1 0.2 0.0Phalombe R.D.P.All maize 100.0 94.2 0.4 0.0 0.6 0.4 4.4 0.0Hybrid 19.3 17.0 0.2 0.0 0.1 0.0 1.9 0.0Composite 0.5 0.5 0.0 0.0 0.0 0.0 0.0 0.0Local pure stand 52.7 50.1 0.0 0.0 0.5 0.4 1.7 0.0Local /G-nuts 2.2 2.2 0.0 0.0 0.0 0.0 0.0 0.0Local /other crop 25.3 24.3 0.1 0.0 0.0 0.0 0.8 0.0Mulanje R.D.P.All maize 100.0 99.6 0.0 0.0 0.0 0.4 0.0 0.0Hybrid 28.0 27.6 0.0 0.0 0.0 0.4 0.0 0.0Composite 5.1 5.1 0.0 0.0 0.0 0.0 0.0 0.0Local pure stand 43.2 43.2 0.0 0.0 0.0 0.0 0.0 0.0Local /G-nuts 1.1 1.1 0.0 0.0 0.0 0.0 0.0 0.0Local /other crop 19.7 19.7 0.0 0.0 0.0 0.0 0.0 0.0Other 2.8 2.8 0.0 0.0 0.0 0.0 0.0 0.0
344

TABLE G17.0. Percentage of Maize Plots to which Fertilizer was Applied by Maize Variety for Male Headed Households
Maize Variety First Application
TotalNone used 20:20:00
Sulphate of ammonia DAP 23:21 O+4S CAN UREA Mixture Other
Blantyre A.D.D.All maize 100.0 76.4 1.5 .3 .8 1.8 7.8 10.1 1.2 .1Hybrid 25.6 14.7 .9 .1 .4 1.0 3.4 4.1 .8 .1Composite 2.7 2.7 .0 .0 .0 .0 .0 .0 .0 .0Local pure stand 49.6 41.0 .5 .1 .3 .7 3.2 3.5 .2 .0Local /G-nuts 1.5 1.3 .0 .0 .0 .0 .1 .1 .0 .0Local /other crop 16.7 13.8 .1 .1 .0 .0 .8 1.8 .2 .0Other 3.8 2.8 .0 .0 .1 .0 .2 .6 .1 .0Mwanza R.D.PAll maize 100.0 84.3 2.0 .0 3.9 .5 6.4 2.8 .0 .0Hybrid 9.1 2.8 .0 .0 2.0 .0 2.2 2.2 .0 .0Local pure stand 76.0 68.6 2.0 .0 1.3 .5 3.6 .0 .0 .0Local /G-nuts .8 .8 .0 .0 .0 .0 .0 .0 .0 .0Local /other crop 9.8 9.1 .0 .0 .0 .0 .7 .0 .0 .0Other 4.3 3.0 .0 .0 .7 .0 .0 .0 .0 .0Blantyre /ShireHighlands R.D.PAll maize 100.0 70.4 2.1 .0 .7 2.1 10.3 12.0 2.1 .2Hybrid 28.5 14.2 1.6 .0 .4 1.7 4.3 4.9 1.3 .2Local pure stand 51.3 40.7 .4 .0 .3 .5 4.4 4.8 .2 .0Local /G-nuts 2.1 1.7 .0 .0 .0 .0 .2 .1 .0 .0Local /other crop 13.8 10.7 .2 .0 .0 .0 1.0 1.5 .3 .0Other 4.2 3.0 .0 .0 .0 .0 .4 .6 .2 .0Phalombe R.D.P.All maize 100.0 72.3 1.3 .9 .5 4.9 8.3 11.5 .3 .0Hybrid 17.9 10.3 .0 .0 .5 .8 4.4 1.8 .0 .0Composite 1.1 1.1 .0 .0 .0 .0 .0 .0 .0 .0Local pure stand 60.5 44.4 1.3 .3 .0 4.0 3.3 6.8 .3 .0Local /other crop 18.4 16.4 .0 .6 .0 .0 .6 .9 .0 .0Other 2.0 .0 .0 .0 .0 .0 .0 2.0 .0 .0Mulanje R.D.P.All maize 100.0 89.8 .0 .9 .0 .0 2.0 7.4 .0 .0Hybrid 27.5 21.8 .0 .5 .0 .0 1.4 3.9 .0 .0Composite 10.5 10.5 .0 .0 .0 .0 .0 .0 .0 .0Local pure stand 32.5 31.7 .0 .4 .0 .0 .3 .2 .0 .0Local /G-nuts .9 .9 .0 .0 .0 .0 .0 .0 .0 .0Local /other crop 25.0 21.4 .0 .0 .0 .0 .3 3.3 .0 .0Other 3.5 3.5 .0 .0 .0 .0 .0 .0 .0 .0
345

TABLE G18.0. Percentage of Maize Plots to which Fertilizer was Applied by Maize Variety for Female Headed Households
Maize Variety Second ApplicationTotal None Used CAN UREA Mixture
Blantyre A.D.D.All maize 100.0 96.7 2.1 1.1 .1Hybrid 25.6 23.5 1.4 .7 .1Composite 2.7 2.7 .0 .0 .0Local pure stand 49.6 48.7 .5 .4 .0Local /G-nuts 1.5 1.5 .0 .0 .0Local /other crop 16.7 16.6 .1 .0 .0Other 3.8 3.7 .1 .0 .0Mwanza R.D.PAll maize 100.0 96.0 4.0 .0 .0Hybrid 9.1 7.1 2.0 .0 .0Local pure stand 76.0 75.3 .7 .0 .0Local /G-nuts .8 .8 .0 .0 .0Local /other crop 9.8 9.8 .0 .0 .0Other 4.3 3.0 1.3 .0 .0Blantyre /ShireHighlands R.D.PAll maize 100.0 95.6 3.0 1.2 .2Hybrid 28.5 25.1 2.1 1.0 .2Local pure stand 51.3 50.6 .6 .2 .0Local /G-nuts 2.1 2.1 .0 .0 .0Local /other crop 13.8 13.6 .3 .0 .0Other 4.2 4.2 .0 .0 .0Phalombe R.D.P.All maize 100.0 95.5 1.1 3.5 .0Hybrid 17.9 17.1 .0 .8 .0Composite 1.1 1.1 .0 .0 .0Local pure stand 60.5 56.8 1.1 2.6 .0Local /other crop 18.4 18.4 .0 .0 .0Other 2.0 2.0 .0 .0 .0Mulanje R.D.P.All maize 100.0 100.0 .0 .0 .0Hybrid 27.5 27.5 .0 .0 .0Composite 10.5 10.5 .0 .0 .0Local pure stand 32.5 32.5 .0 .0 .0Local /G-nuts .9 .9 .0 .0 .0Local /other crop 25.0 25.0 .0 .0 .0Other 3.5 3.5 .0 .0 .0
346

TABLE G19.0. Fertiliser application on Area planted with Maize and Rice by R.D.P.
R.D.P.Total Area (Hectares)
Area Fertilised (hectares)
Percentage Fertilised
Mwanza R.D.P.Total Maize 15507.2 3269.82 21.09Hybrid 3244.56 1271.31 39.18Local pure stand 9199.50 1546.92 16.82Local G-nuts 60.66 - -Local/Other crop 2198.56 264.54 12.03Other 803.93 187.05 23.27Total Rice 10.14 - -Faya 10.14 - -Blantyre/Shire Highlands R.D.P.Total Maize 79393.25 31636.57 39.85Hybrid 21479.80 12815.10 59.66Composite 459.93 435.31 94.65Local pure stand 40524.06 13668.53 33.73Local/G-nuts 2378.34 357.99 15.05Local/Other crop 10300.87 3011.39 29.23Other 4250.24 1348.25 31.72Total Rice 36.32 - -Other local 20.35 - -Faya 8.79 - -Other 7.19 - -Phalombe R.D.P.Total Maize 25258.71 10905.37 43.17Hybrid 4667.40 2870.97 61.51Composite 118.46 - -Local pure stand 13471.45 5688.27 42.22Local/G-nuts 372.89 135.72 36.40Local/Other crop 6459.23 2041.13 31.60Other 169.27 169.27 100.00Total Rice 1704.52 335.25 19.67Kilombera 167.22 - -Other local 1440.58 335.25 23.27Mixture 96.72 - -Mulanje R.D.P.Total Maize 31425.42 4212.93 13.41Hybrid 8771.20 2198.58 25.09Composite 1035.83 79.15 7.64Local pure stand 13.62.31 852.22 6.52Local/G-nuts 268.96 81.35 30.25Local/Other crop 7270.00 1001.63 13.78Other 1017.12 - -Total Rice 409.16 43.91 10.93Kilombera 114.12 - -Other local Other 267.79 43.91 16.40Other 27.25 - -
347/348

TABLE G20.0.Fertiliser Application on Area planted with Maize and Rice for Male Headed Households by R.D.P.
R.D.P.Total Area (Hectares)
Area Fertilised (hectares)
Percentage Fertilised
Mwanza R.D.P.Total Maize 10042.23 2298.93 22.87Hybrid 2682.98 1009.75 37.84Local pure stand 5281.93 1074.30 20.34Local G-nuts 47052 - -Local/Other crop 1689.35 198.84 11.77Other 340.44 14.04 4.12Total Rice 10.14 - -Faya 10.14 - -Blantyre/Shire Highlands R.D.P.Total Maize 49638.72 21470.59 43.25Hybrid 13917.53 8292.22 59.58Composite 459.93 435.31 94.65Local pure stand 24244.63 9308.28 38.39Local/G-nuts 1390.41 237.48 17.08Local/Other crop 6622.77 2165.37 32.70Other 3003.45 1031.95 34.36Total Rice 27.54 - -Other local 20.35 - -Other 7.19 - -Phalombe R.D.P.Total Maize 18796.38 8921.39 47.46Hybrid 3734.76 2516.57 67.38Composite 7.90 - -Local pure stand 9429.75 4415.60 46.83Local/G-nuts 372.89 135.72 36.40Local/Other crop 5251.07 1853.50 35.30Total Rice 1412.41 326.06 23.09Other local 1315.69 328.06 24.78Mixture 96.72 - -Mulanje R.D.P.Total Maize 20538.41 2589.71 12.51Hybrid 5403.73 1283.16 23.75Composite 524.54 79.15 15.09Local pure stand 9041.09 709.25 7.84Local/G-nuts 252.69 81.35 32.19Local/Other crop 4631.01 416.80 9.00Other 685.35 - -Total Rice 205.47 43.91 21.37Kilombera 4592 - -Other local 144.28 43.91 30.43Other 15.27 - -
349

TABLE G21.0. Fertilizer Application on Area planted with Maize andRice for Female Headed Househulds by R.D.P.
R.D.P.Total Area (Hectares)
Area Fertilised (hectares)
Percentage Fertilised
Blantyre/ Shire Highlands R.D.P.Total Rice 8.79 - -Faya 8.79 - -Phalombe R.D.P.Total Rice 292.11 9.19 3.15Kilombera 167.22 - -Other local 124.89 9.19 7.36Mulanje R.D.P.Total Rice 203.69 - -Kilombera 68.20 - -Other local 123.51 - -Other 11.98 - -Mwanza R.D.P.Total Maize 5464.98 972.89 17.80Hybrid 561.57 261.56 46.58Local pure stand 3917.57 472.62 12.06Local/G-nuts 13.14 - -Loca/Other crop 509.21 65.70 12.90Other 463.49 173.01 37.33Blantyre/ Shire Highlands R.D.P.Total Maize 29754.53 10165.98 34.17Hybrid 7562.27 4522.88 59.81Local pure stand 16279.43 4360.25 26.78Local/G-nuts 987.93 120.52 12.20Loca/Other crop 3678.11 846.02 23.00Other 1246.79 316.30 25.37Phalombe R.D.P.Total Maize 6462.34 1983.99 30.70Hybrid 932.64 354.41 38.00Composite 110.57 - -Local pure stand 4041.71 1272.68 31.49Loca/Other crop 1208.16 187.63 15.53Other 169.27 169.27 100.00Mulanje R.D.P.Total Maize 10887.01 1643.21 15.09Hybrid 3367.47 915.42 27.18Composite 511.29 - -Local pure stand 4021.22 142.97 3.58Local/G-nuts 16.27 - -Loca/Other crop 2638.99 584.83 22.16Other 331.77 - -
350

TABLE G22.0. Percentage of Plots to which Fertilizer was Applied by Sex of Household Head and Source of Financing
A.D.D./ R.D.P. Source of Financing FertilizerTotal None used Cash Credit Combination Gift Other
Blantyre A.D.D.
Total 100 74.8 12.6 9.9 .6 1.8 .3Male 63 45.5 8.8 7.1 .3 1.2 .1Female 37 29.3 3.7 2.8 .3 .7 .2
Mwanza R.D.P.
Total 100.0 83.2 5.4 10.1 .0 1.5 .0Male 66.7 55.0 3.3 7.8 .0 .7 .0Female 33.3 28.3 2.1 2.3 .0 .8 .0
Blantyre/Shire Highlands R.D.P.
Total 100.0 67.0 18.5 11.5 .7 1.8 .6Male 60.9 38.6 12.8 7.9 .2 1.0 .2Female 39.1 28.4 5.7 3.6 .5 .8 .3
Phalombe R.D.P.
Total 100.0 66.3 14.7 12.2 1.5 5.2 .1Male 71.7 45.0 12.2 9.2 1.3 3.8 .1Female 28.3 21.3 2.5 2.9 .2 1.3 .1
Mulanje R.D.P.
Total 100.0 90.6 2.9 5.7 .0 .8 .1Male 61.4 55.4 1.6 4.2 .0 .3 .1Female 38.6 35.2 1.3 1.5 .0 .5 .0
351

TABLE G23.0. Cropping pattern by R.D.P. (Thousand Hectares)
CropBlantyre A.D.D.
Mwanza R.D.P.
Blantyre Shire Highlands R.D.P.
Phalombe R.D.P.
Mulanje R.D.P.
Total Maize 151.55 15.50 79.39 25.24 31.42Hybrid 38.16 3.24 21.48 4.66 8.77Composite 1.81 - .48 .12 1.02Local pure stand 76.25 9.20 40.52 13.47 13.06Loca/G-nuts 3.08 .06 2.38 .37 .27Local/Pulses 18.47 2.11 9.27 2.94 4.15Local/Millet .64 .08 .40 .15 .01Local/Sorghum 4.27 .01 .61 2.15 1.50Local/Other grains 2.71 - - 1.21 1.50Local/Root crops .13 - .02 - .11Other 6.24 .80 4.25 .17 1.02
Total/G-nuts 3.53 .06 2.80 .31 .36Chalimbana 2.64 .05 2.30 .28 .01Manipinta .15 - .15 - -Malimba .11 .01 .01 - .09Mawanga .05 - .05 - -Other local variety .36 - .23 .03 .10Mixture .16 - - - .10Other/Unknown .08 - .06 - -
Total Rice 2.17 .01 .04 1.71 .41Kilombera .29 - - .17 .12Other local 1.72 - .02 1.44 .26Faya .02 .01 .01 - -Mixture .10 - - .10 -Other .04 - .01 - .03
Total Pulses 35.28 2.70 19.73 5.29 7.56Soya beans .01 .00 - .01 -Mixed beans 2.28 .02 1.79 .43 .02Pegion peas 21.09 2.40 11.57 2.68 4.44White haricot .63 - .60 - .03Dolichos beans .69 - .53 .06 .10Other 10.00 .28 5.24 2.11 2.97
Total Millet 1.23 .12 .92 .16 .02Finger .90 .12 .64 .14 .00Bullrush .33 - .28 .02 .03
Total Sorghum 8.23 .01 1.52 3.18 3.51Local 6.22 .01 1.22 1.48 3.51Brewing Sorghum 2.01 - .51 1.70 -
Cassava 7.71 .16 3.07. .35 4.13Sweet Potatoes 2.32 .27 1.18 .39 .48Irish Potatoes .10 .10 - - -Yam .01 - - - .01Wheat 1.10 1.10 - - -Sunflower 4.53 - .27 1.84 2.42
Cotton .26 .28 - - -
Total Tobacco 1.54 .02 .26 .93 .33
Dark-fired .42 - - .42 -Sun/Air .12 - .04 .09 -Burley .98 - .23 .42 .33Oriental .02 02 - - - 352/353

TABLE G24.0. Percentage cropping pattern by R.D.P.
CropBlantyre A.D.D.
Mwanza R.D.P.
Blantyre Shire Highlands R.D.P.
Phalombe R.D.P.
Mulanje R.D.P.
Total Maize 100.0 100.0 100.0 100.0 100.0
Hybrid 25.2 20.9 27.1 18.5 27.9Composite 1.1 - .6 .5 3.3Local pure stand 50.3 59.4 51.0 53.3 41.6Loca/G-nuts 2.0 .4 3.0 1.5 .9Local/Pulses 12.2 13.6 11.7 11.7 13.2Local/Millet .4 .5 .5 .6 .0Local/Sorghum 2.8 .1 .8 8.5 4.8Local/Other grains 1.8 - - 4.8 4.8Local/Root crops .1 - .0 - .4Other 4.1 5.2 5.4 .7 3.3
Total/G-nuts 100.0 100.0 100.0 100.0 100.0
Chalimbana 74.8 83.3 82.1 90.3 2.8Manipinta 4.3 - 5.4 - -Malimba 3.1 16.7 .4 - 25.0Mawanga 1.4 - 1.8 - -Other local variety 10.2 - 8.2 9.7 27.8Mixture 4.5 - - - 44.4Other/Unknown 1.7 - 2.1 - -
Total Rice 100.0 100.0 100.0 100.0 100.0
Kilombera 13.4 - - 9.9 29.3Other local 79.3 - 50.0 84.2 63.4Faya .9 100.0 25.0 - -Mixture 4.6 - - 5.9 -Other 1.8 - 25.0 - 7.3
Total Pulses 100.0 100.0 100.0 100.0 100.0
Soya beans .0 .0 - .2 -Mixed beans 6.4 .7 9.1 8.1 .3Pegion peas 59.8 88.9 58.6 50.7 58.7White haricot 1.8 - 3.0 - .4Dolichos beans 2.0 - 2.7 1.1 1.3Other 30.1 10.4 26.6 39.9 39.3
continued…
354

TABLE G24.0. Percentage cropping pattern by R.D.P.
CropBlantyre A.D.D.
Mwanza R.D.P.
Blantyre Shire Highlands R.D.P.
Phalombe R.D.P.
Mulanje R.D.P.
Total Millet 100.0 100.0 100.0 100.0 100.0
Finger 73.2 100.0 69.6 87.5 .0Bullrush 26.8 - 30.4 12.5 100.0
Total Sorghum 100.0 100.0 100.0 100.0 100.0
Local 75.6 100.0 79.7 46.5 100.0Brewing Sorghum 24.4 - 20.3 53.5 -
Cassava 100.0 100.0 100.0 100.0 100.0Sweet Potatoes 100.0 100.0 100.0 100.0 100.0Irish Potatoes 100.0 100.0 - - -Yam 100.0 - - - 100.0Wheat 100.0 100.0 - - -Sunflower 100.0 - 100.0 100.0 100.0
Cotton 100.0 100.0 - - -
Total Tobacco 100.0 100.0 100.0 100.0 100.0
Dark-fired 27.3 - - 45.2 -Sun/Air 7.8 - 15.4 9.7 -Burley 63.6 - 88.5 45.2 100.0Oriental 1.3 100.0 - - -
355

TABLE G25.0. Cropping pattern for Male Headed Households by R.D.P. (Thousand Hectares)
CropBlantyre A.D.D.
Mwanza R.D.P.
Blantyre Shire Highlands R.D.P.
Phalombe R.D.P.
Mulanje R.D.P.
Total Maize 99.00 10.04 49.64 18.79 20.53Hybrid 25.73 2.88 13.92 3.73 5.40Composite .99 - .46 .01 .52Local pure stand 47.99 5.28 24.24 9.43 9.04Loca/G-nuts 2.08 .05 1.39 .37 .25Local/Pulses 12.12 1.62 5.97 2.58 1.95Local/Millet .40 .07 .17 .15 .01Local/Sorghum 2.98 - .47 1.40 1.11Local/Other grains 2.58 - - 1.12 1.48Local/Root crops .12 - .02 - .10Other 4.03 .34 3.00 - .69
Total/G-nuts 2.30 .05 1.62 .28 .35Chalimbana 1.00 .05 1.28 .28 .01Manipinta .15 - .15 - -Malimba .09 - - - .09Mawanga .05 - .05 - -Other local variety .19 - .10 - .09Mixture .18 - - - .15Other/Unknown .08 - .06 - -
Total Rice 1.67 .01 .03 1.42 .21Kilombera .05 - - - .05Other local 1.48 - .02 1.32 .14Faya .01 .01 - - -Mixture .10 - - .10 -Other .03 - .01 - .02
Total Pulses 22.70 1.94 13.00 4.31 3.45Soya beans .01 - - .01 -Mixed beans 1.95 - 1.52 .43 .00Pegion peas 13.37 1.74 7.52 2.23 1.88White haricot .54 - .54 - -Dolichos beans .59 - .47 .03 .09Other 6.24 .20 2.95 1.01 1.48
Total Millet .88 .07 .42 .16 .03Finger .44 .07 .23 .14 .00Bullrush .24 - .19 .02 .03
Continued….
356
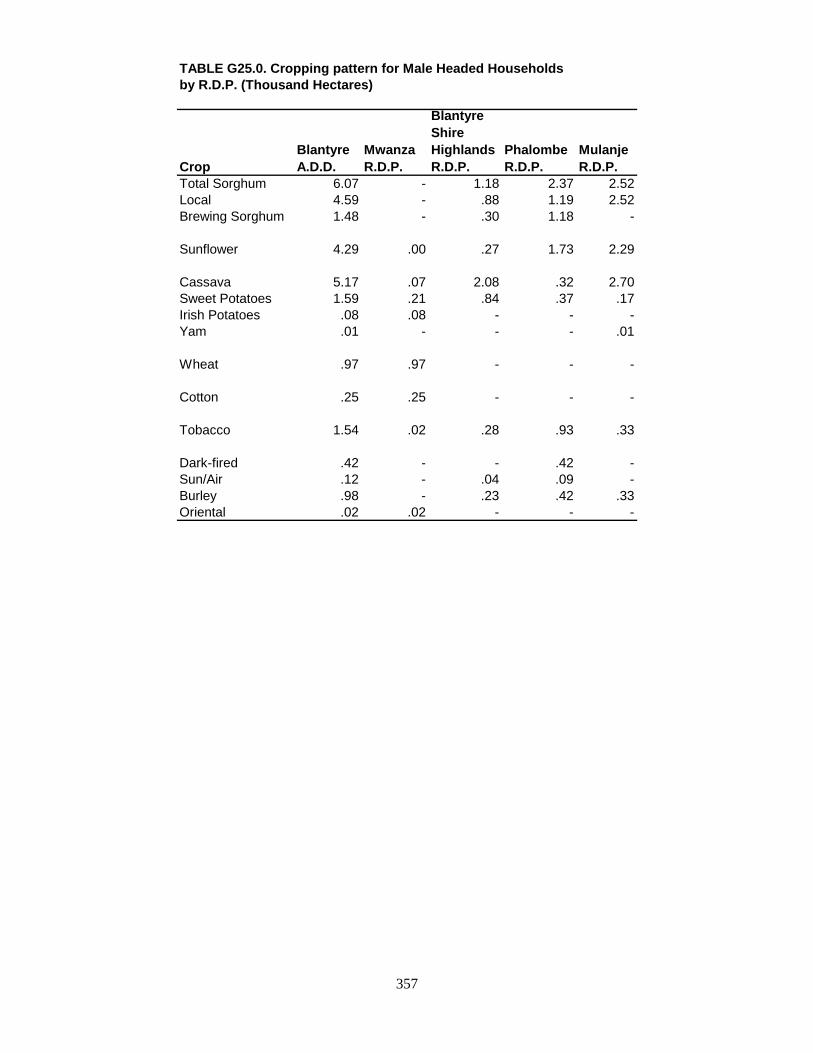
TABLE G25.0. Cropping pattern for Male Headed Households by R.D.P. (Thousand Hectares)
CropBlantyre A.D.D.
Mwanza R.D.P.
Blantyre Shire Highlands R.D.P.
Phalombe R.D.P.
Mulanje R.D.P.
Total Sorghum 6.07 - 1.18 2.37 2.52Local 4.59 - .88 1.19 2.52Brewing Sorghum 1.48 - .30 1.18 -
Sunflower 4.29 .00 .27 1.73 2.29
Cassava 5.17 .07 2.08 .32 2.70Sweet Potatoes 1.59 .21 .84 .37 .17Irish Potatoes .08 .08 - - -Yam .01 - - - .01
Wheat .97 .97 - - -
Cotton .25 .25 - - -
Tobacco 1.54 .02 .28 .93 .33
Dark-fired .42 - - .42 -Sun/Air .12 - .04 .09 -Burley .98 - .23 .42 .33Oriental .02 .02 - - -
357

TABLE G26.0. Cropping pattern for female Headed Households by R.D.P. (Thousand Hectares)
CropBlantyre A.D.D.
Mwanza R.D.P.
Blantyre Shire Highlands R.D.P.
Phalombe R.D.P.
Mulanje R.D.P.
Total Maize 52.55 5.46 29.75 6.45 10.89Hybrid 12.42 .56 7.55 .93 3.37Composite .62 - - .11 .51Local pure stand 28.26 3.92 16.28 4.04 4.02Loca/G-nuts 1.02 .01 .99 - .02Local/Pulses 6.35 .49 3.30 .36 2.20Local/Millet .24 .01 .23 - .00Local/Sorghum 1.29 .01 .14 .75 .39Local/Other grains .13 - - .09 .04Local/Root crops .01 - - - .01Other 2.21 .46 1.25 .17 .33Total/G-nuts 1.23 .01 1.18 .03 .01Chalimbana 1.04 - 1.04 - .00Malimba .02 .01 .01 - -Other local variety .17 - .13 .03 .01Total Rice .50 - .01 .29 .20Kilombera .24 - - .17 .07Other local .24 - - .12 .12Faya .01 - .01 - -Other .01 - - - .01Total Pulses 12.58 .76 6.73 .98 4.11Soya beans .00 .00 - - -Mixed beans .31 .02 .27 - .02Pegion peas 7.72 .66 4.05 .45 2.56White haricot .09 - .06 - .03Dolichos beans .10 - .06 .03 .01Other 4.36 .08 2.29 .50 1.49Total Millet .55 .05 .50 - .00Finger .48 .05 .41 - -Bullrush .09 - .09 - .00Total Sorghum 2.16 .01 .35 .81 .99Local 1.63 .01 .34 .29 .99Brewing Sorghum .53 - .01 .52 -Wheat .13 .13 - - -Sunflower .24 - - .11 .13Cassava 2.54 .09 .99 .03 1.43Sweet Potatoes .73 .06 .34 .02 .31Irish Potatoes .02 .02 - - -Cotton .01 .01 - - -
358

TABLE G27.0. Production for selected crops by R.D.P. (Thousand Tonnes)
CropBlantyre A.D.D.
Mwanza R.D.P.
Blantyre Shire Highlands R.D.P.
Phalombe R.D.P.
Mulanje R.D.P.
Total Maize 181.04 19.48 107.74 28.72 25.12Hybrid 60.73 5.56 40.65 6.04 8.48Composite 2.16 - 1.12 .21 .83Local pure stand 90.68 10.89 48.64 18.90 12.25Loca/G-nuts 3.37 .04 2.81 .37 .15Local/Pulses 23.12 2.75 14.05 2.92 3.40Local/Millet .98 .22 .47 .28 .01Local/Sorghum .00 .00 .00 .00 .00Local/Other grains .00 - - .00 .00Local/Root crops .00 .00 .00 - .00Other .00 .00 .00 .00 .00
Total/G-nuts 1.77 .06 1.48 .20 .03Chalimbana 1.60 .06 1.38 .16 -Manipinta .04 - .04 - -Mlimba .04 - .01 - .03Mawanga - - - - -Other loval variety .09 .00 .05 .04 -Mixture - - - - -Other/Unknown - - - - -
Total Rice 2.28 .01 .02 1.22 1.03Kilombera .86 - - .09 .77Other local 1.22 - .02 .98 .22Faya .01 .01 .00 - -Mixture .15 - - .15 -Other .04 - .00 - .04
Total Pulses 8.64 .58 5.25 3.84 .97Soya beans .00 .00 - .00 -Mixed beans 2.56 .00 1.00 1.56 .00Pegion peas 3.19 .31 1.04 1.54 .30White haricot .03 - .03 - .00Dolichos beans .25 - .24 .01 .00Other 2.61 .27 .34 .73 .67
Total Millet .22 .02 .13 .06 .01Finger .16 .02 .08 .06 .00Bullrush .08 - .05 .00 .01
Total Sorghum 3.79 .00 .78 1.97 1.04Local 2.13 .00 .44 .85 1.04Brewing Sorghum 1.66 - .34 1.32 -
Wheat .00 .00 - - -Sunflower 2.03 .00 .34 1.28 .41
359

TABLE G28.0 Population for selected crops for Male Households by R.D.P. (Thousand Tonnes)
CropBlantyre A.D.D.
Mwanza R.D.P.
Blantyre Shire Highlands R.D.P.
Phalombe R.D.P.
Mulanje R.D.P.
Total Maize 122.21 13.56 71.41 20.78 16.47Hybrid 42.79 4.88 27.77 4.47 5.67Composite 1.42 - 1.12 .01 .29Local pure stand 59.54 6.33 31.43 13.09 8.69Loca/G-nuts 2.36 .04 1.80 .37 .15Local/Pulses 15.44 2.08 9.13 2.58 1.67Local/Millet .66 .22 .16 .28 .00Local/Sorghum .06 - .00 .00 .00Local/Other grains .00 - - - -Local/Root crops .00 .00 .00 - -Other .00 .00 .00 - .00
Total/G-nuts 1.09 .06 .84 .16 .03Chalimbana 1.01 .06 .79 .16 -Mnipinta .04 - .04 - -Malimba .03 - - - .03Mawanga - - - - -Other local variety .01 - .01 - -Mixture - - - - -Other/unknown - - - - -
Total Rice 1.37 .01 .02 .74 .60Kilombera .38 - - - .38Other local .79 - .02 .59 .18Faya .01 .01 - - -Mixture .15 - - .15 -Other .04 - .00 - .04
Total Pulses 6.43 .52 2.12 3.52 .27Soya beans .00 - - .00 -Mixed beans 2.25 - .69 1.56 .00Pegion peas 2.43 .31 .67 1.40 .05White haricot .02 - .02 - -Dolichos beans .21 - .21 .00 .00Other 1.52 .21 .53 .56 .22
Total Millet .13 .00 .06 .06 .01Finger .09 .00 .03 .06 .00Bullrush .04 - .03 .00 .01
Total Sorghum 3.11 - .64 1.61 .86Local 1.80 - .31 .63 .88Brewing Sorghum 1.31 - .33 .98 -Wheat .00 .00 - - -Sunflower 2.00 .00 .34 1.26 .40
360

TABLE G29.0 Population for selected crops for Female Households by R.D.P. (Thousand Tonnes)
CropBlantyre A.D.D.
Mwanza R.D.P.
Blantyre Shire Highlands R.D.P.
Phalombe R.D.P.
Mulanje R.D.P.
Total Maize 58.83 5.91 36.33 7.94 8.65Hybrid 17.94 .68 12.88 1.57 2.81Composite .74 - - .20 .54Local pure stand 31.14 4.56 17.21 5.81 3.56Loca/G-nuts 1.01 .00 1.01 - .00Local/Pulses 7.68 .67 4.92 .36 1.73Local/Millet .32 .00 .31 - .01Local/Sorghum .00 .00 .00 .00 .00Local/Other grains .00 - - .00 .00Local/Root crops .00 - - - .00Other .00 .00 .00 .00 .00
Total/G-nuts .68 .00 .64 .04 -Chalimbana .59 - .59 - -Malimba .01 - .01 - -Other local variety .08 .00 .04 .04 -
Total Rice .91 - .00 .48 .43Kilombera .48 - - .09 .39Other local .43 - - .39 .04Faya .00 - .00 - -Other .00 - - - .00
Total Pulses 2.21 .06 1.13 .32 .70Soya beans .00 .00 - - -Mixed beans .31 .00 .31 - .00Pegion peas .76 .00 .37 .14 .25White haricot .01 - .01 - .00Dolichos beans .04 - .03 .01 .00Other 1.09 .06 .41 .17 .45
Total Millet .09 .02 .07 - .00Finger .07 .02 .05 - -Bullrush .02 - .02 - .00
Total Sorghum .68 .00 .1 .36 .18Local .33 .00 .13 .02 .18Brewing Sorghum .35 - .01 .34 -
Wheat .00 .00 - - -Sunflower .03 - - .02 .01
361
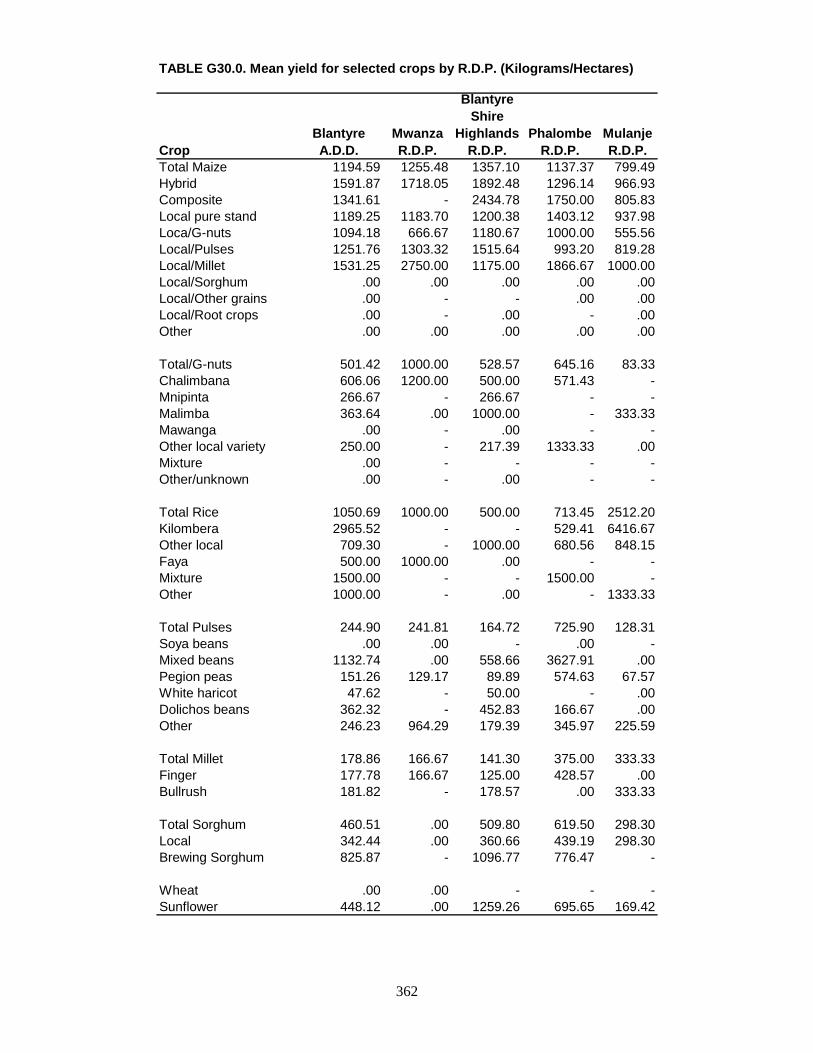
TABLE G30.0. Mean yield for selected crops by R.D.P. (Kilograms/Hectares)
CropBlantyre A.D.D.
Mwanza R.D.P.
Blantyre Shire
Highlands R.D.P.
Phalombe R.D.P.
Mulanje R.D.P.
Total Maize 1194.59 1255.48 1357.10 1137.37 799.49Hybrid 1591.87 1718.05 1892.48 1296.14 966.93Composite 1341.61 - 2434.78 1750.00 805.83Local pure stand 1189.25 1183.70 1200.38 1403.12 937.98Loca/G-nuts 1094.18 666.67 1180.67 1000.00 555.56Local/Pulses 1251.76 1303.32 1515.64 993.20 819.28Local/Millet 1531.25 2750.00 1175.00 1866.67 1000.00Local/Sorghum .00 .00 .00 .00 .00Local/Other grains .00 - - .00 .00Local/Root crops .00 - .00 - .00Other .00 .00 .00 .00 .00
Total/G-nuts 501.42 1000.00 528.57 645.16 83.33Chalimbana 606.06 1200.00 500.00 571.43 -Mnipinta 266.67 - 266.67 - -Malimba 363.64 .00 1000.00 - 333.33Mawanga .00 - .00 - -Other local variety 250.00 - 217.39 1333.33 .00Mixture .00 - - - -Other/unknown .00 - .00 - -
Total Rice 1050.69 1000.00 500.00 713.45 2512.20Kilombera 2965.52 - - 529.41 6416.67Other local 709.30 - 1000.00 680.56 848.15Faya 500.00 1000.00 .00 - -Mixture 1500.00 - - 1500.00 -Other 1000.00 - .00 - 1333.33
Total Pulses 244.90 241.81 164.72 725.90 128.31Soya beans .00 .00 - .00 -Mixed beans 1132.74 .00 558.66 3627.91 .00Pegion peas 151.26 129.17 89.89 574.63 67.57White haricot 47.62 - 50.00 - .00Dolichos beans 362.32 - 452.83 166.67 .00Other 246.23 964.29 179.39 345.97 225.59
Total Millet 178.86 166.67 141.30 375.00 333.33Finger 177.78 166.67 125.00 428.57 .00Bullrush 181.82 - 178.57 .00 333.33
Total Sorghum 460.51 .00 509.80 619.50 298.30Local 342.44 .00 360.66 439.19 298.30Brewing Sorghum 825.87 - 1096.77 776.47 -
Wheat .00 .00 - - -Sunflower 448.12 .00 1259.26 695.65 169.42
362

TABLE G31.0. Mean yield for selected crops for Male Households by R.D.P. (Kilogram/Hectares)
CropBlantyre A.D.D.
Mwanza R.D.P.
Blantyre Shire Highlands R.D.P.
Phalombe R.D.P.
Mulanje R.D.P.
Total Maize 1234.44 1349.50 1438.56 1105.91 802.24Hybrid 1663.04 1820.90 1994.97 1198.39 1050.00Composite 1434.34 - 2434.78 1000.00 557.69Local pure stand 1240.68 1198.86 1296.62 1388.12 961.28Loca/G-nuts 1145.63 800.00 1294.98 1000.00 600.00Local/Pulses 1273.93 1283.95 1529.31 992.25 856.41Local/Millet 1650.00 3142.86 941.18 1866.67 .00Local/Sorghum .00 - .00 .00 .00Local/Other grains .00 - - .00 .00Local/Root crops .00 - .00 - .00Other .00 .00 .00 - .00
Total/G-nuts 473.91 1200.00 518.52 571.43 85.71Chalimbana 631.25 1200.00 626.98 571.43 .00Mnipinta 266.67 - 266.67 - -Malimba 333.33 - - - 333.33Mawanga .00 - .00 - -Other local variety 52.63 - 100.00 - .00Mixture .00 - - - .00Other/unknown .00 - .00 - -
Total Rice 820.36 1000.00 666.67 521.13 2857.14Kilombera 7600.00 - - - 7600.00Other local 533.78 - 1000.00 446.97 1285.71Faya 1000.00 1000.00 - - -Mixture 1500.00 - - 1500.00 -Other 1333.33 - .00 - 2000.00
Total Pulses 283.28 268.04 163.08 816.71 78.26Soya beans .00 - - .00 -Mixed beans 1153.85 - 453.95 3627.91 .00Pegion peas 181.75 178.16 89.10 627.80 26.50White haricot 37.04 - 37.04 - -Dolichos beans 355.93 - 448.81 .00 .00Other 243.59 1050.00 179.66 347.83 48.65
Total Millet 191.18 .00 142.86 375.00 333.33Finger 204.55 .00 130.43 428.57 .00Bullrush 166.67 - 157.89 .00 333.33
Total Sorghum 512.36 - 542.37 679.32 341.27Local 392.16 - 352.27 529.41 341.27Brewing Sorghum 885.14 - 1100.00 830.51 -
Wheat 456.20 .00 1259.26 728.32 174.67Sunflower .00 .00 - - -
363

TABLE G32.0. Mean yield for selected crops for Female Headed Households by R.D.P. (Kilograms/Hectares)
CropBlantyre A.D.D.
Mwanza R.D.P.
Blantyre Shire
Highlands R.D.P.
Phalombe R.D.P.
Mulanje R.D.P.
Total Maize 1119.51 1082.42 1221.18 1231.01 794.31Hybrid 1411.44 1214.29 1703.70 1688.17 833.83Composite 1193.55 - - 1818.18 1058.82Local pure stand 1101.91 1163.27 1057.13 1438.12 885.57Loca/G-nuts 990.20 .00 1020.20 - .00Local/Pulses 1209.45 1367.35 1490.91 1000.00 788.36Local/Millet 1333.33 .00 1347.83 - .00Local/Sorghum .00 .00 .00 .00 .00Local/Other grains .00 - - .00 .00Local/Root crops .00 - - - .00Other .00 .00 .00 .00 .00
Total/G-nuts 552.85 .00 542.37 1333.33 .00Chalimbana 567.31 - 567.31 - .00Malimba 500.00 .00 1000.00 - -Other local variety 470.59 .00 307.69 1333.33 -
Total Rice 1820.00 - .00 1855.17 2150.00Kilombera 2000.00 - - 529.41 5571.43Other local 1791.67 - - 3250.00 .00Faya .00 - .00 - -Other .00 - - - .00
Total Pulses 175.68 78.95 167.90 326.53 170.32Soya beans .00 .00 - - -Mixed beans 1000.00 .00 1148.15 - .00Pegion peas 98.45 .00 91.36 311.11 97.66White haricot 111.11 - 166.67 - .00Dolichos beans 400.00 - 500.00 333.33 .00Other 250.00 750.00 179.04 340.00 302.01
Total Millet 163.64 400.00 140.00 - .00Finger 152.17 400.00 121.95 - -Bullrush 222.22 - 222.22 - .00
Total Sorghum 314.81 .00 400.00 444.44 181.82Local 202.45 .00 382.35 68.97 181.82Brewing Sorghum 660.38 - 1000.00 653.85 -
Wheat .00 .00 - - -Sunflower 125.00 .00 - 181.82 76.92
364

STATISTICAL TABLES
FOR
NSSA 1992/93
SHIRE VALLEY A.D.D.
365/366

LIST OF STATISTICAL TABLES FOR SHIRE VALLEY A.D.D. Table Table title page Number G1.0 Number and percentage of gardens by holding size 371 category G2.0 Percentage of cultivated area by ploughing method 371 Used and holding size category G3.0 Percentage of cultivated area by ridging method used 372 And holding size category G4.0 Percentage of cultivated area by planting method used 373 And holding size category G5.0 Percentage of cultivated area by source of permission 374 To use land and R.D.P. G6.0 Number of plots by holding size category and R.D.P. 374 G7.0 Percentage of plots by maize variety and R.D.P 374 G8.0 Percentage of plots by source of seed and maize variety 375 G9.0 Percentage of plots to which fertilizer was applied by type 375 Of fertilizer G10.0 Percentage of plots to which fertilizer was applied by type 376 Of fertilizer G11.0 Percentage of maize plots to which fertilizer was applied by 376 Type of fertilizer, R.D.P. and sex of household head G12.0 Percentage of maize plots to which fertilizer was applied to 377 By type of fertilizer, R.D.P. and sex of household head G13.0 Percentage of plots to which fertilizer was applied by maize 378 Variety G14.0 Percentage of plots to which fertilizer was applied by maize 379 Variety G15.0 Percentage of maize plots to which fertilizer was applied by 380 Maize variety for male headed households
367/368

G16.0 Percentage of maize plots to which fertilizer was applied by 381 Maize variety for male headed households G17.0 Percentage of maize plots to which fertilizer was applied by 382 Maize variety for female headed households G18.0 Percentage of maize plots to which fertilizer was applied by 383 Maize variety for female headed households G19.0 Fertilizer application on area planted with maize and rice by 384 R.D.P. G20.0 Fertilizer application on area planted with maize and rice for 385 Female headed households by R.D.P. G21.0 Fertilizer application on area planted with maize and rice for 386 Female headed households by R.D.P. G22.0 Percentage of plots to which fertilizer was applied by sex of 387 Household head and source of financing G23.0 Cropping pattern by R.D.P. (Thousand Hectares) 388 G24.0 Percentage cropping pattern by R.D.P. 389 G25.0 Cropping pattern for male headed households by R.D.P. 390 ( Thousand Hectares ) G26.0 Cropping pattern for female headed households by R.D.P. 391 (Thousand Hectares) G27.0 Production for selected crops by R.D.P. (Thousand Tones) 392 G28.0 Production for selected crops for male headed households by 393 R.D.P. (Thousand Tones) G29.0 Production for selected crops for female headed households 394 By R.D.P. (Thousand Tones) G30.0 Mean yield for selected crops by R.D.P. (Kilograms/Hectare) 395 G31.0 Mean yield for selected crops for male headed households by 396 R.D.P (Kilograms/Hectare) G32.0 Mean yield for selected crops for female headed households by 397 R.D.P. (Kilograms/Hectare)
369/370

TABLE G1.0. Number and Percentage of Gardens by Holding Size Category
A.D.D/R.D.P. Total Holding size category of Gardens by Holding size category
Under 0.50 0.50-0.99 1.00-1.49 1.50-1.99 2.00-2.49 2.50-2.993.00 and over
Shire valley .A.D.D.Number 163268 59589 42515 22035 16800 9203 3864 9262Percent 100.0 36.5 26.0 13.5 10.3 5.6 2.4 5.7
Chikwawa R.D.P.Number 99057 26911 23816 15549 13689 7576 2879 8637Percent 100.0 27.2 24.0 15.7 13.8 7.6 2.9 8.7
Nsanje R.D.P.Number 64211 32678 18699 6486 3111 1627 985 625Percent 100.0 50.9 29.1 10.1 4.8 2.5 1.5 1.0
TABLE G2.0. Percentage of Cultivated Area by Ploughing Method Used and Holding Size Category
Ploughing method Total Holding size category (Hectares)
Under 0.50 0.50-0.99 1.00-1.49 1.50-1.99 2.00-2.49 2.50-2.993.00 and over
Shire Valley A.D.DTotal 100.0 16.7 23.6 16.7 14.7 8.9 4.9 14.5Not ploughed this season 57.5 9.7 12.8 10.1 7.6 5.3 2.0 10.0Toilled by hoeing 39.7 6.6 10.0 6.4 6.4 3.6 3.0 3.7Ploughed by oxen .1 .1 .0 .0 - - - -Other 2.7 .3 .8 .1 .7 - - .8Chikwawa R.D.P.Total 100.0 11.1 18.9 16.7 17.9 10.6 5.1 19.7Not ploughed this season 55.2 6.3 10.5 10.4 7.4 5.7 2.0 12.8Toilled by hoeing 41.0 4.6 7.3 6.1 9.4 4.9 3.1 5.7Ploughed by oxen .0 .0 .0 .0 - - - -Other 3.8 .3 1.0 .2 1.1 - - 1.3Nsanje R.D.P.Total 100.0 27.5 32.7 16.6 8.6 5.7 4.6 4.4Not ploughed this season 61.9 16.3 17.2 9.6 7.9 4.6 1.8 4.4Toilled by hoeing 37.1 10.5 15.2 7.0 .6 1.1 2.8 .0Ploughed by oxen .2 .2 - - - - - -Other .7 .4 .3 - - - - -
371

TABLE G3.0. Percentage of cultivated Area by Ridging method used and Holding Size category
Ridging method Total Holding size category (Hectares)
Under 0.50 0.50-0.99 1.00-1.49 1.50-1.99 2.00-2.49 2.50-2.993.00 and over
Shire Valley A.D.D.Total 100.0 16.7 23.6 16.7 14.7 8.9 4.9 14.5Not ridged this season 86.4 14.9 20.7 14.9 12.9 8.0 4.3 10.6Ridged by hoeing 12.9 1.6 2.7 1.8 1.6 .9 .6 3.8Other .7 .2 .1 - .2 - - .2Chikwawa R.D.P.Total 100.0 11.1 18.9 16.7 17.9 10.6 5.1 19.7Not ridged this season 82.6 9.6 14.8 14.5 15.2 9.5 4.8 14.3Ridged by hoeing 16.4 1.2 3.9 2.2 2.4 1.1 .3 5.2Other 1.0 .3 .2 - .3 - - .3Nsanje R.D.P.Total 100.0 27.5 32.7 16.6 8.6 5.7 4.6 4.4Not ridged this season 93.8 25.2 32.3 15.7 8.4 5.2 3.5 3.4Ridged by hoeing 6.2 2.3 .9 .1 .4 1.1 1.0
372

TABLE G4.0. Percentage of cultivated Area by planting method used and Holding size category
Planting method Total Holding size category ( Hectares)
Under 0.50 0.50-0.99 1.00-1.49 1.50-1.99 2.00-2.49 2.50-2.993.00 and over
Shire Valley A.D.D.Total 100.0 16.7 23.6 16.7 14.7 8.9 4.9 14.5Flat planted 79.4 15.2 20.0 14.0 11.1 5.0 3.8 10.3Used last season ridges .9 .0 .1 .1 - .6 .0 .0Used this season ridges 11.1 1.0 2.2 1.4 1.3 .8 .6 3.9Planted into holes 7.6 .4 .9 1.1 2.1 2.5 .5 .1Other 1.0 .0 .4 .1 .3 - - .2Chikwawa R.D.P.Total 100.0 11.1 18.9 16.7 17.9 10.6 5.1 19.7Flat planted 73.3 9.8 14.3 13.2 12.5 5.8 4.0 13.8Used last season ridges .4 .1 .1 .2 - .0 .0 -Used this season ridges 14.2 .8 3.1 1.7 1.8 1.0 .3 5.4Planted into holes 10.5 .3 .8 1.6 3.2 3.8 .8 .1Other 1.5 .1 .6 .1 .5 - - .3Nsanje R.D.P.Total 100.0 27.5 32.7 16.6 8.6 5.7 4.6 4.4Flat planted 91.1 25.7 31.2 15.6 8.3 3.5 3.5 3.4Used last season ridges 1.8 - - - - 1.7 - .1Used this season ridges 5.1 1.3 .4 .7 .2 .4 1.1 .9Planted into holes 1.9 .5 1.2 .3 - - - -
373

TABLE G5.0. Percentage of cuktivated Area by source of permission to use land and R.D.P.
A.D.D./R.DP. TotalRelative by birth-male
Relative by birth-female
Relative by marriage-male
Relative by marriage-female Borrowed
Estate/Scheme Other
Shire Valley A.D.D. 100.0 12.1 5.6 12.8 3.8 48.2 .7 16.8Chikwawa R.D.P. 100.0 14.3 7.5 7.0 4.2 43.1 .6 23.3Nsanje R.D.P. 100.0 7.1 1.2 26.1 2.8 59.7 1.0 2.1
TABLE G6.0. Number of plots by Holding size category and R.D.P.
A.D.D./R.DP. Total Holding size category (Hectares)
Under 0.50 0.50-0.99 1.00-1.49 1.50-1.99 2.00-2.49 2.50-2.993.00 and over
Shire Valley A.D.D. 193960 65445 49859 27304 22562 11871 4423 12496
Chikwawa R.D.P. 119080 28570 27491 19225 18797 9976 3341 11680Nsanje R.D.P. 74880 36875 22368 8079 3765 1895 1082 816
TABLE G7.0. Percentage of plots by maize variety and R.D.P.
A.D.D./R.DP. Total Type of maizeHybrid Composite Local pure stand Local/G-nuts Local/other crop Other
Shire Valley A.D.D. 100.0 15.6 .1 79.9 .2 3.1 1.0
Chikwawa R.D.P. 100.0 13.0 .1 83.1 .0 2.9 .9Nsanje R.D.P. 100.0 21.2 .0 73.4 .6 3.5 1.2
374

TABLE G8.0. Percentage of Plots by Source of Seed and Maize Variety
Maize Variety Total Source of seedRetained from last season
Project/Scheme credit
As seed from
ADMARC
As food from
ADMARC
As food from a market
Bought locally Other
Shire Valley A.D.D.All Maize 100.0 19.3 2.2 10.7 3.1 5.1 46.4 13.2Hybrid 15.6 .6 2.1 3.7 .2 .0 2.6 6.4Composite .1 .0 .0 .0 .0 .0 .0 .1Local pure stand 79.9 17.3 .0 6.3 2.9 4.9 42.9 5.1Loca/G-nuts .2 .2 .0 .0 .0 .0 .0 .0Loca/other crop 3.1 1.3 .1 .1 .0 .2 .4 1.1Other 1.0 .0 .0 .0 .0 .0 .6 .4
Chikwawa R.D.P.All Maize 100.0 24.8 1.3 13.6 .5 6.7 38.4 14.7Hybrid 13.0 .4 1.3 3.6 .0 .0 2.1 5.6Composite .1 .0 .0 .0 .0 .0 .0 .1Local pure stand 83.1 23.5 .0 10.0 .5 6.5 35.9 6.7Loca/other crop 2.9 1.0 .0 .0 .0 .2 .1 1.6Other .9 .0 .0 .0 .0 .0 .3 .7
Nsanje R.D.P.All Maize 100.0 7.8 4.1 4.6 8.4 1.7 63.2 10.2Hybrid 21.2 1.0 3.9 3.8 .6 .0 3.6 8.3Local pure stand 73.4 4.4 .0 .3 7.8 1.7 57.5 1.8Loca/G-nuts .6 .5 .0 .1 .0 .0 .0 .0Loca/other crop 3.5 2.0 .2 .3 .0 .0 .9 .1Other 1.2 .0 .0 .0 .0 .0 1.2 .0
TABLE G9.0. Percentage of plots to which Fertilizer was applied by Type of Fertilizer
A.D.D./R.D.P First Total None used 23;21 0+45 CAN UREA Mixture Other
Shire Valley A.D.D. 100.0 97.8 .2 .0 1.8 .0 .0
Chikwawa R.D.P. 100.0 97.2 .3 .1 2.3 .1 .1Nsanje R.D.P. 100.0 98.8 .0 .0 1.2 .0 .0
375

TABLE G10.0. Percentage of plots to which Fertilizer was Applied by Type of Fertilizer
A.D.D/R.D.P. Second ApplicationTotal None used DAP 23;21 0+45 UREA Mixture
Shire Valley A.D.D. 100.0 99.5 .2 .0 .2 .0
Chikwawa R.D.P. 100.0 99.4 .4 .1 .1 .1Nsanje R.D.P. 100.0 99.7 .0 .0 .3 .0
TABLE G11.0. Percentage of Maize plots to which Fertilizer was Applied by Type of Fertilizer, R.D.P. and sex of Household head
A.D.D./R.D.P First ApplicationTotal None used 23;21 0+45 CAN UREA Mixture Other
Shire Valley A.D.D.
Total 100.0 97.8 .2 .0 1.8 .0 .0
Male 74.2 72.7 .2 .0 1.2 .0 .0Female 25.8 25.1 .0 .0 .6 .0 .0
Chikwawa R.D.P.
Total 100.0 97.2 .3 .1 2.3 .1 .1
Male 75.8 74.1 .3 .1 1.3 .0 .1Female 24.2 23.1 .1 .0 1.0 .1 .0
Nsanje R.D.P.
Total 100.0 98.8 .0 .0 1.2 .0 .0
Male 71.7 70.5 .0 .0 1.2 .0 .0Female 28.3 28.3 .0 .0 .0 .0 .0
376

TABLE G12.0. Percentage of Maize plots which Fertilizer was Applied to by Type of Fertilizer, R.D.P. and sex of Household Head
A.D.D/R.D.P. Second ApplicationTotal None used DAP 23;21 0+45 UREA Mixture
Shire Valley A.D.D.
Total 100.0 99.5 .2 .0 .2 .0
Male 74.2 73.8 .2 .0 .1 .0Female 25.8 25.7 .0 .0 .1 .0
Chikwawa R.D.P.
Total 100.0 99.4 .4 .1 .1 .1
Male 75.8 75.4 .4 .1 .0 .0Female 24.2 24.0 .0 .0 .1 .1
Nsanje R.D.P.
Total 100.0 99.7 .0 .0 .3 .0
Male 71.7 71.4 .0 .0 .3 .0Female 28.3 28.3 .0 .0 .0 .0
377

TABLE G13.0. Percentage of plots to which Fertilizer was Applied by Maize Variety
Maize Variety First Application
Total None used 23;21 0+45 UREAShire Valley A.D.D.
All Maize 100.0 97.1 .4 2.4
Hybrid 15.6 13.7 .3 1.6Composite .1 .1 .0 .0Local pure stand 79.9 79.0 .1 .8Loca/G-nuts .2 .2 .0 .0Local/Other crop 3.1 3.1 .0 .0Other 1.0 1.0 .0 .0
Chikwawa R.D.P
All Maize 100.0 95.7 .6 3.6
Hybrid 13.0 10.1 .5 2.4Composite .1 .1 .0 .0Local pure stand 83.1 81.7 .1 1.3Local/Other crop 2.9 2.9 .0 .0Other .9 .9 .0 .0
Nsanje R.D.P.
All Maize 100.0 100.0 .0 .0
Hybrid 21.2 21.2 .0 .0Local pure stand 73.4 73.4 .0 .0Loca/G-nuts .6 .6 .0 .0Local/Other crop 3.5 3.5 .0 .0Other 1.2 1.2 .0 .0
376

TABLE G14.0. Percentage of plots to which Fertilizer was Applied by Maize Variety
Maize VarietyTotal None used DAP 23;21 0+45
Shire Valley A.D.D.
All Maize 100.0 99.4 .5 .1
Hybrid 15.6 15.0 .5 .1Composite .1 .1 .0 .0Local pure stand 79.9 79.9 .0 .0Loca/G-nuts .2 .2 .0 .0Local/Other crop 3.1 3.1 .0 .0Other 1.0 1.0 .0 .0
Chikwawa R.D.P
All Maize 100.0 99.1 .7 .1
Hybrid 13.0 12.1 .7 .1Composite .1 .1 .0 .0Local pure stand 83.1 83.1 .0 .0Local/Other crop 2.9 2.9 .0 .0Other .9 .9 .0 .0
Nsanje R.D.P.
All Maize 100.0 100.0 .0 .0
Hybrid 21.2 21.2 .0 .0Local pure stand 73.4 73.4 .0 .0Loca/G-nuts .6 .6 .0 .0Local/Other crop 3.5 3.5 .0 .0Other 1.2 1.2 .0 .0
Second Application
379

TABLE G15.0. Percentage of Maize plots to which Fertilizer was Applied by Maize Variety for Male Headed Households
Maize VarietyTotal None used 23;21 0+45 UREA
Shire Valley A.D.D.
All Maize 100.0 97.4 .5 2.2Hybrid 15.7 13.9 .5 1.3Composite .1 .1 .0 .0Local pure stand 79.8 79.0 .0 .8Loca/G-nuts .2 .2 .0 .0Local/Other crop 3.0 3.0 .0 .0Other 1.2 1.2 .0 .0
Chikwawa R.D.P.
All Maize 100.0 96.1 .7 3.2Hybrid 14.4 11.8 .7 2.0Composite .2 .2 .0 .0Local pure stand 81.8 80.6 .0 1.2Local/Other crop 2.6 2.6 .0 .0Other 1.0 1.0 .0 .0
Nsanje R.D.P.
All Maize 100.0 100.0 .0 .0Hybrid 18.3 18.3 .0 .0Local pure stand 75.5 75.5 .0 .0Loca/G-nuts .7 .7 .0 .0Local/Other crop 3.7 3.7 .0 .0Other 1.7 1.7 .0 .0
First Application

TABLE G16.0. Percentage of Maize plots to which Fertilizer was Applied by Maize Variety for Male Headed Households
Maize VarietyTotal None used 23;21 0+45 UREA
Shire Valley A.D.D.
All Maize 100.0 99.2 .7 .1Hybrid 15.7 14.9 .7 .1Composite .1 .1 .0 .0Local pure stand 79.8 79.8 .0 .0Loca/G-nuts .2 .2 .0 .0Local/Other crop 3.0 3.0 .0 .0Other 1.2 1.2 .0 .0
Chikwawa R.D.P.
All Maize 100.0 98.8 1.0 .2Hybrid 14.4 13.3 1.0 .2Composite .2 .2 .0 .0Local pure stand 81.8 81.8 .0 .0Local/Other crop 2.6 2.6 .0 .0Other 1.0 1.0 .0 .0
Nsanje R.D.P.
All Maize 100.0 100.0 .0 .0Hybrid 18.3 18.3 .0 .0Local pure stand 75.5 75.5 .0 .0Loca/G-nuts .7 .7 .0 .0Local/Other crop 3.7 3.7 .0 .0Other 1.7 1.7 .0 .0
Second Application
381

TABLE G17.0. Percentage of maize plots to which Fertilizer was Applied by Maize Variety for Female Headed Households
Maize Variety Fertilizer ApplicationTotal None used 23;21 0+45 UREA
Shire Valley A.D.D.
All Maize 100.0 96.5 .3 3.2Hybrid 15.5 13.2 .0 2.3Local pure stand 80.3 79.1 .3 .9Loca/G-nuts .1 .1 .0 .0Local/Other crop 3.6 3.6 .0 .0Other .5 .5 .0 .0
Chikwawa R.D.P.
All Maize 100.0 94.7 .5 4.9Hybrid 8.9 5.5 .0 3.5Local pure stand 86.5 84.6 .5 1.4Local/Other crop 3.8 3.8 .0 .0Other .7 .7 .0 .0
Nsanje R.D.P.
All Maize 100.0 100.0 .0 .0Hybrid 27.9 27.9 .0 .0Local pure stand 68.5 68.5 .0 .0Loca/G-nuts .4 .4 .0 .0Local/Other crop 3.1 3.1 .0 .0
382

TABLE G18.0. Percentage of maize plots to which Fertilizer was Applied by Maize Variety for Female Headed Households
Maize Variety Second applicationTotal None used
Shire Valley A.D.D.
All Maize 100.0 100.0Hybrid 15.5 15.5Local pure stand 80.3 80.3Loca/G-nuts .1 .1Local/Other crop 3.6 3.6Other .5 .5
Chikwawa R.D.P.
All Maize 100.0 100.0Hybrid 8.9 8.9Local pure stand 86.5 86.5Local/Other crop 3.8 3.8Other .7 .7
Nsanje R.D.P.
All Maize 100.0 100.0Hybrid 27.9 27.9Local pure stand 68.5 68.5Loca/G-nuts .4 .4Local/Other crop 3.1 3.1
383

TABLE G19.0. Fertilizer Application on Area planted with Maize and Rice by R.D.P.
R.D.P.Total Area (Hectares)
Area Fertilized (Hectares
Percentage Fertilized
Chikwawa R.D.P.
Total Maize 31894.79 1848.17 5.79
Hybrid 4200.85 1463.11 34.83Composite 40.82 - -Local pure stand 26508.84 385.06 1.45Local/other crop 915.07 - -Other 229.21 - -
Total Rice 532.76 47.25 8.87
Kilombera 31.57 - -Other local 321.14 - -Faya 132.81 - -Other 47.25 47.25 100.0
Nsanje R.D.P.
Total Maize 10268.84 - -
Hybrid 1627.35 - -Local pure stand 7863.87 - -Local/G-nuts 82.67 - -Local/other crop 458.90 - -Other 236.06 - -
Total Rice 667.02 32.64 4.89
Bluebonnet 339.30 - -Mixture 279.27 - -Other 48.45 32.64 67.67
384

TABLE G20.0. Fertilizer Application on Area Planted withMaize and Rice for Male Headed Households by R.D.P.
R.D.P.Total Area (Hectares)
Area FertilisedHectares)
Percentage Fertilized
Chikwawa R.D.P.Total Maize 23536.52 1398.10 5.94Hybrid 3379.26 1118.88 33.11Composite 40.82 - -Local pure stand 19330.24 279.22 1.44Local/Other crop 588.44 - -Other 197.75 - -Total Rice 426.32 8.48 1.99Kilombera 31.57 - -Other local 253.46 - -Faya 132.81 - -Other 8.48 8.48 100.00
Nsanje R.D.P.Total Maize 7440.64 - - Hybrid 1127.43 - -Local pure stand 5626.42 - - Loca/G-nuts 71.74 - -Local/Other crop 378.99 - - Other 236.06 - -Total Rice 520.86 32.64 6.27Bluebonnet 281.88 - -Mixture 190.53 - -Other 48.45 32.64 67.37
385

TABLE G21.0. Fertilizer Application on Area Planted with Maize and Rice for Female Headed Households by R.D.P.
R.D.P.Total Area (Hectares)
Area Fertilised (Hectares)
Percentage Fertilized
Chikwawa R.D.P.Total Maize 8358.27 450.07 5.38Hybrid 821.58 344.23 41.90Local pure stand 7178.60 105.84 1.47Local/Other crop 326.63 - -Other 31.46 - -Total Rice 106.45 38.77 36.42Other local 67.68 - -Other 38.77 38.77 100.00
Nsanje R.D.P.Total Maize 2828.21 - -Hybrid 499.92 - -Local pure stand 2237.44 - -Loca/G-nuts 10.93 - -Local/Other crop 79.91 - -Total Rice 146.16 - -Bluebonnet 57.42 - -Mixture 88.74 - -
386
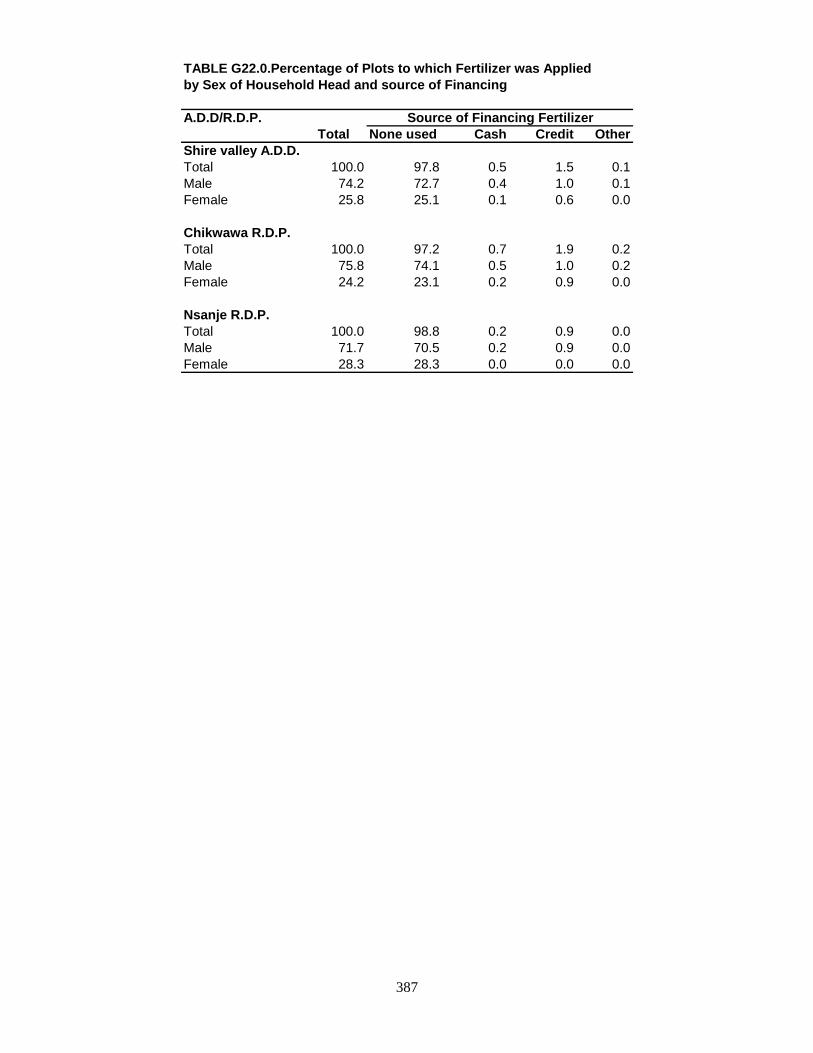
TABLE G22.0.Percentage of Plots to which Fertilizer was Applied by Sex of Household Head and source of Financing
A.D.D/R.D.P.Total None used Cash Credit Other
Shire valley A.D.D.Total 100.0 97.8 0.5 1.5 0.1Male 74.2 72.7 0.4 1.0 0.1Female 25.8 25.1 0.1 0.6 0.0
Chikwawa R.D.P.Total 100.0 97.2 0.7 1.9 0.2Male 75.8 74.1 0.5 1.0 0.2Female 24.2 23.1 0.2 0.9 0.0
Nsanje R.D.P.Total 100.0 98.8 0.2 0.9 0.0Male 71.7 70.5 0.2 0.9 0.0Female 28.3 28.3 0.0 0.0 0.0
Source of Financing Fertilizer
387

TABLE G23.0. Cropping Pattern by R.D.P. (Thousand Hectares)
CropShire valley
A.D.D.Chikwawa
R.D.P.Nsanje R.D.P.
Total Maize 42.18 31.90 10.28Hybrid 5.83 4.20 1.63Composite 0.04 0.04 -Local pure stand 34.38 26.51 7.87Local/G-nuts 0.08 - 0.08Local/Pulses 0.63 0.63 -Local/Millet 0.41 0.05 0.36Local/Sorghum 0.34 0.24 0.10Other 0.47 0.23 0.24
Total G-nuts 0.35 - 0.35Chalimbana 0.05 - 0.05Malimba 0.21 - 0.21Other local variety 0.07 - 0.07Other/unknown 0.02 - 0.02
Total Rice 1.20 0.53 0.67Kilombera 0.03 0.03 -Other local 0.32 0.32 - Faya 0.13 0.13 -Bluebonnet 0.34 - 0.34Mixture 0.28 - 0.28Other local 0.10 0.05 0.05
Total Pulses 1.70 0.10 1.60Mixed Beans 0.01 0.01 -Pegion Peas 0.09 0.09 -Other 1.60 - 1.60
Total Sorghum 12.35 7.77 4.58local 11.50 7.23 4.27Selected Local 0.01 0.01 -Improved 0.34 0.21 0.13Brewing Sorghum 0.18 0.04 0.14Mixture 0.19 0.19 -Other 0.13 0.09 0.04
Total Millet 9.91 1.90 8.01Finger 0.26 0.07 0.19Bullrush 9.43 1.61 7.82Mixture 0.20 0.20 -Other 0.02 0.02 -
Cassava 0.08 0.08 -Sweet Potatoes 0.07 0.04 0.03Cotton 24.87 23.67 1.23
Total Tobacco 0.02 0.02 -Burley 0.02 0.02 -
388

TABLE G24.0. Percentage Cropping Pattern by R.D.P.
CropShire valley
A.D.D.Chikwawa
R.D.P.Nsanje R.D.P.
Total Maize 100.0 100.0 100.0Hybrid 13.8 13.2 15.9Composite 0.1 0.1 -Local pure stand 81.5 83.1 76.6Local/G-nuts 0.2 - 0.8Local/Pulses 1.2 2.0 -Local/Millet 1.0 0.2 3.5Local/Sorghum 0.8 0.8 1.0Other 1.1 0.7 2.3
Total G-nuts 100.0 - 100.0Chalimbana 14.3 - 14.3Malimba 60.0 - 60.0Other local variety 20.0 - 20.0Other/unknown 5.7 - 5.7
Total Rice 100.0 100.0 100.0Kilombera 2.5 5.7 -Other local 26.7 60.4 -Faya 10.8 24.5 -Bluebonnet 28.3 - 50.8Mixture 23.3 - 41.8Other local 8.3 9.4 7.5
Total Pulses 100.0 100.0 100.0Mixed Beans 0.6 10.0 -Pegion Peas 5.3 90.0 -Other 94.1 - 100.0
Total Millet 100.0 100.0 100.0Finger 2.6 3.7 2.4Bullrush 95.2 84.7 97.6Mixture 2.0 10.5 -Other 0.2 1.1 -
Total Sorghum 100.0 100.0 100.0local 93.1 93.1 93.2Selected Local 0.1 0.1 -Improved 2.8 2.7 2.8Brewing Sorghum 1.5 0.5 3.1Mixture 1.5 2.5 -Other 1.1 1.2 0.9
Cassava 100.0 100.0 -Sweet Potatoes 100.0 100.0 100.0Cotton 100.0 100.0 100.0
Total Tobacco 100.0 100.0 -Burley 100.0 100.0 -
389

TABLE G25.0. Cropping Pattern for Male HeadedHouseholds by R.D.P. (Thousand Hectares)
CropShire valley A.D.D.
Chikwawa R.D.P.
Nsanje R.D.P.
Total Maize 30.99 23.54 7.45Hybrid 4.51 3.38 1.13Composite 0.04 0.04 -Local pure stand 24.96 19.33 5.63Local/G-nuts 0.07 - 0.07Local/Pulses 0.55 0.55 -Local/Millet 0.36 - 0.36Local/Sorghum 0.06 0.04 0.02Other 0.44 0.20 0.24
Total G-nuts 0.31 - 0.31Chalimbana 0.05 - 0.05Malimba 0.20 - 0.20Other local variety 0.06 - 0.06
Total Rice 0.94 0.42 0.52Kilombera 0.03 0.03 -Other local 0.25 0.25 -Faya 0.13 0.13 -Bluebonnet 0.28 - 0.28Mixture 0.19 - 0.19Other local 0.06 0.01 0.05
Total Pulses 1.36 0.10 1.26Mixed Beans 0.01 0.01 -Pegion Peas 0.09 0.09 -Other 1.26 - 1.26
Total Millet 7.77 1.30 6.47Finger 0.17 0.05 0.12Bullrush 7.55 1.20 6.35Mixture 0.03 0.03 -Other 0.02 0.02 -
Total Sorghum 9.62 6.08 3.54local 9.18 5.86 3.32Selected Local 0.01 0.01 -Improved 0.19 0.06 0.13Brewing Sorghum 0.05 - 0.05Mixture 0.10 0.10 -Other 0.09 0.05 0.04
Cassava 0.08 0.08 -Sweet Potatoes 0.04 0.04 -Cotton 19.98 19.04 0.93
Total Tobacco 0.01 0.01 -Burley 0.01 0.01 -
390
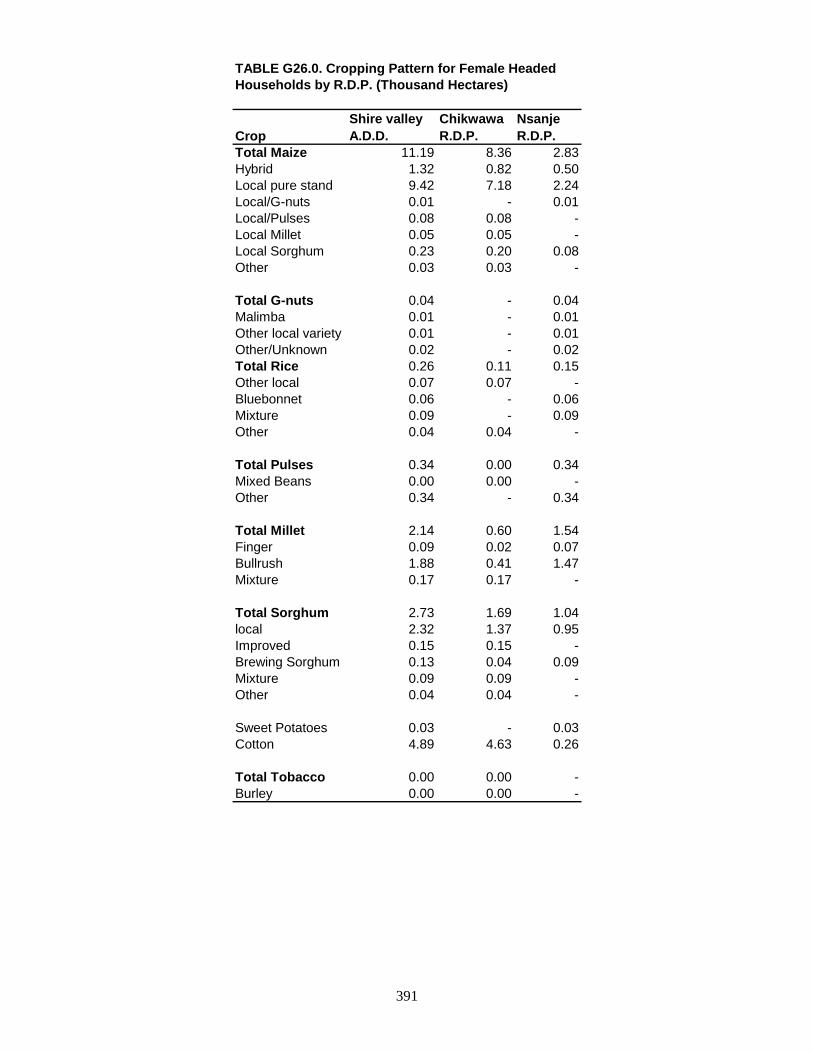
TABLE G26.0. Cropping Pattern for Female HeadedHouseholds by R.D.P. (Thousand Hectares)
CropShire valley A.D.D.
Chikwawa R.D.P.
Nsanje R.D.P.
Total Maize 11.19 8.36 2.83Hybrid 1.32 0.82 0.50Local pure stand 9.42 7.18 2.24Local/G-nuts 0.01 - 0.01Local/Pulses 0.08 0.08 -Local Millet 0.05 0.05 -Local Sorghum 0.23 0.20 0.08Other 0.03 0.03 -
Total G-nuts 0.04 - 0.04Malimba 0.01 - 0.01Other local variety 0.01 - 0.01Other/Unknown 0.02 - 0.02Total Rice 0.26 0.11 0.15Other local 0.07 0.07 -Bluebonnet 0.06 - 0.06Mixture 0.09 - 0.09Other 0.04 0.04 -
Total Pulses 0.34 0.00 0.34Mixed Beans 0.00 0.00 -Other 0.34 - 0.34
Total Millet 2.14 0.60 1.54Finger 0.09 0.02 0.07Bullrush 1.88 0.41 1.47Mixture 0.17 0.17 -
Total Sorghum 2.73 1.69 1.04local 2.32 1.37 0.95Improved 0.15 0.15 -Brewing Sorghum 0.13 0.04 0.09Mixture 0.09 0.09 -Other 0.04 0.04 -
Sweet Potatoes 0.03 - 0.03Cotton 4.89 4.63 0.26
Total Tobacco 0.00 0.00 -Burley 0.00 0.00 -
391

TABLE G27.0. Production for Selected Crops by R.D.P.(Thousand Tonnes)
CropShire valley
A.D.DChikwawa
R.D.P.Nsanje R.D.P.
Total Maize 62.42 53.34 9.08Hybrid 10.08 8.81 1.27Composite 0.09 0.09 -Local pure stand 51.47 43.88 7.59Local/G-nuts 0.00 - 0.00Local/Pulses 0.52 0.52 -Local Millet 0.26 0.04 0.22Local Sorghum 0.00 0.00 0.00Other 0.00 0.00 0.00
Total G-nuts 0.12 - 0.12Chalimbana 0.03 - 0.03Malimba 0.02 - 0.02Other local variety 0.06 - 0.06Other/Unknown 0.01 - 0.01
Total Rice 1.53 1.16 0.37Kilombera 0.12 0.12 -Other local 0.55 0.55 -Faya 0.13 0.13 -Bluebonnet 0.26 - 0.26Mixture 0.06 - 0.06Other 0.41 0.36 0.05
Total Pulses 1.23 0.00 1.23Mixed Beans 0.00 0.00 -Pegion peas 0.00 0.00 -Other 1.23 - 1.23
Total Millet 8.28 2.06 6.22Finger 0.34 0.06 0.28Bullrush 7.53 1.59 5.94Mixture 0.38 0.38 -Other 0.03 0.03 -
Total Sorghum 10.37 8.09 2.28local 9.69 7.59 2.10Selected local 0.02 0.02 -Improved 0.25 0.20 0.05Brewing Sorghum 0.16 0.03 0.13Mixture 0.16 0.16 -Other 0.09 0.09 0.00
392

TABLE G28.0. Production for selected crops for MaleHeaded Households by R.D.P. (Thousand Tonnes)
CropShire valley
A.D.DChikwawa
R.D.P.Nsanje R.D.P.
Total Maize 47.16 40.98 6.18Hybrid 8.64 7.71 0.93Composite 0.09 0.09 -Local pure stand 37.73 32.70 5.03Local/G-nuts 0.00 - 0.00Local/Pulses 0.48 0.48 -Local Millet 0.22 - 0.22Local Sorghum 0.00 0.00 0.00Other 0.00 0.00 0.00
Total G-nuts 0.09 - 0.09Chalimbana 0.03 - 0.03Malimba 0.02 - 0.02Other local variety 0.04 - 0.4
Total Rice 1.13 0.80 0.33Kilombera 0.12 0.12 -Other local 0.51 0.51 -Faya 0.13 0.13 -Bluebonnet 0.24 - 0.24Mixture 0.04 - 0.04Other 0.09 0.04 0.05
Total Pulses 1.23 0.00 1.23Mixed Beans 0.00 0.00 -Pegion peas 0.00 0.00 -Other 1.23 0.00 1.23
Total Millet 5.92 1.04 4.88Finger 0.23 0.04 0.19Bullrush 5.62 0.93 4.69Mixture 0.04 0.04 -Other 0.03 0.03 -
Total Sorghum 7.82 6.22 1.60local 7.54 6.03 1.51Selected local 0.02 0.02 -Improved 0.11 0.06 0.05Brewing Sorghum 0.04 - 0.04Mixture 0.06 0.06 -Other 0.05 0.05 0.00
393

TABLE G29.0. Production for selected crops for FemaleHeaded Households by R.D.P. (Thousand Tonnes)
CropShire valley
A.D.DChikwawa
R.D.P.Nsanje R.D.P.
Total Maize 15.26 12.36 2.90Hybrid 1.44 1.10 0.34Local pure stand 13.74 11.18 2.56Local/G-nuts 0.00 - 0.00Local/Pulses 0.04 0.04 -Local Millet 0.04 0.04 -Local Sorghum 0.00 0.00 0.00Other 0.00 0.00 -
Total G-nuts 0.03 - 0.03Malimba 0.00 - 0.00Other local variety 0.02 - 0.02Other/unknown 0.01 - 0.01Total Rice 0.40 0.36 0.04Other local 0.04 0.04 -Bluebonnet 0.02 - 0.02Mixture 0.02 - 0.02Other 0.32 0.32 -
Total Pulses 0.00 0.00 0.00Mixed Beans 0.00 0.00 -Other 0.00 - 0.00
Total Millet 2.36 1.02 1.34Finger 0.11 0.02 0.09Bullrush 1.91 0.66 1.25Millet 0.34 0.34 -
Total Sorghum 2.55 1.87 0.68local 2.15 1.56 0.59Improved 0.14 0.14 -Brewing Sorghum 0.12 0.03 0.09Mixture 0.10 0.10 -Other 0.04 0.04 -
394

TABLE G30.0. Mean yield for selected crops by R.D.P.(Kilograms/Hectre)
CropShire valley
A.D.D.Chikwawa
R.D.P.Nsanje R.D.P.
Total Maize 1479.85 1672.10 883.27Hybrid 1728.99 20.97.62 779.14Composite 2250.00 2250.00 -Local pure stand 1497.09 1655.22 964.42Local/G-nuts 0.00 - 0.00Local/Pulses 825.40 825.40 -Local/Millet 634.15 800.00 611.11Local/Sorghum 0.00 0.00 0.00Other 0.00 0.00 0.00
Total G-nuts 342.86 - 342.86Chalimbana 600.00 - 600.00Malimba 95.24 - 95.24Other local variety 857.14 - 857.14Other/unknown 500.00 - 500.00
Total Rice 1275.00 2188.68 552.24Kilombera 4000.00 4000.00 -Other local 1718.75 1718.75 -Faya 1000.00 1000.00 -Bluebonnet 764.71 - 764.71Mixture 214.29 - 214.29Other local 4100.00 7200.00 1000.00
Total Pulses 723.53 0.00 768.75Mixed Beans 0.00 0.00 -Pegion Peas 0.00 0.00 -Other 768.75 - 768.75
Total Millet 835.52 1084.21 776.53Finger 1307.69 857.14 1473.68Bullrush 798.52 987.58 759.59Mixture 1900.00 1900.00 -Other 1500.00 1500.00 -
Total Sorghum 839.68 1041.18 497.82local 842.61 1049.79 491.80Selected Local 2000.00 2000.00 -Improved 735.29 952.38 384.62Brewing Sorghum 888.89 750.00 928.57Mixture 842.11 842.11 -Other 692.31 1000.00 0.00
395
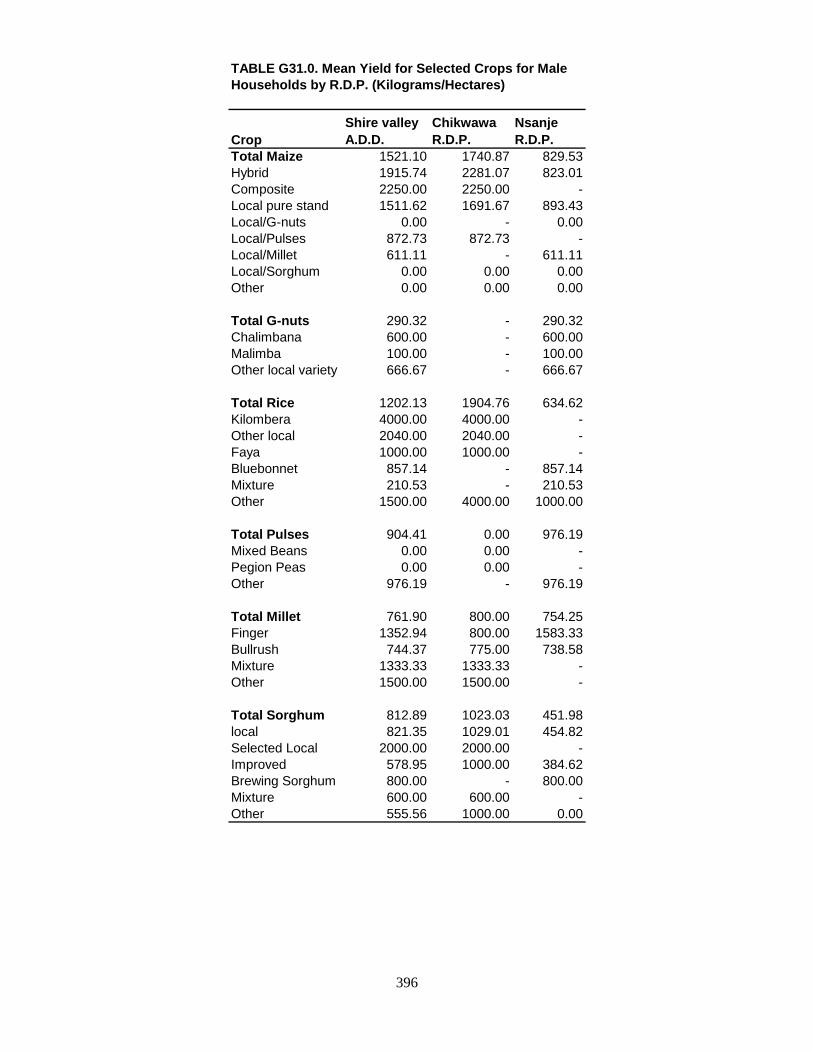
TABLE G31.0. Mean Yield for Selected Crops for MaleHouseholds by R.D.P. (Kilograms/Hectares)
CropShire valley A.D.D.
Chikwawa R.D.P.
Nsanje R.D.P.
Total Maize 1521.10 1740.87 829.53Hybrid 1915.74 2281.07 823.01Composite 2250.00 2250.00 -Local pure stand 1511.62 1691.67 893.43Local/G-nuts 0.00 - 0.00Local/Pulses 872.73 872.73 -Local/Millet 611.11 - 611.11Local/Sorghum 0.00 0.00 0.00Other 0.00 0.00 0.00
Total G-nuts 290.32 - 290.32Chalimbana 600.00 - 600.00Malimba 100.00 - 100.00Other local variety 666.67 - 666.67
Total Rice 1202.13 1904.76 634.62Kilombera 4000.00 4000.00 -Other local 2040.00 2040.00 -Faya 1000.00 1000.00 -Bluebonnet 857.14 - 857.14Mixture 210.53 - 210.53Other 1500.00 4000.00 1000.00
Total Pulses 904.41 0.00 976.19Mixed Beans 0.00 0.00 -Pegion Peas 0.00 0.00 -Other 976.19 - 976.19
Total Millet 761.90 800.00 754.25Finger 1352.94 800.00 1583.33Bullrush 744.37 775.00 738.58Mixture 1333.33 1333.33 -Other 1500.00 1500.00 -
Total Sorghum 812.89 1023.03 451.98local 821.35 1029.01 454.82Selected Local 2000.00 2000.00 -Improved 578.95 1000.00 384.62Brewing Sorghum 800.00 - 800.00Mixture 600.00 600.00 -Other 555.56 1000.00 0.00
396

TABLE G32.0. Mean Yield for Selected Crops for FemaleHeaded Households by R.D.P. (Kilograms/Hectare)
CropShire Valley
A.D.D.Chikwawa
R.D.P. Nsanje R.D.PTotal Maize 1363.72 1478.47 1024.73Hybrid 1090.91 1341.46 680.00Local pure stand 1458.60 1557.10 1142.86Local/G-nuts 0.00 - 0.00Local/Pulses 500.00 500.00 -Local/Millet 800.00 800.00 -Local/Sorghum 0.00 0.00 0.00Other 0.00 0.00 -
Total G-nuts 750.00 - 750.00Malimba 0.00 - 0.00Other local variety 2000.00 - 2000.00Other/unknown 500.00 - 500.00
Total Rice 1538.46 3272.73 266.67Other local 571.43 571.43 -Bluebonnet 333.33 - 333.33Mixture 222.22 - 222.22Other 8000.00 8000.00 -
Total Pulses 0.00 0.00 0.00Mixed Beans 0.00 0.00 -Other 0.00 - 0.00
Total Millet 1102.80 1700.00 870.13Finger 1222.22 1000.00 1285.71Bullrush 1015.96 1609.76 850.34Mixture 2000.00 2000.00 -
Total Sorghum 934.07 1106.51 653.85local 926.72 1138.69 621.05Improved 933.33 933.33 -Brewing Sorghum 923.08 750.00 1000.00Mixture 1111.11 1111.11 -Other 1000.00 1000.00 -
397/398

APPENDIX I. MAP OF MALAWI SHOWING ADDs
399

CONFINDENTIAL FROM NSSA/92/93/3 NATIONAL SAMPLE SURVER OF AGRICULTURE MALAWI GOVERNMENT GARDEN SURVEY PART A: IDETIFICATION Survey Number ( 1 )
Region/District ( 2-3 )A D D ( 4 )Project ( 5 )Household Head ( 6 )
Stratum ( 7-8 )
Enumeration Area ( 9-11 )Village ( 12-13 )Household Number ( 14-15 )Garden Number ( 16-17 )
407

-2- PART B: GARDEN DETAILS 1. What type of garden is it?
Rain-fed garden 1
Dimba Garden 2 (18)Irrigated Garden 3Other (Specify. . . . . . . . . . ) 4
2. Is this your own garden?
Yes 1No 2 (19)
3. If yes to question 2, how long have you been in control of the garden?
Less than 2 years 1
From 2 to 5 years 2 More than 5 years 3 (20) Don't know 4 Specify years . . . . . . . . . . . .
408

3-
4. If No to question 2, from whom did you obtain permission to use the garden?
Relative by birth-male 1Relative by birth-female 2Relative by marriage-male 3Relative by marriage-female 4 ( 21 )Borrowed 5Estate/Scheme 6Other (Specify…………….) 9
5. Who was using this garden before?
Relative by birth-male 1Relative by birth-female 2Relative by marriage-male 3Relative by marriage-female 4Village Headman 5 -22Estate/Scheme 6Virgin land 7Don’t know 8Other No-Relative (Specify……………) 9
409

SKETCH: Draw a sketch of the whole garden indicating clearly all the plots in it. North Arrow
410
Plot No.
1st Main Crop
2nd Main Crop
3rd Main Crop
1st Random Number
2nd Random Number
Date YSP Laid
Area
01 02 03 04 05

-5- PART C: PLOT DETAILS 6. ( a ) Plot Number (23-24) ( b ) Operator Number ( 25-26 ) Specify Name of the Operator. . . . . . . . . . . . . . .
( c ) Sex of the Operator
Male 1 ( 27) Female 2
( d ) Plot Area (28-31) 7. What crops are grown in this plot? Indicate Variety if maize, groundnuts or rice is grown. 1st Main Crop . . . . . . . . . . . . . . . .. . . . . . .
2nd Main Crop . . . . . . . . . . . . . . . . . . . . . .
2rd Main Crop . . . . .. . . . . . . . . .. . . . .. . . .
411

-6-
8. ( a ) What crops were grown in this plot last Season? Indicate variety if Maize, G/nuts or rice
was grown. 1st Main Crop. . . . . . . . . . . . . . . . . . .. . . . . . . . (32-34 )
2nd Main Crop. . . .. . . . . . . . . . . . . . . . .. . . . . . ( 35-37 ) 3rd Main Crop. . . . . . . . .. . . . . . . . . . . . . . . . . (38-40 ) ( b ) What crops were grown in this plot before last season? Indicate Variety if Maize, G/nuts or rice
was grown. 1st Main Crop. . . . . . . . . . . . . . . . . . .. . . . . . . . ( 41-43 )
2nd Main Crop. . . .. . . . . . . . . . . . . . . . .. . . . . . ( 44-46 )
3rd Main Crop. . . . . . . . .. . . . . . . . . . . . . . . . . (47-49 )
412

-7- 9. Where did the operator obtain seeds which he/she planted in this plot?
Retained from last season 1
Project/Scheme Credit 2
As seed from ADMARC 3
As food from ADMARC 4 (50)
As food from a market 5
Bought locally 6
Other (Specify)…………2.. 9 10. How was this plot ploughed this season?
Not ploughed this season 0
Tilled by hoeing 1 (51)
Ploughed by oxen 2
Other (Specify……………) 9
413

RE-SURVEY/ CONTINUATION Garden Plot No
Stations Forward bearing
Length Of side
Backward bearing
Plot no
Plot stations From-To
Forward bearing
Length of side
Cumulative Lengths of plot sides
Backward bearing

GARDEN MEASUREMENTS PLOT MEASUREMENTS Garden Stations from-To
Forward bearing
Length Of side
Backward bearing
Plot no
Plot stations From-To
Forward bearing
Length of side
Cumulative Lengths of plot sides
Backward bearing
A-B B-C C-D D-E E-F F-G G-H H-I I-J J-K K-L L-M M-N N-O O-P P-Q Q-R R-S S-T T-U U-V V-W W-X X-Y Y-Z Z-A A-B B-C C-D D-E E-F F-G G-H I-J J-K K-L L-M
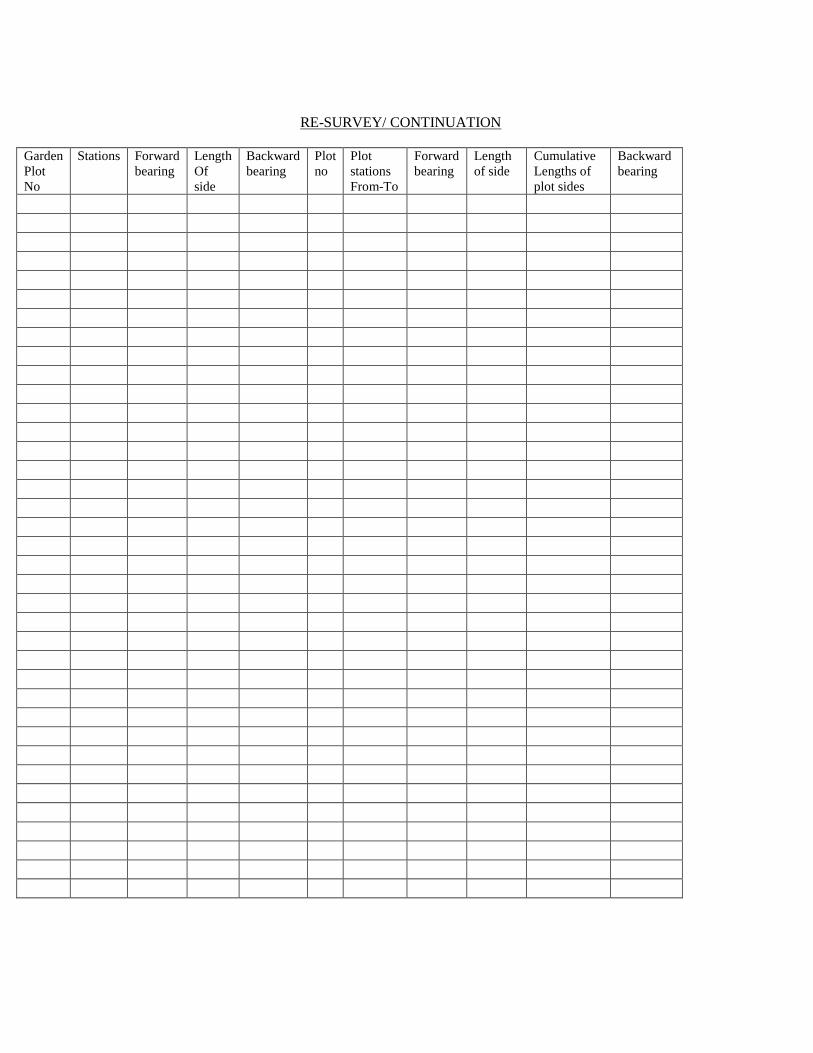
RE-SURVEY/ CONTINUATION
Garden Plot No
Stations Forward bearing
Length Of side
Backward bearing
Plot no
Plot stations From-To
Forward bearing
Length of side
Cumulative Lengths of plot sides
Backward bearing

GARDEN MEASUREMENTS PLOT MEASUREMENTS Garden Stations from-To
Forward bearing
Length Of side
Backward bearing
Plot no
Plot stations From-To
Forward bearing
Length of side
Cumulative Lengths of plot sides
Backward bearing
A-B B-C C-D D-E E-F F-G G-H H-I I-J J-K K-L L-M M-N N-O O-P P-Q Q-R R-S S-T T-U U-V V-W W-X X-Y Y-Z Z-A A-B B-C C-D D-E E-F F-G G-H I-J J-K K-L L-M

-8-
11. ( a ) If ploughed by oxen, indicate number of hour/days spent
No. Of hours (52-54)
No. Of days (55-57) ( b ) Indicate total amount spent if oxen rented
Total amount ( 58-62 )
Not applicable 9 ( 63 ) 12. How was this plot ridged this season?
Not ridged this season 0
Ridged by hoeing 1
Ridged by oxen 2 ( 64 )
Other ( Specify……………………) 9 13. ( a ) If ridged by oxen, indicate number of hours/days spent.
No. Of hours ( 65-67 )
No. Of days (68-70 ) ( b ) Indicate total amount spent if oxen rented.
Total amount ( 71-75 )
Not applicable 9 ( 76 )
418

-9- 14. How was this plot planted this season?
Flat planted 1
Used last season's ridges 2
Used this season's ridges 3 ( 77 )
Planted into holes 4
planted into mounds 5
Other ( Specify…………….) 9 15. How many times was this plot weeded?
Not weeded 0
Weeded only once 1 ( 78 )
Weeded twice 2 16. Was farm yard manure applied in this plot?
Yes 1 ( 79 )
No 2
419

420
-10-
17. ( a ) Was fertilizer applied in this plot?
Yes 1 ( 80 ) No 1
( b ) Application details:
Time Type Bags wt/bag ( Office ) 1st Application ( 81-86 )
2 nd Application ( 87-92) CODES TIME TYPE 1. Within 1 week of germinating/8-14 days 1. 20:20:0 after transplanting 2. Sulphate of Ammonia 2. At/before knee height/2-4 weeks after 3. DAP transplanting 4. 23.21:0+45 3. Between tnee height and tasseling/5-8 5. CAN weeks after transplanting 6. UREA 4. After tasseling/after 8 weeks after 7. Mixture of two or mre of above transplanting 9 Other 9. Other/unknown

-11- 18. How was the fertilizer obtained?
Cash 1 Credit 2 Combination of the two above 3 Gift 4 Other (Specify………..) 5
19. (a) Were you (operator) refused to get loan/credit?
Yes 1 No 2
(b) If yes, what were the reasons?
Do not to a farmers’ club 1 Previous debt problem 2 Default club 3 Other (Specify…………)
4
421
93
94
95
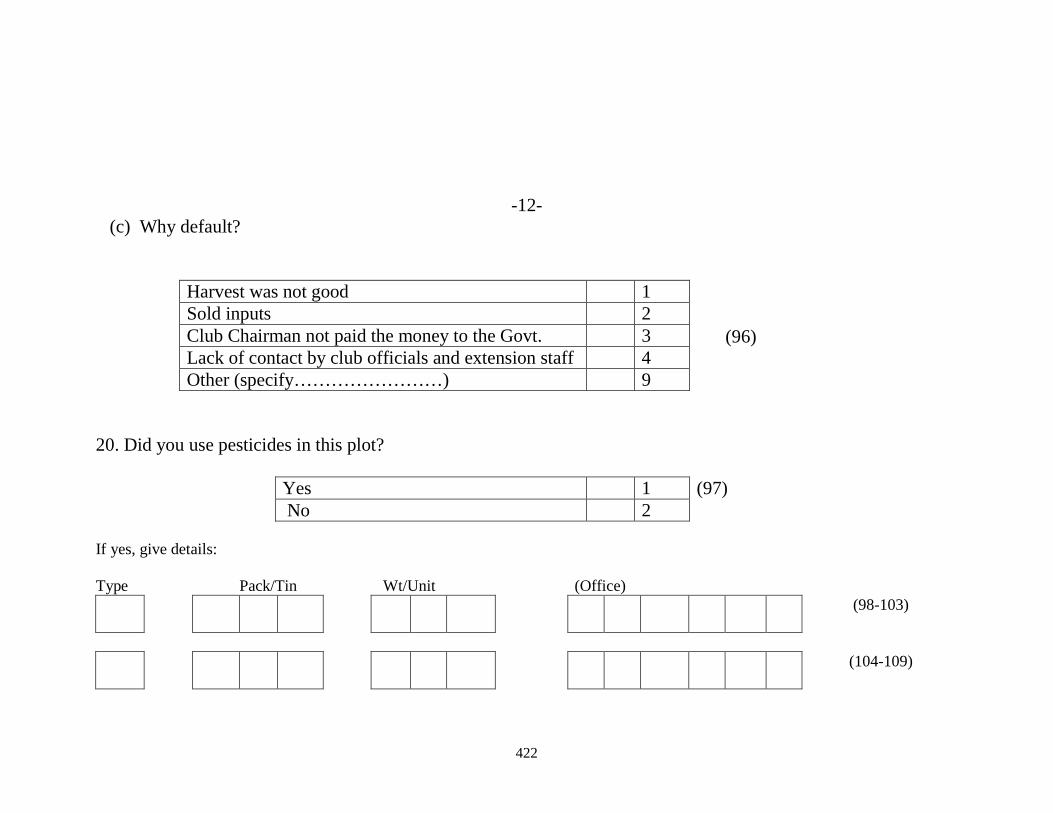
-12- (c) Why default?
Harvest was not good 1 Sold inputs 2 Club Chairman not paid the money to the Govt. 3 Lack of contact by club officials and extension staff 4 Other (specify……………………) 9
20. Did you use pesticides in this plot?
Yes 1 (97) No 2
If yes, give details:
Type Pack/Tin Wt/Unit (Office) (98-103)
(104-109)
422
(96)
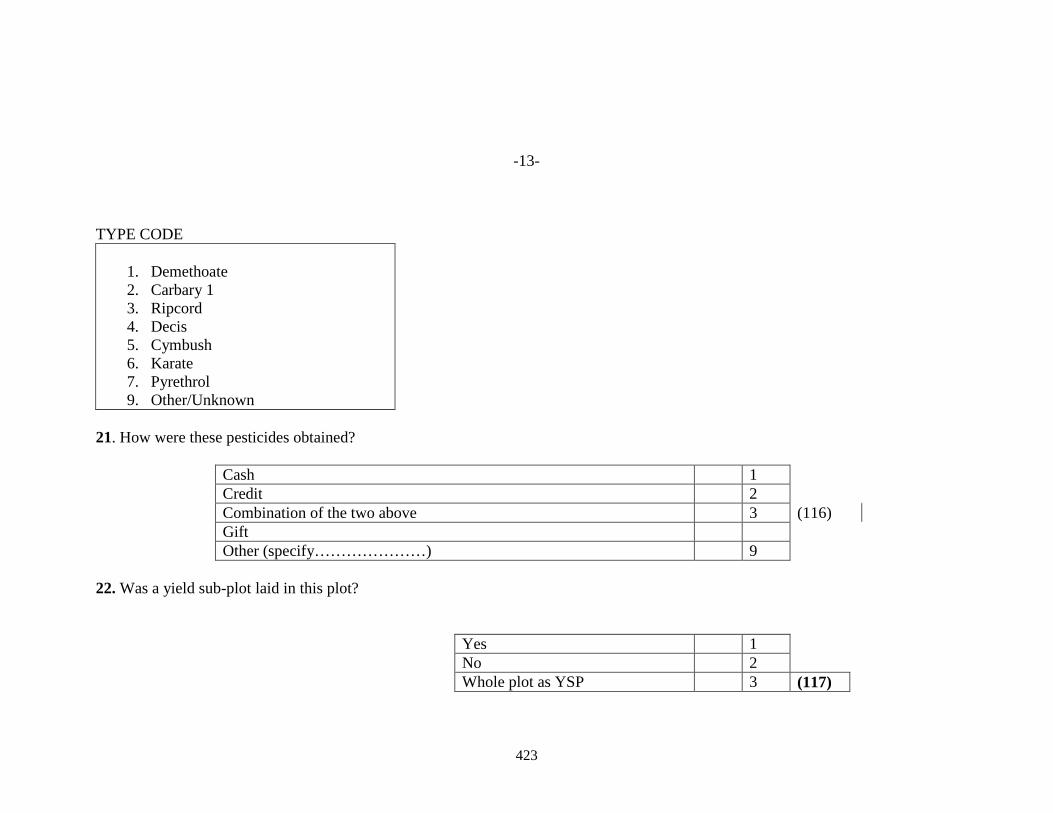
-13- TYPE CODE
1. Demethoate 2. Carbary 1 3. Ripcord 4. Decis 5. Cymbush 6. Karate 7. Pyrethrol 9. Other/Unknown
21. How were these pesticides obtained?
Cash 1 Credit 2 Combination of the two above 3 (116) Gift Other (specify…………………) 9
22. Was a yield sub-plot laid in this plot?
Yes 1 No 2 Whole plot as YSP 3 (117)
423

-14- Next Plot if necessary Copy information from identification
(1-22)
PART C: PLOT DETAILS 6. (a) Plot Number
(23-24) (b) Operator Number
(25-26) Specify Name of the Operator………………. ( c) Sex of the Operator
Male 1 Female 2 (27)
(d) Plot Area 7. What crops are growing in this plot? Indicate Variety if maize, groundnuts or rice is grown. 1st Main Crop…………………………………..
2nd Main Crop………………………………….
3rd Main Crop…………………………………..
424
(28-31)
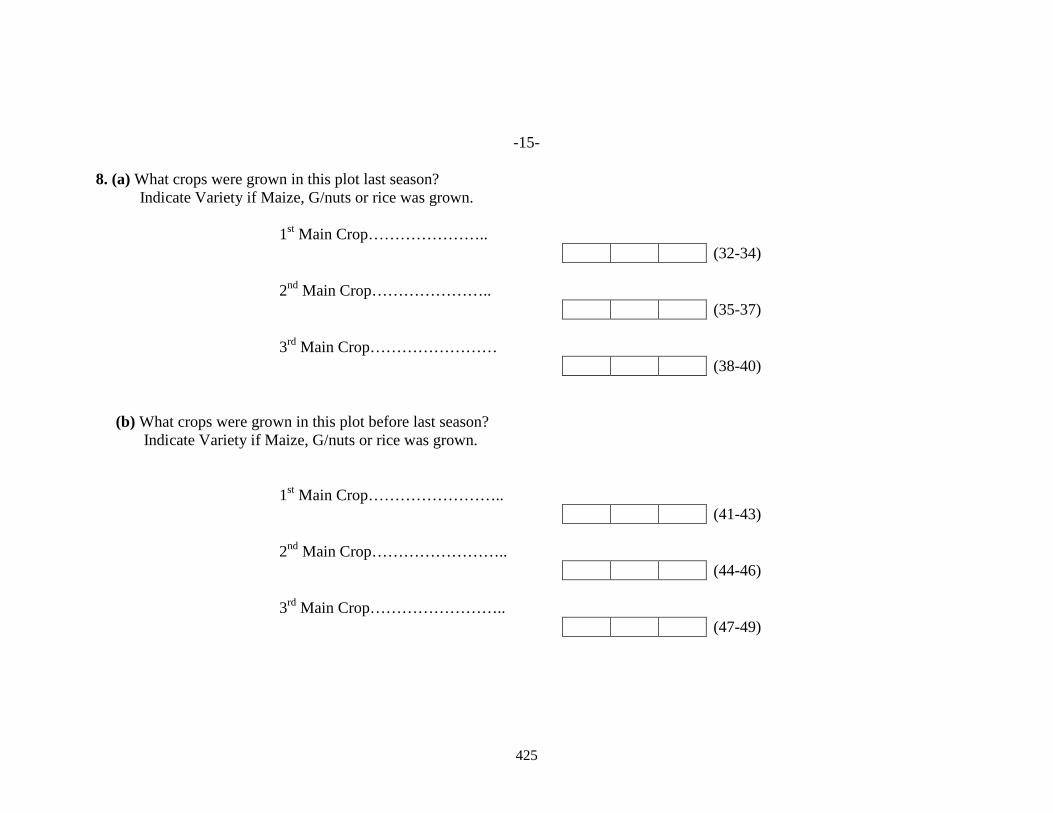
-15- 8. (a) What crops were grown in this plot last season? Indicate Variety if Maize, G/nuts or rice was grown. 1st Main Crop…………………..
(32-34) 2nd Main Crop…………………..
(35-37) 3rd Main Crop……………………
(38-40) (b) What crops were grown in this plot before last season? Indicate Variety if Maize, G/nuts or rice was grown. 1st Main Crop……………………..
(41-43) 2nd Main Crop……………………..
(44-46) 3rd Main Crop……………………..
(47-49)
425

-16- 9. Where did the operator obtain seeds which he/she planted in this plot?
Retained from last season 1 Project/Scheme Credit 2 As seed from ADMARC 3 As food from ADMARC 4 As food from a market 5 Bought locally 6 Other (specify)……………………… 9
10. How was this plot ploughed this season?
Not ploughed this season 0 Tilled by hoeing 1 Ploughed by oxen 2 (51) Other (specify)………………………. 9
426
(50)

-17- 11. (a) If ploughed by oxen , indicate number of hours/days spent. (b) Indicate total amount spent if oxen rented. 12. How was this plot ridged this season? 13. (a) If ridged by oxen, indicate number of hours/days spent.
No. of hours (65-67) (68-70) No. of days
(b) Indicate total amount spent if oxen rented.
Total amount
Not applicable 9
427
No. of hours No. of days (52-54)
(55-57)
Total amount
Not applicable 9 (58-62) (63)
Not ridged this season 0 Ridged by hoeing 1 Ridged by oxen 2 Other (specify)……………………….. 9
(64)
(71-75) (76)
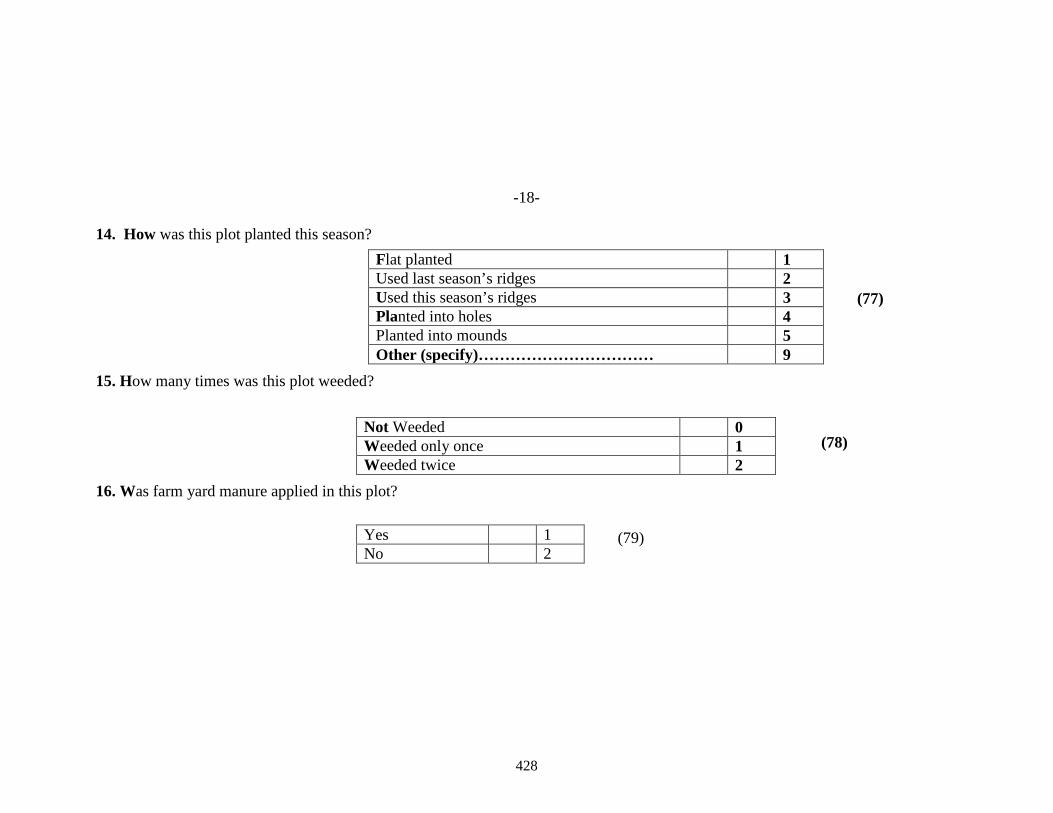
-18- 14. How was this plot planted this season? 15. How many times was this plot weeded? 16. Was farm yard manure applied in this plot?
428
Flat planted 1 Used last season’s ridges 2 Used this season’s ridges 3 Planted into holes 4 Planted into mounds 5 Other (specify)…………………………… 9
(77)
Not Weeded 0 Weeded only once 1 Weeded twice 2
(78)
Yes 1 No 2
(79)
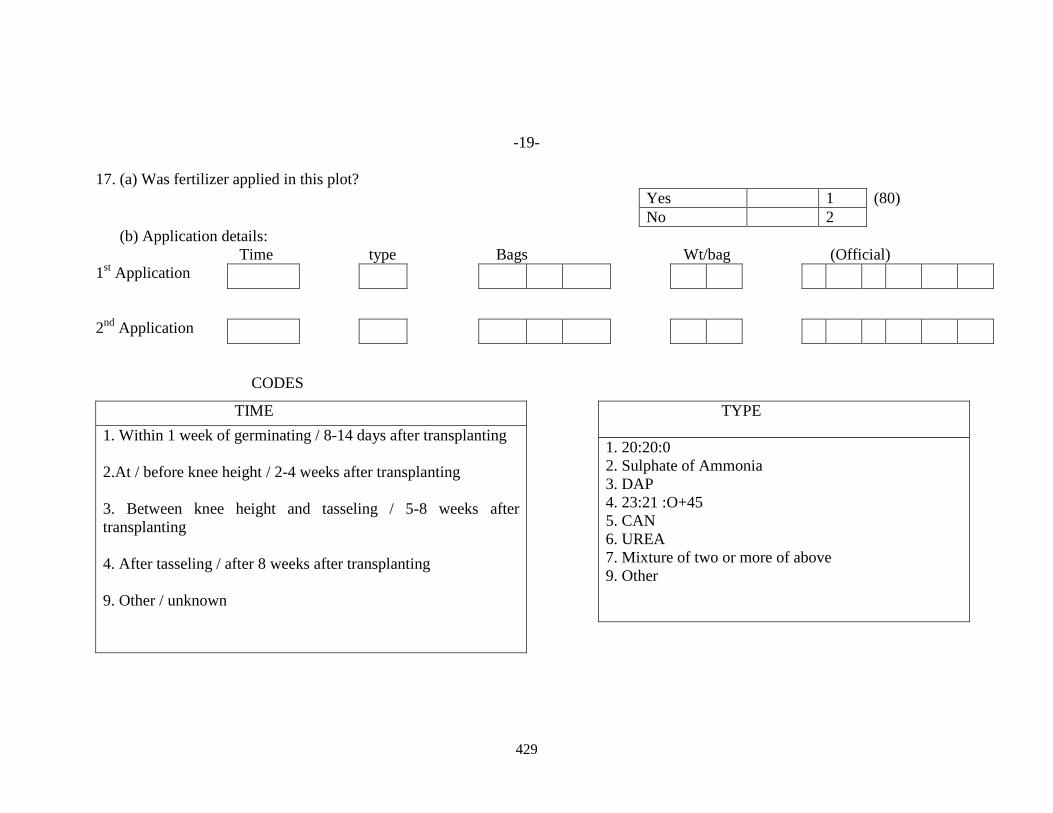
-19- 17. (a) Was fertilizer applied in this plot?
Yes 1 (80) No 2
(b) Application details: Time type Bags Wt/bag (Official) 1st Application 2nd Application CODES
429
TIME 1. Within 1 week of germinating / 8-14 days after transplanting 2.At / before knee height / 2-4 weeks after transplanting 3. Between knee height and tasseling / 5-8 weeks after transplanting 4. After tasseling / after 8 weeks after transplanting 9. Other / unknown
TYPE
1. 20:20:0 2. Sulphate of Ammonia 3. DAP 4. 23:21 :O+45 5. CAN 6. UREA 7. Mixture of two or more of above 9. Other

-20- 18. How was the fertilizer obtained?
Cash 1
Credit 2
Combination of the two above 3 ( 93 )
Gift 4
Other (Specify…………) 9 19. ( a ) Were you ( operator) refused to get loan/credit?
Cash 1 ( 94 )
Credit 2 ( b ) If yes, what were the reason?
Do not belong to a Farmers' club 1
Previous debt problem 2
Default club 3 ( 95 )
Other (specify………………) 9
430

-21- ( C ) Why default?
Harvest was not good 1
Sold inputs 2Club Chairman not paid the money to the Govt. 3 ( 96 )Lack of contact by club official and extension staff 4Other ( Specify……………………)
9 20. Did you use pesticides in this plot?
Yes 1
No 2 ( 97 )
If yes/ give details:
Type Pack/Tins wt/unit ( Office )
( 98-103 )
(104-109 )
(110-115 )
431

-22-
TYPE CODES 1. Demethoate
2. Carbary 1 3. Ripcord 4. Decis 5. Cymbush 6. Karate 7. Pyrethrol
9. Other/Unknown 21. How were these pesticides obtained?
Cash 1 Credit 2 Combination of the two above 3 (116) Gift 4 Other (specify)…………………….. 9
22. Was a yield sub-plot laid in this plot?
Yes 1 No 2 Whole plot as YSP 3
432
(117)

-23- Next Plot if necessary copy information from identification
(1-22)
PART C: PLOT DETAILS
(23-24) 6. (a) Plot Number (b) Operator Number
(25-26) Specify Name of the operator……………….. 2. (c) Sex of the operator
Male 1 Female 2
(28-31)
(d) Plot Area 7. What crops are grown in this plot? Indicate variety if maize, groundnuts or rice is grown. 1st Main Crop……………………………. 2nd Main Crop…………………………… 3rd Main Crop……………………………
433
(27)

-24- 8. (a) What crops were grown in this plot last season? Indicate variety if maize, G/nuts or rice was grown. 1st Main Crop……………………………….. 2nd Main Crop……………………………… 3rd Main Crop……………………………….. (b) What crops were grown in this plot before last season? Indicate Variety if Maize, G/nuts or rice was grown. 1st Main Crop……………………………….. 2nd Main Crop……………………………… 3rd Main Crop………………………………..
434

-25-
9. Where did the operator obtain seeds which he/she planted in this plot?
Retained from last season 1
Project/Scheme Credit 2
As seed from ADMARC 3
As food from ADMARC 4 (50)
As food from a market 5
Bought locally 6
Other (Specify)…………2.. 9 10. How was this plot ploughed this season?
Not ploughed this season 0
Tilled by hoeing 1 (51)
Ploughed by oxen 2
Other (Specify……………) 9
435

-26-
11. ( a ) If ploughed by oxen, indicate number of hour/days spent
No. Of hours (52-54)
No. Of days (55-57) ( b ) Indicate total amount spent if oxen rented
Total amount ( 58-62 )
Not applicable 9 ( 63 ) 12. How was this plot ridged this season?
Not ridged this season 0
Ridged by hoeing 1
Ridged by oxen 2 ( 64 )
Other ( Specify……………………) 9 13. ( a ) If ridged by oxen, indicate number of hours/days spent.
No. Of hours ( 65-67 )
No. Of days (68-70 ) ( b ) Indicate total amount spent if oxen rented.
Total amount ( 71-75 )
Not applicable 9 ( 76 )
436

-27- 14. How was this plot planted this season?
Flat planted 1
Used last season's ridges 2
Used this season's ridges 3 ( 77 )
Planted into holes 4
planted into mounds 5
Other ( Specify…………….) 9 15. How many times was this plot weeded?
Not weeded 0
Weeded only once 1 ( 78 )
Weeded twice 2 16. Was farm yard manure applied in this plot?
Yes 1 ( 79 )
No 2
437

438
-28-
17. ( a ) Was fertilizer applied in this plot?
Yes 1 ( 80 ) No 1
( b ) Application details:
Time Type Bags wt/bag ( Office ) 1st Application ( 81-86 )
2 nd Application ( 87-92) CODES TIME TYPE 1. Within 1 week of germinating/8-14 days 1. 20:20:0 after transplanting 2. Sulphate of Ammonia 2. At/before knee height/2-4 weeks after 3. DAP transplanting 4. 23.21:0+45 3. Between tnee height and tasseling/5-8 5. CAN weeks after transplanting 6. UREA 4. After tasseling/after 8 weeks after 7. Mixture of two or mre of above transplanting 9 Other 9. Other/unknown

-29- 18. How was the fertilizer obtained?
Cash 1 Credit 2 Combination of the two above 3 Gift 4 Other (Specify………..) 5
19. (a) Were you (operator) refused to get loan/credit?
Yes 1 No 2
(b) If yes, what were the reasons?
Do not to a farmers’ club 1 Previous debt problem 2 Default club 3 Other (Specify…………)
4
439
93
94
95

-30- (c) Why default?
Harvest was not good 1 Sold inputs 2 Club Chairman not paid the money to the Govt. 3 Lack of contact by club officials and extension staff 4 Other (specify……………………) 9
20. Did you use pesticides in this plot?
Yes 1 (97) No 2
If yes, give details:
Type Pack/Tin Wt/Unit (Office) (98-103)
(104-109)
440
(96)

-31- TYPE CODES
1. Demethoate 2. Carbary 1 3. Ripcord 4. Decis 5. Cymbush 6. Karate 7. Pyrethrol 8. Other/unknown
21. How were these pesticides obtained?
Cash 1
Credit 2
Combination of the two above 3 ( 116 )
Gift 4other ( Specify …………..) 9
22. Was a yield sub-plot laid in this plot?
Yes 1
No 2 ( 117 )
Whole plot as YSP 3
441

442
(23) Crop Type
(24) Date Planted
(25) No.YSP Plants
(26) No.YSP Planting Station
(27) (28) (29) (30) (31)
Maize
G-Nuts
Other
Month half
No. Cobs harvested
Wt. harvested unshelled
Wt. harvested shelled
No.cob Missing
wt sub-sampled unshelled
Wt. shelled
Wt. Sub-sample shelled
Reason Zero Yield
Moisture content
(118-142)
(143-165)
(166-184)
(185-203)
Maize
G-Nuts
Other
No. Cobs harvested
Wt. harvested unshelled
Wt. harvested shelled
No.cob Missing
wt sub-sampled unshelled
Wt. shelled
Wt. Sub-sample shelled
Reason Zero Yield
Moisture content
(118-142)
(143-165)
(166-184)
(185-203)
Maize
G-Nuts
Other
No. Cobs harvested
Wt. harvested unshelled
Wt. harvested shelled
No.cob Missing
wt sub-sampled unshelled
Wt. shelled
Wt. Sub-sample shelled
Reason Zero Yield
Moisture content
(118-142)
(143-165)
(166-184)
(185-203)
Month Jan = 1 Jul = 7 Feb = 2 Aug = 8 Mar = 3 Sep = 9 Apr = 4 Oct = 10 May = 5 Nov = 11 June = 6 Dec = 12
Half First half = 1 Second half = 2 Unknown = 3
Crop abandoned = 1 Harvested by Operator = 2 Treatment error = 3 Whole plot as YSP = 4 Other ( Specify) = 9 ………………………………

-33- PART E: DATE OF INTERVIEW AND CHECKING
443
Garden Measurement
Visit 2
Visit
Harvest
Enumerator Date Name Date Name Date Name Date Name Interview Call back Supervisor
1st check 2nd check Office
1st check 2nd check

400 MAIZE 450 ROOT CHOPS 510 BEVERAGE CHOPS 550 FRUIT TREES
401 Local 451 cassava 511 tea 551 mangoes
402 MH12,MH15,MH16,NSCM41 512 coffee 552 bananas
403 other hybrid 456 sweet potaoes 513 cocoa 553 pawpaw
404 hybrid once grown 457 irish potatoes 554 avocados
405 UCA,CCA,CCC,Tuxpeno 458 yam 519 other/unknown 555 guavas
407 other composite 459 mix/other/unknown 556 oranges
Bantum 520 VEGETABLES 557 lemons
408 mixture 460 GROUNDNUTS 521 cabbage 558 limes
409 other/Unknown 461 chalimbana 522 pumpkin 559 tangarines
462 manipinta 523 onions 560 grapefruit
410 RICE 463 malimba 524 carrots 561 citrus mixture
411 kilombera 464 RGI 525 tomatoes 562 pineapple
412 other local 465 chitembana 526 squash 563 peach
413 faya 466 mawanga 527 eggplant 564 apple
414 bluebonnet 467 other local variety 528 turnips
418 mixture 468 mixture 529 chillies/peppers 568 mixture
419 other/unknown 469 other/unknown 530 melons 569 other/unknown
531 okra
420 MILLET 470 PULSES 570 TREES
421 bullrush 471 green beans 537 greens/spinsch/lettuce 571 macademia
422 fingermillet 472 ground beans 538 mixture/dimba garden 572 cashew
473 dolichos beans 539 other/unknown 573 tung
428 mixture (millets) 474 soya beans 574 casala
429 other/unknown 475 white haricot 540 OTHER CROPS 575 gmelina
476 guar beans 541 sugarcane 576 bluegum
430 SORGHUM 542 ninde 577 cedrella
431 local 478 mixed beans 578 mixture
432 selected local 479 other/unknown 549 other/unknown 579 unknown/other
433 improved
434 sweet stalk 481 chick peas 580 FALLOW/PASTURE
435 brewing sorghum 482 mixed beans 581 virgin land
438 mixture 483 pigeon peas 582 regenerated
439 other/unknown bushland
488 mixed peas 583 fallow
489 other/unknown 584 grass
440 OTHER GRAINS 490 COTTON 585 grass
441 wheat 499 other/unknown 590 MIXTURE
442 sunflower ( for crop rotation )
443 castor seed 500 TOBACCO 591 maize/groundnuts
444 Sesame 501 dark fired 592 maize/pulse
445 gram 502 sun/air 593 maize/cassava
448 mixture 503 burley 599 other/unknown
449 other/unknown 504 flue cured
505 oriental
509 other/unknown