national - scales · tim goodacre chairman andy borland managing director 4 scales corporation...
TRANSCRIPT


National coverage.
Contents Directors’ Report 4
Auditor’s Review Report 7
Financial Statements 8
Directory 18
2 Scales Corporation Limited

Global presence.
3Interim Report - June 2017

Tim Goodacre Chairman
Andy Borland Managing Director
4 Scales Corporation Limited
Directors’ ReportThe Board is pleased to report a net profit after tax of $29.0 million for the six months ended 30 June 2017. Whilst this was down 14 per cent on the record 2016 half year net profit, this result highlights the resilience of the group, and the efforts of the Scales team, to achieve this level of profitability in light of a challenging growing season.

Highlights
• Combined Mr Apple export volumes consistent with last year noting like-for-like production is only 5% less than 2016 record volumes.
• Acquisition of the business and assets of OceanAir Limited, and acquisition of OceanAir Freight Pty Limited (together OceanAir) completed 1 August 2017 adds Auckland and Melbourne ports as well as further perishable goods expertise to our growing freight forwarding and logistics business.
• Storage & Logistics and Food Ingredients divisions on track for year-end targets.
• Petfood ingredients sales volumes up 8 per cent on 1H16.
Hawke’s Bay experienced double the average rainfall in two months of the growing season as well as being impacted by ex-Cyclone Cook. This inclement weather resulted in increased on-orchard costs, such as higher spray costs, storage costs and additional labour in picking and thinning. These costs were incurred to ensure that in a very difficult season customers’ expectations were met as far as practicable in terms of quality and volume. Accordingly, EBITDA of $48.4 million and EBIT of $42.2 million are down 11 per cent and 12 per cent respectively on the 30 June 2016 record results.
During the period, we have continued to strengthen our relationship with our key strategic shareholder, China Resources Ng Fung Limited (China Resources Ng Fung). Volumes sold through this channel have increased and we believe that additional benefits will continue to flow over the forthcoming periods.
Our balance sheet continues to show a strong financial position. Net tangible assets per share as at 30 June 2017 were $1.56 compared to $1.28 as at 30 June 2016, and the ratio of net debt to equity was 29 per cent, comparable to the 30 June 2016 position of 27 per cent. Average net debt (being the average of the 30 June and 31 December net debt balances) was $51.8 million, an increase of $17.6 million on average net debt as at 30 June 2016. This increase was primarily due to the purchase of Longview Group Holdings Limited (Longview) in November 2016.
On 1 August 2017 we announced the purchase of OceanAir, a freight forwarding business with offices in Auckland and Melbourne. We are delighted to welcome Russell Pope and his team into the Scales family and believe the business will provide excellent synergetic opportunities for Scales Logistics as we broaden our relationships with existing customers. We continue to investigate other suitable acquisitions for the group.
Divisions
Horticulture
In addition to maintaining export volumes (supported by approximately 200,000 TCEs from the Longview acquisition), Mr Apple achieved a packout of 76%. This is in line with long-term averages and illustrates the resilience of our orcharding expertise. Producing this volume in such a challenging growing year is an excellent result and is testament to the skill of everyone in the business.
The packhouse facilities provided by the acquisition of Longview last year proved invaluable during our packing period, significantly increasing efficiencies in our post-harvest infrastructure. We are delighted with the addition, and integration, of this business.
Premium apple variety volumes were in line with the prior year, with high colour varietals influenced by inclement weather. We delivered a slight increase in Traditional variety volumes.
We continued to invest in the Mr Apple products, packaging and brand, particularly in the Middle East and Asia, and are continuing to innovate to meet emerging needs, including the launch of new brands and varieties, such as Dazzle®. This, together with the strength of our relationship with China Resources Ng Fung, continues to deliver sales growth in these key markets.
Storage & Logistics
The Storage & Logistics division performed well. The coldstores saw steady volumes and were aided by a turnaround in industry conditions.
This, together with the addition of OceanAir, is expected to provide the division with revenue opportunities in the second half of the year and position it for longer term growth in freight forwarding activities.
Food Ingredients
Meateor Foods Limited (Meateor) continued its strong growth with an 8% increase in volumes sold, to 12,900 metric tonnes. Whilst margins were impacted by product mix and industry competition, Meateor continues to add value to its products and seek out new protein sources.
Difficult growing conditions saw a reduction in the supply of conventional apple volumes for processing for our joint venture partner, Profruit (2006) Limited (Profruit). Resultant processing volumes were down around 16% on the first half of 2016. However, continued diversification of markets and customers has mitigated increased competition in existing export markets.
We expect the Food Ingredients division to continue to deliver positively to our full year results.
Outlook
Notwithstanding the challenging conditions that we have experienced over the last 6 months, we remain positive in our outlook for the Scales group.
Hard work, resilience, flexibility and investment in technology and relationships have resulted in a strong performance in the Horticulture division despite difficult weather. We will continue to invest in new orchard varieties and we will continue to develop the Mr Apple brand in the key Middle East and Asia markets.
We are reaping the benefit of investment and patience in our Storage & Logistics division. And our Food Ingredients division, while facing more challenging market conditions for sourcing specific products, delivered impressive increases in volumes and sales, highlighting the strength of our key customer relationships.
Our strong balance sheet will allow us to seize organic growth opportunities and acquisitions that meet our investment criteria.
As ever, the Board would like to acknowledge the Scales team. We noted in our 2016 Annual Report that we are extremely lucky to have a stable, experienced and hard-working team of people and this continues to be the case. We send a heartfelt thank you to each individual who contributed to another successful period in Scales’ history.
Tim Goodacre Chairman
Andy Borland Managing Director
5Interim Report - June 2017
DIRECTORS’ REPORT

Financial
Statements

INDEPENDENT REVIEW REPORT TO THE SHAREHOLDERS OF SCALES CORPORATION LIMITEDWe have reviewed the condensed consolidated interim financial statements of Scales Corporation Limited and its subsidiaries (‘the Group’) which comprise the condensed consolidated statement of financial position as at 30 June 2017, and the condensed consolidated statement of comprehensive income, statement of changes in equity and statement of cash flows for the period ended on that date, and a summary of significant accounting policies and other explanatory information on pages 8 to 17.
This report is made solely to the company’s shareholders, as a body. Our review has been undertaken so that we might state to the company’s shareholders those matters we are required to state to them in a review report and for no other purpose. To the fullest extent permitted by law, we do not accept or assume responsibility to anyone other than the company’s shareholders as a body, for our engagement, for this report, or for the opinions we have formed.
Board of Directors’ Responsibilities
The Board of Directors are responsible for the preparation and fair presentation of the condensed consolidated interim financial statements, in accordance with NZ IAS 34 Interim Financial Reporting and IAS 34 Interim Financial Reporting and for such internal control as the Board of Directors determine is necessary to enable the preparation and fair presentation of the condensed consolidated interim financial statements that are free from material misstatement, whether due to fraud or error.
Our Responsibilities
Our responsibility is to express a conclusion on the condensed consolidated interim financial statements based on our review. We conducted our review in accordance with NZ SRE 2410 Review of Financial Statements Performed by the Independent Auditor of the Entity (‘NZ SRE 2410’). NZ SRE 2410 requires us to conclude whether anything has come to our attention that causes us to believe that the condensed consolidated interim financial statements, taken as a whole, are not prepared, in all material respects, in accordance with NZ IAS 34 Interim Financial Reporting and IAS 34 Interim Financial Reporting. As the auditor of Scales Corporation Limited, NZ SRE 2410 requires that we comply with the ethical requirements relevant to the audit of the annual financial statements.
A review of the condensed consolidated interim financial statements in accordance with NZ SRE 2410 is a limited assurance engagement. The auditor performs procedures, primarily consisting of making enquiries, primarily of persons responsible for financial and accounting matters, and applying analytical and other review procedures.
The procedures performed in a review are substantially less than those performed in an audit conducted in accordance with International Standards on Auditing (New Zealand). Accordingly we do not express an audit opinion on those financial statements.
Other than in our capacity as auditor, we have no relationship with or interests in Scales Corporation Limited or its subsidiaries. These services have not impaired our independence as auditor of the Group.
Conclusion
Based on our review, nothing has come to our attention that causes us to believe that the condensed consolidated interim financial statements of the Group do not present fairly, in all material respects, the financial position of the Group as at 30 June 2017 and its financial performance and cash flows for the period ended on that date in accordance with NZ IAS 34 Interim Financial Reporting and IAS 34 Interim Financial Reporting.
Chartered Accountants 23 August 2017 Christchurch, New Zealand
7Interim Report - June 2017
INDEPENDENT REVIEW REPORT

NOTE UNAUDITED AUDITED
Six months ended 30 June 2017
Six months ended 30 June 2016
Year ended 31 December
2016
$000’s $000’s $000’s
Revenue 216,748 209,518 373,927
Cost of sales (141,271) (126,368) (257,038)
75,477 83,150 116,889
Share of profit of entity accounted for using the equity method 393 666 1,612
Administration and operating expenses (28,070) (29,337) (50,197)
Other income 833 50 275
Other losses (227) (342) (1,258)
EBITDA 48,406 54,187 67,321
Depreciation and amortisation (6,222) (6,013) (12,099)
EBIT 42,184 48,174 55,222
Finance revenue 34 41 167
Finance cost (1,679) (1,454) (2,533)
PROFIT BEFORE INCOME TAX EXPENSE 40,539 46,761 52,856
Income tax expense (11,506) (12,985) (14,678)
PROFIT FOR THE PERIOD 29,033 33,776 38,178
OTHER COMPREHENSIVE INCOME
Items that may be reclassified subsequently to profit or loss:
Gain on cash flow hedges 6,868 13,229 9,382
Income tax relating to cash flow hedges (1,923) (3,704) (2,627)
4,945 9,525 6,755
Items that will not be reclassified to profit or loss:
Revaluation of land and buildings - - 26,945
Income tax relating to buildings - - (3,041)
Revaluation of apple trees - - 11,839
Income tax relating to apple trees - - (3,315)
- - 32,428
OTHER COMPREHENSIVE INCOME FOR THE PERIOD 4,945 9,525 39,183
TOTAL COMPREHENSIVE INCOME FOR THE PERIOD 33,978 43,301 77,361
Profit for the period attributable to:
Equity holders of the Company 28,899 33,603 37,772
Non-controlling Interests 134 173 406
29,033 33,776 38,178
Total comprehensive income for the period attributable to:
Equity holders of the Company 33,762 42,998 76,955
Non-controlling Interests 216 303 406
33,978 43,301 77,361
EARNINGS PER SHARE:
Basic and diluted earnings per share (cents) 5 20.7 24.0 27.0
The notes to the financial statements on pages 13 to 17 form part of and should be read in conjunction with this statement.
CONDENSED CONSOLIDATED STATEMENT OF COMPREHENSIVE INCOME
for the six months ended 30 June 2017
8 Scales Corporation Limited

CONDENSED CONSOLIDATED STATEMENT OF CHANGES IN EQUITY
for the six months ended 30 June 2017
NOTE Share Capital
Revaluation Reserve
Hedging Reserve
Equity-settled
Employee Benefits Reserve
Retained Earnings
Attributable to Owners
of the Company
Non - controlling
Interests
Total
$’000 $’000 $’000 $’000 $’000 $’000 $’000 $’000
Unaudited
Six months ended 30 June 2017
Balance at 1 January 2017 89,748 57,717 8,965 503 57,251 214,184 406 214,590
Profit for the period - - - - 28,899 28,899 134 29,033
Other comprehensive income for the period
- - 4,863 - - 4,863 82 4,945
Total comprehensive income for the period
- - 4,863 - 28,899 33,762 216 33,978
Recognition of share-based payments
- - - 203 - 203 - 203
Treasury stock sold 106 - - - - 106 - 106
Dividends paid 4 - - - - - - (406) (406)
Dividends declared 4 - - - - (13,811) (13,811) - (13,811)
Balance at 30 June 2017 89,854 57,717 13,828 706 72,339 234,444 216 234,660
Six months ended 30 June 2016
Balance at 1 January 2016 90,755 25,289 2,210 233 39,498 157,985 - 157,985
Profit for the period - - - - 33,603 33,603 173 33,776
Other comprehensive income for the period
- - 9,395 - - 9,395 130 9,525
Total comprehensive income for the period
- - 9,395 - 33,603 42,998 303 43,301
Recognition of share-based payments
- - - 113 - 113 - 113
Treasury stock purchased (525) - - - - (525) - (525)
Dividends declared 4 - - - - (9,528) (9,528) - (9,528)
Balance at 30 June 2016 90,230 25,289 11,605 346 63,573 191,043 303 191,346
Audited
Year ended 31 December 2016
Balance at 1 January 2016 90,755 25,289 2,210 233 39,498 157,985 - 157,985
Profit for the year - - - - 37,772 37,772 406 38,178
Other comprehensive income for the year
- 32,428 6,755 - - 39,183 - 39,183
Total comprehensive income for the year
- 32,428 6,755 - 37,772 76,995 406 77,361
Recognition of share-based payments
- - - 270 - 270 - 270
Treasury stock purchased (1,007) - - - - (1,007) - (1,007)
Dividends paid 4 - - - - (8,974) (8,974) - (8,974)
Dividends declared 4 - - - - (11,045) (11,045) - (11,045)
Balance at 31 December 2016 89,748 57,717 8,965 503 57,251 214,184 406 214,590
CONDENSED CONSOLIDATED STATEMENT OF CHANGES IN EQUITY
for the six months ended 30 June 2017
The notes to the financial statements on pages 13 to 17 form part of and should be read in conjunction with this statement.
9Interim Report - June 2017
NOTE UNAUDITED AUDITED
30 June 2017 30 June 2016 31 December 2016
$000’s $000’s $000’s
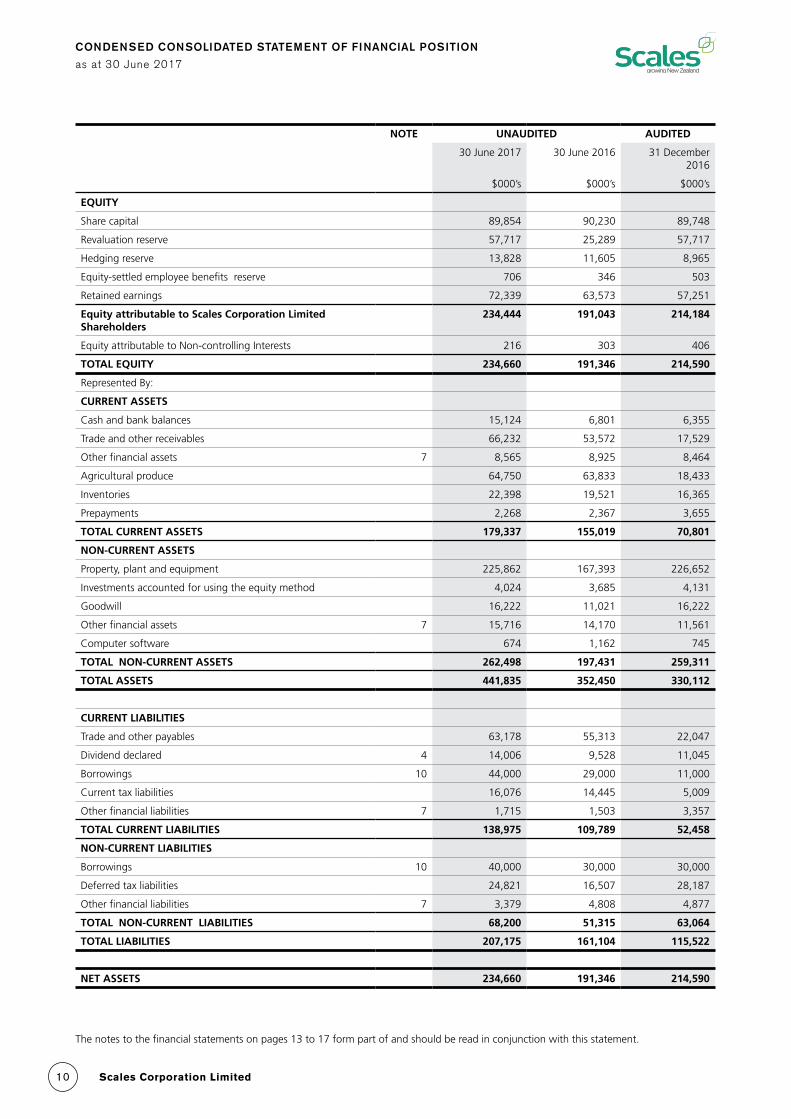
EQUITY
Share capital 89,854 90,230 89,748
Revaluation reserve 57,717 25,289 57,717
Hedging reserve 13,828 11,605 8,965
Equity-settled employee benefits reserve 706 346 503
Retained earnings 72,339 63,573 57,251
Equity attributable to Scales Corporation Limited Shareholders
234,444 191,043 214,184
Equity attributable to Non-controlling Interests 216 303 406
TOTAL EQUITY 234,660 191,346 214,590
Represented By:
CURRENT ASSETS
Cash and bank balances 15,124 6,801 6,355
Trade and other receivables 66,232 53,572 17,529
Other financial assets 7 8,565 8,925 8,464
Agricultural produce 64,750 63,833 18,433
Inventories 22,398 19,521 16,365
Prepayments 2,268 2,367 3,655
TOTAL CURRENT ASSETS 179,337 155,019 70,801
NON-CURRENT ASSETS
Property, plant and equipment 225,862 167,393 226,652
Investments accounted for using the equity method 4,024 3,685 4,131
Goodwill 16,222 11,021 16,222
Other financial assets 7 15,716 14,170 11,561
Computer software 674 1,162 745
TOTAL NON-CURRENT ASSETS 262,498 197,431 259,311
TOTAL ASSETS 441,835 352,450 330,112
CURRENT LIABILITIES
Trade and other payables 63,178 55,313 22,047
Dividend declared 4 14,006 9,528 11,045
Borrowings 10 44,000 29,000 11,000
Current tax liabilities 16,076 14,445 5,009
Other financial liabilities 7 1,715 1,503 3,357
TOTAL CURRENT LIABILITIES 138,975 109,789 52,458
NON-CURRENT LIABILITIES
Borrowings 10 40,000 30,000 30,000
Deferred tax liabilities 24,821 16,507 28,187
Other financial liabilities 7 3,379 4,808 4,877
TOTAL NON-CURRENT LIABILITIES 68,200 51,315 63,064
TOTAL LIABILITIES 207,175 161,104 115,522
NET ASSETS 234,660 191,346 214,590
CONDENSED CONSOLIDATED STATEMENT OF FINANCIAL POSITION
as at 30 June 2017
The notes to the financial statements on pages 13 to 17 form part of and should be read in conjunction with this statement.
10 Scales Corporation Limited

CONDENSED CONSOLIDATED STATEMENT OF CASH FLOWS
for the six months ended 30 June 2017
UNAUDITED AUDITED
Six months ended 30 June 2017
Six months ended 30 June 2016
Year ended 31 December
2016
$000’s $000’s $000’s
CASH FLOWS FROM OPERATING ACTIVITIES
Cash was provided from:
Receipts from customers 168,068 171,753 373,223
Dividends received 500 - 525
Interest received 34 41 167
168,602 171,794 373,915
Cash was disbursed to:
Payments to suppliers and employees (178,993) (176,063) (315,413)
Interest paid (1,679) (1,454) (2,533)
Income tax paid (5,728) (8,277) (14,627)
(186,400) (185,794) (332,573)
NET CASH (USED IN) GENERATED BY OPERATING ACTIVITIES (17,798) (14,000) 41,342
CASH FLOWS FROM INVESTING ACTIVITIES
Cash was provided from:
Advances repaid 81 856 1,100
Sale of property, plant and equipment and computer software 66 93 216
147 949 1,316
Cash was applied to:
Net cash outflow on acquisition of businesses - (414) (16,414)
Purchase of computer software (147) (609) (445)
Purchase of shares in unlisted companies - (49) (53)
Purchase of property, plant and equipment (5,283) (6,856) (19,715)
(5,430) (7,928) (36,627)
NET CASH USED IN INVESTING ACTIVITIES (5,283) (6,979) (35,311)
CASH FLOWS FROM FINANCING ACTIVITIES
Cash was provided from:
Proceeds from borrowings 43,000 29,000 11,000
Treasury stock sold 106 - -
43,106 29,000 11,000
Cash was applied to:
Dividends paid (10,850) (14,527) (23,501)
Dividends paid to non-controlling interest (406) - -
Shares purchased - (525) (1,007)
(11,256) (15,052) (24,508)
NET CASH GENERATED BY (USED IN) FINANCING ACTIVITIES 31,850 13,948 (13,508)
NET INCREASE (DECREASE) IN NET CASH 8,769 (7,031) (7,477)
Cash and cash equivalents at the beginning of the period 6,355 13,832 13,832
CASH AND CASH EQUIVALENTS AT THE END OF THE PERIOD 15,124 6,801 6,355
Represented by:
Cash and bank balances 15,124 6,801 6,355
CASH AND CASH EQUIVALENTS AT THE END OF THE PERIOD 15,124 6,801 6,355
The notes to the financial statements on pages 13 to 17 form part of and should be read in conjunction with this statement.
11Interim Report - June 2017

CONDENSED CONSOLIDATED STATEMENT OF CASH FLOWS
for the six months ended 30 June 2017 (continued)
UNAUDITED AUDITED
Six months ended 30 June 2017
Six months ended 30 June 2016
Year ended 31 December
2016
$000’s $000’s $000’s
NET CASH (USED IN) GENERATED BY OPERATING ACTIVITIES
Reconciliation of profit for the period to net cash generated by operating activities:
Profit for the period 29,033 33,776 38,178
Add non-cash items:
Hedge ineffectiveness on cash flow hedges (832) 343 1,258
Deferred tax (5,289) (5,130) 36
Depreciation and amortisation 6,222 6,013 12,099
Share of equity accounted results (393) (666) (1,612)
Share-based payments 203 113 270
Change in gross liability on Fern Ridge Produce Limited put option 224 - -
Add items classified as investing and financing activities:
Working capital amounts included in acquisition of businesses - (1,517) (1,162)
Dividends received from equity accounted company 500 - 500
Loss (gain) on disposal of property, plant and equipment 3 (50) (50)
Changes in net assets and liabilities:
Trade and other receivables (48,704) (38,891) (2,848)
Agricultural produce (46,317) (46,438) (2,940)
Inventories (6,033) (5,207) (2,051)
Prepayments 1,387 599 (689)
Trade and other payables 41,131 33,037 (229)
Current tax 11,067 10,018 582
NET CASH (USED IN) GENERATED BY OPERATING ACTIVITIES (17,798) (14,000) 41,342
For and on behalf of the Board, who authorised the issue of these interim financial statements on 23 August 2017.
Tim Goodacre Andy Borland Chairman Managing Director
The notes to the financial statements on pages 13 to 17 form part of and should be read in conjunction with this statement.
12 Scales Corporation Limited

NOTES TO THE CONDENSED CONSOLIDATED INTERIM FINANCIAL STATEMENTS
for the six months ended 30 June 2017
1. GENERAL INFORMATION
Scales Corporation Limited (the Company) is a for-profit entity domiciled and registered under the Companies Act 1993 in New Zealand. It is an FMC reporting entity for the purposes of the Financial Markets Conduct Act 2013. The Group consists of Scales Corporation Limited, its subsidiaries and joint venture. The principal activities of the Group are to provide logistics services, grow apples, export products, provide insurance services to companies within the Group and operate storage and processing facilities.
2. FINANCIAL STATEMENTS
These unaudited condensed consolidated interim financial statements have been prepared in accordance with Generally Accepted Accounting Practice (“GAAP”). They comply with the New Zealand Equivalent to International Accounting Standard 34 (NZ IAS 34) “Interim Financial Reporting” and International Accounting Standard 34 (IAS 34) “Interim Financial Reporting”, as applicable for profit orientated entities. Significant accounting policies applied by the Group during the period have been applied consistently to all periods presented in these condensed consolidated interim financial statements.
The same accounting policies and estimates are applied in the interim financial statements as were applied in the financial statements for the year ended 31 December 2016. These financial statements should be read in conjunction with the financial statements and related notes included in the Company’s Annual Report for the year ended 31 December 2016. The information is presented in thousands of New Zealand dollars unless otherwise stated.
3. SEASONALITY OF BUSINESS
All business segments are subject to seasonal fluctuation. The apple crop has been picked and packed and the export programme is well under way in the first half year. Higher volumes are processed through the food ingredients plants in the first half of the year due to the seasonal nature of the meat industry and there is greater utilisation of storage and logistics services over the first half year as seasonal products are stored and then shipped to export markets.
At 30 June the harvested crop held in inventory is valued at fair value less estimated costs to sell. At 31 December the unharvested crop is at fair value less estimated costs to sell. Both the harvested crop at 30 June and the unharvested crop at 31 December are included in agricultural produce.
4. DIVIDENDS
During the six months ended 30 June 2017 the Directors paid an interim dividend of 8.0 cents per share and resolved to pay a final dividend of 10.0 cents per share in respect of the year ended 31 December 2016. This final dividend was paid on 7 July 2017.
During the six months ended 30 June 2016 the Directors paid an interim dividend of 6.5 cents per share and a special dividend of 4.0 cents per share in respect of the year ended 31 December 2015. These dividends were paid on 20 January 2016. Also during this period the Directors resolved to pay a final dividend of 6.5 cents per share in respect of the year ended 31 December 2015. This dividend was paid on 8 July 2016.
Dividends totalling $23.501 million were paid during the year ended 31 December 2016. All dividends were fully imputed.
5. EARNINGS PER SHARE
UNAUDITED AUDITED
Six months ended 30 June 2017
Six months ended 30 June 2016
Year ended 31 December
2016
$000’s $000’s $000’s
Profit attributable to equity holders of the Company - used in the calculation of earnings per share
28,899 33,603 37,772
Basic and diluted earnings per share
Weighted average number of ordinary shares 139,882,718 139,779,006 139,779,006
Basic and diluted earnings per share (cents) 20.7 24.0 27.0
13Interim Report - June 2017

6. SEGMENT INFORMATION
Segment results include items directly attributable to a segment as well as those that can be allocated on a reasonable basis. No single external customer’s revenue accounts for 10% or more of the Group’s revenue. All non-current assets are located in New Zealand.
The Group comprises the following operating segments:
Food Ingredients: processing and marketing of food ingredients such as pet food ingredients and juice concentrate. Meateor Foods Limited, Meateor Foods Australia Pty Limited and Profruit (2006) Limited.
Horticulture: orchards, fruit packing and marketing. Mr Apple New Zealand Limited, New Zealand Apple Limited, Fern Ridge Produce Limited, Longview Group Holdings Limited, Longview New Zealand Limited and Longview Packhouse Limited.
Storage & Logistics: cool, cold and bulk liquid storage and logistics services. Liqueo Bulk Storage Limited, Polarcold Stores Limited, Scales Logistics Limited and Whakatu Coldstores Limited.
Other: Scales Corporation Limited, Geo. H. Scales Limited, Scales Employees Limited, Scales Holdings Limited and Selacs Insurance Limited.
NOTES TO THE CONDENSED CONSOLIDATED INTERIM FINANCIAL STATEMENTS
for the six months ended 30 June 2017 (continued)
Food Ingredients Horticulture
Storage & Logistics Other Eliminations Total
$000’s $000’s $000’s $000’s $000’s $000’s
Six months ended 30 June 2017
Total segment revenue 33,978 131,470 67,551 1,934 (18,185) 216,748
Inter-segment revenue - - (16,594) (1,591) 18,185 -
Revenue from external customers 33,978 131,470 50,957 343 - 216,748
Segment profit (loss) before income tax 3,930 32,824 8,813 (5,028) - 40,539
Segment assets 29,850 296,415 117,977 (2,407) - 441,835
Segment liabilities 6,762 96,651 21,105 82,657 - 207,175
Six months ended 30 June 2016
Total segment revenue 31,064 130,697 65,487 1,648 (19,378) 209,518
Inter-segment revenue - - (18,109) (1,269) 19,378 -
Revenue from external customers 31,064 130,697 47,378 379 - 209,518
Segment profit (loss) before income tax 4,615 35,997 9,242 (3,093) - 46,761
Segment assets 27,485 234,460 96,628 (6,123) - 352,450
Segment liabilities 5,659 80,974 22,992 51,479 - 161,104
Year ended 31 December 2016
Total segment revenue 58,038 230,077 108,383 3,525 (26,096) 373,927
Inter-segment revenue - (212) (23,131) (2,753) 26,096 -
Revenue from external customers 58,038 229,865 85,252 772 - 373,927
Segment profit (loss) before income tax 8,514 39,125 10,867 (5,650) - 52,856
Segment assets 27,327 185,423 109,971 7,391 - 330,112
Segment liabilities 6,325 44,781 20,777 43,639 - 115,522
14 Scales Corporation Limited

NOTES TO THE CONDENSED CONSOLIDATED INTERIM FINANCIAL STATEMENTS
for the six months ended 30 June 2017
7. FINANCIAL INSTRUMENTS AND FAIR VALUE DISCLOSURES
UNAUDITED AUDITED
30 June 2017 30 June 2016 31 December 2016
$000’s $000’s $000’s
Current financial assets:
At fair value:
Foreign currency derivative instruments 8,542 8,846 8,409
At amortised cost:
Advances to other entities 23 79 55
8,565 8,925 8,464
Non-current financial assets:
At fair value:
Foreign currency derivative instruments 15,406 13,633 11,231
Shares in unlisted companies 206 193 206
At amortised cost:
Employee loans 104 344 124
15,716 14,170 11,561
Current financial liabilities at fair value:
Foreign currency derivative instruments 496 530 2,047
Interest rate swap contracts and forward rate agreements 150 33 371
Fern Ridge Produce Limited put option 1,069 940 939
1,715 1,503 3,357
Non-current financial liabilities at fair value:
Foreign currency derivative instruments 1,310 2,070 3,111
Interest rate swap contracts and forward rate agreements 1,005 1,798 826
Fern Ridge Produce Limited put option 1,064 940 940
3,379 4,808 4,877
15Interim Report - June 2017

8. RELATED PARTY DISCLOSURES
(a) Transactions with Related Parties
Certain Directors and senior management have relevant interests in companies with which Scales has transactions in the normal course of business. A number of Scales directors are also non-executive directors of other companies. Any transactions undertaken with these entities have been entered in the ordinary course of business on a third party arm’s-length basis.
(b) Key Management Personnel Remuneration
The compensation of the directors and executives, being the key management personnel of the Group, is as follows:
UNAUDITED AUDITED
Six months ended 30 June 2017
Six months ended 30 June 2016
Year ended 31 December
2016
$000’s $000’s $000’s
Short-term employee benefits 1,885 1,756 2,742
Post-employment benefits 53 54 85
1,938 1,810 2,827
(c) Transactions with Equity Accounted Entity
UNAUDITED AUDITED
Six months ended 30 June 2017
Six months ended 30 June 2016
Year ended 31 December
2016
$000’s $000’s $000’s
Revenue from sale of goods 700 859 1,128
Revenue from services 351 - 1,222
Dividends received 500 - 500
Trade receivables at balance date 4 - 349
9. CAPITAL COMMITMENTS
Commitments entered into as at reporting date were:
UNAUDITED AUDITED
30 June 2017 30 June 2016 31 December 2016
$000’s $000’s $000’s
Biological assets 1,389 2,047 1,577
Plant and equipment - 231 150
1,389 2,278 1,727
NOTES TO THE CONDENSED CONSOLIDATED INTERIM FINANCIAL STATEMENTS
for the six months ended 30 June 2017
16 Scales Corporation Limited

10. BORROWINGS
The level of term and seasonal borrowings has increased largely due to the acquisition of Longview, a Hawke’s Bay grower, packer and marketer of apples, on 2 November 2016. Total seasonal borrowing facilities as at 30 June 2017 were $50.0 million.
11. EVENTS OCCURRING AFTER THE REPORTING DATE
On 1 August 2017 Scales Corporation Limited through its wholly owned subsidiary Scales Logistics Limited completed the purchase of the assets and the business of OceanAir Limited and all of the shares in OceanAir Freight Pty Limited (collectively OceanAir), a freight forwarding business with offices in Auckland and Melbourne.
OceanAir specialises in sea and air freight for perishable produce, specifically kiwifruit and avocado exports, which account for about 50% of its activity.
There have been no other significant post reporting date events.
NOTES TO THE CONDENSED CONSOLIDATED INTERIM FINANCIAL STATEMENTS
for the six months ended 30 June 2017
17Interim Report - June 2017

DIRECTORY
DIRECTORY
Board of Directors
Tim Goodacre (Chairman) Andy Borland (Managing Director) Nick Harris Mark Hutton Alan Isaac Weiyong Wang
Audit and Risk Management Committee
Alan Isaac (Chairman) Nick Harris Mark Hutton
Nominations and Remuneration Committee
Mark Hutton (Chairman) Tim Goodacre
Registered Office
52 Cashel Street Christchurch 8013 New Zealand
Postal Address
PO Box 1590 Christchurch 8140 New Zealand
Telephone
64-3-379-7720
Website
www.scalescorporation.co.nz
Auditor
Deloitte Limited
Level 4 151 Cambridge Terrace Christchurch 8013
Bankers
ANZ Bank New Zealand Limited
665 Colombo Street Christchurch 8011
Rabobank New Zealand Limited
Level 23 157 Lambton Quay Wellington 6011
Westpac New Zealand Limited
Level 2 2 Show Place Christchurch 8024
Solicitors
Anthony Harper
Level 9 HSBC Tower 62 Worcester Boulevard Christchurch 8011
Chapman Tripp
23 Albert Street Auckland 1140
Corporate Advisor
Maher & Associates
17 Albert Street Auckland 1010
Share Registry
Computershare Investor Services Limited
Level 2, 159 Hurstmere Road Takapuna North Shore City Auckland 0622
18 Scales Corporation Limited

19Interim Report - June 2017