national, state, and local data report on prioritized
TRANSCRIPT

PITTSBURGH EQUITY INDICATORS
National, State, and Local Data Report on Prioritized Disparities
Homicides • AstHmA HospitAlizAtions • infAnt mortAlity • Access to BAnking • Homelessness

Background
The city of Pittsburgh, with a population of roughly 300,000, is 64 percent white, 24 percent black, and 6 percent Asian, with other racial and ethnic groups each comprising a small percentage of the remaining population. There are disparities between these groups in terms of quality of life outcomes, economic opportunity, and access to resources. This inequity is one of the key long-term stresses identified by the city in its OnePGH Resilience Strategy. Through OnePGH and other local initiatives dedicated to equity citywide, the city of Pittsburgh has committed to the guiding principle of “If it’s not for all, it’s not for us.”As a first step in assessing progress toward equitable opportunities and outcomes for Pittsburghers of all races, genders, and incomes, and to inform the city’s investment decisions moving forward, the City of Pittsburgh’s Division of Sustainability and Resilience undertook the Pittsburgh Equity Indicators project. Supported with funding and strategic guidance from the City University of New York Institute for State and Local Governance (CUNY ISLG), the research team developed a framework and associated indicators to measure equality in both outcomes and opportunities in Pittsburgh.To portray existing inequity and inequality within Pittsburgh, we analyzed data to understand the largest disparities among Pittsburgh’s residents for each of the 80 indicators in the framework.As a result of this process, most of the indicators in the framework assess disparities by race. Indicators were then analyzed as ratios between the comparison groups, in line with the methodology developed by CUNY ISLG. Each of the 80 indicators was scored on a scale from 1 (higher inequality) to 100 (higher equality). Topic scores were calculated by averaging the four indicator scores under that topic, and domain scores are the average of the five topics under that domain. Finally, averaging domain scores produced the overall citywide score for 2017. A score of 100 indicates that there is either no inequality between subgroups, or the group that typically has less equal outcomes experienced better outcomes than the comparison group. Indicators are scored according to the relative difference in outcomes between two groups, and, for the purpose of scoring, it is assumed that different outcomes for different groups is undesirable.Pittsburgh is part of a cohort of four other cities implementing the methodology developed by CUNY ISLG for New York’s Equality Indicators. The methodology allows data to be compared across domains, topics, indicators, and from year to year within a city. However, because each city has developed its own framework and set of indicators, scores are not comparable across cities.
The 2017 Pittsburgh Equity Indicators report states that:
i

As a result of the 2017 Equity Indicators Report, the City of Pittsburgh has prioritized five areas of extreme inequity, with the goal of bringing together community organizations, service providers, elected officials, and stakeholders to address these concerns. These five priority areas are:
• Homicide victimization• Asthma hospitalizations• Infant mortality• Access to banking services• Homelessness
In order to address these issues, it is helpful to know how the disparities in Pittsburgh compare to those at the state and national level. The goal of this report is to provide data on these disparities as they exist in Pittsburgh (or Allegheny County), Pennsylvania, and the United States more broadly. When applicable, this report connects Pittsburgh’s Equity Indicators to the UN Sustainable Development Goals (UNSDGs) and the Healthy People 2020 Objectives.
This report was prepared by Collin T Hayes, Sustainability Intern with the City of Pittsburgh Department of Planning. Please direct any inquiries to [email protected]
ii

Homicide Victimization
Equity Score
1From the 2017 Equity Indicators Report:
There was a substantial disparity between the homicide victimization rates for black and white Pittsburghers. Black Pittsburghers were almost thirteen times as likely to be the victim of homicide (58.6) than white Pittsburghers (4.6) per 100,000 people. The homicide rate for black residents is only slightly lower than the overall 2015 homicide rate of St. Louis, MO (59.3 per 100,000), the city with the highest rate of homicide in the country. The data collected also demonstrated a significant disparity between males and females who were the victims of homicide. Males were ten times as likely to be the victim of homicide (32.2) compared to females (3.8) per 100,000 people. The equality score for homicide rates is the lowest of all the indicators measured for this effort, indicating significant work to be done to close the gap between black and white Pittsburghers
Relevant UNSDGs:
16.1 Significantly reduce all forms of violence and related death rates every-where16.1.1 Number of victims of intentional homicide per 100,000 population, by sex and age.16.1.3 Proportion of population subjected to (a) physical violence, (b) psychological violence and (c) sexual violence in the previous 12 months.16.1.4 Proportion of population that feel safe walking alone around the area they live.
1

State and National Comparisons
Homicide Victimization Rates by Race and Region 2007-2017
This graph shows homicide victimizations, per 100,000 people, for black and white popu-lations in the City of Pittsburgh, Pennsylvania, and the United States. The homicide rate is calculated by dividing the total number of victims by that demographic’s population, and then multiplying that number by 100,000.
The national rates come from the Center for Disease Control’s WONDER database.
The number of homicide victims for Pittsburgh and Pennsylvania were collected from Pennslyvania’s Uniform Crime Reporting database. Population figures for the city and state come from the Census Bureau’s Annual Community Survey’s Housing and Population Esti-mates. Pittsburgh rates are based on data from the entire Pittsburgh Metro Statistical Area.
2

Homicide Victimization
State and National ComparisonsMale Homicide Victimization Rates by Race and Region 2007-2017
These figures show the homice victimization rates by race and gender for the years 2007 - 2017. Please note that the ACS Housing and Population estimates do not break down racial groups by gender, so the population was estimated by applying the gender ratio for the entire population to each subgroup.
Female Homicide Victimization Rates by Race and Region 2007-2017
3

Asthma Hospitalizations
From the 2017 Equity Indicators Report:Black children, ages 0-17, were hospitalized for asthma at a significantly higher rate than white children. In Allegheny County, the overall rate of hospitalization for asth-ma in children was 9.1 per 10,000. The rate for black children was much higher at 37.2 and slightly lower for white children at 6.2 (per 10,000 people). For white chil-dren, this trend was similar between genders. However, a disparity existed between male and female black children. Black male children had the highest rate of hospital-ization for asthma at a rate of 44.8 whereas black female children had a rate of 29.3 (per 10,000). Hospitalization is a sign of uncontrolled asthma symptoms and may increase with exposure to asthma triggers in the environment such as secondhand smoke, dust, or pollution. Asthma in Pittsburgh contributes to missed school days and time off work for parents.
Relevant UNSDGs:
3.4 By 2030, reduce by one third premature mortality from non-communica-ble diseases through prevention and treatment and promote mental health and well-being3.4.1 Mortality rate attributed to cardiovascular disease, cancer, diabetes or chronic respiratory disease3.9 By 2030, substantially reduce the number of deaths and illnesses from hazardous chemicals and air, water and soil pollution and contamination3.9.1 Mortality rate attributed to household and ambient air pollution3.8 Achieve universal health coverage, including financial risk protection, access to quality essential health-care services and access to safe, effective, quality and affordable essential medicines and vaccines for all3.8.1 Coverage of essential health services (defined as the average coverage of essen-tial services based on tracer interventions that include reproductive, maternal, new-born and child health, infectious diseases, non-communicable diseases and service capacity and access, among the general and the most disadvantaged population)11.6 By 2030, reduce the adverse per capita environmental impact of cities, including by paying special attention to air quality and municipal and oth-er waste management
Equity Score
16
4

Asthma Hospitalizations
Healthy People 2020 Objectives:RD-1 Reduce asthma deaths1.1 Reduce asthma deaths among children and adults under age 35 yearsRD-2 Reduce hospitalizations for asthma2.1 Reduce hospitalizations for asthma among children under age 5 yearsRD-3 Reduce emergency department visits for asthma3.1 Reduce emergency department visits for asthma among children under age 5 yearsRD-5 Reduce the proportion of persons with asthma who miss school or work days5.1 Reduce the proportion of children aged 5 to 17 years with asthma who miss school days
State ComparisonsIt is difficult to make comparisons at the national level due to the unavailability of similar data. The Healthy People 2020 objectives prioritize hospitalizations and emergency department vis-its for children under five and missed school days for children between five and seventeen. The Pennslyvania Department of Health’s EDDIE database only provides data on hospital admis-sions for children under seventeen, but does not break these numbers down for children under five. The most recent national data shows that in 2009, the total hospitalization rate for asthma for children under five was 40.6. In that year, the hospitalization rate for white children in the US was 22.9, while in 2008 (the most recent year for which data is available) the rate for black children was 53. In 2013, the total percent of children with asthma who missed school days was 59.1, this number was 73.2 percent and 54.2 percent for black and white children, respectively.
This graphic comes from the Allegheny County Department of Health’s website.
5

Asthma Hospitalizations by Race and Region for Children Ages 0-17
Asthma Hospitalizations by Gender and Region for Black Children Ages 0-17
Asthma hospitalization rates per 10,000 children. Data for the state and county level come from the Pennsylvania Department of Health EDDIE system.
6

Asthma Hospitalizations
Asthma Hospitalizations by Gender and Region for White Children Ages 0-17
Asthma Hospitalizations by Race and Region for Males Age 0-17
7

Infant Mortality
From the 2017 Equity Indicators Report:
Equity Score
24There is a large disparity between rates of infant mortality for black babies and white babies in Allegheny County. Infant mortality for black babies occurred at a rate of 14.9 per 1,000 births while the rate for white babies was 3.3. Put another way, of the 78 babies who died in Allegheny County, 38 of them (49%) were black. The disparity (andoverall infant mortality rate) in Allegheny County is similar to Pennsylvania as a whole: In 2016, the infant mortality rate for black babies in Pennsylvania was 14.0 per 1,000 compared to 4.8 per 1,000 for white babies. This stark disparity suggests a need to intervene early with adequate prenatal care, risk monitoring systems, and other evidence-based interventions.
Relevant UNSDGs:3.4 By 2030, reduce by one third premature mortality from non-communica-ble diseases through prevention and treatment and promote mental health and well-being3.8 Achieve universal health coverage, including financial risk protection, access to quality essential health-care services and access to safe, effective, quality and affordable essential medicines and vaccines for all
Healtht People 2020 Objectives:
MICH-1 Reduce the rate of fetal and infant deaths1.2 Reduce the rate of fetal and infant deaths during perinatal period1.3 Reduce the rate of all infant deaths1.4 Reduce the rate of neonatal deaths1.5 Reduce the rate of postneonatal deaths1.6 Reduce the rate of infant deaths related to birth defects1.8 Reduce the rate of infant deaths from sudden infant death syndrome1.9 Reduce the rate of infant deaths from sudden unexpected infant deathsMICH-1 Reduce the 1-year mortality rate for infants with Down syndrome
8

Infant Mortality
Total Infant Mortality by Region 2006-2016
Racial Disparities in Infant Mortality by Region 2006-2016
Infant deaths per 1,000 live births. County and State data from the EDDIE system. National data from the Healthy People 2020 website.
7
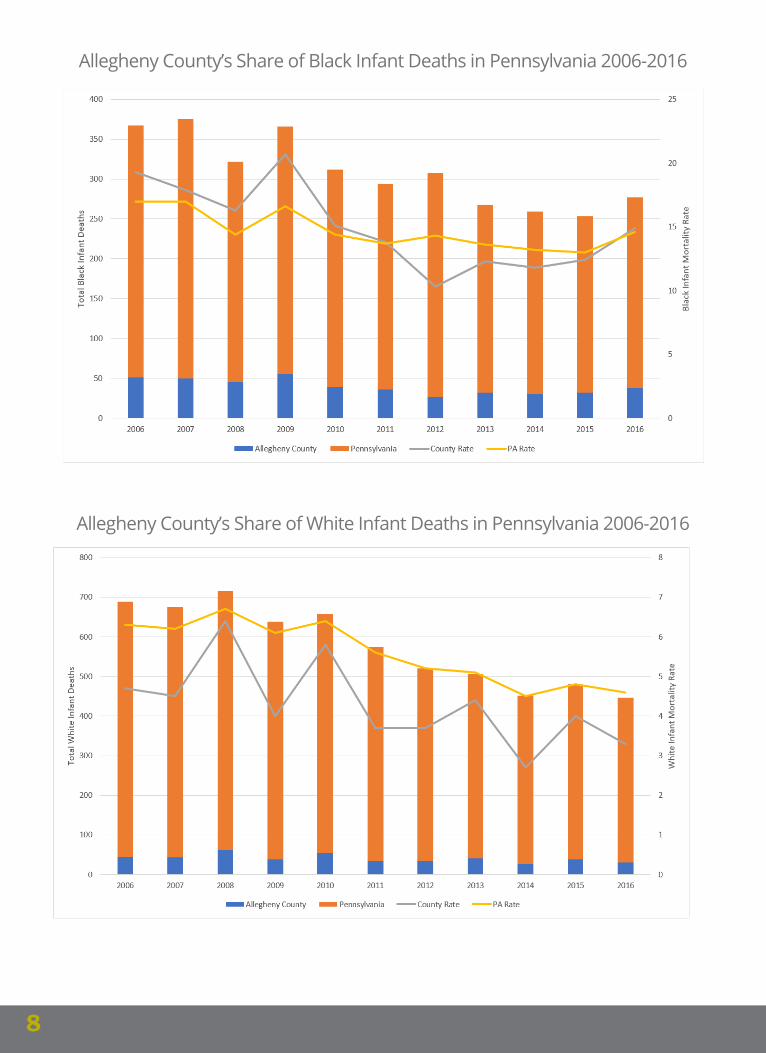
Allegheny County’s Share of Black Infant Deaths in Pennsylvania 2006-2016
Allegheny County’s Share of White Infant Deaths in Pennsylvania 2006-2016
8

Access to Banking
From the 2017 Equity Indicators Report:
Equity Score
15A checking or savings account can impact the ability to obtain housing and to save money, among other important elements of current and future economic wellbeing. Black Pittsburghers were significantly unbanked or underbanked (17.7%), without a checking or savings account, as compared to their white peers (2.8%). The disparity is smaller between males and females. Females were slightly less likely to not have a checking or savings account (4.1%) than their male peers (4.4%). In addition, lack of a checking or savings account decreased as educational attainment increased, with only 0.8% of those with a bachelor’s degree or higher without a checking or savings account.
Relevant UNSDGs:1.2 By 2030, reduce at least by half the proportion of men, women and chil-dren of all ages living in poverty in all its dimensions according to national definitions1.2.2 Proportion of men, women and children of all ages living in poverty in all its dimensions according to national definitions1.4 By 2030, ensure that all men and women, in particular the poor and the vulnerable, have equal rights to economic resources, as well as access to ba-sic services, ownership and control over land and other forms of property, inheritance, natural resources, appropriate new technology and financial services, including microfinance8.10 Strengthen the capacity of domestic financial institutions to encourage and expand access to banking, insurance and financial services for all8.10.1 (a) Number of commercial bank branches per 100,000 adults and (b) number of automated teller machines (ATMs) per 100,000 adults8.10.2 Proportion of adults (15 years and older) with an account at a bank or other financial institution or with a mobile-money-service provider
9

Percentage of the Population that is Unbanked by Race and Region
Data for Pittsburgh comes from the 2015 Current Population Survey Unbanked/Underbanked Supplement. Data for Pennsylvania and the US come from the FDIC Survey of Unbanked and Underbanked Population from 2013, the last year in which data for the black population was available for Pennsylvania.
10

Homelessness
From the 2017 Equity Indicators Report:
Equity Score
2The Allegheny County Department of Human Services provides a variety of services to the homeless and unstably housed population of Pittsburgh, including emergency shelters. The Department of Human Services captures population estimates and tracks participation across multiple services to attempt to account for the full and changing picture of homelessness and unstably housed across Pittsburgh, but is limited to only those who use homelessness services. The use of emergency shelters across ethnic and racial groups showed a severe disproportion in rates between black Pittsburghers and white Pittsburghers. Black Pittsburghers were significantly more likely to use emer-gency shelters (1,216.9) than white Pittsburghers (128.1) per 100,000 people. Use of homelessness services reflects underlying housing instability and may be related to increasing affordability challenges in the city.
Relevant UNSDGs:1.3 Implement nationally appropriate social protection systems and mea-sures for all, including floors, and by 2030 achieve substantial coverage of the poor and the vulnerable1.3.1 Proportion of population covered by social protection floors/systems, by sex, dis-tinguishing children, unemployed persons, older persons, persons with disabilities, pregnant women, newborns, work-injury victims and the poor and the vulnerable1.4 By 2030, ensure that all men and women, in particular the poor and the vulnerable, have equal rights to economic resources, as well as access to ba-sic services, ownership and control over land and other forms of property, inheritance, natural resources, appropriate new technology and financial services, including microfinance1.4.1 Proportion of population living in households with access to basic services11.1 By 2030, ensure access for all to adequate, safe and affordable housing and basic services and upgrade slums11.1.1 Proportion of urban population living in slums, informal settlements or inad-equate housing
11

Homelessness Rate per 100,000 People by Race and Region
Racial Composition of the Homeless Population by Region
The homelessness rate is calculated by dividing the total number of homeless people by the total popula-tion for that group and then multiplying that number by 100,000.County data from the Allegheny County 2017 Point-in-Time Homelessness Data Brief. State data from the HUD 2017 Continuum of Care Homelessness Assistance Programs Homeless Populations and Subpopula-tions. National data from the 2017 Annual Homeless Assessment Report to Congress.
12

November 1, 2018 PrePared by ColliN T Hayes
susTaiNabiliTy aNd resilieNCe iNTerN CiTy of PiTTsburgH
deParTmeNT of PlaNNiNg [email protected]