national statistical coordination board slide no. 0 third quarter 2010 p erformance of the p...
TRANSCRIPT

NATIONAL STATISTICAL COORDINATION BOARDSlide No. 1
Third Quarter 2010Third Quarter 2010
Performance of the Philippine Economy
Presented byROMULO A. VIROLA
Secretary General
National Statistical Coordination Board25 November 2010

NATIONAL STATISTICAL COORDINATION BOARDSlide No. 2
Economic Performance(Growth rates, in percent)
Economic Performance(Growth rates, in percent)
2009 2010 2009 2010
GDP
GNP
NFIA
Third Quarter Q1 to Q3
6.5
13.7
7.54.1
0.2
35.2 31.6
0.7
4.0
10.3
7.5
7.9

NATIONAL STATISTICAL COORDINATION BOARDSlide No. 3
Seasonal Adjustment(Growth rates, in percent)
Seasonal Adjustment(Growth rates, in percent)
2009
Q4 Q1 Q2 Q3
GDP
GNP
2010
-0.5
1.2
3.71.6 1.4
1.92.1 1.8

NATIONAL STATISTICAL COORDINATION BOARDSlide No. 4
GDP
Growth Lower Upper Lower Upper Lower UpperLimit Limit Limit Limit Limit Limit
Q3 2010
99%
Confidence Interval
Period 90% 95%
6.5 6.2 6.7 6.1 6.7 6.0 6.8
Confidence Intervals
for the True Growth Rateof the Gross Domestic Product (GDP)
Confidence Intervals
for the True Growth Rateof the Gross Domestic Product (GDP)
NATIONAL STATISTICAL COORDINATION BOARDSlide No. 5
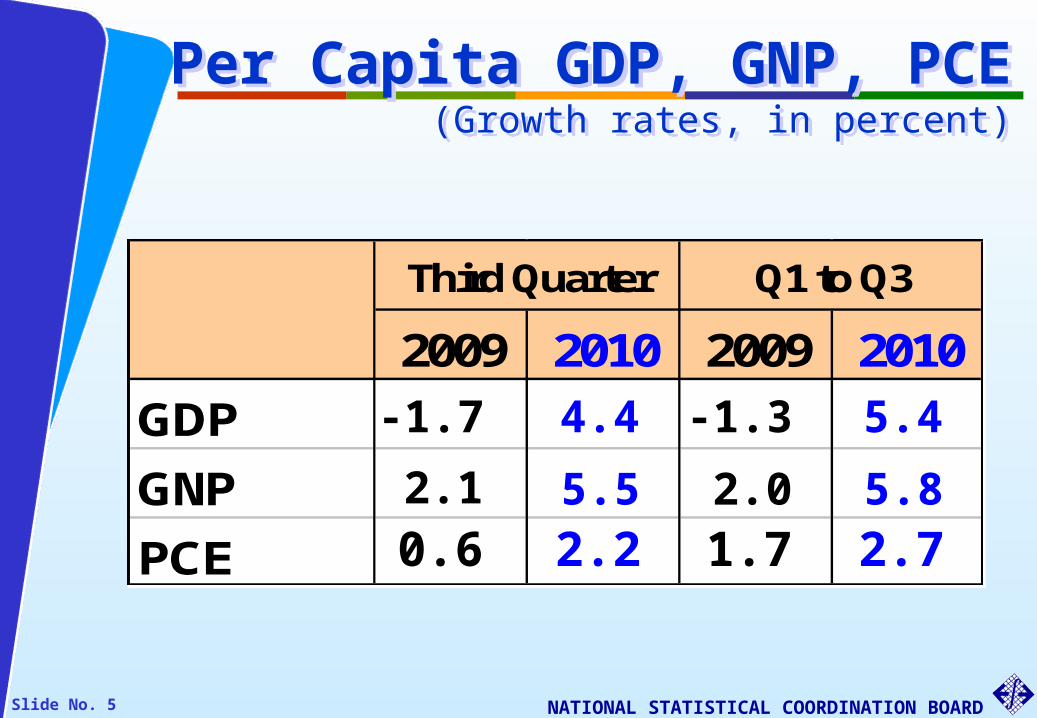
Per Capita GDP, GNP, PCE(Growth rates, in percent)
Per Capita GDP, GNP, PCE(Growth rates, in percent)
2009 2010 2009 2010
GDP
GNP
PCE
Third Quarter Q1 to Q3
5.4
2.75.8
1.72.0
-1.3
0.62.1
-1.7 4.4
2.25.5

NATIONAL STATISTICAL COORDINATION BOARDSlide No. 6
Major Industries(Growth rates, in percent)Major Industries
(Growth rates, in percent)
2009 2010 2009 2010
AFF
Industry
Services
Third Quarter Q1 to Q3
-2.5
7.7
9.2-4.8
1.4
3.4 2.7
1.2
-2.7
7.1
-2.8
13.7

NATIONAL STATISTICAL COORDINATION BOARDSlide No. 7
Seasonal AdjustmentMajor Industries (Growth rates, in percent)
Seasonal AdjustmentMajor Industries (Growth rates, in percent)
2009
Q4 Q1 Q2 Q3
AFF
Industry
Services
2010
1.9
0.3
-4.4
-0.2-2.4 -0.3
4.40.3 0.8
4.76.0 3.0

NATIONAL STATISTICAL COORDINATION BOARDSlide No. 8
Contributions to GDP GrowthContributions to GDP Growth
AFF
Industry
Services
GDP
Q3 2010
3.91
-0.43
2.97
6.46

NATIONAL STATISTICAL COORDINATION BOARDSlide No. 9
Agriculture, Fishery & Forestry(Growth rates, in percent)
Agriculture, Fishery & Forestry(Growth rates, in percent)
2009 2010 2009 2010
AFF
Palay
Corn
Coconut / copra
Sugarcane
Banana
Other crops
Livestock
Poultry
Agri. Activities
Fishery
Forestry
Third Quarter Q1 to Q3
-82.8-1.6
-24.8-2.4
2.32.7
-1.04.28.93.5
-7.3
2.90.82.4
-19.94.0
-1.72.03.52.23.0
-10.7
1.55.24.2
10.53.00.81.31.82.2
-0.6-2.1
-14.9-15.4
-0.4-19.2
1.22.81.13.01.60.8
-13.4
1.4 -2.5 1.2 -2.8

NATIONAL STATISTICAL COORDINATION BOARDSlide No. 10
Agriculture, Fishery & Forestry(Contribution to Growth, in percentage point)
Agriculture, Fishery & Forestry(Contribution to Growth, in percentage point)
Q3 2010AFF 3.92
Palay 1.64
Corn 1.61
Coconut / copra 0.63
Sugarcane 0.36
Banana 0.26
Other Crops 0.17
Livestock 0.17
Poultry -0.12
Agricultural Activities -0.15
Fishery -0.21
Forestry -0.45
-2.49-3.97
0.43-0.120.43
0.79
-0.23
-0.220.08
-0.07
-0.06
0.46

NATIONAL STATISTICAL COORDINATION BOARDSlide No. 11
Industry(Growth rates, in percent)
Industry(Growth rates, in percent)
2009 2010 2009 2010
Industry
Mining & Quarrying
Manufacturing
Construction
Electricity & Water
Third Quarter Q1 to Q3
9.3
9.24.6
11.18.1
-2.7
-7.722.9
12.9-3.8
-4.8
-7.929.5
2.0-6.3
13.918.6
14.28.3
13.7

NATIONAL STATISTICAL COORDINATION BOARDSlide No. 12
Industry (Contribution to Growth, in percentage point)
Industry (Contribution to Growth, in percentage point)
Industry
Mining & Quarrying 4.33
Manufacturing 1.00
Construction 2.00
Electricity & Water 3.00
Q32010
6.31
9.170.24
1.740.88

NATIONAL STATISTICAL COORDINATION BOARDSlide No. 13
TOP CONTRIBUTORS TO GROWTH OF MFG.
Third Quarter 2010
Electrical Machinery 3.70
Basic Metal Industries 1.42
Manufacturing(Contribution to Growth, in percentage point)
Manufacturing(Contribution to Growth, in percentage point)
Products of Petroleum & Coal 3.16
Miscellaneous Manufactures 0.95

NATIONAL STATISTICAL COORDINATION BOARDSlide No. 14
Manufacturing(Contribution to Growth, in percentage point)
Manufacturing(Contribution to Growth, in percentage point)
LEAST CONTRIBUTORS TO GROWTH OF MFG.
Third Quarter 2010
Food Manufactures -2.01
Tobacco Manufactures -0.80
Footwear Wearing Apparel -0.26

NATIONAL STATISTICAL COORDINATION BOARDSlide No. 15
Services(Growth rates, in percent)
Services(Growth rates, in percent)
2009 2010 2009 2010
Services
Transport., Comm., Stor.
Trade
Finance
O. Dwellings & Real Estate
Private Services
Government Services
Third Quarter Q1 to Q3
7.7
11.73.5
7.2
9.1
-1.3
8.4
3.4
-1.51.6
11.5-2.36.78.9
2.7
0.4
1.8
5.9-1.4
5.67.2
7.1
1911.1
5.57.77.64.5
NATIONAL STATISTICAL COORDINATION BOARDSlide No. 16
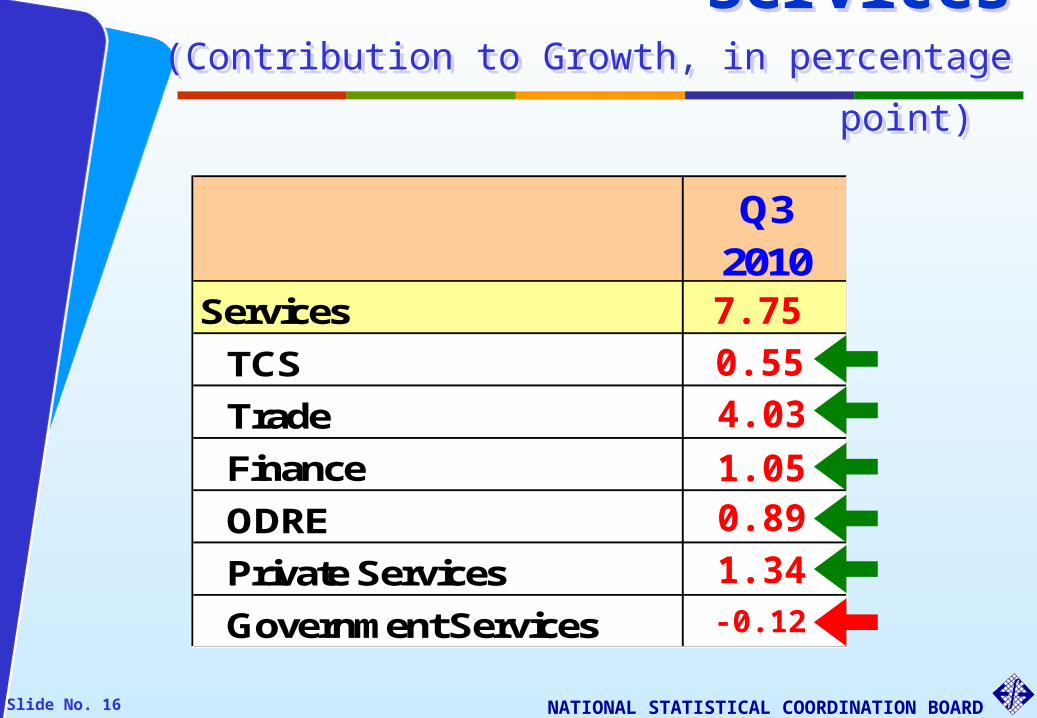
Services (Contribution to Growth, in percentage point)
Services (Contribution to Growth, in percentage point)
Q32010
Services 8.4
TCS 2.8
Trade 1.8
Finance 1.5
ODRE 1.4
Private Services 0.6
Government Services 0.3
4.030.55
1.34
0.89
-0.12
1.05
7.75

NATIONAL STATISTICAL COORDINATION BOARDSlide No. 17
IndicatorsSupporting Growth for 3rd Quarter 2010
IndicatorsSupporting Growth for 3rd Quarter 2010
INDICATOR GROWTH RATE
Employment Up by 2.2 % - Mining and Quarrying Up by 9.6 %- Manufacturing Up by 1.6 %- Construction Up by 3.2 %- TCS Up by 0.1% - Trade Up by 4.8 %- Financing, Insurance, Real Estate & Business
Up by 8.0 %
Mean Hours Worked- Mining and Quarrying Up by 4.59 %- Manufacturing Up by 0.46 %- TCS Up by 0.08 %- Financing, Insurance, Real Estate & Business
Up by 0.69 %
- Community, Social & Personal Services
Up by 37.31 %

NATIONAL STATISTICAL COORDINATION BOARDSlide No. 18
IndicatorsSupporting Growth for 3rd Quarter 2010
IndicatorsSupporting Growth for 3rd Quarter 2010
INDICATOR GROWTH RATEManufacturing (July-Aug)
- Value of Production IndexUp by 15.8 %
- Volume of Production Index Up by 23.8 %
- Capacity Utilization Up by 2.0 %- Value of Net Sales Index Up by 11.3 %- Volume Of Net Sales Index
Up by 19.0 %
Sales of Cement Up by 4.7 %Volume of Car Sales Up by 33.7 %
- Passenger Car Up by 37.3 %- Commercial Vehicle Up by 31.7 %
Coal Production ( In Metric Tons) Up by 18.08 %

NATIONAL STATISTICAL COORDINATION BOARDSlide No. 19
IndicatorsSupporting Growth for 3rd Quarter 2010
IndicatorsSupporting Growth for 3rd Quarter 2010
INDICATOR GROWTH RATEGross Revenue
- Key Players in Real Estate Up by 23.4 %
- Key Players in Retail trading Up by 16.91 %
- Selected Broadcasting Companies Up by 8.4 %
- Selected Fast Food Chains Up by 10.4 %
Water Gross Billed Volume Up by 2.9 %Water Gross Sales Up by 22.0 %Rail Ridership
- Volume of Passenger Up by 3.5 % - Gross Revenue Up by 6.1 %
Subscribers base (cellular) – stock Up by 11.6 % Subscribers base (fixed line) – stock Up by 4.9 %Outstanding Loans of Commercial Banks Up by 6.0 %

NATIONAL STATISTICAL COORDINATION BOARDSlide No. 20
IndicatorsSupporting Growth for 3rd Quarter 2010
IndicatorsSupporting Growth for 3rd Quarter 2010
INDICATOR GROWTH RATEExports of Goods (FOB value in million US$)
Up by 39.8 %
Imports Of Goods (FOB value in million US$) ( Jul-Aug)
Up by 19.5 %
Imports of Capital Goods (FOB value in million US$) (Jul-Aug)
Up by 10.4 %
Tourist/Visitor Arrivals (Jul-Aug) Up by 30.2 %Overseas Filipinos’ Remittances ($)
Up by 9.5 %
CPI Inflation for Q3 2010 Up by 3.8 %Peso Appreciation Q3 2010 Up by 6.4 %

NATIONAL STATISTICAL COORDINATION BOARDSlide No. 21
2009 2010 2009 2010PCEGov't ConsumptionConstructionDurable EquipmentBSODAMerchandise ExportsExports of Non-Factor Svcs
Merchandise ImportsImports of Non-Factor Svcs
Third Quarter Q1 to Q3
Expenditure(Growth rates, in percent)
Expenditure(Growth rates, in percent)
12.12.6
2.8-3.51.4
-14.4-4.1-1.7
-13.8
12.2
4.2-6.1
16.42.2
28.039.516.049.5
9.1
3.710.1
-14.3-1.0
-19.86.9
-5.1-4.6
15.9
4.76.3
24.52.2
28.922.819.329.9

NATIONAL STATISTICAL COORDINATION BOARDSlide No. 22
Expenditure(Contribution to Growth, in percentage point)
Expenditure(Contribution to Growth, in percentage point)
Q3
2010
PCE
Gov't Consump.
Construction
Durable Equip.
BSODA
Changes in Stocks
Net Exports
GDP
3.36
-0.45
1.11
1.24
0.02
-0.90
6.12
6.46

NATIONAL STATISTICAL COORDINATION BOARDSlide No. 23
Construction(Growth rates, in percent)
Construction(Growth rates, in percent)
2009 2010 2009 2010
Construction
Public
Private
Third Quarter Q1 to Q3
12.2-24.041.1
23.32.8
-9.2
15.9
23.08.3
9.1
-3.627.0

NATIONAL STATISTICAL COORDINATION BOARDSlide No. 24
Top 5 Merchandise Exports(In percent)
Top 5 Merchandise Exports(In percent)
Contributors to Growth C ontr i buti ons
to G r owth
76.3Finished Electrical Machinery
20.2Garments
22.8Crude Coconut Oil
76.3Other Prods. Manufactured
95.1Semiconductors and Electric Microcircuits 9.56
6.38
1.06
0.76
0.34
Q3 2010Growth Rates

NATIONAL STATISTICAL COORDINATION BOARDSlide No. 25
Least Contributorsto Growth
C ontr i buti ons
to G r owth
-32.2Dessicated Coconut
-40.1Gold from Copper Ores
-27.6Prepared Tuna
-43.0Centrifugal Sugar
-58.3Iron Agglomerates -0.26
-0.21
-0.11
-0.10
-0.10
Bottom 5 Merchandise Exports(In percent)
Bottom 5 Merchandise Exports(In percent)
Q3 2010Growth Rates

NATIONAL STATISTICAL COORDINATION BOARDSlide No. 26
Top 5 Merchandise Imports(In percent)
Top 5 Merchandise Imports(In percent)
Contributors to GrowthC on t r ibut ion s
t o G r owt h
13.8Electrical Machinery, Apparatus and Appliances
75.6Cereal and Cereal Products
2.73
2.41
23.2Machinery Other Than Electrical Machinery 2.25
46.5Fertilizer 0.96
6.4Mineral fuels, lubricants and related materials 0.52
Q3 2010Growth Rates

NATIONAL STATISTICAL COORDINATION BOARDSlide No. 27
Least Contributorsto Growth
C ontr i buti ons
to G r owth
2.7Paper Products 0.03
Bottom Merchandise Imports(In percent)
Bottom Merchandise Imports(In percent)
Q3 2010Growth Rates
13.9Textile Fibers 0.06
2.5Textile Yarns 0.08
4.8Feeding Stuff 0.18
5.6Chemical Elements & Compounds 0.20
NATIONAL STATISTICAL COORDINATION BOARDSlide No. 28
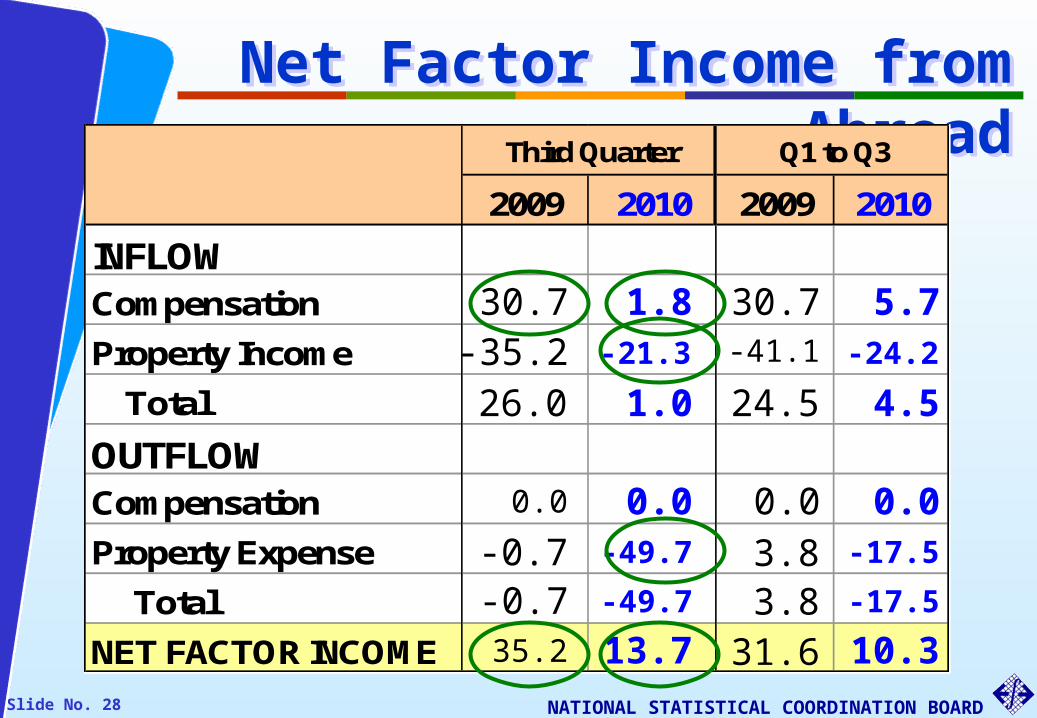
Net Factor Income from AbroadNet Factor Income from Abroad
2009 2010 2009 2010
INFLOWCompensation
Property Income
Total
OUTFLOWCompensation
Property Expense
Total
NET FACTOR INCOME
Third Quarter Q1 to Q3
5.7
-17.5
10.3
-24.2
3.8
4.5
0.0
-17.5
-41.130.7
24.5
0.0
3.831.6
-0.7
30.7-35.226.0
0.0
-0.735.2
1.8
-49.7
13.7
-21.31.0
0.0
-49.7
NATIONAL STATISTICAL COORDINATION BOARDSlide No. 29
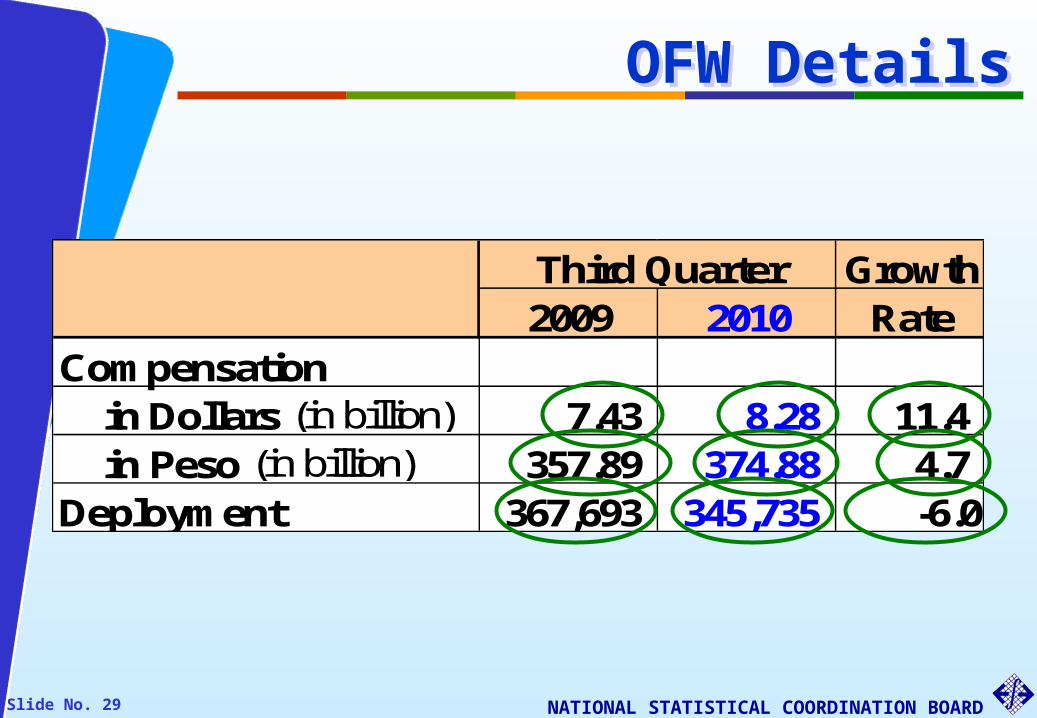
OFW DetailsOFW Details
Growth2009 2010 Rate
Compensation in Dollars (in billion) 7.43 8.28 11.4 in Peso (in billion) 357.89 374.88 4.7 Deployment 367,693 345,735 -6.0
Third Quarter

NATIONAL STATISTICAL COORDINATION BOARDSlide No. 30
Preliminary Revised ContributionAs of Aug 2010 As of Nov 2010 to Revision
PRODUCTION
Second Quarter 2010 Revisions(Growth Rates as of August 2010 and as of November 2010)
Second Quarter 2010 Revisions(Growth Rates as of August 2010 and as of November 2010)
-3.0-2.8
-37.815.8
6.4
36.312.422.68.4
4.27.82.29.46.77.67.9
7.97.7
-3.2-2.9
-37.916.1
6.7
37.412.722.58.6
3.59.11.79.07.17.98.2
7.63.9
-0.02-0.020.000.09
0.01
0.030.06
-0.01
0.15-0.060.21
-0.04-0.020.040.020.30
-0.34-0.53
AFFAGRICULTURE & FISHERYFORESTRY
INDUSTRYMINING & QUARRYINGMANUFACTURINGCONSTRUCTIONELECTRICITY, GAS & WATER
SERVICESTRANS., COMM & STORAGETRADEFINANCEODREPRIVATE SERVICESGOVERNMENT SERVICES
GROSS DOMESTIC PRODUCTN F I A
GROSS NATIONAL PRODUCT

NATIONAL STATISTICAL COORDINATION BOARDSlide No. 31
AnnouncementsAnnouncements1. Approved FDI up by 83 percent in Q3 2010
Total foreign direct investments (FDI) approved in the third quarter of 2010 by the four major investment promotion agencies (IPAs), namely: Board of Investments (BOI), Clark Development Corporation (CDC), Philippine Economic Zone Authority (PEZA), and Subic Bay Metropolitan Authority (SBMA) amounted to PhP 19.0 billion, up by 82.9 percent from PhP 10.4 billion approved in the third quarter of 2009.
Total A ppr ove d FDI in Q1, Q2, Q3 an d Fir s t NIne M onths
2009 and 2010
4.0
19.910.4
34.3
46.7
13.819.0
79.4
-
10.0
20.0
30.0
40.0
50.0
60.0
70.0
80.0
90.0
Q1 Q2 Q3 Jan - Sep
in b
illio
n p
eso
s
2009 2010

NATIONAL STATISTICAL COORDINATION BOARDSlide No. 32
AnnouncementsAnnouncements2. Search for Achievers in Statistics in Western Visayas
The Regional Statistical Coordination Committee Region 6 (RSCC 6) launched the first Search for Achievers in Statistics (SAS) in Western Visayas. Qualified for nomination are practicing or retired statisticians who are residents of Western Visayas and whose dedication and long-standing commitment have contributed significantly to the promotion of statistics and have made a dent in the lives of the people in Region 6. Criteria for evaluation are service, integrity, and professionalism. Awarding of winners will be in October 2011. Nomination will start next month.
Interested parties may contact RSCC 6 thru NSCB Regional Division 6 located at Luna St., La Paz, Iloilo City with telephone numbered (033) 3200513 or email address [email protected].

NATIONAL STATISTICAL COORDINATION BOARDSlide No. 33
AnnouncementsAnnouncements3. NSCB conducts Statistical Appreciation Seminar for the media
To enhance the partnership between the Philippine Statistical System (PSS) and the media in improving data dissemination and communication strategies, the National Statistical Coordination Board (NSCB) will conduct a Statistical Appreciation Seminar for the Media on January 15, 2010 (Saturday) from 8:00am to 5:00pm at the NSCB Operations Room.
The seminar aims to promote the use of statistics in evidence-based decision making towards good governance as well as to serve as a venue for exchange of ideas and discussions on statistical analysis and data interpretation that would enhance the relevance of PSS statistical products and strengthen media’s capacity in writing stories behind the statistics.

NATIONAL STATISTICAL COORDINATION BOARDSlide No. 34
AnnouncementsAnnouncements3. NSCB conducts Statistical Appreciation Seminar for the media cont….
Among the topics to be covered during the whole day seminar include basic concepts as well as sources and methodologies of the Philippine System of National Accounts and its related accounts, poverty statistics, and other indicators produced by the NSCB.
For inquiries, please contact, Mr. Ruben V. Litan of the National Statistical Information Center at 890-9405 or email at [email protected]

NATIONAL STATISTICAL COORDINATION BOARDSlide No. 35
Thank you very much.Thank you very much.
visit: www. nscb.gov.phvisit: www. nscb.gov.ph