national stock exchange of india limited4 national stock exchange of india limited 1.1.3 index...
TRANSCRIPT

NATIONAL STOCK EXCHANGE OF INDIA LIMITED
TWENTY-FOURTH ANNUAL REPORT2015-16

National Stock Exchange of India Limited
CONTENTS
Section - A
Corporate Information ......................................................................................................................................................................................................1
Board’s Report..........................................................................................................................................................................................................................3
Report on Corporate Governance ...........................................................................................................................................................................73
Business Responsibility Report ..................................................................................................................................................................................99
Section - B
Auditors’ Report on Consolidated Financial Statements ..............................................................................................................................1
Consolidated Balance Sheet ...........................................................................................................................................................................................6
Consolidated Statement of Profi t and Loss ...........................................................................................................................................................8
Consolidated Cash Flow Statement .......................................................................................................................................................................10
Notes to Consolidated Financial Statements ....................................................................................................................................................12
Auditors’ Report on Standalone Financial Statements ...............................................................................................................................70
Standalone Balance Sheet ............................................................................................................................................................................................77
Standalone Statement of Profi t and Loss ............................................................................................................................................................79
Standalone Cash Flow Statement ............................................................................................................................................................................81
Notes to Standalone Financial Statements ........................................................................................................................................................83

1
Twenty-Fourth Annual Report FY 2015-2016
CORPORATE INFORMATION
Board of Directors* Mr. Ashok Chawla : Chairman
Mr. Ravi Narain : Vice Chairman
Ms. Chitra Ramkrishna : Managing Director & CEO
Mr. Abhay Havaldar
Mr. Dinesh Kanabar
Mr. Naved Masood
Mr. T.V. Mohandas Pai
Mr. Prakash Parthasarathy
Ms. Dharmishta Raval
Management TeamMr. J. Ravichandran : Group President & Company Secretary
Mr. Subramanian Anand : Group Operating Officer
Mr. Yatrik R. Vin : Chief Financial Officer - Group Accounts & Finance
Mr. Ravi Varanasi : Chief - Business Development
Dr. V. R. Narasimhan : Chief Regulatory Officer
Ms. Huzan Mistry : Chief - Business Development
Mr. Kinjal Medh : Chief Marketing Officer
Mr. Chandrashekhar Mukherjee : Chief People Officer
Mr. Sankarson Banerjee : Chief Technology Officer - Projects
Mr. Nirmal Mohanty : Chief Economist
Mr. Hari K : Chief Business Officer - BD-Equity & Equity Derivatives
Mr. Suprabhat Lala : Chief Vigilance Officer
Mr. M. Vasudev Rao : General Counsel
Mr. Mayur Sindhwad : Chief Operating Officer - Trading
Mr. Tarun Aiyar : Chief Financial Officer - Group Investment & Stakeholders Relations
Mr. Kashinath Katakdhond : Vice President - TREDS
Mr. Nagendra Kumar SRVS : Chief Business Officer, BD-CDs & Debt Market
Mr. Mahesh Haldipur : Head - Admin. & Premises
Mr. Madhavan Sampath : Head - Secretarial
Ms. Nisha Subhash : Senior Asst. Vice President
Ms. Rana Usman : Senior Asst. Vice President
* As on August 22, 2016

2
National Stock Exchange of India Limited
Auditors : M/s. Khandelwal Jain & Co.
Chartered Accountants
12-B, Baldota Bhavan, 5th Floor
Maharshi Karve Road, Churchgate
Mumbai – 400 020
Registered Office : “Exchange Plaza”
Plot No. C-1, Block ‘G’,
Bandra Kurla Complex
Bandra (East), Mumbai – 400 051
Registrar & Transfer Agents : Link Intime India Pvt. Ltd.
C-13, Pannalal Silk Mills Compound
L B S Marg, Bhandup (West) Mumbai – 400 078

Twenty-Fourth Annual Report FY 2015-2016
3
BOARD’S REPORT
To, The Members,
Your Directors have pleasure in presenting the Twenty-fourth Annual Report and Audited Financial Statements of the Company for the year ended March 31, 2016.
1. OPERATIONS AND MAJOR DEVELOPMENTS DURING THE YEAR
1.1 Global rankings - Equity Derivatives Market
1.1.1 Stock Futures
During the calendar year 2015, NSE was ranked as the 2nd largest exchange in respect of contracts traded in stock futures. The details of top 5 exchanges trading stock futures are given in Table 1 below:
Table 1(In millions)
Sr. No. Exchange Contracts traded during 2015
1 Moscow Exchange 307
2 National Stock Exchange India 257
3 Korea Exchange 164
4 EUREX 123
5 ICE Futures Europe 51
Source: WFE
1.1.2 Index Options
During the calendar year 2015, NSE was ranked 1st in the world in respect of contracts traded in index options. The details of top 5 exchanges in index options are given in Table 2 below:
Table 2(In millions)
Sr. No. Exchange Contracts traded during 2015
1 National Stock Exchange India 1,894
2 Korea Exchange 484
3 Chicago Board Options Exchange 408
4 EUREX 401
5 TAIFEX 192
Source: WFE

4
National Stock Exchange of India Limited
1.1.3 Index Futures
During the calendar year 2015, NSE was ranked as the 6th largest exchange in the world in index futures. The details of top 10 exchanges in index futures are given in Table 3 as under:
Table 3(In millions)
Sr. No. Exchange Contracts traded during 2015
1 CME Group 565
2 EUREX 430
3 China Financial Futures Exchange 335
4 Japan Exchange Group 312
5 Moscow Exchange 195
6 National Stock Exchange India 165
7 Singapore Exchange 165
8 BM&FBOVESPA 107
9 Hong Kong Exchanges 72
10 TAIFEX 57
Source: WFE
1.1.4 Nifty Index Global rankings
Nifty Index options ranked 1st across the top 20 Index options traded globally during the calendar year 2015.
(Source: www.futuresindustry.org rankings based on number of contracts traded or cleared between Jan 15 - Dec 15)
1.1.5 All products
NSE was ranked 2nd across all the Derivatives exchanges in the world based on the volume of contracts traded during the calendar year 2015.
(Source: www.futuresindustry.org rankings based on number of contracts traded or cleared between Jan 15 - Dec 15)
1.2 Global Rankings-Capital Market
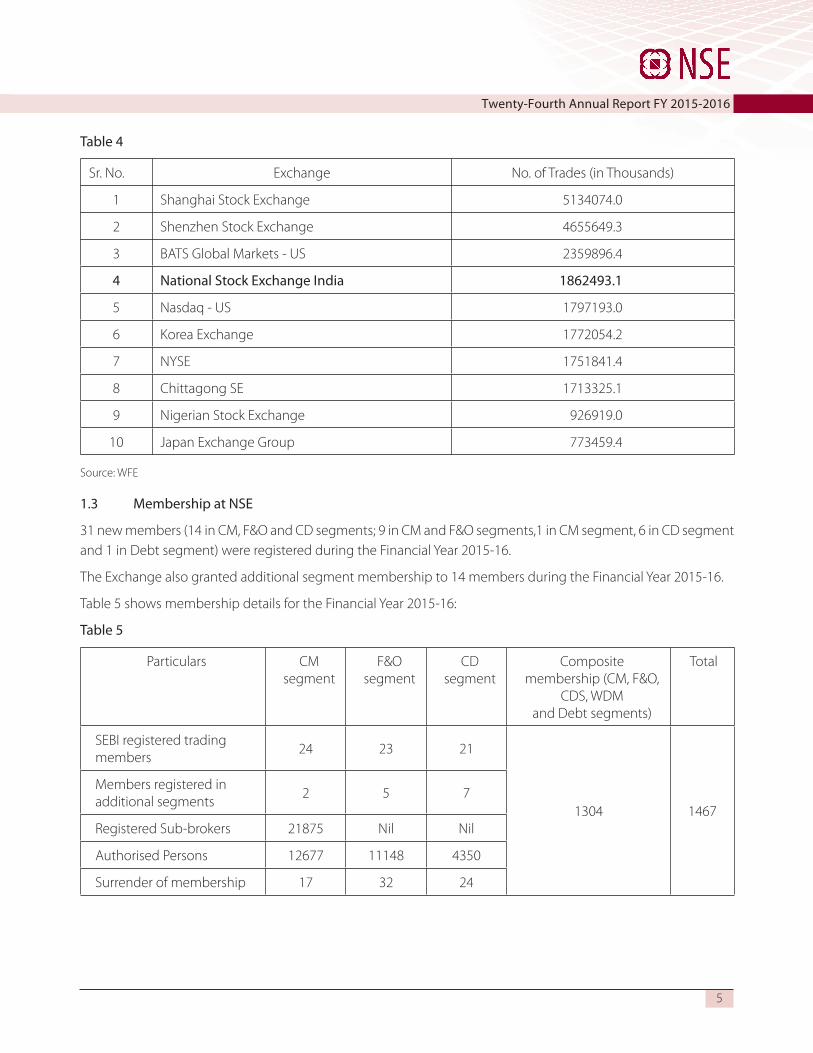
In the Capital Market segment, NSE was ranked fourth in the world based on the number of trades during the calendar year 2015. The details of top 10 Exchanges are given in the table 4 below:
Twenty-Fourth Annual Report FY 2015-2016
5
Table 4
Sr. No. Exchange No. of Trades (in Thousands)
1 Shanghai Stock Exchange 5134074.0
2 Shenzhen Stock Exchange 4655649.3
3 BATS Global Markets - US 2359896.4
4 National Stock Exchange India 1862493.1
5 Nasdaq - US 1797193.0
6 Korea Exchange 1772054.2
7 NYSE 1751841.4
8 Chittagong SE 1713325.1
9 Nigerian Stock Exchange 926919.0
10 Japan Exchange Group 773459.4
Source: WFE
1.3 Membership at NSE
31 new members (14 in CM, F&O and CD segments; 9 in CM and F&O segments,1 in CM segment, 6 in CD segment and 1 in Debt segment) were registered during the Financial Year 2015-16.
The Exchange also granted additional segment membership to 14 members during the Financial Year 2015-16.
Table 5 shows membership details for the Financial Year 2015-16:
Table 5
Particulars CM segment
F&O segment
CD segment
Composite membership (CM, F&O,
CDS, WDM and Debt segments)
Total
SEBI registered trading members
24 23 21
1304 1467
Members registered in additional segments
2 5 7
Registered Sub-brokers 21875 Nil Nil
Authorised Persons 12677 11148 4350
Surrender of membership 17 32 24

6
National Stock Exchange of India Limited
1.4 Capital Market (CM segment)
The total turnover of CM segment in the year 2015-16 is ` 42,36,983 crores as compared to ` 43,29,655 crores in the year 2014-15, showing a decrease of 2.14%. The average daily traded value in 2015-16 is ` 17,154 crores as compared to ` 17,818 crores in 2014-15.
As on March 31, 2016, the number of listed companies available for trading was 1580 compared to 1511 at the end of March 31, 2015.
Figure 1 : Month-wise Turnover and Average Daily Turnover in CM segment
The changes in turnover statistics over the preceding year are presented in Table 6
Table 6Turnover Statistics on CM segment
Sr. No.
Details 2015-16 2014-15 % Rise / (Fall) in 2015-16
1 Total Number of trades (In lakhs) 18518 18328 1.03%
2 Total number of shares traded (in lakhs) 2201771 2361779 -6.77%
3 Total Turnover (` Cr.) 4236983 4329655 -2.14%
4 Market Capitalization at the end of year (` Cr.) 9310471 9930122 -6.24%
5 Turnover of CNX Nifty Securities (` Cr.)* 1963224 1952171 0.57%
6 Total number of listed companies for trading. 1580 1511 4.57%
*CNX Nifty was rebranded as Nifty 50 w.e.f. Nov 09, 2015.
1.4.1 Index movement
Nifty 50 saw downward movement of 8.86% moving from 8,491.00 to 7,738.40 over the financial year 2015-16.
During the year 2015-16, the Nifty 50 touched a high of 8,844.80 on April 15, 2015 and low of 6,825.80 on February 29, 2016. Movement of Nifty 50 is shown in Figure 2.

Twenty-Fourth Annual Report FY 2015-2016
7
The turnover of Nifty 50 securities was ` 19,63,224 crores in the year 2015-16 as compared to ` 19,52,171 crores in the previous year. The contribution of Nifty 50 securities turnover to total turnover during the year 2015-16 was 46.34% compared to 45.09% in the year 2014-15.
Figure 2 : Nifty movement
*CNX Nifty was rebranded as Nifty 50 w.e.f. Nov 09, 2015.
1.4.2 Market Capitalisation
The market capitalisation of securities available for trading on CM segment has decreased by 6.24% during 2015-16 from ̀ 99,30,122.02 crores as on March 31, 2015 to ̀ 93,10,471.47 crores as on March 31, 2016. Out of total market capitalisation of ` 93,10,471.47 crores as on March 31, 2016, ` 1,61,888.62 crores was contributed by newly listed securities. The market capitalisation growth is shown in Figure 3.
Figure 3: Market Capitalisation during year 2015-16

8
National Stock Exchange of India Limited
1.4.3 Distribution of Turnover
Turnover-wise distribution of trading members
About 67.38% of the trading members had an average daily turnover of ` 1 crore or more in 2015-16. In 2015-16, around 25.90% of the trading members have daily turnover more than ` 10 crores.
Figure 4 : Average Daily Turnover-wise distribution of TMs
1.4.4 New Developments during the year
In year 2015-16, various new developments have been initiated by the Exchange. The details of the same are given below:-
May 2015 Prevention of Self trade facility
Exchange has introduced prevention of Self trade facility, in order to prevent matching between a buy and a sell order entered in the same order book by a member for the same client code either originating from same or different trading terminals of the member.
June 2015 Tender Offer Facility through Stock Exchange
Exchange has provided a separate acquisition window in the web based IPO bidding platform to facilitate the following:-
• Order collection from eligible sellers through their respective stock brokers under Takeovers, Buy Back and Delisting
• Real-time validation for availability of securities during submission of offers
• Cumulative quantity tendered will be made available online to the market.
• Settlement of trades to be carried out by clearing corporation

Twenty-Fourth Annual Report FY 2015-2016
9
June 2015 Introduction of overnight Liquid Transaction on MFSS web platform
Exchange has introduced an order entry functionality which shall allow the participants to place purchase and redemption orders simultaneously in liquid schemes. This facility is available on MFSS Web based platform in Physical mode w.e.f. June 22, 2015.
July 2015 Mechanism for acquisition of shares through Stock Exchange pursuant to Tender – Offers under Takeovers, Buy Back and Delisting
The Exchange has issued the detailed operating guidelines and terms and conditions with regard to ‘Tender Offer Scheme’.
July 2015 Policy for annulment of trades undertaken on stock exchanges
The Exchange has set in place the policy of trade annulment and issued a circular with the applicable criteria for placing trade annulment requests on the Exchange platform.
September 2015 Rebranding of Indices
India Index Services & Products Limited, a step down subsidiary of NSE, has, initiated, as a part of rebranding initiative, rebranded all its existing indices to include ’Nifty’ in the name of its indices as Nifty has become a strong brand name amongst the investors tracking Indian capital markets. NSE’s flagship “CNX Nifty” index has been rebranded as “Nifty 50” index.
October 2015 Review of capacity planning framework of Stock Exchanges and Clearing Corporations
SEBI vide Circular ref no. CIR/MRD/DP/17/2015 dated October 08, 2015 has informed Stock exchanges and Clearing Corporations to review the existing capacity planning framework and has provided guidelines to implement suitable mechanisms, including generation of appropriate alerts, to monitor capacity utilisation on a real-time basis and to proactively address issues pertaining to capacity needs. Accordingly, the Exchange has implemented the new SEBI guidelines w.e.f. December 14, 2015.
October 2015 Launch of new testing service – NLABS
The Exchange has introduced a new service which provides facility for market participants to test their trading systems including algorithm trading system with replay of Historical market data and “near live trading“ test experience w.e.f. October 23, 2015.
November 2015 Events / incidents impacting markets
a. Extended live trading session was held on November 9, 2015 on the occasion of Dhanteras
b. Muhurat Trading session was held on November 11, 2015 on account of Diwali
December 2015 Live Trading sessions from Disaster Recovery (DR) site
The Exchange conducted Live trading sessions from its Disaster Recovery (DR) site on December 21, 2015 and December 22, 2015.

10
National Stock Exchange of India Limited
February 2016 Review of Offer for Sale (OFS) of Shares through Stock Exchange Mechanism
The Exchange issued a circular regarding the modified guidelines on sale of shares through Offer for Sale mechanism.
March 2016 Rebranding of Indices
The Exchange issued a circular regarding the New Structure for Nifty Broad Market Indices.
March 2016 Dissemination of New Indices in Capital Market segment
The Exchange issued a circular regarding online dissemination of 3 Indices on trading system w.e.f. Mar 14, 2016 and 7 Indices on trading system w.e.f. April 04, 2016.
1.5 FUTURES AND OPTIONS SEGMENT
The financial year 2015-16 witnessed an increase of 16.58% in volumes and an increase in number of contracts traded by 14.24% vis-à-vis 2014-15 and in daily average open interest, it increased by 8.42% over previous year in the F&O segment. The average contribution of proprietary category decreased to 49.32% in 2015-16 from 51.06% in 2014-15.
1.5.1. Comparison of the close prices of the NIFTY Near Month Futures Contract (F&O segment) with the underlying movement of the NIFTY Index (Cash segment) along with the Daily Traded value of the F&O segment:
Figure 5
Note: Special trading sessions on November 11, 2015 (Muhurat Trading) and December 21, 2015 and December 22, 2015 (Live trading
sessions from Disaster recovery site.)

Twenty-Fourth Annual Report FY 2015-2016
11
1.5.2 Records achieved in the F&O segment during 2015-16:
Table 7
Category Total Date of Record
Stock Options Traded Value (` Crs) 53,692.53 13-Jan-16
Index Options Traded Value (` Crs) 10,47,401.81 31-Mar-16
Total F&O Traded Value (` Crs) 6,48,505.58 31-Mar-16
Number of trades 77,38,349 24-Aug-15
Number of contracts traded 2,72,05,109 30-Apr-15
It may be observed that during 2015-16, new records were set in Stock options, Index options, total F&O traded value, number of trades and number of contracts traded.
1.5.3 (a) Basic Statistics of the F&O segment:
Table 8
Particulars Apr 15 to Jun 15
Jul 15 to Sep 15
Oct 15 to Dec 15
Jan 16 to Mar 16
2015-16 2014-15 % Change
Daily Average Traded Value (` in crores)
2,68,836.20 2,59,944.76 2,19,800.91 3,01,352.56 2,62,452.77 2,28,833.00 14.71
Daily Average Number of Contracts
1,14,95,855 1,11,68,147 54,77,665 57,12,529 84,96,398 75,59,840 11.95
Open Interest (` in crores) End of day averages
2,15,442.10 2,24,349.66 2,23,096.68 2,23,191.95 2,21,554.47 2,04,352.00 8.42
% of Open interest to Daily Average Traded value
80.14% 86.31% 101.50% 74.06% 84.42% 89.30%

12
National Stock Exchange of India Limited
1.5.3 (b) A graphical presentation of monthly product-wise contribution is given below:
Figure 6
Among all products, Index Options continued to dominate the Total Turnover with their contribution observed at 82.79% in 2015-16
1.5.4 Institutional Retail & Proprietary Investors – Turnover Analysis:
Table 9
Sr. No
Year Institutional Retail Proprietary
Average Gross Traded Value
(` Crs.)
Percentage Contribution
Average Gross Traded Value
(` Crs.)
Percentage Contribution
Average Gross Traded Value
(` Crs.)
Percentage Contribution
1 2014-15 1 ,28,47, 080 11.55% 4,15,81,358 37.39% 5,67,84,469 51.06%
2 2015-16 1 ,38,30, 974 10.67% 5,18,76,427 40.01% 6,39,44,268 49.32%
It may be observed that the average contribution of proprietary category has decreased in the year 2015-16 as compared to 2014-15.

Twenty-Fourth Annual Report FY 2015-2016
13
1.5.5 Comparative analysis of the Traded Value in the F&O segment with the Cash segment:
Figure 7
The ratio of F&O segment turnover to cash segment turnover was 31 for the year 2015-16 as compared to 13 for 2014-15.
1.5.6 Product-wise Basic Statistics:
Table 10
Category Product Apr 15 to Jun 15
Jul 15 to Sep 15
Oct 15 to Dec 15
Jan 16 to Mar 16
2015-16 2014-15 % Change
Daily Average Traded Value (` Crs)
Stock Futures 31,429 31,643 30,423 33,286 31695 34,122 -7.11
Index Futures 19,115 20,079 15,170 19,355 18450 16,911 9.10
Stock Options 12,580 13,767 13,592 16,567 14,122 13,508 4.55
Index Options 205,712 194,456 160,616 232,144 198186 164,290 20.63
Daily Average Stock Futures 1,134,503 1,177,857 738,092 731,686 948356 977,797 -3.01
No. of Contracts
Index Futures 742,449 788,260 361,310 373,128 568983 532,157 6.92
Stock Options 440,532 492,906 334,636 351,934 406070 376,457 7.87
Index Options 9,178,371 8,709,124 4,043,627 4,255,781 6572990 5,673,427 15.86
Average OI Value (` Crs)
Stock Futures 70,032 69,975 71,284 64,552 68,961 65,518 5.25
Index Futures 24,829 29,352 26,848 26,623 26,913 25,834 4.18
Stock Options 19,704 20,424 22,217 21,865 21,053 19,385 8.60
Index Options 1,51,487 1,53,209 1,49,909 1,58,535 1,53,285 1,35,815 12.86
Average Number of OI contracts
Stock Futures 25,87,765 26,80,117 18,46,788 14,48,446 2049839 20,14,081 1.78
Index Futures 10,64,011 13,05,396 8,40,162 4,98,238 849152 8,85,348 -4.09
Stock Options 7,36,282 8,02,117 6,17,411 4,95,842 6,44,853 5,85,183 10.20
Index Options 63,89,414 63,90,488 44,77,469 29,32,927 4726476 44,45,172 6.33
Number of trading Days 61 64 61 61 247 243

14
National Stock Exchange of India Limited
1.5.7 TOP 5 TRADED SYMBOLS
Futures:
Figure 8
Options:
Figure 9
Note: Index Futures includes India VIX* data.
1.5.8 New Developments during the year 2015-16
In year 2015-16, various new developments have been initiated by the Exchange. The details of the same are given below:-
Twenty-Fourth Annual Report FY 2015-2016
15
May 2015 Prevention of Self trade facility
The Exchange has introduced prevention of Self trade facility, in order to prevent matching between a buy and a sell order entered in the same order book by a member for the same client code either originating from same or different trading terminals of the member.
July 2015 Policy for annulment of trades undertaken on stock exchanges
The Exchange has set in place the policy of trade annulment and issued a circular with the applicable criteria for placing trade annulment requests on the Exchange platform.
July 2015 SEBI Lot Size revision in F&O segment (Stocks, Indices)
SEBI has revised the minimum lot size value from ` 2 lakhs to ` 5 lakhs for all stock and Index futures and Options contracts.
September 2015 Rebranding of Indices
India Index Services & Products Limited, a step down subsidiary of NSE, has initiated, as a part of rebranding initiative, rebranding of all its existing indices to include ’Nifty’ in the name of its indices as Nifty has become a strong brand name amongst the investors tracking Indian capital markets. NSE’s flagship “CNX Nifty” index has been rebranded as “Nifty 50” index.
October 2015 Review of capacity planning framework of Stock Exchanges and Clearing Corporations
SEBI vide Circular ref no. CIR/MRD/DP/17/2015 dated October 08, 2015 has informed Stock exchanges and clearing corporations to review the existing capacity planning framework and has provided guidelines to implement suitable mechanisms, including generation of appropriate alerts, to monitor capacity utilisation on a real-time basis and to proactively address issues pertaining to capacity needs. Accordingly, the Exchange has implemented the new SEBI guidelines w.e.f. December 14, 2015.
October 2015 Launch of new testing service – NLABS
The Exchange has introduced a new service which provides facility for market participant’s to test their trading systems including algorithm trading system with replay of Historical market data and “near live trading” test experience w.e.f. October 23, 2015
November 2015 Events / incidents impacting markets
Muhurat Trading session was held on November 11, 2015 on account of Diwali
December 2015 Live Trading sessions from Disaster Recovery (DR) site
The Exchange conducted Live trading sessions from its Disaster Recovery (DR) site on December 21, 2015 and December 22, 2015.
1.6 CURRENCY DERIVATIVES SEGMENT
The financial year 2015-16 witnessed an increase in currency derivatives (Currency Futures and Options) volumes. The average daily turnover in currency derivatives increased by 46.42% and stood at `18,603.83 crores in 2015-16 compared to ` 12,705.49 crores in 2014-15.

16
National Stock Exchange of India Limited
The daily average number of contracts increased by 37.82% in 2015-16 and stood at 27,83,402 contracts as compared to 20,19,600 contracts traded in 2014-15.
The daily average open interest increased by 50.35% in 2015-16 as compared to what was observed last year during the same period.
The total number of members registered in currency derivative segment has risen to 900 for the year 2015-16 as compared to 872 for the year 2014-15.
Currency Futures: Average daily turnover in Currency futures for the financial year 2015-16 increased by 20.28% and stood at ` 11,360.88 crores as compared to ` 9,445.35 crores seen in 2014-15. Futures trading constituted 61.07% of the total turnover in the segment. USD-INR currency pair was the most traded futures contracts. The average market share of NSE in currency futures stood at 33.77% in 2015-16.
Currency Options: Average daily turnover in currency options also increased by 122.14% in 2015-16 at ` 7,241.95 crores compared to ` 3,260.15 crores observed during 2014-15. The average market share of NSE in currency options stood at 63.29% in 2015-16.
Interest Rate Futures: Average daily turnover in Interest Rate Futures for the financial year 2015-16 increased by 22.81% and stood at 2,175.31 crores as compared to ` 1,771.25 crores in 2014-15. The daily average open interest also increased by 39.56% and stood at 2,39,044 contracts as compared to 1,71,287 contracts in the previous year.
Figure 10
New Developments during the year 2015-16
In year 2015-16, various new developments have been initiated by the Exchange. The details of the same are given below:-
May 2015 Prevention of Self trade facility
Exchange has introduced prevention of Self trade facility, in order to prevent matching between a buy and a sell order entered in the same order book by a member for the same client code either originating from same or

Twenty-Fourth Annual Report FY 2015-2016
17
different trading terminals of the member.
June 2015 Exchange Traded Cash Settled Interest Rate Futures (IRF) on 6 year, 10 year and 13 year Government of India (GoI) Security
SEBI has permitted stock exchanges to introduce cash settled Interest Rate Futures on 6-Year and 13 year GoI Security.
July 2015 Policy for annulment of trades undertaken on stock exchanges
The Exchange has set in place the policy of trade annulment and issued a circular with the applicable criteria for placing trade annulment requests on the Exchange platform
October 2015 Review of capacity planning framework of Stock Exchanges and Clearing Corporations
SEBI vide Circular ref no. CIR/MRD/DP/17/2015 dated October 08, 2015 has informed stock exchanges and clearing corporations to review the existing capacity planning framework and has provided guidelines to implement suitable mechanisms, including generation of appropriate alerts, to monitor capacity utilisation on a realtime basis and to proactively address issues pertaining to capacity needs. Accordingly, the Exchange has implemented the new SEBI guidelines w.e.f. December 14, 2015.
October 2015 Launch of new testing service – NLABS
The Exchange has introduced a new service which provides facility for market participants to test their trading systems including algorithm trading system with replay of Historical market data and “near live trading” test experience w.e.f. October 23, 2015.
November 2015 Events / incidents impacting markets
Muhurat Trading session was held on November 11, 2015 on account of Diwali
December 2015 Live Trading sessions from Disaster Recovery (DR) site
The Exchange conducted Live trading sessions from its Disaster Recovery (DR) site on December 21, 2015 and December 22, 2015.
1.7 Debt segment
NSE launched first dedicated Debt Platform on May 13, 2013. The Debt segment provided an opportunity to retail investors to invest in corporate bonds on a liquid and transparent exchange platform. The segment has helped Institutions who are holders of corporate bonds an ideal platform to buy and sell at optimum prices and help Corporates to get adequate demand, when they are issuing the bonds.
In its endeavour to centralise trading in all debt instruments into a single platform, the Exchange introduced a new web based negotiated reporting platform for reporting of all the deals in debt instruments by trading members with effect from July 01, 2015 in Debt segment. The Exchange has closed WDM from July 03, 2015 and merged with New Debt segment.
Debt segment consists of negotiated trade reporting platform and order matching platform.
The turnover on Debt segment decreased in the financial year 2015-16. The turnover decreased to ` 5,69,494.67

18
National Stock Exchange of India Limited
crores in 2015-16 from ` 7,72,369.08 crores in 2014-15 registering a decrease of 26.27% The average daily turnover decreased to ` 2,363.05 crores in 2015-16 from ` 3,258.94 crores in 2014-15.
The business growth on the Debt segment of the Exchange is presented in Figure 11 below:-
Figure 11
The transactions in dated government securities account for a substantial share in the Debt segment with 74.08% in 2015-16. Market capitalisation of the Debt segment has witnessed a constant increase in the number of securities available for trading on this segment. Total market capitalisation of the securities available for trading on Debt segment stood at ` 59, 65,056.31 crores as on March 31, 2016

Twenty-Fourth Annual Report FY 2015-2016
19
Table 11
Trades in Debt segment
Particulars 2015-16 2014-15
Number of Trades 14,676 18,789
Average monthly number of trades 1,223 1,566
Average daily number of trades 61 79
Average Trade Value (` in crores) 38.80 41.11
Average Daily Turnover (` in crores) 2,363.05 3,258.94
Turnover (` in crores) 5,69,494.67 7,72,369.08
Number of Active Scrips 1,739 1,553
Number of Active members 28 28
1.7.1 Securities Profile
The turnover of Government securities in the Debt segment decreased by 22.05% during 2015-16. Its share in total turnover increased from 53.17% in 2014-15 to 56.22% in 2015-16. The share of Treasury Bills decreased from 21.58% in 2014-15 to 17.86% in 2015-16. The turnover of Non-Government securities in Debt segment decreased by 24.29% during 2015-16. During 2015-16, the share of Non-Government Securities in total turnover increased to 25.92% as compared to 25.25% in 2014-15.
Table 12 and Figure 12 represent security-wise distribution of turnover.
Table 12
Security-wise Distribution of Turnover
Securities 2015-16 2014-15
Turnover (` incrores)
% of Turnover
Turnover (` in crores)
% of Turnover
Government Securities 3,20,144.91 56.22 4,10,693.91 53.17
T-Bills 1,01,726.20 17.86 1,66,679.74 21.58
PSU Bonds 71,330.06 12.53 1,02,261.29 13.24
Institutional Bonds 23,018.85 4.03 32,163.78 4.16
Bank Bonds 3,569.40 0.63 1,789.90 0.23
Corporate Bonds 49,705.26 8.73 58,780.46 7.62
Total 5,69,494.68 100.00 7,72,369.08 100.00

20
National Stock Exchange of India Limited
Figure 12
Security-wise Distribution of Turnover
1.7.2 Issuances in Debt segment
A total of 1,905 securities were listed during the financial year 2015-16. As at end of March 2016, 7,089 securities were available for trading on the Debt segment. Details of Issuance in Debt are provided in Table 13.
Table 13
Issuance in Debt segment
Financial Year Number of New Securities Listed
Total Number of Securities (at year end)
Market Capitalisation (at year end ` in Crs)
2004-05 1,299 3,097 14,61,734.37
2005-06 564 3,177 15,67,573.81
2006-07 661 3,252 17,84,800.57
2007-08 856 3,566 21,23,346.28
2008-09 1,026 3,954 28,48,315.50
2009-10 959 4,140 31,65,929.48
2010-11 1,080 4,479 35,94,877.15
2011-12 1,508 5,148 42,72,736.48
2012-13 1,707 5,782 49,28,331.79
2013-14 1,304 5,952 51,28,733.33
2014-15 1,694 6,546 57,39,272.61
2015-16 1,905 7,089 59,65,056.31

Twenty-Fourth Annual Report FY 2015-2016
21
1.7.3 Market Capitalisation
Total Market capitalization of the securities available for trading in Debt segment increased to ` 59,65,056.31 crores in 2015-16 from ` 57,39,272.61 crores in the previous year registering a growth of 3.93%. The Central Government securities accounted for the largest share of the market capitalisation with 46.03% while Non-Government Securities accounted for 22.43%. The composition of market capitalisation of various securities on Debt segment is presented in Table 14.
Table 14
Market Capitalisation of Debt segment
Securities As on March 2016 As on March 2015
Market Cap. (` in crores)
% of total
Market Cap. (` in crores)
% of total
Central Government Securities 27,45,713.28 46.03 28,84,022.77 50.25PSU Bonds 4,94,760.44 8.29 4,44,863.56 7.75 State Loans 15,40,492.18 25.83 12,87,822.95 22.44 T-Bills 3,40,958.32 5.72 3,55,521.29 6.19 Others 8,43,132.09 14.13 7,67,042.04 13.37 Total 59,65,056.31 100.00 57,39,272.61 100.00
Figure 13
Market Capitalisation of Debt segment
1.7.4 Corporate Bond Market
Currently for reporting trades in corporate bonds, Exchanges provide two platform namely Debt Segment and CBRICS. The average daily traded value reported through corporate bond for 2015-16 was ` 3,374.50 crores (Debt segment & CBRICS) as compared to ` 3,740.73 crores for 2014-15 with an average of around 221 trades being reported on a daily basis as compared to 245 trades for 2014-15.

22
National Stock Exchange of India Limited
Turnover of Corporate Bond is presented in Table 15 and Figure 14
Table 15
Corporate Bond Turnover
Corporate Bond Turnover 2015-16 2014-15 %Change
Total Turnover (` Crs.) 8,13,255.47 8,86,552.96 (8.27)
Average Daily Turnover (` Crs.) 3,374.50 3,740.73 (9.79)
Total Number of Trades 53,181 58,091 (8.45)
Average Daily Trades 221 245 (9.80)
Figure 14
Corporate Bond Turnover for FY 2015-16
2. SERVICES TO INVESTORS
During the Year 2015-16, the Exchange dealt with 7,391 investor complaints against trading members and companies and facilitated 560 arbitration and appellate arbitration cases.
The Exchange totally has fourteen Investor Service Centres at Mumbai, Delhi, Chennai, Kolkata, Ahmedabad, Hyderabad, Indore, Kanpur, Bangalore, Pune, Jaipur, Vadodara, Patna and Lucknow to facilitate query resolution, complaint resolution and to provide arbitration facilities. The Exchange has empaneled 117 Arbitrators and 109 IGRP members across 14 centres.
During the year, the Exchange has enhanced the e-filing portal for investors wherein investors can upload the necessary documents proving their complaint electronically. Further, through continuous initiatives, the Exchange has managed to decrease the average resolution time by 45%. Intimation of receipt of complaint is sent to trading members directly on receipt by the Exchange.

Twenty-Fourth Annual Report FY 2015-2016
23
3. NSE’S RESEARCH INITIATIVES IN 2015-16
3.1 NSE-NYU Indian Financial Markets Conference
NSE has set up a joint Initiative with NYU Stern School of Business for research in the area of Finance, with a focus on the study of Indian financial markets. The annual conference under this initiative was held in July 2015, which was the third in the series.
3.2 NSE-IGIDR Conference in Corporate Governance
The second annual international conference in corporate governance was organised in January 2016 under the aegis of the NSE-IGIDR research collaboration on corporate governance.
3.3 NSE-IFF Conference on Financial Inclusion
NSE has collaborated with IFF to promote quality research in the field of financial inclusion and household finance. The annual conference under the aegis of this initiative was organised in March 2016, where the findings of the research projects were discussed.
3.4 Quarterly Briefings under the aegis of the NSE – Centre for excellence in corporate governance (NSE-CECG)
To project NSE as a thought leader in corporate governance and engage with NSE listed companies on important governance issues, the NSE Centre for Excellence in Corporate Governance (NSE-CECG) was established in 2012-13. Under the aegis of the NSE-CECG, four issues of Quarterly Briefing were released and circulated among directors of all the NSE listed companies and top SEBI officials in 2015-16.
3.5 Publications of NSE
Indian Securities Market Review (ISMR) and NSE Factbook are two NSE publications which are prepared on an annual basis. In addition, edited transcripts of the international conferences organised by NSE were also circulated among various stakeholders in the securities market. Besides, a ‘White Paper Series’ of the NSE-NYU conference was also widely circulated.
3.6 Seminars and Panel Discussions
In 2015-16, the Economic Policy and Research (EPR) Department continued to organise seminars and panel discussions by eminent people on securities market, corporate governance and macroeconomic issues. EPR department also started the NSE Lecture Series in Securities Laws and Practices, which has seen participation from various securities market professionals including from mutual funds, investment banks, registrar and transfer agents, brokerage houses, law firms, etc. The Listing compliance department has also organized nation-wide seminars and panel discussions by eminent people on SEBI (Listing Obligations and Disclosure Requirements) Regulations, 2015 in FY 2015-16.
4.1 FINANCIAL RESULTS
The working of NSEIL during the year has resulted in a net profit after tax of ` 439.33 crores as per particulars given below: -

24
National Stock Exchange of India Limited
Table 16
Particulars 2015-16 (` In crores)
2014-15 (` In crores)
Income 2044.54 1,918.12
Expenditure 691.90 631.35
Profi t before prior period adjustments, exceptional item, contribution to NSCCL Core SGF & tax
1352.64 1,286.77
Less: Prior Period Adjustments 2.58 0.22
Profi t before exceptional item, contribution to NSCCL Core SGF &tax 1350.06 1286.55
Less: Contribution to NSCCL Core SGF 761.52 170.00
Profi t before tax 588.54 1116.55
Tax expenses (including deferred tax) 149.21 336.87
Profi t after tax 439.33 779.68
Surplus brought forward from previous year 887.03 567.72
Less: Adjustment of Depreciation due to Revised Companies Act, 2013 - 9.99
Add: reversal of provisional appropriation towards NSCCL SGF 527.19 -
Add: Deferred tax impact on depreciation adjustment - 3.40
Amount available for appropriation 1853.55 1,340.81
Appropriations
Provisional transfer to NSCCL SGF in respect of current year [net of contribution to NSCCL Core SGF amounting to ` Nil (previous year – ` 170 crores)]
- 52.97
General Reserve - -
Proposed Dividend 328.50 357.75
Corporate Dividend Tax 34.81 43.06
Balance carried to Balance Sheet 1490.24 887.03
4.2 DIVIDEND
In view of the above results, the Directors recommend payment of dividend of ` 73/- per equity share for the year 2015-16.
4.3 PARTICULARS OF LOANS, GUARANTEES OR INVESTMENTS UNDER SECTION 186
No loan or guarantee is given to any person during the year. The investments made by Company during the year are in accordance with the provisions of the Companies Act, 2013.
Twenty-Fourth Annual Report FY 2015-2016
25
4.4 PARTICULARS OF CONTRACTS OR ARRANGEMENTS WITH RELATED PARTIES
The particulars of contracts or arrangements with related parties are given in Form AOC-2 and is attached herewith as Annexure -1 to this Report.
4.5 DETAILS IN RESPECT OF ADEQUACY OF INTERNAL FINANCIAL CONTROLS WITH REFERENCE TO THE FINANCIAL STATEMENTS
Currently there is a high degree of automation in most of the key areas of operations and processes. Also, all the processes are well documented with comprehensive and well defined Standard Operating Procedures (SOPs) which inter alia includes the financial controls in the form of maker checker, strict adherence to financial delegation given by the Board at various levels, systemic controls, information security controls as well as role based access controls, etc. Further, these controls are periodically reviewed for change management in the situations of introduction of new processes/change in processes, change in the systems, change in personnel handling the activities, etc. These controls are independently reviewed by the internal auditors /operations reviewers of the Company including conducting the routine internal audit/ operations review by them where by the audit activity embeds validation/review of the controls to establish their adequacy and effectiveness. Besides the above, the Internal Auditors, Operational review and Practicing Company Secretary review the compliances by the Company with respect to various laws, rules, regulations, etc. as applicable to it on a quarterly basis.
The observations, if any, of the internal audit, operations review and the compliance report issued by independent practicing company secretary are also presented by them to the Audit Committee in every quarter.
The Statutory Auditors have conducted a review of Internal Financial Controls including Entity Level Controls, IT General Controls, risk control matrix and process walk through on a sample basis as per the guidelines issued by the ICAI.
4.6 SUBSIDIARIES, JOINT VENTURES AND ASSOCIATE COMPANIES
4.6.1. National Securities Clearing Corporation Limited (NSCCL)
CM segment: NSCCL successfully continued its track record of completing all settlements in a timely manner. During the period under review, 247 rolling settlements were handled in de-materialised mode. Per settlement figures in value terms in the current year are as follows:
The average value of securities handled per settlement was ` 5,071.49 crores in 2015-16 compared to ` 5,233.03 crores in 2014-15. The average funds pay-in per settlement was ` 1,572.49 crores in 2015-16 compared to ` 1,500.30 crores in 2014-15. The average number of shares processed per settlement was about 2,507.53 lakhs in 2015-16 compared to 2,617.55 lakhs in 2014-15. Short deliveries per settlement averaged around 0.18% in 2015-16 as compared to 0.14% in 2014-15.
The highest deliverable value of ` 25,142.75 crores was observed on April 23, 2015. Percentage of number of shares deliverable to number of shares traded increased to 28.44% in 2015-16 from 27.46% in 2014-15. Percentage of value of shares deliverable to value of shares traded increased to 29.80% in 2015-16 from 29.52% in 2014-15. The Core Settlement Guarantee Fund stood at ` 164 crores as on 31st March 2016.
F&O segment: The period April 2015 - March 2016 witnessed an increase in the total value of settlement from ` 95,653.57 crores in 2014-15 to ` 1,05,729.05 crores in 2015-16. The highest monthly settlement was `12,246.75
26
National Stock Exchange of India Limited
crores in the month of August 2015. February 2016 witnessed the highest monthly trading volumes of ` 65,72,744.55 crores while the highest daily trading volumes on NSE during this period was ` 6,48,505.58 crores, witnessed on March 31, 2016 with total of 1,18,37,779 contracts being traded. As on March 31, 2016, the Core Settlement Guarantee Fund in F&O segment stood at ` 798 Crores.
Currency Derivatives segment: The year 2015-16 witnessed an increase in the total settlement values from ` 6,569.67 crores in 2014-15 to ` 9,214.10 crores. The highest monthly settlement value was ` 1,112.18 crores in the month of August 2015. The highest trading value in Currency Futures on NSE during this period was ` 27,170.74 crores witnessed on August 25, 2015 with total of 40,22,183 contracts being traded and in Currency Options it was ` 22,182.44 crores, witnessed on March 17, 2016 with total of 32,81,695 contracts being traded. The highest trading volume in Interest Rate Futures on NSE during this period was ̀ 6,422.00 crores witnessed on April 30, 2015 with total of 3,09,819 contracts being traded. As on March 31, 2016, the Core Settlement Guarantee Fund in Currency Derivatives segment stood at ` 99 Crores.
Securities Lending and Borrowing segment: NSCCL is an Approved Intermediary (AI) for SLBS with SEBI. In 2015-16, the volumes in SLBS increased by 87.57% from ` 5,131.24 crores in 2014-15 to ` 9,624.88 crores. As compared to previous year, during 2015-16, securities traded in SLBS increased from 117 to 173 and number of participants traded increased from 57 to 67. As on March 31, 2016, there are 129 participants, 4 custodian-cum-participants and 5 custodians registered in SLBS.
Mutual Fund Service System (MFSS): As on March 31, 2016, 33 mutual fund houses with 4,757 schemes were enabled under the revised MFSS scheme. The average daily value of funds settled for subscription of mutual fund units for the period April 1, 2015 to March 31, 2016 was `12.91 Crores. The average daily value of funds settled for redemption of mutual fund units for the period April 1, 2015 to March 31, 2016 was ` 10.47 crores.
Corporate Debt Instruments: National Securities Clearing Corporation Ltd. (NSCCL) provides DVP-1 based settlement for OTC trades in Corporate Bonds, Repo in Corporate Bonds, Commercial Papers (CP) and Certificate of Deposits (CD). The average daily settlement value at NSCCL for OTC trades in Corporate Bonds, Commercial Papers (CP), Certificate of Deposits (CD) and Securitized Debt (SD) during the financial year 2015-16 stands at ` 2,736.66 crores, ` 2,770.16 crores, ` 4,248.31 crores and ` 18.76 crores respectively. The highest settlement value, during this period, of ` 30,832.08 crores (across all corporate debt instruments) was recorded on March 31, 2016. During the financial year 2015-16, NSCCL settled 177 repo trades valuing ` 8378.30 crores as compared to 63 repo trades valuing ` 1998.60 crores settled in the previous year.
During the F.Y. 2015-16, NSCCL earned net profit after tax of ` 165.89 crores as compared to net profit after tax of ` 218.80 crores during the FY 2014-15. The Board of NSCCL has accordingly recommended a dividend of ̀ 35/- per equity shares to its shareholders in respect of FY 2015-16.
4.6.2. NSE Strategic Investment Corporation Limited
NSE Strategic Investment Corporation Limited (NSICL) was incorporated to, inter alia, make or hold all strategic investments in the equity shares and/or other securities of various companies. The paid up share capital of NSICL as on March 31, 2016 is ` 825.99 crore which is being 100% held by National Stock Exchange of India Limited (NSEIL). During the year under review, NSICL has promoted two businesses - Receivables Exchange of India Limited (RXIL) and NSE Education Facilities Limited (NEFL). During the year, the investment portfolio of the previous year continues to remain the same.

Twenty-Fourth Annual Report FY 2015-2016
27
During the F.Y. 2015-16, NSICL earned net profit after tax of ` 60.95 crores as compared to net profit after tax of ` 70.35 crores during the FY 2014-15. NSICL was formed with an intention to conserve resources for the group to invest in the capital of other companies in the group or outside. Hence, the Board of NSICL did not recommend any dividend to be paid in respect of 6% Non-cumulative Compulsorily Convertible Preference Shares and the equity shares.
4.6.3. India Index Services & Products Limited
India Index Services & Products Limited (IISL) continued to be the primary provider of indices and related products and services to various participants in the Capital Market in India, in its18th year of its operation.
The Nifty 50 Futures traded on National Stock Exchange (NSE) recorded a turnover of ` 2,966,314 crores in the financial year 2015-16 as compared to a turnover of ̀ 2,712,439 crores in the financial year 2014-15, thus registering an increase of 9.36%. Turnover of Nifty 50 Options traded on NSE increased to ` 42,782,302 crores in the financial year 2015-16 from ` 35,667,743 crores in the financial year 2014-15, registering an increase of 20%.
The Nifty 50 Futures traded on Singapore Exchange (SGX) recorded volume of 21.04 million contracts in the financial year 2015-16 as compared to a volume of 19.93 million contracts in the financial year 2014-15, thus registering an increase of 5.6%.
During the financial year 2015-16, IISL granted 21 licenses to domestic and international clients for launching exchange traded funds, active funds, index funds, structured products and exchange traded derivatives.
Other key developments:
1) During the year under review, IISL has widened the client base that uses IISL Indices and index data.
2) Singapore Exchange (SGX) launched the first offshore Indian sector futures linked to Nifty IT and Nifty CPSE Index. SGX also plans to launch index futures linked to Nifty Bank and Nifty Midcap 50 index in 2016.
3) IISL recognised as IOSCO compliant by Deloitte Haskins & Sells LLP. Compliance of Nifty indices with the IOSCO Principles demonstrates IISL’s commitment towards providing world class index solutions.
4) One AMC from Taiwan launched three ETFs linked to Nifty 50, Nifty50 PR 2x Leverage and Nifty50 PR 1x Inverse index which were listed on Taiwan Stock Exchange. With this launch, 43 ETFs (34 ETFs in India and 9 ETFs in international markets) linked to Nifty indices are traded across 19 stock exchanges (including NSE) globally.
5) IISL rebranded of all its existing indices to include Nifty in the names of all its indices. The rebranding of IISL indices was effective from November 09, 2015.
6) Currently, 17 index funds & 34 ETFs are linked to IISL’s indices in domestic market.
7) Nine ETFs on IISL indices are listed outside India (7 on Nifty 50, 1 on Nifty50 2x Leverage and 1 on Nifty50 1x inverse)
8) The corpus of index linked funds (including index linked funds managed by insurance companies)/ ETFs based on IISL’s indices as on March 31, 2016 is ` 20,627 crores as compared to ` 16,467 crores on 31 March 2015.

28
National Stock Exchange of India Limited
9) IISL organised NSE India ETF conference on a big scale. This was the first big ETF conference organised and most of the senior level industry experts attended the event. It will help in promoting ETF as an asset class for retail investors.
During the F.Y. 2015-16, IISL earned net profit after tax of ` 5,093.20 lakhs as compared to net profit after tax of ` 3429.11 lakhs during the FY 2014-15. The Board decided to conserve resources for the inorganic growth expansions being pursued by IISL and accordingly recommended a dividend of Re.1/- per equity shares to its shareholders in respect of FY 2015-16.
4.6.4 NSE Infotech Services Limited
INITIATIVES, OPERATIONS AND MAJOR EVENTS DURING THE YEAR
Technology is key differentiator and a strategic driver for NSE. As Strategic Technology partner NSETECH continues to deliver and maintain technology products and services for NSE.
TRANSFORMATION THROUGH NEW TECHNOLOGY
New CM Trading System: Higher throughput, lower latency and resilient trading platform are constant drivers for enhancing trading performance. CM trading system has moved to a new generation trading platform that provides high speed, high throughput trading for cash market using advanced technology to give world class performance. New trading system in cash market is rolled out in production. New system delivered Latency improvement of 98% in cash market.
Latency: Latency is of key importance in exchange business. Towards this multiple initiatives were undertaken to have better monitoring & control over NSE latency numbers and continuously reduce the transaction latency at NSE. This resulted in latency improvement of 39% at 99%ile in derivative segment. Low Latency Net was implemented in Cash Market to improve latency by 10x.
COLO Phase IV: NSE started Colocation facility for its members to address the need of Algo and HFT trading in the year 2010. NSE has built capacity of 113 full racks and 150 half racks in three phases. As these racks are almost 100% utilised, NSE decided to increase capacity to meet the future demand for colocation facility and extend opportunity to more members. NSE added 104 new racks (77 full racks, 54 half racks) in FY 2015-16 and these are available for member hosting. It is enabled with 10G connectivity and has additionally been enabled for providing PTP services to Members.
Index Rebranding: NSE has rebranded its indices from CNX to Nifty as Nifty has become a strong brand name amongst investors tracking Indian capital market. In total, 35 Indices were rebranded which involved changes in multiple systems such as Trading, Index and Clearing systems.
E-IPO: An Initial Public Offer (IPO) is the selling of securities to the public in the primary market. This paves way for listing and trading of the issuer’s securities. NSE transformed its existing system into a next generation web-based order capture platform. This new system provides user friendly functionalities for better user experience. EIPO system results in reduction of listing lead time from existing 12 working days to 6 working days after issue closes.
Algo Lab platform is launched for Cash and Derivatives segment. This platform provides additional service to members to back test their strategies on the trading system.
Surveillance: With the increase in the processing power of CM & FO trading systems, the need was felt to ramp up

Twenty-Fourth Annual Report FY 2015-2016
29
the surveillance system so that TAT remains the same. Capacity of Surveillance system was increased by making the architecture distributed. The new architecture allows NSE to further horizontally scale out to meet the increasing throughput of the trading system.
High Bandwidth Links at Last Miles: NSE used to provide 2 mbps links to its members from its POP located at nine locations across India. Due to increase in market activity and introduction of new features/products by NSE, 2 mbps link was becoming bottleneck and adding to maintenance cost. To overcome this, NSE launched High Bandwidth project under which members can subscribe to 4 mbps+ last mile links. First phase of Project is completed with Ghatkopar (Mumbai), Jeevanvihar (Delhi) and Salt lake (Kolkata) POPs.
Back up Modernisation: Old backup infrastructure was obsolete with technical and business constraints. NSE implemented a solution reducing the backup window from 12+ hrs. to 4 hrs.
Incremental Backups: Incremental backups were implemented on NAS which reduced backup time from 12+ hours to 40 minutes, a 96% improvement.
Market data products are launched on the new platform. 50% of products are migrated to the new platform.
Tick by Tick data was made available over multicast in CM segment so that the tick latency is same as order confirmation latency. The design provided for better resilience with minimal downtime for end clients.
NSE Electronic Application Processing System (NEAPS): As per SEBI (Listing Obligations and Disclosure Requirements) Regulations 2015 following modules have been updated in NEAPS:
• Corporate Governance: As per SEBI’s mandate, formats for Compliance Report on Corporate Governance have been made available on NEAPS.
• Share Holding Pattern: The holding of specified securities are divided into the following 3 categories viz. Promoter and Promoter Group, Public and Non Promoter Non Public.
• Financial Results: Banking, Non-banking and Alternative formats for Financial Result disclosures
• Investor grievance data, Share transfer agent and certificate with respect to share transfer disclosures by Registrar & Transfer Agents (RTAs) in NEAPS
GROWTH THROUGH NEW PRODUCTS AND SERVICES
Multicast Tick by Tick (MTBT): In Co-location, members can take TBT connectivity for the complete rack. The process is automated resulting in faster processing and reduction in paperwork. This module provides facility to Trading Members to put request for activation / de-activation of MTBT (Multicast Tick by tick) on Colocation racks.
Direct Net: Direct Net was deployed in CD, CM and FO. This would result in latency improvement of up to 30μsecs for members on account of removing the hop through TAP.
Journal layer was removed and redeployed separately in derivatives trading system to offload journal processes from Market layer.
Buyback of Securities: As per the SEBI circular dated April 13, 2015, guidelines were provided on mechanism for acquisition of shares through Stock Exchange pursuant to Tender-Offers under Takeovers, Buy Back and Delisting. The project was focused towards addressing the same.

30
National Stock Exchange of India Limited
Derivative segment:
• Self Trade prevention, IRF extension requirements in trading system
• Feature enhancement inGiveup Approval and Trade cancellation, Optimisation for listing message broadcast, Password change alert were delivered in trading system.
Cash Market:
• Features such as Kill switch and COL were introduced in the Cash market
• Order numbers capacity is increased in Cash market segment; Batch optimisations were introduced in the Cash market.
Other Markets: Other market trading system hardware was upgraded to FT 6308 from V400 resulting is saving high AMC cost.
NSE Member Opportunities and Relationship Enhancement (MORE): With the objective to reward trading members for maintaining high degree of governance standards, the NSE Member Opportunities and Relationship Enhancement (MORE) program has been launched on 31st Aug’15. NFA system has been upgraded to account rewards points earned by members during this program and redemption of these points in transaction section of NFA system.
Insider Trading Regulation- 7(2) and 7(3) on NEAPS: As per the new Regulation for Insider Trading, the entity listed with NSE will provide disclosure under Regulation7 if the trade value by a Promoter or Key Management Personnel reaches ` 10 Lakhs for a quarter. The facility to provide these disclosures in SEBI prescribed format has been implemented on NEAPS. The submissions will be authenticated by OTP and shall follow electronic approval workflow with provision of alerts in case of delay in disclosures.
Change in haircut for broad based ETF: ETFs, accepted as collateral, are identified as NMF. ETFs are being valued on previous day’s closing price after applying the haircut. The haircut applicable to the ETFs was Root 4 times VAR margin rate, subject to a minimum of 40%. Now the haircut applied to broad based ETFs are in line with the current category of Nifty Securities.
Change in method of valuation of corporate bonds: Earlier closing prices for valuation of corporate bonds used to be taken from debt segment. Now, collateral user provides the closing prices for corporate bonds and valuation of corporate bonds is done basis these closing prices.
Closure of Margin Transactions: NSE generates the margin transactions (1501,1502 & 1505) in CM,F&O and CD segments. In this, previously except 1501 transaction of Custodians, all transactions were not sent for banking. The suggested system change was done so that the Transactions were generated with close status to F&O (1502), CDS (1505) and Cash (1501 for Members). Moreover, these closed transactions will not be reflected in EPMG reports being sent to the bank.
Exchange-wide position limit monitoring for IRF: Previously, the exchange-wide position limit monitoring was done by business users. It was proposed to automate manual activities involved in the monitoring of EWPL for each underlying bond and develop a penalty module in-line with FO segment.
Membership: Billing of RACK & IP for Co-location: Automation of Colocation activity in Membership application facilitated generating the Billing data as required by F & A Dept. resulting in eliminating manual activities. The

Twenty-Fourth Annual Report FY 2015-2016
31
colocation module in the Membership Application keeps track of various activities such as rack & connectivity activation, surrender, message rate change and shifting.
OPERATIONS STRENGTHENING
Monitoring Dashboard using ITRS Geneos Tool: A real time dashboard of the Trading Ecosystem - comprising of hardware servers, network devices, middle wares, databases and the trading application (software) - is envisioned to depict real time view of the system health and prevent incidents. The project planned is to be implemented in 4 phases with each phase covering market segments FO, CD, CM and other system. Phase I is completed with FO Dashboards rolled out and people trained on it. Segment one view Dashboards for both CD and CM segments are delivered in November, 2015.
RISK, CONTROLS, COMPLIANCES & QUALITY
BCP 2.0: BCP 2.0 is focused on enhanced redundant capacity for sustained DR at DR site. It enables NSE to sustain running operations from DR for durations of more than 2 days and more (no upper limits). BCP external mock were successfully completed as per schedule and intraday switchover successfully tested with RTO of 3 hours 30 minutes and zero RPO. NSE successfully switched over to main site (Mumbai) from DR site (Chennai) overnight and subsequently third session is conducted from main site (Mumbai). With BCP 2.0, the exchange was able to demonstrate intraday switch over within 4 hours.
GRC (Governance Risk and Compliance): As per SEBI’s recent circular on Cyber security, a Cyber security and Cyber resiliency policy has been formulated and presented to the Board of NSE. Implementation of the same is in progress. Annual systems audit (SEBI) was completed by M/s Ernst & Young. International experts were engaged to benchmark NSE Security Operations Center (SOC) with Global best practices and develop a roadmap for maturing the SOC. Other Risk Management activities taken up during last year are summarised below-
• Build Secure initiative is being streamlined for incorporating information security inputs at build stage itself
• Business Process Review has been initiated to identify information security risks
• Business Impact Analysis Assessment from availability perspective has been initiated for various business functions
• Identity Access Management solution for governing user access to NSE critical systems is in the process of being deployed
A Third Party Audit was conducted from Information Security perspective by Israeli Auditors. Recommendations provided by them are being implemented. Out of 152 recommendations, 141(93%) have been closed. Remaining 11 open items are large pan-organisation initiatives and will be completed as separate projects.
Quality Control (QC): IQC Testing has been operationalised in FO, CD, CM segments for functional testing. Automated Regression testing is completed in 6 hours, resulting in significant productivity benefits also resulting in higher confidence in Quality. Reliability testing, batches, business utilities are under scope and testing readiness is available. Front end testing automation framework is ready and work in progress for CD segment to be followed by work in FO and CM segments. Mock participation extended to Direct net along with Normal TAP.
SDLC Process Improvement: The objective of program was to strengthen processes and practices in organisation that will lead to reduction in overall Cost of Quality. Project Management, Software Configuration Management

32
National Stock Exchange of India Limited
and Defect Prevention processes are rolled out. SDLC processes were revamped and socialised with SMEs. RCAmethodology has been standardised and drive initiated to conduct RCAs using standard methodology.
Tooling towards DevOps: Application Lifecycle Management tool is procured and rolled out toward DevOps roadmap and to enable Bi-Modal IT. The tool provides integrated view from Requirement to Release driving up developer productivity. The tool is rolled out for Tech teams and is being leveraged for purpose beyond initial scope.
During the F.Y. 2015-16, NSETECH earned net profit after tax of ` 1.09 crores as compared to net profit after tax of ` 0.86 crores during the FY 2014-15. As the profit is required to augment operational needs, the Board of NSETECH did not recommend any dividend to be paid in respect of the equity shares.
4.6.5 NSE.IT Limited
During the year 2015-16, NSE.IT achieved turnover of 148.48 crores (an increase of 19% over the previous year). During FY 2015-16, the operating profits of NSE.IT also grew by 72%.
NSE.IT continued to provide innovative solutions in the software space and the revenue grew by 19%. The TCoE business that was kick-started in this year saw some good tractions. The e-Assessments space has grown by 25% with the addition of some large and strategic accounts.
Traditionally NSEIT was positioned as a domain-driven, technology service provider offering services in India and the US market, with a focus in the BFSI space. One of the key developments during FY 2015-16 has been the re-positioning of NSE.IT’s offerings to focus on high-end niche areas. NSE.IT has thus identified six potential growth engines.
While in 2016-17 NSEIT will continue to pursue organic growth in each of the six identified SBUs, a focused and targeted search for inorganic avenues will be undertaken to move faster towards 10x growth mission.
During the financial year 2015-16, NSE.IT earned net profit after tax of ` 2,033.93 lakhs as compared to the net

Twenty-Fourth Annual Report FY 2015-2016
33
profit after tax of ` 1523.17 lakhs in the previous year. The Board of NSEIT has recommended a dividend of Re. 1/- per equity share to its shareholders in respect of the financial year 2015-16.
4.6.6 DotEx International Limited
4.6.6.1. Datafeed business
During the year, DotEx launched the following new products:
1) Corporate Bond Market Data: DotEx provides the data pertaining to corporate bond reported on the CBRICS platform on a real time basis. The data cover both the listed and unlisted OTC bonds and their pricing information.
2) 1 Min Snapshot Data for Currency Derivative segment: DotEx provides the data pertaining to Currency Derivative segment for 1 minute snapshot timeframe.
4.6.6.2 NOW (NEAT on Web) Platform
DotEx also provides a shared platform called NEAT on Web (NOW) which is a shared CTCL and risk management tool for the trading members.
During the year, DotEx started providing the following additional facilities through NOW platform:-
• MSEI CD segment has been offered by NOW exe & web platform
• Tapless connectivity in CD & FO segments
• BSE CDS paired & Straddle Option Contracts are offered in NOW trading platform
• Handling of Reverse Trade Prevention Check in BSE FO segment
• Handling of Self Trade Prevention Check in BSE & NSE segments
• Carry Forward bid facility for IS series in OFS. It’s an option to indicate whether user wants to Carry foward his bid for IS series to be provided in Order book
• Handling of spread orders in NOW EMS
• Additional role based action right “Enable Group Limit” introduced to set combined scrip group position limit for CDS – FUTIRC contracts on maturity basket level from Scrip Groups window
The above initiatives have resulted in NOW maintaining the user base and trading turnover through NOW platform during the financial year 2015-16.
DotEx continues to levy usage charges in respect of NOW terminals for accessing exchanges other than NSE on monthly basis.
4.6.6.3 Know Your Client (KYC) Registration Agency [KRA]
As on March 31, 2016, 935 SEBI intermediaries are registered with DotEx and around 12 lakh existing KYC records and 1.72 lakh new KYC records have been uploaded with DotEx KRA. Approximately 11.25 Lakh records consisting of both existing as well as new KYC have been processed.
DotEx KRA was awarded the project for Central KYC Registry initiated by Central Registry of Securitisation Asset Reconstruction and Security Interest of India (CERSAI). The project aims to consolidate and validate personal

34
National Stock Exchange of India Limited
identity data and generate Unique KYC ID for clients and make it available to the complete financial services industry.
A pilot of the software platform for the Central KYC Registry was successfully completed in January 2016 with participation from ten financial institutions. Basis the feedback from the pilot, the common template was finalised. Central KYC Registry Infrastructure and application is in readiness for go-live. CERSAI has advised all regulators for operationalisation of Central KYC Registry and a notification from regulators is awaited for going live.
During the year 2015-16, DotEx earned a profit of INR 3,360.07 lacs as compared to a profit of INR 2,825.33 lacs during 2014-15. The Board of DotEx has recommended a dividend of Re.1/- per equity share to its shareholders in respect of the financial year 2015-16.
4.6.7 NSE Educational Facilities Limited
NSE Educational Facilities Limited was incorporated on March 12, 2016 as a wholly owned subsidiary of NSE Strategic Investment Corporation Limited, with an authorised share capital of ` 3,00,00,000 (Rupees Three crore only) with the main object to set up, operate and carry on, inter alia, the business of imparting education, in India or abroad.
4.6.8 Other Associate and Joint Venture companies
Besides the above, National Securities Depository Limited and BFSI Sector Skill Council of India are associates of NSE. NSDL e-governance Infrastructure Limited, Computer Age Management Services Private Limited, Market Simplified India Limited and Power Exchange India Limited and Receivables Exchange of India Limited are associates of NSE Strategic Investment Corporation Limited (NSICL), a subsidiary of NSE. NSICL also has equity investments in Goods and Services Tax Network.
4.7 DEPOSITS
The Company has not invited, accepted or renewed any deposits within the meaning of Section 73 of the Companies Act, 2013. Accordingly, the requirement to furnish details relating to deposits covered under Chapter V of the Companies Act, 2013 does not arise.
4.8 RISK MANAGEMENT POLICY
The Company has an enterprise-wide risk assessment and review mechanism which inter alia consists of risk identification, assessment and categorisation of risks taking into account the impact and likelihood of risks and putting in place adequate controls and mitigation plans which has helped in reducing the overall risk exposure for the Company and also the impact thereof.
In this direction, the Company has a Risk Assessment & Review Committee, a sub-committee of the Board, which meets periodically to review the efficacy and adequacy of the Company’s risk management exercise and the controls and mitigation plans put in place to reduce the overall impact of the various inherent risks.
The Company has also appointed a management consultancy firm to assist in identifying, assessing and minimising the risk exposure of the Company. For each of the identified risk areas, the Company maintains detailed Risk Registers mainly containing details such as risk description, risk indicators, categorisation of the risk, current controls and mitigation plans, etc.

Twenty-Fourth Annual Report FY 2015-2016
35
4.9 MATERIAL CHANGES AND COMMITMENTS, IF ANY, AFFECTING FINANCIAL POSITION OF THE COMPANY WHICH HAVE OCCURRED BETWEEN THE END OF THE FINANCIAL YEAR OF THE COMPANY AND THE DATE OF THE REPORT
In accordance with Regulation 33 of Securities Contracts (Regulations) (SECC) Regulations, 2012 (The Regulations) issued on June 20, 2012, every recognised stock exchange is required to transfer 25% of its annual profits every year to a fund of the recognised clearing corporation(s) which clears and settles trades executed on that stock exchange to guarantee settlement of trades. SEBI, in its Press Release No.225/2015 dated September 1, 2015, stated that the report of the Committee on Clearing Corporations was placed before the SEBI Board on August 24, 2015 and that while the SEBI Board took note of the report, it approved the proposal to seek public comments on the recommendations of the Committee. Pending final notification based on the decision which was to be taken by SEBI after the public comments were received, NSE has made a provisional appropriation of ` 527.19 crores (net of ` 170 crores) transferred to Core SGF as at March 31, 2015, to be suitably adjusted in the light of the final SEBI notification in the matter.
SEBI has, in its Circular No. SEBI/HO/MRD/DRMNP/CIR/2016/54 dated May 04, 2016, since notified that the amounts carried forward in the Short Term provision in respect of the period upto March 31, 2015 have to be transferred by the Stock Exchange to the Core SGF maintained by the Clearing Corporation within one month of the date of issuance of the notification and that the amounts to be transferred by the Stock Exchange to the Core SGF maintained by the Clearing Corporation in respect of the period from April 01, 2015 till the date of amendment of the Regulation 33 of SECC Regulation, 2012 within such time as to be specified by SEBI.
Accordingly, the provisional appropriations made out of profits aggregating to ` 527.19 crores shown under the head Short Term Provision in the Balance Sheet as on March 31, 2015 have been reversed and a provision for an equivalent amount has been made during the year. Further a provision of ` 163.33 crores has also been made during the year for the period April 01, 2015 till March 31, 2016 (net of ` 71 crores transferred to Core SGF for the year).
4.10 DETAILS OF SIGNIFICANT AND MATERIAL ORDERS PASSED BY THE REGULATORS OR COURTS OR TRIBUNALS IMPACTING THE GOING CONCERN STATUS AND COMPANY’S OPERATIONS IN FUTURE
None
4.11 EXPLANATIONS OR COMMENTS ON THE QUALIFICATION, RESERVATION OR ADVERSE REMARK OR DISCLAIMER MADE BY THE AUDITOR IN HIS REPORT
There is no qualification, reservation or adverse remark or disclaimer made by the Statutory Auditors appointed under Section 139 and the Secretarial Auditors appointed under Section 204 of the Companies Act, 2013, in their reports. Hence the need for explanations or comments by the Board does not arise. The report of the Secretarial Auditors is attached herewith with as Annexure -2. The report of Statutory Auditors forms part of the financial statements.
4.12 SHARE CAPITAL
During the FY 2015-16, there is no change in the equity capital structure.

36
National Stock Exchange of India Limited
4.13 EXTRACT OF THE ANNUAL RETURN
The extracts of the annual return as on the financial year ended on March 31, 2016 in Form MGT-9 is attached herewith as Annexure-3 and shall form part of Board’s Report.
5. HUMAN RESOURCES
Following developments have taken place in Human Resources / Employee Relations front in the Financial Year 2015-16.
5.1 Talent Management and Development: During the Financial Year 2015-16, NSE has focused on the implementation of the Talent Management Study undertaken in the previous financial years. The training needs for each employee was based on the competency framework. In line with the Business Strategy, NSE has continued to focus on the functional and behavioral training based on the individual and the organisational need. Various cross functional learning initiatives such as Up the learning curve, NSE lecture series were conducted on a regular basis. Manning Study based on time and motion method was conducted to ascertain the level of manpower planning in the Company. Development center workshops were conducted to identify High Potential talent. Based on the development center report, Individual development plans (IDP’s) are created for the employees. Employee communication was facilitated based on the communication matrix. The emphasis was on the performance management system to drive desired performance and behavior. NSE has also implemented Job rotations as per the career path framework. NSE as an organisation believes in Training for all and development of High Potentials.
5.2 Employee Engagement Study / Perception Study: Based on the previous Employee Engagement study and action plan, HR team has implemented the initiatives to enhance the perception levels of the employees. HR team has also conducted various perception studies at regular intervals to gauge the employee perception levels and has taken various steps to maintain or improve the perception levels as per the market benchmark. NSE has also conducted an employee engagement study this financial year and the employee satisfaction levels have improved vis-à-vis the previous years. Some of the employee engagement activities conducted by NSE are Management approachability meetings (meetings of junior executives with the HOD’s of other departments), women mentoring program, Town hall & open house, Books to high performers, cake cutting to celebrate department achievement, Pat on the Back badges, NSE’s participation in Standard Chartered Mumbai marathon 2016, Zumba, Kick boxing, Indoor sports –“Kurukshetra”, Yoga classes, Guitar classes, employee appreciation corner, Women’s day celebration, employee assistance program, Talk to me initiative with the HR Head and various Staff welfare initiatives so as to build synergy among the various teams.
5.3 People soft: The Company is focusing on the People soft –ERP implementation in the entire gamut of Human resources management.
5.4 Employee Relations: The employee relations scenario has been harmonious throughout the period under consideration.
5.5 Employee Strength as on March 31st 2016 is 464
5.6 Disclosures under Sexual Harassment of Women at Workplace (Prevention, Prohibition & Redressal) Act, 2013
The disclosures required to be under Sexual Harassment of Women at Workplace (Prevention, Prohibition & Redressal) Act, 2013 are given in the following Table 17:-

Twenty-Fourth Annual Report FY 2015-2016
37
Table 17
1 Number of complaints of sexual harassment received in the year Nil
2 Number of complaints disposed off during the year Not applicable
3 Number of cases pending for more than 90 days Not applicable
4 Number of workshops or awareness programs against sexual harassment carried out
Awareness program for all employees was done
5 Nature of action taken by the employer Not applicable
6.1 DIRECTORS AND KEY MANAGERIAL PERSONNEL
As per the provisions of Securities Contracts Regulation (Stock Exchanges and Clearing Corporations) Regulations, 2012, the governing board of every recognised stock exchange shall include (a) public interest directors; (b) shareholder directors; and (c) Managing Director. Mr. Ashok Chawla (Chairman of the Board), Ms. Dharmishta Raval and Justice B.N. Srikrishna (Retd.) fall under ‘Public Interest Directors’ category. Mr. Abhay Havaldar, Mr. Prakash Parthasarathy and Mr. Ravi Narain fall under Shareholder Directors category. Ms. Chitra Ramkrishna is the Managing Director & CEO of the Company.
During the year, Mrs. Pratima Umarji, Mr. Y.H. Malegam, Mr. S. B. Mathur, Dr. K. R. S Murthy and Dr. S. Sadagopan ceased as Public Interest Directors. Ms. Dharmishta Raval and Mr. Ashok Chawla have become Public Interest Directors during the year. The Board in its meeting held on April 25, 2016 elected Mr. Ashok Chawla as Chairman of the Board which was approved by SEBI on May 3, 2016.
6.2 NUMBER OF MEETINGS OF THE BOARD OF DIRECTORS
The Board met five times during the year i.e. on May 26, 2015, August 11, 2015, November 02, 2015, February 08, 2016 and March 17, 2016.
6.3 DECLARATION BY INDEPENDENT DIRECTORS
As per SCR (SECC) Regulations, 2012, SEBI has power to nominate Public Interest Directors on the board of stock exchange. The number of PIDs shall not be lesser than number of shareholder directors. A Public Interest Director needs to be an independent director. PIDs have a fixed tenure and the approval of shareholders is not necessary. Pursuant to the same, SEBI has nominated Justice B N Srikrishna (Retd.), Mr. Ashok Chawla and Ms. Dharmishta Raval as PIDs who are as such construed to be Independent Directors under the Companies Act, 2013. They have also given declaration of independence before being nominated by SEBI.
Every Independent Director shall at the first meeting of the Board in every financial year or whenever there is a change in the circumstances which may affect his/her status as an independent director give a declaration that he/she meets the criteria of Independence. Accordingly, the above Independent Directors have given declarations of independence in the first meeting of the Board of NSEIL held on April 25, 2016.
6.4 COMPANY’S POLICY ON DIRECTORS’ APPOINTMENT AND REMUNERATION INCLUDING CRITERIA FOR DETERMINING QUALIFICATIONS, POSITIVE ATTRIBUTES & INDEPENDENCE OF DIRECTORS
Pursuant to requirements of the Companies Act, 2013, the Company has framed a policy on appointment of Directors and Senior Management personnel and a policy on remuneration of Directors and Key Management Persons identified under SCR (SECC) Regulations and under the Companies Act, 2013 and other employees and

38
National Stock Exchange of India Limited
the same are in force. The relevant extracts from the above policies are given in Annexure-4.
6.5 MANNER IN WHICH FORMAL ANNUAL EVALUATION OF PERFORMANCE BY THE BOARD OF ITS OWN PERFORMANCE AND THAT OF ITS COMMITTEES AND INDIVIDUAL DIRECTORS
The Board has put in place an Evaluation Policy vide which the Board evaluates its own performance, that of its Committees and of the individual directors.
I. The criteria for evaluation for each of the above are as follows:
(a) Performance evaluation of the Board
The performance of the Board of Directors is evaluated on the basis of various governance and business related parameters which include, inter-alia, Corporate Governance standards adopted by the Board and its implementation, understanding roles and responsibilities of Directors, commitment to highest ethical standards of integrity and probity, understanding of the objectives, values, vision and business of the Company, provision of entrepreneurial leadership, guidance to drive financial and business performance of the Company and periodic review of the same, ensuring necessary financial and human resource support to achieve Company’s objectives, etc.
(b) Performance evaluation of the Committees
In addition to the principles stated above for evaluation of Board, to the extent applicable to the respective committees, constructive recommendations made by the Committee(s) to the Board are also kept in mind while evaluating their performance.
(c) Performance evaluation of the Directors
The individual director’s performance has largely been evaluated based on his/her level of participation and contribution to the performance of Board/Committee(s) in respect of the above areas. Besides the same, the skills, knowledge, experience, attendance record, devotion of sufficient time and efficient discharge of responsibilities towards the Company, Board and Committees of which he/she is a member and timely disclosure of personal interest, compliance of Code of Conduct and Ethics, Code for Independent Directors etc., are also taken into account.
II. The following process has been adopted by the Company for performance evaluation:
(a) Independent Directors review the performance of the Chairperson, the Non-Independent Directors and the Board;
(b) The Nomination and Remuneration Committee (“NRC”) carries out the evaluation of every Director’s performance. The NRC, while doing so, also takes into account the inputs of review by Independent Directors;
(c) The Board evaluates its performance, its Committees and each Director and while doing so, takes into account the inputs received from the NRC and the review by Independent Directors.
The performance evaluation by Independent Directors, the NRC and the Board respectively, is carried out on the basis of criteria laid down in the Board Evaluation Policy, which, inter-alia, includes the above mentioned parameters.

Twenty-Fourth Annual Report FY 2015-2016
39
6.6 DIRECTORS’ RESPONSIBILITY STATEMENT
Your Directors confirm that -
(i) in the preparation of the annual accounts, the applicable accounting standards had been followed along with proper explanation relating to material departures, if any;
(ii) the Directors had selected such accounting policies and applied them consistently and made judgments and estimates that are reasonable and prudent so as to give a true and fair view of the state of affairs of NSEIL at the end of the financial year i.e., 31st March, 2016 and of the profits of NSEIL for that year;
(iii) the Directors had taken proper and sufficient care for the maintenance of adequate accounting records in accordance with the provisions of the Companies Act, 2013 for safeguarding the assets of NSEIL and for preventing and detecting fraud and other irregularities ;
(iv) the Directors had prepared the annual accounts on a going concern basis;
(v) the Directors had laid down internal financial controls to be followed by the Company and that such internal financial controls are adequate and were operating effectively; and
(vi) the Directors had devised proper systems to ensure compliance with the provisions of all applicable laws and such systems are adequate and were operating effectively
7. CORPORATE SOCIAL RESPONSIBILITY
NSE is covered under the purview of Section 135 of the Companies Act 2013. Similarly many of its subsidiaries are also covered. However, contribution to CSR by some of these Companies as required under the Section 135 will be negligible. Moreover, there could be duplication of efforts if each individual Company undertakes CSR activities on its own and there would be difficulties in scaling up these activities. Therefore, it has been decided by the Boards of the respective Companies in NSE Group that CSR efforts for the Group be undertaken commonly and the actual amount spent be allocated to the respective Companies in proportion to their legal obligations. Therefore, a common CSR function for NSE and its subsidiaries has been created under NSE as a group resource and the actual CSR amount spent is proportionately allocated to the respective Companies. However, the CSR Committees for these Companies are separate. A common CSR policy has been prepared and approved by respective CSR Committees and Boards. The disclosures required to be made in the Board’s Report as per Rule 9 of Companies (Corporate Social Responsibility Policy) Rules, 2014 is attached herewith as Annexure-5
8. CORPORATE GOVERNANCE
The Company is committed to maintain the highest standards of corporate governance and adhere to the corporate governance requirements.
NSEIL is a public limited company, whose securities are not listed on any of the stock exchanges. As per Regulation 35 of the Securities Contracts (Regulation) (Stock Exchanges and Clearing Corporations) Regulations, 2012, the disclosure requirements and corporate governance norms as specified for listed companies are mutatis mutandis applicable to a recognised stock exchange. NSEIL has always been involved in good governance practices and endeavors continuously to improve upon the same. A report on corporate governance for the financial year 2015-16 is furnished as part of the Annual Report for the information of all its stakeholders as Annexure-6. The certificate from a Practicing Company Secretary confirming compliance with the conditions of Corporate Governance as

40
National Stock Exchange of India Limited
stipulated under Schedule V of SEBI (Listing Obligations & Disclosure Requirements) is also attached with the above report.
9. AUDIT COMMITTEE
The Audit Committee currently comprises three Directors viz., Mr. Ashok Chawla, Ms. Dharmishta Raval and Mr. Ravi Narain as its members. Mr. Ashok Chawla is the Chairman of the Audit Committee. Consequent upon completion of term(s) of Mr. Y.H Malegam and Dr. S. Sadagopan as Public Interest Directors, they ceased to be members of the Audit Committee with effect from March 28, 2016. Mr. Ashok Chawla and Ms. Dharmishta Raval were inducted as members of the Audit Committee with effect from April 25, 2016. The Committee met four times during the year i.e., on May 26, 2015, August 11, 2015, November 2, 2015 and February 02, 2016. The details of the attendance of members of the Audit Committee at their meetings held on the above dates are given hereunder:-
Table 18
Name Number of meetings held during the year
Number of meetings attended
Mr. Y. H. Malegam* 4 4
Mr. Ravi Narain 4 4
Dr. S. Sadagopan* 4 4
*ceased as members w.e.f. March 28, 2016
10. STAKEHOLDERS RELATIONSHIP COMMITTEE
The Stakeholders Relationship Committee currently comprises Mr. Ashok Chawla, Mr. Ravi Narain and Ms. Chitra Ramkrishna. Mr. Ashok Chawla is the Chairman of the Committee. Consequent upon completion of term(s) of Mr. Y.H Malegam and Mr. S. B. Mathur as Public Interest Directors, they ceased to be members of the Stakeholders Relationship Committee with effect from March 28, 2016.
The Committee met five times during the year, i.e. on September 10, 2015, November 23, 2015, December 14, 2015, February 02, 2016 and March 17, 2016. The details of the attendance of members of the SRC at their meetings held on above dates are given hereunder:-
Table 19
Name Number of meetings held during the year
Number of meetings attended
Mr. Y.H. Malegam* 5 5
Mr. S.B. Mathur* 5 5
Mr. Ravi Narain 5 5
Ms. Chitra Ramkrishna 5 5
*ceased as members w.e.f. March 28, 2016
11. NOMINATION& REMUNERATION COMMITTEE
The Nomination & Remuneration Committee (NRC) currently comprises Mr. Justice B. N. Srikrishna (Retd.), Mr. Ashok Chawla and Mr. Ravi Narain as its members with Mr. Justice B. N Srikrishna (Retd.) as its Chairman. NRC

Twenty-Fourth Annual Report FY 2015-2016
41
is constituted for the purpose of discharging its functions required under both Companies Act, 2013 and under SEBI requirements. Mr. Y.H. Malegam, Mr. S.B. Mathur, Dr. K R S Murthy and Mrs. Pratima Umarji ceased to be its members on account of expiry of their respective terms as Public Interest Directors. The Committee met six times during the year, i.e. on April 1 & 8, 2015, May 26, 2015, November 2, 2015, February 2, 2016, February 23, 2016 and March 17, 2016. The details of the attendance of members of the NRC at their meetings held on above dates are given hereunder:-
Table 20
Name Number of meetings held during the year
Number of meetings attended
Mr. Y.H. Malegam 6 6
Mr. S.B. Mathur 6 6
Mr. Ravi Narain 6 6
Dr. K.R.S. Murthy 6 5
Mrs. Pratima Umarji* 2 2
* Ceased as members w.e.f. August 11, 2015
12. MANAGEMENT DISCUSSION AND ANALYSIS REPORT
Management’s Discussion and Analysis Report in respect of NSE's standalone financials for the year ended March 31, 2016 is presented in a separate section forming part of the Annual Report.
13. VIGIL MECHANISM
National Stock Exchange of India Limited (“NSEIL” or “the Company”) has, in continuation of its pursuit to establish good corporate governance practice, formulated ‘Whistle Blower Policy’ and the policy is in force since December 2010. The Policy, as on date, provides mechanism to the Directors and employees of the Company for reporting instances of unethical conduct, actual or suspected fraud or violation of the Company’s Code of conduct or Ethics policy or law to the Chairman of Audit Committee (cases of financial nature) / Ethics Committee (other cases) or the Ethics Counselor, as the case may be. Protected Disclosures should preferably be reported in writing as soon as possible after the whistle blower becomes aware of the same.
All Protected Disclosures reported under the Policy will be thoroughly investigated by the Ethics Counselor or Chairman of the Audit Committee/Ethics Committee or a suitable competent person of their choice, as the case may be, of the Company. No unfair treatment will be meted out to a Whistle Blower by virtue of his/her having reported a Protected Disclosure. Complete protection will be given to whistle-blowers against any unfair practice.
If the findings of investigator(s) conclude commission of an unethical and improper act, disciplinary action or any other action, as deemed appropriate, will be initiated against the person concerned.
A report will be submitted to the Chairman of the Ethics Committee/Audit committee on a regular basis about receipt of Protected Disclosures, the results of investigations and the action initiated with regard to the same.As per the requirement of SEBI (Listing Obligations & disclosure Requirements) Regulations, 2015 details of Vigil Mechanism is provided in the Website of the company at https://nseindia.com/global/content/about_us/NSE_dtls_VM.pdf

42
National Stock Exchange of India Limited
14. AUDITORS
Currently, M/s. Khandelwal Jain & Co., Chartered Accountants, are Statutory Auditors of the Company and they were re-appointed for a period of two years from the conclusion of 23rd Annual General Meeting till the conclusion of 25th Annual General Meeting and their term will accordingly expire at the 25th Annual General Meeting of the Company. However, as per the requirement of section 139 (1) of the Companies Act, 2013, their appointment is subject to ratification at the forthcoming Annual General Meeting by the members. The Company has received a certificate from the Auditors stating that they are fulfilling the conditions prescribed in the Companies Act, 2013 and the Rules laid down thereunder and they are eligible to be appointed as Auditors under the Companies Act, 2013.
The Board recommends ratification of appointment of M/s. Khandelwal Jain & Co., Chartered Accountants, as Auditors of the Company by the members at the forthcoming Annual General Meeting.
15. CONSERVATION OF ENERGY, TECHNOLOGY ABSORPTION AND FOREIGN EXCHANGE EARNINGS / OUTGO
a. Conservation of Energy and Technology Absorption
The disclosure of particulars with respect to conservation of energy and technology absorption in terms of Section 134(3)(m) of the Companies Act, 2013 read with Rule 8 of Companies (Accounts) Rules, 2014 are given hereunder:-
NSE has undertaken to use the following major technological initiatives towards ‘‘Effective Energy Conservation’’ as well as ‘‘Load Management System’’ namely:
i. Constructed a ‘Tier-IV compatible Co-location-IV Data Centre to ensure that the ‘Power Utilisation Effectiveness’ (PUE) of new Data Centre does notexceed the benchmarked PUE.
PUE is the ratio of total power supplied to Data Centre to total IT Power. Average PUE of any healthy Data Centre is ≤ 1.7 and the same has been targeted while designing and commissioning of infrastructure for aforesaid new Data Centre.
ii. Reduction of carbon emission
The Carbon footprint refers to a whole set of greenhouse gas emissions on account of an organisation, event, product or individual. These footprints are measured in Tons (or Kilograms) of carbon dioxide equivalent. It is a measure of impact of our activities on environment, or in particular, climate change. NSE’s carbon footprint of Exchange Plaza building was around 22,712 Tonnage of CO
2 (i.e. 0.068 tonnage
CO2/Sqft/year (including Data Centre). However, with effective energy saving / green power measures, NSEIL has reduced it to 9,982 tonnes of CO
2 emission.
iii. Under the ‘Renewable Power Scheme’, NSEIL has started getting set-off facility towards its Green Power generation through 6.25 MW of Wind Power Project at Satara in Maharashtra
NSEIL has commissioned the 6.25 MW (i.e. 5 nos. of 1.25 MW) Wind Power Project Plant at Satara. In Wind Power Project, the Wind Electric Generator (WEG) converts the Kinetic Energy available in the Wind to Electrical Energy by using a Rotor, Gearbox and Generator. With regard to the operation of Wind Power Plant, it mainly goes hand-in-hand with the Local Electricity Board. The Plant is generally connected to the

Twenty-Fourth Annual Report FY 2015-2016
43
Main Power Grid of the Local Electricity Board. As per renewable energy policy of Govt. of Maharashtra, the quantum of electricity generated through the Wind Farm is fed to the grid, which gets set off against the power consumption towards High Tension (HT) installation of the ‘Wind farmer’(which in this case is NSEIL) anywhere in that grid.
Accordingly, the aforesaid NSEIL’s Wind Power Plant has generated around 1.0 crore electricity units in the last year.
iv. Active participation in ‘Thermal Energy Storage Programme’ being conducted by M/s. Tata Power Co. (TPC).
Effective load management is being conducted by State Power Utilities (i.e. TPC) (i.e. for reduction in demand load at grid level during peak hours and effective utilisation of surplus power at lean/night hours). In this mission, NSEIL had actively participated in ‘Thermal Energy Storage Incentive Programme’.
v. As an alternative to the conventional Heating Ventilation and Air Conditioning System (HVAC), NSEIL has the ‘Thermal Energy Storage’ for air-conditioning system during the peak hours
Thermal Energy Storage System’ has been introduced in the HVAC System at Exchange Plaza. It was observed that most of the Services (i.e. HVAC Chillers, AHU’s, Lifts, Lighting, PC, Plumbing System etc.) were operated mainly during office / day hours. Amongst them, the Chillers and its associated equipments used to consume more than 30% of total peak demand load. In view of this, NSEIL had decided to reduce its demand load during peak hours and to achieve this, NSEIL installed the ‘Thermal Energy Storage System’ with the existing HVAC system. In this system, the Chillers are being operated at night hours to form the “Chill” (i.e. Glycol Water at temperature below zero degree centigrade) which gets stored in a Thermal Storage Tank. Following next day the stored Chill is being utilised through Heat Exchangers for air-conditioning the entire Office area. On account of this, the total load (i.e. HVAC-Chillers, AHU’s Lifts, Lighting, PC, Plumbing System etc.) which were operating mainly during office hours have been distributed and NSEIL has surrendered the extra power. This way, NSEIL has saved around 13746 Demand KVA in the last year.
vi. Revamped the ‘Building Management System’ for effective and efficient operations of the Services especially the Air Handling Units (AHUs).
The Building Management System (BMS) had been installed at the inception stage itself to enable the Company to operate the Building’s Services more effectively. For example, with the above BMS, the Air Handling Units (AHU) of air-conditioning system are being operated (i.e. switching ON /OFF) as per the exact time table scheduled for respective floors. It also helps the Company to regulate / control the temperature of the work stations area well within prescribed tolerance. With this effective operation and regulation of AHU’s, electricity is being conserved on day-to-day basis.
vii. NSEIL has Motion/Occupancy Sensors installed in the lighting systems in the General Staff areas
NSEIL has installed Motion/Occupancy Sensors at Workstation area as well as in Meeting Rooms. By implementing this, the lights are operated based on the Motion /Occupancy in the area.
viii. NSEIL has ‘Lighting Transformers’ for regulated voltage of Lighting System
Lighting Transformers have been installed in the lighting feeders. There are various light fittings installed

44
National Stock Exchange of India Limited
at Exchange Plaza. It may be noted that luminaries of any light fitting work more effectively and efficiently on receiving the power supply in the range of 210 to 220 Volts. Whereas in India the single phase supply voltage is 230Volts for residential zone and 240 Volts in commercial zone. The light fittings installed at Exchange Plaza are working on single phase power supply and the voltage between phases and neutral is recorded in the range of 236 to 240 Volts. It was observed that due to excess voltage, the luminaries of light fittings are consuming more power than its rating and also excessive voltage is reducing the life of the luminaries. To prevent such excess power consumption and to enhance the life of the luminaries, the Company has introduced aforesaid Lighting Transformers in the Electrical Distribution System to regulate the incoming single phase supply which restricts the power supply to only 210 to 220Volts. This way NSEIL has saved around 38015 units in the last year.
ix. ‘Electronic Ballast and Compact Fluorescent Lamps’ are used in Lighting System.
Most of the Lighting Fixtures have been installed with Electronic Ballast instead of conventional Chokes. This helps the Company to reduce the inductive load of the building in turn saving of electricity. Additionally, CFLs have been used in passages and lobbies in place of Incandescent Lamps to reduce the power consumption.
x. NSEIL has ‘Automatic Power Factor Control Units’(APFC) to step up power factor of the building.
The said APFC Units are hooked up with Main LT Panel of the building to improve the power factor (i.e. by counter balancing the inductive load of the building with capacitive load) of the entire electrical load of the Building. Power Supplier gives incentives i.e. by passing certain discount in the electricity bill on account of this regularly.
xi. NSEIL has ‘Solar Power Plant’ to cater to the part of lighting load at Exchange Plaza
The Solar Power Plant of the capacity of 10 KW has been installed in the building which harnesses the Solar Power to cater the part of lighting load at Exchange Plaza. This way NSEIL has saved around 4473 units in the last year.
xii. NSEIL has ‘Rain Water Harvesting System’ to harvest the rain water in the periphery of Exchange Plaza
Envisaging water scarcity in future as well as present water shortages, a proper Hydro - Geological survey was conducted at Exchange Plaza to explore the possibility of harvesting the rain water in the periphery of Exchange Plaza. Accordingly, post survey and feasibility, Rain Water Harvesting System has been installed. By using this System, water gets percolated into the soil in the Exchange Plaza campus.
xiii. NSEIL has the ‘Vermiculture Plant’ installed wherein compostable material likefood waste collected from canteen, paper & cardboard are collected and post processing in the Vermiculture Unit, the manure is generated which is usedfor Gardening purposes.
In this Vermiculture system, the compostable material like food waste collected from Canteen, Garden Organics and Paper & Cardboard gets collected at one place. Post shredding, the organic material gets loaded into Vermiculture Unit for decomposing process. Post 7 days of on-going process, Vermicompost / manure get generated and is used for Gardening purposes. This way NSEIL has generated around 2000 Kg of manure in last year by recycling food waste collected from Canteen, Garden Organics and Paper & Cardboard.

Twenty-Fourth Annual Report FY 2015-2016
45
xiv. NSEIL has the ‘Sewerage Treatment Plant’ to reuse building’s domestic and flushing water (i.e. after treatment) for its Cooling Towers associated with HVAC System and for Gardening purposes every day.
This plant has been installed at the inception stage itself to enable the Company to reuse building’s domestic and flushing water (i.e. after treatment) for its Cooling Towers associated with HVAC System and for Gardening purposes every day. This way NSEIL has saved around 20137 Kltr. of Water in the last year.
b. Foreign Exchange earnings/outgo during the year under review
Foreign exchange earnings during the year amounted to ` 0.98 crores. Foreign exchange outgo during the year was ` 27.45 crores.
16. PARTICULARS OF EMPLOYEES
A Statement of Particulars of Employees covered under the provisions of Rule 5 (2) & (3) of Companies (Appointment and Remuneration of Managerial Personnel) Rules, 2014 is enclosed herewith as Annexure-7.
17. ACKNOWLEDGMENT
Your Directors are grateful for the support and co-operation extended by the Government of India, Securities and Exchange Board of India and Reserve Bank of India. Your Directors would like to place on record their sincere appreciation of support provided by the shareholders and also their deep appreciation of the contribution made by the employees at all levels to the continued growth of the Company.
For and on behalf of the Board of Directors
Place: Mumbai Ashok Chawla Date: May 12, 2016 Chairman

46
National Stock Exchange of India Limited
ANNEXURE 1 TO BOARD’S REPORT Form No. AOC-2
(Pursuant to clause (h) of sub-section (3) of section 134 of the Act and Rule 8(2) of the Companies (Accounts) Rules, 2014)
Form for disclosure of particulars of contracts/arrangements entered into by the Company with related parties referred to in sub-section (1) of Section 188 of the Companies Act, 2013 including certain arm’s length transactions under third proviso thereto
1. Details of contracts or arrangements or transactions not at arm’s length basis:
Nil
(a) Name(s) of the related party and nature of relationship: N.A.
(b) Nature of contracts/arrangements/transactions : N.A.
(c) Duration of the contracts / arrangements/transactions: N.A.
(d) Salient terms of the contracts or arrangements or transactions including the value, if any: N.A.
(e) Justification for entering into such contracts or arrangements or transactions: N.A.
(f) date(s) of approval by the Board: N.A.
(g) Amount paid as advances, if any: N.A.
(h) Date on which the special resolution was passed in general meeting as required under first proviso to section 188 : N.A.
2. Details of material contracts or arrangement or transactions at arm’s length basis
(a) Name(s) of the related party and nature of relationship Please see Annexure to AOC -2
(b) Nature of contracts/arrangements/transactions Please see Annexure to AOC -2
(c) Duration of the contracts / arrangements/transactions Please see Annexure to AOC -2
(d) Salient terms of the contracts or arrangements or transactions including the value, if anyPlease see Annexure to AOC -2
(e) Date(s) of approval by the Board, if any Approved by the Audit Committee on May 26, 2015 as all transactions are in the ordinary course of business
and at arm’s length basis.
(f) Amount paid as advances, if any Nil
For and on behalf of the Board of Directors
Place: Mumbai Ashok ChawlaDate: May 12, 2016 Chairman

Twenty-Fourth Annual Report FY 2015-2016
47
ANNEXURE TO AOC-2(a) Names of the related parties and nature of relationship
Sr. Related Party Nature of Relationship
1 National Securities Clearing Corporation Limited Subsidiary Company
2 NSE Strategic Investment Corporation Limited Subsidiary Company
3 NSE.IT Limited Subsidiary's Subsidiary Company
4 DotEx International Limited Subsidiary's Subsidiary Company
5 India Index Services & Products Limited Subsidiary's Subsidiary Company
6 NSE Infotech Services Limited Subsidiary's Subsidiary Company
7 NSE.IT (US) Inc. Subsidiary's Subsidiary's Subsidiary Company
8 NSE Educational Facilities Limited Subsidiary's Subsidiary Company (w.e.f. 12.03.2016)
9 National Securities Depository Limited (new) Associate Company
10 BFSI Sector Skill Council of India Associate Company
11 Power Exchange India Limited Subsidiary's Associate
12 NSDL e-Governance Infrastructure Limited (formerly known as National Securities Depository Limited)
Subsidiary's Associate
13 Market Simplifi ed India Limited (formerly known as INXS Technologies Limited)
Subsidiary's Associate
14 Computer Age Management Services Private Limited Subsidiary's Associate
15 Receivables Exchange Of India Limited Subsidiary’s Joint Venture(w.e.f 25.02.2016)
16 Ms. Chitra Ramkrishna - Managing Director & CEO Key Management Personnel

48
National Stock Exchange of India Limited
Details of transactions (including service tax wherever levied) with related parties are as follows :
(in Crores)
Name of the Related Party
Nature of Transactions Year ended 31.03.2016
Year ended 31.03.2015
National Securities Clearing Corporation Ltd.
Usage charges received 16.25 13.43
Space and Infrastructure usage charges received 4.23 3.97
Reimbursement received for expenses on staff on deputation
12.05 12.89
Reimbursement received for other expenses incurred 41.19 33.85
Dividend received 146.25 112.50
Clearing and Settlement charges paid 112 .04 102.45
Contribution to NSCCL Core SGF 761.52 170.00
Purchase of Investment 0.93 -
Closing balance (Credit)/Debit (657.21) 24.65
Investment in Equity Share Capital 5.64 5.64
NSE.IT Ltd. Reimbursement received for other expenses incurred 0.04 0.67
Software Development Charges paid 1.68 1.19
Software Expenses 0.00 0.83
Repairs and maintenance – Computer trading, Telecommunication systems
34.26 34.12
STP charges received 0.04 0.01
NCFM Test expenses paid 7.28 6.52
CTCL Empanelment charges received 0.09 0.11
IT Mgt. & Consultancy charges paid 5.38 4.08
Installation commissioning & warranty charges for trading
- 0.35
Closing balance (Credit)/Debit (4.83) (1.05)
DotEx International Ltd.
Space and Infrastructure usage charges received 0.85 0.74
Reimbursement received for expenses on staff on deputation
2.35 2.07
Reimbursement for expenses incurred 4.40 2.03
CTCL Empanelment charges received 0.06 0.06
Amount received towards revenue sharing on account of info feed services
17.25 13.47
Web trading related expenses 19.51 19.07
Closing balance (Credit)/Debit 0.15 (0.89)

Twenty-Fourth Annual Report FY 2015-2016
49
(in Crores)
Name of the Related Party
Nature of Transactions Year ended 31.03.2016
Year ended 31.03.2015
India Index Services & Products Ltd.
License fees paid 11.46 8.95
Usage Charges received 0.84 0.84
Space and Infrastructure usage charges received 0.56 0.50
Reimbursement received for expenses on staff on deputation 1.87 1.44
Reimbursement received for other expenses incurred 7.85 1.19
Closing balance (Credit)/Debit (0.08) 0.23
Receivables Exchange Of India Limited
Recoverable towards software development charges paid 0.15 -
Interest recoverable 0.001 -
Closing balance (Credit)/Debit 0.15 -
NSE Infotech Services Ltd.
IT Mgt. & Consultancy charges paid 26.52 25.65
Repairs and maintenance – Computer trading , Telecommunication systems
17.91 19.12
Rent received 0.45 0.22
Reimbursement received for expenses incurred 13.77 12.44
Closing balance (Credit)/Debit (7.23) 0.21
NSE Strategic Investment Corporation Limited
Space and Infrastructure usage charges received 0.20 -
Reimbursement received for expenses on staff on deputation
1.53 -
Reimbursement received for expenses incurred 2.86 0.06
Closing balance (Credit)/Debit 1.14 -
Investment in Preference Share Capital 412.97 412.56
Investment in Equity Share Capital 413.13 412.61
Power Exchange India Ltd.
Investment in equity shares - -
Reimbursement received for other expenses incurred - 1.15
Closing balance (Credit)/Debit - -
(in Crores)

50
National Stock Exchange of India Limited
Name of the Related Party
Nature of Transactions Year ended 31.03.2016
Year ended 31.03.2015
NSDL e-Governance Infrastructure Limited (formerly known as National Securities Depository Limited)
Dividend received - -
Miscellaneous Expenditure - -
Closing balance (Credit)/Debit - -
National Securities Depository Limited (new)
Dividend received 2.50 2.50
STP Charges 0.00 0.00
Miscellaneous Expenditure 0.00 -
Closing balance (Credit)/Debit 0.01 0.01
Investment in Equity Share Capital 61.49 61.49
BFSI Sector Skill Council of India
Amount paid towards PMKVY centres 0.09 -
Investment in Equity Share Capital 1.00 1.00
Closing balance (Credit)/Debit - -
Computer Age Management Services Private Limited
Reimbursement paid for expenses incurred - -
Amount paid towards Rent 0.11 -
Reimbursement received for expenses incurred - -
Closing balance (Credit)/Debit - -
Market Simplifi ed India Limited
Consultancy Charges paid for software development 1.88 1.78
Closing balance (Credit)/Debit - -
Key Management Personnel
Gross remuneration including allowances, non-cash perquisites and contribution to Provident Fund and Superannuation Fund etc.
9.12* 7.45*
*includes 50% of the variable pay payable after 3 years subject to certain conditions

Twenty-Fourth Annual Report FY 2015-2016
51
S.N.ANANTHASUBRAMANIAN & CO.COMPANY SECRETARIES10/26, Brindaban, Thane 400 601 | Tel 2534 5648 / 2543 2704 | Fax 2539 0292 | Email [email protected] I Website www.snaco.net
ANNEXURE 2 TO BOARD'S REPORT
To,The Members,National Stock Exchange of India Limited U67120MH1992PLC069769Exchange Plaza, C-1, Block G, Bandra Kurla Complex, Bandra (E)Mumbai - 400051
Our Secretarial Audit Report of even date is to be read along with this letter.
Management's Responsibility
1. It is the responsibility of the management of the Company to maintain secretarial records, devise proper systems to ensure compliance with the provisions of all applicable laws and regulations and to ensure that the systems are adequate and operate effectively.
Auditor's Responsibility
2. Our responsibility is to express an opinion on these secretarial records, standards and procedures followed by the Company with respect to secretarial compliances.
3. We believe that audit evidence and information obtained from the Company's management is adequate and appropriate for us to provide a basis for our opinion.
4. Wherever required, we have obtained the management's representation about the compliance of laws, rules and regulations and happening of events etc.
Disclaimer
5. The Secretarial Audit Report is neither an assurance as to the future viability of the Company nor of the efficacy or effectiveness with which the management has conducted the affairs of the Company.
For S N ANANTHASUBRAMANIAN & COCompany SecretariesFirm Registration No. P1991MH040400
S N AnanthasubramanianPartnerCOP No. 1774
Date : 10th May 2016Place: Thane

52
National Stock Exchange of India Limited
S.N.ANANTHASUBRAMANIAN & CO.COMPANY SECRETARIES10/26, Brindaban, Thane 400 601 | Tel 2534 5648 / 2543 2704 | Fax 2539 0292 | Email [email protected] I Website www.snaco.net
Form No. MR-3 SECRETARIAL AUDIT REPORT
FOR THE FINANCIAL YEAR ENDED 31st March, 2016 [Pursuant to section 204(1) of the Companies Act, 2013 and rule No.9 of the Companies
(Appointment and Remuneration of Managerial Personnel) Rules, 2014]To,The Members,National Stock Exchange of India Limited CIN: U67120MH1992PLC069769Exchange Plaza, C-1, Block G, Bandra Kurla Complex, Bandra (E), Mumbai-400051.
We have conducted the Secretarial Audit of the compliance with applicable statutory provisions and the adherence to good corporate practices by National Stock Exchange of India Limited (hereinafter called the Company). Secretarial Audit was conducted in a manner that provided us a reasonable basis for evaluating the corporate conducts/statutory compliances and expressing our opinion thereon.
Based on our verifi cation of the Company’s books, papers, minute books, forms and returns fi led and other records maintained by the Company and also the information provided by the Company, its offi cers, agents and authorised representatives during the conduct of Secretarial Audit, we hereby report that in our opinion, the Company has, during audit period covering the fi nancial year ended 31st March 2016, complied with the statutory provisions listed hereunder and also that the Company has proper Board processes and compliance mechanism in place to the extent, in the manner and subject to the reporting made hereinafter:
We have examined the books, papers, minute books, forms and returns fi led and other records maintained by the Company for the year ended 31st March, 2016 according to the provisions of:
(i) The Companies Act, 2013 (the Act) and the rules made thereunder; applicable provisions of the Companies Act, 1956;
(ii) The Securities Contracts (Regulation) Act, 1956 (‘SCRA’) and the rules made thereunder;
(iii) The Depositories Act, 1996 and the Regulations and Bye-laws framed thereunder;
(iv) Foreign Exchange Management Act, 1999 and the rules and regulations made thereunder to the extent of Foreign Direct Investment, Overseas Direct Investment and External Commercial Borrowings;
(v) The following Regulations and Guidelines prescribed under the Securities and Exchange Board of India Act, 1992 (‘SEBI Act’):

Twenty-Fourth Annual Report FY 2015-2016
53
a. The Securities and Exchange Board of India (Substantial Acquisition of Shares and Takeovers) Regulations, 2011- Not applicable as the securities of the Company are not listed with any Stock Exchange;
b. The Securities and Exchange Board of India (Prohibition of Insider Trading) Regulations, 1992 (upto 14th May 2015) / Securities and Exchange Board of India (Prohibition of Insider Trading) Regulations, 2015 (eff ective 15th May 2015);
c. The Securities and Exchange Board of India (Issue of Capital and Disclosure Requirements) Regulations, 2009- Not applicable as the Company has not issued any shares to the Public during the fi nancial year under review;
d. Securities And Exchange Board Of India (Share Based Employee Benefi ts) Regulations, 2014- Not applicable as the Company has not issued any share based employee benefi ts during the fi nancial year under review ;
e. The Securities and Exchange Board of India (Issue and Listing of Debt Securities) Regulations, 2008- Not applicable as the Company has not issued any Debt securities which are listed during the fi nancial year under review ;
f. The Securities and Exchange Board of India (Registrars to an Issue and Share Transfer Agents) Regulations, 1993 regarding the Companies Act and dealing with client - Not applicable as the Company is not registered as Registrar to Issue and Share Transfer Agent during the fi nancial year under review;
g. The Securities and Exchange Board of India (Delisting of Equity Shares) Regulations, 2009 - Not applicable as the securities of the Company are not listed with any Stock Exchange; and
h. The Securities and Exchange Board of India (Buyback of Securities) Regulations, 1998- Not applicable as the Company has not bought back any of its securities during the fi nancial year under review.
(vi) The laws as are applicable specifi cally to the company are:
1. Securities Contracts (Regulation) Act, 1956
2. Securities and Exchange Board of India Act, 1992
3. Securities Contracts (Regulation) (Stock Exchanges and Clearing Corporations) Regulations, 2012
4. Rules, Regulations, Circulars, Orders, Notifi cation and Directives issued under the above statutes to the extent applicable
5. Prevention of Money Laundering Act, 2002
We have also examined compliance with the applicable clauses of the following:
i. Secretarial Standards with respect to the Meetings of the Board of Directors (SS-1) and General Meeting (SS-2) issued by The Institute of Company Secretaries of India with eff ect from 1st July,2015;
ii. The Listing Agreements entered into by the Company with Stock Exchange(s), if applicable - up to 30th November, 2015 and SEBI(Listing Obligations and Disclosure Requirement) Regulations, 2015 w.e.f 1st December, 2015 - To the extent applicable as a Recognised Stock Exchange pursuant to Securities Contracts (Regulation) (Stock Exchanges and Clearing Corporations) Regulations, 2012.

54
National Stock Exchange of India Limited
During the period under review, the Company has complied with the provisions of the Act, Rules, Regulations, Guidelines, Standards, etc. mentioned above.
We further report that:
� The Board of Directors of the Company is duly constituted with proper balance of Executive Directors, Non Executive Directors and Independent Directors. The changes in the composition of the Board of Directors that took place during the period under review were carried out in compliance with the provisions of the Act.
� Adequate notices were given to all directors to schedule the Board Meetings (including Committees), agenda and detailed notes on agenda were sent at least seven days in advance, and a system exists for seeking and obtaining further information and clarifi cations on the agenda items before the meeting and for meaningful participation at the meeting.
� Majority decision is carried through while the dissenting members’ views, if any, are captured and recorded as part of the minutes.
We further report that based on the review of the Compliance mechanism established by the Company And on the basis of Compliance Certifi cates(s) issued by the Company Secretary and taken on record by the Board of Directors at their meeting(s), we are of the opinion that there are adequate systems and processes in the Company commensurate with the size and operations of the Company to monitor and ensure compliance with applicable laws, rules, regulations and guidelines.
We further report that during the audit period, no specifi c events/actions having a major bearing on the Company’s aff airs in pursuance of the laws, rules, regulations, guidelines, standards, etc. referred to above have taken place.
For S N ANANTHASUBRAMANIAN & COCompany SecretariesFirm Registration No. P1991MH040400
S N AnanthasubramanianPartnerCOP No. 1774
Date : 10th May 2016Place: Thane

Twenty-Fourth Annual Report FY 2015-2016
55
ANNEXURE 3 TO BOARD’S REPORTForm No. MGT-9
EXTRACT OF ANNUAL RETURNas on the financial year ended on March 31, 2016
[Pursuant to section 92(3) of the Companies Act, 2013 and rule 12(1) of the Companies (Management and Administration) Rules, 2014]
I. REGISTRATION AND OTHER DETAILS
i CIN U67120MH1992PLC069769
ii Registration Date 27th November, 1992
iii Name of the Company National Stock Exchange of India Limited
iv Category/Sub-category of the Company Limited by shares/Indian Non-Govt. Co.
v Address of the Registered offi ce and contact details
Exchange Plaza, Plot C-1, Block 'G' Bandra-Kurla Complex, Bandra (East), Mumbai-400 051 022-2659 8222 (tel.) 022-2659 8198 (Fax)
vi Whether listed company (Yes/No) No
vii Name, Address & Contact details of Registrar & Transfer Agent, if any
Link Intime India Pvt. Ltd. C-13, Pannalal Silk Mills Compound, L.B.S. Marg, Bhandup (West), Mumbai-400 078 Tel.: 022-2594 6970 Fax: 022-2594 6969
II. PRINCIPAL BUSINESS ACTIVITIES OF THE COMPANY
All the Business activities contributing 10 % or more of the total turnover of the company are:-
Sr. No. Name and Description of main products/services NIC Code of the Product /service
% to total turnover of the company
1 Recognised stock exchange providing fi nancial market operational services
9971 71%
III. PARTICULARS OF HOLDING, SUBSIDIARY AND ASSOCIATE COMPANIES
Sr. No.
Name and Address of the Company CIN/GLN Holding/Subsidiary/Associate
% of shares held
Applicable Section
1 National Securities Clearing Corporation LimitedExchange Plaza, Plot C-1, Block 'G' Bandra-Kurla Complex, Bandra (East), Mumbai-400 051
U67120MH1995PLC092283 Subsidiary Company
100% 2(87) (ii)
2 NSE Strategic Investment Corporation Limited Exchange Plaza, Plot C-1, Block 'G' Bandra-Kurla Complex, Bandra (East), Mumbai-400 051
U65999MH2013PLC240078 Subsidiary Company
100% 2(87) (ii)

56
National Stock Exchange of India Limited
Sr. No.
Name and Address of the Company CIN/GLN Holding/Subsidiary/Associate
% of shares held
Applicable Section
3 India Index Services & Products Limited Exchange Plaza, Plot C-1, Block 'G' Bandra-Kurla Complex, Bandra (East), Mumbai-400 051
U73100MH1998PLC114976 Subsidiary Company
100% 2(87) (ii)
4 NSE.IT LimitedGround Floor , Trade Globe,Andheri-Kurla Road,Andheri (East), Mumbai-400 056.
U72200MH1999PLC122456 Subsidiary Company
100% 2(87) (ii)
5 DotEx International LimitedExchange Plaza, Plot C-1, Block 'G' Bandra-Kurla Complex, Bandra (East), Mumbai-400 051
U72900MH2000PLC126952 Subsidiary Company
100% 2(87) (ii)
6 NSE Infotech Services LimitedExchange Plaza, Plot C-1, Block 'G' Bandra-Kurla Complex, Bandra (East), Mumbai-400 051
U72900MH2006PLC163468 Subsidiary Company
100% 2(87) (ii)
7 Computer Age Management Services Pvt. Ltd. New No. 10, Old No. 178, M G R Salai, Nungambakkam, Chennai - 600 034
U65910TN1988PTC015757 Associate 44.99% 2(6)
8 Market Simplifi ed India Ltd. 13th Floor, Zenith Building,ASCENDES International Tech Park,CSIR Road, Taramani,Chennai - 600 113
U72900TN2000PLC045869 Associate 30% 2(6)
9 NSDL e-Governance Infrastructure Ltd. 1st Floor, Times Tower, Kamala Mills Compound, Lower Parel,Mumbai - 400 013
U72900MH1995PLC095642 Associate 25.045% 2(6)
10 Power Exchange India Ltd. 5th Floor, Tower 3, Equinox Business Park, Peninsula Techno Park, Off BKC, L B S Marg, Kurla (West), Mumbai - 400 070
U74900MH2008PLC179152 Associate 30.95% 2(6)
11 National Securities Depository Limited 4th Floor, ‘A’ Wing, Trade World, Kamala Mills Compound, Senapati Bapat Marg, Lower Parel, Mumbai - 400 013
U74120MH2012PLC230380 Associate 25.045% 2(6)

Twenty-Fourth Annual Report FY 2015-2016
57
Sr. No.
Name and Address of the Company CIN/GLN Holding/Subsidiary/Associate
% of shares held
Applicable Section
12 Receivables Exchange of India LimitedExchange Plaza, Plot C-1, Block 'G' Bandra-Kurla Complex, Bandra (East), Mumbai-400 051
U67190MH2016PLC273522 Associate 26.00% 2(6)
13 NSE Educational Facilities LimitedExchange Plaza, Plot C-1, Block 'G' Bandra-Kurla Complex, Bandra (East), Mumbai-400 051
U67190MH2016PLC274239 Subsidiary Company
100% 2(87) (ii)
IV. SHARE HOLDING PATTERN (Equity Share Capital Break-up as percentage of Total Equity)
i) CATEGORY-WISE SHARE HOLDING
Category of Shareholders No. of Shares held at the beginning of the year No. of Shares held at the end of the year % Change during the
yearDemat Physical Total % of Total
Shares Demat Physical Total % of Total
Shares
A. PROMOTERS - - - - - - - - -
(1) Indian - - - - - - - - -
a) Individual/HUF F - - - - - - - - -
b) Central Govt. - - - - - - - - -
c) State Govt(s) - - - - - - - - -
d) Bodies Corp. - - - - - - - - -
e) Banks/FI - - - - - - - - -
f ) Any other… - - - - - - - - -
Sub- total(A)(1): - - - - - - - - -
(2) Foreign - - - - - - - - -
a) Individual (Non-Resident Individuals/Foreign Individuals)
- - - - - - - - -
b) Other - Individuals - - - - - - - - -
c) Bodies Corp. - - - - - - - - -
d) Banks/FI - - - - - - - - -
e) Any other… - - - - - - - - -
Sub- total(A)(2): - - - - - - - - -
Total Shareholding of Promoter (A)= (A)(1)+(A)(2)
- - - - - - - - -
B. PUBLIC SHAREHOLDI NG
(1) Institutions
a) Mutual Funds - - - - - - - - -
b) Banks/FI 1,26,97,429 - 1,26,97,429 28.22 9697429 - 9,697,429 21.55 -6.67
c) Central Govt - - - - - - - - -
d) State Govt(s) - - - - - - - - -
e) Venture Capital Funds 18,25,119 - 18,25,119 4.05 1,883,953 - 1,883,953 4.19 0.14

58
National Stock Exchange of India Limited
Category of Shareholders No. of Shares held at the beginning of the year No. of Shares held at the end of the year % Change during the
yearDemat Physical Total % of Total
Shares Demat Physical Total % of Total
Shares
f ) Insurance Companies 82,53,500 - 82,53,500 18.34 9,153,500 - 9,153,500 20.34 2.00
g) FIIs 64,30,155 - 64,30,155 14.29 6,430,155 - 6,430,155 14.29 0.00
h) Foreign Venture Capital Funds
- - - - - - - - -
i) Others (specify) Foreign Direct Investments
96,75,000 - 96,75,000 21.5 11,700,000 - 11,700,000 26.00 4.50
Subtotal(B)(1): 3,88,81,203 - 3,88,81,203 86.40 38,865,037 - 38,865,037 86.37 -0.03
(2) Non - Institutions -
a) Bodies Corp.(Indian) 56,47,368 - 56,47,368 12.55 5,613,834 - 5,613,834 12.48 -0.07
b) Bodies Corp. (Overseas) - - - - - - - - -
b) Individuals
i) Individual shareholders holding nominal share capital upto `1 lakh
- - - - - - - -
ii) Individual shareholders holding nominal share capital in excess of ` 1 lakh
4,71,429 - 4,71,429 1.05 521,129 - 521,129 1.16 0.11
c) Others (specify)
Subtotal(B)(2): 61,18,797 - 61,18,797 13.60 6,134,963 - 6,134,963 13.63 0.03
Total Public Shareholding (B)= (B)(1)+(B)(2)
4,50,00,000 - 4,50,00,000 100 4,50,00,000 - 4,50,00,000 100 -
C. Shares held by Custodian forGDRs & ADRs
- - - - - - - - -
Grand Total (A+B+C) 4,50,00,000 - 4,50,00,000 100 4,50,00,000 - 4,50,00,000 100 -
Notes: Number of shares available in the non-public category is 18,17,114 equity shares of ` 10/- each (4.038%). Number of
shares available for acquisition by persons resident outside India is 39,19,845 (8.71%). However the above is subject to FDI policy,
RBI and SEBI Regulations currently in force.
ii) SHAREHOLDING OF PROMOTERS
Sr. No.
Shareholder’s Name
Shareholding at the beginning of the year
Shareholding at the end of the year
% change in shareholding
during the year
No. of Shares
% of total Shares of the
company
%of Shares Pledged /
encumbered to total shares
No. of Shares
% of total Shares of
the company
%of Shares Pledged /
encumbered to total shares
- - - - - - - - -

Twenty-Fourth Annual Report FY 2015-2016
59
iii) CHANGE IN PROMOTERS’ SHAREHOLDING (PLEASE SPECIFY, IF THERE IS NO CHANGE)Not applicable
Sr. No.
Particulars Shareholding at the beginning of the year
Cumulative Shareholding during the year
No. of shares % of total shares of the
company
No. of shares % of total shares of the
company
1 At the beginning of the year N.A. N.A. N.A. N.A.
2 Date wise Increase / Decrease in Promoters Shareholding during the year specifying the reasons for increase / decrease (e.g. allotment /transfer / bonus/ sweat equity, etc.):
N.A. N.A. N.A. N.A.
3 At the end of the year N.A. N.A. N.A. N.A.
iv) Shareholding Pattern Of Top Ten Shareholders (Other Than Directors, Promoters And Holders Of GDRs And ADRs):
Sr.No.
Name Shareholding at the beginning of the year
Date-wise increase/decrease in shareholding during the year
specifying the reasons for increase/decrease (eg. Allotment/transfer/
bonus/sweat equity
Cumulative shareholding
during the year (01-04-15 to 31-03-2016)
Shareholding at the end of year (31-03-
2016)
No. of shares at the
beginning (01-04-15)
% of total shares of the
company
Date Increase (I)/ Decrease(D)
in shareholding
Reason No. of shares
% of total shares of the
company
No. of shares
% of total shares of
the Company
1 Life Insurance Corporation of India
4,728,500 10.51 31 Mar 2016 900,000 (I) Transfer 9,00,000 2.00 5,628,500 12.51
2 State Bank of India (Equity)
4,587,500 10.19 - 0 Nil Movement during the
Year
0 0 4,587,500 10.19
3 ArandaInvestments (Mauritius) Pte Ltd
2,250,000 5.00 - 0 Nil Movement during the
Year
0 0 2,250,000 5.00
4 GAGIL FDI Limited
2,250,000 5.00 - 0 Nil Movement during the
Year
0 0 2,250,000 5.00
5 GS Strategic Investments Limited
2,250,000 5.00 - 0 Nil Movement during the
Year
0 0 2,250,000 5.00
6 SAIF II-SE Investments Mauritius Limited
2,250,000 5.00 - 0 Nil Movement during the
Year
0 0 2,250,000 5.00

60
National Stock Exchange of India Limited
Sr.No.
Name Shareholding at the beginning of the year
Date-wise increase/decrease in shareholding during the year
specifying the reasons for increase/decrease (eg. Allotment/transfer/
bonus/sweat equity
Cumulative shareholding
during the year (01-04-15 to 31-03-2016)
Shareholding at the end of year (31-03-
2016)
No. of shares at the
beginning (01-04-15)
% of total shares of the
company
Date Increase (I)/ Decrease(D)
in shareholding
Reason No. of shares
% of total shares of the
company
No. of shares
% of total shares of
the Company
7 Stock Holding Corporation of India Limited
2,250,000 5.00 - 0 Nil Movement during the
Year
0 0 2,250,000 5.00
8 SBI Capital Markets Limited
1,950,000 4.33 - 0 Nil Movement during the
Year
0 0 1,950,000 4.33
9 IFCI Limited 2,497,750 5.55 15-Sep15 675,000 (D) Transfer 7,50,000 1.67 17,47,750 3.88
30-Dec15 75,000 (D) Transfer
10 MS Strategic (Mauritius) Limited
1,350,000 3.00 - 0 Nil Movement during the
Year
0 0 1,350,000 3.00
11 PI Opportunities Fund
1,350,000 3.00 - 0 Nil Movement during the
Year
0 0 1,350,000 3.00
12 Tiger Global Five Holdings
1,350,000 3.00 - 0 Nil Movement during the
Year
0 0 1,350,000 3.00
13 IDBI Bank Limited
2,249,153 4.998 31-Mar16 900,000 (D) Transfer 0 0 1349153 2.998
v) Shareholding of Directors and Key Managerial Personnel: Nil
Sl.No.
For Each ofthe Directors
and KMP
Shareholding at thebeginning of the year
Cumulative Shareholding during the year
No.of
shares
% of totalshares of the
company
No.of
shares
% of totalshares of
the company
1 At the beginning of the year N.A. N.A. N.A. N.A.
2 Date wise Increase / Decrease in Promoters Shareholding during the year specifying the reasons for increase /decrease (e.g. allotment / transfer / bonus/ sweat equity etc.):
N.A. N.A. N.A. N.A.
3 At the end of the year N.A. N.A. N.A. N.A.

Twenty-Fourth Annual Report FY 2015-2016
61
V. INDEBTEDNESS
Indebtedness of the Company including interest outstanding/accrued but not due for payments- Nil
Particulars Secured Loans excluding deposits
Unsecured Loans
Deposits Total Indebtedness
Indebtedness at the beginning of the fi nancial year N.A N.A N.A N.A
i) Principal Amount N.A N.A N.A N.A
ii) Interest due but not paid N.A N.A N.A N.A
iii) Interest accrued but not due N.A N.A N.A N.A
Total (i+ii+iii) N.A N.A N.A N.A
Change in Indebtedness during the fi nancial year N.A N.A N.A N.A
* Addition N.A N.A N.A N.A
* Reduction N.A N.A N.A N.A
Net Change N.A N.A N.A N.A
Indebtedness at the end of the fi nancial year N.A N.A N.A N.A
i) Principal Amount N.A N.A N.A N.A
ii) Interest due but not paid N.A N.A N.A N.A
iii) Interest accrued but not due N.A N.A N.A N.A
Total (i+ii+iii) N.A N.A N.A N.A
VI. REMUNERATION OF DIRECTORS AND KEY MANAGERIAL PERSONNEL
A. Remuneration to Managing Director, Whole-time Directors and/or Manager:
SN. Particulars of Remuneration Managing DirectorMs. Chitra Ramkrishna - MD
Total Amount
1 Gross salary - (a) Salary as per provisions contained in section 17(1) of the
Income-tax Act, 1961 6.03 6.03
(b) Value of perquisites u/s 17(2) Income-tax Act, 1961 1.36 1.36 (c) Profi ts in lieu of salary under section 17(3) Income-
tax Act, 1961 -
2 Stock Option - - 3 Sweat Equity - - 4 Commission
- as % of profi t - others, specify…
- -
5 Others, please specify (contribution to PF and other fund. Exempted allowances, tax paid by employer, withheld variable pay)
1.731.73
Total (A) 9.12 9.12Ceiling as per the Act-5% 59.43 59.43 Ceiling as per the Act-11% 130.75 130.75

62
National Stock Exchange of India Limited
B. Remuneration to other directors:
SN. Particulars of Remuneration
Name of Directors Total Amount
1 Independent Directors
Mr. Ashok
Chawla
Mr. Justice B.N
Srikrishna (Retd.)
Ms. Dharmishta
Raval
Mr. S. B Mathur
Mr. Y.H Malegam
Dr. S. Sadagopan
Dr. K.R.S Murthy
Fee for attending board, committee meetings
- 7,75,000 1,00,000 38,55,000 48,15,000 20,75,000 48,55,000 1,66,65,000
Commission - - - - - - - Others, please specify
- - - - - - -
Total (1) - 7,75,000 1,00,000 38,55,000 48,15,000 20,75,000 48,55,000 1,66,65,000 2 Other Non-
Executive Directors
Mr. Abhay
Havaldar
LIC (Mr. S.B Mainak)
Mr. Prakash Parthasarthy
Mrs. Pratima Umarji
Mr. Ravi Narain
- -
Fee for attending board, committee meetings
6,75,000 3,50,000 6,50,000 17,10,000 26,80,000 - - 61,40,000
Commission - - - - - - - Others, please specify
- - - - - - -
Total (2) 6,75,000 3,50,000 6,50,000 17,10,000 26,80,000 - - 61,40,000 Total (B)=(1+2)Total Managerial RemunerationOverall Ceiling as per the Act
1,00,000 per director per
meeting
C. Remuneration to Key Managerial Personnel (Other Than MD/Manager/WTD)
Sl. No.
Particulars of Remuneration Key Managerial Personnel
1 Gross salary CEO Company Secretary
CFO Total
(a) Salary as per provisions contained in section 17(1) of the Income-tax Act, 1961
6.03 3.31 1.49 4.80
(b) Value of perquisites u/s 17(2) Incometax Act, 1961 1.36 0.66 0.28 0.94
(c) Profi ts in lieu of salary under section 17(3) Income-tax Act, 1961 - - - -
2 Stock Option - - - - 3 Sweat Equity - - - - 4 Commission
-- - -
- - as % of profi t - - - - others, specify… - - -
5 Others, please specify (Non-taxable Medical, PF/Pension contribution, allowable superannuation contribution (where applicable)
1.73 0.65 0.10 0.75
Total 9.12 4.62 1.87 6.49

Twenty-Fourth Annual Report FY 2015-2016
63
VII. PENALTIES / PUNISHMENT/ COMPOUNDING OF OFFENCES Nil
Type Section of the Companies Act
Brief Description
Details of Penalty /
Punishment/ Compounding fees imposed
Authority [RD / NCLT/
COURT]
Appeal made, if any (give
Details)
A. COMPANY
Penalty - - - - -
Punishment - - - - -
Compounding - - - - -
B. DIRECTORS
Penalty - - - - -
Punishment - - - - -
Compounding - - - - -
C. OTHER OFFICERS IN DEFAULT
Penalty - - - - -
Punishment - - - - -
Compounding - - - - -
For and on behalf of the Board of Directors
Ashok ChawlaDate: May 12, 2016 Chairman

64
National Stock Exchange of India Limited
ANNEXURE 4 TO BOARD’S REPORTRELEVANT EXTRACTS FROM NOMINATION AND R EMUNERATION
POLICIES OF NSEIL
(a) Criteria for determining qualifi cations, positive attributes and independence of a director:
• Satisfaction of the ‘fi t & proper criteria’ stipulated under SCR (SECC) Regulations 2012 and other requirements as prescribed by SEBI from time to time.
• Assessment of the appointee against a range of criteria which includes, but not be limited to, qualifi cations, skills, diverse industry experience, background and other qualities relevant to the business of the Company and required to operate successfully in the position. Additionally the Board may consider appointment of experts from various specialised fi elds such as fi nance, law, information technology, corporate strategy, marketing and business development, international business, operations management so as to bring diversifi ed skill sets on board or succeed any outgoing director with the same expertise
• The extent to which the appointee is likely to contribute to the overall eff ectiveness of the Board, work constructively with the existing directors and enhance the effi ciencies of the Company
• The nature of existing positions held by the appointee including directorships or other relationships and the impact they may have on the appointee’s ability to exercise independent judgment
• Ability of the appointee to represent the company
• Ability to work individually as well as a member of the Board and with the senior management
• Infl uential communicator with power to convince other in a positive way
• Ability to participate actively in deliberation and group processes
• Strategic thinking and facilitation skills
• Act impartially keeping in mind the interest of the company on priority basis
• Criteria for determining independence
(b) Policy on directors’ remuneration:
• The remuneration / compensation / commission, etc. to be paid to Directors is determined by the Nomination & Remuneration Committee and recommended to the Board for approval.
• The remuneration / compensation / commission etc. shall be subject to the approval of the shareholders of the Company, the Central Government and SEBI, wherever required. It shall be as per the statutory provisions of the Companies Act, 2013 read with the rules made thereunder for the time being in force. The requirements prescribed by SEBI from time to time in this regard shall be followed while determining the compensation payable to Directors
----

Twenty-Fourth Annual Report FY 2015-2016
65
ANNEXURE 5 TO BOARD’S REPORT
Annual Report of CSR Activities
NSE is covered under the purview of Section 135 of the Companies Act 2013. Similarly many of its subsidiaries are also covered. However, contribution to CSR by some of these Companies as required under the Section 135 will be negligible. Moreover, there could be eff orts at duplication if each individual Company undertakes CSR activities on its own and there would be diffi culties in scaling up these activities. Therefore it has been decided by the Boards of the respective Companies in NSE Group that CSR eff orts for the Group be undertaken commonly and the actual spent be allocated to the respective Companies in proportion to their legal obligations. Therefore a common CSR function for NSE and its subsidiaries has been created under NSE as a group resource and the actual CSR spend is proportionately allocated to the respective Companies. However the CSR Committees for these Companies are separate. A common CSR policy has been prepared and approved by respective CSR Committees and Boards.
1. A brief outline of the company’s CSR policy, including overview of projects or programmes proposed to be undertaken and a reference to the web-link to the CSR policy and projects or programmes.
CSR Vision: NSE Group has been constantly working to improve the fi nancial wellbeing of people at large through a committed approach to off er investment products that suits varied needs of people. It has improved access of the fi nancial market to people across the country, improved safety measures for investors, empowered investors through improved awareness and education on fi nancial planning, investor protection and investment related issues. Besides this, NSE Group also has been continuously improvising on the conduct of business in a responsible manner through conservation of energy, use of renewable sources of energy, eco-friendly infrastructure etc., In order to strengthen its CSR initiatives, in 2012, a CSR Focus Group was formed consisting of employees volunteering to contribute part of their time to undertake CSR activities internally. The group has since organised various activities such as organising environment awareness building programmes, exposure visits on environmental issues etc. with the help of NGO partners like Bombay Natural History Society (BNHS), organising blood donation camps, promoting social entrepreneurship by facilitating sale of articles produced by diff erent NGOs etc. Besides, diff erent eco-friendly activities like wind power generation, rain water harvesting, use of solar energy,solid waste management through promoting vermi-composting out of the waste from NSE Group Companies premises, etc., have also been undertaken. Employees have been encouraged to take part in environment initiatives such as Earth Hour, Waterless Holi and sustainable environment initiatives in day to day life. The Chennai branch offi ce extended timely emergency relief assistance to fl ood aff ected citizens.
NSE Group, in order to further its CSR aspiration of helping the underprivileged sections of the population in improving their quality of life is now embarking upon a mission to reach out to them. MOUs have been entered into with Tata Institute of Social Sciences (TISS) and Samhita Social Ventures to guide NSE with designing the CSR policy, gap analysis, CSR plan, community engagement strategy, project and project partner evaluation, screening, implementation, monitoring, measurement of programme impact etc.
CSR Objectives and Goals: To begin with, NSE Group has taken up, i) Primary Education and ii) Elder Care, iii) Sanitation and Safe Drinking Water as the focus areas. The CSR objectives have been identifi ed basis the larger mandate outlined in the Section 135 of the Companies Act 2013 and CSR Rules 2014 as well as to meet NSE’s community engagement aspirations. Projects undertaken under these verticals will not be one-time

66
National Stock Exchange of India Limited
activities but will be on a project or programme mode with a long term time-line to achieve pre-determined goals. In the initial phase eff orts are concentrated on Primary Education and Elder Care. On the basis of the experience and learnings gained, other areas will be included in the future. In addition to the three focal areas of intervention outlined, a number of small CSR activities to engage and motivate employees to be socially responsible have been undertaken by the CSR Focus Group of NSE. These activities such as Blood Donation Camps, NGO-Melas related to social entrepreneurship, awareness building programmes in education, health and environment, screening of documentaries on environmental & social issues, organising guest lectures on social issues, nature awareness activities, observing of national / international days such as Children’s Day, Women’s Day etc. are undertaken by the CSR Focus Group of NSE Group in collaboration with the company employees.
The core CSR focus verticals, the objectives and goals are more fully elaborated in the following sections.
Primary Education: While selecting projects under primary education NSE Group has emphasized intervention in capacity building & training of highly motivated, equipped and qualifi ed teachers that will augment teacher-student ratio and directly impact the quality and quantity of attention that is currently provided per student. Besides this, to enhance foundational skills at the primary education level in the areas of reading, writing, critical thinking, arithmetic and problem-solving, application and behavioral skills. The projects which have commenced implementation will contribute to the holistic development of children which includes addressing their physical, mental and aspirational needs through supplementary and in-school programmes. A unique characteristic of the projects selected by NSE in the fi eld of Primary Education is that they impact the most disadvantaged communities and the weakest sections of the society.
The programme modules are intensive, customized and highly individualistic in nature. Many of these programmes are model path breaking projects that are recognized as social and educational change agents.
Elder Care: Projects considered under elder care focus on enhancing the physical and mental well-being of the underprivileged ageing population by awareness of mental and physical health indicators, addressing elder abuse and loneliness as also provision of monthly food rations to very poor senior citizens living alone without any support systems. During the Chennai fl oods, emergency relief measures were taken to provide medical aid, psychological counselling and food to fl ood aff ected senior citizens.
Sanitation and Safe Drinking Water: NSE Group has taken sanitation and safe drinking water as one of the focus areas under the CSR policy of NSE group. Proposals from NGOs specializing in this area have been invited and the proposals reviews are being executed. Under this, NSE Group will support sanitation projects in the schools, communities, awareness building on sanitation and safe drinking water, solid waste management, WASH (Water, Sanitation and hygiene) etc. A pilot project is planned for the renovation, maintenance and behavioral change programs in rural, semi urban and urban schools to understand the on ground realities and complexities, post which the programme would be scaled up and implemented.
Prime Minister’s National Relief Fund: India is a vast country susceptible to the vagaries of nature. From time to time various geographical areas are aff ected by natural calamities such as fl oods, storms, earthquakes, etc. unfortunate disasters such as cyclone in Andhra Pradesh, fl oods in Kashmir and last year’s calamities such as a storm in Orissa, fl ash fl ood in Uttaranchal are some of the disasters witnessed by India. Relief is granted, by the State Govt. & Central Govt., NGOs etc. and also through Prime Minister’s National Relief Fund. NSE Group has taken contribution to the ‘Prime Minister’s National Relief Fund’ as one of the focus area in such circumstances

Twenty-Fourth Annual Report FY 2015-2016
67
if and when the need arises.
CSR Activities under NSE CSR Focus Group: CSR focus group consisting of employee volunteers conducts/coordinates various social activities such as Blood Donation Camps, NGO-Melas related to social entrepreneurship, education, health awareness, environmental awareness, organising awareness building programmes such as solar power, support of Earth Hour, recycling of waste paper, screening of documentaries on environmental & social issues, organising guest lectures on social issues, nature awareness walk, observing of National / International Days such as Children’s Day, Women’s Day etc. The CSR Focus Group will continue to engage in such activities.
Monitoring and evaluation of CSR initiatives: Appropriate monitoring mechanisms are being evolved for tracking the progress and impact of the various CSR programmes in consultation with TISS and Samhita.
Web-link for NSE Group CSR Policy: http://nseindia.com/global/content/about_us/NSE_CSR_Policy.pdf
2. The Composition of the CSR Committee of National Stock Exchange of India Ltd (NSEIL): During the year CSR Committee consisted of Mr. Ravi Narain, Mr. Prakash Parthasarathy, Dr. K.R.S Murthy and Ms. Chitra Ramkrishna. Mr. Ravi Narain is Chairperson of the NSEIL CSR Committee. Dr.K.R.S. Murthy completed his term on March 27, 2016 and Ms. Dharmishta Raval has since then been appointed in his place.
3. Average net profi t of NSEIL for last three fi nancial years: The average net profi t of NSEIL calculated pursuant to Section 135 read with Section 198 for last three Financial Years is ` 1057,15,13,807.69
4. Prescribed CSR Expenditure (2% of the amount as in item 3 above): ` 21,14,30,276.15
5. Details of CSR spend during the fi nancial year 2015-16
(a) Total amount to be spent for the fi nancial year: ` 21,14,30,276.15
(b) (i) Total amount committed: ` 8,93,63,906.56 (including for ongoing projects)
(ii) Total amount disbursed/spent: ` 2,70,70,618.33 (including for ongoing projects) of which ` 2,07,39,602.85 was disbursed in the current Financial year.
(iii) Amount unspent if any for the Financial Year: 19,06,90,673.30 of which ` 3,18,94,205.62 was already committed during the year.
(c) Manner in which the amount is spent during the fi nancial year is detailed below.

68
National Stock Exchange of India Limited
Sr. No.
CSR Project or activity identifi ed
Sector in which the project is covered
Projects or programmes (1)
Local area or other (2) Specify the
state and district where projects or programmes was
undertaken
Cumulative Amount outlay (Committed Budget)
Amount spent during FY 15 -16 on projects or programs sub heads (1) Direct expenditure on projects or programs (2)
overheads
Cumulative expenditure up to the reporting period
Amount spent Direct or through implementing agency
Outlay for the Group
Outlay for the Company
Spent by the Group
Spent by the Company
Spent by the Group
Spent by the company
Spent by the Group
Spent by the Company
1 Door Step School
Primary Education
Pune City, District- Pune, State- Maharashtra
11,44,100.00 8,55,573.78 5,99,911.00 4,39,518.72 10,28,950.00 7,60,360.01 10,28,950.00 7,60,360.01
2 Door Step School
Primary Education
Haveli- Mulashi Tehasil, District-
Pune State- Maharashtra
42,07,000.00 31,46,052.71 16,41,260.00 12,02,452.51 30,41,260.00 22,49,391.85 30,41,260.00 22,49,391.85
3 Vikas Sahayog Pratishtan
Primary Education
District-Buldhana State-Maharashtra
36,26,700.00 27,12,096.36 22,66,201.00 16,60,309.21 34,32,826.00 25,32,727.50 34,32,826.00 25,32,727.50
4 Magic Bus India
Foundation
Primary Education
Ulhasanagar City District-Thane
State-Maharashtra
54,82,400.00 40,99,814.45 30,49,274.00 22,34,019.71 39,43,024.00 29,02,378.30 39,43,024.00 29,02,378.30
5 Tata Institute of Social Sciences
Primary Education
Mankhurd, Mumbai State-
Maharashtra
37,35,690.00 27,93,600.58 20,47,617.00 15,00,165.85 30,67,902.00 22,63,149.07 30,67,902.00 22,63,149.07
6 All India Inst. Of Local Self Government
Primary Education
Thane and Pune State-Maharashtra
2,10,32,480.00 1,57,28,379.07 49,81,110.00 36,49,359.78 49,81,110.00 36,49,359.78 49,81,110.00 36,49,359.78
7 All India Inst. Of Local Self Government
Primary Education
Medha Dist-Satara State-Maharashtra
2,10,32,480.00 1,57,28,379.07 49,10,290.00 35,97,474.23 49,10,290.00 35,97,474.23 49,10,290.00 35,97,474.23
8 Dignity Foundation
Elder Care Mumbai and Chennai State-
Maharashtra and Tamilnadu
1,65,89,430.00 1,24,05,804.91 48,74,085.00 35,70,949.00 68,89,185.00 50,77,868.62 68,89,185.00 50,77,868.62
9 Door Step School
Primary Education
Pune City, District- Pune, State- Maharashtra
25,37,207.00 18,58,859.01 0 0 0 0 0 0
10 Door Step School
Primary Education
Haveli-Mulashi Tehasil, District-
Pune State- Maharashtra
44,21,076.00 32,39,056.55 0 0 0 0 0 0
11 Vikas Sahayog Pratishtan
Primary Education
District-Buldhana State-Maharashtra
59,26,950.00 43,42,319.88 0 0 0 0 0 0
12 Tata Institute of Social Sciences
Primary Education
Mankhurd, Mumbai State-
Maharashtra
47,35,230.00 34,69,218.29 0 0 0 0 0 0
13 Teach For India
Primary Education
Mumbai and Chennai
1,76,71,602.00 1,29,46,920.19 0 0 0 0 0 0
14 Family Welfare Agency
Elder Care Lower Parel, 82,41,200.00 60,37,831.70 0 0 0 0 0 0
15 CSR Focus Group
Various Activities*
Mumbai, Maharashtra
NA NA 11,31,107.00 8,28,694.09 11,91,615.75 8,73,942.80 11,91,615.75 8,73,942.80
16 Capacity Building
Capacity Building
Mumbai, Maharashtra
NA NA 17,01,304.59 12,46,443.57 26,71,053.59 19,71,635.27 26,71,053.59 19,71,635.27
17 PME* Project Monitoring
NA NA NA 11,05,886.00 8,10,216.18 16,16,861.00 11,92,330.34 16,16,861.00 11,92,330.34
12,03,83,545.00 8,93,63,906.56 2,83,08,045.59 2,07,39,602.85 3,67,74,077.34 2,70,70,617.77 3,67,74,077.34 2,70,70,617.77
* Activities undertaken by NSE Group CSR Focus Group covers Blood Donation Camp, NGO Melas for Children’s Day, Environment Awareness, Swachha Bharat Drive. *PME- Project Monitoring Expenditures

Twenty-Fourth Annual Report FY 2015-2016
69
6. Details of the implementing agencies.
The Society for Door Step Schools Urban Project: The school provides education and support to those children who do not have access to mainstream educational facilities and are children of pavement dwellers, construction site families and migrant labourers. The organization aims to bring education to the Doorstep of these children and helps them to enroll in formal schools. Doorstep has addressed the needs of 300000 children since inception. The NSE project has addressed the educational needs of a cumulative number of 831 out of school children in Pune urban area and 2639 primary children in the Pune rural district. Project Foundation is a part of the Educational Urban Activity Centres or EAC of Door step schools which addresses the needs of the children 6 -14 years who do not have access to formal schooling. The project is intended to impart quality education to the children of the construction labourers. The Project centres are in the vicinity of construction sites with a high population of migrant labourers literally bringing education to the Doorstep of the out of school children. The project is currently being implemented near 10 construction sites in Pune where pre - primary, literacy and study classes for children are conducted. The children are then helped to get into the formal education system and admitted to schools. The highlight of the project is to track the children who are forced to drop out of school due to migration of parents in search of livelihood child and provided assistance to enroll in a school nearby.
The Society for Door Step Schools Rural Project: This is a part of the rural literacy school intervention programme of Door Step Schools. The Project titled ‘Grow with Books’ is being implemented in the Mulashi-Mawal area since April’15. The project aims to enhance the reading ability of 2639 children in the age group 6 – 14 years, enrolled in 22 government schools as the children belong to either the migrant community or are from socio-economically weaker sections. The project uses specially trained staff named ‘book fairies’ who conduct the sessions as an supplementary feature of the formal state school curriculum. The program consists of three main modules. First Steps Forward for class 1, Reading classes for class 1-4 and Home lending library for class 1- 7.A 10 day train the trainer programme was conducted for newly recruited Book Fairies who would work in the schools bridge classes in 22 identifi ed schools.
Vikas Sahayog Pratishtan: Vikas Sahayog Pratishtan has been working with marginalized communities such as Vimukta Jati Nomadic Tribes (VJNT), poor farmers, women etc., addressing various issues like human rights, livelihood, education etc. Under the NSE project minimum learning levels in language and mathematics were established in 1200 primary school children in Mehkar block of Buldhana district. Since the students hailed from nomadic backgrounds, eff orts were made to lower the dropout rate of the children in school. The NSE project aims to provide supplementary education in rural Government Schools for 1200 children hailing from the VJNT Tribes of Mehkar Block in the drought hit Buldhana District. A large number of the population in these areas are tribal and nomadic communities that frequently migrate to other regions in search of employment and livelihood. VSP conducts awareness programs in the community to decrease the dropout rates of students by encouraging the village community and relatives to care for children when parents migrate in search of work. The objectives of the NSE project also include the setting up of School Management Committees as well as establishment of Learning Centres (LEP) in schools and in shared resource areas of the villages. The fundamentals of the program looks to change both learning and teaching methodologies by working with teachers, supervisors and primary level children. The project methodology includes village level assessment and grouping of children, creating of learning centers both within the community and the schools. Distribution of teaching aids and learning material in language and math, awareness workshops for

70
National Stock Exchange of India Limited
teachers, resource staff , parents and working with school management committees.
Magic Bus India Foundation: Magic Bus is a mentoring organisation, working to take a million children living in poverty on a journey from childhood to livelihood. It trains and guides local community mentors to deliver a programme that focuses on education, health and gender equality. The youth mentors do this by using a curriculum that uses sports as a tool for engagement and as a metaphor for learning. Magic Bus India Foundation is implementing project on Quality Education in 10 Municipal Schools Ulhasnagar benefi tting 1700 children. The project carries a blend of two broad concepts i.e. Sport for Development (S4D) and Quality Education. Sport for Development is intended to build children’s conviction for education which very important in the long run to retain children’s interest in education and therefore continuation of studies. Quality supplementary education with the help of Youth Mentors helps to improve academic performance. The Young Mentors undergo a rigorous 7 days training in Sports for Development. The increased interest and importance of physical education in education is refl ected in the 95% children’s attendance at these sessions. The total number of children enrolled in the Sport for Development program is 1772, with 882 boys and 930 girls. AS per the TISS review in the previous quarter, 298 S4D sessions and 296 Library sessions were held. The positive eff orts of the NSE Magic Bus programme and its impact on the children has been recognized by the government authorities and Magic Bus has been selected as one of the NGO partners in the Child Protection Committee of Ulhasnagar Municipal Corporation.
Tata Institute of Social Sciences - Field Action Project Chunauti Tata Institute of Social Sciences is the pioneer & premier institute of social work. It is an autonomous university. A model program Chunauti managed by TISS was supported. This is a model project to rehabilitate and educate a small group of 103 rescued children through intensive psychological and educational interventions. Chunauti is a fi eld action project of Tata Institute of Social Sciences undertaken pursuant to the orders of Bombay High Court. The project is currently being implemented in the Mankhurd Children’s Home to impart quality education to 103 mentally challenged children rescued from diff erent orphanages Project interventions are at 2 levels. First level interventions are determined for the children at Mankhurd Center. Whereas the second level of intervention is on training functionaries of government offi cials and replicating this model with the support of the state government and High Court. This project benefi ts 103 mentally challenged children. In the review of the project by TISS it is seen that 15 children provided schooling through SSA and 7 children through NIOS, which is big step to bring them to mainstream education. This is a model rehabilitation and social re –integration project. It is a unique project in terms of the impact created, media scrutiny, learning outcomes advocacy with various stakeholders and policy reforms. The pedagogy, training and counselling off ered is customized. The project has signifi cant learnings and has brought about several policy level changes at the ground level. The aim is to replicate the model in 19 MIDC homes across Maharashtra and elsewhere.
Dignity Foundation: Dignity Foundation is working on the issue of elder care. Dignity Foundation has a physical presence in 6 cities through offi ces and activity centres - Mumbai, Pune, Bangalore, Kolkata, Chennai and Ahmedabad. Dignity Foundation is implementing the Senior Citizens project in Mumbai- Dharavi, Jogeshwari, Worli, Sion and in Chennai- Kannaginagar, Saidapeth etc. to cater diff erent needs of the elderly population. As reported by TISS, monthly workshops have been conducted according to the schedule since March 2015. 5 awareness workshops have been conducted in 5 distinct sections in each of the 6 project areas. 4320 Elders have registered and taken the Dignity Savings Card. This card enables them to avail discounts at around 1500 partnered outlets across Mumbai that includes pathology laboratories, orthopedics, lenses, hospitals, etc.

Twenty-Fourth Annual Report FY 2015-2016
71
A one of its kind help line for Senior citizens was launched to address physiological, psychological, emotional and social issues. Many senior citizens suff er from verbal and emotional abuse and require psychological counselling. More than 20 calls have been received on the Helpline for various assistances. This can be looked upon as a positive outcome of the awareness activity. As an emergency measure to provide relief and assistance during the devastating fl oods in Chennai, timely medicines and ration was distributed. Emergency medical camps were conducted and psychological counselling was provided to overcome the trauma of the disaster.
All India Institute of Local Self Government (AIILSG): AIILSG works on various issues like Primary Education, Disaster Management, Health, Livelihood, Women Empowerment, Research and Documentation etc. across India. Project on Quality Education is being implemented in Ramnagar from Thane and Gandhinagar from Pune City impacting 718 children. As reported by TISS, the project team has established Children’s Resource Center (CRC) at the local level with committed, trained and enthusiastic Shikshan-Mitras (SM) which has resulted in creating a conducive environment for holistic learning to supplement education provide and ensure minimum age appropriate learning and age appropriate literacy levels. The feedback on the popularity of the project is that the children who are often reluctant to attend the formal schools, however reach the CRC even before its scheduled time. Reading of books has given them a completely diff erent experience and added value to their knowledge level as well. The sessions of supplementary and complementary learning at the CRC are conducted for 2 hours each in the mornings and evenings, with some SMs taking sessions in the afternoon as well depending upon the availability of the children. The interaction with the various stake holders such as school principal’s teachers,and parents refl ected that they feel this intervention has made a positive impact on the children.
All India Institute of Local Self Government- Rural Project: Project on Quality Education is being implemented in Medha Tehasil of Satara Block impacting 817 children.
As reported by TISS, a seven day training session was conducted in Pune. The programme managers have conducted multiple meetings with the school teachers, headmasters and the district education authorities. The CRC sessions are planned for 2 hours in the morning between 8-10 before class begins and 2 Hours in the evening between 5-7 p.m. Some Shikshan mitras also take sessions in the afternoon between 3-5 p.m. depending upon the availability of students and teachers. Schools have reported increased use of their facilities including teaching aids, music instruments, sports infrastructure due to the keen interest and mentoring guidance of the Shikshan Mitras and demand from the children. The Shikshan mitras have been using activities, games, music and art with the children during CRC sessions. These sessions are conducted twice a day in the school and in the vastis/ temples/community hall or open spaces as may be available or provided by the community.
Teach for Indi a (TFI) a project of Teach to Lead is a nationwide movement to infuse management perspective to school education by committing outstanding graduates and young professionals to work in government schools for a term of two years with the aim of addressing educational inequity. Teach For India recruits outstanding college graduates and young professionals who commit two-years to teach full-time in under resourced schools and who become lifelong leaders working from within various sectors towards the pursuit of equity in education. I n June 2009, The Teach for India fellowship program placed the fi rst cohort of Fellows in low-income municipal and private schools in Pune and Mumbai. Today, TFI is in 7 cities - Mumbai, Pune,

72
National Stock Exchange of India Limited
Delhi, Hyderabad, Chennai, Ahmedabad and Bengaluru. They have a total of 1200 Fellows and 1100 Alumni working towards eliminating educational inequity. In their current proposed project with NSE, TFI wishes to support 25 fellows in Chennai and Mumbai each.
Family Welfare Agency :Family Welfare Agency (FWA) has been, working with senior citizens in the community with the objective to provide specialized services in the fi eld of ageing and mental health. FWA has been providing specialized day care services to the elderly since 1979, using a community based approach. FWA has worked at three levels, namely: preventive, palliative and curative health care. FWA on a daily basis caters to 45 senior citizens per center. FWA has trained paramedic professionals and volunteers to work with senior citizens who have contributed to the fi eld at diff erent levels. FWA has been involved in providing direct services to the senior citizens such as health check-ups, community outreach activities, and care for home bound senior citizens, advocacy to senior citizens on state policies and many more. In the current proposed project, FWA aims to build two Elder Enrichment Care Center (EECC) which will provide need based services, such as: health, social, recreational, educational, and counselling to the senior citizens. Through the program, FWA will also provide outreach services to the home bound senior citizens in selected communities.
7. The reasons for shortfall in disbursal: In the initial phase of project implementation NSE has already addressed the minimum literacy levels of more than 5000 extremely marginalized and disadvantaged children who require intensive pedagogic and social interventions. Through the programmes conducted by Dignity Foundation, NSE has touched the lives of more than 3500 senior citizens. This being the initial phase of implementation of CSR projects after introduction of Section 135 of Companies Act 2013, the NSE Group continues to identify projects, build capacity for partner agencies and implement current projects. Capacity augmentation is a key for project identifi cation and monitoring the implementation and the Company is in the process of building the same besides implementing the existing projects through NGOs. Moreover, identifying new projects alongside the implementation of selected projects is a time consuming and knowledge oriented activity. Selecting projects which will have a measurable and meaningful social impact requires time, knowledge, skill and availability. Accordingly, the actual spend is expected to gather steam only over a period of 2-3 years after which the Company will be in position to achieve the required CSR spend. The Company remains committed to meet its CSR obligations on an annual basis to the extent feasible.
8. The implementation and monitoring of CSR Policy, is in compliance with CSR objectives and Policy of the company.
Chitra Ramkrishna Ashok Chawla Managing Director & CEO Chairman

Twenty-Fourth Annual Report FY 2015-2016
73
ANNEXURE 6 TO BOARDS’ REPORT
REPORT ON CORPORATE GOVERNANCE
I. Brief Statement on Company’s Philosophy on Code of Governance
Corporate Governance is the application of best management practices, compliance of law and commitment to values and ethical business conduct to achieve the Company’s objective of enhancing shareholder value and effective discharge of its social responsibility. National Stock Exchange of India Limited (“NSEIL” or “NSE” or “the Exchange” or the Company) is a public limited company, incorporated under the Companies Act, 1956 whose securities are not listed on any of the stock exchanges. NSEIL is also a recognised stock exchange under Securities Contracts (Regulation) Act, 1956. Therefore, NSEIL is additionally required to comply with Securities Contracts (Regulation) Act, 1956, the Rules and Regulations laid down thereunder and the directives and circulars issued by Securities and Exchange Board of India (SEBI) from time to time for the purpose of its governance. As per Regulation 35 of the Securities Contracts (Regulation) (Stock Exchanges and Clearing Corporations) Regulations, 2012 [SCR(SECC) Regulations, 2012], the disclosure requirements and corporate governance norms, specified for listed companies, has become mutatis mutandis applicable to a recognised Stock Exchange. However, NSEIL has always been involved in good governance practices and endeavours continuously to improve upon the same. In continuation of its pursuit to establish good corporate governance practice and for the information of its stakeholders, NSEIL is furnishing this Report for the financial year ended on 31st March, 2016.
II. Board of Directors
A. Composition of the Board and Category of Directors
The Board consists of 7 Directors of which 3Directors represent Shareholders, 3 are Public Interest Directors, who are chosen from among eminent persons or experts in the field of Law, Finance, Accounting, Taxation, Information Technology, Economics, Commerce, Management, etc. and 1 Executive Director. None of the Directors of the Company are inter-se related with each other.
With the approval of SEBI, the Company has appointed Mr. Ashok Chawla, a Non-executive Director as well as Public Interest Director, as Chairman of the Board of Directors.
B. Number of Board Meetings
The Board of Directors met five times during the year on May 26, 2015, August 11, 2015, November 02, 2015 and February 08, 2016 and March 17, 2016. The maximum gap between any two meetings was less than one hundred and twenty days.
C. Directors’ Attendance Record and Directorships held
As mandated by SEBI (Listing Obligations & Disclosure Requirements) Regulations, 2015, no director is a member of more than ten Board committees or act as chairperson of more than five such committees across all entities in which he or she is a Director. Table No. 1 gives the details of the composition of the Board, attendance and details of Committee Membership and Committee Chairmanships.

74
National Stock Exchange of India Limited
(1) Details of Directors along with the Directorship(s) and Chairmanship(s)/Membership(s) ofCommittees in other companies for the year 2015-16:
Name of the Director
Category Attendance Particulars No. of Directorships / Chairmanships and Committee Chairmanships / Memberships
Number of Board Meetings
LastAGM
OtherDirectorship(s)/
Chairmanship(s)*
OtherCommittee
Membership(s)**
OtherCommittee
Chairmanship(s)**Held Attended
1 Mr. Ashok Chawla, Chairman
Public Interest Director
0 0 - 1 - -
Mr. Ravi Narain, Vice Chairman
Shareholder Director
5 5 Y 9 7 1
Ms. ChitraRamkrishna, Managing Director & CEO
Executive Director
5 5 Y 7 4 1
Mr. Abhay Havaldar
Shareholder Director
4 3 N 2 - -
Mr. Prakash Parthasarathy
Shareholder Director
5 5 N 2 - -
2 Ms.Dharmishta Raval
Public Interest Director
1 1 N 8 3 -
Mr. Justice B.N. Srikrishna (Retd.)
Public Interest Director
5 4 N 2 - -
1 Nominated as Public Interest Director w.e.f March 28, 2016; 2 Nominated as Public Interest Director w.e.f February 05, 2016 Y= Yes; N=No
* The Directorships/ Committee memberships held by Directors as mentioned above, do not include Directorships/Committee memberships of Section 8 Companies.
** Memberships/Chairmanships of only the Audit Committee and Stakeholders Relationship Committee of all Public Companies have been considered.
(2) Separation of Offices of Chairman & Chief Executive Officer
Since inception, the Company has been following the principle of separation of the role of Chairman and the Chief Executive Officer. Mr. Ashok Chawla, a Public Interest Director, is the Non-executive Chairman of the Board. Ms. Chitra Ramkrishna is the Managing Director & Chief Executive Officer of the Company and is entrusted with the day to day management of the affairs of the Company. The Managing Director carries out her functions subject to superintendence, control and management of the Board of Directors of the Company.

Twenty-Fourth Annual Report FY 2015-2016
75
D. Responsibilities of the Board
The Company conducts orientation programme for new Directors covering various operations of the Exchange so as to familiarise them with the various functions being carried out by the Exchange. The details of familiarization programmes imparted to independent directors are given in the Company’s website at the following location https://nseindia.com/global/content/about_us/FPID_NSEIL.pdf. The Company also provides training in various fields such as operation, risk management, compliance, etc. to every Public Interest Director each year. Every director inducted on the Board is well known in the financial services industry and has the ability to understand basic financial statements and information and related documents/papers.
The regular updates inter-alia provided by the Company to the Board include the following:
• Annual operating plans and capital and revenue budgets and updates
• Quarterly financial results
• Status report on the Exchange operations and operations of different segments
• Minutes of the meetings of Audit Committee, other committees of the Board and also minutes of the meetings of the Board of all subsidiary companies
• Details of joint ventures, acquisitions of companies or collaboration agreements, etc.
• Details of foreign exchange exposures and the steps taken to limit the risk of adverse exchange rate movements
• Details of significant transactions and arrangements entered into by material unlisted subsidiary
• Review of market surveillance
• Other information, which is required to be placed before the Board as per SEBI (Listing Obligations & Disclosure Requirements) Regulations, 2015, is taken to the Board as and when the event occurs.
A quarterly report on compliance of various laws, rules and regulations, to which the Company is subjected, is placed before the Audit Committee for its review. The Audit Committee from time to time reviews the report and gives suggestions for improvement of compliance level/process. On its review, a consolidated report on a quarterly basis is placed before the Board at its subsequent meetings.
E. Code of Conduct
A code of conduct for Public Interest Directors and Key Management Personnel of the Company is framed. They have affirmed compliance with the Code of Conduct. As per the requirement of the SEBI (Listing Obligations & Disclosure Requirements) Regulations, 2015, the code of conduct, has been hosted on the website of the Company at the following location: https://nseindia.com/global/content/about_us/NSE_CODE_BOARD.pdf
The MD & CEO has affirmed to the Board of Directors that the Code of Conduct has been complied by the Directors and Senior Management Personnel.
F. Independent Directors
(1) Independent Directors on the Board of NSE are not less than 21 years in age and do not hold any shares in NSE.

76
National Stock Exchange of India Limited
(2) Attributes
The Company as a policy inducts only those persons as Independent Directors who have integrity, experience and expertise, foresight, managerial qualities and ability to read and understand financial statements.
(3) Tenure
The tenure of Independent Directors is in line with the directives issued by SEBI from time to time.
(4) Freedom to Independent Directors
The Company takes all possible efforts to enable the Independent Directors to perform their functions effectively. However, as per SEBI requirement, the elected directors shall not interfere in the day- to- day management of the Exchange particularly relating to the surveillance and risk management functions of the Exchange. The Company always strives to strike a balance between both the above requirements without compromising on compliance of such requirements.
G. Remuneration of Directors
In order to align compensation levels with market levels and at the same time attract, retain and motivate Directors of the quality required to run the company successfully, the compensation being paid to Managing Director is periodically reviewed and revised. The remuneration includes both fixed and variable components. The Company pays only sitting fee to its non-executive Directors. The terms and conditions of appointment of independent directors, Public Interest Directors and Shareholder Directors are governed by the provisions of the Companies Act, 2013 &Rules laid down thereunder, Securities Contracts (Regulation)(Stock Exchanges and Clearing Corproations) Regulations, 2012, SEBI (Listing Obligations & Disclosure Requirements) Regulations, 2015 and the circulars issued thereunder by SEBI. The terms and conditions of service in respect of the Managing Director of the Company are governed by the resolution passed by the shareholders, provisions of the Companies Act, 2013 & Rules laid down thereunder, Securities Contracts (Regulation)(Stock Exchanges and Clearing Corproations) Regulations, 2012 and the circulars issued thereunder by SEBI.
As per the terms of appointment, the non-executive directors are not eligible for severance pay or notice period. The Managing Director is not eligible for severance pay. The notice period for the Managing Director is three (03) months.
SEBI had laid down certain norms in terms of the compensation policy for the Key Management Personnel which are as under:-
A. The variable pay component will not exceed one third of the total pay.
B. 50 % of the variable pay will be paid on a deferred basis after 3 years.
C. ESOPs and other equity linked instruments will not form part of the Compensation.
D. The terms of compensation shall have malus and claw back arrangements
Accordingly, the Company has framed Remuneration policy in conformity with norms specified by SEBI for its employees, which include Key Management Personnel and Managing Director.
None of the Directors of the Company hold any shares or any convertible instruments in the Company.

Twenty-Fourth Annual Report FY 2015-2016
77
The details of remuneration paid to Managing Director & CEO during FY 2015-16 are given in the following table:-
(` in crores)
Name & Designation Salary &Allowances
Variable Pay
Perquisites in cash or in kind
Contribution to PF and other Funds
Total
Ms. Chitra Ramkrishna, Managing Director & CEO
4.78 1.25* 1.36 0.48 7.87
* Excludes 50% of the Variable Pay to be paid on deferred basis after 3 years
The sitting fees paid to the Non-Executive Directors for attending the meetings of the Board and Committees during the year is as follows:
Name Board meetings Board Committees’ meetings Total
No. of meetingsattended
Amount (`)
No. of meetings attended
Amount(`)
Mr. Ashok Chawla, Chairman 0 - - - -
Mr. S. B. Mathur 4 4,00,000 47 34,55,000 38,55,000
Mr. Ravi Narain 5 5,00,000 30 21,80,000 26,80,000
Mr. Abhay Havaldar 3 3,00,000 5 3,75,000 6,75,000
Mr. Prakash Parthasarathy 5 5,00,000 2 1,50,000 6,50,000
Ms. Dharmishta Raval 1 1,00,000 - - 1,00,000
Mr. Justice B.N. Srikrishna (Retd.) 4 4,00,000 5 3,75,000 7,75,000
Mr. Y.H. Malegam 5 5,00,000 58 43,15,000 48,15,000
LIC (Mr. S.B. Mainak) 2 2,00,000 2 1,50,000 3,50,000
Dr. K. R. S. Murthy 5 5,00,000 64 43,55,000 48,55,000
Mrs. Pratima Umarji 1 1,00,000 29 16,10,000 17,10,000
Dr. S.Sadagopan 5 5,00,000 21 15,75,000 20,75,000
III. Committees of the Board
(A) Audit Committee
The primary function of the Audit Committee is to assist the Board of Directors in fulfilling its oversight responsibilities by reviewing the financial information to be provided to the shareholders and others, the systems of internal controls, which the management and the Board of Directors have established, financial reporting and the compliance process. The Committee maintains open communication with statutory auditors, internal auditors and operational auditors.
The Audit Committee reviews the reports of the internal auditors, operational auditors and statutory auditors. The

78
National Stock Exchange of India Limited
terms of reference of Audit Committee shall be as per the provisions contained in the Companies Act, 2013 and SEBI (Listing Obligations and Disclosure Requirements) Regulations, 2015.
The Audit Committee consisted of three directors viz., Mr. Y. H. Malegam, Mr. Ravi Narain and Dr. S. Sadagopan as its members with Mr. Y. H. Malegam as the Chairman of Audit Committee. The Committee met four times during the year i.e., on May 26, 2015, August 11, 2015, November 2, 2015 and February 02, 2016. The details of the attendance of members of the Audit Committee at their meetings held on the above dates are given hereunder:-
Name Number of meetings held during the year
Number of meetings attended
Mr. Y. H. Malegam* 4 4
Mr. Ravi Narain 4 4
Dr. S. Sadagopan* 4 4
*ceased as members w.e.f. March 28, 2016
Consequent upon completion of term(s) of Mr. Y.H Malegam and Dr. S. Sadagopan as Public Interest Directors, they ceased to be members of the Audit Committee with effect from March 28, 2016. Mr. Ashok Chawla and Ms. Dharmishta Raval were inducted as members of the Audit Committee with effect from April 25, 2016. The Audit Committee currently comprises three Directors viz., Mr. Ashok Chawla, Ms. Dharmishta Raval and Mr. Ravi Narain as its members with Mr. Ashok Chawla as the Chairman of the Audit Committee.
The Officer responsible for the finance function, the representative of the statutory auditors, internal auditors and operational auditors are regularly invited to the Audit Committee meetings. The Company Secretary is the Secretary to the Committee.
All members of the Audit Committee have requisite accounting and financial management expertise. Mr. Y. H. Malegam, Chairman of the Audit Committee attended the Annual General Meeting (AGM) held on September 18, 2015 to answer shareholders queries.
(B) Nomination & Remuneration Committee (NRC)
The NRC laid down the policy for compensation of employees including key Management Personnel in terms of the compensation norms prescribed by the SEBI. The NRC also laid down performance evaluation criteria for the Board of Directors, individual directors (including independent directors), Committees of the Board of Directors. As per SEBI Regulations, the Compensation Committee shall consist of majority of Public Interest Directors and shall be chaired by a Public Interest Director. Further as per requirements of the Companies Act, 2013, the Company is required to constitute a Nomination and Remuneration Committee (NRC) consisting of three or more non-executive directors out of which not less than one-half shall be independent directors. The Chairman of NRC shall be different from Chairman of the Board. Accordingly, the Board constituted Nomination & Remuneration Committee for the purpose of discharging its functions required under both Companies Act, 2013 and under SEBI requirements. The Nomination & Remuneration Committee (NRC) consisted of Mr. Y.H. Malegam, Mr. S.B.Mathur, Mr. Ravi Narain, Dr. K. R. S. Murthy and Mrs. Pratima Umarji as its members with Mr. Y. H. Malegam as the Chairman of Nomination & Remuneration Committee. The Committee met six times during the year, i.e. on April 1 & 8, 2015, May 26, 2015,November 2, 2015, February 2, 2016, February 23, 2016 and March 17, 2016. The details of the attendance of members of the NRC at their meetings held on above dates are given hereunder:-

Twenty-Fourth Annual Report FY 2015-2016
79
Name Number of meetings held during the year
Number of meetings attended
Mr. Y.H. Malegam** 6 6
Mr. S.B. Mathur ** 6 6
Mr. Ravi Narain 6 6
Dr. K.R.S. Murthy ** 6 5
Mrs. Pratima Umarji* 2 2
* Ceased as members w.e.f. August 11, 2015 ** Ceased as members w.e.f. March 28, 2016
Consequent upon completion of their respective terms as Public Interest Directors,Mr. Y.H. Malegam, Mr. S.B. Mathur, Dr. K R S Murthy and Mrs. Pratima Umarji ceased to be members of Nomination & Remuneration Committee.The Committee currently comprises Mr. Justice B. N Srikrishna (Retd.), Mr. Ashok Chawla and Mr. Ravi Narain as its members with Mr. Justice B. N Srikrishna (Retd.) as its Chairman.
The details of criteria for determining qualifications, positive attributes and independence of a director are elaborately given in Annexure 4 to Board’s Report.
(C) Stakeholders Relationship Committee (SRC)
The Committee besides discharging the function of approving share transfers and deciding on any matter incidental to or connected with the transfer, also discharges the function of redressal of shareholder grievances like transfer of shares, non-receipt of Annual report, non-receipt of declared dividends, etc. The Committee consisted of four directors viz., Mr. Y. H. Malegam, Mr. S.B. Mathur, Mr. Ravi Narain and Ms. Chitra Ramkrishna as its members with Mr. Y.H. Malegam as the Chairman of the Stakeholders Relationship Committee.
The Committee met five times during the year, i.e. on September 10, 2015, November 23, 2015, December 14, 2015, February 02, 2016 and March 17, 2016. The details of the attendance of members of the SRC at their meetings held on above dates are given hereunder:-
Name Number of meetings held during the year
Number of meetings attended
Mr. Y.H. Malegam* 5 5
Mr. S.B. Mathur* 5 5
Mr. Ravi Narain 5 5
Ms. Chitra Ramkrishna 5 5
*ceased as members w.e.f. March 28, 2016
Consequent upon expiry of terms of Mr. Y. H. Malegam and Mr. S.B. Mathur as Public Interest Directors, they ceased to be members of SRC with effect from March 28, 2016. The Committee currently comprises Mr. Ashok Chawla, Mr. Ravi Narain and Ms. Chitra Ramkrishna as its members with Mr. Ashok Chawla as the Chairman of the Committee..

80
National Stock Exchange of India Limited
(D) Risk Assessment and Review Committee
The Committee carries out the identification and assessment of existing risk and also recommends risk minimisation procedures & reporting system thereof on an ongoing basis. The Committee consisted three Directors viz., Mr. Y.H.Malegam, Mr. Ravi Narain and Dr. S. Sadagopan as its members withMr. Y.H.Malegam as the Chairman of the Risk Assessment and Review Committee. The Committee met once during the year i.e, on February 02, 2016. Mr. Y. H Malegam and Mr. Ravi Narain attended the meeting. Consequent upon expiry of terms of Mr. Y. H. Malegam and Dr. S. Sadagopan as Public Interest Directors, they ceased to be members of the Committee with effect from March 28, 2016. The Committee currently comprises Mr. Ashok Chawla, Mr. Ravi Narain and Ms. Chitra Ramkrishna with Mr. Ashok Chawla as the Chairman of the Committee.
(E) Corporate Social Responsibility (CSR) Committee
The Committee was constituted, inter alia, to formulate and recommend to the Board a Corporate Social Responsibility Policy, to recommend the amount of expenditure to be incurred on the activities, and to monitor the Corporate Social Responsibility Policy of the company from time to time. The Committee consisted of Mr. Ravi Narain, Ms. Chitra Ramkrishna, Dr. K.R.S. Murthy, Mrs. Pratima Umarji and Mr. Prakash Parathasarathy with Mr. Ravi Narain as the Chairman of the Committee.
The Committee met three times during the year, i.e. on May 13, 2015, February 1, 2016 and March 17, 2016. The details of the attendance of members of the CSR Committee at their meetings held on above dates are given hereunder:-
Name Number of meetings held during the year
Number of meetings attended
Mr. Ravi Narain 3 3
Ms. Chitra Ramkrishna 3 3
Dr. K.R.S.Murthy* 3 2
Mrs. Pratima Umarji** 1 1
Mr. Prakash Parathasarathy 3 2
* ceased as member w.e.f. March 28, 2016** ceased as member w.e.f August 11, 2015
Consequent upon completion of their respective terms as Public Interest Directors,Dr. K R S Murthy and Mrs. Pratima Umarji ceased to be members of the CSR Committee.Ms. Dharmishta Raval was inducted as member of the CSR Committee with effect from April 25, 2016. The Committee currently comprises Mr. Ravi Narain, Ms. Dharmishta Raval, Mr. Prakash Parthasarathy and Ms. Chitra Ramkrishna as its members with Mr. Ravi Narain as the Chairman of the Committee.
(F) In addition to Committees covered specifically in detail above, the Company also has following Committees, namely:
(i) SEBI mandated Committees
1. Membership Selection Committee
2. Disciplinary Action Committee
3. Defaulters Committee

Twenty-Fourth Annual Report FY 2015-2016
81
4. Standing Committee on Technology
5. Sub-committee for monitoring compliance of suggestions given in SEBI Inspection Reports
6. Investor Services Committee
7. Public Interest Directors Committee
8. Arbitration Committee
9. Ethics Committee
10. Independent Oversight Committees of the Governing Board for Member regulation, Listing Functions, Trading & Surveillance Functions
11. Advisory Committee
12. Committee to decide on Compulsory Delisting
(ii) Other Functional Committees
1. Committee for Declaration of Defaults
2. Technology Budget Committee
3. Committee for Approval of Acquisition of Premises
4. Business Development Committee
5. Pricing Committee
6. Premises Advisory Committee
7. Membership Recommendation Committee
8. Sub-broker Recognition Committee
IV. Auditors
The Audit Committee considers the profile of the audit firms, qualifications and experience of partners auditing books and accounts of the Company, strengths and weaknesses, if any, of the audit firm and other related aspects and then recommends appointment of Auditor and the remuneration payable to them to the Board/shareholders. The Audit Committee also periodically discusses with the Auditors the annual audit programme and the depth and detailing of the audit plan to be undertaken by them.
The Board has appointed an external firm of Chartered Accountants as its internal auditor in order to ensure the independence and credibility of the internal audit process.
V. Secretarial Audit
The Company had engaged the services of M/s. S.N. Ananthasubramanian & Co., Practicing Company Secretaries, to conduct Secretarial Audit pursuant to the requirements of the Companies Act, 2013 and the rules laid down thereunder for the financial year ended 31st March, 2016. The report of the Secretarial Auditors is being placed before the Audit Committee and the Board. The Annual Report containing the Secretarial Audit Report is also circulated to the Shareholders of NSEIL.

82
National Stock Exchange of India Limited
VI. Management Discussion and Analysis
The Annual Report has a detailed report on Management Discussion and Analysis in respect of NSE's standalone financials for the year ended on March 31, 2016.
VII. CEO/ CFO certification
The CEO and CFO certification of the financial statements for the financial year 2015-16 is enclosed at the end of the report.
VIII. General Shareholder Information
(A) Annual General Meeting: The 23rd Annual General Meeting of the Company was held on Friday, September 18, 2015 at 11.00 a.m. at the Conference Room, Ground Floor, Exchange Plaza, Plot C-1, Block G,Bandra-Kurla Complex, Bandra (East), Mumbai-400 051
(B) Financial year: 2014-15
(C) Dividend Payment date: October 5, 2015
(D) Registrar and Transfer Agent:
The address for communication and contact details of the Registrar and Transfer Agent are as under:
M/s. Link Intime India Pvt Ltd., C-13, Pannalal Silk Mills Compound, L.B.S. Marg, Bhandup (West) Mumbai 400 078. Tel. No. + 91 22 2596 3838 and Fax No. +91 22 2594 6969.
(E) Share Transfer system: The equity shares of NSEIL are in dematerialised form. Further, the ISIN of equity shares is suspended by NSEIL to prevent transfers not approved by NSEIL pursuant to Article 63 of its Articles of Association and to ensure compliance of the provisions of Securities Contracts (Regulation) (Stock Exchanges and Clearing Corporations) Regulations, 2012. Therefore, if and when application for approval of transfer is received adherence to compliance of SECC Regulations will be ensured.
(F) Distribution of shareholding:
Distribution of Shareholding as on 31st March, 2016:
Category No. of shareholders in each category
% of the category
No. of shares held
% to the total paid up equity
capital
Individuals 7 10.00 5,21,129 1.16
Corporates-Listed 3 4.29 7,05,000 1.57
Corporates-Unlisted 10 14.29 49,08,834 10.91
Financial Institutions/Banks 11 15.71 96,97,429 21.55
Insurance Companies 7 10.00 91,53,500 20.34
Venture capital fund 4 5.71 18,83,953 4.18
Foreign holding 28 40.00 1,81,30,155 40.29
Total 70 100.00 4,50,00,000 100.00

Twenty-Fourth Annual Report FY 2015-2016
83
Top 10 Shareholders as on 31st March, 2016
Sr. No.
Name of the shareholder No. of shares held Percentage of
shareholding
1 Life Insurance Corporation of India 5,628,500 12.51
2 State Bank of India 4,587,500 10.19
3 Aranda Investments (Mauritius) Pte Ltd 2,250,000 5.00
4 GAGIL FDI Limited 2,250,000 5.00
5 GS Strategic Investments Limited 2,250,000 5.00
6 SAIF II-SE Investments Mauritius Limited 2,250,000 5.00
7 Stock Holding Corporation of India Limited 2,250,000 5.00
8 SBI Capital Markets Limited 1,950,000 4.33
9 IFCI Limited 1,747,750 3.88
10 MS Strategic (Mauritius) Limited 1,350,000 3.00
11 PI Opportunities Fund I 1,350,000 3.00
12 Tiger Global Five Holdings 1,350,000 3.00
As per Securities Contracts (Regulation) (Stock Exchanges and Clearing Corporations) Regulations, 2012, the Exchange is required to ensure that at least 51% of the equity share capital is held by public. The Exchange ensures compliance thereof.
(G) Dematerialisation of shares. The Company’s shares are fully dematerialised.
(H) Address for correspondence: The Secretarial Department, National Stock Exchange of India Limited, Exchange Plaza, Plot No. C-1, “G” Block, Bandra-Kurla Complex, Bandra (East), Mumbai – 400 051. Shareholders are requested to intimate all changes pertaining to their Bank details, email addresses, Power of Attorney, change of name, change of address, contact details, etc., to their Depository Participants (DP).
(I) Other Disclosures
(1) Basis of related party transactions
The transactions with related parties are entered in the ordinary course of business and at arm’s length price. The details of the related party transactions are disclosed in the Annual Report. The ‘Policy on dealing with related party transactions’ of the Company is available on the Website of the Company at the following address: https://nseindia.com/global/content/about_us/nseil_disc_others.htm
(2) Details of non-compliance by the Company, penalties, strictures imposed on the Company by SEBI or any other statutory authority on any matter related to capital markets
None

84
National Stock Exchange of India Limited
(3) Whistle Blower Policy
The Company has established a mechanism for Directors and employees to report concerns about unethical behavior, actual or suspected fraud, or violation of the code of conduct or ethics policy or law. The Company also provides for adequate safeguards against victimisation of employees who avail of the mechanism and also allows direct access to the Chairman of Audit Committee (for financial matters) or Chairman of the Ethics committee (for other matters) in exceptional cases. No personnel has been denied access to the audit committee. Details of the Policy have been disclosed on the website of the Exchange at the following address: https://nseindia.com/global/content/about_us/NSE_dtls_VM.pdf
(4) Compliance with the non-mandatory requirements [ Part E of Schedule II Regulation 27(1) of the SEBI (Listing Obligations & Disclosure Requirements) Regulations, 2015 ]
In addition to the above, NSEIL also complies with non-mandatory requirements of Part E of Schedule II Regulation 27(1) of the SEBI (Listing Obligations & Disclosure Requirements) Regulations, 2015 like maintaining a Chairman’s office at the company’s expense, reimbursement of expenses incurred by Chairman in performance of his duties, dissemination of financial results to the shareholders on a quarterly basis, unqualified financial statements, separate posts of chairperson and chief executive officer, etc.
(5) Subsidiary Companies
As per SEBI (Listing Obligations and Disclosure Requirements), Regulations, 2015, “material subsidiary” shall mean a subsidiary whose income or net worth exceeds twenty percent of the consolidated income or net worth respectively, of the listed entity and its subsidiaries in the immediately preceding accounting year.
The said Regulations lay down corporate governance requirements with respect to subsidiary of listed entity. NSEIL has one ‘material unlisted Indian subsidiary’ i.e National Securities Clearing Corporation Limited (NSCCL). The financial statements, in particular the investments made, by the subsidiary companies are reviewed by the Audit Committee of NSEIL. A statement of all significant transactions and arrangements entered into by NSCCL is periodically brought to the attention of the Board of Directors of NSEIL. The minutes of the meetings of the Board of Directors of all the subsidiary companies of NSEIL are also periodically brought to the meeting of the Board of Directors of NSEIL for its noting. The ‘Policy for determining material subsidiaries’ of the Company is available on the Website of the Company at the following address: https://nseindia.com/global/content/about_us/nseil_disc_others.htm
(6) Disclosure of Accounting Treatment in the preparation of Financial Statements.
NSEIL follows the guidelines of Accounting Standards laid down by the Central Government under the provisions of Section 133 of the Companies Act, 2013 in the preparation of its financial statements.
(7) Communication with Shareholders
The data related to quarterly and annual financial results, shareholding pattern, Board meetings, general meetings, terms and conditions of appointment of independent directors, the details of vigil mechanism, etc., are provided on the web-site of NSE for the information of the shareholders at the following location: https://nseindia.com/global/content/about_us/nseil_disc_others.htm

Twenty-Fourth Annual Report FY 2015-2016
85
The Exchange disseminates all material information to its shareholders through periodical communications. The financial results are published periodically in the newspapers as per the requirements of SEBI (LODR) Regulations, 2015.
Annual Report: Annual report containing, inter alia, Audited Accounts, Directors’ Report, Report on Corporate Governance, Management Discussion & Analysis and other material and related matters/information are circulated to the shareholders and others entitled thereto.
(8) Redressal of shareholders’ complaints
The Company has already constituted a Stakeholders Relationship Committee to look into and redress Shareholders and investor complaints. During the year, the Company did not receive any grievance from its shareholder(s) in respect of transfer of shares, non-receipt of Annual Report, non-receipt of declared dividends, etc.
IX General Body Meetings
Location, date and time of the general meetings held in the last three years till March 31, 2016:-
Type of meeting Date Time Venue Special Resolution passed
23rd Annual General Meeting
September 18, 2015 11:00 a.m. Exchange Plaza, Bandra-Kurla Complex Bandra (East) Mumbai- 400 051
-
22nd Annual General Meeting
August 8, 2014 12:30 p.m. Exchange Plaza, Bandra-Kurla Complex Bandra (East) Mumbai- 400 051
-
21st Annual General Meeting
September 26, 2013 10.00 a.m. Exchange Plaza, Bandra-Kurla Complex Bandra (East) Mumbai- 400 051
• Re-appointment of Auditors under Section 224A
• Alteration of Articles of Association of the Company.
The Company did not pass any resolution through postal ballot in the last year. The requirement of passing any resolution by postal ballot is not applicable to NSEIL as the number of shareholders of NSEIL is less than 200.
X Certificate on compliance of corporate governance norms
As required in SEBI(Listing Obligations & Disclosure Requirements) Regulations, 2015 read with Regulation 35 of Securities Contracts(Regulation) (Stock Exchanges and Clearing Corporations) Regulations, 2012, NSEIL has, obtained a certificate regarding the compliance of conditions of Corporate Governance therein from a Practicing Company Secretary. The same is given as an Annexure to the Directors’ Report.
---
86
National Stock Exchange of India Limited
DECLARATION REGARDING COMPLIANCE BY BOARD MEMBERS AND SENIOR MANAGEMENT PERSONNEL WITH THE COMPANY’S CODE OF CONDUCT
I hereby confirm that the Company has obtained from all the members of the Board and Senior Management
Personnel, affirmation that they have complied with the code of conduct for the Financial Year 2015-16.
For the purpose of this declaration, Senior Management Personnel means Key Management Persons appointed
under SCR(SECC) Regulations, 2012 and Key Managerial personnel appointed under the Companies Act, 2013 as on
March 31, 2016.
Mumbai, Chitra Ramkrishna
12.05.2016 Managing Director & CEO

Twenty-Fourth Annual Report FY 2015-2016
87
MANAGEMENT DISCUSSION & ANALYSIS(in respect of NSE's standalone financials for the year ended March 31, 2016)
Economic & Business Environment
During FY15-16, the global economy continued its struggle with recovery, as evidenced by the subdued growth witnessed across all major economies during the period under consideration. Advanced economies such as the US and UK started the fi nancial year on an upbeat mood, but were unable to maintain the momentum despite positive signals such as robust job creation and soft monetary policy. Economic activity in most of the euro area was adversely impacted by socio-economic and political developments. Japan also struggled to meet growth expectations primarily on account of falling private consumption.
Most emerging markets economies, barring India, have also struggled to keep up the growth momentum, mainly due to factors such as deteriorating structural bottlenecks, weak external demand, and lack of external fi nancing. China’s economic performance during the last one year has been a topic of interest among economists and analysts. This is because China is transforming into a consumer driven economy from an investment driven one, due to which the market widely believes that its GDP growth rate would be lower than what it was previously. It is expected that the Chinese economy would, in the coming years, re-balance to a growth of below 7% levels, as against growth rates of 10% seen during the previous two decades. As regards other emerging market economies in Middle East, Eastern Europe and Latin America, falling prices of oil and other commodities such as copper, iron ore and steel, has deteriorated their growth prospects.
India, however, remained a bright spot in the global economy and the fastest growing major economy in the world. As per the latest advanced estimates of GDP released by the Central Statistics Offi ce, India’s GDP grew in the range of 7.6% or so. While the growth rates for industry and agricultural sectors improved in the range of to 7.4% and 1.1% respectively in FY15-16 (compared to 5.9% and negative 0.3% respectively in FY14-15), the growth in the services sector declined marginally to 9.2% (compared to 10.3% in FY14-15).
Monthly infl ation, as measured by the Consumer Price Index (CPI), has fl uctuated around RBI’s target level of 2-6% during FY15-16, with average infl ation at 4.9% as compared to 5.8% during FY14-15. The primary reasons for this benign infl ationary environment during FY15-16 were as follows: (1) low capacity utilization of the Indian economy, (2) plunging input prices especially oil, (3) disciplined increases in minimum support prices (MSPs) for cereals and (4) dumping of Chinese imports. This suggests that the eff ective stance of RBI’s monetary policy could be more relaxed in the coming months of FY17, which will surely give a boost to economic activity in the country.
On the external front, India’s current account defi cit (CAD) to GDP ratio worsened marginally to 1.4% in FY15-16 from 1.3% in FY14-15. India’s trade defi cit, on the other hand, decreased substantially by 16.51% in FY15-16 to USD 118.01 billion compared to USD 137.49 billion in the previous fi scal. This was primarily on account of a large fall in imports to USD 379.07 from USD 447.60 during the period under consideration. Meanwhile, exports fell at a much lower rate than imports, declining to USD 261.05 billion from USD 310.11 billion. Lower trade defi cit and modest growth in invisibles resulted in the low CAD. According to the Economic Survey 2015-16, the CAD, as a proportion of GDP, is likely to be in the low range of 1-1.5 per cent during the coming year.
India’s foreign exchange reserves were also at an all-time high of USD 355.6 billion at end-March 2016 (compared to USD 341.6 billion at end-March, 2015). As a result, the import cover ratio – an important indicator of a country’s external sector vulnerability – has risen to over 10 months.

88
National Stock Exchange of India Limited
Outlook
The outlook for the Indian economy is currently optimistic, especially in the backdrop of relatively strong macroeconomic fundamentals such as (1) low current account defi cit and rising forex reserves, (2) low infl ation, and (3) high GDP growth rate, as compared to other major emerging market economies such as Brazil, Russia and China. This will assist India in dealing with the prevailing uncertainty and emerging risks in the global economy and fi nancial markets. In both FY16-17 and FY17-18, the IMF has recently projected that the Indian economy will grow at a rate of 7.5%, primarily supported by a boost in private consumption and recovery of industrial activity.
With strong innate economic fundamentals, India continues to be the highly attractive destination for investment, globally. The Advanced Economies are yet to fully recover from the consequences of the global fi nancial crisis, although the medium-term outlook looks positive. On the other hand, the medium-term outlook for the EMEs appears subdued. Overall, the sluggish global recovery so far has warranted successive downward adjustments to forecasts the world over, raising concerns of ‘secular stagnation’. Against this backdrop, however, the outlook for the Indian economy looks promising and in fact, the International Monetary Fund (IMF) has projected India as the only bright spot. The stronger macroeconomic fundamentals are expected to further bolster the investment climate in India. This would have a signifi cantly positive impact on the capital markets. Additionally, various policy level steps are also expected to fetch positive eff ect on the growth of the Indian Capital market.
Similarly, existing products and asset classes which would continue to evince interest, it is expected that there would be attraction towards new asset classes as well new products and services, technological innovation, robust risk management system and strong regulatory framework would continue to be the key drivers for the securities market.
Risks and concerns
While the fundamentals of Indian Economy remain strong, the domestic capital market and especially the infl ow of foreign funds are to a large extent susceptible to the developments in the global economy. However, with key policy changes and domestic growth expectations within the country and improvement in global economy these risks would be largely mitigated.
Internal control systems and their adequacy
The Company has well established internal control systems commensurate with the size and nature of its business and are adequate to ensure compliance with various internal processes and procedures as well as with various statutory and legal requirements. The Company has appointed reputed fi rms of Chartered Accountants to review the eff ectiveness of the internal control systems and submits its observations, if any to the Audit Committee of the Board for its review / recommendations.
Financials
The fi nancial statements have been prepared in compliance with the requirements of the Companies Act, 2013, including revised Schedule VI, Generally Accepted Accounting Principles (GAAP) in India and as per the applicable Accounting Standards laid down by the Institute of Chartered Accountants of India. A well known and reputed fi rm of Chartered Accountants performs the audit and they have confi rmed that our practices are as stringent and complete as internationally. Consolidated Financial statements have also been presented.

Twenty-Fourth Annual Report FY 2015-2016
89
Financial performance (2015-16)
During the year 2015-16, the total revenue has increased by around 7% from ̀ 1,918.12 crores for the year 2014-15 to ` 2,044.54 crores for the year 2015-16.
The total expenditure for the year 2015-16 was ` 1,456 crores as compared to ` 801.57 crores for the year 2014-15, an increase of around 81% over the previous year.
The total Profi t Before tax for the year 2015-16 was ` 588.54 crores as against ` 1,116.55 crores for the year 2014-15, a decrease of around 47% over the previous year. The decrease in Profi t Before Tax was due to provision for an amount of ` 761.52 crores towards contribution to NSCCL Core Settlement Guarantee Fund as per SEBI Circular dated May 4, 2016.
The total Provision for tax (including deferred tax) for the year 2015-16 was ` 149.21 crores as against ` 336.87 crores for the year 2014-15.
The total Profi t after tax for the year 2015-16 was ` 439.33 crores as against ` 779.68 crores for the year 2014-15, a decrease of around 44% over the previous year.
Operating Revenues
Transaction charges
During the year, upward trend continued of around 9.30% in the income from Transaction charges from `1,075.21 crores for the year 2014-15 to ` 1,175.01 crores for the year 2015-16. The average daily turnover on the Exchange during the year 2015-16 was ` 17,214 crores in Cash Market (CM segment) as against ` 17,788 crores for the year 2014-15 indicating a decline of around 3%. In F&O segment the average daily turnover (billable) for the year 2015-16 was ` 51,823 crores as against ` 52,380 crores for the year 2014-15 indicating a decline of around 1%. In Currency Derivatives Segment the average daily turnover (billable) for the year 2015-16 was ` 11,386 crores as against ` 9,458 crores for the year 2014-15 indicating an increase of around 20%.
Listing Fees
During the year, there was an increase of around 5% in the income of Listing Fees from ` 47.91 crores for the year 2014-15 to ` 50.36 crores for the year 2015-16. The Exchange as of March 31, 2016 had 1,808 listed companies. The total market capitalisation of these companies as of March 31, 2016 stood at around ` 93 lakhs crores.
Book Building Fees
During the year, there was a healthy increase in the total book building fess of around 158% from ` 3.30 crores for the year 2014-15 to ` 8.50 crores for the year 2015-16.
Interest & Other Investment income
During the year 2015-16, the total investment income increased by around 3% from ` 608.07 crores for the year 2014-15 to ` 626.63 crores for the year 2015-16. The increase was mainly on account of dividend from subsidiary companies for the year 2015-16 from ` 112.50 crores to ` 146.25 crores.
NSE’s Certifi cation in Financial Markets (NCFM)
The income from NCFM activity stood at ` 19.01 crores for the year 2015-16. Also, the total number of candidates taking examination during the year 2015-16 was around 46,000.

90
National Stock Exchange of India Limited
Other Operating Revenues
During the year 2015-16, the other operating revenues has increased by around 24% from ` 107.59 crores for the year 2014-15 to ` 133.04 crores for the year 2015-16.
Other Income
During the year 2015-16, the other income had declined by around 39% from ` 53.74 crores for the year 2014-15 to ` 32.99 crores for the year 2015-16. The decline was due to decrease in rental income from ` 50.72 crores for the year 2014-15 to ` 20.64 crores for the year 2015-16.
Expenditure
IT & Telecom expenses
Technology is the backbone of our business and also the key diff erentiator. The Exchange continued to invest in the state of the art technology in diff erent areas of its business keeping clear focus on its cost effi ciency. Accordingly, during the year, the total IT & Telecom expenses for the year 2014-15 increased by around 6% from ` 174.98 crores for the year 2014-15 to ` 195.88 crores for the year 2015-16.
Other expenses
During the year 2015-16 other expenses has increased by around 0.85% from ` 187.61 crores for the year 2014-15 to `186.00 crores for the year 2015-16.
Clearing & Settlement charges
National Securities and Clearing Corporation Limited (NSCCL), a wholly owned subsidiary of the Exchange, carries out the clearing and settlement of the trades executed in the CM, F&O and CD segments. Consequent to the increase in income from transaction charges, the clearing & settlement charges for the year 2015-16 paid to NSCCL increased by around 8% i.e. from ` 91.18 crores in FY 2014-15 to ` 98.54 crores in FY 2015-16.
Employee cost
The Exchange recognises the value of its human capital deployed at all levels. To continue to provide best in class services to its members and other market participants it is essential for the Company to attract and retain the best talent available. In this direction, the Company continues to take various initiatives to follow HR best practices and also keeps benchmarking it with other forward looking organisations. During the year 2015-16, the Company has taken number of HR initiatives in the areas of employee developments and training, harnessing knowledge and skill levels as well as various staff welfare measures etc. During the year 2015-16, the total employee strength remained stable as compared to the year 2014-15 and the employee related expenses stood at ` 108.39 crores which was ` 91.79 crores for the year 2014-15. For the year 2015-16, the total employee cost as a percentage to total income was 5.30% and as a percentage of expenditure was 16% which is comparable to the industry standards.
Depreciation
Depreciation increased by around 20% from ` 85.79 crores for the year 2014-15 to ` 103.09 crores for the year 2015-16.

Twenty-Fourth Annual Report FY 2015-2016
91
Financial Statement as on March 31, 2016
Share Capital
The total paid up capital of the Company as on March 31, 2016 is ̀ 45 crores divided in to 4,50,00,000 equity shares of ` 10 each.
Reserves & Surplus
The total Reserves & Surplus as on March 31, 2016 is ` 5,231.74 crores comprising of Share Premium of ` 40 crores, Investor Compensation reserves ` 10 crores, staff welfare reserves of ` 1.50 crores, General reserve of ` 3,690 crores and balance in P&L A/c of ` 1,490.24 crores.
Thus the total Net worth of the Company as on March 31, 2016 is ` 5,276.74 crores and the book value is ` 1,172.61 per share
Deposits from members (Unsecured)
The total deposits from members as on March 31, 2016 stood at ` 1,051.96 crores as against ` 1,056.60 crores as on March 31, 2015.
Fixed Assets
Total Gross Block as on March 31, 2016 was ` 1,289.39 crores. Total Accumulated depreciation up to March 31, 2016 was ` 748.30 crores. Net fi xed Assets (including Capital W.I.P) were ` 541.09 crores. As part of the total investments in technology areas, during the year 2015-16 the total additions to fi xed assets were ` 126.21 crores mainly pertaining to the Trading systems, Computer system, telecom equipment’s and computer software. Total deletions at cost were at ` 2.79 crores.
Investments
The prudential policy of the Company permits to invest both long term and short term surplus funds in to deposits of highly rated banks, bonds issued by the Central / State governments, institutions and various corporates and into the debt oriented schemes of high performing mutual funds. As on March 31, 2016 the total non-current investments were ̀ 3,577.91 crores as against ̀ 2,050.92 crores as on March 31, 2015, increase of ̀ 1,526.99 crores. Current investments were ̀ 1,545.20 crores as on March 31,2016 as against ̀ 2,040.79 crores as on March 31, 2015, an decrease of ` 495.59 crores.
Other Non-Current and Current Assets
Total other assets (non-current and current) as on March 31, 2016 stood at ` 2,317.93 crores comprising of interest accrued on investments and Fixed Deposits amounting to ` 235.66 crores, Trade Receivables amounting to ` 224.50 crores and Cash and Bank balances in Current and Fixed Deposits amounting to ` 1,472.48 crores and Loans advances of ` 347.75 crores.
Other Non-Current and Current Liabilities
Total other liabilities (non-current and current) as on March 31, 2016 stood at ` 1,635.69 crores mainly comprising of dues from subsidiary companies ` 12.13 crores, security deposits as per listing agreement amounting to ` 46.49crores, Securities Transaction Tax of ` 166.35 crores, provision for leave encashment of ` 12.29 crores, Contribution payable to NSCCL Core SGF ` 690.51 crores other current liabilities amounting to ` 707.92 crores.

92
National Stock Exchange of India Limited
Taxation (Eff ective Tax rate to be updated)
The total Provision for tax (including deferred tax) for the year 2015-16 was ` 149.21 crores as against ` 336.87 crores for the year 2014-15. Though the present Indian Corporate tax rate is 34.608% comprising of base rate and surcharge and cess, due to investments into various debt schemes of mutual funds the eff ective tax rate works out to 25.35%
Event occurring after the balance sheet date
In accordance with Regulation 33 of Securities Contracts (Regulations) (SECC) Regulations, 2012 (The Regulations) issued on June 20, 2012, every recognised stock exchange is required to transfer 25% of its annual profi ts every year to a fund of the recognised clearing corporation(s) which clears and settles trades executed on that stock exchange to guarantee settlement of trades. SEBI, in its Press Release No.225/2015 dated September 1, 2015, stated that the report of the Committee on Clearing Corporations was placed before the SEBI Board on August 24, 2015 and that while the SEBI Board took note of the report, it approved the proposal to seek public comments on the recommendations of the Committee. Pending fi nal notifi cation based on the decision which was to be taken by SEBI after the public comments were received, NSE has made a provisional appropriation of ` 527.19 crores (net of ` 170 crores transferred to Core SGF as at March 31, 2015, to be suitably adjusted in the light of the fi nal SEBI notifi cation in the matter.
SEBI has, in its Circular No. SEBI/HO/MRD/DRMNP/CIR/2016/54 dated May 04, 2016, since notifi ed that the amounts carried forward in the Short Term provision in respect of the period upto March 31, 2015 have to be transferred by the Stock Exchange to the Core SGF maintained by the Clearing Corporation within one month of the date of issuance of the notifi cation and that the amounts to be transferred by the Stock Exchange to the Core SGF maintained by the Clearing Corporation in respect of the period from April 01, 2015 till the date of amendment of the Regulation 33 of SECC Regulation, 2012 within such time as to be specifi ed by SEBI.
Accordingly, the provisional appropriations made out of profi ts aggregating to ` 527.19 crores shown under the head Short Term Provision in the Balance Sheet as on March 31, 2015 have been reversed and a provision for an equivalent amount has been made during the year. Further a provision of ` 163.33 crores has also been made during the year for the period April 01, 2015 till March 31, 2016 (net of ` 71 crores transferred to Core SGF for the year).

Twenty-Fourth Annual Report FY 2015-2016
93
CEO – CFO CERTIFICATE
To,The Board of DirectorsNational Stock Exchange of India Limited
We, Chitra Ramkrishna, Managing Director & CEO and Yatrik Vin, Chief Financial Officer of the National Stock Exchange of India Limited hereby certify to the Board that:
a. We have reviewed financial statements and the cash flow statement for the year ended on March 31, 2016and that to the best of our knowledge and belief :
i. these statements do not contain any materially untrue statement or omit any material fact or contain statements that might be misleading;
ii. these statements together present a true and fair view of the Company’s affairs and are in compliance with existing accounting standards, applicable laws and regulations.
b. There are, to the best of our knowledge and belief, no transactions entered into by the company during the year which are fraudulent, illegal or violative of the Company’s code of conduct.
c. We accept responsibility for establishing and maintaining internal controls for financial reporting and that we have evaluated the effectiveness of internal control systems of the company pertaining to financial reporting and we have disclosed to the auditors and the Audit Committee, deficiencies in the design or operation of such internal controls, if any, of which we are aware and the steps we have taken or propose to take to rectify these deficiencies.
d. We have indicated to the auditors and the Audit committee
i. significant changes, if any, in internal control over financial reporting during the year;
ii. significant changes, if any, in accounting policies during the year and that the same have been disclosed in the notes to the financial statements; and
iii. instances of significant fraud of which we have become aware and the involvement therein, if any, of the management or an employee having a significant role in the Company’s internal control system over financial reporting.
Mumbai Chitra Ramkrishna Yatrik VinMay 12, 2016 Managing Director & CEO Chief Financial Officer

94
National Stock Exchange of India Limited
S.N.ANANTHASUBRAMANIAN & CO.COMPANY SECRETARIES10/26, Brindaban, Thane 400 601 | Tel 2534 5648 / 2543 2704 | Fax 2539 0292 | Email [email protected] I Website www.snaco.net
CORPORATE GOVERNANCE COMPLIANCE CERTIFICATE
To,The Members,National Stock Exchange of India Limited, CIN: U67120MH1992PLC069769Exchange Plaza, C-1, Block G,Bandra Kurla Complex,Bandra (East), Mumbai 400051
We have examined all relevant records of National Stock Exchange of India Limited (the Company) for the purpose of certifying compliance of the disclosure requirements and corporate governance norms as specifi ed for the Listed Companies for the fi nancial year ended 31st March 2016. In terms of Regulation 35 of the Securities Contracts (Regulation)(Stock Exchanges and Clearing Corporations) Regulations, 2012, the disclosure requirements and corporate governance norms as specifi ed for listed companies have become mutatis mutandis applicable to the recognized Stock Exchanges. We have obtained all the information and explanations to the best of our knowledge and belief which were necessary for the purpose of this certifi cation.
The compliance of the conditions of Corporate Governance is the responsibility of the Management. Our examination was limited to the procedures and implementation thereof, adopted by the Company for ensuring the compliance of the conditions of the Corporate Governance. This certifi cate is neither an assurance as to the future viability of the Company nor of the effi cacy or eff ectiveness with which the management has conducted the aff airs of the Company.
In our opinion and to the best of our information and according to the explanations given to us, we certify that the Company has complied with disclosure requirements and corporate governance norms as specifi ed for Listed Companies.
For S N ANANTHASUBRAMANIAN & COCompany Secretaries
Firm Registration No. P1991MH040400
S N AnanthasubramanianPartner
COP No. 1774Date: Place: Thane

Twenty-Fourth Annual Report FY 2015-2016
95
ANNEXURE 7(I) TO DIRECTORS’ REPORT
STATEMENT PURSUANT TO RULE 5(2) OF THECOMPANIES (APPOINTMENT AND REMUNERATION OF MANAGERIAL PERSONNEL) RULES, 2014
Sr. No.
Name & Qualifi cations Age in
years
Designation/ Nature of Duties
Remuneration Received (`)
Experience (No.of years)
Date of Commencement of Employment
Last Employment
Gross Net
1 Ms. Chitra Ramkrishna #B. Com, FCA
53 Managing Director & CEO
78669422 36043630 31 October 15, 1994 Dy. Manager, Industrial Development Bank of India
2 Mr. J. Ravichandran # B. Com, B.L.,FCS
55 Group President & Company Secretary
36838528 15182860 30 August 12, 1994 Dy. Secretary & Manager (Legal), Raymond Synthetics Limited
3 Mr. Yatrik VinM.Com, AICWA
49 Chief Financial Offi cer - Group Accounts and Finance
18675829 9305096 29 February 21, 2000
Manager (Finance & Accounts), Godrej & Boyce Mfg. Co. Ltd.
4 Mr. Ravi VaranasiB. Sc., ACA
53 CEO - SBU Education and Group Head
20265385 12296550 29 July 3, 1995 Sr. Dy. Manager, Vysya Bank Limited
5 Dr.V. R. Narasimhan # *M. Com., ACS, MBA, Ph.D
59 Chief Regulatory Offi cer
17388357 11334720 32 May 30, 2013 Sr. Vice President, Kotak Mahindra Bank Ltd.
6 Mr. Chandrashekhar Mukherjee, B. Com., PGPM & IR
52 Chief People Offi cer
15849563 9856278 23 April 9, 2010 Associate Vice PresidentBennett Coleman & Company Ltd.
7 Ms. Kamala KB.Com, FCA
50 Head - Mutual Funds
15673879 6609392 26 March 16, 2006 Vice President (Risk Mgmt. & Ops.), IL&FS Investsmart Limited
8 Mr. Hari K. AICWA, ACS
49 Chief Business Offi cer
17293072 9349042 25 May 29, 1995 Cost Accountant, KCP Ltd.
9 Mr. Suprabhat Lala B. Sc.
49 Chief Vigilance Offi cer
13298846 8199718 26 October 1, 2001 Sr. Vice President, Geojit Securities Ltd.
10 Mr. Nirmal Mohanty M.A., MBA
57 Chief Economist 10830180 6698793 29 April 1, 2009 Principal /Vice President, Infrastructure Development Finance Company Ltd.
11 Mr.M Vasudev RaoB. Com., LL.B, FCS
48 General Counsel 9869343 6338738 20 November 1, 2012
Associate Vice PresidentBennett Coleman & Company Ltd.
12 Mr. Kashinath Katakdhond B.E., MBA, GEMBA(US)
47 Product Head - NBF
12365959 8253936 21 September 12, 2013
Sr. Vice President, Citigroup
13 Mr. Mahesh HaldipurB.E. (Civil), AMIE
56 Head - Premises and Admin
10494798 5620786 33 April 25, 1995 Project Engineer, TataElectric CompanyLimited
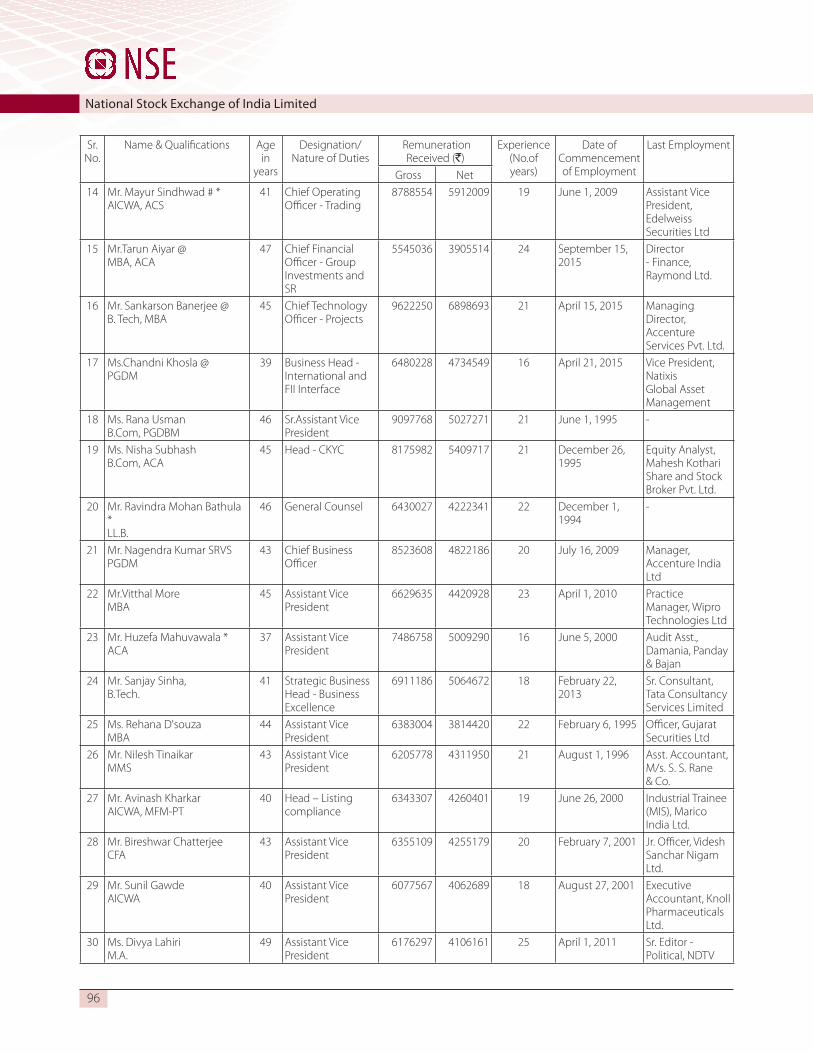
96
National Stock Exchange of India Limited
Sr. No.
Name & Qualifi cations Age in
years
Designation/ Nature of Duties
Remuneration Received (`)
Experience (No.of years)
Date of Commencement of Employment
Last Employment
Gross Net
14 Mr. Mayur Sindhwad # *AICWA, ACS
41 Chief Operating Offi cer - Trading
8788554 5912009 19 June 1, 2009 Assistant Vice President, Edelweiss Securities Ltd
15 Mr.Tarun Aiyar @MBA, ACA
47 Chief Financial Offi cer - Group Investments and SR
5545036 3905514 24 September 15, 2015
Director - Finance, Raymond Ltd.
16 Mr. Sankarson Banerjee @B. Tech, MBA
45 Chief Technology Offi cer - Projects
9622250 6898693 21 April 15, 2015 Managing Director, Accenture Services Pvt. Ltd.
17 Ms.Chandni Khosla @PGDM
39 Business Head - International and FII Interface
6480228 4734549 16 April 21, 2015 Vice President, Natixis Global Asset Management
18 Ms. Rana UsmanB.Com, PGDBM
46 Sr.Assistant Vice President
9097768 5027271 21 June 1, 1995 -
19 Ms. Nisha SubhashB.Com, ACA
45 Head - CKYC 8175982 5409717 21 December 26, 1995
Equity Analyst, Mahesh Kothari Share and Stock Broker Pvt. Ltd.
20 Mr. Ravindra Mohan Bathula *LL.B.
46 General Counsel 6430027 4222341 22 December 1, 1994
-
21 Mr. Nagendra Kumar SRVSPGDM
43 Chief Business Offi cer
8523608 4822186 20 July 16, 2009 Manager, Accenture India Ltd
22 Mr.Vitthal More MBA
45 Assistant Vice President
6629635 4420928 23 April 1, 2010 Practice Manager, Wipro Technologies Ltd
23 Mr. Huzefa Mahuvawala *ACA
37 Assistant Vice President
7486758 5009290 16 June 5, 2000 Audit Asst., Damania, Panday & Bajan
24 Mr. Sanjay Sinha, B.Tech.
41 Strategic Business Head - Business Excellence
6911186 5064672 18 February 22, 2013
Sr. Consultant, Tata Consultancy Services Limited
25 Ms. Rehana D'souzaMBA
44 Assistant Vice President
6383004 3814420 22 February 6, 1995 Offi cer, Gujarat Securities Ltd
26 Mr. Nilesh TinaikarMMS
43 Assistant Vice President
6205778 4311950 21 August 1, 1996 Asst. Accountant, M/s. S. S. Rane & Co.
27 Mr. Avinash Kharkar AICWA, MFM-PT
40 Head – Listing compliance
6343307 4260401 19 June 26, 2000 Industrial Trainee (MIS), Marico India Ltd.
28 Mr. Bireshwar ChatterjeeCFA
43 Assistant Vice President
6355109 4255179 20 February 7, 2001 Jr. Offi cer, Videsh Sanchar Nigam Ltd.
29 Mr. Sunil GawdeAICWA
40 Assistant Vice President
6077567 4062689 18 August 27, 2001 Executive Accountant, Knoll Pharmaceuticals Ltd.
30 Ms. Divya LahiriM.A.
49 Assistant Vice President
6176297 4106161 25 April 1, 2011 Sr. Editor - Political, NDTV

Twenty-Fourth Annual Report FY 2015-2016
97
Sr. No.
Name & Qualifi cations Age in
years
Designation/ Nature of Duties
Remuneration Received (`)
Experience (No.of years)
Date of Commencement of Employment
Last Employment
Gross Net
31 Mr. Umesh Jain @*B.Tech
46 Chief - Technology 7896341 5320351 16 September 3, 2012
President, Yes Bank Ltd.
32 Mr. Chandrakant Upadhyay @ACA, LL.M
52 Assistant Vice President
3068014 1573031 24 September 16,2004
Executive Director,Saurashtra Kutch StockExchange Limited
33 Mr.Amol Mahajan @ACA
46 Assistant Vice President
3795018 2516109 22 October 30, 2015 Asst. Manager-Taxation, Total Finaelf India Ltd.
34 Mr. Bipin Singh @LL.B.
48 Vice President 1549931 1206538 25 August 3, 2015 Vice President, Deutsche Bank
35 Mr. Sachin Dhar @MBA
39 Chief Manager 1227450 1019408 14 August 16, 2006 Team Leader - Ops, Intelenet Global Services
36 Piyush Mehta @CFA
37 Chief Manager 1921768 1457577 15 November 1, 2013
Associate, Bank of America
Notes :1 Gross Remuneration includes Salary and other benefi ts, Company’s contribution to Provident Fund, Pension, Superannuation Fund,
taxable value of perquisites etc. Net remuneration represents gross remuneration less Company’s contribution to Provident, Pension and Superannuation Funds, taxable value of perquisites, profession tax and income tax. Where applicable, the amounts also include certain allowances accrued during previous year(s) but claimed in the current year.
2 Besides the above, leave encashment amounting to ` 5043025, ` 2552301, ` 993797, ` 744697, ` 251704, ` 1606303 and ` 784080 was paid to Mr.J Ravichandran, Ms. Kamala, Mr.Chandrakant Upadhyay, Mr. Umesh Jain, Mr. M Vasudev Rao, Ms. Rehana D’souza and Mr. Amol Mahajan respectively.
3 Ms. Chitra Ramkrishna was appointed as Managing Director & CEO for a period of fi ve years with eff ect from April 1, 2013.4 Employees, whose names were marked with # are Key Management Personnel under SCR (SECC) Regulations, 2012 of SEBI. Their
remuneration excludes 50% of their Variable Pay to be paid on deferred basis after 3 years.5 Other employees are in permanent employment of the Company on contractual basis governed by the employment terms &
conditions and service rules. Employees whose names have been marked with @ were employed with the Company for part of the year.
6 None of the employees mentioned above is a relative of any Director.7 Employees, in respect of whom Rule 5(2) applies but are on deputation to subsidiary company and in respect of whom the
remuneration is recovered are shown under statement prepared under Rule 5(2) of that subsidiary company(ies) to avoid duplication. Employees whose names have been marked with * are also on deputation to subsidiary company(ies) and in respect of whom the proportionate remuneration recovered from the subsidiary company(ies) is shown in the statement prepared under Rule 5(2) of that subsidiary company(ies).
8 None of the employees is holding equity share(s) in the Company within the meaning of clause (iii) of sub-rule 2 of Rule 5 of the Companies (Appointment and Remuneration of Managerial Personnel) Rules, 2014.
9 The Company does not have any Employees Stock Option Plan(ESOP) Scheme for its employees.

98
National Stock Exchange of India Limited
ANNEXURE-7(II) TO BOARD’S REPORT
DISCLOSURES PURSUANT TO SECTION 197 (12) OF THE COMPANIES ACT, 2013 READ WITH RULE 5(1) OF THE COMPANIES (APPOINTMENT AND REMUNERATION OF MANAGERIAL PERSONNEL) RULES, 2014
The disclosures pertaining to remuneration in terms of Section 197 (12) of the Companies Act, 2013 read with Rule 5(1) of the Companies (Appointment and Remuneration of Managerial Personnel) Rules, 2014 are as per the details provided below:-
(i) Ratio of Remuneration of each director to the median remuneration of the employees of the Company for the Financial Year
The ratio of remuneration of the Managing Director& Chief Executive Officer to the median remuneration of the employees of the Company for the financial year is 83.16X.
(ii) The percentage increase in remuneration of each director, Chief Financial Officer, Chief Executive Officer, Company Secretary or Manager, if any, in the financial year
The percentage increase in remuneration of Managing Director & Chief Executive Officer, Group President & Company Secretary and Chief Financial Officer (Group Finance & Accounts) in the financial year is around 24%, 17% and 13% respectively.
(iii) The percentage increase in the median remuneration of employees in the financial year
The percentage increase in the median remuneration of employees in the financial year is around 17%.The remuneration under points (i) to (ix) of these disclosures (except viii), excludes 50% of variable pay, payable to Key Managerial Personnel (defined as per the Companies Act, 2013) on a deferred basis as per SEBI norms and accumulated leave encashment, where applicable.
(iv) The number of permanent employees on the rolls of the Company
As on March 31, 2016, there are 439 employees on the rolls of the Company who worked with the Company in both the financial years.
(v) The explanation on the relationship between average increase in remuneration and company performance.
The remuneration practices are framed and followed as per guidance of the Board, and the Nomination and Remuneration Committee, and is subject to norms specified under the Companies Act, 2013 and by SEBI in the Securities Contracts Regulations (Stock Exchanges and Clearing Corporations) Regulations, 2012. The percentage increase of employee remuneration was 8.19% as against the percentage increase in the Company’s revenue, which was 6.59%.
The intended objective of the remuneration policy is to promote meritocracy and retain eminent and talented resources, within the overarching framework of risk management and legislative and regulatory requirements. Additionally, remuneration, including the determination and increase thereof, is a function of several additional factors such as Salary level in the BFSI sector, Company performance, business performance and performance of the individual as determined from periodic evaluations.
(vi) Comparison of the remuneration of Key Managerial Personnel against the performance of the Company
For the financial year, the Key Managerial Personnel were paid about around 0.66% of the Company’s revenue.

Twenty-Fourth Annual Report FY 2015-2016
99
(vii) Variations in the net worth of the Company as at the close of the current financial year and previous financial year
Networth for the financial year 2015-16 increased by 12.90% at ` 5277 crores as against ` 4674 crores for the financial year 2014-15.
(viii) Average percentile increase already made in the salaries of employees other than the managerial personnel in the last financial year and its comparison with the percentile increase in the managerial remuneration and justification thereof and point out if there are any exceptional circumstances for increase in the managerial remuneration
The average percentile increase in the salaries of employees other than the managerial personnel in the last financial year was 25% as opposed to a 23% average percentile increase in the managerial remuneration based on ‘offer based cost to the company remuneration’ in respect of employees who worked with the Company for both the financial years. Besides normal increase in remuneration, a periodic revision was also made in the employees’ remuneration in the financial year 2015-16.
(ix) Comparison of remuneration of each of the Key Managerial Personnel against the performance of the company
The ratio of each Key Managerial Personnel’s remuneration as against Company’s performance was 0.38% for the Managing Director & Chief Executive Officer, 0.18% for the Group President &Company Secretary and 0.09% for Chief Financial Officer (Group Finance & Accounts).
(x) The key parameters for any variable component of remuneration availed by the directors
As per applicable provisions of Securities Contracts Regulations (Stock Exchanges and Clearing Corporations) Regulations, 2012 and the Companies Act, 2013,the nomination and remuneration policy of the stock exchange is required to be in accordance with norms specified therein. The nomination and remuneration policy is accordingly drafted and recommended by the Nomination and Remuneration Committee and approved by the Board. The Company has, in place, a robust nomination and remuneration policy which takes into consideration, several parameters with respect to payment of the variable component of remuneration.
These factors include, inter alia, the performance against the Key Result Areas or Performance Indicators that are set as part of the goal setting exercise conducted at the beginning of the financial year, the overall performance of the Company and several variable factors specific to the operational and commercial aspects of the Company’s business.
(xi) The ratio of the remuneration of the highest paid director to that of the employees who are not directors but receive remuneration in excess of the highest paid director during the year
No employee receives remuneration in excess of highest paid director. Hence the question is not applicable.
(xii) Affirmation that the remuneration is as per the remuneration policy of the company
The remuneration is as per the remuneration policy of the Company.
---
Business Responsibility Report
As a green initiative, the Business Responsibility Report is given on Company’s website at the following address: https://nseindia.com/global/content/about_us/nseil_disc_others.htm


Twenty-Fourth Annual Report FY 2015-2016
1
INDEPENDENT AUDITOR’S REPORT
TO THE MEMBERS OF NATIONAL STOCK EXCHANGE OF INDIA LIMITED
Report on the Consolidated Financial Statements
We have audited the accompanying consolidated financial statements of NATIONAL STOCK EXCHANGE OF INDIA LIMITED (hereinafter referred to as “the Holding Company”), its subsidiaries (the Holding Company and its subsidiaries together referred to as “the Group”), its jointly controlled entity and its associates, comprising of the Consolidated Balance Sheet as at March 31, 2016, the Consolidated Statement of Profit and Loss, the Consolidated Cash Flow Statement for the year then ended, and a summary of the significant accounting policies and other explanatory information (hereinafter referred to as “the consolidated financial statements”).
Management’s Responsibility for the Consolidated Financial Statements
The Holding Company’s Board of Directors is responsible for the preparation of these consolidated financial statements in terms of the requirements of the Companies Act, 2013 (hereinafter referred to as “the Act”) that give a true and fair view of the consolidated financial position, consolidated financial performance and consolidated cash flows of the Group including its Jointly Controlled Entity and Associates in accordance with the accounting principles generally accepted in India, including the Accounting Standards specified under Section 133 of the Act, read with Rule 7 of the Companies (Accounts) Rules, 2014. The respective Board of Directors of the companies included in the Group and of its jointly controlled entity and associates are responsible for maintenance of adequate accounting records in accordance with the provisions of the Act for safeguarding the assets of the Group and for preventing and detecting frauds and other irregularities; the selection and application of appropriate accounting policies; making judgments and estimates that are reasonable and prudent; and the design, implementation and maintenance of adequate internal financial controls, that were operating effectively for ensuring the accuracy and completeness of the accounting records, relevant to the preparation and presentation of the financial statements that give a true and fair view and are free from material misstatement, whether due to fraud or error, which have been used for the purpose of preparation of the consolidated financial statements by the Directors of the Holding Company, as aforesaid.
Auditor’s Responsibility
Our responsibility is to express an opinion on these consolidated financial statements based on our audit. While conducting the audit, we have taken into account the provisions of the Act, the accounting and auditing standards and matters which are required to be included in the audit report under the provisions of the Act and the Rules made thereunder.
We conducted our audit in accordance with the Standards on Auditing specified under Section 143(10) of the Act. Those Standards require that we comply with ethical requirements and plan and perform the audit to obtain reasonable assurance about whether the consolidated financial statements are free from material misstatement.
An audit involves performing procedures to obtain audit evidence about the amounts and the disclosures in the consolidated financial statements. The procedures selected depend on the auditor’s judgment, including the assessment of the risks of material misstatement of the consolidated financial statements, whether due to fraud or error. In making those risk assessments, the auditor considers internal financial control relevant to the Holding Company’s preparation of the consolidated financial statements that give a true and fair view in order to design audit procedures that are appropriate in the circumstances. An audit also includes evaluating the appropriateness of the accounting policies used and the reasonableness of the accounting estimates made by the Holding Company’s Board of Directors, as well as evaluating the overall presentation of the consolidated financial statements.

2
National Stock Exchange of India Limited
We believe that the audit evidence obtained by us and the audit evidence obtained by the other auditors in terms of their reports referred to in sub-paragraph (a) of the Other Matters paragraph below, is sufficient and appropriate to provide a basis for our audit opinion on the consolidated financial statements.
Opinion
In our opinion and to the best of our information and according to the explanations given to us, the aforesaid consolidated financial statements give the information required by the Act in the manner so required and give a true and fair view in conformity with the accounting principles generally accepted in India, of the consolidated state of affairs of the Group, its jointly controlled entity and its associates as at March 31, 2016, and their consolidated profitand their consolidated cash flows for the year ended on that date.
Other Matters
(a) We did not audit the financial statements of five subsidiaries, whose financial statements reflect total assets of ` 5,498.23 crores as at March 31, 2016, total revenues of ̀ 701.30 crores and net cash inflows amounting to ̀ 631.78 crores for the year ended on that date, as considered in the consolidated financial statements. The consolidated financial statements also include the Group’s share of net profit of ` 25.81 crores for the year ended March 31, 2016, as considered in the consolidated financial statements, in respect of an associate, whose financial statement have not been audited by us. These financial statements have been audited by other auditors whose reports have been furnished to us by the Management and our opinion on the consolidated financial statements, in so far as it relates to the amounts and disclosures included in respect of these subsidiaries and an associate, and our report in terms of sub-section (3) of Section 143 of the Act, insofar as it relates to the aforesaid subsidiaries and an associate, is based solely on the reports of the other auditors.
(b) We did not audit the financial information of two subsidiaries and a jointly controlled entity, whose financial information reflect total assets of ` 5.52 crores as at March 31, 2016, total revenues of ` 8.90 crores and net cash inflows amounting to ` 0.20 crore for the year ended on that date, as considered in the consolidated financial statements. The consolidated financial statements also include the Group’s share of net profitof ` 63.85 crores for the year ended March 31, 2016, as considered in the consolidated financial statements, in respect of four associates, whose financial informationhave not been audited by us. These financial information are unaudited and have been furnished to us by the Management and our opinion on the consolidated financial statements, in so far as it relates to the amounts and disclosures included in respect of these subsidiaries, jointly controlled entity and associates, and our report in terms of sub-section (3) of Section 143 of the Act in so far as it relates to the aforesaid subsidiaries, jointly controlled entity and associates, is based solely on such unaudited financial information. In our opinion and according to the information and explanations given to us by the Management, these financial information are not material to the Group.
Our opinion on the consolidated financial statements, and our report on Other Legal and Regulatory Requirements below, is not modified in respect of the above matters with respect to our reliance on the work done and the reports of the other auditors and the financial statements / financial information certified by the Management.
Report on Other Legal and Regulatory Requirements
As required by Section 143(3) of the Act, we report, to the extent applicable, that:
(a) we have sought and obtained all the information and explanations which to the best of our knowledge and belief were necessary for the purposes of our audit of the aforesaid consolidated financial statements;
(b) in our opinion, proper books of account as required by law relating to preparation of the aforesaid consolidated financial statements have been kept so far as it appears from our examination of those books and the reports of the other auditors;

Twenty-Fourth Annual Report FY 2015-2016
3
(c) the Consolidated Balance Sheet, the Consolidated Statement of Profit and Loss, and the Consolidated Cash Flow Statement dealt with by this Report are in agreement with the relevant books of account maintained for the purpose of preparation of the consolidated financial statements;
(d) in our opinion, the aforesaid consolidated financial statements comply with the Accounting Standards specified under Section 133 of the Act, read with Rule 7 of the Companies (Accounts) Rules, 2014;
(e) on the basis of the written representations received from the directors of the Holding Company as on March 31, 2016 taken on record by the Board of Directors of the Holding Company and the reports of the statutory auditors of its subsidiary companies and an associate company incorporated in India, none of the directors of the Group companies and an associate company incorporated in India is disqualified as on March 31, 2016 from being appointed as a director in terms of Section 164 (2) of the Act;
(f ) with respect to the adequacy of the internal financial controls over financial reporting of the Group, its jointly controlled entity and its associates and the operating effectiveness of such controls, refer to our separate Report in “Annexure A”; and
(g) with respect to the other matters to be included in the Auditor’s Report in accordance with Rule 11 of the Companies (Audit and Auditor’s) Rules, 2014, in our opinion and to the best of our information and according to the explanations given to us;
i. the consolidated financial statements disclose the impact of pending litigations on the consolidated financial position of the Group, its jointly controlled entity and its associates– Refer Note 42 to the consolidated financial statements.
ii. the Group, its jointly controlled entity and its associates did not have any long-term contracts including derivative contracts for which there were any material foreseeable losses - Refer Note 43 to the consolidated financial statements.
iii. there were no amounts which were required to be transferred to the Investor Education and Protection Fund by the Holding Company, its subsidiary companies,its jointly controlled entity and its associates incorporated in India - Refer Note 44 to the consolidated financial statements.
For Khandelwal Jain & CoChartered AccountantsFirm’s Registration No. 105049W
(Narendra Jain)PartnerMembership No. 048725
Place : MumbaiDate :May 12, 2016

4
National Stock Exchange of India Limited
ANNEXURE A TO THE INDEPENDENT AUDITOR’S REPORT OF EVEN DATE ON THE CONSOLIDATED FINANCIAL STATEMENTS OF NATIONAL STOCK EXCHANGE OF INDIA LIMITED
Report on the Internal Financial Controls under Clause (i) of Sub-section 3 of Section 143 of the Companies Act, 2013 (“the Act”)
In conjunction with our audit of the consolidated financial statements of the Company as of and for the year ended March 31, 2016, we have audited the internal financial controls over financial reporting of NATIONAL STOCK EXCHANGE OF INDIA LIMITED (hereinafter referred to as “the Holding Company”)and its subsidiary companies, its jointly controlled entity and its associate companies, whichare companies incorporated in India, as of that date.
Management’s Responsibility for Internal Financial Controls
The respective Board of Directors of the of the Holding company, its subsidiary companies, its jointly controlled entity and its associate companies, which are companies incorporated in India, are responsible for establishing and maintaining internal financial controls based on the internal control over financial reporting criteria established by the Company considering the essential components of internal control stated in the Guidance Note on Audit of Internal Financial Controls Over Financial Reporting issued by the Institute of Chartered Accountants of India (ICAI). These responsibilities include the design, implementation and maintenance of adequate internal financial controls that were operating effectively for ensuring the orderly and efficient conduct of its business, including adherence to the respective company’s policies, the safeguarding of its assets, the prevention and detection of frauds and errors, the accuracy and completeness of the accounting records, and the timely preparation of reliable financial information, as required under the Companies Act, 2013.
Auditor’s Responsibility
Our responsibility is to express an opinion on the Company’s internal financial controls over financial reporting based on our audit. We conducted our audit in accordance withthe Guidance Note on Audit of Internal Financial Controls Over Financial Reporting (the“Guidance Note”) issued by the ICAI and the Standards on Auditing, issued by ICAI and deemedto be prescribed under section 143(10) of the Companies Act, 2013, to the extent applicable to an audit of internal financial controls, both issued by the Institute of Chartered Accountants ofIndia. Those Standards and the Guidance Note require that we comply with ethical requirements and plan and perform the audit to obtain reasonable assurance about whether adequate internal financial controls over financial reporting was established and maintained and if such controls operated effectively in all material respects.
Our audit involves performing procedures to obtain audit evidence about the adequacy of the internal financial controls system over financial reporting and their operating effectiveness. Our audit of internal financial controls over financial reporting included obtaining an understanding of internal financial controls over financial reporting, assessing the risk that a material weakness exists, and testing and evaluating the design and operating effectiveness of internal control based on the assessed risk. The procedures selected depend on the auditor’s judgement, including the assessment of the risks of material misstatement of the financial statements, whether due to fraud or error.
We believe that the audit evidence we have obtained and the audit evidence obtained by the other auditors in terms of their reports referred to in the Other Matters paragraph below, is sufficient and appropriate to provide a basis for our audit opinion on the Company’s internal financial controls system over financial reporting.
Meaning of Internal Financial Controls Over Financial Reporting
A company’s internal financial control over financial reporting is a process designed to provide reasonable assurance regarding the reliability of financial reporting and the preparation of financial statements for external purposes in accordance with generally accepted accounting principles. A company’s internal financial control over financial reporting includes those policies and procedures that (1) pertain to the maintenance of records that,

Twenty-Fourth Annual Report FY 2015-2016
5
in reasonable detail, accurately and fairly reflect the transactions and dispositions of the assets of the company; (2) provide reasonable assurance that transactions are recorded as necessary to permit preparation of financial statements in accordance with generally accepted accounting principles, and thatreceipts and expenditures of the company are being made only in accordance with authorisations of management and directors of the company; and (3) provide reasonable assurance regarding prevention or timely detection of unauthorised acquisition, use, or disposition of the company’s assets that could have a material effect on the financial statements.
Inherent Limitations of Internal Financial Controls Over Financial Reporting
Because of the inherent limitations of internal financial controls over financial reporting, including the possibility of collusion or improper management override of controls, material misstatements due to error or fraud may occur and not be detected. Also, projections of any evaluation of the internal financial controls over financial reporting to future periods are subject to the risk that the internal financial control over financial reporting may become inadequate because of changes in conditions, or that the degree of compliance with the policies or procedures may deteriorate.
Opinion
In our opinion, the Holding Company, its subsidiary companies, its jointly controlled entity and its associate companies, which are companies incorporated in India, have, in all materialrespects, an adequate internal financial controls system over financial reporting and such internal financial controls over financial reporting were operating effectively as at March 31,2016, based on the internal control over financial reporting criteria established by the Company considering the essential components of internal control stated in the Guidance Note on Audit of Internal Financial Controls Over Financial Reporting issued bythe Institute of Chartered Accountants of India.
Other Matters
Our aforesaid reports under Section 143(3)(i) of the Act on the adequacy and operating effectiveness of the internal financial controls over financial reporting in so far as it relates to five subsidiary companies and an associate company, which are companies incorporated in India, is based on the corresponding reports of the auditors of such companies incorporated in India.
In respect of a subsidiary, a jointly controlled entity and four associates, which a re companies incorporated in India, there are no reports from Chartered Accountants in respect of internal financial control system over financial reporting and hence, these are not covered in this report.
For Khandelwal Jain & CoChartered AccountantsFirm’s Registration No. 105049W
(Narendra Jain)PartnerMembership No. 048725
Place : MumbaiDate : May 12, 2016

6
National Stock Exchange of India Limited
CONSOLIDATED BALANCE SHEET AS AT MARCH 31, 2016
PARTICULARS NOTES AS AT 31.03.2016 (` in Crores)
AS AT 31.03.2015 (` in Crores)
Equity and liabilities
1 Shareholder's fundsa Share Capital 2 45.00 45.00 b Reserves and surplus 3 6,352.20 5,681.78
6,397.20 5,726.78
2 Core Settlement Guarantee Fund (Core SGF ) 31 965.88 673.11
3 Non-current liabilitiesa Deposits (Unsecured) 4 1,594.56 1,594.53 b Deferred tax liabilities (net) 5 18.02 12.93 c Other long-term liabilities 6 17.35 16.69 d Long-term provisions 7 6.68 5.31
1,636.61 1,629.46 4 Current liabilities
a Deposits (Unsecured) 4 34.10 32.17 b Trade payables 6 5.82 6.92 c Other current liabilities 6 4,000.17 2,671.14 d Short-term provisions 7 446.68 1,050.95
4,486.77 3,761.18
TOTAL 13,486.46 11,790.53
Assets
1 Non-current assetsa Fixed assets
Tangible assets 8 507.18 495.81 Intangible assets 8 45.88 33.20 Capital work-in-progress 15.06 5.15 Intangible assets under development 23.31 11.39
591.43 545.55 b Goodwill on Consolidation 32 66.91 67.35 c Non-current investments 9 3,587.70 1,984.65 d Deferred tax Assets (net) 10 3.87 3.46 e Trade receivable 15 14.08 31.36 f Long-term loans and advances 11 288.45 112.27
g Other non-current assets 12i) Non-current bank balances 521.59 865.88 ii) Others 52.77 43.25
5,126.80 3,653.77

Twenty-Fourth Annual Report FY 2015-2016
7
PARTICULARS NOTES AS AT 31.03.2016 (` in Crores)
AS AT 31.03.2015 (` in Crores)
2 Current assetsa Current investments 13 3,233.59 3,140.23 b Inventories 14 0.03 0.04 c Short-term loans and advances 11 55.15 47.09 d Trade receivable 15 264.43 197.34 e Cash and bank balances 16 4,507.16 4,238.45 f Other Current assets 12 299.30 513.61
8,359.66 8,136.76
TOTAL 13,486.46 11,790.53
Summary of significant accounting policies 1The accompanying notes forms an integral part of the financial statements.
As per our report of even date attached For and on behalf of the Board of Directors
For KHANDELWAL JAIN & CO.,Chartered AccountantsFirm’s Registration no : 105049W
NARENDRA JAIN ASHOK CHAWLA CHITRA RAMKRISHNAPartner Chairman Managing Director & CEOMembership No.:48725
J. RAVICHANDRAN YATRIK VINPlace : Mumbai Group President & Chief Financial OfficerDate : May 12, 2016 Company Secretary

8
National Stock Exchange of India Limited
STATEMENT OF CONSOLIDATED PROFIT & LOSS FOR THE YEAR ENDED MARCH 31, 2016
PARTICULARS
NOTES For the Year ended 31.03.2016
(` in Crores)
For the Year ended 31.03.2015
(` in Crores)
IncomeRevenue from operations 17 1,854.50 1,723.09
Other income 18 499.44 552.35
Total Income 2,353.94 2,275.44
ExpensesPurchases of Stock-in-Trade 19 0.03 0.06
Changes in inventories of Stock-in-Trade 14 0.01 (0.03)
Employee benefits expenses 20 220.78 193.38
Depreciation and amortisation expenses 8 108.92 93.29
Other expenses 21 402.00 371.86
Total Expenses 731.74 658.56
Profit before prior-period adjustments, exceptional item, contribution to Core SGF & tax
1,622.20 1,616.88
Add/(Less) : Prior-period adjustments 22 (2.11) (0.50)
Profit before exceptional item, contribution to Core SGF & tax
1,620.09 1,616.38
Less : Contribution to Core Settlement Guarantee Fund (Core SGF)
36 (761.52) (170.00)
Profit before tax 858.57 1,446.38
Less : Tax Expenses
Current tax 290.29 480.26
MAT Credit adjusted - (0.05)
Income Tax for earlier years 0.20 0.05
Wealth Tax for earlier years (1.08) -
Deferred tax 4.68 4.36
Total tax expenses 294.09 484.62
Profit after taxation before Minority Interest 564.48 961.76
Less: Minority Interest - -
Add / (Less) : Share of profit / (Loss) of associate 34 89.66 64.72
Profit after taxation 654.14 1,026.48

Twenty-Fourth Annual Report FY 2015-2016
9
PARTICULARS
NOTES For the Year ended 31.03.2016
(` in Crores)
For the Year ended 31.03.2015
(` in Crores)
Earnings Per Share ( Face Value ` 10/- each)
(a) Before exceptional item and contribution to Core SGF
Basic 23 256.03 253.04
Diluted 23 256.03 253.04
(b) After exceptional item and contribution to Core SGF
Basic 23 145.36 228.11
Diluted 23 145.36 228.11
Summary of significant accounting policies 1
The accompanying notes forms an integral part of the financial statements.
As per our report of even date attached For and on behalf of the Board of Directors
For KHANDELWAL JAIN & CO.,Chartered AccountantsFirm’s Registration no : 105049W
NARENDRA JAIN ASHOK CHAWLA CHITRA RAMKRISHNAPartner Chairman Managing Director & CEOMembership No.:48725
J. RAVICHANDRAN YATRIK VINPlace : Mumbai Group President & Chief Financial OfficerDate : May 12, 2016 Company Secretary

10
National Stock Exchange of India Limited
CONSOLIDATED CASHFLOW STATEMENT FOR THE YEAR ENDED MARCH 31, 2016
For the Year ended March 2016
(` In Crores)
For the Year ended March 2015
(` In Crores) A) CASHFLOW FROM OPERATING ACTIVITIES
NET PROFIT BEFORE TAX 858.57 1,446.38 Add : Adjustments for :
Depreciation and amortisation expenses 108.92 93.29 Adjustments to the carrying amount of current investments 0.09 0.02 Bad debts/Sundry balances written off 0.06 0.04 Goodwill on Consolidation written off 0.44 – Provision for doubtful Debts 0.21 0.10 Prior period adjustments (Net) 2.11 0.50 Wealth Tax 0.07 0.50 Loss on sale /discard of assets (Net) – 0.25
Less : Adjustments for :Staff welfare expenses debited to staff welfare Reserve – – Amortisation of Premium / Discount on Govt/Debt Securities 1.60 (5.54)Interest income on short term investments (25.34) (57.60)Interest income on long term investment (204.59) (128.73)Interest income on Bank deposit (95.52) (103.75)Interest income on Certificate of deposits – (8.51)Interest income on Inter Corporate deposits – –(Profit)/Loss on sale Of Long Term Equity Investments ( Exceptional Item) – –(Profit)/Loss on sale/redemption of long term investments (5.89) (14.09)(Profit)/Loss on sale/redemption of short term investments (135.35) (182.01)Profit on sale of Fixed Assets (6.05) – Dividend - Long Term (1.33) (1.14)Dividend - Short Term (0.17) (0.23)Excess Provision written back (0.43) (0.98)
OPERATING PROFIT BEFORE WORKING CAPITAL CHANGES 497.40 1,038.50 Adjustments for :Trade Receivables (50.08) (11.84)Inventory 0.01 (0.03)Loans & Advances (11.03) 5.12 Other Current Assets 82.29 106.66 Long Term Liabilities & Provisions 2.03 3.34 Current Liabilities & Provisions 1,603.96 (2,081.78)
CASH GENERATED FROM OPERATIONS 2,124.58 (940.03)Prior period adjustments (Net) (2.11) (0.50)Direct Taxes paid (Net of Refunds) (508.11) (465.50)
CASH FLOW BEFORE EXTRAORDINARY ITEMS 1,614.36 (1,406.04)Extraordinary Items – –
NET CASH FROM (USED IN) OPERATING ACTIVITIES - Total (A) 1,614.36 (1,406.03)
B) CASHFLOW FROM INVESTING ACTIVITIESPurchase of Fixed Assets/Capital work-in-progress (140.99) (151.58)Sale of Fixed Assets 7.23 0.03 Interest received 351.26 268.66 Dividend received 1.50 1.37 (Increase)/Decrease in Fixed deposit & Certificate of deposits 725.75 1,641.63 (Increase)/Decrease in Investment (1,467.69) (1,993.30)
NET CASH FROM (USED IN) INVESTING ACTIVITIES - Total (B) (522.94) (233.19)

Twenty-Fourth Annual Report FY 2015-2016
11
For the Year ended March 2016
(` In Crores)
For the Year ended March 2015
(` In Crores)
C) CASHFLOW FROM FINANCING ACTIVITIESProceed of deposit from trading & clearing member / applicant 160.82 124.01 Refund of deposit from trading & clearing member / applicant (160.24) (123.00)Refund of Equipment Deposit (net) 1.37 0.99 Tax on Distributed income to Shareholders ( Buy Back of Shares) (5.19) – Dividend paid (including dividend paid to minority shareholders) (357.75) (306.00)Dividend distribution tax paid on above (80.26) (59.69)
NET CASH FROM (USED IN) FINANCING ACTIVITIES - Total (C) (441.25) (363.69)
NET INCREASE/(DECREASE) IN CASH AND CASH EQUIVALENTS (A+B+C) 650.17 (2,002.91)
CASH AND CASH EQUIVALENTS : OPENING BALANCE 2,294.57 4,297.48
CLOSING CASH AND CASH EQUIVALENTS : CLOSING BALANCE 2,944.74 2,294.57
NET INCREASE/(DECREASE) IN CASH AND CASH EQUIVALENT 650.17 (2,002.91)
Notes to Cash Flow Statement :1 Cash and cash equivalent represent cash, bank balances, fixed deposits of ` 2,587.44 crores ( previous year ` 2,052.20
crores) with original maturity of less than three months and earmarked deposits of ` 69.11 crores (previous year ` 96.62 crores) with original maturity of less than three months.
2 The above Cash Flow Statement has been prepared under the "Indirect Method" as set out in the Accounting Standard-3 on Cash Flow Statements notified under Rule 7 of the Companies (Accounts) Rules, 2014.
3 Previous years’ figures are regrouped, reclassified and rearranged wherever necessary.
As per our report of even date attached For and on behalf of the Board of Directors
For KHANDELWAL JAIN & CO.,Chartered AccountantsFirm's Registration no : 105049W NARENDRA JAIN ASHOK CHAWLA CHITRA RAMKRISHNAPartner Chairman Managing Director & CEOMembership No.:048725
J. RAVICHANDRAN YATRIK VINPlace : Mumbai Group President & Chief Financial OfficerDate : May 12, 2016 Company Secretary

12
National Stock Exchange of India Limited
NOTES TO CONSOLIDATED FINANCIAL STATEMENTS FOR THE YEAR ENDED MARCH 31, 2016
1 Summary of significant accounting policies to the Consolidated Financial Statement (CFS)
The consolidated financial statements relates to National Stock Exchange of India Limited (“the Company” or “the Parent Company”), its subsidiary companies (collectively referred to as “the Group”),its Jointly Controlled Entiity and associates.
a) Basis of Accounting
The consolidated financial statements of the company, its subsidiaries, its Jointly Controlled Entiity and its associates have been prepared in accordance with generally accepted accounting principles in India (India GAAP). The company has prepared these financial statements to comply in all material respects with the Accounting Standards specified under Section 133 of the Companies Act, 2013, read with Rule 7 of the Companies (Accounts) Rules, 2014 and relevant provisions of the Companies Act, 2013. and in particular Accounting Standard 21 (AS 21) - ‘Consolidated Financial Statements’, Accounting Standard 23 (AS 23) - ‘Accounting for Investments in Associates in Consolidated Financial Statements’ and Accounting Standard 27 (AS 27) - ‘Financial Reporting of Interests in Joint Ventures’. The financial statements have been prepared on an accrual basis and under the historical cost convention.
b) Use of estimates
The preparation of financial statements in conformity with India GAAP requires the management to make judgments, estimates and assumptions that affect the reported amounts of revenues, expenses, assets and liabilities and the disclosure of contingent liabilities, at the end of the reporting period. Although these estimates are based on the management’s best knowledge of current events and actions, uncertainity about these assumptions and estimates could result in the outcomes requiring a material adjustment to the carrying amounts of assets or liabilities in future periods.
c) Principles of Consolidation
The Consolidated Financial Statements are prepared on the following basis:
i. The financial statements of the parent company, its subsidiaries and jointly controlled entity are consolidated / proportionately consolidated on a line-by-line basis by adding together the book values of like items of assets, liabilities, income and expenses, after fully eliminating intra-group balances and transactions resulting in unrealized profits or losses on intra-group transactions and are presented to the extent possible, in the same manner as the Company’s independent financial statements except in respect of accounting policy for depreciation on fixed assets.
ii. Interest in jointly controlled entities (incorporated Joint Ventures), if any, is accounted using proportionate consolidation method.
iii. The excess of the cost to the company of its investment in subsidiary / jointly controlled entity over the company’s portion of equity of the subsidiary / jointly controlled entity as at the date on which investment in subsidiary / jointly controlled entity is made, is recognized in the financial statement as Goodwill. The excess of Company’s share of equity and reserve of the subsidiary / joint venture Company over the cost of acquisition is treated as Capital Reserve.
iv. Investment in associate companies have been accounted for, by using equity method whereby investment is initially recorded at cost and the carrying amount is adjusted thereafter for post acquisition change in company’s share of net assets of the associate. The carrying amount of

Twenty-Fourth Annual Report FY 2015-2016
13
investment in associate companies is reduced to recognize any decline which is other than temporary in nature and such determination of decline in value, if any, is made for investment individually.
v. Minority Interests in the CFS is identified and recognized after taking into consideration:
- The amount of equity attributable to minority’s at the date on which investments in a subsidiary is made.
- The minority’s share of movements in equity since the date parent subsidiary relationships came into existence.
d) The particulars of subsidiaries and associates which are considered for consolidation and the percentage of voting power therein of the company as on 31st March, 2016 are as under:
Name of Company w.e.f. Country of Incorpora-
tion
Percentage of voting power
as at
Reporting Date
Financial Status
Audited / Unaudited
Relationship
31st March 2016National Securities Clearing Corporation Limited
31-Aug-1995 India 100.00% 31-Mar-16 Audited Subsidiary
NSE Strategic Investment Corporation Limited
31-Jan-2013 India 100.00% 31-Mar-16 Audited Subsidiary
NSEIT Limited 29-Oct-1999 India 100.00% 31-Mar-16 Audited Subsidiary's Subsidiary
NSE.IT (US) Inc. 04-Dec-2006 United States of America
100.00% 31-Mar-16 Unaudited Subsidiary's Subsidiary's Subsidiary
India Index Services & Products Limited
02-Aug-2006 India 100.00% 31-Mar-16 Audited Subsidiary's Subsidiary
DotEx International Limited 02-Jun-2000 India 100.00% 31-Mar-16 Audited Subsidiary's Subsidiary
NSE Infotech Services Limited 02-Aug-2006 India 100.00% 31-Mar-16 Audited Subsidiary's Subsidiary
NSE Education Facilities Limited 12-Mar-2016 India 100.00% 31-Mar-16 Unaudited Subsidiary's Subsidiary
Receivables Exchange of India Limited
25-Feb-2016 India 50.00% 31-Mar-16 Unaudited Subsidiary's Joint Venture
National Securities Depository Limited (new)
01-Apr-2012 India 25.05% 31-Mar-16 Audited Associate
Power Exchange India Limited 20-Feb-2008 India 30.95% 31-Mar-16 Unaudited Subsidiary'sAssociate
NSDL e-Governance Infrastructure Limited (formerly known as National Securities Depository Limited)
15-Feb-2010 India 25.05% 31-Mar-16 Unaudited Subsidiary'sAssociate
Market Simplified India Limited (Formerly known as INXS Technologies Limited)
30-Nov-2011 India 30.00% 31-Mar-16 Unaudited Subsidiary'sAssociate
Computer Age Management Services Private Limited
7-Jan-14 India 44.99% 31-Mar-16 Unaudited Subsidiary'sAssociate

14
National Stock Exchange of India Limited
e) Revenue Recognition (i) Revenue is being recognised as and when there is reasonable certainty of ultimate realisation.
(ii) Revenue from sale of software product licenses, sale of digital certificates and resale of hardware & software is recognised upon delivery.
(iii) Revenue from online examination services are recognised on the basis of exams conducted.
(iv) Revenues from software development and maintenance on time and material basis and consultancy charges are recognised based on the terms agreed with the customers.
(v) Revenue from IT & Process support charges are recognised on accrual basis when services are rendered and there is reasonable certainty of ultimate realization.
(vi) Clearing and Settlement charges, IT & support charges are recognized on accrual basis as and when the services are rendered.
(vii) Revenue from subscription fees received for dissemination of data (data feed) is recognised on time proportion method.
(viii) Penal Charges, in the year of declaration of default, in respect of shortages due from the respective member, are booked to the extent such charges are recoverable.
(ix) Interest is recognized on time proportionate basis taking into consideration the amount outstanding and the rate applicable.
(x) Income from dividend is accounted as and when such dividend has been declared and the Company’s right to receive payment is established.
(xi) Income excludes applicable taxes and other levies
(xii) Revenue from fixed price contracts is recognised on the basis of the deliverables provided / milestone executed and delivered.
(xiii) Revenues from maintenance contracts and technical support agreements are recognised on a pro-rata basis over the period in which such services are rendered under the terms of the contracts and agreements.
(xiv) Revenue on account of subscription fees with respect to the period of the contract on an accrual basis.
(xv) Subscription fees received in respect of unexpired period of the contract is treated as a current liability and is recognised as income in the respective period.
(xvi) Revenue from IT Services is recognized based on the terms agreed with the customers.
(xvii) Other insurance claims are accounted on accrual basis when the claims become due and payable.
(xviii) Revenue from e-learning activity is recognised on the basis of enrollment.
(xix) Revenue from Contracts priced on a time and material basis are recognised when services are rendered.
(xx) Revenue from online Datafeed Service Fees income is recognised on a time proportion method. Other revenue is recognised as and when services are rendered.
(xxi) Revenue Index License Fees income is recognised on a time proportion method and revenue on account of subscription fees with respect to the period of the contract on an accrual basis.
(xxii) Provision for Doubtful debts and Bad Debts.
(a) In respect of members who have been declared as defaulter or expelled during the year by the company all amounts remaining to be recovered till the date of being declared defaulter

Twenty-Fourth Annual Report FY 2015-2016
15
or expelled are written off as bad debts. All subsequent recoveries are accounted for in the year of receipt. Shortages arising after the date of declaration of default are written off as bad debts in the year in which it arises, after exhausting all remedies including forfeiture of securities and insurance cover available if any.
(b) Other overdue amounts are provided for as doubtful debts or are written off as bad debts, if the same are considered doubtful / irrecoverable in the opinion of the management.
f ) Expenditure
Expenses are accounted on accrual basis and provisions are made for all known losses and liabilities.
Since the company does not visualise any major expenditure on account of warranty given for maintaining the software product licenses sold, no provisions are made on this account. Any expenditure that may have to be incurred towards honouring the warranty shall be accounted for in the year in which it is incurred.
g) Fixed Assets
Fixed Assets are stated at historical cost less accumulated depreciation. Historical cost is inclusive of freight, duties, taxes, cost of installation, interest upto the date of installation and other incidental expenses incurred towards acquisition and installation of fixed assets.
h) Depreciation
(i) Depreciation on assets is provided on the straight-line method using the rates based on the economic useful life of assets as estimated by the management but not being more than the limits specified in Schedule II of the Companies Act, 2013 except in case of subsidiary NSEIT Limited. Details are as follows :
Assets Management Estimateof Useful
Life in years
Useful life as per the limits prescribed in Schedule II
of the Companies Act, 2013 in Years
Building 60 Years 60 Years
Furniture and Fixture 5 to 10 Years 10 Years
Office Equipments 4 to 5 Years 5 Years
Electrical Equipments 10 Years 10 Years
Computer Systems Office Automation 3 Years 3 Years
Computer Systems - Others 4 Years 4 Years
Computer Software 4 Years 4 Years
Telecommunication Systems 4 Years 6 Years
Trading & Clearing Systems 4 Years 6 Years
In case of Furniture and Fixtures, Office Equipments, Computer Symstem-others, Telecommunication Systems and Trading & Clearing Systems , the management estimate of the useful life is lower than that prescribed in Schedule II of the Companies Act, 2013. This is based on the consistent practices followed, past experience, internal assessment and duly supported by technical advice.
(ii) Depreciation on assets purchased / disposed off during the year is provided on pro rata basis with reference to the date of additions / deductions.
(iii) Fixed assets whose aggregate cost is ` 5,000 or less are depreciated fully in the year of acquisition.
(iv) Leasehold land is amortised over the period of lease.
(v) Computer Software is amortized over a period of 4 years.

16
National Stock Exchange of India Limited
(vi) In case of Subsidiary NSEIT Limited, Fixed Assets are depreciated as per the useful life sepcified under schedule II to Companies Act 2013 except the Fixed Furniture and fixtures, electrical installation and office equipment including civil improvements at lease hold premises which are depreciated over the lease period.
(vii) In case of Subsidiary NSEIT Limited, Software products/ licenses purchased/ acquired for internal use of the Company which have expected longer life are capitalised and depreciated @ 33 1/3 % on Straight Line Method, which is higher than the rates prescribed in the aforesaid schedule. Depreciation on fixed assets other than above is provided using straight line method at the rates specified in schedule XIV to Companies Act, 2013.
i) Computer software
(i) Cost of development and production software is capitalised,
(ii) Cost towards software development incurred till the time software is put to use is capitalised, and
(iii) Standard packaged software products are written off in the year of purchase in case of Parent Company.
j) Impairment of Assets
An assets is treated as impaired when the carrying cost of assets exceeds its recoverable value. An impairment loss is charged to the Statement of Consolidated Profit and Loss in the year in which assets are identified as impaired. The impairment loss recognized in prior accounting period is reversed if there has been change in the estimate of recoverable amount.
k) Investments
(i) Long term investments are considered as held till maturity and are valued at cost. Provision is made for diminution in the value of investment, if any, other than temporary in nature.
(ii) Short term investments are valued at cost or fair value whichever is lower.
(iii) Premium paid/discount received at the time of acquisition of Government / Debt securities is amortised over the residual period of its maturity.
(iv) The cost of investment includes acquisition charges such as brokerage, etc. Front-end discount / incentive earned in respect of direct subscription is adjusted towards the cost of investment. Income on investments is accounted for on accrual basis.
l) Foreign currency transactions
(i) Transactions in foreign exchange are accounted at the exchange rates prevailing on the date on which transactions have taken place. Outstanding if any, at the end of the year are converted at the year end rates.
(ii) Monetary items denominated in foreign currency at the year end are translated at the year end rate except for those covered by forward cover contracts which are translated at contracted rates.
(iii) Any income or expense on account of exchange difference between the date of transaction and settlement or translation is recognised in the Statement of Consolidated Profit and Loss as income or expense. The premium or discount on forward exchange contract are amortised and recognized in the Statement of Consolidated Profit and Loss over the period of contract.
(iv) Assets and liabilities of foreign subsidiary are translated at closing exchange rate and income and expenditure are translated at average exchange rate for the year. The difference arising on such translation is debited / credited to foreign currency translation reserve.

Twenty-Fourth Annual Report FY 2015-2016
17
m) Forward Exchange Contract
Forward exchange contracts entered into to hedge foreign currency risk of an existing asset/liability. The premium or discount arising at the inception of forward exchange contract is amortized and recognized as an expense/income over the life of the contract. Exchange differences on such contracts, are recognized in the Statement of Consolidated Profit and Loss in the period in which the exchange rates change. Any profit or loss arising on cancellation or renewal of such forward exchange contract is also recognized as income or as expense for the period.
n) Inventory
The Inventory is valued at cost or net realizable value whichever is lower.
o) Employee Benefits
(i) Provident Fund: The parent company has established ‘National Stock Exchange of India Limited Employee Provident Fund Trust’ and one of the subsidairy, NSE Infotech Services Limited has established ‘NSE Infotech Services Limited Employee Provident Fund Trust’ to which both the employee and the employer make monthly contribution equal to 12% of the employee’s basic salary respectively. Such contribution to the provident fund for all employees, are charged to revenue. In case of any liability arising due to shortfall between the return from its investments and the administered interest rate, the same is required to be provided for by the respective companies.
One of the subsidiary, NSEIT Limited contributes to the Regional Provident Fund Office, Kandivali, Mumbai as per the applicable rule at the rate of 12% of the employee’s basic salary to the said recognized provident fund and the same is charged to revenue.
(ii) Superannuation: Superannuation benefit for employees designated as chief managers and above is covered by Group Superannuation Scheme with the Life Insurance Corporation of India towards which it annually contributes a sum based on a specified percentage of each covered employees’ salary. The contribution paid for the year on the Group Superannuation Scheme is charged to revenue. There are no other obligations other than the annual contribution payable.
(iii) Gratuity: The Company has maintained a Group Gratuity Cum Life Assurance Scheme with the Life Insurance Corporation of India (LIC) towards which it annually contributes a sum determined by LIC. The Company provides for the defined benefit with respect to gratuity liability based on the present value of defined benefit obligation as reduced by the fair value of plan assets as per the actuarial valuation calculation as on the balance sheet date to comply with the Accounting Standard 15 for employee benefits.
(iv) Leave Encashment : Liability on account of Leave encashment is provided based on Acturial Valuation at Balance Sheet date.
(v) Short term employee benefits are charged to revenue in the year in which the related service is rendered.
p) Taxation
Tax expense for the year, comprising current tax and deferred tax is included in determining the net profit for the year.
A provision is made for the current tax based on tax liability computed in accordance with relevant tax rates and tax laws. A provision is made for deferred tax for all timing differences arising between taxable income and accounting income at currently enacted tax rates.

18
National Stock Exchange of India Limited
Deferred tax assets are recognised only if there is a reasonable certainty that they will be realised and are reviewed for the appropriateness of their respective carrying values at each balance sheet date.
q) Provisions, contingent liabilities & contingent assets :-
A provision is recognised when the Company has a present obligation as a result of past event and it is probable that an outflow of resources will be required to settle the obligation, in respct of which reliable estimate can be made. Provisions (excluding retirement benefits) are not discounted to its present value and are determined based on best estimate required to settle the obligation at the balance sheet date. These are reviewed at each balance sheet date and adjusted to reflect the current best estimates. Contingent liabilities are not recognised in the financial statments. A contingent asset is neither recognised nor disclosed in the financial statements.
2 Share Capital
As at 31.03.2016
(` in Crores)
As at 31.03.2015
(` in Crores) Authorised
5,00,00,000 (Previous Year 5,00,00,000 ) Equity Shares of ` 10 each. 50.00 50.00
Issued, Subscribed and Paid-up4,50,00,000 (Previous year 4,50,00,000) Equity shares of ` 10 each fully paid up.
45.00 45.00
Total 45.00 45.00
There is no movement either in the number of shares or in amount between previous year and current year.
The company has only one class of equity shares having a par value of ` 10/- per share. Each holder of equity shares is entitled to one vote per share. The dividend proposed by the Board of Directors is subject to the approval of the shareholders in the ensuing Annual General Meeting.
The Board of directors, in their meeting on May 12, 2016, proposed a dividend of ` 73/- per equity share. The proposal is subject to the approval of shareholders at the Annual General Meeting . The total dividend appropriation for the year ended March 31, 2016 amounted to ̀ 328.50 crores excluding Dividend Distribution Tax.
During the year ended March 31, 2015, the amount of dividend per share recognized as distribution to equity shareholders was ` 72/- per equity share and a special one time dividend or ` 7.50/- per share. The total dividend appropriation for the year ended March 31, 2015 amounted to ̀ 357.75/- crores excluding Dividend Distribution Tax.
In the event of liquidation of the company, the holders of equity shares will be entitled to receive remaining assets of the company, after distributional of all preferential amounts. The distribution will be in proportion to the number of equity shares held by the shareholders.
Details of shareholders holding more than 5% share in the company
31.03.2016 31.03.2015
No. % holding No. % holding
Life Insurance Corporation of India 5,628,500 12.51% 4,728,500 10.51%
State Bank of India 4,587,500 10.19% 4,587,500 10.19%
IFCI Limited 1,747,750 3.88% 2,497,750 5.55%

Twenty-Fourth Annual Report FY 2015-2016
19
3 Reserves & Surplus
As at 31.03.2016 (` in Crores)
As at 31.03.2015 (` in Crores)
Share premiumAs per last balance sheet 40.00 40.00
Investor compensation reserveAs per last balance sheet 10.00 10.00
Capital Redemption Reserve As per last balance sheet 10.00 10.00 Add : Transferred from General Reserve 3.00 13.00 - 10.00
Staff welfare reserveAs per last balance sheet 1.50 1.50
Capital Reserve on consolidation ( Refer Note 33) 39.39 39.39
Currency Translation Reserve (0.10) (0.16)
General reserveAs per last balance sheet 4,443.53 4,769.56 Less: Contribution to Core Settlement Guarantee Fund (Core SGF ) ( Refer Note 31)
- (344.89)
Less : Transferred to Capital Redemption Reserve (3.00) -Add : Transferred from surplus balance in the Statement of Consolidated Profit and Loss
0.51 4,441.04 18.86 4,443.53
Surplus/(deficit) in the Statement of Consolidated Profit and LossBalance as per last financial statements 1,137.52 635.16
Less : Adjustment of Depreciation due to revised Companies Act, 2013
- (12.74)
Add : Deffered Tax impact on depreciation adjustment
- 3.40
Less : Contribution to Core Settlement Guarantee Fund (Core SGF )
(143.00) -
Add : Tax on contribution to Core SGF 33.00 -
Add : Reversal of provisional appropriation towards SGF ( Refer Note 7 & 36)
527.19 -
Less: Adjustment in respect of losses of earlier year adjusted against goodwill of an associate
- (4.86)
Profit for the year 654.14 1,026.48
Amount available for appropriation 2,208.85 1,647.44
Less : Appropriations
Provisional transfer to SGF in respect of current year (net of contribution to Core SGF amounting to ` Nil. (P.Y ` 170 crores) ( Refer Note 36)
- 52.97
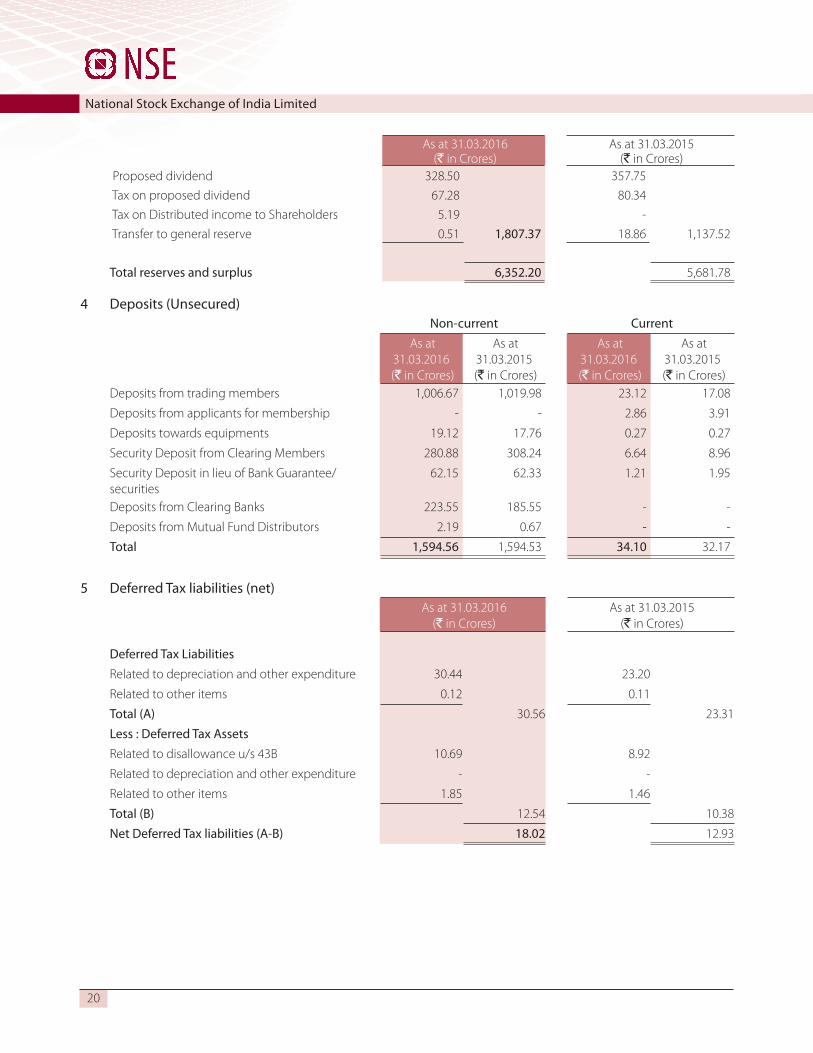
20
National Stock Exchange of India Limited
As at 31.03.2016 (` in Crores)
As at 31.03.2015 (` in Crores)
Proposed dividend 328.50 357.75
Tax on proposed dividend 67.28 80.34
Tax on Distributed income to Shareholders 5.19 -
Transfer to general reserve 0.51 1,807.37 18.86 1,137.52
Total reserves and surplus 6,352.20 5,681.78
4 Deposits (Unsecured) Non-current Current
As at 31.03.2016
(` in Crores)
As at 31.03.2015
(` in Crores)
As at 31.03.2016
(` in Crores)
As at 31.03.2015
(` in Crores)Deposits from trading members 1,006.67 1,019.98 23.12 17.08
Deposits from applicants for membership - - 2.86 3.91
Deposits towards equipments 19.12 17.76 0.27 0.27
Security Deposit from Clearing Members 280.88 308.24 6.64 8.96
Security Deposit in lieu of Bank Guarantee/securities
62.15 62.33 1.21 1.95
Deposits from Clearing Banks 223.55 185.55 - -
Deposits from Mutual Fund Distributors 2.19 0.67 - -
Total 1,594.56 1,594.53 34.10 32.17
5 Deferred Tax liabilities (net) As at 31.03.2016
(` in Crores) As at 31.03.2015
(` in Crores)
Deferred Tax LiabilitiesRelated to depreciation and other expenditure 30.44 23.20
Related to other items 0.12 0.11
Total (A) 30.56 23.31
Less : Deferred Tax AssetsRelated to disallowance u/s 43B 10.69 8.92
Related to depreciation and other expenditure - -
Related to other items 1.85 1.46
Total (B) 12.54 10.38
Net Deferred Tax liabilities (A-B) 18.02 12.93

Twenty-Fourth Annual Report FY 2015-2016
21
6 Other liabilities Long Term Short Term As at
31.03.2016 (` in Crores)
As at 31.03.2015
(` in Crores)
As at 31.03.2016
(` in Crores)
As at 31.03.2015
(` in Crores)
Trade payables ( Refer Note 38) - - 5.82 6.92 - - 5.82 6.92
Others Deposit - Premises 4.18 4.15 - 27.22 Deposit - Others 5.39 5.39 - - Liability for expenses (Refer Note 38) - - 100.01 85.82 Creditors for Capital expenditure (Refer Note 38) - - 20.72 13.77 Amount payable to Core SGF (Refer Note 36) - - 709.91 19.68 Margins from Members - - 863.53 508.75 Settlement Obligation payable - - 1,865.18 1,640.59 Security deposit - - 46.49 36.87 Unpaid matured deposits - - 0.07 0.07 Other deposits - - 1.30 1.38 Income received in advance - - 39.18 44.87 Securities Transaction Tax payable - - 166.35 126.87 Statutory dues - payable - - 36.33 28.97 Defaulters committee account - - 67.89 63.98 Deposits of defaulters members - SEBI - - 0.18 0.18 Balance in Escrow Account ( Refer Note 39) - - 4.34 1.90 Other liabilities 7.78 7.15 78.69 70.22
17.35 16.69 4,000.17 2,671.14 Total 17.35 16.69 4,005.99 2,678.06
7 Provision Long - term Short - Term As at
31.03.2016 (` in Crores)
As at 31.03.2015
(` in Crores)
As at 31.03.2016 (` in Crores)
As at 31.03.2015 (` in Crores)
Provision for employee benefitsMedical benefits - - 1.82 1.39 Provision for Leave Travel allowance - - 4.22 3.33 Provision for gratuity 3.68 2.72 4.01 3.36 Provision for Leave encashment 3.00 2.59 12.62 11.56
6.68 5.31 22.67 19.64 Other ProvisionsIncome tax (net of advance tax including TDS) - - 27.94 64.30 Wealth Tax (net of advance) - - 0.29 1.81 Provisional appropriation towards Core SGF ( Refer Note 3 & 36)As per last balance sheet 527.19 474.22 Add : Provisional appropriation towards Core SGF
(net of contribution to Core SGF amounting to NIL, PY ` 170 crores)
- 52.97
Less : Reversal of Provisional appropriation towards SGF
(527.19)
- - 527.19
Proposed Dividend - - 328.50 357.75 Corporate Dividend Tax - - 67.28 80.26
- - 424.01 1,031.31 Total 6.68 5.31 446.68 1,050.95

22
National Stock Exchange of India Limited8:
FIX
ED A
SSET
S (N
ote
No.
1g,
1h,
1i &
1j)
(` In
cro
res)
SR
NO
.D
ESC
RIPT
ION
GRO
SS B
LOC
KD
EPRE
CIA
TIO
N/A
MO
RTIS
ATIO
NS
NET
BLO
CK
As
onA
pril
1,
2015
Add
ition
s 20
15-2
016
Ded
uctio
n 20
15-2
016
As
on
Mar
ch 3
1,
2016
Tota
l upt
o M
arch
31,
20
15
For t
he
year
Ded
uc-
tions
/A
m-
ortis
atio
ns
2015
-201
6
Tota
l upt
o M
arch
31,
20
16
As
on
Mar
ch 3
1,
2016
As
on
Mar
ch 3
1,
2015
Tang
ible
Ass
ets
1BU
ILD
ING
175
.83
- 1
.32
174
.51
32.
52
3.0
3 0
.38
35.
17
139
.34
143
.31
2C
LEA
RIN
G A
ND
SET
TLEM
ENT
SYST
EM 2
7.61
3
.71
- 3
1.32
2
4.81
1
.69
- 2
6.50
4
.82
2.8
0
3CO
MPU
TER
SYST
EMS
OFF
ICE
AUTO
MAT
ION
26.
11
0.9
7 -
27.
08
19.
48
1.5
6 -
21.
04
6.0
4 6
.63
4CO
MPU
TER
SYST
EM O
THER
S 1
56.3
5 4
3.62
0
.19
199
.78
93.
37
31.
65
0.0
6 1
24.9
6 7
4.82
6
2.98
5EL
ECTR
ICA
L IN
STA
LLAT
ION
S 8
7.56
1
5.34
0
.04
102
.86
27.
40
6.8
7 0
.03
34.
24
68.
62
60.
16
6FU
RNIT
URE
AN
D F
IXTU
RES
43.
27
3.9
5 1
.28
45.
94
24.
41
4.1
6 1
.20
27.
37
18.
57
18.
86
7LA
ND
35.
51
- -
35.
51
- -
- -
35.
51
35.
51
8LE
ASE
HO
LD L
AN
D 1
07.6
2 -
- 1
07.6
2 2
5.13
1
.30
- 2
6.43
8
1.19
8
2.49
9O
FFIC
E EQ
UIP
MEN
TS 6
3.73
1
1.11
0
.38
74.
46
46.
21
8.8
7 0
.36
54.
72
19.
74
17.
52
10TE
LECO
MM
UN
ICAT
ION
SY
STEM
S 1
56.3
2 1
8.49
-
174
.81
118
.12
17.
00
- 1
35.1
2 3
9.69
3
8.21
11TR
AD
ING
SYS
TEM
S 1
88.5
5 2
.15
- 1
90.7
0 1
61.2
0 1
0.66
-
171
.86
18.
84
27.
35
TOTA
L (A
) 1
,068
.46
99.
34
3.2
1 1
,164
.59
572
.65
86.
79
2.0
3 6
57.4
1 5
07.1
8 4
95.8
2
Inta
ngib
le A
sset
s
12CO
MPU
TER
SOFT
WA
RE 1
78.9
7 3
4.81
-
213
.78
145
.77
22.
13
- 1
67.9
0 4
5.88
3
3.20
13SO
FTW
ARE
CO
PYRI
GH
TS 2
.59
- -
2.5
9 2
.59
- -
2.5
9 -
-
TOTA
L (B
) 1
81.5
6 3
4.81
-
216
.37
148
.36
22.
13
- 1
70.4
9 4
5.88
3
3.20
TOTA
L (A
+B)
1,2
50.0
2 1
34.1
5 3
.21
1,3
80.9
6 7
21.0
1 1
08.9
2 2
.03
827
.90
553
.06
529
.02
PREV
IOU
S YE
AR
TOTA
L 1
,105
.94
147
.78
3.7
0 1
,250
.02
618
.38
106
.03
3.4
0 7
21.0
1 5
29.0
2

Twenty-Fourth Annual Report FY 2015-2016
23
9 - N
ON
CU
RREN
T IN
VEST
MEN
TS (V
ALU
ED A
T CO
ST U
NLE
SS S
TATE
D O
THER
WIS
E)M
atur
ity
Dat
e N
umbe
r of
Uni
ts
Fac
e Va
lue
per U
nit
(`)
Fac
e va
lue
(` in
Cro
res)
A
s at
31
.3.2
016
(` in
Cro
res)
Num
ber o
f U
nits
A
s at
31
.3.2
015
(` in
Cro
res)
IIN
VEST
MEN
TS IN
EQ
UIT
Y SH
ARE
S
A)
QU
OTE
D E
QU
ITY
SHA
RES
(i)IN
OTH
ER C
OM
PAN
IES
MC
X Li
mite
d(C
urre
nt Y
ear C
ost `
40,
000/
-, Pr
evio
us Y
ear
` 40
,000
/-)
5,0
00
10.
00
0.0
1 -
5,0
00
-
Sub
-Tot
al (i
) -
-
B)U
NQ
UO
TED
EQ
UIT
Y SH
ARE
S(ii
)IN
ASS
OCI
ATE
COM
PAN
IES
NAT
ION
AL
SEC
URI
TIES
DEP
OSI
TORY
LIM
ITED
10,
018,
000
10.
00
10.
02
102
.14
10,
018,
000
78.
83
BFSI
SEC
TOR
SKIL
L CO
UN
CIL
OF
IND
IA (S
ectio
n 8
Com
pany
) 1
0,00
0,00
0 1
.00
1.0
0 1
.00
10,
000,
000
1.0
0
NSD
L E-
GO
VERN
AN
CE
INFR
AST
RUC
TURE
LIM
ITED
10,
018,
000
55.
00
55.
10
141
.80
10,
018,
000
126
.40
COM
PUTE
R A
GE
MA
NA
GEM
ENT
SERV
ICES
PR
IVAT
E LI
MIT
ED 2
1,93
8,40
0 1
87.8
6 4
12.1
3 4
54.8
0 2
1,93
8,40
0 4
33.8
1
POW
ER E
XCH
AN
GE
IND
IA L
IMIT
ED 1
5,00
0,03
0 1
0.03
1
5.04
-
15,
000,
030
- M
ARK
ET S
IMPL
IFIE
D IN
DIA
LIM
ITED
9,0
10,3
50
10.
00
9.0
1 7
.20
4,5
05,1
75
6.9
6 S
ub-T
otal
(ii)
706
.94
647
.00
(iii)
IN O
THER
CO
MPA
NIE
SN
ATIO
NA
L CO
MM
OD
ITY
& D
ERIV
ATIV
E EX
CH
AN
GE
LTD
. 7
,601
,377
1
0.00
5
9.55
5
9.54
7
,601
,377
5
9.54
GO
OD
S A
ND
SER
VIC
E TA
X N
ETW
ORK
1,0
00,0
00
10.
00
1.0
0 1
.00
1,0
00,0
00
1.0
0 S
ub-T
otal
(iii)
6
0.54
6
0.54
Tota
l ( I
) 7
67.4
8 7
07.5
4

24
National Stock Exchange of India LimitedM
atur
ity
Dat
e N
umbe
r of
Uni
ts
Fac
e Va
lue
per U
nit
(`)
Fac
e va
lue
(` in
Cro
res)
A
s at
31
.3.2
016
(` in
Cro
res)
Num
ber o
f U
nits
A
s at
31
.3.2
015
(` in
Cro
res)
IIIN
VEST
MEN
TS IN
PRE
FERE
NCE
SH
ARE
SU
NQ
UO
TED
PRE
FERE
NCE
SH
ARE
SIN
ASS
OCI
ATE
COM
PAN
Y10
% O
PTIO
NA
LLY
CON
VERT
IBLE
RED
EEM
ABL
E PR
EFRE
NC
E SH
ARE
S O
F PO
WER
EXC
HA
NG
E IN
DIA
LI
MIT
ED
5,0
00,0
00
10.
03
5.0
1 5
.01
5,0
00,0
00
5.0
1
Tota
l ( II
) 5
.01
5.0
1
III
EXCH
AN
GE
TRA
DED
FU
ND
SQ
UO
TED
GO
LDM
AN
SA
CH
S BA
NKI
NG
IND
EX E
XCH
AN
GE
TRA
DED
SC
HEM
E 5
8,16
1 1
,573
.74
9.1
5 9
.15
- -
GO
LDM
AN
SA
CH
S M
F BA
NK
BEES
439
,839
1
,764
.81
77.
62
77.
63
160
,000
3
0.32
G
OLD
MA
N S
AC
HS
MU
TUA
L FU
ND
- C
PSE
ETF
- G
ROW
TH O
PTIO
N 4
0,51
9,99
4 2
1.74
8
8.08
8
8.08
6
,500
,000
1
6.01
GO
LDM
AN
SA
CH
S N
IFTY
ETF
- N
IFTY
BEE
S 1
,026
,000
8
14.0
6 8
3.52
8
3.52
2
80,0
00
24.
38
GO
LDM
AN
SA
CH
S N
IFTY
EXC
HA
NG
E TR
AD
ED
SCH
EME
- IN
F732
E010
11 3
34,7
37
10.
00
0.3
3 2
7.53
1
47,5
55
12.
42
Gol
dman
Sac
hs N
ifty
Exch
ange
Tra
ded
Sche
me-
Nift
y Be
ES 1
14,3
10
797
.87
9.1
2 9
.12
- -
ICIC
I PRU
DEN
TIA
L N
IFTY
ETF
3,3
90,0
00
78.
58
26.
64
26.
64
- -
KOTA
K M
AH
IND
RA M
F - K
OTA
K BA
NKI
NG
ETF
1,6
12,4
50
159
.91
25.
78
25.
78
- -
R SH
ARE
S RE
LIA
NC
E M
F BA
NKI
NG
ETF
74,
500
1,6
74.4
6 1
2.47
1
2.48
-
- SB
I-ETF
NIF
TY 5
0 4
,691
,478
7
7.31
3
6.27
3
6.27
-
- To
tal (
III )
3
96.2
2 8
3.13
IVQ
UO
TED
BO
ND
S(i)
TAX
FREE
BO
ND
S 6.
86%
IND
IA IN
FRA
STRU
CTU
RE F
INA
NC
E CO
MPA
NY
LIM
ITED
- 26
MA
R 20
2326
/Mar
/23
250
,000
1
,000
.00
25.
00
24.
49
- -
7% H
UD
CO TA
XFRE
E BO
ND
OC
T25
08/O
ct/2
5 1
00
1,0
00,1
00.0
0 1
0.00
1
0.00
-
-7.
07%
HU
DCO
TAXF
REE
BON
DS
01O
CT2
501
/Oct
/25
100
1
,000
,000
.00
10.
00
10.
00
- -
7.15
% N
TPC
LIM
ITED
- 21
AU
G 2
025
21/A
ug/2
5 1
50
1,0
00,0
00.0
0 1
5.00
1
5.02
-
- 7.
18 %
IND
IAN
RA
ILW
AY F
INA
NC
E CO
RPN
LTD
- TR
AN
CH
E 1
- SER
IES
119
/Feb
/23
150
,000
1
,000
.00
15.
00
15.
00
150
,000
1
5.00

Twenty-Fourth Annual Report FY 2015-2016
25
Mat
urity
D
ate
Num
ber o
f U
nits
F
ace
Valu
e pe
r Uni
t (`
)
Fac
e va
lue
(` in
Cro
res)
A
s at
31
.3.2
016
(` in
Cro
res)
Num
ber o
f U
nits
A
s at
31
.3.2
015
(` in
Cro
res)
7.18
% IN
DIA
N R
AIL
WAY
FIN
AN
CE
CORP
ORA
TIO
N
LIM
ITED
19
/Feb
/23
150
,000
1
,000
.00
15.
00
15.
00
150
,000
1
5.00
7.19
% H
OU
SIN
G &
URB
AN
DEV
ELO
PMEN
T CO
RPO
RATI
ON
LIM
ITED
28
MA
RCH
202
828
/Mar
/28
100
1
,000
,000
.00
10.
00
10.
09
- -
7.19
% IN
DIA
INFR
AST
RUC
TURE
FIN
AN
CE
COM
PAN
Y LI
MIT
ED -
22 JA
N 2
023
22/J
an/2
3 1
00,0
00
1,0
44.8
4 1
0.45
1
0.02
-
-
7.19
% IN
DIA
N R
AIL
WAY
FIN
AN
CE
CORP
ORA
TIO
N
LTD
- 31
JUL
2025
31/J
ul/2
5 5
00
1,0
00,0
00.0
0 5
0.00
5
0.11
-
-
7.28
% N
ATIO
NA
L H
IGH
WAY
S AU
THO
RITY
OF
IND
IA S
EP 2
030
18/S
ep/3
0 1
,250
1
,000
,000
.00
125
.00
125
.21
- -
7.34
% IN
DIA
N R
AIL
WAY
FIN
AN
CE
CORP
ORA
TIO
N
LTD
19-
FEB-
2028
19/F
eb/2
8 1
00
1,0
00,0
00.0
0 1
0.00
1
0.17
-
-
7.35
% N
ABA
RD 2
3032
031
23/M
ar/3
1 2
50
1,0
00,0
00.0
0 2
5.00
2
5.90
-
- 7.
35%
Nat
iona
l Hig
hway
s A
utho
rity
of In
dia
11
Jan,
2031
11/J
an/3
1 1
00,0
00
1,0
00.0
0 1
0.00
1
0.06
-
-
7.36
% IN
DIA
INFR
AST
RUC
TURE
FIN
AN
CE
COM
PAN
Y LI
MIT
ED -
22 JA
N 2
028
22/J
an/2
8 1
00
1,0
00,0
00.0
0 1
0.00
1
0.20
-
-
7.51
% H
UD
CO TA
XFRE
E BO
ND
S - 1
6FEB
2028
16/F
eb/2
8 1
00,2
50
3,4
91.2
7 3
5.00
3
6.10
-
- 7.
93 %
RU
RAL
ELEC
TRIF
ICAT
ION
CO
RPN
LTD
- TR
AN
CH
E 1
- SER
IES
1 27
/Mar
/22
61,
238
1,0
00.0
0 6
.12
6.1
2 6
1,23
8 6
.12
8.00
% IN
DIA
N R
AIL
WAY
FIN
AN
CE
CORP
N L
TD -
TRA
NC
HE
1 - S
ERIE
S 1
23/F
eb/2
2 3
2,62
6 1
,000
.00
3.2
6 3
.26
32,
626
3.2
6
8.00
% IN
DIA
N R
AIL
WAY
FIN
AN
CE
CORP
ORA
TIO
N
LIM
ITED
23
/Feb
/22
32,
626
1,0
00.0
0 3
.26
3.2
6 3
2,62
6 3
.26
8.09
% -
POW
ER F
INA
NC
E CO
RPO
RATI
ON
- SE
RIES
80
A25
/Nov
/21
500
1
00,0
00.0
0 5
.00
5.0
0 5
00
5.0
0
8.20
% N
ATIO
NA
L H
IGH
WAY
S AU
THO
RITY
OF
IND
IA25
/Jan
/22
37,
086
1,0
00.0
0 3
.71
3.7
1 3
7,08
6 3
.71
8.20
% N
ATIO
NA
L H
IGH
WAY
S AU
THO
RITY
OF
IND
IA -
TRA
NC
HE
1 - S
ERIE
S 1
25/J
an/2
2 8
6 1
,000
.00
0.0
1 -
86
0.0
0
8.20
% P
OW
ER F
INA
NA
CE
CORP
ORA
TIO
N L
IMIT
ED
01/F
eb/2
2 9
2,71
8 1
,000
.00
9.2
7 9
.31
92,
718
9.3
2 8.
20%
PO
WER
FIN
AN
CE
CORP
ORA
TIO
N L
IMIT
ED -
TRA
NC
HE
1 - S
ERIE
S 1
01/F
eb/2
2 4
2,71
8 1
,000
.00
4.2
7 4
.27
42,
718
4.2
7
8.35
% IN
DIA
N R
AIL
WAY
FIN
AN
CE
CORP
ORA
TIO
N
LTD
TAX
FREE
21-
NO
V-20
2321
/Nov
/23
150
1
,000
,000
.00
15.
00
15.
00
150
1
5.00
8.40
% IR
FC-T
AXF
REE-
18FE
B202
918
/Feb
/29
550
1
81,8
18.1
8 1
0.00
1
1.05
-
- 8.
41%
NTP
C L
IMIT
ED16
/Dec
/23
79,
162
1,0
00.0
0 7
.92
7.9
2 7
9,16
2 7
.92

26
National Stock Exchange of India LimitedM
atur
ity
Dat
e N
umbe
r of
Uni
ts
Fac
e Va
lue
per U
nit
(`)
Fac
e va
lue
(` in
Cro
res)
A
s at
31
.3.2
016
(` in
Cro
res)
Num
ber o
f U
nits
A
s at
31
.3.2
015
(` in
Cro
res)
8.46
% IN
DIA
INFR
AST
RUC
TURE
FIN
AN
CE
COM
PAN
Y LI
MIT
ED -
30 A
UG
202
830
/Aug
/28
200
1
,000
,000
.00
20.
00
22.
07
- -
8.46
% N
ATIO
NA
L H
OU
SIN
G B
AN
K - S
ERIE
S V
- 20
2830
/Aug
/28
250
1
,000
,000
.00
25.
00
26.
87
50
5.0
0
8.46
% R
URA
L EL
ECTR
IFIC
ATIO
N C
ORP
ORA
TIO
N
LIM
ITED
- 24
SEP
202
824
/Sep
/28
250
,000
1
,000
.00
25.
00
27.
29
- -
8.46
% R
URA
L EL
ECTR
IFIC
ATIO
N C
ORP
ORA
TIO
N
LIM
ITED
- N
ON
CO
NVE
RTIB
LE B
ON
DS
29/A
ug/2
8 1
00
1,0
00,0
00.0
0 1
0.00
1
0.01
1
00
10.
00
8.48
% IN
DIA
INFR
AST
RUC
TURE
FIN
AN
CE
COM
PAN
Y LI
MIT
ED 0
5 SE
P 20
2805
/Sep
/28
150
1
,000
,000
.00
15.
00
16.
45
- -
9.00
% IN
DIA
N R
AIL
WAY
FIN
AN
CE
CORP
ORA
TIO
N
LIM
ITED
28/F
eb/1
5 -
- 0
.01
Sub
-Tot
al (i
) 5
48.9
8 1
02.8
8
(ii)
TAXA
BLE
BON
DS
11.2
5% P
OW
ER F
INA
NC
E CO
RPO
RATI
ON
LIM
ITED
28
/Nov
/18
100
1
,000
,000
.00
10.
00
10.
46
100
1
0.63
7.
87%
EXP
ORT
IMPO
RT B
AN
K O
F IN
DIA
- 16
MAY
20
1616
/May
/16
- -
- -
250
2
4.85
8.33
% U
NIO
N B
AN
K 19
MAY
201
619
/May
/16
- 1
,000
,000
.00
10.
00
- 1
00
10.
00
8.39
% P
OW
ER F
INA
NC
E CO
RPO
RATI
ON
LIM
ITED
- 19
APR
IL 2
025
19/A
pr/2
5 2
50
1,0
00,0
00.0
0 2
5.00
2
4.79
-
-
8.40
% P
OW
ER G
RID
CO
RPO
RATI
ON
OF
IND
IA
LIM
ITED
- 27
MAY
202
427
/May
/24
50
1,0
00,0
00.0
0 5
.00
4.9
5 -
-
8.70
% P
OW
ER G
RID
CO
RPO
RATI
ON
OF
IND
IA
LIM
ITED
15/J
ul/1
8 5
0 1
,000
,000
.00
5.0
0 4
.92
50
4.8
9
8.70
% P
OW
ER G
RID
CO
RPO
RATI
ON
OF
IND
IA
LIM
ITED
15/J
ul/2
3 5
0 1
,000
,000
.00
5.0
0 4
.80
50
4.7
8
8.78
% P
OW
ER F
INA
NC
E CO
RPO
RATI
ON
LIM
ITED
- 11
DEC
201
611
/Dec
/16
- -
- -
5
0.5
0
8.80
% P
OW
ER G
RID
CO
RPO
RATI
ON
OF
IND
IA
LIM
ITED
13/M
ar/2
3 6
00
1,0
00,0
00.0
0 6
0.00
5
9.99
5
00
49.
86
8.82
% R
URA
L EL
ECTR
IFIC
ATIO
N C
ORP
ORA
TIO
N
LIM
ITED
- SR
114
12/A
pr/2
3 2
50
1,0
00,0
00.0
0 2
5.00
2
4.92
2
50
24.
90
8.95
% N
ABA
RD T
XB 0
1 JA
N 2
018
01/J
an/1
8 2
,500
2
0,00
0.00
5
.00
4.3
7 2
,500
4
.01
Sub
-Tot
al (i
i) 1
39.2
0 1
34.4
2

Twenty-Fourth Annual Report FY 2015-2016
27
Mat
urity
D
ate
Num
ber o
f U
nits
F
ace
Valu
e pe
r Uni
t (`
)
Fac
e va
lue
(` in
Cro
res)
A
s at
31
.3.2
016
(` in
Cro
res)
Num
ber o
f U
nits
A
s at
31
.3.2
015
(` in
Cro
res)
UN
QU
OTE
D(i)
TAXA
BLE
BON
DS
6 %
NAT
ION
AL
HIG
HW
AYS
AUTH
ORI
TY O
F IN
DIA
- T
XB -
2017
31/M
ar/1
7 -
- -
- 1
,000
1
.00
Sub
-Tot
al (i
ii)
- 1
.00
Tota
l ( IV
) 6
88.1
8 2
38.3
0
V Q
UO
TED
DEB
ENTU
RES
0% H
DFC
- D
EB -
16-J
AN
-201
716
/Jan
/17
- -
- -
250
3
3.67
0%
INFR
AST
RUC
TURE
LEA
SIN
G &
FIN
AN
CIA
L SE
RVIC
ES L
IMIT
ED -
10 A
PR 2
018
10/A
pr/2
8 1
50
1,0
00,0
00.0
0 1
5.00
1
6.24
10.0
5% H
DB
FIN
AN
CIA
L SE
RVIC
ES L
IMIT
ED -
NC
D
10-F
EB-2
017
10/F
eb/1
7 1
00
1,0
00,0
00.0
0 1
0.00
-
150
1
5.02
10.1
7% H
DB
FIN
AN
CIA
L SE
RVIC
ES L
IMIT
ED -
11
NO
V 20
1611
/Nov
/16
- -
- -
350
3
5.20
10.1
8% L
IC H
OU
SIN
G F
INA
NC
E - D
EB -
19-S
EP-
2016
19/S
ep/1
6 2
00
1,0
00,0
00.0
0 2
0.00
-
200
2
0.15
10.2
5% M
AH
IND
RA &
MA
HIN
DRA
FIN
AN
CIA
L SE
RVIC
ES L
IMIT
ED-D
EB-0
8-O
CT-
2018
08/O
ct/1
8 5
0 1
,000
,000
.00
5.0
0 5
.17
- -
10.6
0% L
IC H
OU
SIN
G F
INA
NC
E - D
EB -
06-S
EPT-
2016
06/S
ep/1
6 5
0 1
,000
,000
5
.00
- 8
00
80.
99
8.54
% H
DB
FIN
AN
CIA
L SE
RVIC
ES L
IMIT
ED -
03 JU
N
2016
03/J
un/1
6 -
- -
- 2
50
24.
76
8.58
% IN
FRA
STRU
CTU
RE L
EASI
NG
& F
INA
NC
IAL
SERV
ICES
LIM
ITED
- 01
DEC
201
801
/Dec
/18
250
1
,000
,000
.00
25.
00
25.
00
- -
8.70
% IL
&FS
FIN
AN
CIA
L SE
RVIC
ES L
IMIT
ED-N
CD
--30
SP20
18-
30/S
ep/1
8 2
50
1,0
00,0
00.0
0 2
5.00
2
5.00
-
-
8.70
% K
OTA
K M
AH
IND
RA IN
VEST
MEN
T LT
D 1
1 AU
G 2
017
11/A
ug/1
7 2
50
1,0
00,0
00.0
0 2
5.00
2
5.00
-
-
8.71
% C
AN
FIN
HO
MES
LTD
- 07
AU
G 2
018
07/A
ug/1
8 3
50
1,0
00,0
00.0
0 3
5.00
3
5.00
-
- 8.
71%
HD
B FI
NA
NC
IAL
SERV
ICES
LIM
ITED
- 20
O
CT
2018
20/O
ct/1
8 1
00
1,0
00,0
00.0
0 1
0.00
1
0.03
-
-
8.74
% IN
FRA
STRU
CTU
RE L
EASI
NG
& F
INA
NC
IAL
SERV
ICES
LIM
ITED
- 10
AU
G 2
018
10/A
ug/1
7 3
50
1,0
00,0
00.0
0 3
5.00
3
5.02
-
-
8.75
% M
AH
IND
RA &
MA
HIN
DRA
FIN
AN
CIA
L SE
RVIC
ES L
IMIT
ED -
31 JU
L 20
1731
/Jul
/17
400
1
,000
,000
.00
40.
00
40.
02
- -

28
National Stock Exchange of India LimitedM
atur
ity
Dat
e N
umbe
r of
Uni
ts
Fac
e Va
lue
per U
nit
(`)
Fac
e va
lue
(` in
Cro
res)
A
s at
31
.3.2
016
(` in
Cro
res)
Num
ber o
f U
nits
A
s at
31
.3.2
015
(` in
Cro
res)
8.75
% M
AH
IND
RA &
MA
HIN
DRA
FIN
AN
CIA
L SE
RVIC
ES L
IMIT
ED -
AUG
201
704
/Aug
/17
50
1,0
00,0
00.0
0 5
.00
5.0
0 -
-
8.77
% IC
ICI H
OM
E FI
NA
NC
E CO
. LTD
.-D
EB-2
1122
018
21/D
ec/1
8 5
00
500
,000
.00
25.
00
25.
00
- -
8.80
% C
AN
FIN
HO
MES
LTD
- D
EB -
02 JU
L 20
1802
/Jul
/18
100
1
,000
,000
.00
10.
00
10.
00
- -
8.80
% K
OTA
K M
AH
IND
RA P
RIM
E LI
MIT
ED -
15
MA
R 20
1815
/Mar
/18
150
1
,000
,000
.00
15.
00
15.
00
- -
8.80
% K
OTA
K M
AH
IND
RA P
RIM
E LI
MIT
ED -
26 JU
N
2018
26/J
un/1
8 2
00
1,0
00,0
00.0
0 2
0.00
1
9.99
-
-
8.80
% K
OTA
K M
AH
IND
RA P
RIM
E LI
MIT
ED 1
0 JU
L 20
1826
/Jun
/18
250
1
,000
,000
.00
25.
00
24.
99
- -
8.80
% K
OTA
K M
AH
IND
RA P
RIM
E LI
MIT
ED 1
0 JU
L 20
1810
/Jul
/18
150
1
,000
,000
.00
15.
00
15.
00
- -
8.80
75%
MA
HIN
DRA
& M
AH
IND
RA F
INA
NC
IAL
SERV
ICES
LIM
ITED
- 15
MAY
201
715
/May
/17
250
1
,000
,000
.00
25.
00
24.
95
- -
8.90
% IL
&FS
FIN
AN
CIA
L SE
RVIC
ES L
IMIT
ED-
DEB
-210
3201
921
/Mar
/19
250
1
,000
,000
.00
25.
00
25.
00
- -
8.90
% K
OTA
K M
AH
IND
RA IN
VEST
MEN
T LT
D N
CD
- 11
SEP
201
711
/Sep
/17
250
1
,000
,000
.00
25.
00
25.
00
- -
9.00
% R
ELIA
NC
E C
API
TAL
LIM
ITED
28
JULY
201
728
/Jul
/17
250
1
,000
,000
.00
25.
00
25.
00
- -
9.05
% F
ULL
ERTO
N IN
DIA
CRE
DIT
CO
MA
PNY
LIM
ITED
- 30
APR
IL 2
018
- SER
IES
33-A
30/A
pr/1
8 5
0 1
,000
,000
.00
5.0
0 5
.00
- -
9.06
% H
DB
FIN
AN
CIA
L SE
RVIC
ES L
IMIT
ED -
DEB
- 20
DEC
2016
20/J
un/1
6 1
50
1,0
00,0
00.0
0 1
5.00
-
150
1
5.00
9.10
% H
DB
FIN
AN
CIA
L SE
RVIC
ES L
IMIT
ED -
NC
D -
29 D
EC 2
017
29/D
ec/1
7 1
50
1,0
00,0
00.0
0 1
5.00
1
5.00
1
50
15.
00
9.15
% H
OU
SIN
G D
EVEL
OPM
ENT
FIN
AN
CE
CORP
ORA
TIO
N L
TD -
NC
D -
SR K
028
- 03
APR
201
603
/Apr
/16
50
1,0
00,0
00.0
0 5
.00
- 5
0 4
.96
9.65
% IL
&FS
FIN
AN
CIA
L SE
RVIC
ES L
IMIT
ED -
DEB
- 18
SEP
201
718
/Sep
/17
250
1
,000
,000
.00
25.
00
25.
00
250
2
5.00
9.65
% IL
&FS
FIN
AN
CIA
L SE
RVIC
ES L
IMIT
ED -
DEB
- 18
SEP
201
718
/Sep
/17
30
1,0
00,0
00.0
0 3
.00
3.0
0 3
0 3
.00
9.68
% TA
TA S
ON
S LI
MIT
ED -
DEB
- 10
-JA
N-2
017
10/J
an/1
7 5
0 1
,000
,000
.00
5.0
0 -
50
5.0
1 9.
71%
TATA
SO
NS
LIM
ITED
- 13
DEC
201
613
/Dec
/16
- -
- -
250
2
5.09
9.
75%
HD
FC -
DEB
- 10
-OC
T-20
1610
/Oct
/16
50
1,0
00,0
00.0
0 5
.00
- 5
0 5
.02
Tota
l ( V
) 4
79.4
0 3
07.8
6

Twenty-Fourth Annual Report FY 2015-2016
29
Mat
urity
D
ate
Num
ber o
f U
nits
F
ace
Valu
e pe
r Uni
t (`
)
Fac
e va
lue
(` in
Cro
res)
A
s at
31
.3.2
016
(` in
Cro
res)
Num
ber o
f U
nits
A
s at
31
.3.2
015
(` in
Cro
res)
VI
QU
OTE
DG
OVE
RNM
ENT
SECU
RITI
ES7.
72%
GO
VERN
MEN
T O
F IN
DIA
25
MAY
202
525
/May
/25
525
,000
1
0,00
0.00
5
25.0
0 5
28.9
3 -
- 7.
88%
GO
VERN
MEN
T O
F IN
DIA
- 19
-MA
R-20
3019
/Mar
/30
25,
000
10,
000.
00
25.
00
25.
30
- -
8.15
% G
OVE
RNM
ENT
OF
IND
IA -
24 N
OV
2026
24/N
ov/2
6 1
5,00
0 1
0,00
0.00
1
5.00
1
5.53
1
5,00
0 1
5.58
8.
40%
GO
VERN
MEN
T O
F IN
DIA
- 28
JUL
2024
28/J
ul/2
4 8
0,00
0 1
0,00
0.00
8
0.00
8
3.26
8
0,00
0 8
3.65
8.
60%
GO
VERN
MEN
T O
F IN
DIA
- 02
JUN
202
802
/Jun
/28
220
,000
1
0,00
0.00
2
20.0
0 2
33.9
7 1
70,0
00
182
.12
8.67
% M
AH
ARA
SHTR
A S
DL
24FE
B202
624
/Feb
/26
5,0
00
10,
000.
00
5.0
0 5
.07
- -
8.72
% A
P SD
L 06
FEB
202
306
/Feb
/23
25,
000
10,
000.
00
25.
00
25.
74
2,5
00,0
00
25.
84
9.20
% G
OVE
RNM
ENT
OF
IND
IA -
30 S
EP 2
030
30/S
ep/3
0 1
30,0
00
10,
000.
00
130
.00
145
.32
130
,000
1
46.3
8 9.
23%
GO
VERN
MEN
T O
F IN
DIA
- 23
DEC
204
323
/Dec
/43
160
,000
1
0,00
0.00
1
60.0
0 1
86.0
2 1
60,0
00
186
.96
Tota
l ( V
I )
1,2
49.1
4 6
40.5
3
VII
MU
TUA
L FU
ND
SQ
UO
TED
Can
nara
Rob
ecco
Liq
uid-
Fun
d In
stitu
tiona
l G
row
th P
lan
4,2
79
0.5
0 4
,279
0
.50
HD
FC C
ASH
MA
NA
GEM
ENT
SAVI
NG
S PL
AN
G
ROW
TH 5
79,4
94
0.7
8 5
79,4
94
0.7
8
DSP
MER
ILLY
NC
H L
IQU
IDIT
Y FU
ND
GRO
WTH
302
,847
0
.50
302
,847
0
.50
UTI
LIQ
UID
CA
SH P
LAN
REG
ULA
R G
ROW
TH 4
,522
0
.50
4,5
22
0.5
0 To
tal (
VII
) 2
.28
2.2
8
GRA
ND
TO
TAL
(I+II+
III+I
V+V+
VI+V
II)
3,5
87.7
0 1
,984
.65
Not
es :
As
at 3
1.3.
2016
`
in C
rore
s A
s at
31.
3.20
15
` in
Cro
res
(a)
Agg
rega
te B
ook
Valu
e - Q
uote
d In
vest
men
ts 2
,815
.21
1,2
71.1
0 (b
) A
ggre
gate
Mar
ket V
alue
of Q
uote
d In
vest
men
ts 2
,801
.26
1,2
98.6
8 (c
) A
ggre
gate
Boo
k Va
lue
- Unq
uote
d In
vest
men
ts 7
72.4
9 7
13.5
5

30
National Stock Exchange of India Limited
10 Deferred Tax Assets (net) 31.03.2016
(` in Crores) 31.03.2015(` in Crores)
Deferred Tax AssetsRelated to disallowance u/s 43B 1.76 1.46
Related to depreciation and other expenditure 2.08 1.90
Related to other items 0.03 0.10
Total (A) 3.87 3.46
Less : Deferred Tax LiabilitiesRelated to depreciation and other expenditure - -
Related to other items - -
Total (B) - -
Net Deferred Tax Asset (A-B) 3.87 3.46
11 Loans and advances
Long Term Short Term 31.03.2016 (` in Crores)
31.03.2015 (` in Crores)
31.03.2016 (` in Crores)
31.03.2015 (` in Crores)
Capital advancesSecured, considered good - - - -
Unsecured, considered good 1.36 9.40 - -
(A) 1.36 9.40 - -
Security depositSecured, considered good - - - -
Unsecured, considered good 6.47 6.40 - -
(B) 6.47 6.40 - -
Loan and advances to related partiesSecured, considered good - - - -
Unsecured, considered good - - 0.22 0.01
(C) - - 0.22 0.01
Advances recoverable in cash or kind Secured, considered good - - - -
Unsecured, considered good 0.50 - 22.17 22.63
(D) 0.50 - 22.17 22.63
Other loans and advances (unsecured, considered good)Income Tax paid including TDS (Net of Provisions) 265.01 79.56 4.86 9.56
Fringe Benefit Tax (Net of Provisions) 2.21 2.21 - -

Twenty-Fourth Annual Report FY 2015-2016
31
Long Term Short Term 31.03.2016 (` in Crores)
31.03.2015 (` in Crores)
31.03.2016 (` in Crores)
31.03.2015 (` in Crores)
Wealth Tax (Net of Provisions) 0.02 0.02 - -
Prepaid Expenses 2.09 3.89 27.80 14.17
Securities Transaction Tax paid * 10.59 10.59 - -
Others 0.20 0.20 0.10 0.72
(E) 280.12 96.47 32.76 24.45
Total (A+B+C+D+E) 288.45 112.27 55.15 47.09
31.03.2016 (` in Crores)
31.03.2015 (` in Crores)
Loan and advances to related partiesReceivable Exchange of India Limited 0.21 - National Securities Depository limited 0.01 0.01
* Pertains to amounts recovered by tax authorities towards STT, Interest and penalty thereon collectible from few members and ad-hoc STT, interest and penalty thereon which is disputed by the Company. Out of this an amount of ` 5.39 crores is recovered by the Company from the respective members and held as deposit shown under the head other long term liabilities.
12 Other assets Non-current Current
31.03.2016 (` in Crores)
31.03.2015 (` in Crores)
31.03.2016 (` in Crores)
31.03.2015 (` in Crores)
Unsecured, considered good unless stated otherwiseNon-current bank balances (Refer Note 16 ) 521.59 865.88 - - Unbilled Revenue - - 2.65 7.79 Other receivable (Unsecured, considered good) - - - 0.82
521.59 865.88 2.65 8.61 OthersInterest accrued on Investments 5.40 17.05 118.41 118.17 Interest accrued on certificate of deposits - - - - Interest accrued on Bank deposits 47.37 26.20 122.96 197.62 Receivable from member towards Core SGF (Refer note 31)
- - 16.42 113.11
Other receivables (Unsecured, considered good) (Refer note 37)
- - 38.86 76.10
52.77 43.25 296.65 505.00
Total 574.36 909.13 299.30 513.61

32
National Stock Exchange of India Limited13
- CU
RREN
T IN
VEST
MEN
TS
Mat
urity
D
ate
Num
ber o
f U
nits
F
ace
Valu
e pe
r Uni
t (`
)
Fac
e va
lue
(` in
Cro
res)
A
s at
31
.3.2
016
(` in
Cro
res)
Num
ber o
f U
nits
A
s at
31
.3.2
015
(` in
Cro
res)
ICU
RREN
T PO
RTIO
N O
F LO
NG
TER
M
INVE
STM
ENTS
(VA
LUED
AT
COST
UN
LESS
STA
TED
O
THER
WIS
E)
A)
BON
DS
(i)Q
UO
TED
TAXA
BLE
BON
DS
7.87
% E
XPO
RT IM
PORT
BA
NK
OF
IND
IA -
16 M
AY
2016
16-M
ay-1
6 2
50
1,0
00,0
00
25.
00
24.
98
- -
6 %
NAT
ION
AL
HIG
HW
AYS
AUTH
ORI
TY O
F IN
DIA
- TX
B - 2
017
31-M
ar-1
7 5
00
10,
000
0.5
0 0
.50
8.33
% U
NIO
N B
AN
K 19
MAY
201
619
-May
-16
100
1
,000
,000
1
0.00
1
0.00
-
-
8.78
% P
OW
ER F
INA
NC
E CO
RPO
RATI
ON
LIM
ITED
- 11
DEC
201
611
-Dec
-16
5
1,0
00,0
00
0.5
0 0
.49
- -
8.88
% N
ATIO
NA
L BA
NK
FOR
AG
RIC
ULT
URA
L RU
RAL
DEV
EL S
R-XI
II O
25
SEP
2015
25-S
ep-1
5 -
1,0
00,0
00
- -
100
9
.99
9% M
AH
IND
RA &
MA
HIN
DRA
FIN
AN
CIA
L SE
RVIC
ES
LIM
ITED
- 04
MAY
201
54-
May
-15
- 1
,000
,000
-
- 1
50
14.
99
9.14
% IN
FRA
STRU
CTU
RE D
EVEL
OPM
ENT
FIN
AN
CE
COM
PAN
Y LI
MIT
ED -
27 JA
N 2
016
27-J
an-1
6 -
1,0
00,0
00
- -
100
1
0.03
9.35
% IN
DIA
N O
IL C
ORP
ORA
TIO
N L
IMIT
ED30
-Apr
-15
150
1
,000
,000
1
5.00
-
150
1
4.99
Sub
-Tot
al (i
) 3
5.96
5
0.00
(ii)
QU
OTE
D TA
XFRE
E BO
ND
S
6.05
% IN
DIA
N R
AIL
WAY
FIN
AN
CE
CORP
ORA
TIO
N
LIM
ITED
- SE
RIES
73
20-D
ec-1
5 5
00
100
,000
5
.00
- 1
,000
1
0.00
Sub
-Tot
al (i
i) -
10.
00

Twenty-Fourth Annual Report FY 2015-2016
33
Mat
urity
D
ate
Num
ber o
f U
nits
F
ace
Valu
e pe
r Uni
t (`
)
Fac
e va
lue
(` in
Cro
res)
A
s at
31
.3.2
016
(` in
Cro
res)
Num
ber o
f U
nits
A
s at
31
.3.2
015
(` in
Cro
res)
(iii)
UN
QU
OTE
D TA
XABL
E BO
ND
S
6 %
NAT
ION
AL
HIG
HW
AYS
AUTH
ORI
TY O
F IN
DIA
- TX
B - 2
017
31-M
ar-1
7 5
00
10,
000
0.5
0 0
.50
- -
Sub
-Tot
al (i
ii)
0.5
0 -
B)D
EBEN
TURE
S
(iv)
QU
OTE
D
0% H
DFC
- D
EB -
16-J
AN
-201
716
-Jan
-17
250
1
,000
,000
2
5.00
3
6.86
-
-
10.0
5% H
DB
FIN
AN
CIA
L SE
RVIC
ES L
IMIT
ED -
NC
D
10-F
EB-2
017
10-F
eb-1
7 5
0 1
,000
,000
5
.00
5.0
1 -
-
10.6
0% L
IC H
OU
SIN
G F
INA
NC
E - D
EB -
06-S
EPT-
2016
6-Se
p-16
750
1
,000
,000
7
5.00
7
5.28
-
-
8.54
% H
DB
FIN
AN
CIA
L SE
RVIC
ES L
IMIT
ED -
03 JU
N
2016
3-Ju
n-16
250
1
,000
,000
2
5.00
2
4.96
-
-
8.85
% IN
FRA
STRU
CTU
RE D
EVEL
OPM
ENT
FIN
AN
CE
COM
PAN
Y LI
MIT
ED -N
CD
-27J
AN
1615
-Jan
-16
200
1
,000
,000
2
0.00
-
200
2
0.01
9.30
% TA
TA S
ON
S LI
MIT
ED -
DEB
- 24
DEC
201
524
-Dec
-15
50
1,0
00,0
00
5.0
0 -
50
5.0
1
9.5
0% H
DB
FIN
AN
CIA
L SE
RVIC
ES L
IMIT
ED -
22 D
EC
2015
22
-Dec
-15
50
1,0
00,0
00
5.0
0 -
50
5.0
0
9.55
% H
OU
SIN
G D
EVEL
OPM
ENT
FIN
AN
CE
CORP
ORA
TIO
N L
TD7-
Sep-
15 5
0 1
,000
,000
5
.00
- 5
0 5
.00
9.55
53%
HD
B FI
NA
NC
IAL
SERV
ICES
LIM
ITED
- N
CD
- 2
5 SE
P 20
1525
-Sep
-15
100
1
,000
,000
1
0.00
-
100
1
0.02
9.60
% H
OU
SIN
G D
EVEL
OPM
ENT
FIN
AN
CE
CORP
ORA
TIO
N L
IMIT
ED -
SR J
021
- 07
AUG
201
57-
Aug
-15
100
1
,000
,000
1
0.00
-
100
1
0.01
9.60
% H
OU
SIN
G D
EVEL
OPM
ENT
FIN
AN
CE
CORP
ORA
TIO
N L
TD
18-J
ul-1
5 2
00
1,0
00,0
00
20.
00
- 2
00
20.
02

34
National Stock Exchange of India LimitedM
atur
ity
Dat
e N
umbe
r of
Uni
ts
Fac
e Va
lue
per U
nit
(`)
Fac
e va
lue
(` in
Cro
res)
A
s at
31
.3.2
016
(` in
Cro
res)
Num
ber o
f U
nits
A
s at
31
.3.2
015
(` in
Cro
res)
9.70
% H
OU
SIN
G D
EVEL
OPM
ENT
FIN
AN
CE
CORP
ORA
TIO
N L
TD -
NC
D 1
6 A
PR 2
015
16-A
pr-1
5 1
50
1,0
00,0
00
15.
00
- 1
50
15.
00
9.71
% TA
TA S
ON
S LI
MIT
ED -
13 D
EC 2
016
13-D
ec-1
6 2
50
1,0
00,0
00
25.
00
25.
04
- -
9.78
% TA
TA S
ON
S LI
MIT
ED -
NC
D -
23 JU
L 20
1523
-Jul
-15
250
1
,000
,000
2
5.00
-
250
2
5.04
9.85
% H
OU
SIN
G D
EVEL
OPM
ENT
FIN
AN
CE
CORP
ORA
TIO
N L
IMIT
ED -
SR J0
05 -
05 JU
N 2
015
5-Ju
n-15
50
1,0
00,0
00
5.0
0 -
50
5.0
1
9.90
% TA
TA S
ON
S LI
MIT
ED 2
016
24-F
eb-1
6 1
50
1,0
00,0
00
15.
00
- 1
50
15.
03
Sub
-Tot
al (i
v)
167
.15
135
.15
Tota
l (I)
203
.61
195
.15
IICU
RREN
T IN
VEST
MEN
TS (v
alue
d at
low
er o
f cos
t or
fair
valu
e)
(A)
DEB
ENTU
RES
(i)
QU
OTE
D
0% S
HRI
RAM
TRA
NSP
ORT
FIN
AN
CE
CO L
TD –
24
MAY
201
624
-May
-16
50.
00
1,0
00,0
00.0
0 5
.00
6.6
1 -
-
0% S
UN
DA
RAM
BN
P PA
RIBA
S H
OM
E FI
NA
NC
E LI
MIT
ED -
28 M
AY 2
015
28-M
ay-1
5 -
- 2
3.15
-
200
.00
22.
84
0% TA
TA C
API
TAL
FIN
AN
CIA
L SE
RVIC
ES L
IMIT
ED -
NC
D -
30 JU
N 2
015
30-J
un-1
5 -
- 6
.73
- 5
0.00
6
.59
10%
FU
LLER
TON
IND
IA C
RED
IT C
OM
APN
Y LI
MIT
ED
- DEB
- 15
JAN
201
615
-Jan
-16
- -
10.
00
- 1
00.0
0 1
0.05
10.0
5% H
DB
FIN
AN
CIA
L SE
RVIC
ES L
IMIT
ED -
NC
D
10-F
EB-2
017
10-F
eb-1
7 1
00.0
0 1
,000
,000
.00
10.
00
10.
00
- -
10.1
0% S
UN
DA
RAM
FIN
AN
CE
LIM
ITED
- 11
JUL
2015
11-J
ul-1
5 -
- 1
0.00
-
100
.00
10.
02

Twenty-Fourth Annual Report FY 2015-2016
35
Mat
urity
D
ate
Num
ber o
f U
nits
F
ace
Valu
e pe
r Uni
t (`
)
Fac
e va
lue
(` in
Cro
res)
A
s at
31
.3.2
016
(` in
Cro
res)
Num
ber o
f U
nits
A
s at
31
.3.2
015
(` in
Cro
res)
10.1
7% H
DB
FIN
AN
CIA
L SE
RVIC
ES L
IMIT
ED -
11
NO
V 20
1611
-Nov
-16
350
.00
1,0
00,0
00.0
0 3
5.00
3
5.08
-
-
10.1
8% L
IC H
OU
SIN
G F
INA
NC
E - D
EB -
19-S
EP-2
016
19-S
ep-1
6 2
00.0
0 1
,000
,000
.00
20.
00
20.
04
- -
10.2
0% S
UN
DA
RAM
FIN
AN
CE
LIM
ITED
- D
EB -
14
MAY
201
514
-May
-15
- -
15.
00
- 1
50.0
0 1
5.01
10.2
3% S
HRI
RAM
TRA
NSP
ORT
FIN
AN
CE
COM
PAN
Y LI
MIT
ED -
03 JU
L 20
163-
Jul-1
6 1
00.0
0 1
,000
,000
.00
10.
00
10.
02
- -
10.4
0% TA
TA M
OTO
RS F
INA
NC
E LI
MIT
ED -
DEB
- 12
JU
N 2
015
12-J
un-1
5 -
- 2
5.00
-
250
.00
25.
03
10.4
0% TA
TA M
OTO
RS F
INA
NC
E LI
MIT
ED -
TXB
- 22
MAY
201
522
-May
-15
400
.00
4,0
00,0
00.0
0 4
0.00
-
400
.00
40.
02
10.5
0% F
ULL
ERTO
N IN
DIA
CRE
DIT
CO
MA
PNY
LIM
ITED
- 11
DEC
201
511
-Dec
-15
- -
35.
00
- 3
50.0
0 3
5.29
10.5
2% S
UN
DA
RAM
BN
P PA
RIBA
S H
OM
E FI
NA
NC
E LI
MIT
ED -
DEB
- 03
APR
201
53-
Apr
-15
- -
40.
00
- 4
00.0
0 4
0.00
10.5
7035
% A
DIT
YA B
IRLA
FIN
AN
CE
LIM
ITED
09
APR
20
159-
Apr
-15
- -
13.
00
- 1
30.0
0 1
3.00
10.5
9% A
DIT
YA B
IRLA
FIN
AN
CE
LIM
ITED
- D
EB -
18
MAY
201
518
-May
-15
- -
60.
00
- 6
00.0
0 6
0.10
10.6
0% L
IC H
OU
SIN
G F
INA
NC
E - D
EB -
06-S
EPT-
2016
6-Se
p-16
50.
00
1,0
00,0
00.0
0 5
.00
5.0
2 -
-
10.8
0 D
EWA
N H
OU
SIN
G F
INA
NC
E CO
RPO
RATI
ON
LT
D -
DEB
- 05
DEC
201
55-
Dec
-15
350
.00
4,0
00,0
00.0
0 8
5.00
-
850
.00
85.
50
10.9
5% F
ULL
ERTO
N IN
DIA
CRE
DIT
CO
MA
PNY
LIM
ITED
- 07
-OC
T-20
167-
Oct
-16
1,0
50.0
0 5
71,4
28.5
7 6
0.00
6
0.50
-
-
11.1
0% F
ULL
ERTO
N IN
DIA
CRE
DIT
CO
MA
PNY
LIM
ITED
- D
EB -
04 S
EP 2
015
4-Se
p-15
50.
00
1,0
00,0
00.0
0 5
.00
- 5
0.00
5
.03
11.5
0% F
ULL
ERTO
N IN
DIA
CRE
DIT
CO
MA
PNY
LIM
ITED
- 21
-AU
G-2
015
21-A
ug-1
5 -
- 2
5.00
-
250
.00
25.
17

36
National Stock Exchange of India LimitedM
atur
ity
Dat
e N
umbe
r of
Uni
ts
Fac
e Va
lue
per U
nit
(`)
Fac
e va
lue
(` in
Cro
res)
A
s at
31
.3.2
016
(` in
Cro
res)
Num
ber o
f U
nits
A
s at
31
.3.2
015
(` in
Cro
res)
11.6
0% S
HRI
RAM
TRA
NSP
ORT
FIN
AN
CE
COM
PAN
Y LI
MIT
ED -
11 JU
LY 2
016
11-J
ul-1
6 1
50.0
0 1
,000
,000
.00
15.
00
15.
09
- -
5% D
EWA
N H
OU
SIN
G F
INA
NC
E CO
RPO
RATI
ON
LTD
- 0
6 M
AY 2
016
6-M
ay-1
6 6
00.0
0 1
,000
,000
.00
60.
00
69.
43
- -
8.70
% B
AJA
J FIN
AN
CE
LIM
ITED
- 22
JUL
2015
22-J
ul-1
5 -
- 2
5.00
-
25.
00
24.
95
8.80
% K
OTA
K M
AH
IND
RA IN
VEST
MEN
T LT
D -
28
FEB
2017
28-F
eb-1
7 1
00.0
0 1
,000
,000
.00
10.
00
10.
00
- -
8.80
% K
OTA
K M
AH
IND
RA IN
VEST
MEN
T LT
D -
28
FEB
2017
INE9
75F0
7EJ4
28-F
eb-1
7 1
50.0
0 1
,000
,000
.00
15.
00
15.
00
- -
8.80
% S
UN
DA
RAM
FIN
AN
CE
LIM
ITED
- D
EB -
03
JUN
201
63-
Jun-
16 5
0.00
1
,000
,000
.00
5.0
0 5
.00
- -
8.90
% L
&T F
INA
NC
E CO
MPA
NY
LIM
ITED
- 20
MAY
20
1620
-May
-16
150
.00
1,0
00,0
00.0
0 1
5.00
1
4.99
-
-
8.91
% L
&T IN
FRA
STRU
CTU
RE F
INA
NC
E CO
MPA
NY
LIM
ITED
- D
EB -
16 A
PR 2
015
16-A
pr-1
5 -
- 1
0.00
-
100
.00
10.
00
8.95
% L
&T IN
FRA
STRU
CTU
RE F
INA
NC
E CO
MPA
NY
LIM
ITED
- 04
MAY
201
54-
May
-15
- -
25.
00
- 2
50.0
0 2
4.99
8.95
% L
&T IN
FRA
STRU
CTU
RE F
INA
NC
E CO
MPA
NY
LIM
ITED
- 15
JUN
201
515
-Jun
-15
- -
40.
00
- 4
00.0
0 3
9.96
9% S
HRI
RAM
TRA
NSP
ORT
FIN
AN
CE
COM
PAN
Y LI
MIT
ED -
DEB
- 17
JUN
201
617
-Jun
-16
350
.00
2,0
00,0
00.0
0 3
5.00
3
4.99
-
-
9.06
% H
DB
FIN
AN
CIA
L SE
RVIC
ES L
IMIT
ED -
DEB
- 20
DEC
2016
20-J
un-1
6 1
50.0
0 1
,000
,000
.00
15.
00
15.
00
- -
9.15
% H
OU
SIN
G D
EVEL
OPM
ENT
FIN
AN
CE
CORP
ORA
TIO
N L
TD -
NC
D -
SR K
028
- 03
APR
201
63-
Apr
-16
50.
00
1,0
00,0
00.0
0 5
.00
5.0
0 -
-
9.15
% S
HRI
RAM
TRA
NSP
ORT
FIN
AN
CE
COM
PAN
Y LI
MIT
ED -
02 JU
N 2
016
2-Ju
n-16
50.
00
1,0
00,0
00.0
0 5
.00
5.0
0 -
-
9.15
% TA
TA M
OTO
RS L
IMIT
ED -
03 JU
N 2
015
3-Ju
n-15
- -
75.
00
- 7
50.0
0 7
4.98
9.20
% M
AH
IND
RA &
MA
HIN
DRA
FIN
AN
CIA
L SE
RVIC
ES L
IMIT
ED -
DEB
- 22
APR
201
522
-Apr
-15
- -
20.
00
- 2
00.0
0 1
9.99

Twenty-Fourth Annual Report FY 2015-2016
37
Mat
urity
D
ate
Num
ber o
f U
nits
F
ace
Valu
e pe
r Uni
t (`
)
Fac
e va
lue
(` in
Cro
res)
A
s at
31
.3.2
016
(` in
Cro
res)
Num
ber o
f U
nits
A
s at
31
.3.2
015
(` in
Cro
res)
9.25
% H
DFC
LTD
- D
EB -
21O
CT2
016
21-O
ct-1
6 2
50.0
0 1
,000
,000
.00
25.
00
24.
99
- -
9.30
% TA
TA S
ON
S LI
MIT
ED -
DEB
- 24
DEC
201
524
-Dec
-15
50.
00
1,0
00,0
00.0
0 1
0.00
-
100
.00
10.
01
9.34
50%
L&T
FIN
AN
CE
COM
PAN
Y LI
MIT
ED -
13
MAY
201
613
-May
-16
250
.00
1,0
00,0
00.0
0 2
5.00
2
5.00
-
-
9.40
% TA
TA M
OTO
RS F
INA
NC
E LI
MIT
ED -
05 JU
N
2016
5-Ju
n-16
300
.00
1,0
00,0
00.0
0 3
0.00
3
0.01
-
-
9.40
% TA
TA M
OTO
RS F
INA
NC
E LI
MIT
ED -
10 JU
N
2016
10-J
un-1
6 5
00.0
0 2
,000
,000
.00
50.
00
50.
01
- -
9.45
% A
SHO
K LE
YLA
ND
LTD
- D
EB -
2016
21-J
un-1
6 7
50.0
0 1
,000
,000
.00
75.
00
75.
04
- -
9.46
23%
TATA
CA
PITA
L FI
NA
NC
IAL
SERV
ICES
LI
MIT
ED -
08 JU
L 20
168-
Jul-1
6 2
00.0
0 1
,000
,000
.00
20.
00
20.
01
- -
9.55
% B
AJA
J FIN
AN
CE
LIM
ITED
- 10
AU
G 2
016
10-A
ug-1
6 5
0.00
1
,000
,000
.00
5.0
0 5
.01
- -
9.58
% S
UN
DA
RAM
BN
P PA
RIBA
S H
OM
E FI
NA
NC
E LI
MIT
ED 1
0 O
CT
2016
10-O
ct-1
6 5
0.00
1
,000
,000
.00
5.0
0 5
.01
- -
9.60
% H
DFC
LIM
ITED
- D
EB -
26 JU
N 2
015
26-J
un-1
5 -
- 2
0.00
-
200
.00
20.
02
9.60
% S
UN
DA
RAM
FIN
AN
CE
LIM
ITED
- 23
SEP
201
623
-Sep
-16
50.
00
1,0
00,0
00.0
0 5
.00
5.0
1 -
-
9.60
% TA
TA M
OTO
RS F
INA
NC
E LI
MIT
ED -
DEB
- 13
M
AY 2
015
13-M
ay-1
5 -
- 2
5.00
-
250
.00
25.
00
9.65
% S
HRI
RAM
TRA
NSP
ORT
FIN
AN
CE
COM
PAN
Y LI
MIT
ED -
31 JU
L 20
1631
-Jul
-16
250
.00
1,0
00,0
00.0
0 2
5.00
2
5.04
-
-
9.65
% TA
TA C
API
TAL
FIN
AN
CIA
L SE
RVIC
ES L
IMIT
ED
- 26
MAY
201
626
-May
-16
250
.00
1,0
00,0
00.0
0 2
5.00
2
5.01
-
-
9.68
% TA
TA S
ON
S LI
MIT
ED -
DEB
- 10
-JA
N-2
017
10-J
an-1
7 4
50.0
0 2
,000
,000
.00
45.
00
45.
15
- -
9.75
% H
DFC
- D
EB -
10-O
CT-
2016
10-O
ct-1
6 3
00.0
0 2
,000
,000
.00
30.
00
30.
04
- -
9.80
% B
AJA
J FIN
AN
CE
LIM
ITED
- 17
OC
T 20
1617
-Oct
-16
300
.00
1,0
00,0
00.0
0 3
0.00
3
0.13
-
-
9.83
% TA
TA C
API
TAL
FIN
AN
CIA
L SE
RVIC
ES L
IMIT
ED
- 30
APR
201
530
-Apr
-15
- -
10.
00
- 1
00.0
0 1
0.00
9.85
% H
DFC
LIM
ITED
- 28
MAY
201
528
-May
-15
- -
5.0
0 -
50.
00
5.0
1

38
National Stock Exchange of India LimitedM
atur
ity
Dat
e N
umbe
r of
Uni
ts
Fac
e Va
lue
per U
nit
(`)
Fac
e va
lue
(` in
Cro
res)
A
s at
31
.3.2
016
(` in
Cro
res)
Num
ber o
f U
nits
A
s at
31
.3.2
015
(` in
Cro
res)
9.85
% TA
TA C
API
TAL
FIN
AN
CIA
L SE
RVIC
ES L
IMIT
ED
- 15
APR
201
515
-Apr
-15
- -
25.
00
- 2
50.0
0 2
5.01
9.89
% TA
TA M
OTO
RS F
INA
NC
E LI
MIT
ED -
26-J
UN
-20
1526
-Jun
-15
- -
25.
00
- 2
50.0
0 2
5.03
9.90
% D
EWA
N H
OU
SIN
G F
INA
NC
E CO
RPO
RATI
ON
LT
D -
DEB
- 17
JUN
201
517
-Jun
-15
- -
25.
00
- 2
50.0
0 2
5.01
9.90
%D
EWA
N H
OU
SIN
G -D
EBEN
TURE
- 06
MAY
2016
6-M
ay-1
6 1
,500
,000
.00
100
.00
15.
00
15.
00
- -
9.93
% TA
TA C
API
TAL
FIN
AN
CIA
L SE
RVIC
ES L
IMIT
ED
31 JU
L 20
1531
-Jul
-15
200
.00
1,0
00,0
00.0
0 3
0.00
-
300
.00
30.
03
9.95
% L
&T F
INA
NC
E CO
MPA
NY
LIM
ITED
- 28
OC
T 20
1628
-Oct
-16
100
.00
1,0
00,0
00.0
0 1
0.00
1
0.05
-
-
9.98
5 %
TATA
MO
TORS
FIN
AN
CE
LIM
ITED
- D
EB -
26-O
CT-
2015
26-O
ct-1
5 1
00.0
0 1
,000
,000
.00
10.
00
- 1
00.0
0 1
0.02
9.99
% S
UN
DA
RAM
FIN
AN
CE
LIM
ITED
- D
EB -
03
AUG
201
53-
Aug
-15
- -
5.0
0 -
50.
00
5.0
1
9.99
% S
UN
DA
RAM
FIN
AN
CE
LTD
- 04
MAY
201
54-
May
-15
- -
45.
00
- 4
50.0
0 4
5.01
Sub
-Tot
al (i
) 7
57.2
8 8
23.6
6
B)M
UTU
AL
FUN
DS
(ii)
QU
OTE
D
HD
FC F
MP
453D
FEB
RUA
RY 2
014
(1)
4-M
ay-1
5 1
,000
,000
.00
10.
00
1.0
0 -
2,0
00,0
00.0
0 2
.00
IDFC
FIX
ED T
ERM
PLA
N S
ERIE
S - 7
5 - 4
06 D
AYS
- 2
50,0
00.0
0 0
.25
Sub
-Tot
al (i
i) -
2.2
5

Twenty-Fourth Annual Report FY 2015-2016
39
Mat
urity
D
ate
Num
ber o
f U
nits
F
ace
Valu
e pe
r Uni
t (`
)
Fac
e va
lue
(` in
Cro
res)
A
s at
31
.3.2
016
(` in
Cro
res)
Num
ber o
f U
nits
A
s at
31
.3.2
015
(` in
Cro
res)
(iii)
UN
QU
OTE
D
AXI
S LI
QU
ID F
UN
D -D
IREC
T - G
ROW
TH 5
35.5
6 0
.09
33,
533.
50
5.1
8
AXI
S TR
EASU
RY A
DVA
NTA
GE
FUN
D -
GRO
WTH
- D
IREC
T PL
AN
3,6
48,0
83.0
4 2
93.3
0 -
3.1
9
AXI
S TR
EASU
RY A
DVA
NTA
GE
FUN
D -
IP -
GRO
WTH
55,
402.
63
7.3
2 7
9,48
6.16
1
0.38
BARO
DA
PIO
NEE
R LI
QU
ID F
UN
D -
PLA
N B
- D
IREC
T - G
ROW
TH -
- 5
92,9
06.8
5 9
5.00
BARO
DA
PIO
NEE
R TR
EASU
RY A
DVA
NTA
GE
FUN
D -
PLA
N B
- D
IREC
T - G
ROW
TH 2
7,49
7.63
4
.54
18,
204.
55
2.8
6
BARO
DA
PIO
NEE
R TR
EASU
RY A
DVA
NTA
GE
FUN
D
PLA
N B
- G
ROW
TH 1
86,2
85.2
0 2
8.94
7
1,30
6.43
1
0.00
BIRL
A S
UN
LIF
E C
ASH
MA
NA
GER
- D
IREC
T -
GRO
WTH
1,4
06,7
22.6
8 4
9.94
5
,933
.21
0.2
0
BIRL
A S
UN
LIF
E C
ASH
PLU
S - D
IREC
T - G
ROW
TH 4
9,71
5.58
1
.00
8,7
43,2
16.2
0 1
97.0
0
BIRL
A S
UN
LIF
E FL
OAT
ING
RAT
E FU
ND
- LT
P -
DIR
ECT
- GRO
WTH
1,3
66,6
86.3
1 2
5.00
-
-
BIRL
A S
UN
LIF
E SA
VIN
GS
FUN
D -
DIR
ECT
- DA
ILY
DIV
IDEN
D R
EIN
VEST
- -
5,9
25,3
31.9
2 5
9.43
BIRL
A S
UN
LIF
E SA
VIN
GS
FUN
D -
DIR
ECT
- G
ROW
TH 2
,400
,678
.23
68.
69
105
,263
.72
2.7
6
BIRL
A S
UN
LIF
E U
LTRA
SH
ORT
TER
M F
UN
D -
DIR
ECT
PLA
N -
GRO
WTH
- -
22,
655.
58
0.3
4
BNP
PARI
BAS
OVE
RNIG
HT
FUN
D -
DIR
ECT
- G
ROW
TH -
- 2
3,22
6.84
5
.00
BOI A
XA L
IQU
ID F
UN
D- D
IREC
T PL
AN
– G
ROW
TH -
- 3
1,03
7.95
5
.00
DH
FL P
RAM
ERIC
A L
OW
DU
RATI
ON
FU
ND
- D
IREC
T PL
AN
- GRO
WTH
1,6
97,7
18.8
6 2
.82
- -
DH
FL P
RAM
ERIC
A U
LTRA
SH
ORT
TER
M F
UN
D -
DIR
ECT
PLA
N- G
ROW
TH 3
63,4
64.1
4 0
.66
- -

40
National Stock Exchange of India LimitedM
atur
ity
Dat
e N
umbe
r of
Uni
ts
Fac
e Va
lue
per U
nit
(`)
Fac
e va
lue
(` in
Cro
res)
A
s at
31
.3.2
016
(` in
Cro
res)
Num
ber o
f U
nits
A
s at
31
.3.2
015
(` in
Cro
res)
DSP
BLA
CKR
OC
K LI
QU
IDIT
Y FU
ND
- D
IREC
T -
GRO
WTH
- -
88.
16
0.0
2
DSP
BLA
CKR
OC
K U
LTRA
SH
ORT
TER
M F
UN
D -
DIR
ECT
- GRO
WTH
92,
905,
241.
56
101
.10
- -
DW
S TR
EASU
RY F
UN
D -
CA
SH -
DIR
ECT
- GRO
WTH
1,1
41.8
7 0
.02
1,2
46.5
1 0
.02
DW
S TR
EASU
RY F
UN
D -
INVE
STM
ENT
PLA
N -
- 1
,842
,077
.50
2.6
4
DW
S M
ON
EY P
LUS
FUN
D -
DIR
ECT
- GRO
WTH
- -
2,1
58,6
30.0
0 2
.82
DW
S U
LTRA
SH
ORT
-TER
M F
UN
D -
DIR
ECT
- G
ROW
TH 1
6,05
0,55
3.65
2
9.16
-
-
FRA
NKL
IN IN
DIA
LO
W D
URA
TIO
N F
UN
D -
DIR
ECT
- G
ROW
TH -
- 3
,351
,126
.62
4.9
1
HD
FC B
AN
KIN
G &
PSU
DEB
T FU
ND
- -
4,5
39,4
70.7
0 5
.00
HD
FC C
ASH
MA
NA
GEM
ENT
FUN
D -
TREA
SURY
A
DVA
NTA
GE
- DIR
ECT
– G
ROW
TH -
- 2
76,4
42.6
0 0
.80
HD
FC C
ASH
MG
MT
FUN
D -
SAVI
NG
S PL
AN
- D
IREC
T - G
ROW
TH 3
6,96
8.01
5
.05
- -
HD
FC F
LOAT
ING
RAT
E IN
COM
E FU
ND
- ST
P -
DIR
ECT
- GRO
WTH
9,6
32,5
00.8
3 2
5.00
-
-
HD
FC F
MP
91 D
FEB
201
5 (I)
- -
10,
000,
000.
00
10.
00
HD
FC L
IQU
ID F
UN
D -
DIR
ECT
- GRO
WTH
692
.64
0.2
1
ICIC
I PRU
DEN
TIA
L FL
EXIB
LE IN
COM
E - D
IREC
T PL
AN
- D
AIL
Y D
IVID
END
- RE
INVE
STM
ENT
- -
9,6
39,9
74.6
7 1
01.9
3
ICIC
I PRU
DEN
TIA
L FL
EXIB
LE IN
COM
E PL
AN
- G
ROW
TH 9
6,88
0.53
2
.06
96,
880.
53
2.0
6
ICIC
I PRU
DEN
TIA
L FL
EXIB
LE IN
COM
E PL
AN
- G
ROW
TH -
DIR
ECT
19,
667,
785.
65
228
.82
133
,615
.19
4.7
7
ICIC
I PRU
DEN
TIA
L FL
EXIB
LE IN
COM
E PL
AN
- PR
EMIU
M -
GRO
WTH
- 4
6,84
0.94
0
.97
ICIC
I PRU
DEN
TIA
L LI
QU
ID -
DIR
ECT
PLA
N -
GRO
WTH
5,6
27,0
26.3
0 3
.91
1,4
20,5
47.9
1 2
9.33

Twenty-Fourth Annual Report FY 2015-2016
41
Mat
urity
D
ate
Num
ber o
f U
nits
F
ace
Valu
e pe
r Uni
t (`
)
Fac
e va
lue
(` in
Cro
res)
A
s at
31
.3.2
016
(` in
Cro
res)
Num
ber o
f U
nits
A
s at
31
.3.2
015
(` in
Cro
res)
ICIC
I PRU
DEN
TIA
L M
ON
EY M
ARK
ET F
UN
D –
D
IREC
T –
DA
ILY
DIV
IDEN
D R
EIN
VEST
MEN
T -
208
,813
.97
2.0
9
ICIC
I PRU
DEN
TIA
L M
ON
EY M
ARK
ET F
UN
D -
DIR
ECT-
GRO
WTH
202
,902
.69
3.9
5 9
01.7
2 1
.02
ICIC
I PRU
DEN
TIA
L U
LTRA
SH
ORT
TER
M P
LAN
- D
IREC
T - G
ROW
TH 8
9,21
6,23
2.86
1
32.9
9 1
6,34
4,41
2.22
5
7.20
IDBI
LIQ
UID
FU
ND
- D
IR -
GRO
WTH
- -
33,
356.
35
5.0
0
IDFC
MO
NEY
MA
NA
GER
- IN
VEST
MEN
T PL
AN
- D
IREC
T - G
ROW
TH 4
,087
,651
.57
9.4
2 3
48,9
76.6
9 1
.35
IDFC
MO
NEY
MA
NA
GER
- TR
EASU
RY P
LAN
- D
IREC
T - G
ROW
TH 6
4,18
0,59
7.62
1
47.8
2 5
8,90
7,88
4.00
1
29.5
4
IDFC
ULT
RA S
HO
RT T
ERM
FU
ND
- D
IREC
T -
GRO
WTH
1,3
82,8
10.3
8 2
.65
899
,359
.92
3.3
2
JM H
IGH
LIQ
UID
ITY
FUN
D -
DIR
ECT
GRO
WTH
4,3
77,2
61.0
9 1
7.42
7
63,1
59.0
0 2
.65
JM M
ON
EY M
AN
AG
ER F
UN
D -
SUPE
R PL
US
PLA
N -
DIR
ECT
- GRO
WTH
- 3
90,6
14.5
6 0
.71
JP M
ORG
AN
IND
IA T
REA
SURY
FU
ND
- G
ROW
TH -
663
,730
.16
0.9
9
JP M
ORG
AN
IND
IA T
REA
SURY
FU
ND
- SU
PER
IP -
GRO
WTH
- 8
26,6
59.1
7 1
.21
JPM
ORG
AN
IND
IA L
IQU
ID F
UN
D -
DA
ILY
DIV
IDEN
D
- DIR
ECT
PLA
N 8
,125
,474
.91
- 8
,125
,474
.91
8.1
3
JPM
ORG
AN
IND
IA L
IQU
ID F
UN
D -
DIR
ECT
- G
ROW
TH 2
2,83
2,95
4.42
4
1.41
37
,571
,733
.94
66.
97
JPM
ORG
AN
IND
IA T
REA
SURY
FU
ND
- D
IREC
T -
GRO
WTH
- -
2,2
11,7
19.7
8 4
9.06
KOTA
K FL
EXI D
EBT
SCH
EME
- PLA
N A
- D
IREC
T -
GRO
WTH
2,6
46,6
64.9
0 4
.27
7,2
15,4
90.5
8 1
1.70
KOTA
K FL
OAT
ER -
LON
G T
ERM
- D
IREC
T - G
ROW
TH-
894
,653
.50
1.8
8
KOTA
K FL
OAT
ER -
SHO
RT T
ERM
- D
IREC
T -
GRO
WTH
20,
387.
73
4.8
8 -
-

42
National Stock Exchange of India LimitedM
atur
ity
Dat
e N
umbe
r of
Uni
ts
Fac
e Va
lue
per U
nit
(`)
Fac
e va
lue
(` in
Cro
res)
A
s at
31
.3.2
016
(` in
Cro
res)
Num
ber o
f U
nits
A
s at
31
.3.2
015
(` in
Cro
res)
KOTA
K LI
QU
ID S
CH
EME
- PLA
N A
- D
IREC
T - D
AIL
Y D
IVID
END
- 2
4,26
8.80
2
.97
KOTA
K LI
QU
ID S
CH
EME
- PLA
N A
- D
IREC
T -
GRO
WTH
26,
857.
90
8.0
9 2
,473
.84
0.7
0
Kota
k Tr
easu
ry A
dvan
tage
Fun
d –
DIR
ECT
- G
ROW
TH 1
1,66
2,78
9.74
2
7.66
-
-
L&T
CA
SH F
UN
D -
DIR
ECT
PLA
N -
GRO
WTH
25,
975.
39
3.0
7 -
-
L&T
LIQ
UID
FU
ND
- D
IREC
T - G
ROW
TH 6
89.5
6 0
.14
496
,031
.28
95.
00
L&T
ULT
RA S
HO
RT T
ERM
FU
ND
- D
IREC
T -
GRO
WTH
27,
574,
189.
27
67.
79
- -
LIC
NO
MU
RA M
F LI
QU
ID F
UN
D -
DIR
ECT
- G
ROW
TH 3
3,14
9.60
8
.65
114
.46
0.0
3
PRIN
CIP
AL
CA
SH M
AN
AG
EMEN
T - D
IREC
T PL
AN
- G
ROW
TH -
- 3
31,2
39.6
3 5
6.74
RELI
AN
CE
LIQ
UID
FU
ND
- C
ASH
PLA
N -
DIR
ECT
- G
ROW
TH 2
53,8
65.1
2 6
1.14
7
3,59
8.66
1
6.50
RELI
AN
CE
LIQ
UID
FU
ND
- TP
- D
IREC
T - G
ROW
TH 1
52,2
32.2
0 5
4.82
6
6,93
8.97
2
2.80
RELI
AN
CE
LIQ
UID
FU
ND
- TP
- D
IREC
T PL
AN
- D
AIL
Y D
IVID
END
- 0
.00
503
,086
.01
76.
91
RELI
AN
CE
LIQ
UID
ITY
FUN
D -
DIR
ECT
- GRO
WTH
11,
517.
21
2.5
0 -
-
RELI
AN
CE
MED
IUM
TER
M F
UN
D -
DIR
ECT
- G
ROW
TH 3
7,61
0,20
8.92
1
15.4
9 1
,931
,404
.17
11.
20
RELI
AN
CE
MO
NEY
MA
NA
GER
FU
ND
- G
ROW
TH 2
2,45
8.97
3
.49
3.4
9
RELI
AN
CE
MO
NEY
MA
NA
GER
FU
ND
- G
ROW
TH -
DIR
ECT
144
,075
.92
30.
00
RELI
GA
RE IN
VESC
O C
RED
IT O
PPO
RTU
NIT
IES
FUN
D
- DIR
ECT
- GRO
WTH
11,
833.
67
- 3
4,88
8.53
7
.36
RELI
GA
RE IN
VESC
O L
IQU
ID F
UN
D -
DIR
ECT
- G
ROW
TH 6
34.3
7 0
.13
- -

Twenty-Fourth Annual Report FY 2015-2016
43
Mat
urity
D
ate
Num
ber o
f U
nits
F
ace
Valu
e pe
r Uni
t (`
)
Fac
e va
lue
(` in
Cro
res)
A
s at
31
.3.2
016
(` in
Cro
res)
Num
ber o
f U
nits
A
s at
31
.3.2
015
(` in
Cro
res)
RELI
GA
RE IN
VESC
O U
LTRA
SH
ORT
TER
M F
UN
D -
DIR
- D
AIL
Y D
IVID
END
REI
NVE
STM
ENT
- 0
.00
1,3
59,9
59.5
7 1
38.4
4
RELI
GA
RE IN
VESC
O U
LTRA
SH
ORT
TER
M F
UN
D -
DIR
ECT
- GRO
WTH
1,0
06,5
49.1
1 2
08.7
9 -
0.6
0
SBI M
AG
NU
M IN
STA
CA
SH F
UN
D -
DIR
ECT
- G
ROW
TH 7
,032
.50
- 6
37,5
75.5
5 1
99.0
3
SBI S
HD
F - U
LTRA
SH
ORT
TER
M -
DIR
ECT
– G
ROW
TH L
IEN
MA
RKED
12,
391.
37
2.3
4 -
-
SBI S
HD
F - U
LTRA
SH
ORT
TER
M -
GRO
WTH
648
.31
0.1
0 0
.46
SBI S
HD
F - U
LTRA
SH
ORT
TER
M -
GRO
WTH
- D
IREC
T PL
AN
33,
869.
28
5.2
4 9
,094
.00
1.3
9
SBI S
HD
F - U
LTRA
SH
ORT
TER
M -
IP -
GRO
WTH
6,7
66.9
6 0
.99
0.9
9
SBI U
LTRA
SH
ORT
TER
M D
EBT
FUN
D -
DIR
ECT
PLA
N
- GRO
WTH
19,
221.
81
- 2
.85
SUN
DA
RAM
MO
NEY
FU
ND
- D
IREC
T PL
AN
- G
ROW
TH -
- 1
,909
,166
.23
5.6
2
SUN
DA
RAM
ULT
RA S
HO
RT T
ERM
- D
IREC
T PL
AN
- G
ROW
TH 1
5,09
4,03
3.85
2
7.78
10
,362
,119
.88
23.
84
TATA
FLO
ATER
FU
ND
- D
IREC
T - G
ROW
TH 1
6,49
7.43
3
.58
0.1
8
TATA
LIQ
UID
FU
ND
DIR
ECL
PLA
N -
GRO
WTH
- -
20,
065.
90
5.1
6
TEM
PLET
ON
IND
IA -
TMA
- D
AIL
Y D
IVID
END
- D
IREC
T PL
AN
- 0
.00
236
,668
.43
23.
71
TEM
PLET
ON
IND
IA T
MA
- D
IREC
T - G
ROW
TH -
- 3
7,86
6,63
9.19
8
3.85
TEM
PLET
ON
IND
IA U
LTRA
SH
ORT
BO
ND
FU
ND
- D
IREC
T PL
AN
- G
ROW
TH -
- 2
7,90
4,86
9.87
5
1.04
UTI
FLO
ATIN
G R
ATE
FUN
D -
STP
- DIR
ECT
– G
ROW
TH 8
40,2
32.7
8 2
04.1
5 -
-
UTI
FLO
ATIN
G R
ATE
FUN
D -
STP
- DIR
ECT
– G
ROW
TH L
IEN
MA
RKED
10,
127.
83
2.6
0 -
-

44
National Stock Exchange of India LimitedM
atur
ity
Dat
e N
umbe
r of
Uni
ts
Fac
e Va
lue
per U
nit
(`)
Fac
e va
lue
(` in
Cro
res)
A
s at
31
.3.2
016
(` in
Cro
res)
Num
ber o
f U
nits
A
s at
31
.3.2
015
(` in
Cro
res)
UTI
MO
NEY
MA
RKET
- D
IREC
T PL
AN
- G
ROW
TH 2
7,69
0.47
4
.60
- -
UTI
TRE
ASU
RY A
DVA
NTA
GE
FUN
D -
DIR
ECT
- G
ROW
TH 1
0,37
5.87
1
.95
10,
375.
87
1.9
5
UTI
TRE
ASU
RY A
DVA
NTA
GE
FUN
D -
GRO
WTH
31,
377.
94
4.0
3 3
1,37
7.94
4
.84
UTI
TRE
ASU
RY A
DVA
NTA
GE
FUN
D G
ROW
TH -
DIR
ECT
PLA
N 4
7,54
2.36
8
.94
19,
658.
43
6.5
4
AXI
S A
SSET
MA
NA
GEM
ENT
COM
PAN
Y LI
MIT
ED 7
9,23
4.97
1
3.02
-
-
BARO
DA
PIO
NEE
R A
SSET
MA
NA
GEM
ENT
COM
PAN
Y LI
MIT
ED 9
7,08
6.89
1
5.95
-
-
BIRL
A S
UN
LIF
E M
UTU
AL
FUN
D 5
35,5
17.7
9 1
5.30
-
-
BIRL
A S
UN
LIF
E M
UTU
AL
FUN
D 6
,098
,830
.22
15.
20
--
ICIC
I PRU
DEN
TIA
L M
UTU
AL
FUN
D 1
1,05
2,39
2.85
1
5.28
-
-
IDFC
MU
TUA
L FU
ND
6,4
58,6
74.9
9 1
4.95
-
-
JM F
INA
NC
IAL
MU
TUA
L FU
ND
2,7
09,7
86.7
6 1
1.00
-
-
JP M
ORG
AN
ASS
ET M
AN
AG
EMEN
T -
- -
-
KOTA
K M
UTU
AL
FUN
D 6
,838
,293
.79
15.
91
--
PRIN
CIP
AL
ASS
ET M
AN
AG
EMEN
T CO
MPA
NY
PRIV
ATE
LIM
ITED
109
,352
.96
13.
96
--
RELI
AN
CE
MU
TUA
L FU
ND
4,9
74,0
09.0
1 2
6.60
-
-
UTI
MU
TUA
L FU
ND
62,
902.
10
15.
00
--
Sub
-Tot
al (i
ii)
2,2
72.6
9 1
,748
.62
C)CO
MM
ERCI
AL
PAPE
R
BAJA
J FIN
AN
CE
LIM
ITED
6-
Apr
-15
- -
- 6
00
27.
40
TATA
CA
PITA
L LI
MIT
ED3-
Aug
-15
- -
- 5
00
22.
85
RELI
AN
CE
CA
PITA
L LI
MIT
ED3-
Nov
-15
- -
- 1,
000.
00
45.
66

Twenty-Fourth Annual Report FY 2015-2016
45
Mat
urity
D
ate
Num
ber o
f U
nits
F
ace
Valu
e pe
r Uni
t (`
)
Fac
e va
lue
(` in
Cro
res)
A
s at
31
.3.2
016
(` in
Cro
res)
Num
ber o
f U
nits
A
s at
31
.3.2
015
(` in
Cro
res)
SUN
DA
RAM
FIN
AN
CE
LIM
ITED
24-A
pr-1
5 -
- -
1,00
0.00
4
5.64
FULL
ERTO
N IN
DIA
CRE
DIT
CO
MA
PNY
LIM
ITED
11-A
ug-1
5 -
- -
1,00
0.00
4
5.57
TATA
CA
PITA
L FI
NA
NC
IAL
SERV
ICES
LIM
ITED
4-A
ug-1
5 -
- -
600.
00
27.
42
SUN
DA
RAM
BN
P PA
RIBA
S H
OM
E FI
NA
NC
E LI
MIT
ED9-
Jun-
15 -
- -
500.
00
23.
09
TATA
CA
PITA
L LI
MIT
ED12
-Jun
-15
- -
- 50
0.00
2
2.92
TATA
CA
PITA
L LI
MIT
ED3-
Aug
-15
- -
- 50
0.00
2
2.85
FULL
ERTO
N IN
DIA
CRE
DIT
CO
MA
PNY
LIM
ITED
6-A
ug-1
5 -
- -
500.
00
22.
79
BAJA
J FIN
AN
CE
LIM
ITED
19-J
un-1
5 -
- -
400.
00
18.
31
BAJA
J FIN
AN
CE
LIM
ITED
6-A
pr-1
5 -
- -
400.
00
18.
27
L&T
FIN
AN
CE
COM
PAN
Y LI
MIT
ED6-
May
-15
- -
- 20
0.00
9
.33
TATA
CA
PITA
L LI
MIT
ED9-
Jun-
15 -
- -
100.
00
4.6
2
L&T
FIN
AN
CE
COM
PAN
Y LI
MIT
ED8-
May
-15
- -
- 10
0.00
4
.62
SUN
DA
RAM
FIN
AN
CE
LIM
ITED
3-Ju
n-15
- -
- 10
0.00
4
.61
TATA
CA
PITA
L FI
NA
NC
IAL
SERV
ICES
LIM
ITED
10-J
un-1
5 -
- -
100.
00
4.5
9
Sub
-tot
al (i
v)
- 3
70.5
4
Tota
l (II)
3
,029
.97
2,9
45.0
8
GRA
ND
TO
TAL
(I+II)
3
,233
.59
3,1
40.2
3

46
National Stock Exchange of India LimitedN
otes
: A
s at
31
.3.2
016
` in
C
rore
s
As
at
31.3
.201
5 `
in C
rore
s
(a)
Agg
rega
te B
ook
Valu
e - Q
uote
d In
vest
men
ts 9
60.3
9 1
,021
.06
(b)
Agg
rega
te M
arke
t Val
ue o
f Quo
ted
Inve
stm
ents
964
.90
1,0
22.7
8
(c)
Agg
rega
te B
ook
Valu
e - U
nquo
ted
Inve
stm
ents
2,2
73.2
0 2
,119
.17
(c)
Prov
isio
n fo
r dim
uniti
on in
val
ue o
f Cur
rent
In
vest
men
ts (0
.09)
(0.0
2)
(e)
Inve
stm
ents
in M
utua
l Fun
d Ea
rmar
ked
for C
ore
Sett
lem
ent G
uara
ntee
Fun
d (R
efer
not
e 31
)
Unq
uote
d N
umbe
r of
Uni
ts A
s at
31
.3.2
016
(` in
Cro
res)
Num
ber o
f U
nits
A
s at
31
.3.2
015
(` in
Cro
res)
AXI
S TR
EASU
RY A
DVA
NTA
GE
FUN
D -
GRO
WTH
- D
IREC
T PL
AN
773
,083
4
6.80
-
-
BARO
DA
PIO
NEE
R TR
EASU
RY A
DVA
NTA
GE
FUN
D -
PLA
N B
- D
IREC
T - G
ROW
TH 1
42,4
76
4.5
4 -
-
BIRL
A S
UN
LIF
E C
ASH
MA
NA
GER
- D
IREC
T - G
ROW
TH 1
,393
,221
1
1.34
-
-
BIRL
A S
UN
LIF
E SA
VIN
GS
FUN
D -
DIR
ECT
- GRO
WTH
2,4
00,6
78
68.
70
5,9
25,3
31.9
2 5
9.43
ICIC
I PRU
DEN
TIA
L FL
EXIB
LE IN
COM
E PL
AN
- G
ROW
TH
- DIR
ECT
3,7
94,9
68
105
.92
9,6
39,9
74.6
7 1
01.9
3
ICIC
I PRU
DEN
TIA
L M
ON
EY M
ARK
ET F
UN
D -
DIR
ECT-
G
ROW
TH 1
06,1
61
2.1
7 2
08,8
13.9
7 2
.09
ICIC
I PRU
DEN
TIA
L U
LTRA
SH
ORT
TER
M P
LAN
- D
IREC
T - G
ROW
TH 6
0,63
6,49
0 1
8.80
-
-
IDFC
MO
NEY
MA
NA
GER
- TR
EASU
RY P
LAN
- D
IREC
T -
GRO
WTH
60,
857,
672
107
.00
- -
JPM
ORG
AN
IND
IA L
IQU
ID F
UN
D -
DIR
ECT
- GRO
WTH
22,
832,
954
41.
41
8,1
25,4
74.9
1 8
.13
KOTA
K LI
QU
ID S
CH
EME
- PLA
N A
- D
IREC
T - G
ROW
TH 1
0,25
0 3
.09
24,
268.
80
2.9
7
L&T
ULT
RA S
HO
RT T
ERM
FU
ND
- D
IREC
T - G
ROW
TH 2
7,57
4,18
9 9
.16
- -
LIC
NO
MU
RA M
F LI
QU
ID F
UN
D -
DIR
ECT
- GRO
WTH
32,
749
8.5
2 -
-
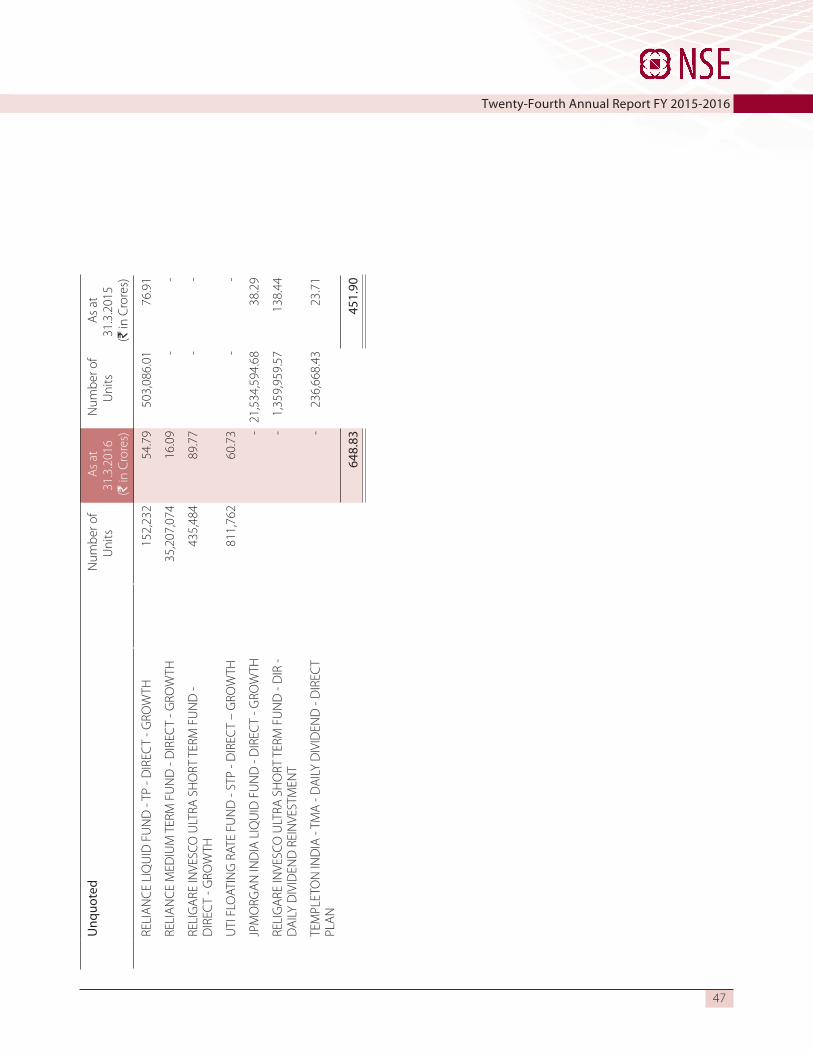
Twenty-Fourth Annual Report FY 2015-2016
47
Unq
uote
d N
umbe
r of
Uni
ts A
s at
31
.3.2
016
(` in
Cro
res)
Num
ber o
f U
nits
A
s at
31
.3.2
015
(` in
Cro
res)
RELI
AN
CE
LIQ
UID
FU
ND
- TP
- D
IREC
T - G
ROW
TH 1
52,2
32
54.
79
503
,086
.01
76.
91
RELI
AN
CE
MED
IUM
TER
M F
UN
D -
DIR
ECT
- GRO
WTH
35,
207,
074
16.
09
- -
RELI
GA
RE IN
VESC
O U
LTRA
SH
ORT
TER
M F
UN
D -
DIR
ECT
- GRO
WTH
435
,484
8
9.77
-
-
UTI
FLO
ATIN
G R
ATE
FUN
D -
STP
- DIR
ECT
– G
ROW
TH 8
11,7
62
60.
73
- -
JPM
ORG
AN
IND
IA L
IQU
ID F
UN
D -
DIR
ECT
- GRO
WTH
- 2
1,53
4,59
4.68
3
8.29
RELI
GA
RE IN
VESC
O U
LTRA
SH
ORT
TER
M F
UN
D -
DIR
- D
AIL
Y D
IVID
END
REI
NVE
STM
ENT
- 1
,359
,959
.57
138
.44
TEM
PLET
ON
IND
IA -
TMA
- D
AIL
Y D
IVID
END
- D
IREC
T PL
AN
- 2
36,6
68.4
3 2
3.71
648
.83
451
.90

48
National Stock Exchange of India Limited
14 CHANGES IN INVENTORIES OF STOCK-IN-TRADE 31.03.2016
(` in Crores) 31.03.2015
(` in Crores)
Opening Inventories of Digital Certificates 0.04 0.01
Closing Inventories of Digital Certificates 0.03 0.04
Total 0.01 (0.03)
15 Trade receivables
Non-current Current
31.03.2016 (` in Crores)
31.03.2015 (` in Crores)
31.03.2016 (` in Crores)
31.03.2015 (` in Crores)
Unsecured, considered good unless stated otherwise
Outstanding for a period of over six months from the date they are due from payment
Secured, considered good - - 2.32 2.52
Unsecured, considered good 14.08 31.36 14.28 7.98
Doubtful - - - 0.28
14.08 31.36 16.60 10.78
Provision for doubtful receivables - (0.28)
14.08 31.36 16.60 10.50
Other debts
Secured, considered good - - 209.34 158.04
Unsecured, considered good - - 38.49 28.80
Considered Doubtful 0.04 0.04
- - 247.87 186.88
Provision for doubtful receivables (0.04) (0.04)
- - 247.83 186.84
Total 14.08 31.36 264.43 197.34

Twenty-Fourth Annual Report FY 2015-2016
49
16 Cash and bank balances Non-current Current
31.03.2016 (` in Crores)
31.03.2015(` in Crores)
31.03.2016 (` in Crores)
31.03.2015 (` in Crores)
Cash and cash equivalents
Balances with banks :
On current accounts - - 287.72 145.74
Deposits held for the purpose of meeting short term cash commitments
- - 2,587.44 2,052.20
Earmarked Deposits with original maturity of less than three months {including ` 15.56 crores (previous year `. 51.92 crores) towards withheld payouts and ` 52.91 crores (previous year `. 44.70 crores) pertaining to Core SGF )
- - 69.11 96.62
Cheques in hand - - 0.45 -
Cash on hand - - 0.02 0.01
- - 2,944.74 2,294.57
Other bank balances
Bank Deposits with original maturity for more than 12 months ( includes ` 6.12 crores (P.Y ` 2.54 crores) against bank guarantee)
449.09 749.99 749.95 1,326.15
Earmarked Deposits with original maturity for more than 12 months
72.50 115.89 126.39 40.16
Bank Deposits with original maturity for more than 3 months but less than 12 months
- - 503.97 453.01
Certificate of Deposits with original maturity for more than 3 months but less than 12 months
- - - -
Certificate of Deposits - - - -
Earmarked Deposits with original maturity for more than 3 months but less than 12 months
- - 179.78 122.74
Earmarked Certificate of Deposits - -
Balance in Escrow Account ( Refer Note 39) - - 2.33 1.82
521.59 865.88 1,562.42 1,943.88
Amount disclosed under non-current assets (note 12)
521.59 865.88 - -
Total - - 4,507.16 4,238.45

50
National Stock Exchange of India Limited
17 Revenue from operations For year ended 31.03.2016
(` in Crores)
For year ended 31.03.2015
(` in Crores)
Operating revenues
Transaction charges 1,175.02 1,075.21
Book building Fees 8.50 3.30
Listing fees 50.36 47.91
Income - Online Datafeed Service Fees 59.21 47.06
Application Development & Maintenance Services 26.16 27.08
Infrastructure Management Services 5.06 4.21
E-Learning Solutions 57.51 44.92
IT & Process Support Charges 0.73 0.44
Index License Fees Outside India 57.07 34.47
ETF Licensing Outside India 2.28 1.72
Data Subscription Fees 4.67 3.69
Net gain / loss on sale of Current Investment - 0.01
Others 8.30 1,454.87 7.53 1,297.55
Other operating revenues
NCFM Registration & Test enrolment fees 19.01 22.31
Interest on Bank Deposits & Dividend recd 259.28 311.23
Processing Fees - Listing 21.52 13.15
Data Centre charges 70.84 56.15
Operational expenses recovery 0.73 0.66
Others 17.37 388.75 10.75 414.25
Sale of Products
Software Products 10.33 10.58
Traded Goods 0.55 10.88 0.71 11.29
Total 1,854.50 1,723.09

Twenty-Fourth Annual Report FY 2015-2016
51
18 Other income For year ended 31.03.2016
(` in Crores)
For year ended 31.03.2015
(` in Crores) Interest Income on
On Investment
Current 25.34 57.60
Long Term 204.59 128.73
On Bank Deposits 95.52 103.75
On Certificate of Deposits - 8.51
On Income Tax Refund 7.29 2.05
On Others 0.97 333.71 0.86 301.50
Dividend income
Long Term :
from Others 1.33 1.14
Current 0.17 1.50 0.23 1.37
Net gain / loss on sale of long term Investment 5.89 14.09
Net gain / loss on sale of current Investment 135.35 182.01
Rent Income 15.52 46.08
Profit on Sale of Fixed Assets 6.05 - Excess Provision written back 0.43 0.98 Amortisation of Premium / Discount on Govt/Debt Securities
- 5.54
Miscellaneous Income 0.99 0.78
Total 499.44 552.35
19 Purchases Of Stock-In-Trade For year ended 31.03.2016
(` in Crores)
For year ended 31.03.2015
(` in Crores)
Purchase of Digital Certificates 0.03 0.06
Total 0.03 0.06
20 Employee benefits expenses For year ended 31.03.2016
(` in Crores)
For year ended 31.03.2015
(` in Crores) Salaries, wages and bonus 199.12 172.95
Contribution to provident and other fund (Refer Note 24) 13.23 13.14
Staff welfare expenses 8.43 7.29
Total 220.78 193.38

52
National Stock Exchange of India Limited
21 Other expenses For year ended
31.03.2016 (` in Crores)
For year ended 31.03.2015
(` in Crores) Rent 19.78 16.62 Lease line charges 8.47 8.60 Repairs & maintenance - To buildings 2.67 3.10 - To computers, trading & telecommunication systems 76.07 64.40 - To others 8.74 7.35 Network Infrastructure Management charges 7.07 7.77 IT management and consultancy charges 6.82 9.07 Insurance 1.84 1.70 Rates & taxes * 6.71 10.47 Advertisement & publicity 17.97 16.30 Legal & Professional fees 34.32 33.61 Payment to auditor (Refer note below) 1.26 1.02 Electricity charges 22.83 27.44 Directors' sitting fees 0.87 0.54 Software expenses 31.70 15.70 Contribution to Investor protection fund trust 4.57 5.31 Investor education expenses 4.38 9.97 SEBI Regulatory Fees 25.04 24.79 Bad debts/Sundry balance written off 0.06 0.04 Provision for Doubtful Debts 0.21 0.10 Loss on sale /discard of assets (Net) - 0.25 Loss on exchange fluctuation (Net) 0.30 0.64 Amortisation of Premium / Discount on Govt/Debt Securities 1.60 - Goodwill on Consolidation written off 0.44 - Preliminary Expenses written off 0.17 - Adjustments to the carrying amount of current investments 0.09 0.02 NSE MORE Incentive 7.45 - Technical & Sub Contract Charges 21.67 23.58 Expenditure on CSR Activities (Ref note 40) 2.83 0.70 Other Expenses 86.07 82.77
Total 402.00 371.86
Note : Payment to auditor As auditor : Audit fees 0.40 0.34 Tax audit fee 0.11 0.10 Limited review 0.17 0.17 In other capacity Taxation matters 0.19 0.15 Certification matters 0.14 0.15 Other services 0.25 0.11 Total 1.26 1.02
* Includes Municipal Corporation Tax Nil (Previous Year ` 2.57 Crores) related to earlier years due to revision in taxes.

Twenty-Fourth Annual Report FY 2015-2016
53
22 Prior Period Adjustments 31.03.2016
(` in Crores) 31.03.2015
(` in Crores)
Expenses
Network Infrastructure Management charges - 0.71
Repairs & Maintenance - To computers, trading & telecommunication systems
2.29 -
IT management and consultancy charges (0.49) -
Professional Fees 0.31 -
Leased Line Charges 0.09 -
Software expenses - -
Other Expenses 0.57 0.40
2.78 1.11
Income
Processing Fees - Listing - 0.64
Usage Charges 0.37 -
Other Income 0.30 (0.03)
0.67 0.61
Total 2.11 0.50
23 In accordance with Accounting Standard 20 - “Earning per Share” notified under Rule 7 of the Companies (Accounts) Rules, 2014.
Earning per share
Particulars Year ended 31.03.2016
Year ended 31.03.2015
Net Profit attributable to Shareholders (` In Crores)
(a) Before exceptional item and contribution to Core SGF 1,620.09 1,616.38
Tax on above 557.63 542.40
Share of Profit from Associates and Minority Associates 89.66 64.72
Profit after tax and before exceptional item 1,152.12 1,138.70
(b) After exceptional item and contribution to Core SGF 654.14 1,026.48
Weighted Average number of equity shares issued (No. in Crores) 4.50 4.50
Basic earnings per share of ` 10/- each (in `)
(a) Before exceptional item and contribution to Core SGF 256.03 253.04
(b) After exceptional item and contribution to Core SGF 145.36 228.11
The Company does not have any outstanding dilutive potential equity shares. Consequently, the basic and diluted earning per share of the Company remain the same.
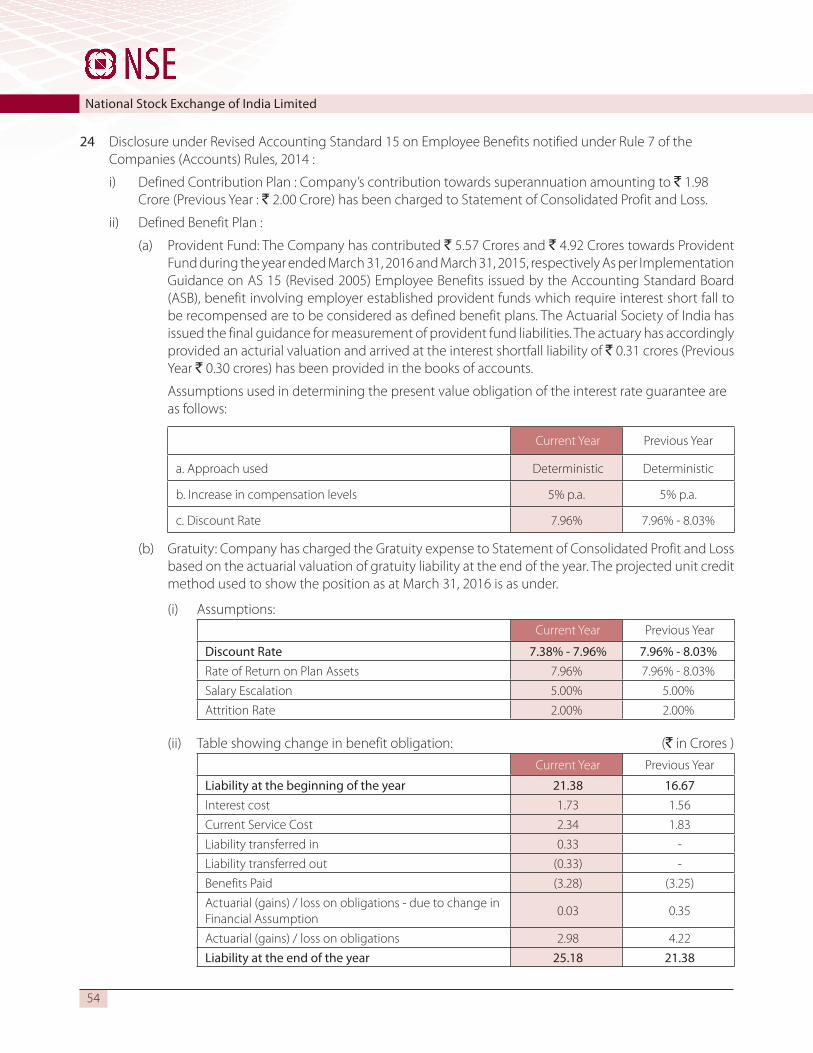
54
National Stock Exchange of India Limited
24 Disclosure under Revised Accounting Standard 15 on Employee Benefits notified under Rule 7 of the Companies (Accounts) Rules, 2014 :
i) Defined Contribution Plan : Company’s contribution towards superannuation amounting to ` 1.98 Crore (Previous Year : ` 2.00 Crore) has been charged to Statement of Consolidated Profit and Loss.
ii) Defined Benefit Plan :
(a) Provident Fund: The Company has contributed ` 5.57 Crores and ` 4.92 Crores towards Provident Fund during the year ended March 31, 2016 and March 31, 2015, respectively As per Implementation Guidance on AS 15 (Revised 2005) Employee Benefits issued by the Accounting Standard Board (ASB), benefit involving employer established provident funds which require interest short fall to be recompensed are to be considered as defined benefit plans. The Actuarial Society of India has issued the final guidance for measurement of provident fund liabilities. The actuary has accordingly provided an acturial valuation and arrived at the interest shortfall liability of ` 0.31 crores (Previous Year ` 0.30 crores) has been provided in the books of accounts.
Assumptions used in determining the present value obligation of the interest rate guarantee are as follows:
Current Year Previous Year
a. Approach used Deterministic Deterministic
b. Increase in compensation levels 5% p.a. 5% p.a.
c. Discount Rate 7.96% 7.96% - 8.03%
(b) Gratuity: Company has charged the Gratuity expense to Statement of Consolidated Profit and Loss based on the actuarial valuation of gratuity liability at the end of the year. The projected unit credit method used to show the position as at March 31, 2016 is as under.
(i) Assumptions: Current Year Previous Year
Discount Rate 7.38% - 7.96% 7.96% - 8.03%Rate of Return on Plan Assets 7.96% 7.96% - 8.03%
Salary Escalation 5.00% 5.00%
Attrition Rate 2.00% 2.00%
(ii) Table showing change in benefit obligation: (` in Crores )
Current Year Previous Year
Liability at the beginning of the year 21.38 16.67 Interest cost 1.73 1.56
Current Service Cost 2.34 1.83
Liability transferred in 0.33 -
Liability transferred out (0.33) -
Benefits Paid (3.28) (3.25)
Actuarial (gains) / loss on obligations - due to change in Financial Assumption
0.03 0.35
Actuarial (gains) / loss on obligations 2.98 4.22
Liability at the end of the year 25.18 21.38

Twenty-Fourth Annual Report FY 2015-2016
55
(iii) Tables of Fair value of plan assets: (` in Crores )
Current Year Previous Year
Fair Value of plan assets at the beginning of the year 15.30 10.71
Expected return on plan assets 1.22 0.89
Contributions 4.00 6.53
Transfer from other company - -
Benefits paid (3.28) (3.24)
Actuarial gain / (loss) on Plan Assets 0.25 0.41
Fair Value of plan assets at the end of the year 17.49 15.30
(iv) Actual Return on Plan Assets: (` in Crores )
Current Year Previous Year
Expected return on plan assets 1.22 0.89
Actuarial gain/(loss) on plan assets 0.25 0.41
Actual Return on plan assets 1.47 1.30
(v) Amount recognised in the Consolidated Balance Sheet (` in Crores )
Current Year Previous Year
Fair value of plan assets as at the end of the year 17.49 15.30
Liability as at the end of the year (25.18) (21.38)
Net (liability) / asset disclosed in the Consolidated Balance Sheet
(7.69) (6.08)
(vi) Expenses recognised in the Statement of Consolidated Profit & Loss (` in Crores )
Current Year Previous Year
Current Service cost 2.34 1.83
Interest Cost 0.88 1.55
Expected return on plan assets (0.36) (0.89)
Actuarial (Gain) or Loss 2.75 4.16
Expenses recognised in the Statement of Consolidated Profit & Loss
5.61 6.65
(vii) Consolidated Balance Sheet Reconciliation (` in Crores )
Current Year Previous Year
Opening Net Liability 6.08 5.96
Expense as above 5.61 6.65
Net (Liability)/Asset Transfer out - -
Employers Contribution (4.00) (6.53)
Amount recognised in the Consolidated Balance Sheet 7.69 6.08

56
National Stock Exchange of India Limited
(viii) Category of Assets (` in Crores )
Current Year Previous Year
Insurer Managed Funds 17.49 15.30
Total 17.49 15.30
(ix) Experience Adjustment (` in Crores )
Current Year Previous Year
On Plan Liability (Gain) / Loss 3.11 4.31
On Plan asset (Loss) / Gain 0.38 0.34
25 In accordance with Accounting Standard 19 - “Leases” notified under the Rule 7 of the Companies (Accounts) Rules, 2014, the details of obligation on long term non - cancellable operating lease in respect of certain vehicles and office premises taken by the Company are as follows.
(` In Crores)
Lease obligations Year ended 31.03.2016
Year ended 31.03.2015
Total of future minimum lease payments
- Lease rentals paid during the year 13.31 14.34
- Not later than one year 11.98 12.44
- Later than one year and not later than five years 14.36 18.49
- Later than five years 0.45 0.75
The terms of the Leases range from 3 years to 9 years.
26 In compliance with Accounting Standard 18 - “Related Party Disclosures” notified under the Rule 7 of the Companies (Accounts) Rules, 2014, the required disclosures are given in the table below:
(a) Names of the related parties and related party relationship
Sr. No. Related Party Nature of Relationship
1 Power Exchange India Limited
Associate Company
2 NSDL e-Governance Infrastructure Limited
3 National Securities Depository Limited
4 Computer Age Management Services Private Limited
5 Market Simplified India Limited
6 BFSI Sector Skill Council of India
7 CAMS Investor Services Private Limited Subsidiary of Associate Company8 NSDL Database Management Limited
9 Receivable Exchange of India Limited (w.e.f 25.02.2016) Joint Venture Company
10 Ms. Chitra Ramkrishna - Managing Director & CEOKey Management
Personnel

Twenty-Fourth Annual Report FY 2015-2016
57
(b) Names of the related parties and relationship (` in Crores )
Name of the Related Party Nature of Transactions Year ended 31.03.2016
Year ended 31.03.2015
Power Exchange India Ltd.
Space and Infrastructure usage charges received
- -
Application Development and Maintenance Services
0.53 0.54
Applicable Taxes Recovered 0.07 0.07
Reimbursement received for other expenses incurred
- 1.15
Closing balance included in Current Assets
1.00 1.09
Investment in Prefrence Share Capital
5.01 5.01
Investment in Equity Share Capital
15.00 15.00
NSDL e-Governance Infrastructure Limited
Application Development and Maintenance Services
0.62 0.72
Applicable Taxes Recovered 0.09 0.09
Dividend received 6.01 5.51
Closing balance included in Current Assets
0.13 0.24
Investment in Equity Share Capital
35.42 35.42
National Securities Depository Limited (new)
Dividend received 2.50 2.50
Application Development and Maintenance Services
0.32 0.35
Infrastructure Management Services
- 0.01
Applicable Taxes Recovered 0.04 0.05
Closing balance included in Loans & Advances
0.01 0.01
Closing balance included in Current Assets
0.04 0.26
Investment in Equity Share Capital
61.49 61.49

58
National Stock Exchange of India Limited
Name of the Related Party Nature of Transactions Year ended 31.03.2016
Year ended 31.03.2015
Market Simplified India Limited
License Fees Paid 0.68 0.67
Consultancy Charges paid for software development
1.88 -
Investment in Equity Shares (Closing Balance)
4.51 4.51
Closing balance included in Current Liabilities
- (0.06)
Computer Age Management Services Private Limited
Dividend Received 21.21 20.25
Reimbursement received for expenses incurred
0.11 -
Investment in Equity Shares (Closing Balance)
412.13 412.13
CAMS Investor Services Private Limited
KRA fees received / receivable
0.13 0.06
KRA fees Paid / payable 0.00 0.00
Outstanding balance included in Current Assests
0.03 0.05
Outstanding balance included in Current Liabilities
0.00 0.00
NSDL Database Management Ltd.
Application Development and Maintenance Services
(0.00) 0.06
Infrastructure Management Services
0.07 0.09
Applicable taxes recovered 0.01 0.02
Outstanding balance included in Current Assests
0.02 0.01
Receivables Exchange of India Limited
Preliminary Expenses paid on behalf of Receivables Exchange of India Limited
0.13 -
Recoverable towards software development charges paid
0.08 -
Interest recoverable 0.00 -
Closing balance included in Loans & Advances
0.21 -

Twenty-Fourth Annual Report FY 2015-2016
59
Name of the Related Party Nature of Transactions Year ended 31.03.2016
Year ended 31.03.2015
BFSI Sector Skill Council Of India
Amount paid towards PMVY centres
0.09 -
Investment in Equity Share Capital
1.00 1.00
Key Management Personnel
Gross remuneration including allowances, non-cash perquisites and contribution to Provident Fund and Superannuation Fund etc.
9.12 * 7.45 *
* Includes 50% of the variable pay payable after 3 years subject to certain conditions.
27 Segment Reporting
a The disclosure in respect of Segment information as per Accounting Standard - 17 on "Segment Reporting" notified under the Rule 7 of the Companies (Accounts) Rules, 2014 for the year ended March 31, 2016 is given as follows:
The Company has identified segments viz. Trading Services, Clearing Services, End to End Solutions, E-Learning Solutions, Data Feed, Web trading, IT services, IT Process Support charges, Index licensing, strategic investment and Software application development. Out of these, reportable segments are Trading Services and Clearing Services. Segments have been identified and reported taking into account nature of products and services, the differing risks and returns and the internal business reporting systems. The accounting policies adopted for segment reporting are in line with the accounting policy of the Company with following additional policies for segment reporting.
a) Revenue and expenses have been identified to a segment on the basis of relationship to operating activities of the segment. Revenue and expenses which relate to enterprise as a whole and are not allocable to a segment on reasonable basis have been disclosed as “Unallocable”.
b) Segment assets and segment liabilities represent assets and liabilities in respective segments. Investments, tax related assets and other assets and liabilities that cannot be allocated to a segment on reasonable basis have been disclosed as “Unallocable”.

60
National Stock Exchange of India LimitedBu
sine
ss S
egm
ents
:
Parti
cular
sTr
adin
g Se
rvice
sCl
earin
g Se
rvice
sDa
tafe
ed
Serv
ices
Inde
x Lic
ensin
g Se
rvice
s
Stra
tegi
c In
vest-
men
ts
Othe
rsEli
min
a-tio
nTo
tal
Trad
ing
Serv
ices
Clea
ring
Serv
ices
Data
feed
Se
rvice
sIn
dex
Licen
sing
Serv
ices
Stra
tegi
c In
vest-
men
ts
Othe
rsEli
min
a-tio
nTo
tal
31.03
.2016
31.03
.2016
31.03
.2016
31.03
.2016
31.03
.2016
31.03
.2016
31.03
.2015
31.03
.2015
31.03
.2015
31.03
.2015
31.03
.2015
31.03
.2015
REVE
NUE :
Exte
rnal
Reve
nue
1,45
0.20
173.9
3 60
.09
67.58
-
102.7
0 -
1,85
4.50
1,33
8.85
212.0
8 47
.75
43.44
-
80.97
-
1,72
3.09
Inte
r-seg
men
t Rev
enue
30.22
98
.35
0.32
10
.39
63.73
11
4.10
(317
.11)
- 24
.83
91.18
0.
17
8.23
70
.99
113.6
8 (3
09.08
) -
Tota
l Rev
enue
1,48
0.42
272.2
8 60
.41
77.97
63
.73
216.8
0 (3
17.11
) 1,
854.5
0 1,
363.6
8 30
3.26
47.92
51
.67
70.99
19
4.65
(309
.08)
1,72
3.09
RESU
LT
Segm
ent R
esul
t 33
.97*
193.4
5 42
.23
71.41
57
.43
26.30
-
424.7
9 56
8.31*
23
1.28
34.33
47
.18
70.99
15
.56
- 96
7.65
Add:
Unall
ocab
le In
com
e (ne
t of
unall
ocab
le ex
pend
iture
) 10
8.33
177.2
3
Add:
Inte
rest
Inco
me
325.4
5 30
1.50
Prof
it be
fore
tax &
exce
ptio
nal it
em 85
8.57
1,44
6.38
Prof
it / (
Loss
) on
sale
of Lo
ng te
rm
Equi
ty in
vestm
ents
- -
Prof
it be
fore
tax
858.5
7 1,
446.3
8
Less
:Prov
ision
for c
urre
nt ta
x (2
90.29
) (4
80.26
)
Add:
MAT
Cre
dit a
djus
ted
- 0.
05
Less
:Prov
ision
for d
efer
red
tax
(4.68
) (4
.36)
Less
:Wea
lth ta
x for
earli
er ye
ars
1.08
-
Less
:Inco
me t
ax fo
r ear
lier y
ears
(0.20
) (0
.05)
Prof
it af
ter t
ax an
d be
fore
min
ority
in
tere
st an
d sh
are o
f loss
of
asso
ciate
564.4
8 96
1.76
Less
: Min
ority
Inte
rest
- -
Add:
Shar
e of p
rofit
(net
) of
asso
ciate
(s) 89
.66
64.72

Twenty-Fourth Annual Report FY 2015-2016
61
Parti
cular
sTr
adin
g Se
rvice
sCl
earin
g Se
rvice
sDa
tafe
ed
Serv
ices
Inde
x Lic
ensin
g Se
rvice
s
Stra
tegi
c In
vest-
men
ts
Othe
rsEli
min
a-tio
nTo
tal
Trad
ing
Serv
ices
Clea
ring
Serv
ices
Data
feed
Se
rvice
sIn
dex
Licen
sing
Serv
ices
Stra
tegi
c In
vest-
men
ts
Othe
rsEli
min
a-tio
nTo
tal
31.03
.2016
31.03
.2016
31.03
.2016
31.03
.2016
31.03
.2016
31.03
.2016
31.03
.2015
31.03
.2015
31.03
.2015
31.03
.2015
31.03
.2015
31.03
.2015
Prof
it af
ter t
ax 65
4.14
1,02
6.48
OTHE
R INF
ORM
ATIO
N
Segm
ent A
sset
s 2,
077.3
7 4,
400.9
1 6.
08
10.71
78
2.52
57.98
7,
335.5
7 1,
988.1
5 3,
695.0
4 4.
30
7.49
81
2.38
43.71
6,
551.0
7
Unall
ocab
le As
sets
6,15
0.89
5,23
9.46
Tota
l Ass
ets
13,48
6.46
11,79
0.53
Segm
ent L
iabilit
ies 2,
296.1
4 4,
338.7
3 8.
13
2.95
1.
39
35.50
6,
682.8
4 2,
038.0
4 3,
465.4
9 5.
78
2.05
0.
58
34.22
5,
546.1
6
Unall
ocab
le Lia
bilit
ies 40
6.42
517.5
9
Tota
l Liab
ilities
7,08
9.26
6,06
3.75
Capi
tal E
xpen
ditu
re
Segm
ent C
apita
l Exp
endi
ture
138.8
8 6.
88
0.00
-
- 2.
21
147.9
7 14
8.77
1.09
0.
24
- -
2.42
15
2.52
Unall
ocab
le Ca
pita
l Exp
endi
ture
- -
Tota
l Cap
ital E
xpen
ditu
re 14
7.97
152.5
2
Depr
eciat
ion/
Amor
tisat
ion
Segm
ent D
epre
ciatio
n /
Amor
tisat
ion
** 10
1.92
2.30
0.
13
0.00
-
3.42
10
7.77
94.61
1.
95
0.14
-
- 8.
14
104.8
4
Unall
ocab
le De
prec
iatio
n /
Amor
tisat
ion
1.15
1.
19
Tota
l Dep
recia
tion
/ Am
ortis
atio
n 10
8.92
106.0
3
* Se
gmen
t res
ult i
s ne
t of c
ontr
ibut
ion
to C
ore
SGF
amou
ntin
g to
` 7
61.5
2 cr
ores
(Pre
viou
s Yea
r ` 1
70 c
rore
s)**
in
clud
es d
epre
ciat
ion/
amor
tisat
ion
of `
Nil
(Pre
viou
s Yea
r ` 1
2.74
cro
re -
Trad
ing
Segm
ent `
9.9
9 cr
ore
and
Oth
ers `
2.75
cro
re) a
djus
ted
agai
nst o
peni
ng re
tain
ed e
arni
ngs
purs
uant
to
the
prov
isio
ns o
f Com
pani
es A
ct, 2
013.
The
busi
ness
es, w
hich
wer
e no
t rep
orta
ble
segm
ents
dur
ing
the
year
, hav
e be
en g
roup
ed u
nder
the
“Oth
ers”
segm
ent w
hich
com
pris
es o
f: En
d to
End
Sol
utio
n, E
-lear
ning
Sol
utio
ns,W
eb
trad
ing,
IT s
ervi
ces,
IT P
roce
ss S
uppo
rt c
harg
es,a
nd S
oftw
are
appl
icat
ion
deve
lopm
ent.

62
National Stock Exchange of India Limited
28 Capital and other commitments
Estimated amount of contracts remaining to be executed on capital account (net of advances) and not provided for ̀ 73.34 Crores (previous year ` 37.00 Crores) and other commitments of ̀ 31.01 crores ( Previous year ` NIL)
29 Contingent liability:
(i) Claims against the company not acknowledged as debts: `11.96 Crores (previous year`12.39 Crores)
(ii a ) In a complaint filed by a competitor against the Company, the Competition Commission of India directed the Company to pay a penalty of ` 55.50 crores (Previous Year : ` 55.50 crores). The Company had appealed against the order before the Hon'ble Competition Appellate Tribunal (COMPAT) which rejected the appeal. The Company has appealed against the said order and stay has been granted by the Hon'ble Supreme Court of India. In respect of the same subject matter, a compensation claim has been filed against the Company amounting to ` 856.99 crores (Previous Year : ` 856.99) before the COMPAT by the competitor and the same is being disputed by the Company. Based on the legal advice, the Company is of the view that there are strong grounds that the Hon'ble Supreme Court of India will over turn the decision of the COMPAT.In view of the same no provision has been made in respect of penalty and compensation claimed.
(ii b ) A suit has been filed, jointly and severally against the Company and National Securities Clearing Corporation Limited for damages / compensation amounting to ` 152.57 crores (Previous Year : ` 152.57 crores) along with interest thereon and has been disputed by the Company.As per the legal opinion received, the possibiity of the claim being awarded against the Company is remote.
(iii) On account of disputed demand of Income Tax: ` 46.95 Crores (previous year ` 59.30 Crores), disputed demand of Fringe Benefit Tax: ̀ 2.22 Crores (previous year ̀ 2.22 Crores) and disputed demand of Wealth Tax: ` 1.94 Crores (previous year ` 1.94 Crores). Wealth Tax liability includes ` 1.86 Crores (previous year ` 1.86 Crores) on account of Tax Department appeals pending disposal before the Bombay High Court. On account of disputed demand of Service Tax: ` 47.75 Crores (previous year ` 39.58 crores) alongwith interest and penalty thereon.On account of show-cause cum demand notice on disputed matter of Central Excise for ` 0.13 Crores alongwith interest and penalty (Previous Year ` 0.13 crores).
(iv) On account of disputed demand of Securities Transaction Tax : ` 5.21 Crores (previous year ` 5.21Crores)
(v) On account of Bank Guaranties ` 1.10 Crores (Previous year ` 0.48 Crores)
(vi) On account of disputed demand of Sales tax/VAT : ` 6.30 crores (Previous year ` Nil) (As against the refund claim of ` 0.03 crores for F.Y. 2008-09, the Assessing Authority has raised a demand of ` 6.05 crores.In case of subsidiary company, NSEIT Limited is in process of filing an appeal against the demand of ` 6.05 crores)
30 In the opinion of the Board, current assets, loans and advances are approximately of the value stated, if realised in the ordinary course of business.
31 Securities and Exchange Board of India, vide circular CIR/MRD/DRMNP/25/2014 dated August 27, 2014, interlia, has issued norms related to the computation and contribution to the Core Settlement Guarantee Fund (Core SGF) by the Clearing Corporation (minimum 50%), Stock Exchange (minimum 25%) and members (maximum 25%) for each segment. Details of Core SGF a on 31-Mar-2016 are as follows :

Twenty-Fourth Annual Report FY 2015-2016
63
` In Crs.
Details of MRC of Core SGF CM FO CD Debt Total
NSCCL own contribution 73.42 357.27 46.76 3.00 480.45
Contribution by NSCCL on behalf of Member
0.55 13.60 2.25 - 16.40
Member Deposits 13.27 28.54 5.22 - 47.04
Member Cash Equivalents 22.88 136.49 15.90 - 175.28
Contribution by NSE 37.00 179.00 24.00 1.00 241.00
Total 147.13 714.90 94.14 4.00 960.17
Out of the above the details of the Cash contributions and investment of the same are as follows : ` In Crs.
I Contribution to Corpus of Core SGF
CM FO CD Debt Total
a NSCCL own contribution 74.81 361.46 48.62 3.00 487.89
b Contribution by NSCCL on behalf of Member
0.54 13.63 2.25 - 16.42
c Member Deposits 13.27 28.54 5.22 - 47.04
d Contribution by NSE 37.00 179.00 24.00 1.00 241.00
1 Total (a+b+c+d) 125.62 582.63 80.09 4.00 792.34
2 Penalty* 19.38 100.98 11.70 - 132.06
3 Income on Investments* 8.33 27.93 5.06 0.15 41.47
Grand Total (1+2+3) 153.33 711.54 96.85 4.15 965.88
II Details of Investment CM FO CD Debt Total
1 Mutual Funds 97.32 488.99 59.67 2.85 648.83
2 Fixed Deposit with Banks 33.60 199.98 26.47 - 260.05
3 Flexi Fixed Deposits 22.39 21.72 8.80 - 52.91
4 Balance in Bank Accounts 0.02 0.85 1.92 1.30 4.08
Grand Total (1+2+3+4) 153.33 711.54 96.85 4.15 965.88
* Net of applicable corporate tax ` 9.38 Crs, on cash basis.
32 Movement in Goodwill on Consolidation (` In Crores)
Particulars As at 31.03.2016 As at 31.03.2015
Goodwill on Consolidation as on 1-Apr-15 67.35 67.35
Less : Goodwill on Consolidation written off (0.44) -
Goodwill on Consolidation as on 31-Mar-16 66.91 67.35

64
National Stock Exchange of India Limited
33 Movement in Capital Reserve on Consolidation (` In Crores)
Particulars As at 31.03.2016 As at 31.03.2015
Capital Reserve on Consolidation as on 1-Apr-15 39.39 39.39
Capital Reserve on Consolidation as on 31-Mar-16 39.39 39.39
34 Share of Profit / (loss) for AS - 23 "Accounting for Investments in Associates in Consolidated Financial Statements"
(` In Crores)
Particulars 2015-16 2014-15
Power Exchange India Limited - -
National Securities Depository Limited 25.81 11.68
NSDL-e governance Infrastructure Limited 21.41 17.09
Market Simplified India Limited 0.24 0.35
Computer Age Management Services Private Limited 42.20 35.60
Total 89.66 64.72
35 The Company has made an investment in BFSI Sector Skill Council of India, an assoiate company incorporated under section 8 of Companies Act, 2013, wherein the profits will be applied for promoting its objects. Since the Company will not derive any economc benefit from its investments in BFSI Sector Skill Council of India, share of profit/loss of BFSI Sector Skill Council of India are not consolidated in these financial statements
36 a) In accordance with Regulation 33 of Securities Contracts (Regulations) (SECC) Regulations, 2012 (The Regulations) issued on June 20, 2012, every recognized stock exchange was required to transfer twenty five percent of its annual profits every year to a fund of the recognized clearing corporation(s) which clears and settles trades executed on that stock exchange to guarantee settlement of trades.The Securities and Exchange Board of India (SEBI) in its Press Release No.225/2015 dated September 1, 2015, stated that the report of the Committee on Clearing Corporations had been placed before the SEBI Board in its meeting held on August 24, 2015 and that while the SEBI Board took note of the report, it approved the proposal to seek public comments on the recommendations of the committee. Pending final notification based on the decision which was to be taken by SEBI after the public comments were received, the Company has made a provisional appropriation of ` 527.19 crores (net of ` 170 crores transferred to Core SGF (Refer Note 36(b)) as at March 31, 2015 and the same had been shown under the head Short Term Provisions, to be suitably adjusted in the light of the final SEBI notification in the matter.
(i) SEBI has in its Circular No. SEBI/HO/MRD/DRMNP/CIR/2016/54 dated May 04, 2016 since notified that the amounts carried forward in the Short Term provision in respect of the period upto March 31, 2015 have to be transferred by the Stock Exchange to the Core SGF maintained by the Clearing Corporation within one month of the date of issuance of the notification and that the amounts to be transferred by the Stock Exchange to the Core SGF maintained by the Clearing Corporation in respect of the period from April 01, 2015 till the date of amendment of the Regulation 33 of SECC Regulation, 2012 within such time as to be specified by SEBI.
(ii) Accordingly, the provisional appropriations made out of profits aggregating to ` 527.19 crores

Twenty-Fourth Annual Report FY 2015-2016
65
shown under the head Short Term Provision in the Balance Sheet as on March 31, 2015 have been reversed and a provision for an equivalent amount has been made during the year. Further a provision of ` 163.32 crores has also been made during the year for the period April 01, 2015 till March 31,2016 (net of of ` 71 crores transferred to Core SGF for the year (Refer Note 36 (b)). Both these provisions are disclosed as an exceptional item and an aggregate amount of ` 690.52 crores payable to Core SGF has been shown under the head Other current liability in the Balance sheet.
b) In terms of Securities and Exchange Board of India circular CIR/MRD/DRMNP/25/2014 dated August 27, 2014, the Clearing Corporation (CC) shall have a fund called Core SGF for each segment of each Recognised Stock Exchange (SE) to guarantee the settlement of trades executed in respective segment of the SE. The Recognised SE shall contribute at least 25 % of the Minimum Required Corpus of Core SGF (MRC). The contribution to be made by the Recognised SE to the said Core SGF can be adjusted against transfer of 25% of the profit by the Recognised SE as required by Regulation 33 of SECC Regulations. Accordingly, during the year ended March 31, 2016, an amount of ` 71 crores ( Previous Year - ` 170 crores) has been transferred to the Clearing Corporation towards contribution to the said Minimum Required Corpus of Core SGF and the same is adjusted against appropriation of 25% of the profit as mentioned in note (36)(a)(ii) and has been charged to Statement of Profit and Loss and shown as exceptional item.
37 In case of a subsidiary namely National Securities Clearing Corporation Limited, during the year, dues amounting to ` 83.47 crores (previous year ` 72.38 crores) of defaulter member, after netting off available deposits and collaterals in the form of securities available with the company have been partly appropriated from Fines and Penalties amounting to ` 59.37 crores and the balance amount of ` 24.10 crores (previous year ` 72.38 crores) from the contribution provisionally receivable from National Stock Exchange of India Limited towards Settlement Guarantee Fund under the Securities Contracts (Regulations) (SECC) Regulations, 2012.
38 Details of dues to micro and small, medium enterprises as defined under the MSMED Act, 2006
Liability for expenses includes ` 0.11 Crore (Previous Year: ` 0.05 Crore) due to Micro, Small & Medium Enterprises. Total outstanding dues to Micro, Small & Medium Enterprises have been determined to the extent such parties have been identified on the basis of information available with the Company.
39 Balance with Escrow Account
In case of subsidiary NSEIT Limited, The Company jointly with Unique Identification Authority of India (UIDAI) maintains a escrow bank account with State Bank of India (SBI) for the purpose of collection of fees from candidates appearing for the UIDAI certification exams. The operating control of the said bank account rests solely with UIDAI and amounts due to the Company are paid out by SBI (under instruction from UIDAI) on periodic basis to the Company on fulfillment of certain conditions by the Company.The balance in the escrow bank account as of the Balance Sheet date is shown under Other Bank balances under Current Assets. Since the amounts lying in escrow bank account are not at disposal of the company the same is also shown as liability under Other Current Liabilities.
40 a Gross amount required to be spent by the Company on Corporate Social Responsibility activities during the
financial year 2015-16 is ` 28.86 crores (Previous year : ` 28.01 crores)
b Amount spent during the year towards Primary Education, Elder Care, etc :

66
National Stock Exchange of India Limited
Particulars In cash Yet to be paid in cash
Total
Construction / acquisiting of any asset - - -
- - -
On purposes other than above * 2.71 - 2.71
(0.62) - (0.62)
Figure in brackets pertain to year ended March 31, 2015
* excludes ̀ 0.12 crores (previous year ̀ 0.08 crores) on capacity building of personnel and implementing agencies
etc., which is in excess of 5 % of total CSR expenditure.
41 a C.I.F. value of import in respect of Capital goods : ` 4.36 Crores (Previous year : ` 16.61 Crores)
b Expenditure in foreign currency (accrual basis)(` in Crores)
Particulars Current Year Previous Year
Travelling Expenses 1.06 1.05
Professional and Technical Fees 24.84 16.57
Direct Fees & Subscription 0.06 0.04
Subcontract/ Technical Fees 20.31 21.18
Software Licenses 0.07 0.00
Recruitment Expenses - 0.03
Others 2.19 1.47
c Net dividend remitted in foreign exchange
Year of remittance (ending on) 31.03.2016 31.03.2015
Period to which it relates 01.04.2014 to 31.03.2015
01.04.2013 to 31.03.2014
Number of non-resident shareholders to whom dividend remitted in foreign currency
4.00 7.00
Number of equity shares held on which dividend was due 6,075,000.00 8,775,000.00
Amount remitted INR equivalent USD ( ` In Crores) 48.30 59.67
d Earning in Foreign Currency(` in Crores)
Particulars Current Year Previous Year
Application Development and Maintenance Services 7.27 7.58
E-Learning 0.27 0.25
Index License Fees Outside India : 57.06 34.47
ETF Licensing Outside India: 2.28 1.72
Data Subscription Fees: 3.15 2.57
Revenue Sharing - S & P: - -
Others 45.66 34.52

Twenty-Fourth Annual Report FY 2015-2016
67
e Particulars of un-hedged foreign currency exposure as at Balance Sheet date is as follow : Trade Receivable
Financial Year Currency Foreign Currency Exchange Rate ` in crores
2015 - 16 USD 1,072,477.68 66.33 7.11 2014 - 15 USD 571,338.64 62.59 3.58
42 The Group, its jointly controlled entity and its associates pending litigations comprise of claims against the Group, its jointly controlled entity and its associates and proceedings pending with Statutory and Tax Authorities. The Group, its jointly controlled entity and its associates has reviewed all its pending litigatins and proceedings and has made adequate provisions, whenever required and disclosed the contingent liabilities, wherever applicable, in its consolidated financial statements. The Group, its jointly controlled entity and its associates does not expect the outcome of these proceedings to have a material impact on its financial position (Refer note no 29 for details on contingent liabilities)
43 In accordance with relevant provisions of Companies Act, 2013, the Group, its jointly controlled entity and its associates did not have any long-term contracts including derivative contracts as at March 31, 2016.
44 For the year ended March 31, 2016, the Group, its jointly controlled entity and its associates is not required to transfer any amount into the Investor Education & Protection Fund.as required under relevant provisions of the Companies Act, 2013.
45 (a) Statement containing salient features of the financial statement of subsidiaries/associate companies/joint ventures Form AOC 1 (Pursuant to first proviso to sub-section (3) of section 129 read with rule 5 of Companies (Accounts) Rules, 2014)
Part “A”: Subsidiaries(` in crores)
Name of Subsidiary National Securities Clearing
Corporation Limited
NSE Strate-gic Invest-ment Cor-poration Limited
Dotex In-ternational
Limited (Note 1)
India Index Services & Products Limited (Note 1)
NSE.IT LTD (Note 1)
NSE Educa-tion Facili-
ties Limited (Note 1)
NSE.IT (US) INC.
( Note.2 )
Nse Info-tech Ser-vices Ltd (Note 1)
Reporting period March 31, 2016
March 31, 2016
March 31, 2016
March 31, 2016
March 31, 2016
March 31, 2016
March 31, 2016
March 31, 2016
Share Capital 45.00 825.99 9.00 1.30 10.00 0.25 5.35 0.05
Reserves and Surplus
523.98 129.92 94.99 136.74 79.43 -0.05 -4.34 5.40
Total assets 5,111.63 957.31 117.50 141.43 111.41 0.25 4.99 16.26
Total liabilities 5,111.63 957.31 117.50 141.43 111.41 0.25 4.99 16.26
Investments 1,509.60 954.40 83.71 111.67 7.62 0.00 0.00 0.00
Turnover 331.42 70.64 90.37 84.12 148.48 0.00 8.87 46.91
Profi t before taxation
251.70 63.28 51.88 77.53 31.61 -0.05 0.77 1.64
Provision for taxation
85.81 2.32 18.28 26.60 11.27 0.00 0.04 0.55
Profi t after taxation 165.89 60.95 33.60 50.93 20.34 -0.05 0.73 1.09
Proposed dividend 157.50 0.00 0.90 0.13 1.00 0.00 0.00 0.00
% of shareholding 100.00% 100.00% 100.00% 100.00% 100.00% 100.00% 100.00% 100.00%
Note :1. Dotex International Limited, India Index Services & Products Limited, NSEIT Ltd, Nse Infotech Services Ltd and NSE
Education Facilities Limited are wholly owned subsidiaries of NSE Strategic Investment Corporation Limited.2. NSE.IT (US) INC. is a wholly owned subsidiary of NSE.IT LTD. The fi nancial information of NSE.IT (US) INC. have been translated
into INR at the closing rate at March 31, 2016 of 1USD = Rs.66.3329 for purpose of translation of balance sheet purpose and average rate for FY 2015-16 of 1USD = Rs. 64.2455 for purpose of translation of Statement of Profi t and Loss.

68
National Stock Exchange of India Limited
Part “B”: Associates and Joint Ventures Statement pursuant to Section 129 (3) of the Companies Act, 2013 related to Associate Companies and Joint
Ventures
(` in crores)Name of Associates/Joint Ventures National Securi-
ties Depository Limited
Computer Age Management
Services Private Limited
Nsdl E - Gov-ernance In-frastructure
Limited
Market Simpli-fi ed India Lim-
ited
Power Exchange India Limited
Latest audited Balance Sheet Date March 31, 2016 March 31, 2015 March 31, 2015 March 31, 2015 March 31, 2015
Shares of Associate held by the group at the abovementioned reporting date
Number of Equity Shares 10,018,000.00 21,938,400 10,018,000 4,505,175 15,000,030
Amount of Investment in Associates
61.49 412.13 55.10 4.51 15.04
Extend of Holding % 25.05% 44.99% 25.05% 30.00% 30.95%
Description of how there is signifi cant infl uence
Note 1 Note 1 Note 1 Note 1 Note 1
Reason why the associate is not consolidated
N.A N.A N.A N.A N.A
Networth attributable to Shareholding as per latest audited Balance Sheet
453.60 294.95 281.33 8.60 -0.68
Profi t / Loss for the year
i. Considered in Consolidation 25.81 42.20 21.41 0.24 -
ii. Not Considered in Consolidation - - - - -
Notes :-1. The group has signifi cant infl uence through holding more than 20.00% of the equity shares in the investee company in
terms of Accounting Standard 23,issued by ICAI.2. During the year the company has entered into a Joint Venture namely Receivables Exchange of India Limited which is yet
to commence operations as on 31st March 2016.
(b) Statement Of Net Assets And Profit Or Loss Attributable To Owners
Name of the Entity Net Assets, i.e. total assets minus total liabilities
Share in profit or loss
As % ofConsolidated
Net Assets
Amount ( ` Crores)
As % ofConsolidated
Profit and Loss
Amount ( ` Crores)
National Stock Exchange of India Limited 73.91% 5,276.74 56.86% 439.33
(71.51%) (4,673.53) (67.93%) (779.68)
Indian SubsidiariesNational Securities Clearing Corporation Limited
7.97% 568.98 21.47% 165.89
(10.75%) (702.66) (19.06%) (218.80)
NSE Strategic Investment Corporation Limited
13.39% 955.91 7.89% 60.95
(13.69%) (894.97) (6.13%) (70.35)
NSEIT Limited 1.25% 89.43 2.63% 20.34
(1.08%) (70.33) (1.33%) (15.23)

Twenty-Fourth Annual Report FY 2015-2016
69
Name of the Entity Net Assets, i.e. total assets minus total liabilities
Share in profit or loss
As % ofConsolidated
Net Assets
Amount ( ` Crores)
As % ofConsolidated
Profit and Loss
Amount ( ` Crores)
India Index Services & Products Limited 1.93% 138.04 6.59% 50.93
(1.34%) (87.26) (2.99%) (34.29)
DotEx International Limited 1.46% 103.99 4.35% 33.60
(1.56%) (102.16) (2.46%) (28.25)
NSE Infotech Services Limited 0.08% 5.45 0.14% 1.09
(0.07%) (4.37) (0.07%) (0.86)
NSE Education Facilities Limited 0.00% 0.20 -0.01% -0.05
N.A. N.A. N.A. N.A.
Foreign SubsidiaryNSE. IT (US) Inc. 0.01% 1.01 0.09% 0.73
(0.00%) (0.24) (0.03%) (0.35)
Indian Joint VentureReceivables Exchange of India Limited 0.00% 0.07 -0.02% -0.13
N.A. N.A. N.A. N.A.
Total 100% 7,139.82 100% 772.68 Adjustment arising out of Consolidation -742.62 -118.54
Consolidated Net Assets / Profit after tax 6,397.20 654.14 (5,726.78) (1,026.48)
Figure in brackets pertain to year ended March 31, 2015
As per our report of even date attached For and on behalf of the Board of Directors
For KHANDELWAL JAIN & CO.,Chartered AccountantsFirm's Registration no : 105049W NARENDRA JAIN ASHOK CHAWLA CHITRA RAMKRISHNAPartner Chairman Managing Director & CEOMembership No.:048725
J. RAVICHANDRAN YATRIK VINPlace : Mumbai Group President & Chief Financial OfficerDate : May 12, 2016 Company Secretary

70
National Stock Exchange of India Limited
INDEPENDENT AUDITOR’S REPORT
TO THE MEMBERS OF NATIONAL STOCK EXCHANGE OF INDIA LIMITED
Report on the Standalone Financial Statements
We have audited the accompanying standalone financial statements of NATIONAL STOCK EXCHANGE OF INDIA LIMITED (“the Company”), which comprise the Balance Sheet as at March 31, 2016, the Statement of Profit and Loss, the Cash Flow Statement for the year then ended, and a summary of the significant accounting policies and other explanatory information.
Management’s Responsibility for the Standalone Financial Statements
The Company’s Board of Directors is responsible for the matters stated in Section 134(5) of the Companies Act, 2013 (“the Act”) with respect to the preparation and presentation of these standalone financial statements that give a true and fair view of the financial position, financial performance and cash flows of the Company in accordance with the accounting principles generally accepted in India, including the Accounting Standards specified under Section 133 of the Act, read with Rule 7 of the Companies (Accounts) Rules, 2014. This responsibility also includes maintenance of adequate accounting records in accordance with the provisions of the Act for safeguarding of the assets of the Company and for preventing and detecting frauds and other irregularities; selection and application of appropriate accounting policies; making judgments and estimates that are reasonable and prudent; and design, implementation and maintenance of adequate internal financial controls, that were operating effectively for ensuring the accuracy and completeness of the accounting records, relevant to the preparation and presentation of the financial statements that give a true and fair view and are free from material misstatement, whether due to fraud or error.
Auditor’s Responsibility
Our responsibility is to express an opinion on these standalone financial statements based on our audit.
We have taken into account the provisions of the Act, the accounting and auditing standards and matters which are required to be included in the audit report under the provisions of the Act and the Rules made thereunder.
We conducted our audit in accordance with the Standards on Auditing specified under Section 143(10) of the Act. Those Standards require that we comply with ethical requirements and plan and perform the audit to obtain reasonable assurance about whether the financial statements are free from material misstatement.
An audit involves performing procedures to obtain audit evidence about the amounts and the disclosures in the financial statements. The procedures selected depend on the auditor’s judgment, including the assessment of the risks of material misstatement of the financial statements, whether due to fraud or error. In making those risk assessments, the auditor considers internal financial control relevant to the Company’s preparation of the financial statements that give a true and fair view in order to design audit procedures that are appropriate in the circumstances. An audit also includes evaluating the appropriateness of the accounting policies used and the reasonableness of the accounting estimates made by the Company’s Directors as well as evaluating the overall presentation of the financial statements.
We believe that the audit evidence we have obtained is sufficient and appropriate to provide a basis for our audit opinion on the standalone financial statements.
Opinion
In our opinion and to the best of our information and according to the explanations given to us, the aforesaid standalone financial statements give the information required by the Act in the manner so required and give a

Twenty-Fourth Annual Report FY 2015-2016
71
true and fair view in conformity with the accounting principles generally accepted in India, of the state of affairs of the Company as at March 31, 2016, and its profit and its cash flows for the year ended on that date.
Report on Other Legal and Regulatory Requirements
1. As required by the Companies (Auditor’s Report) Order, 2016 (“the Order”), issued by the Central Government of India in terms of sub-section (11) of section 143 of the Act, we give in the “Annexure A”, a statement on the matters specified in paragraphs 3 and 4 of the Order.
2. As required by Section 143 (3) of the Act, we report that:
(a) we have sought and obtained all the information and explanations which to the best of our knowledge and belief were necessary for the purposes of our audit;
(b) in our opinion, proper books of account as required by law have been kept by the Company so far as it appears from our examination of those books;
(c) the Balance Sheet, the Statement of Profit and Loss, and the Cash Flow Statement dealt with by this Report are in agreement with the books of account;
(d) in our opinion, the aforesaid standalone financial statements comply with the Accounting Standards specified under Section 133 of the Act, read with Rule 7 of the Companies (Accounts) Rules, 2014;
(e) on the basis of the written representations received from the directors as on March 31, 2016 taken on record by the Board of Directors, none of the directors is disqualified as on March 31,2016 from being appointed as a director in terms of Section 164 (2) of the Act;
(f ) with respect to the adequacy of the internal financial controls over financial reporting of the Company and the operating effectiveness of such controls, refer to our separate Report in “Annexure B”;
(g) with respect to the other matters to be included in the Auditor’s Report in accordance with Rule 11 of the Companies (Audit and Auditors) Rules, 2014, in our opinion and to the best of our information and according to the explanations given to us:
(i) The Company has disclosed the impact of pending litigations on its financial position in its financial statements - Refer Note 36 to the financial statements;
(ii) The Company did not have any long-term contracts including derivative contracts for which there were any material foreseeable losses - Refer Note 37 to the financial statements;
(iii) There were’ no amounts which were required to be transferred to the Investor Education and Protection Fund by the Company - Refer Note 38 to the financial statements,
For Khandelwal Jain & CoChartered AccountantsFirm’s Registration No. 105049W
(Narendra Jain)PartnerMembership No. 048725
Place : MumbaiDate : May 12, 2016

72
National Stock Exchange of India Limited
ANNEXURE A TO THE INDEPENDENT AUDITOR’S REPORT OF EVEN DATE ON THE STANDALONE FINANCIAL STATEMENTS OF NATIONAL STOCK EXCHANGE OF INDIA LIMITED
The Annexure referred to in Independent Auditors’ Report to the members of the Company on the standalone
financial statement for the year ended March 31, 2016. We report that:
(i) a) The Company has maintained proper records showing full particulars including quantitative details
and situation of Fixed Assets.
b) The Company has physically verified the fixed assets in accordance with a program of verification
which in our opinion provides for physical verification of all fixed assets at reasonable intervals. We
have been informed that no material discrepancies were noticed on such verification.
c) According to the information and explanations given to us and on the basis of our examination of
the records of the Company, the title deeds of immovable properties are held in the name of the
Company.
(ii) Considering the nature of the business and services rendered by the Company, the provisions of clause 3(ii)
of Companies (Auditor’s Report) Order, 2016 are not applicable to the Company.
(iii) The Company has not granted any loans, secured or unsecured, to companies, firms, Limited Liability
Partnerships or other parties covered in the register maintained under Section 189 of the Act. Therefore, the
provisions of clause 3(iii) of Companies (Auditor’s Report) Order, 2016 are not applicable to the Company.
(iv) In our opinion and according to the information and explanations given to us, the Company has complied
with the provisions of section 185 and 186 of the Act, with respect to the loans and investments made.
(v) The Company has not accepted any deposits during the year from the public within the meaning of the
provisions of Section 73 to 76 or any other relevant provisions of the Companies Act, 2013 and the rules
made thereunder.
(vi) We are informed that the Central Government, has not prescribed the maintenance of cost records under
Section 148(1) of the Companies Act 2013.
(vii) a) According to the information and explanations given to us and on the basis of records examined
by us, the Company is regular in depositing with appropriate authorities undisputed statutory dues
including provident fund, employees’ state insurance, income-tax, sales-tax, service-tax, duty of
custom, duty of excise, value added tax, sales and any other statutory dues, wherever applicable.
According to the records of the Company, there were no undisputed amounts payable in respect of
provident fund, employees’ state insurance, income-tax, sales tax, service-tax, duty of custom, duty of
excise, value added tax, cess and other statutory dues were in arrears as at March 31, 2016 for a period
of more than six months from the date they became payable.
b) According to the information and explanations given to us, the dues of sales-tax, income-tax, duty
of customs, wealth-tax, service tax, securities transaction tax and duty of excise which have not been
deposited on account of disputes and the forum where the dispute is pending are as under:

Twenty-Fourth Annual Report FY 2015-2016
73
Sr. No.
Name of the Statute
Nature of the Dues
Period to which amount relates (Financial year)
Amount (`. in
Crores)
Forum where dispute is Pending
1. Income TaxAct, 1961
Income Tax 1995-1996 0.08 High Court, Mumbai
1999-2000 0.34 High Court, Mumbai
2007-2008 0.002 Income Tax Appellate Tribunal, Mumbai
2. Wealth Tax Act, 1957
Wealth Tax 2000-2001 0.11 Income Tax Appellate Tribunal, Mumbai Wealth Tax Bench
3. Finance (No.2) Act, 2004-ChapterVII
Securities Transaction
Tax
2006-2007 1.57 Income Tax Appellate Tribunal, Mumbai
2007-2008 0.97 Income Tax Appellate Tribunal, Mumbai
2008-2009 0.48 Income Tax Appellate Tribunal, Mumbai
4. Chapter V of Finance Act, 1994
Service Tax 2004-2005 To2008-2009
28.10 Commissioner of Service Tax, Mumbai
2010-2011 0.001 Commissioner of Central Excise (Appeal), Mumbai
2011-2012 0.001 Commissioner of Central Excise (Appeal), Mumbai
2008-2009 To2011-2012
11.09 Commissioner of Service Tax, Mumbai
5 The Competition Act, 2002
Penalty 2007-2008 to2009-2010
55.50 Supreme Court of India
(viii) The Company has not taken any loan from banks, financial institutions or government and the Company has not issued any debentures. Therefore, the provisions of clause 3(viii) of Companies (Auditor’s Report) Order, 2016 are not applicable to the Company.
(ix) The Company has not taken any term loans and has not raised moneys by way of initial public offer or further public offer (including debt instruments) during the year. Therefore, the provisions of clause 3(ix) of Companies (Auditor’s Report) Order, 2016 are not applicable to the Company.
(x) Based upon the audit procedures performed and information and explanations given to us, we report that no fraud by the Company or on the Company by its officers or employees has been noticed or reported during the course of our audit.
(xi) According to the information and explanations given to us and based on our examination of the records of the Company, the Company has paid / provided for managerial remuneration in accordance with the requisite approvals mandated by the provisions of section 197 read with schedule V to the Companies Act.
74
National Stock Exchange of India Limited
(xii) In our opinion and according to the information and explanations given to us, the Company is not a Nidhi Company. Therefore, the provisions of clause 3(xii) of Companies (Auditor’s Report) Order, 2016 are not applicable to the Company.
(xiii) According to the information and explanations given to us and based on our examination of the records of the Company, transactions with the related parties are in compliance with sections 177 and section 188 of the Act, where applicable and details of such transactions have been disclosed in the Financial Statements as required by the applicable accounting standards.
(xiv) According to the information and explanations given to us and based on our examination of the records of the Company, the Company has not made any preferential allotment or .private placement of shares or fully or partly convertible debentures during the year. Therefore, the provisions of clause 3(xiv) of Companies (Auditor's Report) Order, 2016 are not applicable to the Company.
(xv) According to the information and explanations given to us and based on our examination of the records of the Company, the Company has not entered into non-cash transactions with directors or persons connected with him. Therefore, the provisions of clause 3(xv) of Companies (Auditor’s Report) Order, 2016 are not applicable to the Company.
(xvi) According to the information and explanations given to us, the Company is not required to be registered under section 45-IA of the Reserve Bank of India Act, 1934.
For Khandelwal Jain & CoChartered AccountantsFirm’s Registration No. 105049W
(Narendra Jain)PartnerMembership No. 048725
Place : MumbaiDate : May 12, 2016

Twenty-Fourth Annual Report FY 2015-2016
75
ANNEXURE B TO THE INDEPENDENT AUDITOR’S REPORT OF EVEN DATE ON THE STANDALONE FINANCIAL STATEMENTS OF NATIONAL STOCK EXCHANGE OF INDIA LIMITED
Report on the Internal Financial Controls under Clause (i) of Sub-section 3 of Section 143 of the Companies Act, 2013 (“the Act”)
We have audited the internal financial controls over financial reporting of NATIONAL STOCK EXCHANGE OF INDIA LIMITED (“the Company”) as of March 31, 2016 in conjunction with our audit of the standalone financial statements of the Company for the year ended on that date.
Management’s Responsibility for Internal Financial Controls
The Company’s management is responsible for establishing and maintaining internal financial controls based on the internal control over financial reporting criteria established by the Company considering the essential components of internal control stated in the Guidance Note on Audit of Internal Financial Controls Over Financial Reporting issued by the Institute of Chartered Accountants of India. These responsibilities include the design, implementation and maintenance of adequate internal financial controls that were operating effectively for ensuring the orderly and efficient conduct of its business, including adherence to company’s policies, the safeguarding of its assets, the prevention and detection of frauds and errors, the accuracy and completeness of the accounting records, and the timely preparation of reliable financial information, as required under the Companies Act, 2013.
Auditors’ Responsibility
Our responsibility is to express an opinion on the Company’s internal financial controls over financial reporting based on our audit. We conducted our audit in accordance with the Guidance Note on Audit of Internal Financial Controls Over Financial Reporting (the “Guidance Note”) and the Standards on Auditing, issued by ICAI and deemed to be prescribed under section 143(10) of the Companies Act, 2013, to the extent applicable to an audit of internal financial controls, both applicable to an audit of Internal Financial Controls both issued by the Institute of Chartered Accountants of India. Those Standards and the Guidance Note require we comply with ethical requirements and plan and perform the audit to obtain reasonable assurance about whether adequate internal financial controls over financial reporting was established and maintained and if such controls operated effectively in all material respects.
Our audit involves performing procedures to obtain audit evidence about the adequacy of the internal financial controls system over financial reporting and their operating effectiveness. Our audit of internal financial controls over financial reporting included obtaining an understanding of internal financial controls over financial reporting, assessing the risk that a material weakness exists, and testing and evaluating the design and operating effectiveness of internal control based on the assessed risk. The procedures selected depend on the auditor’s judgement, including the assessment of the risks of material misstatement of the financial statements, whether due to fraud or error.
We believe that the audit evidence we have obtained is sufficient and appropriate to provide a basis for our audit opinion on the Company’s internal financial controls system over financial reporting.
Meaning of Internal Financial Controls Over Financial Reporting
A company’s internal financial control over financial responding is a process designed to provide reasonable assurance regarding the reliability of financial reporting and the preparation of financial statements for external purposes in accordance with generally accepted accounting principles. A company’s internal financial control over financial reporting includes those policies and procedures that (1) pertain to the maintenance of records that,
76
National Stock Exchange of India Limited
in reasonable detail, accurately and fairly reflect the transactions and dispositions of the assets of the company; (2) provide reasonable assurance that transactions are recorded as necessary to permit preparation of financial statements in accordance with generally accepted accounting principles, and that receipts and expenditures of the company are being made only in accordance with authorisations of management and directors of the company; and (3) provide reasonable assurance regarding prevention or timely detection of unauthorised acquisition, use, or disposition of the company’s assets that could have a material effect on the financial statements.
Inherent Limitations of Internal Financial Controls Over Financial Reporting
Because of the inherent limitations of internal financial controls over financial reporting, including the possibility of collusion or improper management override of controls, material misstatements due to error or fraud may occur and not be detected. Also, projections of any evaluation of the internal financial controls over financial reporting to future periods are subject to the risk that the internal financial control over financial reporting may become inadequate because of changes in conditions, or that the degree of compliance with the policies or procedures may deteriorate.
Opinion
In our opinion, the Company has, in all material respects, an adequate internal financial controls system over financial reporting and such internal financial controls over financial reporting were operating effectively as at March 31, 2016, based on the internal control over financial reporting criteria established by the Company considering the essential components of internal control stated in the Guidance Note on Audit of Internal Financial Controls Over Financial Reporting issued by the Institute of Chartered Accountants of India.
For Khandelwal Jain & CoChartered AccountantsFirm’s Registration No. 105049W
(Narendra Jain)PartnerMembership No. 048725
Place : MumbaiDate : May 12, 2016

Twenty-Fourth Annual Report FY 2015-2016
77
BALANCE SHEET AS AT MARCH 31, 2016
Particulars Notes As at 31.03.2016(` in Crores)
As at 31.03.2015(` in Crores)
Equity and liabilities
1 Shareholder's funds
a Share Capital 2 45.00 45.00
b Reserves and surplus 3 5,231.74 4,628.53
5,276.74 4,673.53
2 Non-current liabilities
a Deposits (Unsecured) 4 1,027.98 1,038.41
b Deferred tax liabilities (net) 5 17.74 12.46
c Other long-term liabilities 6 17.15 16.69
d Long-term provisions 7 2.67 2.16
1,065.54 1,069.72
3 Current liabilities
a Deposits (Unsecured) 4 23.98 18.19
b Trade payables 6 – -
c Other current liabilities 6 1,207.88 449.76
d Short-term provisions 7 407.99 1,004.38
1,639.85 1,472.33
TOTAL 7,982.13 7,215.58
Assets
1 Non-current assets
a Fixed assets 8
Tangible assets 498.50 487.42
Intangible assets 42.59 31.70
Capital work-in-progress 14.43 5.15
Intangible assets under development 23.11 11.39
578.63 535.66

78
National Stock Exchange of India Limited
Particulars Notes As at 31.03.2016(` in Crores)
As at 31.03.2015(` in Crores)
b Non-current investments 9 3,577.91 2,050.92
c Long-term loans and advances 10 274.91 93.31
d Other non-current assets 11
i) Non-current bank balances 280.86 548.22
ii) Others 20.99 15.30
4,733.30 3,243.41
2 Current assets
a Current investments 12 1,545.20 2,040.79
b Trade receivable 13 224.50 170.57
c Cash and bank balances 14 1,191.62 1,461.87
d Short-term loans and advances 10 72.84 52.71
e Other Current assets 11 214.67 246.23
3,248.83 3,972.17
TOTAL 7,982.13 7,215.58
Summary of significant accounting policies 1
The accompanying notes forms an integral part of the financial statements.
As per our report of even date attached For and on behalf of the Board of Directors
For KHANDELWAL JAI & CO.,Chartered AccountantsFirm's Registration no : 105049W
NARENDRA JAIN ASHOK CHAWLA CHITRA RAMKRISHNAPartner Chairman Managing Director & CEOMembership No.:048725
Place : Mumbai J. RAVICHANDRAN YATRIK VINDate : May 12, 2016 Group President Chief Financial Officer & Company Secretary

Twenty-Fourth Annual Report FY 2015-2016
79
STATEMENT OF PROFIT & LOSS FOR THE YEAR ENDED MARCH 31, 2016
Particulars Notes For the year ended 31.03.2016
(` in Crores)
For the year ended 31.03.2015
(` in Crores)
Income
Revenue from operations 15 1,480.42 1,363.68
Other income 16 564.12 554.44
Total Income 2,044.54 1,918.12
Expenses
Employee benefits expense 17 108.39 91.79
Clearing & Settlement charge 98.54 91.18
Depreciation and amortisation expense 8 103.09 85.79
Other expenses 18 381.88 362.59
Total Expenses 691.90 631.35
Profit before prior-period adjustments, exceptional item, contribution to NSCCL Core SGF & tax
1,352.64 1,286.77
Add/(Less) : Prior-period adjustments 19 (2.58) (0.22)
Profit before exceptional item, contribution to NSCCL Core SGF & tax
1,350.06 1,286.55
Less :Contribution to NSCCL Core Settlement Guarantee Fund (Core SGF)
35 (761.52) (170.00)
Profit before tax 588.54 1,116.55
Less : Tax expenses
Current tax 145.00 330.00
Wealth Tax for earlier year (1.07) –
Deferred tax 5.28 6.87
Total tax expenses 149.21 336.87
Profit after tax 439.33 779.68

80
National Stock Exchange of India Limited
Particulars Notes For the year ended 31.03.2016
(` in Crores)
For the year ended 31.03.2015
(` in Crores)
Earnings per equity share ( FV ` 10 each)
(a) Before exceptional item & contribution to NSCCL Core SGF
- Basic ( ` ) 20 208.29 198.20
- Diluted ( ` ) 20 208.29 198.20
(b) After exceptional item & contribution to NSCCL Core SGF
- Basic ( ` ) 20 97.63 173.26
- Diluted ( ` ) 20 97.63 173.26
Summary of significant accounting policies 1
The accompanying notes forms an integral part of the financial statements.
As per our report of even date attached For and on behalf of the Board of Directors
For KHANDELWAL JAIN & CO.,Chartered AccountantsFirm's Registration no : 105049W
NARENDRA JAIN ASHOK CHAWLA CHITRA RAMKRISHNAPartner Chairman Managing Director & CEOMembership No.:048725
Place : Mumbai J. RAVICHANDRAN YATRIK VINDate : May 12, 2016 Group President Chief Financial Officer & Company Secretary

Twenty-Fourth Annual Report FY 2015-2016
81
CASH FLOW STATEMENT FOR THE YEAR ENDED 31ST MARCH, 2016
2015-16(` in Crores )
2014-15(` in Crores )
A) CASHFLOW FROM OPERATING ACTIVITIES
NET PROFIT BEFORE TAX 588.54 1,116.55
Add : Adjustments for : - Depreciation 103.09 85.79
- Adjustments to the carrying amount of current investments 0.07 0.02
- Bad Debts written off 0.21 –
- (Profit) / Loss on sale /discard of assets (Net) (6.05) 0.25
- Prior-period adjustments (Net) 2.58 0.22
- Wealth Tax (0.07) 0.50
Less : Adjustments for : - Interest income on Current Investments (8.49) (36.24)
- Interest income on Long Term Investment (196.16) (111.27)
- Interest income on Bank deposit (81.36) (76.20)
- Interest income on Certificate of deposits – (7.71)
- (Profit)/Loss on sale/redemption of long term investments (5.86) (14.09)
- (Profit)/Loss on sale/redemption of current investments (89.15) (133.39)
- Amortisation of Premium / Discount on Govt/Debt Securities 1.19 (5.65)
- Dividend received from Subsidiaries, associate companies and others (150.07) (116.15)
OPERATING PROFIT BEFORE WORKING CAPITAL CHANGES 158.47 702.63
Adjustments for :Trade Receivable (54.14) (18.47)
Loans & Advances (18.63) 6.60
Liabilities & Provisions 754.94 (43.35)
Other Current Assets 4.00 88.46
CASH GENERATED FROM OPERATIONS 844.64 735.87
Prior-period adjustments (Net) (2.58) (0.22)
Direct Taxes paid (Net of Refunds) (369.07) (317.18)
NET CASH FROM (USED IN) OPERATING ACTIVITIES - Total (A) 472.99 418.48
B) CASHFLOW FROM INVESTING ACTIVITIES
Purchase of Fixed Assets/Capital work-in-progress (132.13) (147.84)
Sale of Fixed Assets 7.19 0.04
Interest received 307.87 221.02
Dividend received from Subsidiaries, associate companies and others 150.07 116.15
(Increase)/Decrease in Fixed deposit & Certificate of deposits 555.56 1,455.46
(Increase)/Decrease in Investment (938.15) (1,707.93)
NET CASH FROM (USED IN) INVESTING ACTIVITIES - Total (B) (49.59) (63.10)

82
National Stock Exchange of India Limited
2015-16(` in Crores )
2014-15(` in Crores )
C) CASHFLOW FROM FINANCING ACTIVITIES
Proceed of Deposit from Trading members / applicants 30.97 25.95
Refund of deposit from trading members / applicants (36.98) (36.91)
Refund / Proceed of Equipment deposits (Net) 1.37 0.99
Dividend paid (357.75) (306.00)
Dividend distribution tax paid (43.06) (32.89)
NET CASH FROM (USED IN) FINANCING ACTIVITIES - Total (C) (405.45) (348.86)
NET INCREASE / (DECREASE) IN CASH AND CASH EQUIVALENTS (A+B+C) 17.95 6.52
CASH AND CASH EQUIVALENTS : OPENING BALANCE 32.70 26.18
CLOSING CASH AND CASH EQUIVALENTS : CLOSING BALANCE 50.65 32.70
NET INCREASE / (DECREASE) IN CASH AND CASH EQUIVALENT 17.95 6.52
Notes to Cash Flow Statement :1 Cash and cash equivalent represent cash, bank balances and certificate of deposits with original maturity of less than
three months.
2 The above Cash Flow Statement has been prepared under the "Indirect Method" as set out in the Accounting Standard-3 on Cash Flow Statements notified under Rule 7 of the Companies (Accounts) Rules, 2014.
3 Previous year's figures have been regrouped/ reclassified wherever necessary to correspond with the current period classification / disclosure.
As per our report of even date attached For and on behalf of the Board of Directors
For KHANDELWAL JAIN & CO.,Chartered AccountantsFirm's Registration no : 105049W
NARENDRA JAIN ASHOK CHAWLA CHITRA RAMKRISHNAPartner Chairman Managing Director & CEOMembership No.:048725
Place : Mumbai J. RAVICHANDRAN YATRIK VINDate : May 12, 2016 Group President Chief Financial Officer & Company Secretary

Twenty-Fourth Annual Report FY 2015-2016
83
NOTES TO FINANCIAL STATEMENTS FOR THE YEAR ENDED MARCH 31, 2016
1 Summary of significant accounting policies :
a) Basis of preparation
The financial statements of the company have been prepared in accordance with generally accepted accounting principles in India (India GAAP). The company has prepared these financial statements to comply in all material respects with the Accounting Standards specified under Section 133 of the Companies Act, 2013, read with Rule 7 of the Companies (Accounts) Rules, 2014 and relevant provisions of the Companies Act, 2013. The financial statements have been prepared on an accrual basis and under the historical cost convention.
b) Use of estimates
The preparation of financial statements in conformity with India GAAP requires the management to make judgments, estimates and assumptions that affect the reported amounts of revenues, expenses, assets and liabilities and the disclosure of contingent liabilities, at the end of the reporting period. Although these estimates are based on the management's best knowledge of current events and actions, uncertainity about these assumptions and estimates could result in the outcomes requiring a material adjustment to the carrying amounts of assets or liabilities in future periods.
c) Revenue Recognition
(i) Revenue is being recognised as and when there is reasonable certainty of ultimate realisation.
(ii) Provision for Doubtful debts and Bad Debts.
(a) In respect of members who have been declared as defaulter or expelled during the year by the company all amounts remaining to be recovered till the date of being declared defaulter or expelled are written off as bad debts. All subsequent recoveries are accounted for in the year of receipt
(b) Other overdue amounts are provided for as doubtful debts or are written off as bad debts, if the same are considered doubtful / irrecoverable in the opinion of the management.
d) Fixed Assets
Fixed Assets are stated at historical cost less accumulated depreciation. Historical cost is inclusive of freight, duties, taxes, cost of installation, interest upto the date of installation and other incidental expenses incurred towards acquisition and installation of fixed assets.
e) Depreciation
(i) Depreciation on assets is provided on the straight-line method using the rates based on the economic useful life of assets as estimated by the management but not being more than the limits specified in Schedule II of the Companies Act, 2013 as below :

84
National Stock Exchange of India Limited
Assets Management Estimateof Useful
Life in years
Useful life as per the limitsprescribed in Schedule II
of the Companies Act, 2013 in Years
Building 60 Years 60 Years
Furniture and Fixture 5 to 10 Years 10 Years
Office Equipments 4 to 5 Years 5 Years
Electrical Equipments 10 Years 10 Years
Computer Systems Office Automation 3 Years 3 Years
Computer Systems - Others 4 Years 6 Years
Computer Software 4 Years 4 Years
Telecommunication Systems 4 Years 6 Years
Trading & Clearing Systems 4 Years 6 Years
In case of Furniture and Fixtures, Office Equipments, Computer Symstem-others, Telecommunication Systems and Trading & Clearing Systems , the management estimate of the useful life is lower than that prescribed in Schedule II of the Companies Act, 2013. This is based on the consistent practices followed, past experience, internal assessment and duly supported by technical advice.
(ii) Depreciation on assets purchased / disposed off during the year is provided on pro rata basis with reference to the date of additions / deductions.
(iii) Fixed assets whose aggregate cost is ` 5,000 or less are depreciated fully in the year of acquisition.
(iv) Leasehold land is amortised over the period of lease.
(v) Computer Software is amortized over a period of 4 years.
f ) Computer software (i) Cost of development and production software is capitalised,
(ii) Cost towards software development incurred till the time software is put to use is capitalised, and
(iii) Standard packaged software products are written off in the year of purchase.
g) Impairment of Assets
An assets is treated as impaired when the carrying cost of assets exceeds its recoverable value. An impairment loss is charged to the Statement of Profit & Loss in the year in which assets are identified as impaired. The impairment loss recognized in prior accounting period is reversed if there has been change in the estimate of recoverable amount.
h) Investments (i) Long term investments are considered as held till maturity and are valued at cost. Provision is made
for diminution in the value of investment, if any, other than temporary in nature.
(ii) Short term investments are valued at cost or fair value whichever is lower.
(iii) Premium paid/discount received at the time of acquisition of Government / Debt securities is amortised over the residual period of its maturity.
(iv) The cost of investment includes acquisition charges such as brokerage, etc. Front-end discount / incentive earned in respect of direct subscription is adjusted towards the cost of investment. Income on investments is accounted for on accrual basis.

Twenty-Fourth Annual Report FY 2015-2016
85
i) Foreign currency transactions (i) Transactions denominated in foreign currency are recorded at the exchange rate prevailing at the
time of the transaction.
(ii) Monetary items denominated in foreign currency at the year end are translated at the year end rate except for those covered by forward cover contracts which are translated at contracted rates.
(iii) Any income or expense on account of exchange difference between the date of transaction and settlement or translation is recognised in the Statement of Profit and Loss as income or expense. The premium or discount on forward exchange contract are amortised and recognized in the Statement of Profit and Loss over the period of contract.
j) Employee Benefits (i) Provident Fund: The Company has established National Stock Exchange of India Limited Employee
Provident Fund Trust to which both the employee and the employer make monthly contribution equal to 12% of the employee’s basic salary respectively. Company's contribution to the provident fund for all employees, are charged to revenue. In case of any liability arising due to short fall between the return from its investments and the administered interest rate, the same is required to be provided for by the Company.
(ii) Superannuation: Superannuation benefits for employees designated as chief managers and above are covered by group policies with the Life Insurance Corporation of India. Company’s contribution payable for the year is charged to revenue. There are no other obligations other than the annual contribution payable.
(iii) Gratuity: The Company has maintained a Group Gratuity Cum Life Assurance Scheme with the Life Insurance Corporation of India (LIC) towards which it annually contributes a sum determined by LIC. The Company provides for the defined benefit with respect to gratuity liability based on the present value of defined benefit obligation as reduced by the fair value of plan assets as per the actuarial valuation calculation.
(iv) Leave Encashment : Liability on account of Leave encashment is provided based on Acturial Valuation at Balance Sheet date.
(v) Short term employee benefits are charged to revenue in the year in which the related service is rendered.
k) Taxation Tax expense for the year, comprising current tax and deferred tax is included in determining the net
profit for the year.
A provision is made for the current tax based on tax liability computed in accordance with relevant tax rates and tax laws. A provision is made for deferred tax for all timing differences arising between taxable income and accounting income at currently enacted tax rates.
Deferred tax assets are recognised only if there is a reasonable certainty that they will be realised and are reviewed for the appropriateness of their respective carrying values at each balance sheet date.
l) Provisions, Contingent liabilities and Contingent assets A provision is recognised when the Company has a present obligation as a result of past event and it is
probable that an outflow of resources will be required to settle the obligation, in respect of which reliable
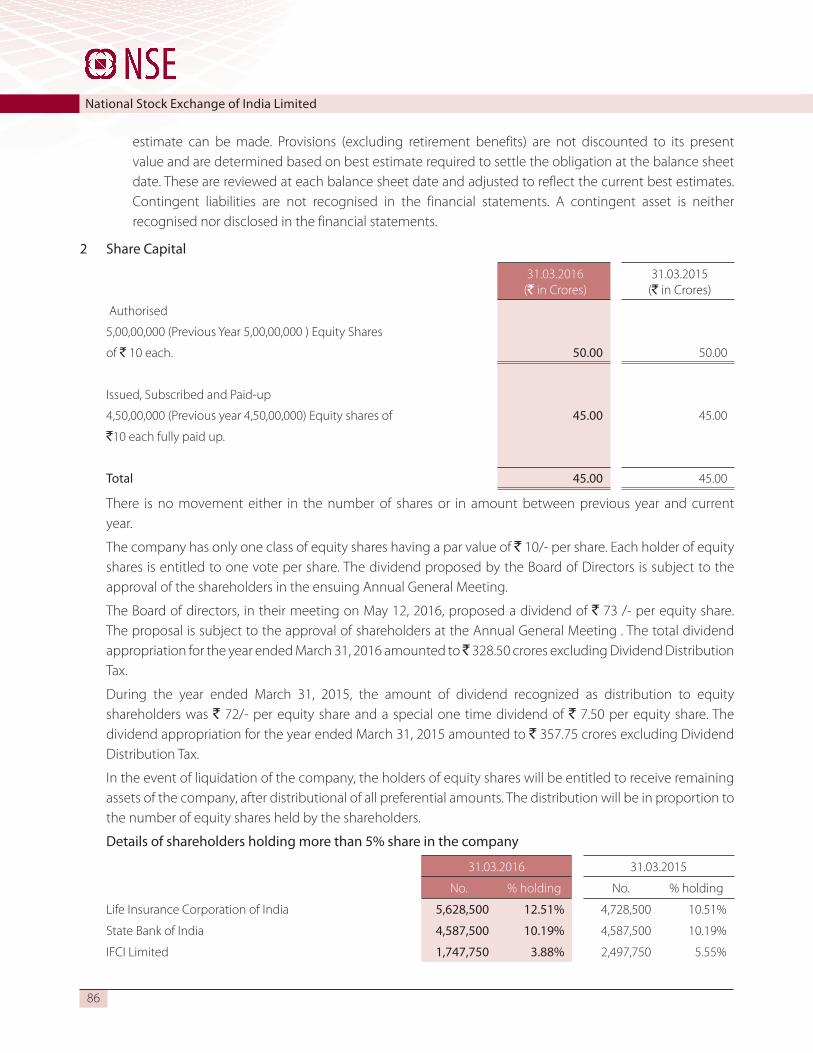
86
National Stock Exchange of India Limited
estimate can be made. Provisions (excluding retirement benefits) are not discounted to its present value and are determined based on best estimate required to settle the obligation at the balance sheet date. These are reviewed at each balance sheet date and adjusted to reflect the current best estimates. Contingent liabilities are not recognised in the financial statements. A contingent asset is neither recognised nor disclosed in the financial statements.
2 Share Capital
31.03.2016 (` in Crores)
31.03.2015 (` in Crores)
Authorised
5,00,00,000 (Previous Year 5,00,00,000 ) Equity Shares
of ` 10 each. 50.00 50.00
Issued, Subscribed and Paid-up
4,50,00,000 (Previous year 4,50,00,000) Equity shares of 45.00 45.00
`10 each fully paid up.
Total 45.00 45.00
There is no movement either in the number of shares or in amount between previous year and current year.
The company has only one class of equity shares having a par value of ` 10/- per share. Each holder of equity shares is entitled to one vote per share. The dividend proposed by the Board of Directors is subject to the approval of the shareholders in the ensuing Annual General Meeting.
The Board of directors, in their meeting on May 12, 2016, proposed a dividend of ` 73 /- per equity share. The proposal is subject to the approval of shareholders at the Annual General Meeting . The total dividend appropriation for the year ended March 31, 2016 amounted to ̀ 328.50 crores excluding Dividend Distribution Tax.
During the year ended March 31, 2015, the amount of dividend recognized as distribution to equity shareholders was ` 72/- per equity share and a special one time dividend of ` 7.50 per equity share. The dividend appropriation for the year ended March 31, 2015 amounted to ` 357.75 crores excluding Dividend Distribution Tax.
In the event of liquidation of the company, the holders of equity shares will be entitled to receive remaining assets of the company, after distributional of all preferential amounts. The distribution will be in proportion to the number of equity shares held by the shareholders.
Details of shareholders holding more than 5% share in the company
31.03.2016 31.03.2015
No. % holding No. % holding
Life Insurance Corporation of India 5,628,500 12.51% 4,728,500 10.51%
State Bank of India 4,587,500 10.19% 4,587,500 10.19%
IFCI Limited 1,747,750 3.88% 2,497,750 5.55%

Twenty-Fourth Annual Report FY 2015-2016
87
3 Reserve and surplus
31.03.2016(` in Crores)
31.03.2015(` in Crores)
Share premium
As per last balance sheet 40.00 40.00
Investor compensation reserve
As per last balance sheet 10.00 10.00
Staff welfare reserve
As per last balance sheet 1.50 1.50
General reserve 3,690.00 3,690.00
Surplus/(deficit) in the statement of profit and loss
As per last balance sheet 887.03 567.72
Less : Adjustment of Depreciation due to revised Companies Act, 2013
– 9.99
Add : Deffered Tax impact on depreciation adjustment – 3.40
Add : Reversal of provisional appropriation towards NSCCL SGF (Refer Note 7 and 35)
527.19 –
Add : Net profit after tax transferred from the Statement of Profit & Loss
439.33 779.68
Amount available for appropriation 1,853.55 1,340.81
Less : Appropriations
Provisional transfer to NSCCL SGF in respect of current year (net of contribution to NSCCL Core
SGF amounting to ` Nil (Previous Year ` 170 crores) (Refer Note 35)
– 52.97
Proposed dividend 328.50 357.75
Tax on proposed dividend 34.81 1,490.24 43.06 887.03
Total reserves and surplus 5,231.74 4,628.53
4 Deposits (Unsecured)
Non-current Current
31.03.2016(` in Crores)
31.03.2015(` in Crores)
31.03.2016(` in Crores)
31.03.2015(` in Crores)
Deposits from trading members 1,006.67 1,019.98 23.12 17.08
Deposits from applicants for membership – – 0.59 0.84
Deposits from Mutual Fund Distributors 2.19 0.67 – –
Deposits towards equipments 19.12 17.76 0.27 0.27
Total 1,027.98 1,038.41 23.98 18.19

88
National Stock Exchange of India Limited
5 Deferred Tax liabilities (net)
31.03.2016(` in Crores)
31.03.2015(` in Crores)
Deferred Tax Liabilities
Related to depreciation and other expenditure 30.15 22.73
Related to other items 0.13 0.11
Total (A) 30.28 22.84
Less : Deferred Tax Assets
Related to disallowance u/s 43B 10.69 8.92
Related to other items 1.85 1.46
Total (B) 12.54 10.38
Net Deferred Tax liabilities (A-B) 17.74 12.46
6 Other Liabilities
Long - term Short - term
31.03.2016(` in Crores)
31.03.2015(` in Crores)
31.03.2016(` in Crores)
31.03.2015(` in Crores)
Trade payables – – – –
– – – –
Others
Deposit - premises 4.18 4.15 – 27.22
Deposit - STT 5.39 5.39 – –
Liability for expenses – – 86.50 75.72
Creditors for Capital expenditure – – 20.72 13.77
Subsidiary Companies – – 12.13 1.94
Contribution payable to NSCCL Core SGF (Refer note 35)
– – 690.52 –
Security deposit - Listing agreement – – 46.49 36.87
Unpaid matured deposits – – 0.07 0.07
Other deposits – – 1.30 1.38
Income received in advance – – 32.62 32.52
Securities Transaction Tax payable – – 166.35 126.87
Statutory dues payable – – 31.38 24.44
Defaulters Fund pending claims – – 67.89 63.98
Deposits of defaulters members - SEBI – – 0.18 0.18
Other liabilities 7.58 7.15 51.73 44.80
17.15 16.69 1,207.88 449.76
Total 17.15 16.69 1,207.88 449.76

Twenty-Fourth Annual Report FY 2015-2016
89
7 Provision
Long - term Short - term
31.03.2016(` in Crores)
31.03.2015(` in Crores)
31.03.2016(` in Crores)
31.03.2015(` in Crores)
Provision for employee benefits
Medical benefits – – 1.82 1.39
Provision for Leave Travel allowance – – 4.22 3.33
Provision for gratuity 2.67 2.16 2.34 2.05
Provision for Leave encashment – – 12.29 11.12
2.67 2.16 20.67 17.89
Other Provisions
Wealth Tax (Net of Advances) – – 0.29 1.81
Income Tax (Net of Advances) – – 23.72 56.68
Provisional appropriation towards NSCCL SGF (Refer note 35)
– –
As per last balance sheet 527.19 474.22
Add : Provisional appropriation towards NSCCL SGF (net of contribution to NSCCL Core SGF amounting to ` NilPrevious Year - ` 170 crores)
– 52.97
Less : Reversal of Provisional appropriation towards NSCCL SGF (Refer note 3 and 35)
– – 527.19 – – 527.19
Proposed dividend – – 328.50 357.75
Corporate dividend tax – – 34.81 43.06
– – 387.32 986.49
Total 2.67 2.16 407.99 1,004.38
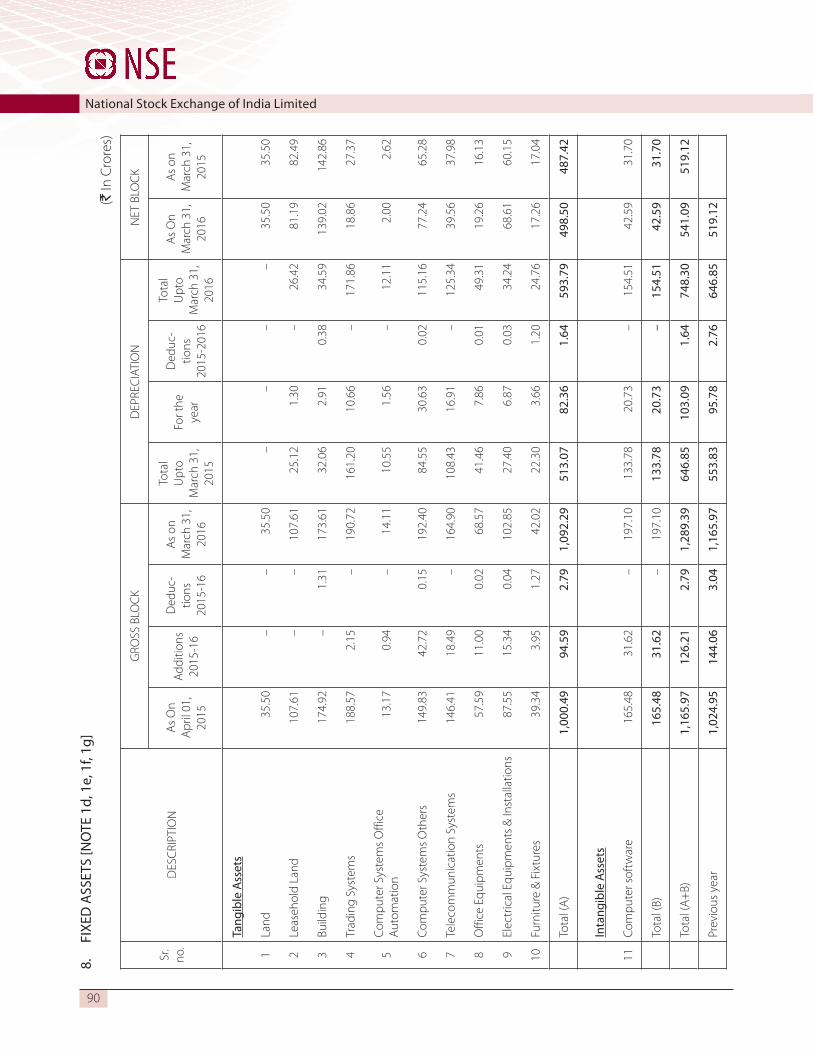
90
National Stock Exchange of India Limited8.
FI
XED
ASS
ETS
[NO
TE 1
d, 1
e, 1
f, 1g
](`
In C
rore
s)
Sr.
no.
DES
CRI
PTIO
N
GRO
SS B
LOC
KD
EPRE
CIA
TIO
NN
ET B
LOC
K
As
On
Apr
il 01
, 20
15
Add
ition
s 20
15-1
6
Ded
uc-
tions
20
15-1
6
As
on
Mar
ch 3
1,
2016
Tota
l U
pto
Mar
ch 3
1,
2015
For t
he
year
Ded
uc-
tions
20
15-2
016
Tota
l U
pto
Mar
ch 3
1,
2016
As
On
Mar
ch 3
1,
2016
As
on
Mar
ch 3
1,
2015
Tang
ible
Ass
ets
1La
nd 3
5.50
– –
35.
50 –
– –
– 3
5.50
35.
50
2Le
aseh
old
Land
107
.61
– –
107
.61
25.
12 1
.30
– 2
6.42
81.
19 8
2.49
3Bu
ildin
g 1
74.9
2 –
1.3
1 1
73.6
1 3
2.06
2.9
1 0
.38
34.
59 1
39.0
2 1
42.8
6
4Tr
adin
g Sy
stem
s 1
88.5
7 2
.15
– 1
90.7
2 1
61.2
0 1
0.66
– 1
71.8
6 1
8.86
27.
37
5Co
mpu
ter S
yste
ms
Offi
ce
Aut
omat
ion
13.
17 0
.94
– 1
4.11
10.
55 1
.56
– 1
2.11
2.0
0 2
.62
6Co
mpu
ter S
yste
ms
Oth
ers
149
.83
42.
72 0
.15
192
.40
84.
55 3
0.63
0.0
2 1
15.1
6 7
7.24
65.
28
7Te
leco
mm
unic
atio
n Sy
stem
s 1
46.4
1 1
8.49
– 1
64.9
0 1
08.4
3 1
6.91
– 1
25.3
4 3
9.56
37.
98
8O
ffice
Equ
ipm
ents
57.
59 1
1.00
0.0
2 6
8.57
41.
46 7
.86
0.0
1 4
9.31
19.
26 1
6.13
9El
ectr
ical
Equ
ipm
ents
& In
stal
latio
ns 8
7.55
15.
34 0
.04
102
.85
27.
40 6
.87
0.0
3 3
4.24
68.
61 6
0.15
10Fu
rnitu
re &
Fix
ture
s 3
9.34
3.9
5 1
.27
42.
02 2
2.30
3.6
6 1
.20
24.
76 1
7.26
17.
04
Tota
l (A
) 1
,000
.49
94.
59 2
.79
1,0
92.2
9 5
13.0
7 8
2.36
1.6
4 5
93.7
9 4
98.5
0 4
87.4
2
Inta
ngib
le A
sset
s
11Co
mpu
ter s
oftw
are
165
.48
31.
62 –
197
.10
133
.78
20.
73 –
154
.51
42.
59 3
1.70
Tota
l (B)
165
.48
31.
62 –
197
.10
133
.78
20.
73–
154
.51
42.
59 3
1.70
Tota
l (A
+B)
1,1
65.9
7 1
26.2
1 2
.79
1,2
89.3
9 6
46.8
5 1
03.0
9 1
.64
748
.30
541
.09
519
.12
Prev
ious
yea
r 1
,024
.95
144
.06
3.0
4 1
,165
.97
553
.83
95.
78 2
.76
646
.85
519
.12

Twenty-Fourth Annual Report FY 2015-2016
91
9 N
ON
CU
RREN
T IN
VEST
MEN
TS (V
ALU
ED A
T CO
ST U
NLE
SS S
TATE
D O
THER
WIS
E)
Mat
urity
Dat
e N
umbe
r of
Units
Fac
e Va
lue
per
Unit
Fac
e va
lue
(` in
Cro
res)
As a
t 31.
3.20
16 (`
in C
rore
s) N
umbe
r of
Units
As a
t 31.
3.20
15 (`
in C
rore
s)
(`)
IIN
VEST
MEN
TS IN
EQ
UITY
SHA
RES
A)Q
UOTE
D EQ
UITY
SHA
RES
(i)IN
OTH
ER C
OM
PANI
ES
MCX
Lim
ited
(Cur
rent
Year
Cos
t `40
,000
/-, P
revi
ous Y
ear
`40,
000/
-)
5,0
00 1
0 0
.01
0.00
5,0
000.
00
Sub
-Tot
al (i
)0.
000.
00
B)UN
QUO
TED
EQUI
TY S
HARE
S
(ii)
IN S
UBSI
DIAR
Y CO
MPA
NIES
NAT
ION
AL S
ECUR
ITIE
S CL
EARI
NG
CORP
ORA
TIO
N LT
D. 4
5,00
0,00
0 1
0 4
5.00
5.6
4 4
5,00
0,00
0 5
.64
NSE
STR
ATEG
IC IN
VEST
MEN
T CO
PORA
TIO
N
LTD
413
,021
,703
10
413
.02
413
.13
412
,608
,681
412
.61
Sub
-Tot
al (i
i) 4
18.7
8 4
18.2
5
(iii)
IN A
SSO
CIAT
E CO
MPA
NIES
NAT
ION
AL S
ECUR
ITIE
S D
EPO
SITO
RY LT
D. 1
0,01
8,00
0 1
0 1
0.02
61.
49 1
0,01
8,00
0 6
1.49
BFSI
SEC
TOR
SKIL
L CO
UNCI
L O
F IN
DIA
(S
ectio
n 8
com
pany
) 1
0,00
0,00
0 1
1.0
0 1
.00
10,
000,
000
1.0
0
Sub
-Tot
al (i
ii) 6
2.49
62.
49
(iv)
IN O
THER
CO
MPA
NIES
NAT
ION
AL C
OM
MO
DIT
Y &
DER
IVAT
IVE
EXCH
ANGE
LTD.
7,6
01,3
77 1
0 5
9.55
59.
54 7
,601
,377
59.
54
Sub
-Tot
al (i
v) 5
9.54
59.
54
Tota
l ( I )
540
.80
540
.28

92
National Stock Exchange of India LimitedM
atur
ity D
ate
Num
ber o
f Un
its F
ace
Valu
e pe
r Un
it F
ace
valu
e (`
in C
rore
s) A
s at 3
1.3.
2016
(` in
Cro
res)
Num
ber o
f Un
its A
s at 3
1.3.
2015
(` in
Cro
res)
(`)
IIIN
VEST
MEN
TS IN
PRE
FERE
NCE
SHAR
ES
UNQ
UOTE
D PR
EFER
ENCE
SHA
RES
IN S
UBSI
DIAR
Y CO
MPA
NY
6% N
ON
-CUM
ULAT
IVE
COM
PULS
ORI
LY
CON
VERT
IBLE
PRE
FERE
NCE
SH
ARES
(N
CCCP
S) O
F N
SE S
TRAT
EGIC
INVE
STM
ENT
COPO
RATI
ON
LTD
27-M
ar-2
2 2
2,50
0,00
0 1
0 2
2.50
22.
50 2
2,47
7,50
0 2
2.48
1-Ja
n-23
57,
564,
000
10
57.
56 5
7.56
57,
506,
436
57.
51
1-Se
p-22
54,
120,
000
10
54.
12 5
4.12
54,
065,
880
54.
07
19-F
eb-2
3 2
11,5
47,7
03 1
0 2
11.5
5 2
11.5
5 2
11,3
36,1
55 2
11.3
4
21-Ju
l-22
9,0
20,0
00 1
0 9
.02
9.0
2 9
,010
,980
9.0
1
27-Ju
n-22
31,
570,
000
10
31.
57 3
1.57
31,
538,
430
31.
54
30-S
ep-2
2 2
6,65
0,00
0 1
0 2
6.65
26.
65 2
6,62
3,35
0 2
6.62
Tota
l ( II
) 4
12.9
7 4
12.5
6
III
EXCH
ANGE
TRA
DED
FUND
S
QUO
TED
GOLD
MAN
SAC
HS
MF
BAN
K BE
ES 4
98,0
00 1
0 0
.50
86.
78 1
60,0
00 3
0.32
GOLD
MAN
SAC
HS
MUT
UAL
FUN
D -
CPSE
ET
F - G
ROW
TH O
PTIO
N 4
0,52
0,00
0 1
0 4
0.52
88.
08 6
,500
,000
16.
01
GOLD
MAN
SAC
HS
NIF
TY E
TF -
NIF
TY B
EES
1,0
26,0
00 1
0 1
.03
83.
52 2
80,0
00 2
4.38
ICIC
I PRU
DEN
TIAL
NIF
TY E
TF 3
,390
,000
10
3.3
9 2
6.64
– –
KOTA
K M
AHIN
DRA
MF
- KO
TAK
BAN
KIN
G ET
F 1
,440
,000
10
1.4
4 2
2.85
– –
R SH
ARES
REL
IAN
CE M
F BA
NKI
NG
ETF
74,
500
10
0.0
7 1
2.48
– –
SBI-E
TF N
IFTY
50
4,8
50,0
00 1
0 4
.85
36.
27 –
–
Tota
l ( II
I ) 3
56.6
3 7
0.71

Twenty-Fourth Annual Report FY 2015-2016
93
Mat
urity
Dat
e N
umbe
r of
Units
Fac
e Va
lue
per
Unit
Fac
e va
lue
(` in
Cro
res)
As a
t 31.
3.20
16 (`
in C
rore
s) N
umbe
r of
Units
As a
t 31.
3.20
15 (`
in C
rore
s)
(`)
IVQ
UOTE
D BO
NDS
(i)TA
X FR
EE B
OND
S
6.86
% IN
DIA
INFR
ASTR
UCTU
RE F
INAN
CE
COM
PAN
Y LI
MIT
ED -
26 M
AR 2
023
26-M
ar-2
3 2
50,0
00 1
,000
25.
00 2
4.49
– –
7% H
UDCO
TAXF
REE
BON
D O
CT25
8-O
ct-2
5 1
00 1
,000
,100
10.
00 1
0.00
– –
7.07
% H
UDCO
TAXF
REE
BON
DS
01O
CT25
1-O
ct-2
5 1
00 1
,000
,000
10.
00 1
0.00
– –
7.15
% N
TPC
LIM
ITED
- 21
AUG
202
521
-Aug
-25
150
1,0
00,0
00 1
5.00
15.
02 –
–
7.18
% IN
DIA
N R
AILW
AY F
INAN
CE
CORP
ORA
TIO
N L
IMIT
ED19
-Feb
-23
150
,000
1,0
00 1
5.00
15.
00 1
50,0
00 1
5.00
7.19
% H
OUS
ING
& UR
BAN
DEV
ELO
PMEN
T CO
RPO
RATI
ON
LIM
ITED
28
MAR
CH 2
028
28-M
ar-2
8 1
00 1
,000
,000
10.
00 1
0.09
– –
7.19
% IN
DIA
INFR
ASTR
UCTU
RE F
INAN
CE
COM
PAN
Y LI
MIT
ED -
22 JA
N 2
023
22-Ja
n-23
100
,000
1,0
45 1
0.45
10.
02 –
–
7.19
% IN
DIA
N R
AILW
AY F
INAN
CE
CORP
ORA
TIO
N LT
D -
31 JU
L 20
2531
-Jul-2
5 4
50 1
,000
,000
45.
00 4
5.11
– –
7.28
% N
ATIO
NAL
HIG
HW
AYS
AUTH
ORI
TY
OF
IND
IA S
EP 2
030
18-S
ep-3
0 9
50 1
,000
,000
95.
00 9
5.12
– –
7.34
% IN
DIA
N R
AILW
AY F
INAN
CE
CORP
ORA
TIO
N LT
D 1
9-FE
B-20
2819
-Feb
-28
100
1,0
00,0
00 1
0.00
10.
17 –
–
7.35
% N
ABAR
D 2
3032
031
23-M
ar-3
1 2
50 1
,000
,000
25.
00 2
5.90
– –
7.36
% IN
DIA
INFR
ASTR
UCTU
RE F
INAN
CE
COM
PAN
Y LI
MIT
ED -
22 JA
N 2
028
22-Ja
n-28
100
1,0
00,0
00 1
0.00
10.
20 –
–
7.51
% H
UDCO
TAXF
REE
BON
DS
- 16F
EB20
2816
-Feb
-28
250
1,0
00,0
00 2
5.00
25.
79 –
–
8.00
% IN
DIA
N R
AILW
AY F
INAN
CE
CORP
ORA
TIO
N L
IMIT
ED23
-Feb
-22
32,
626
1,0
00 3
.26
3.2
6 3
2,62
6 3
.26
8.20
% N
ATIO
NAL
HIG
HW
AYS
AUTH
ORI
TY
OF
IND
IA25
-Jan-
22 3
7,08
6 1
,000
3.7
1 3
.71
37,
086
3.7
1

94
National Stock Exchange of India LimitedM
atur
ity D
ate
Num
ber o
f Un
its F
ace
Valu
e pe
r Un
it F
ace
valu
e (`
in C
rore
s) A
s at 3
1.3.
2016
(` in
Cro
res)
Num
ber o
f Un
its A
s at 3
1.3.
2015
(` in
Cro
res)
(`)
8.20
% P
OW
ER F
INAN
ACE
CORP
ORA
TIO
N
LIM
ITED
1-Fe
b-22
92,
718
1,0
00 9
.27
9.3
1 9
2,71
8 9
.32
8.35
% IN
DIA
N R
AILW
AY F
INAN
CE
CORP
ORA
TIO
N LT
D TA
X FR
EE 2
1-N
OV-
2023
21-N
ov-2
3 1
50 1
,000
,000
15.
00 1
5.00
150
15.
00
8.40
% IR
FC-T
AXFR
EE-1
8FEB
-202
918
-Feb
-29
550
181
,818
10.
00 1
1.05
––
8.46
% IN
DIA
INFR
ASTR
UCTU
RE F
INAN
CE
COM
PAN
Y LI
MIT
ED -
30 A
UG-2
028
30-A
ug-2
8 2
00 1
,000
,000
20.
00 2
2.07
––
8.46
% N
ATIO
NAL
HO
USIN
G BA
NK
- SER
IES
V - 2
028
30-A
ug-2
8 2
50 1
,000
,000
25.
00 2
6.87
50
5.0
0
8.46
% R
URAL
ELE
CTRI
FICA
TIO
N
CORP
ORA
TIO
N L
IMIT
ED -
24 S
EP-2
028
24-S
ep-2
8 2
50,0
00 1
,000
25.
00 2
7.29
– –
8.46
% R
URAL
ELE
CTRI
FICA
TIO
N
CORP
ORA
TIO
N L
IMIT
ED -
NO
N
CON
VERT
IBLE
BO
ND
S - 2
028
29-A
ug-2
8 5
0 1
,000
,000
5.0
0 5
.00
50
5.0
0
8.48
% IN
DIA
INFR
ASTR
UCTU
RE F
INAN
CE
COM
PAN
Y LI
MIT
ED 0
5 SE
P 20
285-
Sep-
28 1
50 1
,000
,000
15.
00 1
6.45
– –
Sub
-Tot
al (i
) 4
46.9
4 5
6.30
(ii)
TAXA
BLE
BOND
S
8.80
% P
OW
ER G
RID
CO
RPO
RATI
ON
OF
IND
IA L
IMIT
ED -
13 M
AR 2
023
13-M
ar-2
3 5
00 1
,000
,000
50.
00 5
0.33
400
40.
25
7.87
% E
XPO
RT IM
PORT
BAN
K O
F IN
DIA
- 16
M
AY 2
016
16-M
ay-1
6 –
1,0
00,0
00 2
5.00
– 2
50 2
4.85
8.82
% R
URAL
ELE
CTRI
FICA
TIO
N
CORP
ORA
TIO
N L
IMIT
ED -
SR 1
14 -
12 A
PR
2023
12-A
pr-2
3 1
50 1
,000
,000
15.
00 1
5.13
150
15.
14
11.2
5% P
OW
ER F
INAN
CE C
ORP
ORA
TIO
N
LIM
ITED
28-N
ov-1
8 1
00 1
,000
,000
10.
00 1
0.46
100
10.
63
8.33
% U
NIO
N B
ANK
19 M
AY 2
016
19-M
ay-1
6 –
1,0
00,0
00 1
0.00
– 1
00 1
0.00

Twenty-Fourth Annual Report FY 2015-2016
95
Mat
urity
Dat
e N
umbe
r of
Units
Fac
e Va
lue
per
Unit
Fac
e va
lue
(` in
Cro
res)
As a
t 31.
3.20
16 (`
in C
rore
s) N
umbe
r of
Units
As a
t 31.
3.20
15 (`
in C
rore
s)
(`)
8.95
% N
ABAR
D T
XB 0
1 JA
N 2
018
1-Ja
n-18
2,5
00 2
0,00
0 5
.00
4.3
7 2
,500
4.0
1
8.78
% P
OW
ER F
INAN
CE C
ORP
ORA
TIO
N
LIM
ITED
- 11
DEC
201
611
-Dec
-16
– 1
,000
,000
0.5
0 –
5 0
.50
8.39
% P
OW
ER F
INAN
CE C
ORP
ORA
TIO
N
LIM
ITED
- 19
APR
IL 2
025
19-A
pr-2
5 2
50 1
,000
,000
25.
00 2
4.79
– –
8.40
% P
OW
ER G
RID
CO
RPO
RATI
ON
OF
IND
IA L
IMIT
ED -
27 M
AY 2
024
27-M
ay-2
4 5
0 1
,000
,000
5.0
0 4
.95
– –
Sub
-Tot
al (i
i) 1
10.0
3 1
05.3
8
UNQ
UOTE
D
(iii)
TAXA
BLE
BOND
S
6 %
NAT
ION
AL H
IGH
WAY
S AU
THO
RITY
OF
IND
IA -
TXB
- 201
731
-Mar
-17
– 1
0,00
0 0
.50
– 5
00 0
.50
Sub
-Tot
al (i
ii)–
0.5
0
Tota
l ( IV
) 5
56.9
7 1
62.1
8
VQ
UOTE
D
DEBE
NTUR
ES
0% H
DFC
- D
EB -
16-JA
N-2
017
16-Ja
n-17
– 1
,000
,000
25.
00 –
250
33.
67
0% IN
FRAS
TRUC
TURE
LEA
SIN
G &
FIN
ANCI
AL S
ERVI
CES
LIM
ITED
- 10
APR
201
810
-Apr
-28
15,
000
10,
000
15.
0016
.24
––
10.0
5% H
DB
FIN
ANCI
AL S
ERVI
CES
LIM
ITED
- N
CD 1
0-FE
B-20
1710
-Feb
-17
– 1
,000
,000
5.0
0 –
50
5.0
2
10.1
7% H
DB
FIN
ANCI
AL S
ERVI
CES
LIM
ITED
- 11
NO
V 20
1611
-Nov
-16
– 1
,000
,000
35.
00 –
350
35.
20

96
National Stock Exchange of India LimitedM
atur
ity D
ate
Num
ber o
f Un
its F
ace
Valu
e pe
r Un
it F
ace
valu
e (`
in C
rore
s) A
s at 3
1.3.
2016
(` in
Cro
res)
Num
ber o
f Un
its A
s at 3
1.3.
2015
(` in
Cro
res)
(`)
10.2
5% M
AHIN
DRA
& M
AHIN
DRA
FI
NAN
CIAL
SER
VICE
S LI
MIT
ED-D
EB-0
8-O
CT-2
018
8-O
ct-1
8 5
0 1
,000
,000
5.0
0 5
.17
– –
10.6
0% L
IC H
OUS
ING
FIN
ANCE
- D
EB -
06-
SEPT
-201
66-
Sep-
16 –
1,0
00,0
00 7
5.00
– 7
50 7
5.93
8.54
% H
DB
FIN
ANCI
AL S
ERVI
CES
LIM
ITED
- 03
JUN
201
63-
Jun-
16 –
1,0
00,0
00 2
5.00
– 2
50 2
4.76
8.58
% IN
FRAS
TRUC
TURE
LEA
SIN
G &
FIN
ANCI
AL S
ERVI
CES
LIM
ITED
- 01
DEC
201
81-
Dec
-18
250
,000
1,0
00 2
5.00
25.
00 –
–
8.70
% IL
&FS
FIN
ANCI
AL S
ERVI
CES
LIM
ITED
-N
CD--3
0SEP
2018
30-S
ep-1
8 2
50,0
00 1
,000
25.
00 2
5.00
– –
8.70
% K
OTA
K M
AHIN
DRA
INVE
STM
ENT
LTD
11
AUG
201
711
-Aug
-17
250
1,0
00,0
00 2
5.00
25.
00 –
–
8.71
% C
AN F
IN H
OM
ES LT
D -
07 A
UG 2
018
7-Au
g-18
350
1,0
00,0
00 3
5.00
35.
00 –
–
8.71
% H
DB
FIN
ANCI
AL S
ERVI
CES
LIM
ITED
- 20
OCT
201
820
-Oct
-18
100
1,0
00,0
00 1
0.00
10.
03 –
–
8.74
% IN
FRAS
TRUC
TURE
LEA
SIN
G &
FIN
ANCI
AL S
ERVI
CES
LIM
ITED
- 10
AUG
20
18
10-A
ug-1
8 1
00,0
00 1
,000
10.
00 1
0.02
– –
8.74
% IN
FRAS
TRUC
TURE
LEA
SIN
G &
FIN
ANCI
AL S
ERVI
CES
LIM
ITED
- 10
AUG
20
18
10-A
ug-1
8 2
50,0
00 1
,000
25.
00 2
5.00
––
8.75
% M
AHIN
DRA
& M
AHIN
DRA
FIN
ANCI
AL
SERV
ICES
LIM
ITED
- 31
JUL
2017
31-Ju
l-17
150
1,0
00,0
00 1
5.00
15.
00 –
–
8.75
% M
AHIN
DRA
& M
AHIN
DRA
FIN
ANCI
AL
SERV
ICES
LIM
ITED
- 31
JUL
2017
31-Ju
l-17
250
1,0
00,0
00 2
5.00
25.
01–
–
8.75
% M
AHIN
DRA
& M
AHIN
DRA
FIN
ANCI
AL
SERV
ICES
LIM
ITED
- AU
G 20
174-
Aug-
17 5
0 1
,000
,000
5.0
0 5
.00
– –
8.77
% IC
ICI H
OM
E FI
NAN
CE C
O. L
TD.-
DEB
-211
2201
821
-Dec
-18
500
500
,000
25.
00 2
5.00
– –

Twenty-Fourth Annual Report FY 2015-2016
97
Mat
urity
Dat
e N
umbe
r of
Units
Fac
e Va
lue
per
Unit
Fac
e va
lue
(` in
Cro
res)
As a
t 31.
3.20
16 (`
in C
rore
s) N
umbe
r of
Units
As a
t 31.
3.20
15 (`
in C
rore
s)
(`)
8.80
% C
AN F
IN H
OM
ES LT
D -
DEB
- 02
JUL
2018
2-Ju
l-18
100
1,0
00,0
00 1
0.00
10.
00 –
–
8.80
% K
OTA
K M
AHIN
DRA
PRI
ME
LIM
ITED
- 15
MAR
201
815
-Mar
-18
150
1,0
00,0
00 1
5.00
15.
00 –
–
8.80
% K
OTA
K M
AHIN
DRA
PRI
ME
LIM
ITED
10
JUL
2018
10-Ju
l-18
250
1,0
00,0
00 2
5.00
24.
99 –
–
8.80
% K
OTA
K M
AHIN
DRA
PRI
ME
LIM
ITED
10
JUL
2018
10-Ju
l-18
150
1,0
00,0
00 1
5.00
15.
00 –
–
8.80
75%
MAH
IND
RA &
MAH
IND
RA
FIN
ANCI
AL S
ERVI
CES
LIM
ITED
- 15
MAY
20
17
15-M
ay-1
7 2
50 1
,000
,000
25.
00 2
4.95
– –
8.80
% K
OTA
K M
AHIN
DRA
PRI
ME
LIM
ITED
- 26
JUN
201
826
-Jun-
18 2
00 1
,000
,000
20.
00 1
9.99
– –
8.90
% IL
&FS
FIN
ANCI
AL S
ERVI
CES
LIM
ITED
-D
EB-2
1032
019
21-M
ar-1
9 2
50,0
00 1
,000
25.
00 2
5.00
– –
8.90
% K
OTA
K M
AHIN
DRA
INVE
STM
ENT
LTD
N
CD -
11 S
EP 2
017
11-S
ep-1
7 2
50 1
,000
,000
25.
00 2
5.00
– –
9.00
% R
ELIA
NCE
CAP
ITAL
LIM
ITED
28
JULY
20
1728
-Jul-1
7 2
50 1
,000
,000
25.
00 2
5.00
– –
9.05
% F
ULLE
RTO
N IN
DIA
CRE
DIT
CO
MAP
NY
LIM
ITED
- 30
APR
IL 2
018
- SER
IES
33-A
30-A
pr-1
8 5
0 1
,000
,000
5.0
0 5
.00
– –
9.65
% IL
&FS
FIN
ANCI
AL S
ERVI
CES
LIM
ITED
- D
EB -
18 S
EP 2
017
18-S
ep-1
7 2
50 1
,000
,000
25.
00 2
5.00
250
25.
00
9.71
% TA
TA S
ON
S LI
MIT
ED -
13 D
EC 2
016
13-D
ec-1
6 –
1,0
00,0
00 2
5.00
– 2
50 2
5.09
Tota
l ( V
) 4
61.3
9 2
24.6
6

98
National Stock Exchange of India LimitedM
atur
ity D
ate
Num
ber o
f Un
its F
ace
Valu
e pe
r Un
it F
ace
valu
e (`
in C
rore
s) A
s at 3
1.3.
2016
(` in
Cro
res)
Num
ber o
f Un
its A
s at 3
1.3.
2015
(` in
Cro
res)
(`)
VIQ
UOTE
D
GOVE
RNM
ENT
SECU
RITI
ES
9.23
% G
OVE
RNM
ENT
OF
IND
IA -
23 D
EC
2043
23-D
ec-4
3 1
60,0
00 1
0,00
0 1
60.0
0 1
86.0
2 1
60,0
00 1
86.9
6
8.60
% G
OVE
RNM
ENT
OF
IND
IA -
02 JU
N
2028
2-Ju
n-28
220
,000
10,
000
220
.00
233
.97
170
,000
182
.12
9.20
% G
OVE
RNM
ENT
OF
IND
IA -
30 S
EP
2030
30-S
ep-3
0 1
30,0
00 1
0,00
0 1
30.0
0 1
45.3
2 1
30,0
00 1
46.3
8
8.40
% G
OVE
RNM
ENT
OF
IND
IA -
28 JU
L 20
2428
-Jul-2
4 8
0,00
0 1
0,00
0 8
0.00
83.
26 8
0,00
0 8
3.65
8.72
% A
P SD
L 06
FEB
202
36-
Feb-
23 2
5,00
0 1
0,00
0 2
5.00
25.
74 2
,500
,000
25.
84
8.15
% G
OVE
RNM
ENT
OF
IND
IA -
24 N
OV
2026
24-N
ov-2
6 1
5,00
0 1
0,00
0 1
5.00
15.
53 1
5,00
0 1
5.58
7.72
% G
OVE
RNM
ENT
OF
IND
IA 2
5 M
AY
2025
25-M
ay-2
5 5
25,0
00 1
0,00
0 5
25.0
0 5
28.9
3 –
–
7.88
% G
OVE
RNM
ENT
OF
IND
IA -
19-M
AR-
2030
19-M
ar-3
0 2
5,00
0 1
0,00
0 2
5.00
25.
30 –
–
8.67
% M
AHAR
ASH
TRA
SDL
24FE
B202
624
-Feb
-26
5,0
00 1
0,00
0 5
.00
5.0
7 –
–
Tota
l ( V
I ) 1
,249
.14
640
.53
GRA
ND TO
TAL
(I+II+
III+I
V+V+
VI)
3,5
77.9
1 2
,050
.92
Note
s :
As a
t 31.
3.20
16 `
in C
rore
s A
s at 3
1.3.
2015
` in
Cro
res
(a) A
ggre
gate
Boo
k Val
ue -
Quo
ted
Inve
stm
ents
2,62
4.13
1,09
7.58
(b) A
ggre
gate
Mar
ket V
alue
of Q
uote
d In
vest
men
ts2,
605.
101,
109.
94
(c) A
ggre
gate
Boo
k Val
ue -
Unqu
oted
Inve
stm
ents
953.
7895
3.34
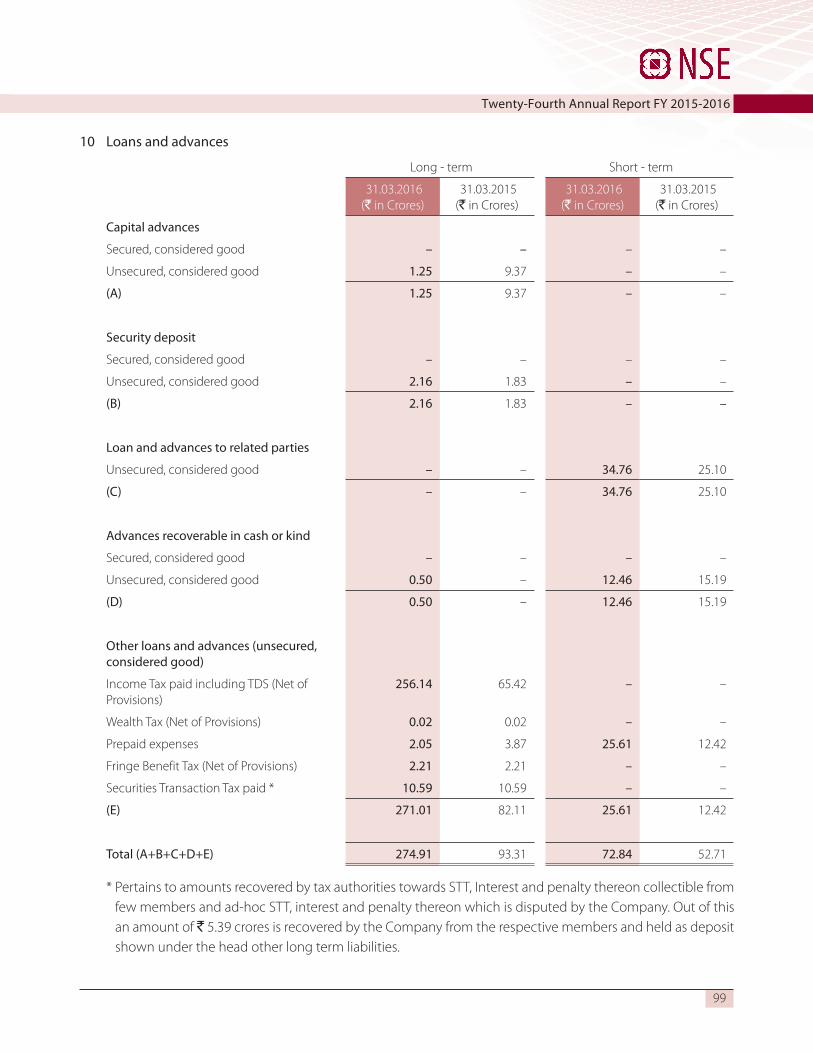
Twenty-Fourth Annual Report FY 2015-2016
99
10 Loans and advances
Long - term Short - term
31.03.2016(` in Crores)
31.03.2015(` in Crores)
31.03.2016(` in Crores)
31.03.2015(` in Crores)
Capital advances
Secured, considered good – – – –
Unsecured, considered good 1.25 9.37 – –
(A) 1.25 9.37 – –
Security deposit
Secured, considered good – – – –
Unsecured, considered good 2.16 1.83 – –
(B) 2.16 1.83 – –
Loan and advances to related parties
Unsecured, considered good – – 34.76 25.10
(C) – – 34.76 25.10
Advances recoverable in cash or kind
Secured, considered good – – – –
Unsecured, considered good 0.50 – 12.46 15.19
(D) 0.50 – 12.46 15.19
Other loans and advances (unsecured, considered good)
Income Tax paid including TDS (Net of Provisions)
256.14 65.42 – –
Wealth Tax (Net of Provisions) 0.02 0.02 – –
Prepaid expenses 2.05 3.87 25.61 12.42
Fringe Benefit Tax (Net of Provisions) 2.21 2.21 – –
Securities Transaction Tax paid * 10.59 10.59 – –
(E) 271.01 82.11 25.61 12.42
Total (A+B+C+D+E) 274.91 93.31 72.84 52.71
* Pertains to amounts recovered by tax authorities towards STT, Interest and penalty thereon collectible from few members and ad-hoc STT, interest and penalty thereon which is disputed by the Company. Out of this an amount of ` 5.39 crores is recovered by the Company from the respective members and held as deposit shown under the head other long term liabilities.

100
National Stock Exchange of India Limited
Long - term Short - term
31.03.2016(` in Crores)
31.03.2015(` in Crores)
31.03.2016(` in Crores)
31.03.2015(` in Crores)
Loans and advances to related parties pertains to :
National Securities Clearing Corporation Limited
– – 33.31 24.65
NSE Strategic Investment Corporation Limited
1.14 –
National Securities Depository Limited (new)
– – 0.01 0.01
NSE Infotech Services Limited – – – 0.21
Dotex International Limited – – 0.15 –
Receivables Exchange Of India Limited 0.15 –
India Index Services & Products Limited – – – 0.23
Total – – 34.76 25.10
11 Other assets
Non-current Current
31.03.2016(` in Crores)
31.03.2015(` in Crores)
31.03.2016(` in Crores)
31.03.2015(` in Crores)
Unsecured, considered good unless stated otherwise
Non-current bank balances (note no.14) 280.86 548.22 – –
280.86 548.22 – –
Others
Interest accrued on Investments – – 114.39 114.18
Interest accrued on Bank deposits 20.99 15.30 94.83 129.83
Other receivables – – 5.45 2.22
20.99 15.30 214.67 246.23
Total 301.85 563.52 214.67 246.23

Twenty-Fourth Annual Report FY 2015-2016
101
12
CURR
ENT
INVE
STM
ENTS
Mat
urity
D
ate
Num
ber o
f Un
its Fa
ce V
alue
pe
r Uni
t F
ace
valu
e (`
) F
ace
valu
e (`
in C
rore
s) A
s at
31.3
.201
6 N
umbe
r of
Units
As a
t 31
.3.2
015
(`)
(` in
Cro
res)
(` in
Cro
res)
ICU
RREN
T PO
RTIO
N O
F LO
NG T
ERM
INVE
STM
ENTS
(VAL
UED
AT C
OST
UNL
ESS
STAT
ED O
THER
WIS
E)
A)BO
NDS
(i)Q
UOTE
D TA
XABL
E BO
NDS
9.14
% IN
FRAS
TRUC
TURE
DEV
ELO
PMEN
T FI
NAN
CE C
OM
PAN
Y LI
MIT
ED -
27 JA
N 2
016
27-Ja
n-16
–1,
000,
000
100
,000
,000
10.
00 –
100.
00 1
0.03
8.88
% N
ATIO
NAL
BAN
K FO
R AG
RICU
LTUR
AL R
URAL
DEV
EL S
R-XI
II O
25
SEP
2015
25-S
ep-1
5–
1,00
0,00
0 1
00,0
00,0
00 1
0.00
–10
0.00
10.
00
9% M
AHIN
DRA
& M
AHIN
DRA
FIN
ANCI
AL S
ERVI
CES
LIM
ITED
- 04
M
AY 2
015
4-M
ay-1
5–
1,00
0,00
0 1
50,0
00,0
00 1
5.00
–15
0.00
14.
99
6 %
NAT
ION
AL H
IGH
WAY
S AU
THO
RITY
OF
IND
IA -
TXB
- 201
731
-Mar
-17
500
.00
10,0
00 5
,000
,000
0.5
0 0
.50
––
7.87
% E
XPO
RT IM
PORT
BAN
K O
F IN
DIA
- 16
MAY
201
616
-May
-16
250
.00
1,00
0,00
0 2
50,0
00,0
00 2
5.00
24.
98–
–
8.33
% U
NIO
N B
ANK
19 M
AY 2
016
19-M
ay-1
6 1
00.0
01,
000,
000
100
,000
,000
10.
00 1
0.00
––
8.78
% P
OW
ER F
INAN
CE C
ORP
ORA
TIO
N L
IMIT
ED -
11 D
EC 2
016
11-D
ec-1
6 5
.00
1,0
00,0
00 5
,000
,000
0.5
0 0
.49
––
Sub
-Tot
al (i
) 3
5.96
35.
02
(ii)
QUO
TED
TAXF
REE
BOND
S
6.05
% IN
DIA
N R
AILW
AY F
INAN
CE C
ORP
ORA
TIO
N L
IMIT
ED20
-Dec
-15
–10
0,00
0 5
0,00
0,00
0 5
.00
–50
0.00
5.0
0
Sub
-Tot
al (i
i)–
5.0
0
B)DE
BENT
URES
(iii)
QUO
TED
9.78
% TA
TA S
ON
S LI
MIT
ED -
NCD
- 23
JUL
2015
23-Ju
l-15
200
.00
1,0
00,0
00 2
00,0
00,0
00 2
0.00
–20
0.00
20.
03
9.60
% H
OUS
ING
DEV
ELO
PMEN
T FI
NAN
CE C
ORP
ORA
TIO
N LT
D18
-Jul-1
5 2
00.0
0 1
,000
,000
200
,000
,000
20.
00–
200.
00 2
0.02
8.85
% IN
FRAS
TRUC
TURE
DEV
ELO
PMEN
T FI
NAN
CE C
OM
PAN
Y LI
MIT
ED -N
CD-2
7JAN
1615
-Jan-
16 2
00.0
0 1
,000
,000
200
,000
,000
20.
00–
200.
00 2
0.01

102
National Stock Exchange of India LimitedM
atur
ity
Dat
e N
umbe
r of
Units
Face
Val
ue
per U
nit
Fac
e va
lue
(`)
Fac
e va
lue
(` in
Cro
res)
As a
t 31
.3.2
016
Num
ber o
f Un
its A
s at
31.3
.201
5
(`)
(` in
Cro
res)
(` in
Cro
res)
9.90
% TA
TA S
ON
S LI
MIT
ED 2
016
24-F
eb-1
6 1
50.0
0 1
,000
,000
150
,000
,000
15.
00–
150.
00 1
5.03
9.55
53%
HD
B FI
NAN
CIAL
SER
VICE
S LI
MIT
ED -
NCD
- 25
SEP
20
1525
-Sep
-15
100
.00
1,0
00,0
00 1
00,0
00,0
00 1
0.00
–10
0.00
10.
02
9.78
% TA
TA S
ON
S LI
MIT
ED -
NCD
- 23
JUL
2015
23-Ju
l-15
50.
00 1
,000
,000
50,
000,
000
5.0
0–
50.0
0 5
.01
9.30
% TA
TA S
ON
S LI
MIT
ED -
DEB
- 24
DEC
201
524
-Dec
-15
50.
00 1
,000
,000
50,
000,
000
5.0
0–
50.0
0 5
.01
9.55
% H
OUS
ING
DEV
ELO
PMEN
T FI
NAN
CE C
ORP
ORA
TIO
N LT
D7-
Sep-
15 5
0.00
1,0
00,0
00 5
0,00
0,00
0 5
.00
–50
.00
5.0
0
0% H
DFC
- D
EB -
16-JA
N-2
017
16-Ja
n-17
250
.00
1,0
00,0
00 2
50,0
00,0
00 2
5.00
36.
86–
–
10.6
0% L
IC H
OUS
ING
FIN
ANCE
- D
EB -
06-S
EPT-
2016
6-Se
p-16
750
.00
1,0
00,0
00 7
50,0
00,0
00 7
5.00
75.
28–
–
9.71
% TA
TA S
ON
S LI
MIT
ED -
13 D
EC 2
016
13-D
ec-1
6 2
50.0
0 1
,000
,000
250
,000
,000
25.
00 2
5.04
––
8.54
% H
DB
FIN
ANCI
AL S
ERVI
CES
LIM
ITED
- 03
JUN
201
63-
Jun-
16 2
50.0
0 1
,000
,000
250
,000
,000
25.
00 2
4.96
––
10.0
5% H
DB
FIN
ANCI
AL S
ERVI
CES
LIM
ITED
- N
CD 1
0-FE
B-20
1710
-Feb
-17
50.
00 1
,000
,000
50,
000,
000
5.0
0 5
.01
––
Sub
-Tot
al (i
ii) 1
67.1
5 1
00.1
3
TOTA
L (I)
203
.11
140
.15
IICU
RREN
T IN
VEST
MEN
TS (v
alue
d at
low
er o
f cos
t or f
air
valu
e)
A)DE
BENT
URES
(i)Q
UOTE
D
0% S
HRI
RAM
TRA
NSP
ORT
FIN
ANCE
CO
LTD
– 2
4 M
AY 2
016
24-M
ay-1
6 5
0.00
1,0
00,0
00 5
0,00
0,00
0 5
.00
6.6
1–
–
0% S
UND
ARAM
BN
P PA
RIBA
S H
OM
E FI
NAN
CE L
IMIT
ED -
28
MAY
201
528
-May
-15
– 1
,000
,000
231
,523
,400
23.
15–
200.
00 2
2.84
0% TA
TA C
APITA
L FI
NAN
CIAL
SER
VICE
S LI
MIT
ED -
NCD
- 30
JUN
20
1530
-Jun-
15–
1,0
00,0
00 6
7,34
6,35
0 6
.73
–50
.00
6.5
9
10%
FUL
LERT
ON
IND
IA C
RED
IT C
OM
APN
Y LI
MIT
ED -
DEB
- 15
JA
N 2
016
15-Ja
n-16
– 1
,000
,000
100
,000
,000
10.
00–
100.
00 1
0.05
10.1
0% S
UND
ARAM
FIN
ANCE
LIM
ITED
- 11
JUL
2015
11-Ju
l-15
– 1
,000
,000
100
,000
,000
10.
00–
100.
00 1
0.02
10.2
0% S
UND
ARAM
FIN
ANCE
LIM
ITED
- D
EB -
14 M
AY 2
015
14-M
ay-1
5–
1,0
00,0
00 1
50,0
00,0
00 1
5.00
–15
0.00
15.
01

Twenty-Fourth Annual Report FY 2015-2016
103
Mat
urity
D
ate
Num
ber o
f Un
its Fa
ce V
alue
pe
r Uni
t F
ace
valu
e (`
) F
ace
valu
e (`
in C
rore
s) A
s at
31.3
.201
6 N
umbe
r of
Units
As a
t 31
.3.2
015
(`)
(` in
Cro
res)
(` in
Cro
res)
10.4
0% TA
TA M
OTO
RS F
INAN
CE L
IMIT
ED -
DEB
- 12
JUN
201
512
-Jun-
15–
1,0
00,0
00 2
50,0
00,0
00 2
5.00
–25
0.00
25.
03
10.5
0% F
ULLE
RTO
N IN
DIA
CRE
DIT
CO
MAP
NY
LIM
ITED
- 11
DEC
20
1511
-Dec
-15
– 1
,000
,000
250
,000
,000
25.
00–
250.
00 2
5.21
10.5
0% F
ULLE
RTO
N IN
DIA
CRE
DIT
CO
MAP
NY
LIM
ITED
- 11
DEC
20
1511
-Dec
-15
– 1
,000
,000
100
,000
,000
10.
00–
100.
00 1
0.08
10.5
2% S
UND
ARAM
BN
P PA
RIBA
S H
OM
E FI
NAN
CE L
IMIT
ED -
DEB
- 03
APR
201
53-
Apr-1
5–
1,0
00,0
00 3
00,0
00,0
00 3
0.00
–30
0.00
30.
00
10.5
2% S
UND
ARAM
BN
P PA
RIBA
S H
OM
E FI
NAN
CE L
IMIT
ED -
DEB
- 03
APR
201
53-
Apr-1
5–
1,0
00,0
00 1
00,0
00,0
00 1
0.00
–10
0.00
10.
00
10.5
7035
% A
DIT
YA B
IRLA
FIN
ANCE
LIM
ITED
09
APR
2015
9-Ap
r-15
– 1
,000
,000
130
,000
,000
13.
00–
130.
00 1
3.00
10.5
9% A
DIT
YA B
IRLA
FIN
ANCE
LIM
ITED
- D
EB -
18 M
AY 2
015
18-M
ay-1
5–
1,0
00,0
00 3
00,0
00,0
00 3
0.00
–30
0.00
30.
05
10.5
9% A
DIT
YA B
IRLA
FIN
ANCE
LIM
ITED
- D
EB -
18 M
AY 2
015
18-M
ay-1
5–
1,0
00,0
00 3
00,0
00,0
00 3
0.00
–30
0.00
30.
05
10.8
0% D
EWAN
HO
USIN
G FI
NAN
CE C
ORP
ORA
TIO
N LT
D -
DEB
- 05
DEC
201
55-
Dec
-15
– 1
,000
,000
350
,000
,000
35.
00–
350.
00 3
5.20
10.8
0% D
EWAN
HO
USIN
G FI
NAN
CE C
ORP
ORA
TIO
N LT
D -
DEB
- 05
DEC
201
55-
Dec
-15
– 1
,000
,000
150
,000
,000
15.
00–
150.
00 1
5.09
10.9
5% F
ULLE
RTO
N IN
DIA
CRE
DIT
CO
MAP
NY
LIM
ITED
- 07
-O
CT-2
016
7-O
ct-1
6 1
,200
.00
500
,000
600
,000
,000
60.
00 6
0.50
––
11.5
0% F
ULLE
RTO
N IN
DIA
CRE
DIT
CO
MAP
NY
LIM
ITED
- 21
-AU
G-20
1521
-Aug
-15
– 1
,000
,000
250
,000
,000
25.
00–
250.
00 2
5.17
11.6
0% S
HRI
RAM
TRA
NSP
ORT
FIN
ANCE
CO
MPA
NY
LIM
ITED
- 11
JU
LY 2
016
11-Ju
l-16
150
.00
1,0
00,0
00 1
50,0
00,0
00 1
5.00
15.
09–
–
5% D
EWAN
HO
USIN
G FI
NAN
CE C
ORP
ORA
TIO
N LT
D -
06 M
AY
2016
6-M
ay-1
6 6
00.0
0 1
,000
,000
600
,000
,000
60.
00 6
9.43
––
8.70
% B
AJAJ
FIN
ANCE
LIM
ITED
- 22
JUL
2015
22-Ju
l-15
– 1
,000
,000
250
,000
,000
25.
00–
250.
00 2
4.95
8.80
% S
UND
ARAM
FIN
ANCE
LIM
ITED
- D
EB -
03 JU
N 2
016
3-Ju
n-16
50.
00 1
,000
,000
50,
000,
000
5.0
0 5
.00
––
8.80
% K
OTA
K M
AHIN
DRA
INVE
STM
ENT
LTD
- 28
FEB
201
728
-Feb
-17
100
.00
1,0
00,0
00 1
00,0
00,0
00 1
0.00
10.
00–
–
8.80
% K
OTA
K M
AHIN
DRA
INVE
STM
ENT
LTD
- 28
FEB
201
7 IN
E975
F07E
J428
-Feb
-17
150
.00
1,0
00,0
00 1
50,0
00,0
00 1
5.00
15.
00–
–
8.90
% L
&T F
INAN
CE C
OM
PAN
Y LI
MIT
ED -
20 M
AY 2
016
20-M
ay-1
6 1
50.0
0 1
,000
,000
150
,000
,000
15.
00 1
4.99
––
8.91
% L
&T IN
FRAS
TRUC
TURE
FIN
ANCE
CO
MPA
NY
LIM
ITED
- D
EB -
16 A
PR 2
015
16-A
pr-1
5–
1,0
00,0
00 1
00,0
00,0
00 1
0.00
–10
0.00
10.
00

104
National Stock Exchange of India LimitedM
atur
ity
Dat
e N
umbe
r of
Units
Face
Val
ue
per U
nit
Fac
e va
lue
(`)
Fac
e va
lue
(` in
Cro
res)
As a
t 31
.3.2
016
Num
ber o
f Un
its A
s at
31.3
.201
5
(`)
(` in
Cro
res)
(` in
Cro
res)
8.95
% L
&T IN
FRAS
TRUC
TURE
FIN
ANCE
CO
MPA
NY
LIM
ITED
- 04
MAY
201
54-
May
-15
– 1
,000
,000
250
,000
,000
25.
00–
250.
00 2
4.99
8.95
% L
&T IN
FRAS
TRUC
TURE
FIN
ANCE
CO
MPA
NY
LIM
ITED
- 15
JU
N 2
015
15-Ju
n-15
– 1
,000
,000
250
,000
,000
25.
00–
250.
00 2
4.97
8.95
% L
&T IN
FRAS
TRUC
TURE
FIN
ANCE
CO
MPA
NY
LIM
ITED
- 15
JU
N 2
015
15-Ju
n-15
– 1
,000
,000
150
,000
,000
15.
00–
150.
00 1
4.99
9% S
HRI
RAM
TRA
NSP
ORT
FIN
ANCE
CO
MPA
NY
LIM
ITED
- D
EB -
17 JU
N 2
016
17-Ju
n-16
250
.00
1,0
00,0
00 2
50,0
00,0
00 2
5.00
24.
99–
–
9.15
% TA
TA M
OTO
RS L
IMIT
ED -
03 JU
N 2
015
3-Ju
n-15
– 1
,000
,000
350
,000
,000
35.
00–
350.
00 3
5.00
9.15
% TA
TA M
OTO
RS L
IMIT
ED -
03 JU
N 2
015
3-Ju
n-15
– 1
,000
,000
200
,000
,000
20.
00–
200.
00 1
9.99
9.15
% TA
TA M
OTO
RS L
IMIT
ED -
03 JU
N 2
015
3-Ju
n-15
– 1
,000
,000
150
,000
,000
15.
00–
150.
00 1
4.99
9.15
% TA
TA M
OTO
RS L
IMIT
ED -
03 JU
N 2
015
3-Ju
n-15
– 1
,000
,000
50,
000,
000
5.0
0–
50.0
0 5
.00
9.20
% M
AHIN
DRA
& M
AHIN
DRA
FIN
ANCI
AL S
ERVI
CES
LIM
ITED
- D
EB -
22 A
PR 2
015
22-A
pr-1
5–
1,0
00,0
00 2
00,0
00,0
00 2
0.00
–20
0.00
19.
99
9.25
% H
DFC
LTD
- D
EB -
21O
CT20
1621
-Oct
-16
250
.00
1,0
00,0
00 2
50,0
00,0
00 2
5.00
24.
99–
–
9.30
% TA
TA S
ON
S LI
MIT
ED -
DEB
- 24
DEC
201
524
-Dec
-15
– 1
,000
,000
50,
000,
000
5.0
0–
50.0
0 5
.01
9.34
50%
L&T
FIN
ANCE
CO
MPA
NY
LIM
ITED
- 13
MAY
201
613
-May
-16
250
.00
1,0
00,0
00 2
50,0
00,0
00 2
5.00
25.
00–
–
9.40
% TA
TA M
OTO
RS F
INAN
CE L
IMIT
ED -
10 JU
N 2
016
10-Ju
n-16
400
.00
1,0
00,0
00 4
00,0
00,0
00 4
0.00
40.
01–
–
9.45
% A
SHO
K LE
YLAN
D LT
D -
DEB
- 20
1621
-Jun-
16 7
50.0
0 1
,000
,000
750
,000
,000
75.
00 7
5.04
––
9.55
% B
AJAJ
FIN
ANCE
LIM
ITED
- 10
AUG
201
610
-Aug
-16
50.
00 1
,000
,000
50,
000,
000
5.0
0 5
.01
––
9.58
% S
UND
ARAM
BN
P PA
RIBA
S H
OM
E FI
NAN
CE L
IMIT
ED 1
0 O
CT 2
016
10-O
ct-1
6 5
0.00
1,0
00,0
00 5
0,00
0,00
0 5
.00
5.0
1–
–
9.60
% H
DFC
LIM
ITED
- D
EB -
26 JU
N 2
015
26-Ju
n-15
– 1
,000
,000
200
,000
,000
20.
00–
200.
00 2
0.02
9.60
% S
UND
ARAM
FIN
ANCE
LIM
ITED
- 23
SEP
201
623
-Sep
-16
50.
00 1
,000
,000
50,
000,
000
5.0
0 5
.01
––
9.60
% TA
TA M
OTO
RS F
INAN
CE L
IMIT
ED -
DEB
- 13
MAY
201
513
-May
-15
– 1
,000
,000
250
,000
,000
25.
00–
250.
00 2
5.00
9.65
% S
HRI
RAM
TRA
NSP
ORT
FIN
ANCE
CO
MPA
NY
LIM
ITED
- 31
JU
L 20
1631
-Jul-1
6 2
50.0
0 1
,000
,000
250
,000
,000
25.
00 2
5.04
––
9.65
% TA
TA C
APITA
L FI
NAN
CIAL
SER
VICE
S LI
MIT
ED -
26 M
AY
2016
26-M
ay-1
6 2
50.0
0 1
,000
,000
250
,000
,000
25.
00 2
5.01
––
9.68
% TA
TA S
ON
S LI
MIT
ED -
DEB
- 10
-JAN
-201
710
-Jan-
17 4
00.0
0 1
,000
,000
400
,000
,000
40.
00 4
0.15
––

Twenty-Fourth Annual Report FY 2015-2016
105
Mat
urity
D
ate
Num
ber o
f Un
its Fa
ce V
alue
pe
r Uni
t F
ace
valu
e (`
) F
ace
valu
e (`
in C
rore
s) A
s at
31.3
.201
6 N
umbe
r of
Units
As a
t 31
.3.2
015
(`)
(` in
Cro
res)
(` in
Cro
res)
9.75
% H
DFC
- D
EB -
10-O
CT-2
016
10-O
ct-1
6 2
50.0
0 1
,000
,000
250
,000
,000
25.
00 2
5.04
––
9.80
% B
AJAJ
FIN
ANCE
LIM
ITED
- 17
OCT
201
617
-Oct
-16
300
.00
1,0
00,0
00 3
00,0
00,0
00 3
0.00
30.
13–
–
9.83
% TA
TA C
APITA
L FI
NAN
CIAL
SER
VICE
S LI
MIT
ED -
30 A
PR
2015
30-A
pr-1
5–
1,0
00,0
00 5
0,00
0,00
0 5
.00
–50
.00
5.0
0
9.83
% TA
TA C
APITA
L FI
NAN
CIAL
SER
VICE
S LI
MIT
ED -
30 A
PR
2015
30-A
pr-1
5–
1,0
00,0
00 5
0,00
0,00
0 5
.00
–50
.00
5.0
0
9.85
% H
DFC
LIM
ITED
- 28
MAY
201
528
-May
-15
– 1
,000
,000
50,
000,
000
5.0
0–
50.0
0 5
.01
9.85
% TA
TA C
APITA
L FI
NAN
CIAL
SER
VICE
S LI
MIT
ED -
15 A
PR
2015
15-A
pr-1
5–
1,0
00,0
00 1
50,0
00,0
00 1
5.00
–15
0.00
15.
00
9.85
% TA
TA C
APITA
L FI
NAN
CIAL
SER
VICE
S LI
MIT
ED -
15 A
PR
2015
15-A
pr-1
5–
1,0
00,0
00 1
00,0
00,0
00 1
0.00
–10
0.00
10.
00
9.89
% TA
TA M
OTO
RS F
INAN
CE L
IMIT
ED -
26-JU
N-2
015
26-Ju
n-15
– 1
,000
,000
250
,000
,000
25.
00–
250.
00 2
5.03
9.90
% D
EWAN
HO
USIN
G FI
NAN
CE C
ORP
ORA
TIO
N LT
D -
DEB
- 17
JUN
201
517
-Jun-
15–
1,0
00,0
00 1
50,0
00,0
00 1
5.00
–15
0.00
15.
01
9.90
% D
EWAN
HO
USIN
G FI
NAN
CE C
ORP
ORA
TIO
N LT
D -
DEB
- 17
JUN
201
517
-Jun-
15–
1,0
00,0
00 1
00,0
00,0
00 1
0.00
–10
0.00
10.
01
9.90
%D
EWAN
HO
USIN
G -D
EBEN
TURE
- 06
MAY
2016
6-M
ay-1
6 1
50.0
0 1
,000
,000
150
,000
,000
15.
00 1
5.00
––
9.93
% TA
TA C
APITA
L FI
NAN
CIAL
SER
VICE
S LI
MIT
ED 3
1 JU
L 20
1531
-Jul-1
5–
1,0
00,0
00 1
00,0
00,0
00 1
0.00
–10
0.00
10.
01
9.95
% L
&T F
INAN
CE C
OM
PAN
Y LI
MIT
ED -
28 O
CT 2
016
28-O
ct-1
6 1
00.0
0 1
,000
,000
100
,000
,000
10.
00 1
0.05
––
9.99
% S
UND
ARAM
FIN
ANCE
LIM
ITED
- D
EB -
03 A
UG 2
015
3-Au
g-15
– 1
,000
,000
50,
000,
000
5.0
0–
50.0
0 5
.01
9.99
% S
UND
ARAM
FIN
ANCE
LTD
- 04
MAY
201
54-
May
-15
– 1
,000
,000
250
,000
,000
25.
00–
250.
00 2
5.01
9.99
% S
UND
ARAM
FIN
ANCE
LTD
- 04
MAY
201
54-
May
-15
– 1
,000
,000
200
,000
,000
20.
00–
200.
00 2
0.00
9.15
% S
HRI
RAM
TRA
NSP
ORT
FIN
ANCE
CO
MPA
NY
LIM
ITED
- 02
JU
N 2
016
2-Ju
n-16
50.0
0 1
,000
,000
50,0
00,0
00 5
.00
5.0
0–
–
9.46
23%
TATA
CAP
ITAL
FIN
ANCI
AL S
ERVI
CES
LIM
ITED
- 08
JUL
2016
8-Ju
l-16
200.
00 1
,000
,000
200,
000,
000
20.
00 2
0.01
––
9.40
% TA
TA M
OTO
RS F
INAN
CE L
IMIT
ED -
05 JU
N 2
016
5-Ju
n-16
300.
00 1
,000
,000
300,
000,
000
30.
00 3
0.01
––
10.1
7% H
DB
FIN
ANCI
AL S
ERVI
CES
LIM
ITED
- 11
NO
V 20
1611
-Nov
-16
350
.00
1,0
00,0
00 3
50,0
00,0
00 3
5.00
35.
08–
–
Sub
-Tot
al (i
) 6
62.2
0 7
08.3
6

106
National Stock Exchange of India LimitedM
atur
ity
Dat
e N
umbe
r of
Units
Face
Val
ue
per U
nit
Fac
e va
lue
(`)
Fac
e va
lue
(` in
Cro
res)
As a
t 31
.3.2
016
Num
ber o
f Un
its A
s at
31.3
.201
5
(`)
(` in
Cro
res)
(` in
Cro
res)
B)M
UTUA
L FU
NDS
(ii)
UNQ
UOTE
D
LIQ
UID
PLUS
GRO
WTH
PLA
NS
AXIS
TRE
ASUR
Y AD
VAN
TAGE
FUN
D -
GRO
WTH
- D
IREC
T PL
AN 2
,840
,689
.01
157
.00
––
BIRL
A SU
N L
IFE
FLO
ATIN
G RA
TE F
UND
- LT
P - D
IREC
T - G
ROW
TH 1
,366
,686
.31
25.
00–
–
DSP
BLA
CKRO
CK U
LTRA
SH
ORT
TER
M F
UND
- D
IREC
T -
GRO
WTH
86,4
08,3
46.8
8 9
4.00
––
HD
FC B
ANKI
NG
& PS
U D
EBT
FUN
D–
–4,
539,
470.
70 5
.00
HD
FC F
LOAT
ING
RATE
INCO
ME
FUN
D -
STP
- DIR
ECT
- GRO
WTH
9,6
32,5
00.8
3 2
5.00
––
ICIC
I PRU
DEN
TIAL
ULT
RA S
HO
RT T
ERM
PLA
N -
DIR
ECT
- GR
OW
TH 1
7,35
8,54
3.94
27.
00–
–
ICIC
I PRU
DEN
TIAL
FLE
XIBL
E IN
COM
E PL
AN -
GRO
WTH
- D
IREC
T 3
,496
,025
.54
100
.00
––
IDFC
MO
NEY
MAN
AGER
- TR
EASU
RY P
LAN
- D
IREC
T - G
ROW
TH–
–43
,835,8
64.06
97.
00
RELI
ANCE
MO
NEY
MAN
AGER
FUN
D -
GRO
WTH
- D
IREC
T 1
44,0
75.9
2 3
0.00
––
RELI
GARE
INVE
SCO
ULT
RA S
HO
RT T
ERM
FUN
D -
DIR
ECT
- GR
OW
TH 5
67,8
88.0
9 1
19.0
2–
–
SBI S
HD
F - U
LTRA
SH
ORT
TER
M -
DIR
ECT
– GR
OW
TH L
IEN
M
ARKE
D 1
2,39
1.37
2.3
4 –
–
SUN
DAR
AM U
LTRA
SH
ORT
TER
M -
DIR
ECT
PLAN
- GR
OW
TH 6
,673
,276
.39
14.
00–
–
UTI F
LOAT
ING
RATE
FUN
D -
STP
- DIR
ECT
– GR
OW
TH L
IEN
M
ARKE
D 1
0,12
6.83
2.4
4–
–
Sub
-Tot
al (i
i) 5
95.8
0 1
02.0
0
(iii)
LIQ
UID
GRO
WTH
PLA
NS
SBI M
AGN
UM IN
STA
CASH
FUN
D -
DIR
ECT
- GRO
WTH
––
637,
575.
55 1
97.0
0
BIRL
A SU
N L
IFE
CASH
PLU
S - D
IREC
T - G
ROW
TH–
–8,
743,
216.
20 1
96.0
0
BARO
DA
PIO
NEE
R LI
QUI
D F
UND
- PL
AN B
- D
IREC
T - G
ROW
TH–
–59
2,90
6.85
95.
00
L&T
LIQ
UID
FUN
D -
DIR
ECT
- GRO
WTH
––
496,
031.
28 9
5.00

Twenty-Fourth Annual Report FY 2015-2016
107
Mat
urity
D
ate
Num
ber o
f Un
its Fa
ce V
alue
pe
r Uni
t F
ace
valu
e (`
) F
ace
valu
e (`
in C
rore
s) A
s at
31.3
.201
6 N
umbe
r of
Units
As a
t 31
.3.2
015
(`)
(` in
Cro
res)
(` in
Cro
res)
TEM
PLET
ON
IND
IA T
MA
- DIR
ECT
- GRO
WTH
––
37,78
5,764
.03 6
8.78
PRIN
CIPA
L CA
SH M
ANAG
EMEN
T - D
IREC
T PL
AN -
GRO
WTH
––
331,
239.
63 4
5.00
ICIC
I PRU
DEN
TIAL
LIQ
UID
- D
IREC
T PL
AN -
GRO
WTH
––
1,41
8,70
5.20
29.
29
RELI
ANCE
LIQ
UID
FUN
D -
TP -
DIR
ECT
- GRO
WTH
––
66,9
38.9
7 2
2.80
BNP
PARI
BAS
OVE
RNIG
HT
FUN
D -
DIR
ECT
- GRO
WTH
––
23,2
26.8
4 5
.00
IDBI
LIQ
UID
FUN
D -
DIR
- GR
OW
TH–
–33
,356
.35
5.0
0
SUN
DAR
AM M
ON
EY F
UND
- D
IREC
T PL
AN -
GRO
WTH
––
1,69
4,77
1.63
5.0
0
TATA
LIQ
UID
FUN
D D
IREC
T PL
AN -
GRO
WTH
––
19,3
67.1
7 5
.00
JPM
ORG
AN IN
DIA
TRE
ASUR
Y FU
ND
- D
IREC
T - G
ROW
TH–
–64
6,17
5.35
1.1
1
JM H
IGH
LIQ
UID
ITY
FUN
D -
DIR
ECT
GRO
WTH
2,7
02,4
78.0
2 1
1.11
––
RELI
ANCE
LIQ
UID
FUN
D -
CASH
PLA
N -
DIR
ECT
- GRO
WTH
185
,805
.24
45.
00–
–
HD
FC C
ASH
MGM
T FU
ND
- SA
VIN
GS P
LAN
- D
IREC
T - G
ROW
TH 1
5,93
7.98
5.0
0–
–
ICIC
I PRU
DEN
TIAL
FLE
XIBL
E IN
COM
E PL
AN -
GRO
WTH
- D
IREC
T12
,215
,742
.88
19.
00–
–
ICIC
I PRU
DEN
TIAL
LIQ
UID
- D
IREC
T PL
AN -
GRO
WTH
5,6
27,0
26.3
0 3
.92
––
HD
FC C
ASH
MGM
T FU
ND
- SA
VIN
GS P
LAN
- D
IREC
T - G
ROW
TH 2
1,03
0.03
0.0
5–
–
Sub
-Tot
al (i
ii) 8
4.09
769
.98
C)CO
MM
ERCI
AL PA
PER
(iv)
UNQ
UOTE
D
RELI
ANCE
CAP
ITAL
LIM
ITED
3-N
ov-1
5–
500,
000
500
,000
,000
50.
00–
1,00
0.00
45.
66
SUN
DAR
AM F
INAN
CE L
IMIT
ED24
-Apr
-15
–50
0,00
0 5
00,0
00,0
00 5
0.00
–1,
000.
00 4
5.64
FULL
ERTO
N IN
DIA
CRE
DIT
CO
MAP
NY
LIM
ITED
11-A
ug-1
5–
500,
000
500
,000
,000
50.
00–
1,00
0.00
45.
57
TATA
CAP
ITAL
FIN
ANCI
AL S
ERVI
CES
LIM
ITED
4-Au
g-15
–50
0,00
0 3
00,0
00,0
00 3
0.00
–60
0.00
27.
42
SUN
DAR
AM B
NP
PARI
BAS
HO
ME
FIN
ANCE
LIM
ITED
9-Ju
n-15
–50
0,00
0 2
50,0
00,0
00 2
5.00
–50
0.00
23.
09
TATA
CAP
ITAL
LIM
ITED
12-Ju
n-15
–50
0,00
0 2
50,0
00,0
00 2
5.00
–50
0.00
22.
92

108
National Stock Exchange of India LimitedM
atur
ity
Dat
e N
umbe
r of
Units
Face
Val
ue
per U
nit
Fac
e va
lue
(`)
Fac
e va
lue
(` in
Cro
res)
As a
t 31
.3.2
016
Num
ber o
f Un
its A
s at
31.3
.201
5
(`)
(` in
Cro
res)
(` in
Cro
res)
TATA
CAP
ITAL
LIM
ITED
3-Au
g-15
–50
0,00
0 2
50,0
00,0
00 2
5.00
–50
0.00
22.
85
FULL
ERTO
N IN
DIA
CRE
DIT
CO
MAP
NY
LIM
ITED
6-Au
g-15
–50
0,00
0 2
50,0
00,0
00 2
5.00
–50
0.00
22.
79
BAJA
J FIN
ANCE
LIM
ITED
19-Ju
n-15
–50
0,00
0 2
00,0
00,0
00 2
0.00
–40
0.00
18.
31
BAJA
J FIN
ANCE
LIM
ITED
6-Ap
r-15
–50
0,00
0 2
00,0
00,0
00 2
0.00
–40
0.00
18.
27
L&T
FIN
ANCE
CO
MPA
NY
LIM
ITED
6-M
ay-1
5–
500,
000
100
,000
,000
10.
00–
200.
00 9
.33
TATA
CAP
ITAL
LIM
ITED
9-Ju
n-15
–50
0,00
0 5
0,00
0,00
0 5
.00
–10
0.00
4.6
2
L&T
FIN
ANCE
CO
MPA
NY
LIM
ITED
8-M
ay-1
5–
500,
000
50,
000,
000
5.0
0–
100.
00 4
.62
SUN
DAR
AM F
INAN
CE L
IMIT
ED3-
Jun-
15–
500,
000
50,
000,
000
5.0
0–
100.
00 4
.62
TATA
CAP
ITAL
FIN
ANCI
AL S
ERVI
CES
LIM
ITED
10-Ju
n-15
–50
0,00
0 5
0,00
0,00
0 5
.00
–10
0.00
4.5
9
Sub
-Tot
al (i
v)–
320
.30
Tota
l (II)
1,3
42.0
9 1
,900
.64
GRA
ND TO
TAL
(I +I
I) 1
,545
.20
2,0
40.7
9
Note
s : A
s at 3
1.3.
2016
(` in
Cro
res)
As a
t 31.
3.20
15(`
in C
rore
s)
(a) A
ggre
gate
Boo
k Val
ue -
Quo
ted
Inve
stm
ents
865.
31 8
48.5
1
(b) A
ggre
gate
Mar
ket V
alue
of Q
uote
d In
vest
men
ts86
9.60
849
.53
(c) A
ggre
gate
Boo
k Val
ue -
Unqu
oted
Inve
stm
ents
679.
89 1
,192
.28
(d) P
rovi
sion
for d
imin
utio
n in
val
ue o
f Cur
rent
Inve
stm
ents
(0.0
7) (0
.02)

Twenty-Fourth Annual Report FY 2015-2016
109
13 Trade receivables
Non-current Current
31.03.2016(` in Crores)
31.03.2015(` in Crores)
31.03.2016(` in Crores)
31.03.2015(` in Crores)
Unsecured, considered good unless stated otherwise Outstanding for a period of over six months from the date they are due for payment
Secured, considered good – – 2.32 2.52
Unsecured, considered good – – 8.11 3.84
– – 10.43 6.36
Other debts
Secured, considered good – – 209.33 158.04
Unsecured, considered good 4.74 6.17
Doubtful – – 0.04 0.04
– – 214.11 164.25
Less : Provision for Doubtful Debts – – 0.04 0.04
– – 214.08 164.21
Total – – 224.50 170.57
14 Cash and bank balances
Non-current Current
31.03.2016(` in Crores)
31.03.2015(` in Crores)
31.03.2016(` in Crores)
31.03.2015(` in Crores)
Cash and cash equivalents
Balances with banks : On current accounts – – 50.64 32.69
Cash on hand – – 0.01 0.01
– – 50.65 32.70
Other bank balances
Bank Deposits with original maturity for more than 12 months
226.88 512.34 637.52 935.21
Earmarked Deposits with original maturity for more than 12 months
53.98 35.88 46.39 40.16
Bank Deposits with original maturity for more than 3 months but less than 12 months
– – 438.81 421.06
Earmarked Deposits with original maturity for more than 3 months but less than 12 months
– – 18.25 32.74
280.86 548.22 1,140.97 1,429.17
Amount disclosed under non-current assets (note 11) 280.86 548.22
Total – – 1,191.62 1,461.87

110
National Stock Exchange of India Limited
15 Revenue from operations
31.03.2016(` in Crores)
31.03.2015(` in Crores)
Operating revenuesSale of Services :Transaction charges 1,175.01 1,075.21
Book building Fees 8.50 3.30
Listing fees 50.36 1,233.87 47.91 1,126.41
Other operating revenuesNCFM Registration & Test enrolment fees 19.01 22.31
Processing Fees - Listing 17.37 13.15
Data Centre charges 70.84 56.15
Operational expenses recovery 0.73 0.66
Interest on Investments 94.50 107.37
Others 44.10 246.55 37.62 237.27
Total 1,480.42 1,363.68
16 Other income
31.03.2016 (` in Crores)
31.03.2015 (` in Crores)
Interest Income On Investment
Current 8.49 36.24
Long Term 196.16 111.27
On Bank Deposits 81.36 76.20
On Certificate of Deposits – 7.71
On Income Tax Refund 4.65 2.03
On Others 0.97 291.63 0.84 234.29
Dividend income Long Term :
from Subsidiary Companies 146.25 112.50
from Others 3.84 150.09 3.65 116.15
Current 0.02 –
Net gain / loss on sale of long term Investment 5.86 14.09
Net gain / loss on sale of current Investment 89.15 133.39
Rent Income 20.64 50.72
Amortisation of Premium / Discount on Govt/Debt Securities
– 5.65
Profit on sale of asset 6.05 –
Miscellaneous Income 0.68 0.15
Total 564.12 554.44
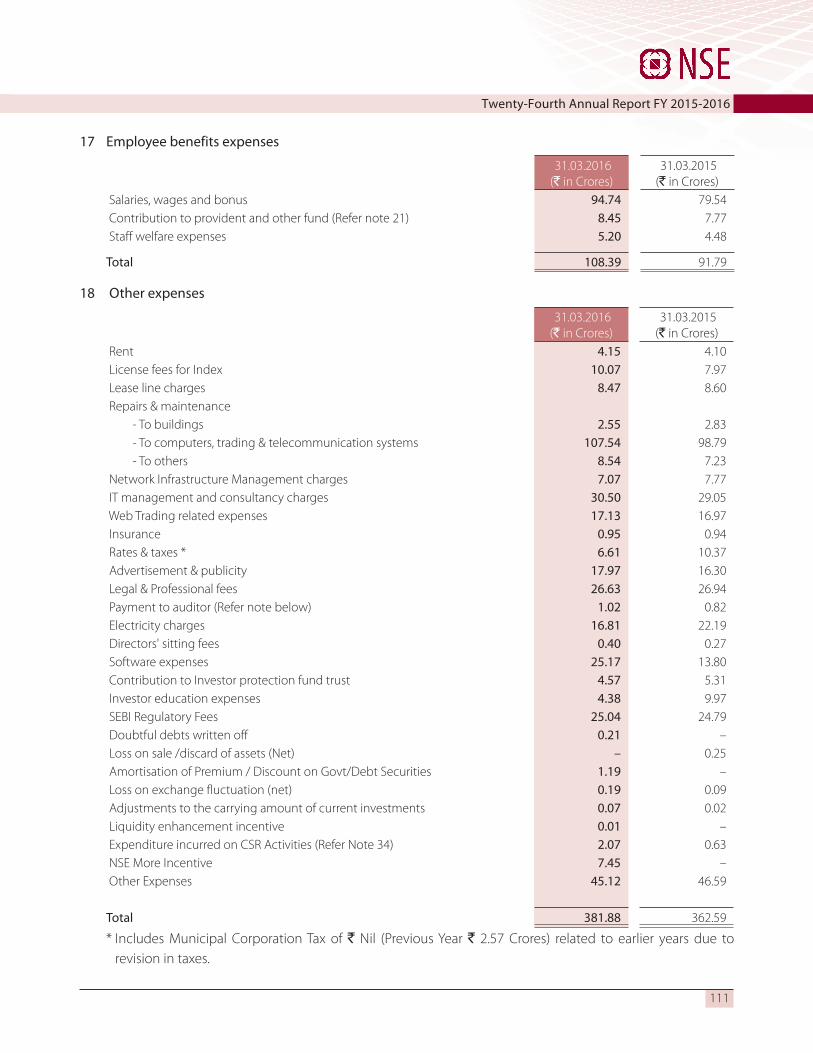
Twenty-Fourth Annual Report FY 2015-2016
111
17 Employee benefits expenses
31.03.2016(` in Crores)
31.03.2015(` in Crores)
Salaries, wages and bonus 94.74 79.54 Contribution to provident and other fund (Refer note 21) 8.45 7.77 Staff welfare expenses 5.20 4.48
Total 108.39 91.79
18 Other expenses
31.03.2016(` in Crores)
31.03.2015(` in Crores)
Rent 4.15 4.10 License fees for Index 10.07 7.97 Lease line charges 8.47 8.60 Repairs & maintenance - To buildings 2.55 2.83 - To computers, trading & telecommunication systems 107.54 98.79 - To others 8.54 7.23 Network Infrastructure Management charges 7.07 7.77 IT management and consultancy charges 30.50 29.05 Web Trading related expenses 17.13 16.97 Insurance 0.95 0.94 Rates & taxes * 6.61 10.37 Advertisement & publicity 17.97 16.30 Legal & Professional fees 26.63 26.94 Payment to auditor (Refer note below) 1.02 0.82 Electricity charges 16.81 22.19 Directors' sitting fees 0.40 0.27 Software expenses 25.17 13.80 Contribution to Investor protection fund trust 4.57 5.31 Investor education expenses 4.38 9.97 SEBI Regulatory Fees 25.04 24.79 Doubtful debts written off 0.21 – Loss on sale /discard of assets (Net) – 0.25 Amortisation of Premium / Discount on Govt/Debt Securities 1.19 – Loss on exchange fluctuation (net) 0.19 0.09 Adjustments to the carrying amount of current investments 0.07 0.02 Liquidity enhancement incentive 0.01 – Expenditure incurred on CSR Activities (Refer Note 34) 2.07 0.63 NSE More Incentive 7.45 – Other Expenses 45.12 46.59
Total 381.88 362.59
* Includes Municipal Corporation Tax of ` Nil (Previous Year ` 2.57 Crores) related to earlier years due to revision in taxes.

112
National Stock Exchange of India Limited
31.03.2016(` in Crores)
31.03.2015(` in Crores)
Note :
Payment to auditor
As auditor :
Audit fees 0.23 0.19
Tax audit fee 0.11 0.10
Limited review 0.17 0.17
In other capacity
Taxation matters 0.18 0.15
Certification matters 0.14 0.14
Other services 0.16 0.06
Total 1.02 0.82
19 Prior Period Adjustments
31.03.2016(` in Crores)
31.03.2015(` in Crores)
Expenses
Network Infrastructure Management charges – 0.71
Repairs & Maintenance - To computers, trading & telecommunication systems 2.29 –
IT management and consultancy charges (0.49) –
Professional Fees 0.31
Leased Line Charges 0.09 –
Other Expenses 1.04 0.12
3.25 0.83
Income
Processing Fees - Listing – 0.64
Usage Charges 0.37 –
Other Income 0.30 (0.03)
0.67 0.61
Total 2.58 0.22

Twenty-Fourth Annual Report FY 2015-2016
113
20 In accordance with Accounting Standard 20 - “Earning per Share” notified under Rule 7 of the Companies (Accounts) Rules, 2014.
Year ended31.03.2016
Year ended31.03.2015
Net Profit attributable to Shareholders (` In Crores)
(a) Profit before exceptional item and tax 1,350.06 1,286.55
Tax on above 412.75 394.65
Profit after tax and before exceptional item 937.31 891.90
(b) After exceptional item & contribution to NSCCL Core SGF 439.33 779.68
Weighted Average number of equity shares issued (No. in Crores) 4.50 4.50
Basic earnings per share of ` 10/- each (in `)
(a) Before exceptional item & contribution to NSCCL Core SGF 208.29 198.20
(b) After exceptional item & contribution to NSCCL Core SGF 97.63 173.26
The Company does not have any outstanding dilutive potential equity shares. Consequently, the basic and diluted earning per share of the Company remain the same.
21 Disclosure under Revised Accounting Standard 15 on Employee Benefits notified under Rule 7 of the Companies (Accounts) Rules, 2014.
i) Defined Contribution Plan: Company’s contribution towards superannuation amounting to ̀ 1.85 Crore (Previous Year : ` 1.80 Crore).
ii) Defined Benefit Plan :
(a) Provident Fund: The Company has contributed ` 3.42 Crores and ` 2.92 Crores towards Provident Fund during the year ended March 31, 2016 and March 31, 2015, respectively As per Implementation Guidance on AS 15 (Revised 2005) Employee Benefits issued by the Accounting Standard Board (ASB), benefit involving employer established provident funds which require interest short fall to be recompensed are to be considered as defined benefit plans. The Actuarial Society of India has issued the guidance for measurement of provident fund liabilities. The actuary has accordingly provided an actuarial valuation and indicated that the interest shortfall liability is ` Nil. Accordingly, no provision is required to be made towards the same.
Assumptions used in determining the present value obligation of the interest rate guarantee are as follows:
Current Year Previous Year
a. Approach used Deterministic Deterministic
b. Increase in compensation levels 5% p.a. 5% p.a.
c. Discount Rate 7.96% 7.96%
d. Attrition Rate 2.00% 2.00%

114
National Stock Exchange of India Limited
(b) Gratuity: Company has charged the Gratuity expense to Statement of Profit & Loss based on the actuarial valuation of gratuity liability at the end of the year. The projected unit credit method used to show the position as at March 31, 2016 is as under.
(i) Assumptions:
Current Year Previous Year
Discount Rate 7.96% 7.96%
Rate of Return on Plan Assets 7.96% 7.96%
Salary Escalation 5.00% 5.00%
Attrition Rate 2.00% 2.00%
(ii) Table showing change in benefit obligation: (` in Crores)
Current Year Previous Year
Liability at the beginning of the year 14.93 12.33
Interest cost 1.19 1.15
Current Service Cost 1.34 1.07
Liability transferred in (0.33) 0
Benefits Paid (1.42) (2.54)
Actuarial (gains) / loss on obligations 2.50 2.92
Liability at the end of the year 18.21 14.93
(iii) Table of recognition of Actuarial Gain / Loss (` in Crores)
Current Year Previous Year
Actuarial (Gain) / Loss on obligation for the period 2.50 2.92
Actuarial (Gain) / Loss on asset for the period (0.32) (0.37)
Actuarial (gains) / loss reconized in Income Statement 2.18 2.55
(iv) Tables of Fair value of plan assets: (` in Crores)
Current Year Previous Year
Fair Value of plan assets at the beginning of the year 10.73 6.72
Expected return on plan assets 0.85 0.54
Contributions 2.72 5.64
Transfer from other company - 0
Benefits paid (1.42) (2.54)
Actuarial gain / (loss) on Plan Assets 0.32 0.37
Fair Value of plan assets at the end of the year 13.20 10.73

Twenty-Fourth Annual Report FY 2015-2016
115
(v) Actual Return on Plan Assets: (` in Crores)
Current Year Previous Year
Expected return on plan assets 0.85 0.54
Actuarial gain/(loss) on plan assets 0.32 0.37
Actual Return on plan assets 1.17 0.91
(vi) Amount recognised in the balance sheet (` in Crores)
Current Year Previous Year
Fair value of plan assets as at the end of the year 13.20 10.72
Liability as at the end of the year (18.21) (14.93)
Net (liability) / asset disclosed in the Balance Sheet (5.01) (4.21)
(vii) Expenses recognised in the Statement of Profit & Loss (` in Crores)
Current Year Previous Year
Current Service cost 1.34 1.07
Interest Cost 0.33 1.14
Expected return on plan assets - (0.53)
Actuarial (Gain) or Loss 2.19 2.55
Expenses recognised in the Statement of Profit & Loss 3.86 4.23
viii) Balance Sheet Reconciliation (` in Crores)
Current Year Previous Year
Opening Net Liability 4.20 5.62
Expense as above 3.86 4.23
Net (liability) / Asset transfer out (0.33) 0.00
Employers Contribution (2.72) (5.64)
Amount recognised in the Balance Sheet 5.01 4.21
ix) Category of Assets (` in Crores)
Current Year Previous Year
Insurer Managed Funds 13.20 10.72
Total 13.20 10.72
x) Experience Adjustment (` in Crores)
Current Year Previous Year
On Plan Liability (Gain) / Loss 2.50 2.92
On Plan asset (Loss) / Gain 0.32 0.37

116
National Stock Exchange of India Limited
22 In accordance with Accounting Standard 19 - “Leases” notified under the Rule 7 of the Companies (Accounts) Rules, 2014, the details of obligation on long term non - cancellable operating lease in respect of certain vehicles and office premises taken by the Company are as follows.
(` in Crores)
Lease obligations Year ended31.03.2016
Year ended31.03.2015
Total of future minimum lease payments
- Lease rentals paid during the year 3.25 3.46
- Not later than one year 2.76 3.03
- Later than one year and not later than five years 2.32 3.05
- Later than five years 0.45 0.75
The terms of the Leases range from 3 years to 9 years.
23 In the opinion of the management, as the Company’s operations comprise of only facilitating trading in securities and the activities incidental thereto within India, the disclosures required in terms of Accounting Standard 17 - “Segment Reporting” notified under the Rule 7 of the Companies (Accounts) Rules, 2014 are not applicable. However the Company while presenting the consolidated financial statements in the annual report has disclosed the segment information in the consolidated financial statements to the extent applicable as required under Accounting Standard 17 - “Segment Reporting”.
24 In compliance with Accounting Standard 18 - “Related Party Disclosures” notified under the Rule 7 of the Companies (Accounts) Rules, 2014, the required disclosures are given in the table below:
(a) Names of the related parties and related party relationship
Sr. No. Related Party Nature of Relationship
1 National Securities Clearing Corporation Limited Subsidiary Company
2 NSE Strategic Investment Corporation Limited Subsidiary Company
3 NSE.IT Limited Subsidiary's Subsidiary Company
4 DotEx International Limited Subsidiary's Subsidiary Company
5 India Index Services & Products Limited Subsidiary's Subsidiary Company
6 NSE Infotech Services Limited Subsidiary's Subsidiary Company
7 NSE.IT (US) Inc. Subsidiary's Subsidiary's Subsidiary Company
8 NSE Educational Facilities Limited Subsidiary's Subsidiary Company(w.e.f. 12.03.2016)
9 National Securities Depository Limited (new) Associate Company
10 BFSI Sector Skill Council of India Associate Company
11 Power Exchange India Limited Subsidiary's Associate

Twenty-Fourth Annual Report FY 2015-2016
117
Sr. No. Related Party Nature of Relationship
12 NSDL e-Governance Infrastructure Limited (formerly known as National Securities Depository Limited)
Subsidiary's Associate
13 Market Simplified India Limited (formerly known as INXS Technologies Limited)
Subsidiary's Associate
14 Computer Age Management Services Private Limited Subsidiary's Associate
15 Receivables Exchange Of India Limited Subsdiary's Joint Venture(w.e.f. 25.02.2016)
16 Ms. Chitra Ramkrishna - Managing Director & CEO Key Management Personnel
(b) Details of transactions (including service tax wherever levied) with related parties are as follows:
(` in Crores)
Name of the Related Party Nature of Transactions Year ended 31.03.2016
Year ended 31.03.2015
National Securities Clearing Corporation Ltd.
Usage charges received 16.25 13.43
Space and Infrastructure usage charges received
4.23 3.97
Reimbursement received for expenses on staff on deputation
12.05 12.89
Reimbursement received for other expenses incurred
41.19 33.85
Dividend received 146.25 112.50
Clearing and Settlement charges paid 112.04 102.45
Contribution to NSCCL Core SGF 761.52 170.00
Purchase of Investment 0.93 –
Closing balance (Credit)/Debit (657.21) 24.65
Investment in Equity Share Capital 5.64 5.64
NSE.IT Ltd.
Reimbursement received for other expenses incurred
0.04 0.67
Software Development Charges paid 1.68 1.19
Software Expenses 0.00 0.83
Repairs and maintenance – Computer trading , Telecommunication systems
34.26 34.12
STP charges received 0.04 0.01
NCFM Test expenses paid 7.28 6.52
CTCL Empanelment charges received 0.09 0.11
IT Mgt. & Consultancy charges paid 5.38 4.08
Installation commissioning & warranty charges for trading system
– 0.35
Closing balance (Credit)/Debit (4.83) (1.05)

118
National Stock Exchange of India Limited
Name of the Related Party Nature of Transactions Year ended 31.03.2016
Year ended 31.03.2015
DotEx International Ltd.
Space and Infrastructure usage charges received
0.85 0.74
Reimbursement received for expenses on staff on deputation
2.35 2.07
Reimbursement for expenses incurred 4.40 2.03
CTCL Empanelment charges received 0.06 0.06
Amount received towards revenue sharing on account of info feed services
17.25 13.47
Web trading related expenses 19.51 19.07
Closing balance (Credit)/Debit 0.15 (0.89)
India Index Services & Products Ltd.
License fees paid 11.46 8.95
Usage Charges received 0.84 0.84
Space and Infrastructure usage charges received
0.56 0.50
Reimbursement received for expenses on staff on deputation
1.87 1.44
Reimbursement received for other expenses incurred
7.85 1.19
Closing balance (Credit)/Debit (0.08) 0.23
Receivables Exchange Of India Limited
Recoverable towards software development charges paid
0.15 –
Interest recoverable 0.001 –
Closing balance (Credit)/Debit 0.15 –
NSE Infotech Services Ltd.
IT Mgt. & Consultancy charges paid 26.52 25.65
Repairs and maintenance – Computer trading , Telecommunication systems
17.91 19.12
Rent received 0.45 0.22
Reimbursement received for expenses incurred
13.77 12.44
Closing balance (Credit)/Debit (7.23) 0.21
NSE Strategic Investment Corporation Limited
Space and Infrastructure usage charges received
0.20 –
Reimbursement received for expenses on staff on deputation
1.53 –
Reimbursement received for expenses incurred
2.86 0.06
Closing balance (Credit)/Debit 1.14 –
Investment in Preference Share Capital 412.97 412.56
Investment in Equity Share Capital 413.13 412.61
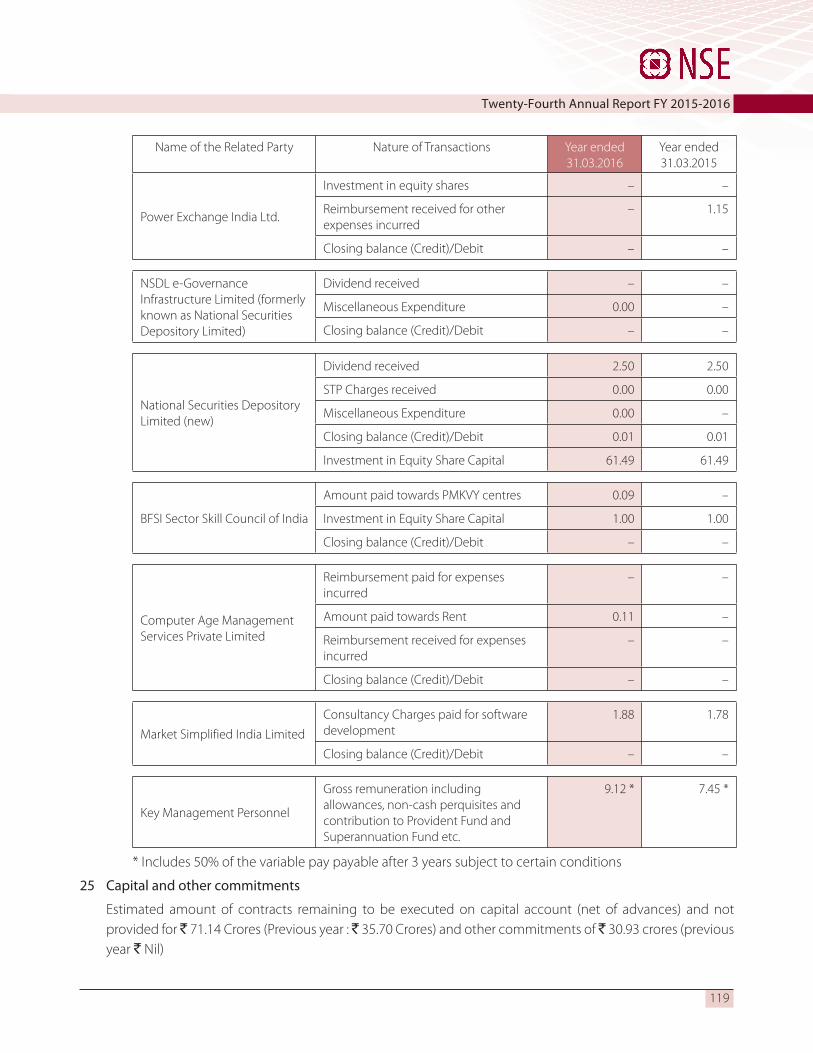
Twenty-Fourth Annual Report FY 2015-2016
119
Name of the Related Party Nature of Transactions Year ended 31.03.2016
Year ended 31.03.2015
Power Exchange India Ltd.
Investment in equity shares – –
Reimbursement received for other expenses incurred
– 1.15
Closing balance (Credit)/Debit – –
NSDL e-Governance Infrastructure Limited (formerly known as National Securities Depository Limited)
Dividend received – –
Miscellaneous Expenditure 0.00 –
Closing balance (Credit)/Debit – –
National Securities Depository Limited (new)
Dividend received 2.50 2.50
STP Charges received 0.00 0.00
Miscellaneous Expenditure 0.00 –
Closing balance (Credit)/Debit 0.01 0.01
Investment in Equity Share Capital 61.49 61.49
BFSI Sector Skill Council of India
Amount paid towards PMKVY centres 0.09 –
Investment in Equity Share Capital 1.00 1.00
Closing balance (Credit)/Debit – –
Computer Age Management Services Private Limited
Reimbursement paid for expenses incurred
– –
Amount paid towards Rent 0.11 –
Reimbursement received for expenses incurred
– –
Closing balance (Credit)/Debit – –
Market Simplified India Limited
Consultancy Charges paid for software development
1.88 1.78
Closing balance (Credit)/Debit – –
Key Management Personnel
Gross remuneration including allowances, non-cash perquisites and contribution to Provident Fund and Superannuation Fund etc.
9.12 * 7.45 *
* Includes 50% of the variable pay payable after 3 years subject to certain conditions
25 Capital and other commitments
Estimated amount of contracts remaining to be executed on capital account (net of advances) and not provided for ̀ 71.14 Crores (Previous year : ` 35.70 Crores) and other commitments of ` 30.93 crores (previous year ` Nil)

120
National Stock Exchange of India Limited
26 Contingent liability:
(i) Claims against the company not acknowledged as debts: ` 5.20 Crores (Previous Year: ` 5.65 Crores)
(ii) (a) In a complaint filed by a competitor against the Company, the Competition Commission of India directed the Company to pay a penalty of ̀ 55.50 crores (Previous Year : ̀ 55.50 crores). The Company had appealed against the order before the Hon'ble Competition Appellate Tribunal (COMPAT) which rejected the appeal. The Company has appealed against the said order and stay has been granted by the Hon'ble Supreme Court of India. In respect of the same subject matter, a compensation claim has been filed against the Company amounting to ` 856.99 crores (Previous Year : ` 856.99 crores) before the COMPAT by the competitor and the same is being disputed by the Company. Based on the legal advice, the Company is of the view that there are strong grounds that the Hon'ble Supreme Court of India will over turn the decision of the COMPAT.In view of the same no provision has been made in respect of penalty and compensation claimed.
(b) A suit has been filed, jointly and severally against the Company and National Securities Clearing Corporation Limited for damages / compensation amounting to ` 152.57 crores (Previous Year : ` 152.57 crores) along with interest thereon and has been disputed by the Company.As per the legal opinion received, the possibiity of the claim being awarded against the Company is remote.
(iii) On account of disputed demand of Income Tax: ` 37.81 Crores (Previous Year: ` 45.99 Crores), disputed demand of Fringe Benefit Tax: ̀ 2.21 Crores (Previous Year: ̀ 2.21 Crores ) and disputed demand of Wealth Tax: `1.94 Crores (Previous Year: ` 1.94 Crores). Wealth Tax liability includes ` 1.86 Crores (Previous Year: ` 1.86 Crores) on account of Tax Department appeals pending disposal before the Bombay High Court. On account of disputed demand of Service Tax: ` 39.20 crores (Previous Year: ` 39.20 crores) alongwith interest and penalty thereon
(iv) On account of disputed demand of Securities Transaction Tax : ` 5.21 Crores (Previous Year : ` 5.21 Crores)
27 Details of dues to micro, small and medium enterprises as defined under the MSMED Act, 2006
Liability for expenses includes ` 0.11 Crore (Previous Year: ` 0.05 Crore) due to Micro, Small & Medium Enterprises. Total outstanding dues to Micro, Small & Medium Enterprises have been determined to the extent such parties have been identified on the basis of information available with the Company.
28 C.I.F. value of import in respect of Capital goods : ` 2.37 Crores (Previous year : ` 16.61 Crores)
29 Expenditure in foreign currency (accrual basis)
Particulars (` in Crores)
Current Year Previous Year
Travelling expenses 0.53 0.51
Professional and technical fees 24.84 16.57
Others 2.08 1.41
30 Net dividend remitted in foreign exchange
Year of remittance (ending on) 31.03.2016 31.03.2015
Period to which it relates 01.04.2014 to 31.03.2015
01.04.2013 to 31.03.2014
Number of non-resident shareholders to whom dividend remitted in foreign currency 4 7
Number of equity shares held on which dividend was due 6,075,000 8,775,000
Amount remitted INR equivalent USD ( ` In Crores) 48.30 59.67

Twenty-Fourth Annual Report FY 2015-2016
121
31 Earnings in foreign currency (accrual basis) :
Particulars (` in Crores)
Current Year Previous Year
Professional Fees 0.98 0.08
32 In the opinion of the Board, current assets, loans and advances are approximately of the value stated, if realised in the ordinary course of business.
33 Effective April 1, 2016 the company has demerged its education operations into a separate subsidiary's subsidiary company and the impact of the same is not material.
34 a) Gross amount required to be spent by the Company on Corporate Social Responsibility activities during the financial year 2015-16 is ` 21.14 crores (Previous year : ` 20.95 crores)
b) Amount spent during the year towards Primary Education, Elder Care, etc :
Particulars In cash Yet to be paid in cash Total
Construction / acquisiting of any asset – – –
– – –
On purposes other than above * 1.95 – 1.95
(0.55) – (0.55)
Figure in brackets pertain to year ended March 31, 2015
* excludes ̀ 0.12 crores (previous year ̀ 0.08 crores) on capacity building of personnel and implementing agencies etc., which is in excess of 5 % of total CSR expenditure.
35 a) In accordance with Regulation 33 of Securities Contracts (Regulations) (SECC) Regulations, 2012 (The Regulations) issued on June 20, 2012, every recognized stock exchange was required to transfer twenty five percent of its annual profits every year to a fund of the recognized clearing corporation(s) which clears and settles trades executed on that stock exchange to guarantee settlement of trades.The Securities and Exchange Board of India (SEBI) in its Press Release No.225/2015 dated September 1, 2015, stated that the report of the Committee on Clearing Corporations had been placed before the SEBI Board in its meeting held on August 24, 2015 and that while the SEBI Board took note of the report, it approved the proposal to seek public comments on the recommendations of the committee. Pending final notification based on the decision which was to be taken by SEBI after the public comments were received, the Company has made a provisional appropriation of ̀ 527.19 crores (net of ̀ 170 crores transferred to Core SGF (Refer Note 35(b)) as at March 31, 2015 and the same had been shown under the head Short Term Provisions, to be suitably adjusted in the light of the final SEBI notification in the matter.
(i) SEBI has in its Circular No. SEBI/HO/MRD/DRMNP/CIR/2016/54 dated May 04, 2016 since notified that the amounts carried forward in the Short Term provision in respect of the period upto March 31, 2015 have to be transferred by the Stock Exchange to the Core SGF maintained by the Clearing Corporation within one month of the date of issuance of the notification and that the amounts to be transferred by the Stock Exchange to the Core SGF maintained by the Clearing Corporation in respect of the period from April 01, 2015 till the date of amendment of the Regulation 33 of SECC Regulation, 2012 within such time as to be specified by SEBI.

122
National Stock Exchange of India Limited
(ii) Accordingly, the provisional appropriations made out of profits aggregating to ` 527.19 crores shown under the head Short Term Provision in the Balance Sheet as on March 31, 2015 have been reversed and a provision for an equivalent amount towards contribution to NSCCL Core SGF has been made during the year. Further a provision of `163.33 crores has also been made during the year for the period April 01, 2015 till March 31,2016 (net of of ` 71 crores transferred to Core SGF for the year (Refer Note 35 (b)). Accordingly, an aggregate amount of ` 690.52 crores has been charged to Statement of Profit and Loss during the year and shown as an exceptional item. Also, the said amount payable to NSCCL Core SGF has been shown under the head Other current liability in the Balance sheet.
b) In terms of Securities and Exchange Board of India circular CIR/MRD/DRMNP/25/2014 dated August 27, 2014, the Clearing Corporation (CC) shall have a fund called Core SGF for each segment of each Recognised Stock Exchange (SE) to guarantee the settlement of trades executed in respective segment of the SE. The Recognised SE shall contribute at least 25 % of the Minimum Required Corpus of Core SGF (MRC). The contribution to be made by the Recognised SE to the said Core SGF can be adjusted against transfer of 25% of the profit by the Recognised SE as required by Regulation 33 of SECC Regulations. Accordingly, during the year ended March 31, 2016, an amount of ̀ 71 crores ( Previous Year - ̀ 170 crores) has been transferred to the Clearing Corporation towards contribution to the said Minimum Required Corpus of Core SGF and the same is adjusted against appropriation of 25% of the profit as mentioned in note (35)(a)(ii) and has been charged to Statement of Profit and Loss and shown as exceptional item.
36 The Company's pending litigations comprise of claims against the Company and proceedings pending with Statutory and Tax Authorities. The Company has reviewed all its pending litigations and proceedings and has made adequate provisions, whenever required and disclosed the contingent liabilities, whereever applicable, in its financial statements. The Company does not expect the outcome of these proceedings to have a material impact on its financial position (Refer note no 26 for details on contingent liabilities)
37 In accordance with relevant provisions of Companies Act, 2013, the Company did not have any long-term contracts including derivative contracts as at March 31, 2016.
38 For the year ended March 31, 2016, the company is not required to transfer any amount into the Investor Education & Protection Fund as required under relevant provisions of the Companies Act, 2013.
39 Previous years’ figures are regrouped, reclassified and rearranged wherever necessary.
As per our report of even date attached For and on behalf of the Board of Directors
For KHANDELWAL JAIN & CO.,Chartered AccountantsFirm's Registration no : 105049W
NARENDRA JAIN ASHOK CHAWLA CHITRA RAMKRISHNAPartner Chairman Managing Director & CEOMembership No.:048725
Place : Mumbai J. RAVICHANDRAN YATRIK VINDate : May 12, 2016 Group President & Company Secretary Chief Financial Officer