national survey results - mclaughlin and...
TRANSCRIPT

December 2018John McLaughlin
On the webwww.mclaughlinonline.com
National Survey Results2020 General Election Likely Voters
Political Environment, Trends & Analysis

Part One –Political Environment
2

Direction: United StatesTime Series
41
52
0
10
20
30
40
50
60
70
80
11
/14
1/1
5
2/1
5
3/1
5
4/1
5
5/1
5
6/1
5
7/1
5
8/1
5
9/1
5
10
/15
11
/15
1/1
6
2/1
6
3/1
6
5/1
6
12
/16
1/1
7
2/1
7
3/1
7
4/1
7
5/1
7
8/1
7
10
/17
11
/17
12
/17
1/1
8
2/1
8
3/1
8
4/1
8
5/1
8
6/1
8
7/1
8
8/1
8
9/1
8
10
/18
11
/18
12
/18
Right Direction Wrong Track
3National - M&A
December 2018
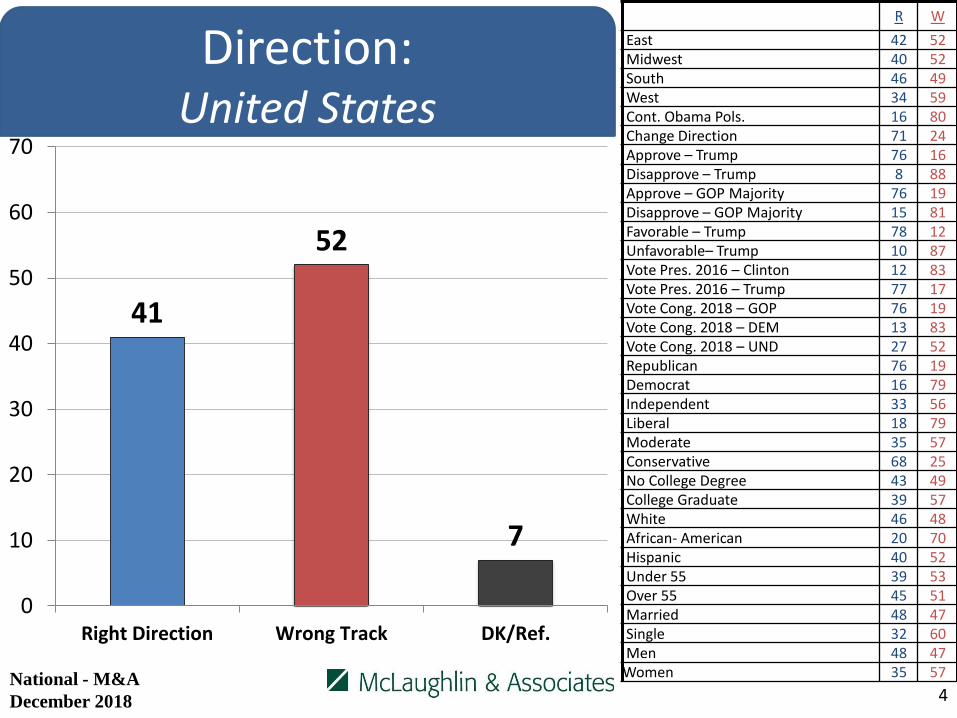
41
52
7
0
10
20
30
40
50
60
70
Right Direction Wrong Track DK/Ref.
R W
East 42 52Midwest 40 52South 46 49West 34 59Cont. Obama Pols. 16 80Change Direction 71 24Approve – Trump 76 16Disapprove – Trump 8 88Approve – GOP Majority 76 19Disapprove – GOP Majority 15 81Favorable – Trump 78 12Unfavorable– Trump 10 87Vote Pres. 2016 – Clinton 12 83Vote Pres. 2016 – Trump 77 17Vote Cong. 2018 – GOP 76 19Vote Cong. 2018 – DEM 13 83Vote Cong. 2018 – UND 27 52Republican 76 19Democrat 16 79Independent 33 56Liberal 18 79Moderate 35 57Conservative 68 25No College Degree 43 49College Graduate 39 57White 46 48African- American 20 70Hispanic 40 52Under 55 39 53Over 55 45 51Married 48 47Single 32 60Men 48 47
Women 35 57
Direction: United States
4National - M&A
December 2018
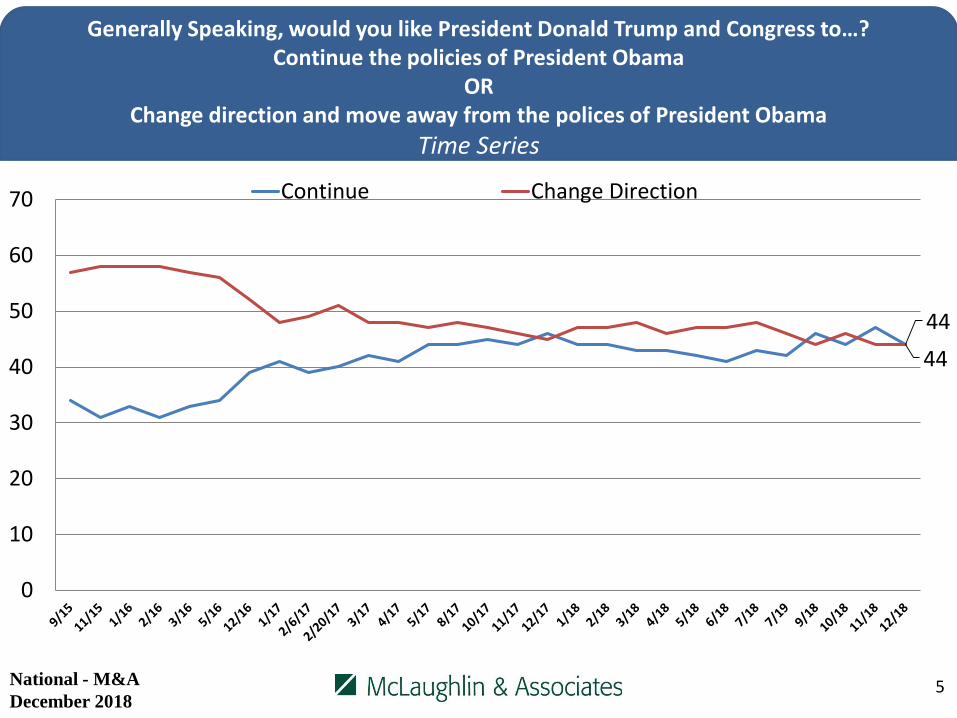
Generally Speaking, would you like President Donald Trump and Congress to…? Continue the policies of President Obama
OR Change direction and move away from the polices of President Obama
Time Series
44
44
0
10
20
30
40
50
60
70 Continue Change Direction
5National - M&A
December 2018
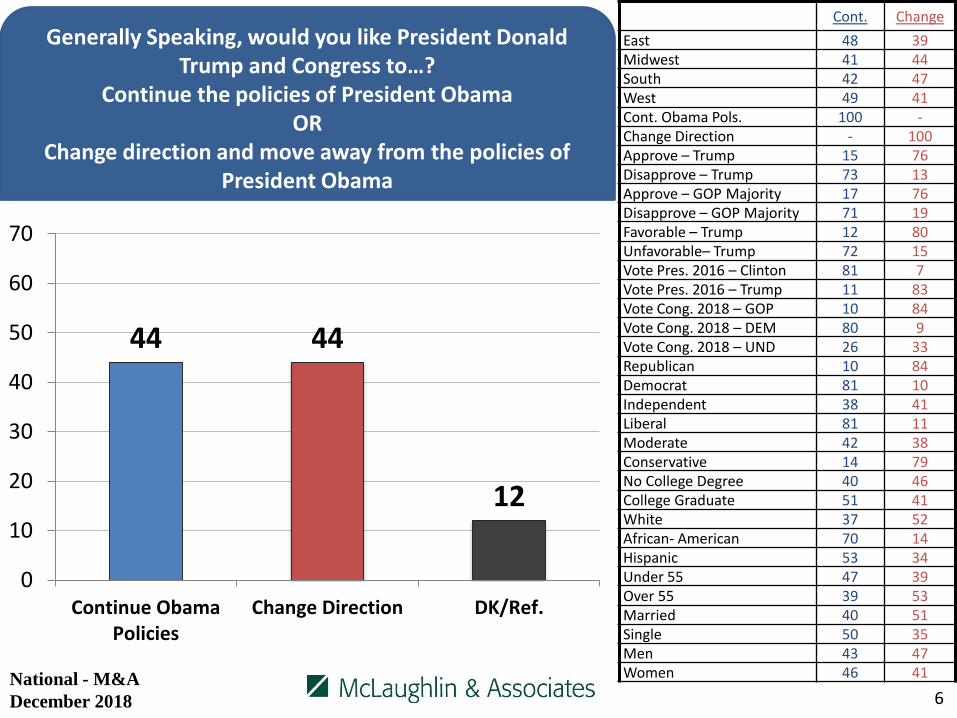
44 44
12
0
10
20
30
40
50
60
70
Continue ObamaPolicies
Change Direction DK/Ref.
Cont. Change
East 48 39Midwest 41 44South 42 47West 49 41Cont. Obama Pols. 100 -Change Direction - 100Approve – Trump 15 76Disapprove – Trump 73 13Approve – GOP Majority 17 76Disapprove – GOP Majority 71 19Favorable – Trump 12 80Unfavorable– Trump 72 15Vote Pres. 2016 – Clinton 81 7Vote Pres. 2016 – Trump 11 83Vote Cong. 2018 – GOP 10 84Vote Cong. 2018 – DEM 80 9Vote Cong. 2018 – UND 26 33Republican 10 84Democrat 81 10Independent 38 41Liberal 81 11Moderate 42 38Conservative 14 79No College Degree 40 46College Graduate 51 41White 37 52African- American 70 14Hispanic 53 34Under 55 47 39Over 55 39 53Married 40 51Single 50 35Men 43 47Women 46 41
Generally Speaking, would you like President Donald Trump and Congress to…?
Continue the policies of President ObamaOR
Change direction and move away from the policies of President Obama
6National - M&A
December 2018

Job Rating: Donald TrumpTime Series
48
51
10
20
30
40
50
60
70Approve Disapprove
7National - M&A
December 2018

48
24 24
51
12
38
10
10
20
30
40
50
60
70
APP. Strongly Smwt DISAPP. Smwt Strongly DK/Ref.
App. Disapp.
East 48 51Midwest 48 51South 51 48West 44 55Cont. Obama Pols. 17 83Change Direction 84 15Approve – Trump 100 -Disapprove – Trump - 100Approve – GOP Majority 87 13Disapprove – GOP Majority 17 83Favorable – Trump 97 3Unfavorable– Trump 9 91Vote Pres. 2016 – Clinton 12 87Vote Pres. 2016 – Trump 91 9Vote Cong. 2018 – GOP 89 11Vote Cong. 2018 – DEM 11 88Vote Cong. 2018 – UND 46 49Republican 85 13Democrat 16 84Independent 46 52Liberal 20 79Moderate 41 57Conservative 80 20No College Degree 50 48College Graduate 45 55White 54 45African- American 26 73Hispanic 39 58Under 55 46 52Over 55 51 49Married 55 44Single 40 58Men 55 44Women 42 56
8
Job Rating: Donald Trump
National - M&A
December 2018

Opinion: Donald TrumpTime Series
44
53
10
20
30
40
50
60
70Favorable Unfavorable
9National - M&A
December 2018

44
23 21
53
12
40
4
0
10
20
30
40
50
60
70
FAV. Very Smwt UNFAV. Smwt Very NOOPIN.
Fav. Unfav.
East 44 52Midwest 45 52South 45 51West 40 57Cont. Obama Pols. 12 86Change Direction 81 18Approve – Trump 88 9Disapprove – Trump 3 95Approve – GOP Majority 82 17Disapprove – GOP Majority 14 84Favorable – Trump 100 -Unfavorable– Trump - 100Vote Pres. 2016 – Clinton 8 89Vote Pres. 2016 – Trump 87 12Vote Cong. 2018 – GOP 84 15Vote Cong. 2018 – DEM 8 88Vote Cong. 2018 – UND 39 49Republican 82 15Democrat 13 85Independent 39 56Liberal 17 81Moderate 34 60Conservative 77 21No College Degree 45 51College Graduate 42 56White 50 48African- American 18 73Hispanic 37 58Under 55 41 54Over 55 48 50Married 52 46Single 33 61Men 50 47Women 38 58
10
Opinion: Donald Trump
National - M&A
December 2018
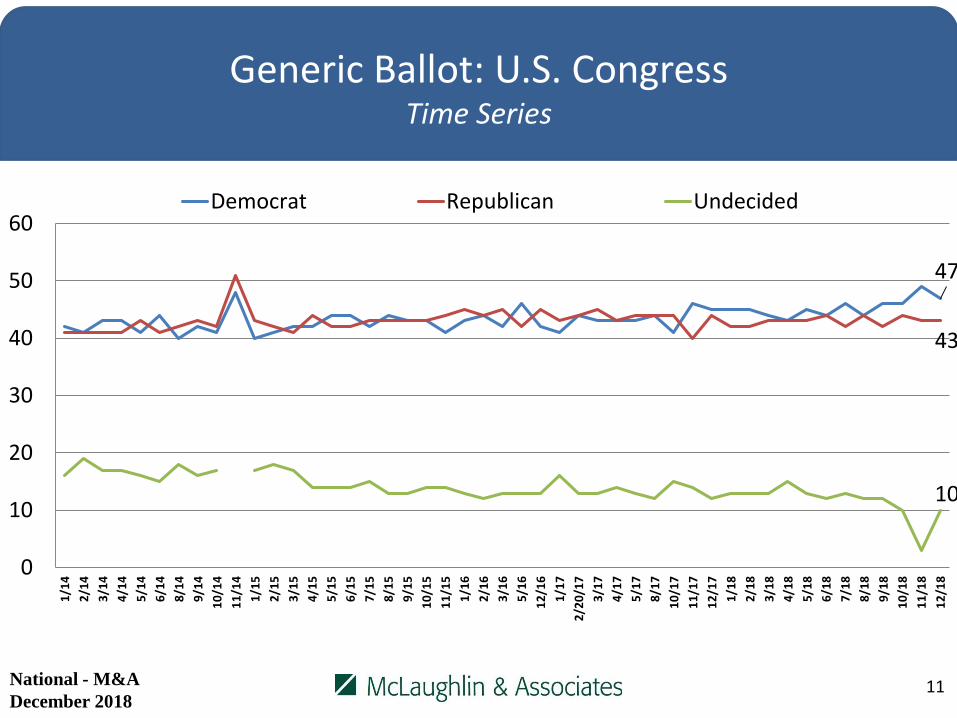
Generic Ballot: U.S. CongressTime Series
47
43
10
0
10
20
30
40
50
60
1/1
4
2/1
4
3/1
4
4/1
4
5/1
4
6/1
4
8/1
4
9/1
4
10
/14
11
/14
1/1
5
2/1
5
3/1
5
4/1
5
5/1
5
6/1
5
7/1
5
8/1
5
9/1
5
10
/15
11
/15
1/1
6
2/1
6
3/1
6
5/1
6
12
/16
1/1
7
2/2
0/1
7
3/1
7
4/1
7
5/1
7
8/1
7
10
/17
11
/17
12
/17
1/1
8
2/1
8
3/1
8
4/1
8
5/1
8
6/1
8
7/1
8
8/1
8
9/1
8
10
/18
11
/18
12
/18
Democrat Republican Undecided
11National - M&A
December 2018
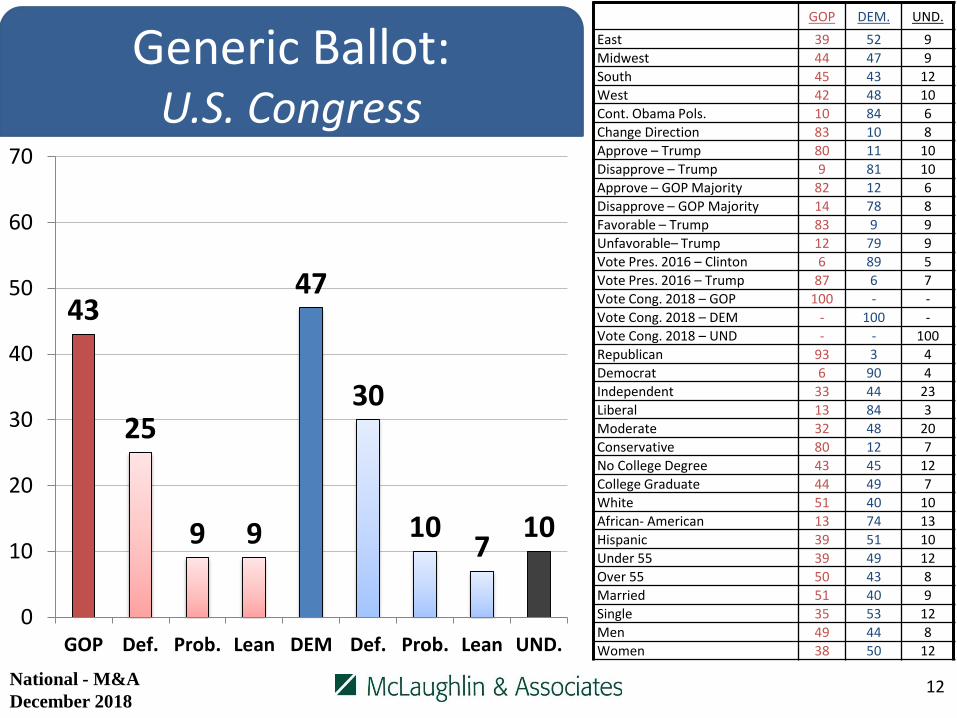
GOP DEM. UND.
East 39 52 9
Midwest 44 47 9
South 45 43 12
West 42 48 10
Cont. Obama Pols. 10 84 6
Change Direction 83 10 8
Approve – Trump 80 11 10
Disapprove – Trump 9 81 10
Approve – GOP Majority 82 12 6
Disapprove – GOP Majority 14 78 8
Favorable – Trump 83 9 9
Unfavorable– Trump 12 79 9
Vote Pres. 2016 – Clinton 6 89 5
Vote Pres. 2016 – Trump 87 6 7
Vote Cong. 2018 – GOP 100 - -
Vote Cong. 2018 – DEM - 100 -
Vote Cong. 2018 – UND - - 100
Republican 93 3 4
Democrat 6 90 4
Independent 33 44 23
Liberal 13 84 3
Moderate 32 48 20
Conservative 80 12 7
No College Degree 43 45 12
College Graduate 44 49 7
White 51 40 10
African- American 13 74 13
Hispanic 39 51 10
Under 55 39 49 12
Over 55 50 43 8
Married 51 40 9
Single 35 53 12
Men 49 44 8
Women 38 50 12
43
25
9 9
47
30
107
10
0
10
20
30
40
50
60
70
GOP Def. Prob. Lean DEM Def. Prob. Lean UND.
12
Generic Ballot: U.S. Congress
National - M&A
December 2018
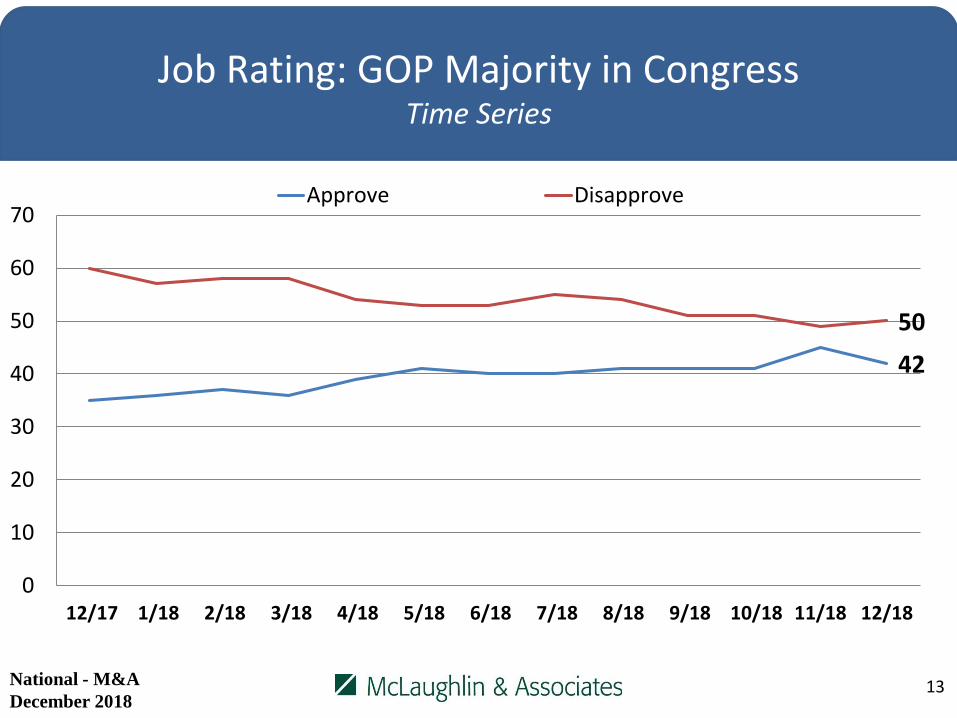
Job Rating: GOP Majority in CongressTime Series
42
50
0
10
20
30
40
50
60
70
12/17 1/18 2/18 3/18 4/18 5/18 6/18 7/18 8/18 9/18 10/18 11/18 12/18
Approve Disapprove
13National - M&A
December 2018
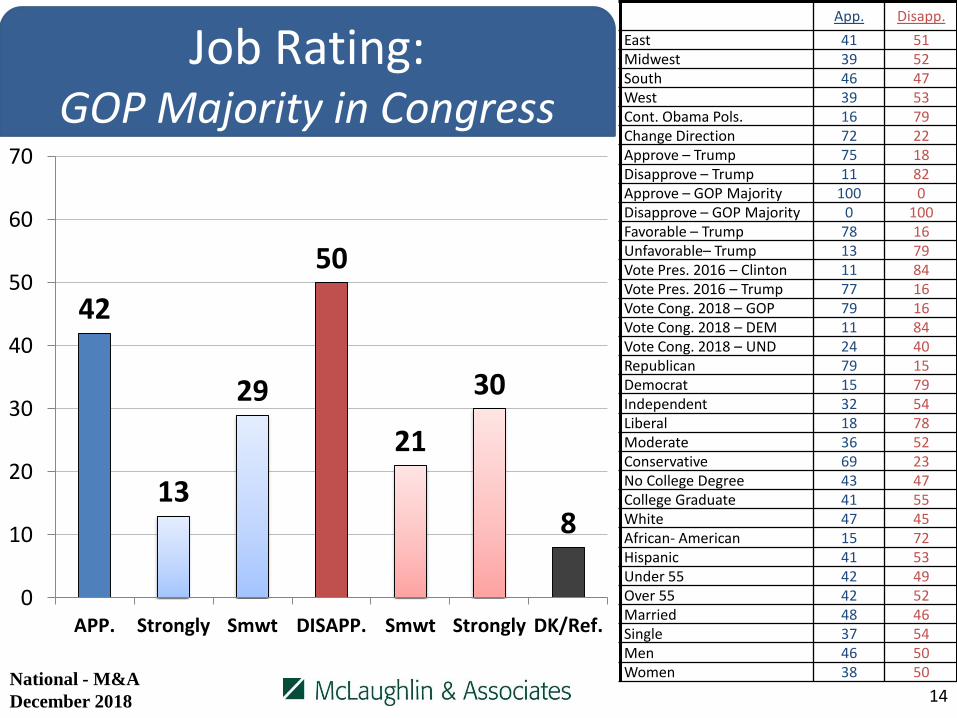
App. Disapp.
East 41 51Midwest 39 52South 46 47West 39 53Cont. Obama Pols. 16 79Change Direction 72 22Approve – Trump 75 18Disapprove – Trump 11 82Approve – GOP Majority 100 0Disapprove – GOP Majority 0 100Favorable – Trump 78 16Unfavorable– Trump 13 79Vote Pres. 2016 – Clinton 11 84Vote Pres. 2016 – Trump 77 16Vote Cong. 2018 – GOP 79 16Vote Cong. 2018 – DEM 11 84Vote Cong. 2018 – UND 24 40Republican 79 15Democrat 15 79Independent 32 54Liberal 18 78Moderate 36 52Conservative 69 23No College Degree 43 47College Graduate 41 55White 47 45African- American 15 72Hispanic 41 53Under 55 42 49Over 55 42 52Married 48 46Single 37 54Men 46 50Women 38 50
14
Job Rating: GOP Majority in Congress
42
13
29
50
21
30
8
0
10
20
30
40
50
60
70
APP. Strongly Smwt DISAPP. Smwt Strongly DK/Ref.
National - M&A
December 2018

Would you say you most favor a smaller government with fewer services or a larger government with many services?
Time Series
52
31
10
20
30
40
50
60
70
1/1
5
3/1
5
4/1
5
5/1
5
6/1
5
7/1
5
8/1
5
9/1
5
10
/15
11
/15
1/1
6
2/1
6
3/1
6
5/1
6
11
/16
12
/16
1/1
7
2/1
7
3/1
7
4/1
7
5/1
7
8/1
7
10
/17
11
/17
12
/17
1/1
8
2/1
8
3/1
8
4/1
8
5/1
8
6/1
8
7/1
8
8/1
8
9/1
8
10
/18
11
/18
12
/18
Smaller Larger
15National - M&A
December 2018
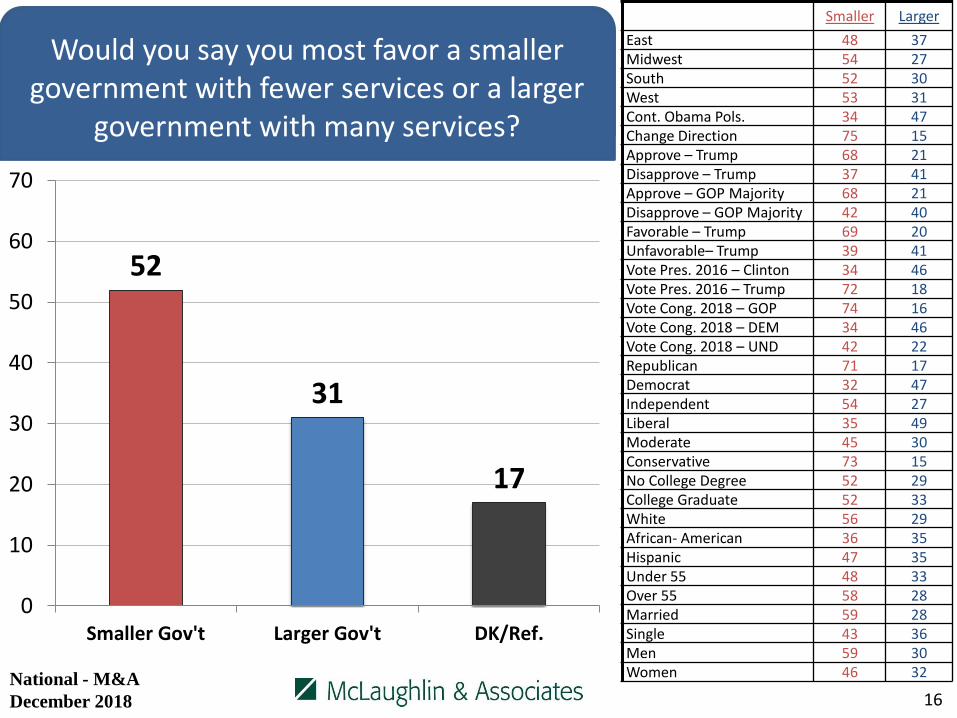
52
31
17
0
10
20
30
40
50
60
70
Smaller Gov't Larger Gov't DK/Ref.
Smaller Larger
East 48 37Midwest 54 27South 52 30West 53 31Cont. Obama Pols. 34 47Change Direction 75 15Approve – Trump 68 21Disapprove – Trump 37 41Approve – GOP Majority 68 21Disapprove – GOP Majority 42 40Favorable – Trump 69 20Unfavorable– Trump 39 41Vote Pres. 2016 – Clinton 34 46Vote Pres. 2016 – Trump 72 18Vote Cong. 2018 – GOP 74 16Vote Cong. 2018 – DEM 34 46Vote Cong. 2018 – UND 42 22Republican 71 17Democrat 32 47Independent 54 27Liberal 35 49Moderate 45 30Conservative 73 15No College Degree 52 29College Graduate 52 33White 56 29African- American 36 35Hispanic 47 35Under 55 48 33Over 55 58 28Married 59 28Single 43 36Men 59 30Women 46 32
16
Job Rating: Donald Trump
Would you say you most favor a smaller government with fewer services or a larger
government with many services?
National - M&A
December 2018
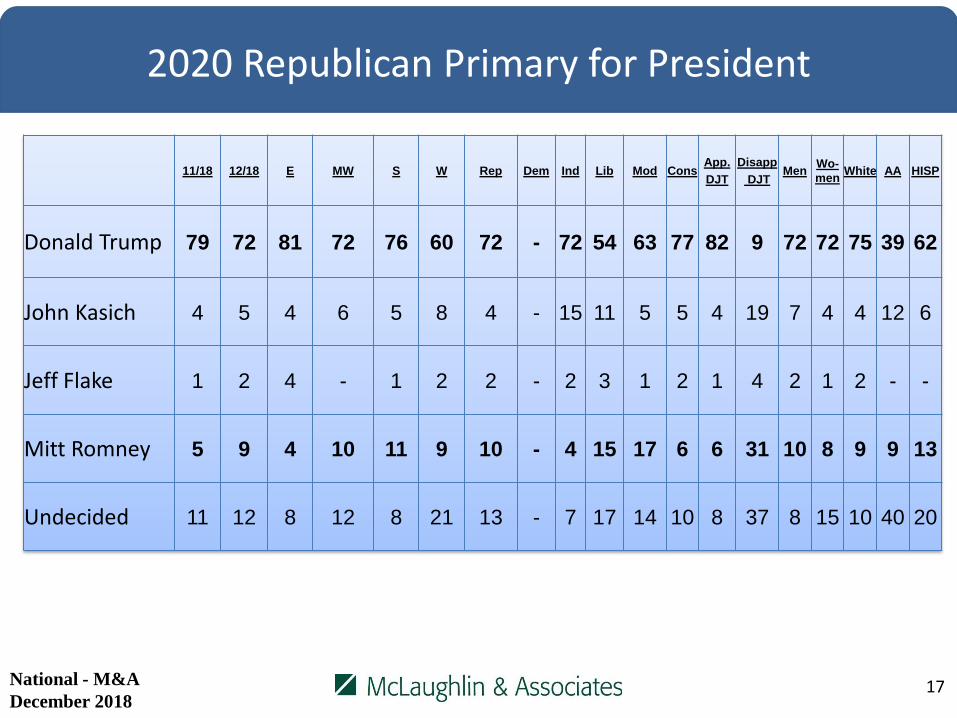
11/18 12/18 E MW S W Rep Dem Ind Lib Mod ConsApp.
DJT
Disapp
DJTMen
Wo-
menWhite AA HISP
Donald Trump 79 72 81 72 76 60 72 - 72 54 63 77 82 9 72 72 75 39 62
John Kasich 4 5 4 6 5 8 4 - 15 11 5 5 4 19 7 4 4 12 6
Jeff Flake 1 2 4 - 1 2 2 - 2 3 1 2 1 4 2 1 2 - -
Mitt Romney 5 9 4 10 11 9 10 - 4 15 17 6 6 31 10 8 9 9 13
Undecided 11 12 8 12 8 21 13 - 7 17 14 10 8 37 8 15 10 40 20
17
2020 Republican Primary for President
National - M&A
December 2018

11/18 12/18 E MW S W Rep Dem Ind Lib Mod ConsApp.
DJT
Disapp.
DJTMen
Wo-
menWhite AA HISP
Joe Biden 19 17 13 23 17 15 - 16 22 15 21 16 14 18 17 17 19 21 9
Michelle Obama 17 16 13 14 22 12 - 20 4 15 18 18 12 17 10 21 10 27 24
Bernie Sanders 16 18 23 15 15 20 - 16 22 20 13 19 15 18 21 15 21 12 13
Hillary Clinton 8 9 9 4 12 9 - 11 5 9 10 8 10 9 10 9 7 13 16
Kamala Harris 5 3 3 2 1 9 - 4 1 4 3 - 7 3 4 3 5 3 -
Elizabeth Warren 4 4 6 4 2 6 - 4 5 6 2 4 1 5 3 5 7 - 2
Oprah Winfrey 4 3 2 4 4 3 - 4 1 2 5 6 5 3 1 5 3 5 2
Beto O’Rourke n/a 11 8 12 11 10 - 10 14 13 10 - 4 12 10 11 10 6 14
Cory Booker 3 2 5 3 0 2 - 2 4 3 1 - - 3 4 1 3 2 -
Michael Bloomberg
2 2 4 2 1 1 - 1 4 1 0 8 3 1 2 1 2 1 2
Mark Zuckerberg 1 0 1 1 - - - 1 - - 1 2 2 - 1 - 1 - -
18
2020 Democratic Primary for President
National - M&A
December 2018

11/18 12/18 E MW S W Rep Dem Ind Lib Mod ConsApp.
DJT
Disapp.
DJTMen
Wo-
menWhite AA HISP
Andrew Cuomo 1 -- -- -- -- -- -- -- -- -- -- -- -- -- -- -- -- -- --
Deval Patrick 1 1 1 0 1 0 0 0 1 1 0 1 0 1 1 1 1 0 1
Kirsten Gillibrand 1 1 1 - 1 1 - 0 1 1 - 2 - 1 1 0 1 - 1
Eric Holder 1 1 1 - 1 - - 1 - 1 0 - 1 0 1 - 1 - 1
Tim Kaine 1 0 - - - 1 - - 1 - 1 - - 0 1 - 0 - -
John Hicken Looper
1 1 1 - - 2 - 1 - 1 - - 1 0 1 0 1 - 1
Bill De Blasio 0.3 0 1 - 0 - - 0 - 1 - - 1 0 0 0 0 - 1
Howard Schultz 0.1 0 1 - - 1 - 0 - 1 - - - 0 1 - - - 1
Amy Klobucher N/A 1 - 2 - - - 0 1 0 1 - 1 0 0 1 1 - -
Michael Avenatti 0.4 -- -- -- -- -- -- -- -- -- -- -- -- -- -- -- -- -- --
Undecided 16 11 10 13 11 8 - 9 14 7 15 18 22 8 12 9 10 11 11
19
2020 Democratic Primary for President Cont.
National - M&A
December 2018

Part Two –Issue Analysis
20

21
Most Important Issue3/17 4/17 5/17 8/17 10/17 11/17 12/17 1/18 2/18 3/18 4/18 5/18 6/18 8/18 9/18 10/18 12/18 Rep Dem Ind Lib Mod Cons
App.
DJT
Disapp
DJTMen
Wo-
Men
ECONOMIC 40 38 38 37 40 36 37 38 37 36 34 36 35 35 35 34 33 34 32 34 33 36 31 36 31 37 30
Improving the
Economy14 13 13 14 13 11 14 12 12 14 12 12 11 13 13 12 12 13 14 11 14 14 9 13 12 14 11
Jobs/Unemployment 12 11 12 8 9 11 7 8 9 8 8 9 9 8 8 7 7 5 8 8 9 8 4 7 7 8 6
Wasteful Gov’t
Spending8 6 6 7 8 7 8 9 7 7 6 7 8 7 8 7 8 10 7 7 6 8 10 10 6 8 8
Reduce Budget/Deficit 5 5 5 6 6 5 6 6 6 5 6 5 6 5 5 5 4 4 3 6 3 4 6 4 4 5 4
Hold Line/Taxes 2 3 2 2 3 2 2 3 2 2 2 2 2 2 2 2 2 2 2 3 1 2 2 2 1 2 2
SOCIAL 29 24 25 29 27 29 29 28 27 30 29 27 30 27 28 30 28 22 36 26 35 30 20 19 37 24 31
Protect Medicare 14 12 11 13 14 16 12 13 12 13 15 11 16 11 12 14 13 9 17 13 14 16 9 9 17 13 13
Reform Healthcare 7 6 7 10 9 9 11 9 10 11 9 10 9 10 9 9 9 8 10 7 10 9 7 6 11 8 9
Improving Education 8 6 7 6 5 5 6 7 6 6 6 6 6 5 7 7 7 5 9 6 10 5 4 4 9 4 9
SECURITY 17 24 22 19 18 20 18 18 18 18 19 19 17 19 18 19 19 31 9 18 7 17 32 33 6 19 20
Fix Immigration 3 6 4 4 4 5 5 4 6 7 6 7 6 9 7 8 10 19 5 8 3 9 18 18 3 10 10
Nat’l Sec./Terror 9 11 11 9 8 10 9 9 10 9 9 9 8 7 9 7 6 9 3 8 2 5 11 12 1 6 6
Defeat/Destroy ISIS 5 8 8 5 6 6 4 5 2 2 5 4 3 3 2 3 3 4 1 3 2 3 3 3 2 2 3
HONESTY/
INTEGRITY/D.C.11 10 13 13 12 13 12 14 17 14 15 16 15 17 16 14 16 10 19 17 21 13 14 10 22 18 14
D.K./REFUSED 3 4 3 4 3 2 3 2 2 2 3 2 3 3 4 3 4 4 4 4 4 4 4 2 4 2 5
National - M&A
December 2018
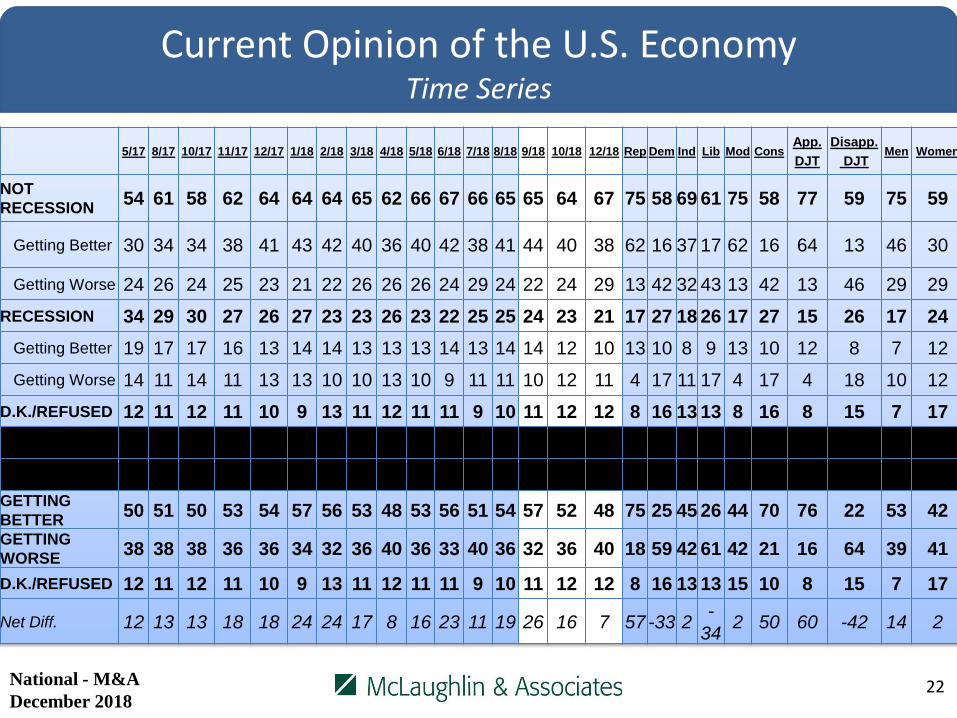
5/17 8/17 10/17 11/17 12/17 1/18 2/18 3/18 4/18 5/18 6/18 7/18 8/18 9/18 10/18 12/18 Rep Dem Ind Lib Mod ConsApp.
DJT
Disapp.
DJTMen Women
NOT
RECESSION54 61 58 62 64 64 64 65 62 66 67 66 65 65 64 67 75 58 69 61 75 58 77 59 75 59
Getting Better 30 34 34 38 41 43 42 40 36 40 42 38 41 44 40 38 62 16 37 17 62 16 64 13 46 30
Getting Worse 24 26 24 25 23 21 22 26 26 26 24 29 24 22 24 29 13 42 32 43 13 42 13 46 29 29
RECESSION 34 29 30 27 26 27 23 23 26 23 22 25 25 24 23 21 17 27 18 26 17 27 15 26 17 24
Getting Better 19 17 17 16 13 14 14 13 13 13 14 13 14 14 12 10 13 10 8 9 13 10 12 8 7 12
Getting Worse 14 11 14 11 13 13 10 10 13 10 9 11 11 10 12 11 4 17 11 17 4 17 4 18 10 12
D.K./REFUSED 12 11 12 11 10 9 13 11 12 11 11 9 10 11 12 12 8 16 13 13 8 16 8 15 7 17
GETTING
BETTER50 51 50 53 54 57 56 53 48 53 56 51 54 57 52 48 75 25 45 26 44 70 76 22 53 42
GETTING
WORSE38 38 38 36 36 34 32 36 40 36 33 40 36 32 36 40 18 59 42 61 42 21 16 64 39 41
D.K./REFUSED 12 11 12 11 10 9 13 11 12 11 11 9 10 11 12 12 8 16 13 13 15 10 8 15 7 17
Net Diff. 12 13 13 18 18 24 24 17 8 16 23 11 19 26 16 7 57 -33 2-
342 50 60 -42 14 2
22
Current Opinion of the U.S. EconomyTime Series
National - M&A
December 2018

Up Down Same
East 19 19 40
Midwest 14 22 39
South 21 23 38
West 19 17 45
Cont. Obama Pols. 29 11 39
Change Direction 8 33 42
Approve – Trump 11 34 38
Disapprove – Trump 26 9 43
Approve – GOP Majority 14 31 40
Disapprove – GOP Majority 24 14 41
Favorable – Trump 11 34 38
Unfavorable– Trump 25 10 43
Vote Pres. 2016 – Clinton 28 10 41
Vote Pres. 2016 – Trump 9 35 37
Vote Cong. 2018 – GOP 10 35 38
Vote Cong. 2018 – DEM 28 10 42
Vote Cong. 2018 – UND 15 10 43
Republican 12 34 35
Democrat 28 9 43
Independent 15 20 42
Liberal 33 9 40
Moderate 15 17 43
Conservative 9 35 38
No College Degree 17 21 41
College Graduate 20 21 39
White 15 21 42
African- American 29 16 36
Hispanic 28 21 35
Under 55 22 20 38
Over 55 13 22 44
Married 19 27 40
Single 21 16 37
Men 18 26 41
Women 19 16 39
19 21
40
0
10
20
30
40
50
60
70
Up Down Same
23
As a result of President Trump and Congress’ tax cut plan, did your taxes go up, go down, or remain about the same?
National - M&A
December 2018
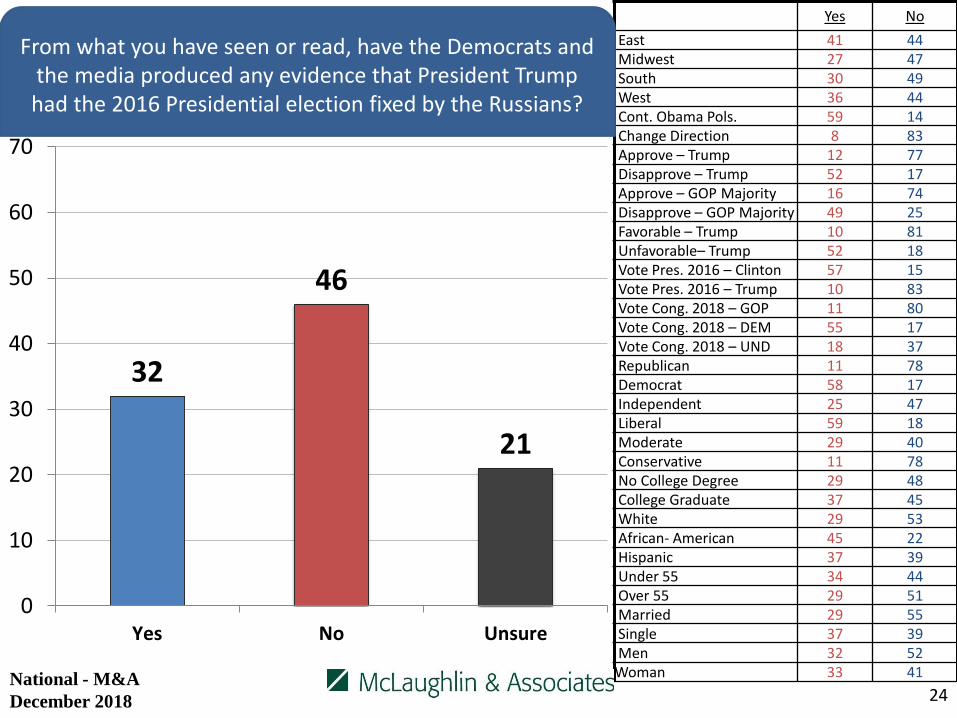
32
46
21
0
10
20
30
40
50
60
70
Yes No Unsure
Yes No
East 41 44Midwest 27 47South 30 49West 36 44Cont. Obama Pols. 59 14Change Direction 8 83Approve – Trump 12 77Disapprove – Trump 52 17Approve – GOP Majority 16 74Disapprove – GOP Majority 49 25Favorable – Trump 10 81Unfavorable– Trump 52 18Vote Pres. 2016 – Clinton 57 15Vote Pres. 2016 – Trump 10 83Vote Cong. 2018 – GOP 11 80Vote Cong. 2018 – DEM 55 17Vote Cong. 2018 – UND 18 37Republican 11 78Democrat 58 17Independent 25 47Liberal 59 18Moderate 29 40Conservative 11 78No College Degree 29 48College Graduate 37 45White 29 53African- American 45 22Hispanic 37 39Under 55 34 44Over 55 29 51Married 29 55Single 37 39Men 32 52
Woman 33 41
From what you have seen or read, have the Democrats and the media produced any evidence that President Trump had the 2016 Presidential election fixed by the Russians?
24National - M&A
December 2018

53
28
20
0
10
20
30
40
50
60
70
Yes No Unsure
Yes No
East 52 29Midwest 53 25South 56 25West 47 34Cont. Obama Pols. 28 51Change Direction 84 5Approve – Trump 80 8Disapprove – Trump 27 47Approve – GOP Majority 81 9Disapprove – GOP Majority 33 45Favorable – Trump 82 7Unfavorable– Trump 30 46Vote Pres. 2016 – Clinton 29 48Vote Pres. 2016 – Trump 82 7Vote Cong. 2018 – GOP 84 7Vote Cong. 2018 – DEM 28 47Vote Cong. 2018 – UND 34 25Republican 82 8Democrat 29 47Independent 48 28Liberal 32 47Moderate 46 30Conservative 78 9No College Degree 54 25College Graduate 51 32White 57 26African- American 37 32Hispanic 48 30Under 55 49 29Over 55 59 26Married 58 26Single 46 21Men 61 26
Woman 46 30
Is the Democrats campaign to impeach President Trump a partisan political ploy to stop President Trump?
25National - M&A
December 2018

Part Three –Social Media Usage
26

Do you follow Donald Trump on Twitter, Instagram and/or have you like his page on Facebook, meaning his posts show up on your newsfeed?
- Time Series-
25
15
12
8
0
5
10
15
20
25
30
35
4/17 5/17 8/17 10/17 11/17 12/17 1/18 2/18 3/18 4/18 5/18 6/18 7/18 8/18 9/18 10/18 11/18 12/18
TOTAL Follow/Twitter Like/Facebook Follow/Instagram
27National - M&A
December 2018

25
1512
8
75
0
10
20
30
40
50
60
70
80
FOLLOW Facebook Twitter Instagram NONE
Follow None
East 28 73Midwest 21 79South 27 73West 25 75Cont. Obama Pols. 22 78Change Direction 32 68Approve – Trump 38 62Disapprove – Trump 13 77Approve – GOP Majority 41 59Disapprove – GOP Majority 15 86Favorable – Trump 40 60Unfavorable– Trump 14 86Vote Pres. 2016 – Clinton 16 84Vote Pres. 2016 – Trump 37 63Vote Cong. 2018 – GOP 39 61Vote Cong. 2018 – DEM 17 83Vote Cong. 2018 – UND 8 92
Republican 40 60Democrat 18 82Independent 19 82Liberal 26 74Moderate 17 83Conservative 33 67No College Degree 23 77College Graduate 29 71White 24 76African- American 20 80Hispanic 33 67Under 55 31 69Over 55 16 84Married 27 73Single 25 75Men 28 72Women 23 77
28
Do you follow Donald Trump on Twitter, Instagram and/or have you like his page on Facebook, meaning
his posts show up on your newsfeed?
National - M&A
October 2018

Total Rep Dem Ind Lib Mod ConsApp.
DJT
Disapp.
DJT
Under
55Over 55 Men
Wo-
men
Facebook 80 82 79 78 82 82 77 80 80 83 75 78 82
Instagram 39 35 44 37 46 39 32 36 42 52 16 32 45
Twitter 35 33 35 36 43 31 31 33 37 44 19 37 34
Pinterest 31 33 30 28 31 28 33 30 32 35 22 17 43
Google+ 26 25 27 27 30 26 23 27 26 31 19 26 27
Linked-In 26 25 24 30 28 26 25 26 27 27 24 30 23
Snapchat 23 22 23 22 24 24 19 21 24 34 2 16 28
WhatsApp 11 12 12 10 15 10 9 12 11 16 4 12 11
Reddit 10 9 10 12 14 9 8 10 11 15 3 11 9
None 8 8 6 10 4 8 12 9 7 5 14 10 7
Tumblr 8 6 10 8 14 5 5 6 10 12 2 7 9
Other 3 2 4 3 4 3 2 2 4 3 3 4 3
Periscope 3 2 3 3 4 2 2 3 3 4 1 3 2
29
From the following list, which social media networks do you use?
National - M&A
December 2018

Party Total Age Total Race Total
Republican 33 18-29 20 White 71
Democrat 36 30-40 19 African American 12
Independent 31 41-55 25 Hispanic 11
Ideology 56-65 20 Asian 4
Liberal 32 Over 65 17 Gender
Moderate 33 Male 47
Conservative 35 Female 53
30
2020 Likely General Election Voter Profile
National - M&A
December 2018

New York Office566 South Route 303Blauvelt, NY 10913
845-365-2000
D.C./Virginia Office919 Prince Street
Alexandria, VA 22314703-518-4445
www.mclaughlinonline.com
31