national transit database. national transit database. federal transit administration u.s. department...
TRANSCRIPT

NTDNational Transit Database
Federal Transit Administration U.S. Department of Transportation
Office of Budget and Policy
2016 National Transit Summary and Trends
October 2017


National Transit Summaries & Trends 2016
Table of Contents — i
Table of Contents
Table of Exhibits ..............................................................................................................iv
Introduction ..................................................................................................................... 7
General Information ..................................................................................................... 7
What is the National Transit Database (NTD)? .................................................................................... 7
Who reports data to the NTD? .............................................................................................................. 7
What are the modes of transit? ............................................................................................................. 8
What is an Urbanized Area (UZA)? .................................................................................................... 10
What is a Rural Area? ......................................................................................................................... 10
What data does the NTD collect? ....................................................................................................... 11
What is Safety and Security reporting?............................................................................................... 11
Rounding and Inflation ............................................................................................... 12
Web Information ......................................................................................................... 12
Transit Trends in Service Operated, Service Consumed, and Costs ............................ 13
Report Year 2016 Service and Cost Ratios ............................................................... 15
Transit Service Providers: Organization Type ............................................................ 17
Transit Funding ............................................................................................................. 18
The Federal Transit Administration’s Annual Budget ................................................. 18
Operating Expense Funding Sources ........................................................................ 19
Capital Expenditure Funding Sources ........................................................................ 20
Fare Box Recovery .................................................................................................... 21
Modal Differences ......................................................................................................... 22
Service Size ............................................................................................................... 22
Service Data by Factor .............................................................................................. 23
National Transit Summaries & Trends 2016
ii — Table of Contents
Fixed Guideway and High Intensity Busway ................................................................. 25
Fixed Guideway Route Miles from 2007 to 2016 ....................................................... 25
Fixed Guideway Concentration .................................................................................. 26
Safety and Security ....................................................................................................... 28
2016 NTD Safety Statistics by Mode ......................................................................... 30
Non-Rail Safety Events .............................................................................................. 31
Rail Safety Events ...................................................................................................... 31
Fatalities..................................................................................................................... 32
Service Consumed ........................................................................................................ 33
Population and Transit ............................................................................................... 33
Trips per Capita ......................................................................................................... 34
Operating Cost per Passenger Trip ........................................................................... 34
Operating Cost per Revenue Hour ............................................................................. 35
Event Rate Comparison ............................................................................................. 36
Fixed Guideway Comparison ..................................................................................... 36
National Ridership Trends: A Five-Year Snapshot ........................................................ 37
Ridership by Mode and Urbanized Area .................................................................... 38
Gas Prices ........................................................................................................................................... 40
Population ........................................................................................................................................... 41
Funding Sources ........................................................................................................... 41
Operating and Capital Expenses ............................................................................... 41
5307 and 5311 ........................................................................................................... 45
Alternative Fuels ........................................................................................................... 46
Natural Gas and Propane .......................................................................................... 47
Alternative Fuels as a Whole ..................................................................................... 48
National Transit Summaries & Trends 2016
Table of Contents — iii
Traditional Energy Sources ........................................................................................ 49
Unique Transit Modes ................................................................................................... 50
Aerial Tramway .......................................................................................................... 51
Alaska Railroad .......................................................................................................... 52
Cable Car ................................................................................................................... 53
Inclined Plane ............................................................................................................ 54
Monorail/Automated Guideway .................................................................................. 56
Públicos ..................................................................................................................... 57

National Transit Summaries & Trends 2016
iv — Table of Exhibits
Table of Exhibits
Exhibit 1: Operating Expenses and Vehicle Revenue Hours: Time Series.................... 13
Exhibit 2: Operating Expenses and Unlinked Passenger Trips: Time Series ................ 14
Exhibit 3: Cost per Vehicle Revenue Hour .................................................................... 15
Exhibit 4: 2016 Unlinked Passenger Trips per Vehicle Revenue Hour .......................... 15
Exhibit 5: 2016 Cost per Unlinked Passenger Trip ........................................................ 16
Exhibit 6: 2016 Cost per Passenger Mile ...................................................................... 17
Exhibit 7: Urban Transit Providers by Type ................................................................... 17
Exhibit 8: 2016 Transit Provider Organization Types .................................................... 18
Exhibit 9: 2016 Transportation as a Percentage of the Total Federal Budget ............... 19
Exhibit 10: 2016 Funding Sources for Transit Operations ............................................. 19
Exhibit 11: 2016 Funding Sources for Capital Expenses ............................................... 20
Exhibit 12: 2016 Fares as a Proportion of Operating Costs .......................................... 21
Exhibit 13: 2016 Service Provided ................................................................................ 22
Exhibit 14: 2016 Service Consumed ............................................................................. 23
Exhibit 15: 2016 Passenger Miles per Unlinked Passenger Trip (Average Trip Length in Miles) ............................................................................................................................. 23
Exhibit 16: 2016 Unlinked Passenger Trips per Vehicle Revenue Hour ........................ 24
Exhibit 17: 2016 Passenger Miles per Vehicle Mile (Average Number of Passengers per Vehicle) ......................................................................................................................... 25
Exhibit 18: 2007 FG Route Miles ................................................................................... 26
Exhibit 19: 2017 FG Route Miles ................................................................................... 26
Exhibit 20: Metropolitan Area Density ........................................................................... 27
Exhibit 21: High Density City Rail Transit Start Dates ................................................... 27
Exhibit 22: UZAs with Most Directional Route Miles ...................................................... 28

National Transit Summaries & Trends 2016
Table of Exhibits — v
Exhibit 23: 2016 NTD Safety and Security Major Event Rates by Mode ....................... 30
Exhibit 24: Non-Rail Event Categories .......................................................................... 31
Exhibit 25: Rail Events by Mode .................................................................................... 31
Exhibit 26: Fatalities by Person Type ............................................................................ 32
Exhibit 27:UZA Count, Population, and Total Passenger Miles Traveled ...................... 33
Exhibit 28: 2016 Ridership Density (Passenger Trips per Capita) ................................. 34
Exhibit 29: Operating Cost per Passenger Trip ............................................................. 35
Exhibit 30: Operating Cost per Vehicle Revenue Hour.................................................. 35
Exhibit 31: Total S&S Event Rate Comparison ............................................................. 36
Exhibit 32: Rail, Bus, and Other Fixed Guideway Directional Miles .............................. 36
Exhibit 33: Ridership Changes by State (Regions VIII and X) ....................................... 37
Exhibit 34: Ridership Decreases (Thousands) by Mode: 2012 to 2016 ......................... 38
Exhibit 35: UZA Ridership Trend Against Modes Operated .......................................... 39
Exhibit 36: UZA Ridership by Type of Mode, 2012 vs. 2016 ......................................... 39
Exhibit 37: Ridership and Gasoline Price, 2012 to 2016 ............................................... 40
Exhibit 38: Population vs. Unlinked Passenger Trips Change for Selected UZAs, 2012 to 2016 .............................................................................................................................. 41
Exhibit 39: Federal Funds - Total Operating Expenses ................................................. 42
Exhibit 40: Total Operating Expenses by Funding Source, Top 50 vs. All Others ......... 42
Exhibit 41: Total Federal Operating Expenses for Selected UZAs – Time Series ......... 43
Exhibit 42: Federal Funds - Total Capital Expenses ..................................................... 43
Exhibit 43: 2016 Capital Funding by Source, Top 50 vs. All Others .............................. 44
Exhibit 44: Total Federal Capital Expenses for Selected UZAs – Time Series .............. 45
Exhibit 45: 2016 Urbanized Area Formula Program (5307) ........................................... 45
Exhibit 46: 2016 Rural Area Program (5311) ................................................................ 46

National Transit Summaries & Trends 2016
vi — Table of Exhibits
Exhibit 47: Natural Gas Consumption ........................................................................... 47
Exhibit 48: Propane Consumption ................................................................................. 48
Exhibit 49: Alternative and Other Fuel Consumption ..................................................... 48
Exhibit 50: Traditional Fuel Consumption ...................................................................... 49
Exhibit 51: 2016 PMT by Mode ..................................................................................... 50
Exhibit 52: Portland Aerial Tram .................................................................................... 51
Exhibit 53: Aerial Tramway PMT ................................................................................... 51
Exhibit 54: Alaska Railroad Corporation ........................................................................ 52
Exhibit 55: Alaska Railroad PMT ................................................................................... 52
Exhibit 56: San Francisco Cable Car............................................................................. 53
Exhibit 57: Cable Car PMT ............................................................................................ 54
Exhibit 58: Monongahela Incline ................................................................................... 54
Exhibit 59: Inclined Plane PMT ..................................................................................... 55
Exhibit 60: Louis Brennan's Gyrocar and Miami-Dade Metromover .............................. 56
Exhibit 61: Unique Modes PMT ..................................................................................... 56
Exhibit 62: Público PMT ................................................................................................ 57

National Transit Summaries & Trends 2016
Transit Funding — 7
Introduction
General Information
Welcome to the National Transit Summaries and Trends (NTST), one of the Federal Transit Administration’s (FTA) National Transit Database (NTD) Annual Data Products. The goal of the NTST is to present and summarize transit data in an easy-to-read format and to provide an overview of public transit in the United States. This 2016 NTST discusses data from 2007 to 2016. Except for the Rural transit exhibits presented and where explicitly noted, all data included in the NTST are from agencies operating within an Urbanized Area (UZA).
What is the National Transit Database (NTD)?
The National Transit Database (NTD) is the primary source for information and statistics on transit systems in the United States. Congress requires the NTD to collect financial and service information annually from public transportation agencies that benefit from FTA grants. The NTD also requires larger urban transit providers (Full Reporters) to submit monthly operating and safety data. Each year, the FTA uses NTD data to apportion over $8 billion to urbanized areas (UZAs) and States under funding programs such as §5307 (Urbanized Area Formula grants), §5311 (Formula Grants for Rural Areas), §5329 (State Safety Oversight grants), and §5337 (State of Good Repair grants).
Who reports data to the NTD?
§5307 Program Recipients
Recipients or beneficiaries of the FTA's Urbanized Area Formula Program (§5307) must file annual reports, monthly ridership, and safety and security reports with the NTD. These reporters are also called Urban Reporters. Beginning in FY 2011, transit agencies with 30 or fewer vehicles became eligible for reduced reporting requirements, including reporting exemptions for passenger miles, mode-specific capital and operations costs, employee counts, maintenance performance, energy consumption, monthly ridership, and safety data. This is referred to as the Small Systems Waiver and agencies receiving automatic Small Systems Waivers are referred to as Reduced Reporters.
§5311 Program Recipients
Recipients or beneficiaries of the FTA's Rural Area Formula Program (§5311) must file annual reports to the rural module of the NTD. These recipients are also called Rural

National Transit Summaries & Trends 2016
8 — Transit Funding
Reporters. States and Indian Tribes report directly to the NTD. States file reports on behalf of their subrecipient rural transit agencies, who do not report directly to the NTD.
Because of the difference in reporting requirements for agencies that report as Small Systems (Reduced Reporters), certain exhibits within this document exclude their data for the entire ten-year period presented. In these cases, exhibits are labeled with a footnote. Unless otherwise noted, all exhibits in the NTST include data from all urban reporters.
Voluntary NTD Reporters
The FTA accepts voluntary NTD reports from other transit systems, both public and private, that serve both urbanized and non-urbanized areas. Voluntary reporters must provide public transportation services and meet the same reporting obligations as mandatory reporters.
Some agencies that do not operate transit service report to the NTD. Build Reporters are agencies that benefit from Federal funding and are in the process of building transit infrastructure but do not yet operate service. Planning Reporters do not operate transit service but instead receive Federal funding and distribute the funds among transit operators in their area.
What are the modes of transit?
Public transit includes buses, trains, ferryboats, paratransit, and much more. Certain transportation services are specifically excluded, such as intercity bus service, intercity rail service, intra-facility transport (airport people movers), and sightseeing rides.
Different types of vehicles, technologies, and operational characteristics distinguish the modes of transit. FTA identifies the following modes of public transit:
• Aerial Tramway (TR) is an electric system of aerial cables powered by centralized motors with suspended powerless passenger vehicles.
• Alaska Railroad (AR) is a public transportation system that shares vehicles and facilities with freight rail operations.
• Bus (MB) includes a variety of rubber-tired passenger vehicles operating on fixed routes and schedules over roadways.
• Bus Rapid Transit (RB) is a fixed-route bus mode that operates frequent service (short headways), has at least 50 percent of its route on exclusive guideways, and includes features that emulate rail transit modes.
National Transit Summaries & Trends 2016
Transit Funding — 9
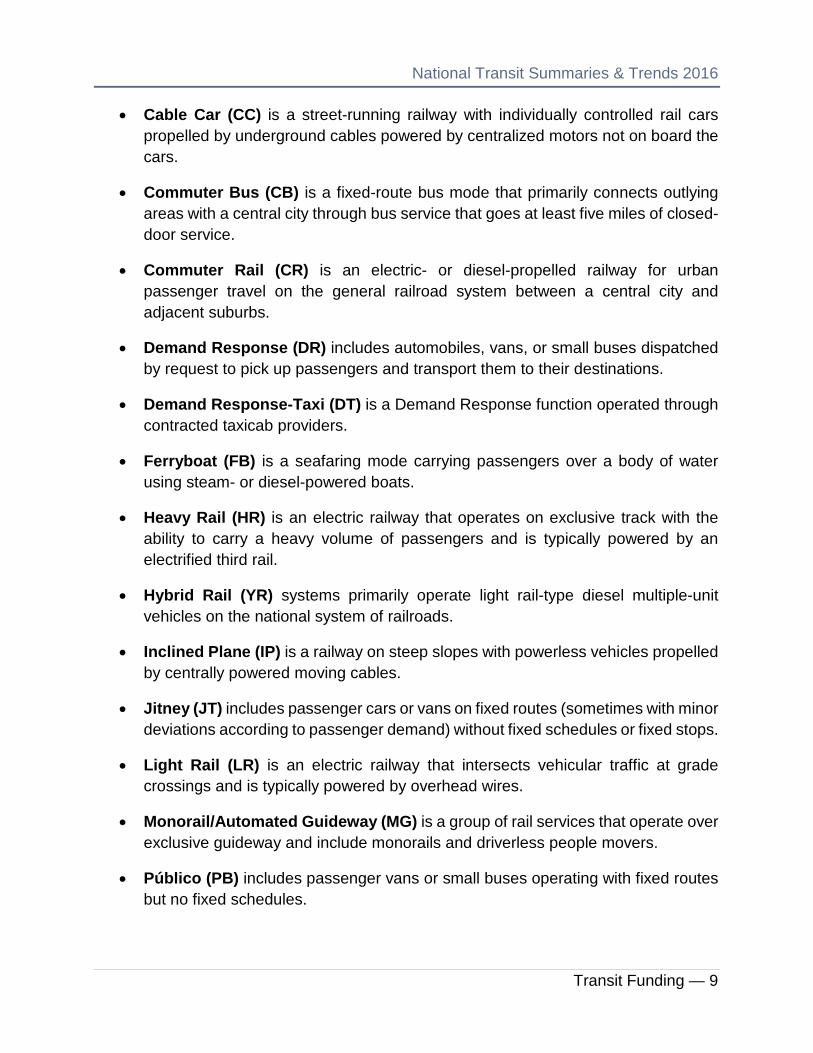
• Cable Car (CC) is a street-running railway with individually controlled rail cars propelled by underground cables powered by centralized motors not on board the cars.
• Commuter Bus (CB) is a fixed-route bus mode that primarily connects outlying areas with a central city through bus service that goes at least five miles of closed-door service.
• Commuter Rail (CR) is an electric- or diesel-propelled railway for urban passenger travel on the general railroad system between a central city and adjacent suburbs.
• Demand Response (DR) includes automobiles, vans, or small buses dispatched by request to pick up passengers and transport them to their destinations.
• Demand Response-Taxi (DT) is a Demand Response function operated through contracted taxicab providers.
• Ferryboat (FB) is a seafaring mode carrying passengers over a body of water using steam- or diesel-powered boats.
• Heavy Rail (HR) is an electric railway that operates on exclusive track with the ability to carry a heavy volume of passengers and is typically powered by an electrified third rail.
• Hybrid Rail (YR) systems primarily operate light rail-type diesel multiple-unit vehicles on the national system of railroads.
• Inclined Plane (IP) is a railway on steep slopes with powerless vehicles propelled by centrally powered moving cables.
• Jitney (JT) includes passenger cars or vans on fixed routes (sometimes with minor deviations according to passenger demand) without fixed schedules or fixed stops.
• Light Rail (LR) is an electric railway that intersects vehicular traffic at grade crossings and is typically powered by overhead wires.
• Monorail/Automated Guideway (MG) is a group of rail services that operate over exclusive guideway and include monorails and driverless people movers.
• Público (PB) includes passenger vans or small buses operating with fixed routes but no fixed schedules.

National Transit Summaries & Trends 2016
10 — Transit Funding
• Streetcar Rail (SR) is a rail transit system powered by overhead catenaries that operates mostly on streets in mixed traffic.
• Trolleybus (TB) is an electric rubber-tire bus system powered by overhead catenaries that operates on streets in mixed traffic.
• Vanpool (VP) includes vans, small buses, and other vehicles operating as a ride-sharing arrangement, transporting at least seven people directly between their home area and a regular destination.
What is an Urbanized Area (UZA)?
The U.S. Census Bureau defines urbanized areas based on incorporated places (e.g., cities, towns, villages) and their adjacent areas. The U.S. Census Bureau considers a UZA to be a densely settled core of census tracts and/or census blocks that meet minimum population density requirements and encompasses at least 50,000 people or more. There are 498 UZAs according to the 2010 U.S. census, and while UZAs make up 2.5 percent of United States land area, the populations of UZAs make up 71.5 percent of United States population.
The FTA bases UZA designations on the most recent census (currently the 2010 census). The NTD reporting system uses a unique number for each UZA that represents its numerical ranking by population. For the purpose of transit grants, the FTA also designates the Virgin Islands, Lake Tahoe, and certain areas in Puerto Rico as urbanized areas.
In the NTD, transit providers indicate the primary UZA of service operations as their “primary UZA” along with any secondary UZAs they serve. For analysis purposes, the NTST groups UZAs into the following categories:
• UZAs over 1 million: population of more than 1 million (42 urbanized areas, 309 agencies, or 35.7 percent of all agencies reporting).
• UZAs under 1 million: population of more than 50,000 and less than 1 million (456 urbanized areas, 557 agencies, or 64.3 percent of urban agencies reporting).
What is a Rural Area?
Rural areas are all areas not included in a UZA. The FTA includes Urban Clusters (2,500–50,000 population) in rural areas, while the U.S. Census Bureau considers Urban Clusters a part of urban areas. For this reason, the FTA provides Rural Formula Program funds to reporters to the rural module of the NTD. In comparison to UZAs, rural areas tend to have large distances between transit destinations and smaller populations.

National Transit Summaries & Trends 2016
Transit Funding — 11
What data does the NTD collect?
Transit operators report information regarding service provided, service consumed, and service resources, including financial data. Service provided includes information such as Vehicle Revenue Hours (VRH) and Vehicle Revenue Miles (VRM). Service consumed is described in terms of Unlinked Passenger Trips (UPT) — the total count of individual vehicle boardings — and Passenger Miles Traveled (PMT) — the total number of miles traveled by passengers. The NTD collects financial data such as Operating Expenses (OE) for each mode operated, as well as the sources of funds used to support transit service. The NTD also collects resource data related to transit staffing levels and asset data for fleets and facilities.
What is Safety and Security reporting?
NTD safety and security (S&S) reporting requires all reporters to provide the number of safety and security events that involve the transit system’s property, along with the number of fatalities and injuries that result from those safety and security events. While the exact reporting timelines and level of detail differ slightly based on agencies’ NTD reporting type, a safety or security event is one that meets any of the following criteria:
• A fatality resulting from the event occurs within 30 days;
• One or more persons are injured as a result of the event and require immediate transport for medical attention;
• The estimated property damage from the event is at least $25,000;
• The collision involves transit vehicles that require towing away from the scene;
• An evacuation is made due to potentially life-threatening conditions or to the rail right-of-way;
• A derailment occurs (this includes both mainline and yard derailments, as well as non-revenue vehicle derailments);
• The rail transit vehicle is involved in a collision at rail grade crossing;
• The rail transit vehicle collides with an individual on the right-of-way; and
• A rail transit vehicle and a second rail transit vehicle or rail transit non-revenue vehicle collide.
Generally, the NTD requires Full Reporters to provide summary data for all events on a monthly basis. However, these agencies report additional details for more serious safety

National Transit Summaries & Trends 2016
12 — Transit Funding
events. In contrast, Rural Reporters and Reduced Reporters provide annual summary totals of safety and security events, fatalities, and injuries.
Rounding and Inflation
Rounding may lead to minor variations in total values from one exhibit to another within this analysis or may lead to instances where percentages may not add to 100. Due to rounding, percent changes may not exactly match the values calculated using the formatted figures shown in the exhibits.
The NTD has adjusted all exhibits involving dollar amounts to 2016 constant-dollar values or dollar amounts adjusted in terms of constant purchasing power using the Consumer Price Index (CPI).
Web Information
For information about National Transit Database publications and training, visit the FTA website at www.transit.dot.gov or the National Transit Database website at www.transit.dot.gov/ntd.
National Transit Summaries & Trends 2016
Transit Funding — 13
Transit Trends in Service Operated, Service Consumed, and Costs
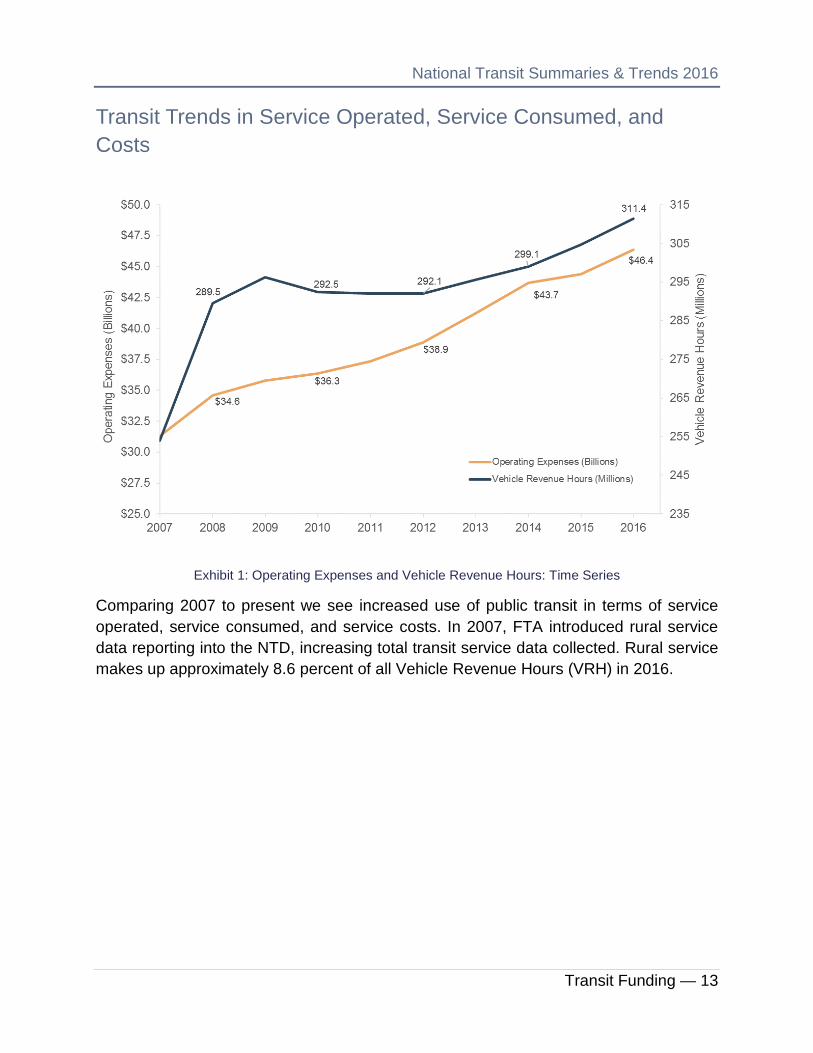
Exhibit 1: Operating Expenses and Vehicle Revenue Hours: Time Series
Comparing 2007 to present we see increased use of public transit in terms of service operated, service consumed, and service costs. In 2007, FTA introduced rural service data reporting into the NTD, increasing total transit service data collected. Rural service makes up approximately 8.6 percent of all Vehicle Revenue Hours (VRH) in 2016.

National Transit Summaries & Trends 2016
14 — Transit Funding
Exhibit 2: Operating Expenses and Unlinked Passenger Trips: Time Series
Following the U.S. recession from 2007–2009, public transit passenger trips dropped 2.7 percent from 2008 to 2010 (10.4 billion trips to 10.1 billion trips). In response to reduced trip demand, transit operating expenses plateaued briefly, while transit service hours dropped 1.4 percent from 296.2 million revenue hours in 2009 to 292 million revenue hours in 2011.

National Transit Summaries & Trends 2016
Transit Funding — 15
Report Year 2016 Service and Cost Ratios
Service is provided, consumed, and financed differently for every transit mode. Service factors and expenses depend on the operating environment of different areas. For example, the average operating cost per VRH is highest for ferries (FB, $1,559.23). However, the mode provides an average of 170.3 UPT per VRH on large boats, thus the final cost per boarding is relatively low ($9.16).
Exhibit 3: Cost per Vehicle Revenue Hour
Exhibit 4: 2016 Unlinked Passenger Trips per Vehicle Revenue Hour
By contrast, demand-based modes (demand response [DR] and demand response taxi [DT]) — which frequently provide single-passenger trips for individuals who meet the

National Transit Summaries & Trends 2016
16 — Transit Funding
requirements of the Americans with Disabilities Act (ADA) — are relatively inexpensive per vehicle hour. However, because less service is consumed, the ultimate cost per passenger trip on these modes is higher than other transit modes.
Exhibit 5: 2016 Cost per Unlinked Passenger Trip
Urban rail modes split into transit rail and commuter rail. Transit rail includes heavy rail (HR), light rail (LR), and streetcar (SR); passengers typically use these services for shorter trips. Commuter rail (CR), which includes hybrid rail (YR), carries passengers for longer trips on the Federal Railroad Administration-regulated (FRA) general railroad system.
Transit rail has among the highest number of trips per hour among all modal categories. Therefore, even though cost per hour is higher than fixed route bus services, the ultimate operating cost per trip is comparable.
Exhibit 5 (above) calculates the cost per Unlinked Passenger Trip (UPT), which is one measure of the service consumed by the riding public. The NTD also measures the distance traveled or Passenger Miles Traveled (PMT), the cost per which is depicted in Exhibit 6. The operating cost per passenger unit differs, and this contrast gives a more rounded picture of the cost of service consumed. Vanpool (VP) service, for example, may carry fewer people, but it carries them a consistently longer distance per trip. The opposite is true of trolleybuses (TB) and streetcars (SR), which carry many people but not very far in dense urban settings.

National Transit Summaries & Trends 2016
Transit Funding — 17
Exhibit 6: 2016 Cost per Passenger Mile
Transit Service Providers: Organization Type
Transit providers indicate their organization type on the NTD Annual Report. The totals in Exhibit 7 do not include systems such as the Roosevelt Island Tramway in New York City and other systems that do not benefit from FTA funds and do not report to the NTD.
Exhibit 7: Urban Transit Providers by Type
City and county organizations are departments of local government, while Transit Authorities are independent public agencies led by boards focused on providing public transit. Together, they make up 81.6 percent of all public transit in 2016. The remaining portion of public transit is operated by private for-profit companies, non-profit companies,
Count518263173
Non-Profit 38Planning 31For-Profit 28State Gov 21Agency on Aging 10Contractor 14University 12Subsidiary 8Semi-Public Corp 9Other 1Tribe 1
Total Transit Providers 954
City/CountyTransit AuthorityOther Types
Organization Type

National Transit Summaries & Trends 2016
18 — Transit Funding
contractors, and semi-public corporations (9.4 percent); state government departments of transportation (2.3 percent); universities (1.3 percent); American Indian Tribes (0.2 percent); and other transit operators (5.2 percent).
Exhibit 8: 2016 Transit Provider Organization Types
Transit Funding
The Federal Transit Administration’s Annual Budget
The FTA budget is a small portion of the U.S. Federal Government’s total annual budget. During 2016, Congress appropriated 2 percent ($76 billion) of the total Federal budget

National Transit Summaries & Trends 2016
Transit Funding — 19
($3.85 trillion) for transportation needs for the entire country. Over $11.4 billion is allocated to the FTA, making up 0.30 percent of the total Federal budget.
Exhibit 9: 2016 Transportation as a Percentage of the Total Federal Budget
Operating Expense Funding Sources
On average, passenger fares fund 32 percent of public transit operations in the United States, with another 4.8 percent generated directly by the transit operator. Local and State sources fund 31.6 percent and 24.4 percent, respectively; Federal Government sources fund the remaining 7.2 percent.
Exhibit 10: 2016 Funding Sources for Transit
Operations
National Transit Summaries & Trends 2016
20 — Transit Funding
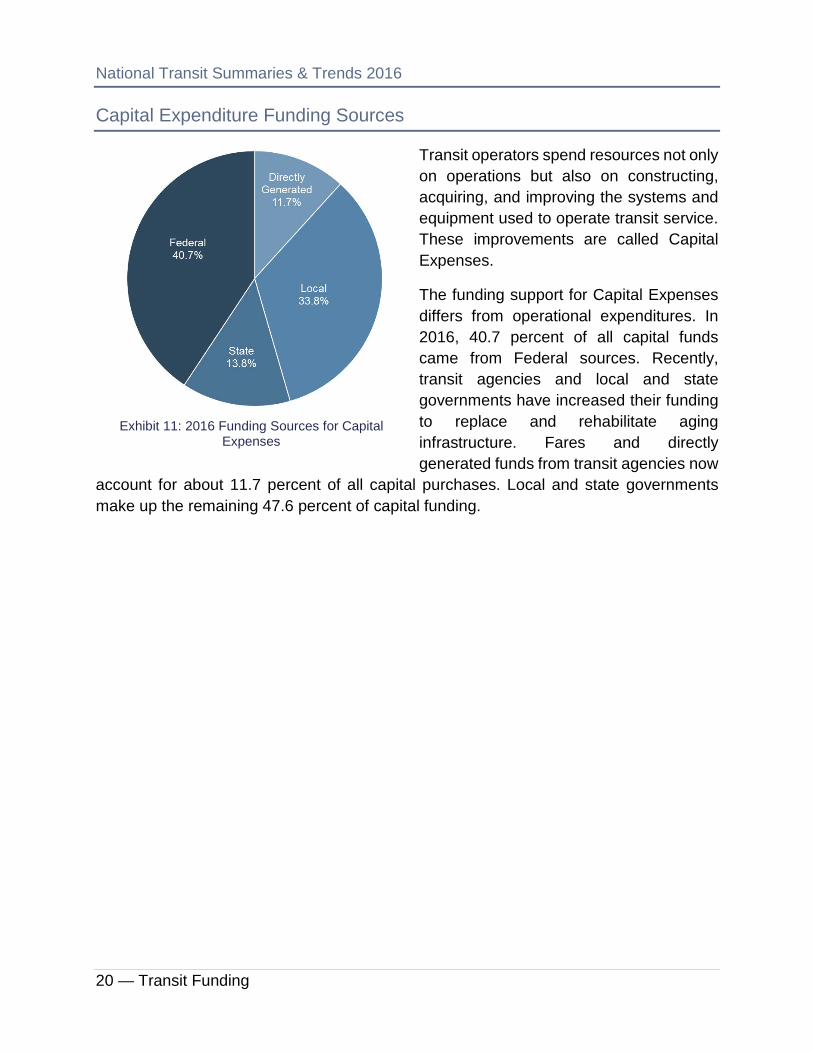
Capital Expenditure Funding Sources
Transit operators spend resources not only on operations but also on constructing, acquiring, and improving the systems and equipment used to operate transit service. These improvements are called Capital Expenses.
The funding support for Capital Expenses differs from operational expenditures. In 2016, 40.7 percent of all capital funds came from Federal sources. Recently, transit agencies and local and state governments have increased their funding to replace and rehabilitate aging infrastructure. Fares and directly generated funds from transit agencies now
account for about 11.7 percent of all capital purchases. Local and state governments make up the remaining 47.6 percent of capital funding.
Exhibit 11: 2016 Funding Sources for Capital Expenses
National Transit Summaries & Trends 2016
Transit Funding — 21
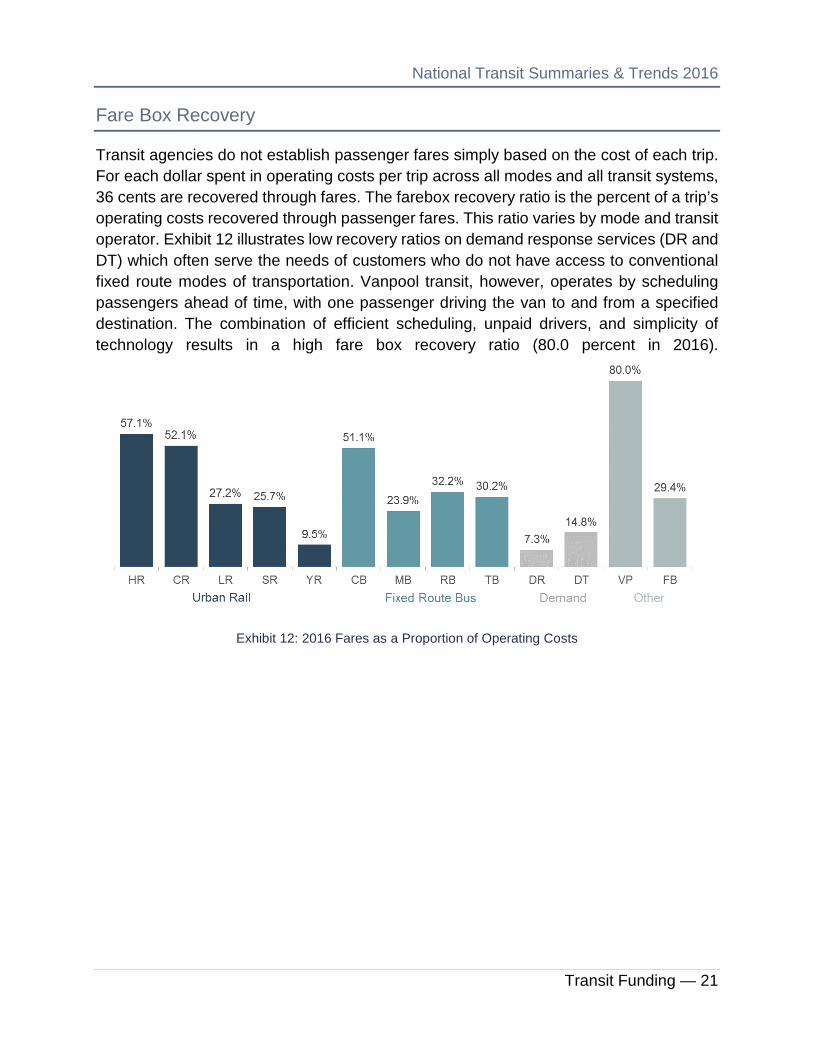
Fare Box Recovery
Transit agencies do not establish passenger fares simply based on the cost of each trip. For each dollar spent in operating costs per trip across all modes and all transit systems, 36 cents are recovered through fares. The farebox recovery ratio is the percent of a trip’s operating costs recovered through passenger fares. This ratio varies by mode and transit operator. Exhibit 12 illustrates low recovery ratios on demand response services (DR and DT) which often serve the needs of customers who do not have access to conventional fixed route modes of transportation. Vanpool transit, however, operates by scheduling passengers ahead of time, with one passenger driving the van to and from a specified destination. The combination of efficient scheduling, unpaid drivers, and simplicity of technology results in a high fare box recovery ratio (80.0 percent in 2016).
Exhibit 12: 2016 Fares as a Proportion of Operating Costs

National Transit Summaries & Trends 2016
22 — Safety and Security
Modal Differences
Service Size
Exhibit 13: 2016 Service Provided
Of the modes defined in the introduction, Exhibit 13 (above) demonstrates that fixed route bus (MB) systems are the most common form of public transit service provided in the United States, with over 52 thousand Vehicles Operated in Maximum Service (VOMS) and operating over 163.7 million Vehicle Revenue Hours (VRH) of service. MB is typically a more cost-effective method of providing public transit in an urbanized area where building the necessary infrastructure for a rail network is impractical or infeasible. DR is the second largest transit service type (over 41 thousand VOMS and 73.3 million VRH) and is the main provider of service in rural and sparsely populated areas. Among rail modes, heavy rail (HR) systems are the most used (over 9 thousand VOMS and 34 million VRH), with commuter (CR) and light rail (LR) close behind in terms of service provided.

National Transit Summaries & Trends 2016
Safety and Security — 23
Exhibit 14: 2016 Service Consumed
Service Data by Factor
Exhibits 15, 16, and 17 compare transit operation statistics across transit modes. Average Trip Length (PMT per UPT) estimates the average distance a passenger travels on public transit, and Trips per Vehicle Revenue Hour indicates the average volume of passengers carried in an equivalent period on a vehicle. Passenger Miles Traveled per Vehicle Revenue Miles estimates the average number of passengers per vehicle at any given time.
Exhibit 15: 2016 Passenger Miles per Unlinked Passenger Trip (Average Trip Length in Miles)

National Transit Summaries & Trends 2016
24 — Safety and Security
Exhibit 16: 2016 Unlinked Passenger Trips per Vehicle Revenue Hour
Comparing average trips per hour and average trip length demonstrates how many passengers are on a transit vehicle and how far they travel, respectively. Demand modes take small passenger loads a relatively long distance to meet the requirements of the ADA. Ferryboats move the largest number of passengers often a very short distance across a waterway. CR, YR, CB and VP all transport a comparatively smaller load of commuters a longer distance per trip.
Intensive city transit modes such as heavy rail (HR), light rail (LR), streetcar rail (SR), bus rapid transit (RB), trolleybus (TB), and bus (MB) all tend to provide a larger number of trips for a much shorter distance compared to long distance commuter-related modes. These intensive city transit modes also often include multiple transfers on a passenger’s journey between vehicles of the same mode and among multiple modes. To get to work, for example, a passenger might take a bus trip to get to the underground train, ride the train for three stops, and walk from the train station to their workplace. In this example, the single commuter represents two unlinked passenger trips, one on bus and one on rail.
Exhibit 17 shows that ferryboats carry more passengers per vehicle than any other mode, an average of 133 passengers. Demand modes often assist disabled passengers (as a part of the ADA compliance) and respond to single passenger trip requests, dropping their load factor to nearly one passenger at a time. For most of the other modes that run on schedules instead of requests, load factor does not take into account peak travel, such as rush hour, which can be more than twice the number of passengers in off-peak times.

National Transit Summaries & Trends 2016
Safety and Security — 25
Exhibit 17: 2016 Passenger Miles per Vehicle Mile (Average Number of Passengers per Vehicle)
Fixed Guideway and High Intensity Busway
Fixed Guideway Route Miles from 2007 to 2016
Public transit often operates on fixed guideway. The NTD separates fixed guideway into two categories: exclusive fixed guideway (FG) and high intensity busway (HIB). FG uses separate right-of-way (ROW) or rail exclusively for public transportation. FG may be a fixed catenary system useable by multiple forms of public transit (e.g., trolleybus, light rail, etc.). HIB is roadway that is either:
• Exclusive at all times (24 hours, 7 days per week) as a High Occupancy Vehicle (HOV) lane or transit-way; or
• Controlled access, which is exclusive for part of the time but is otherwise available to general traffic.
All rail, catenary, and ferryboat (FB) systems operate over FG. Bus systems may operate over FG, HIB, or publicly available roadway (mixed traffic ROW).
National Transit Summaries & Trends 2016
26 — Safety and Security
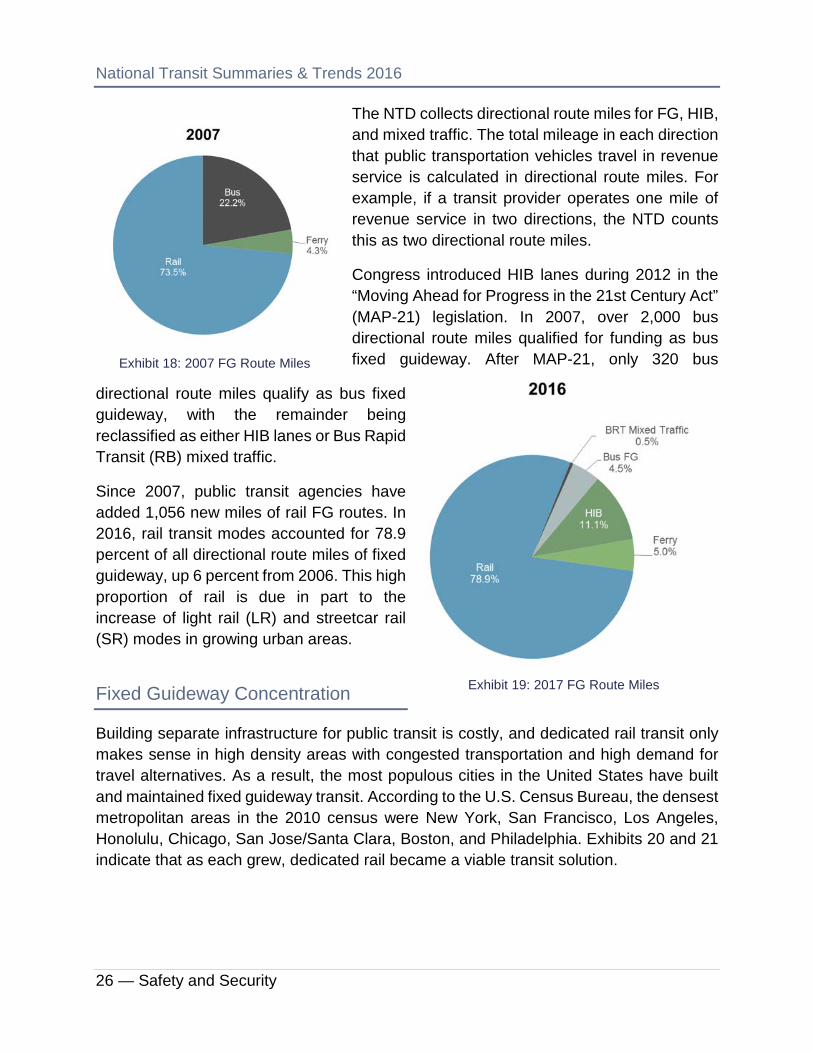
The NTD collects directional route miles for FG, HIB, and mixed traffic. The total mileage in each direction that public transportation vehicles travel in revenue service is calculated in directional route miles. For example, if a transit provider operates one mile of revenue service in two directions, the NTD counts this as two directional route miles.
Congress introduced HIB lanes during 2012 in the “Moving Ahead for Progress in the 21st Century Act” (MAP-21) legislation. In 2007, over 2,000 bus directional route miles qualified for funding as bus fixed guideway. After MAP-21, only 320 bus
directional route miles qualify as bus fixed guideway, with the remainder being reclassified as either HIB lanes or Bus Rapid Transit (RB) mixed traffic.
Since 2007, public transit agencies have added 1,056 new miles of rail FG routes. In 2016, rail transit modes accounted for 78.9 percent of all directional route miles of fixed guideway, up 6 percent from 2006. This high proportion of rail is due in part to the increase of light rail (LR) and streetcar rail (SR) modes in growing urban areas.
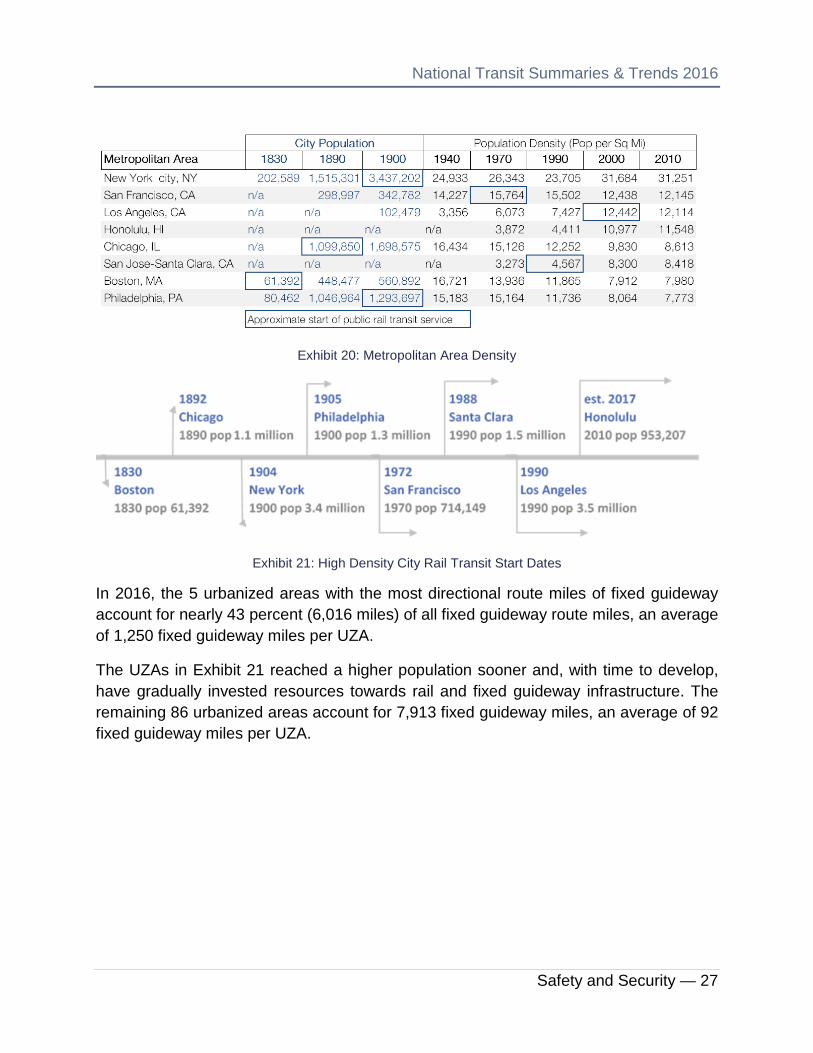
Fixed Guideway Concentration
Building separate infrastructure for public transit is costly, and dedicated rail transit only makes sense in high density areas with congested transportation and high demand for travel alternatives. As a result, the most populous cities in the United States have built and maintained fixed guideway transit. According to the U.S. Census Bureau, the densest metropolitan areas in the 2010 census were New York, San Francisco, Los Angeles, Honolulu, Chicago, San Jose/Santa Clara, Boston, and Philadelphia. Exhibits 20 and 21 indicate that as each grew, dedicated rail became a viable transit solution.
Exhibit 18: 2007 FG Route Miles
Exhibit 19: 2017 FG Route Miles
National Transit Summaries & Trends 2016
Safety and Security — 27
Exhibit 20: Metropolitan Area Density
Exhibit 21: High Density City Rail Transit Start Dates
In 2016, the 5 urbanized areas with the most directional route miles of fixed guideway account for nearly 43 percent (6,016 miles) of all fixed guideway route miles, an average of 1,250 fixed guideway miles per UZA.
The UZAs in Exhibit 21 reached a higher population sooner and, with time to develop, have gradually invested resources towards rail and fixed guideway infrastructure. The remaining 86 urbanized areas account for 7,913 fixed guideway miles, an average of 92 fixed guideway miles per UZA.

National Transit Summaries & Trends 2016
28 — Safety and Security
Exhibit 22: UZAs with Most Directional Route Miles
Safety and Security
Safety and Security (S&S) events include vehicle collisions on the roadway, assaults on transit property, train derailments, slips and falls, damage from fallen trees, and more. The NTD requires large transit agencies to report any safety or security events that meet any of the following criteria:
• A fatality resulting from the event occurs within 30 days;
• Injuries to one or more persons resulting from the event that require immediate transport for medical attention;
• The estimated property damage from the event is at least $25,000;
• Collisions involving transit vehicles that require towing away from the scene;
• An evacuation that is made due to potentially life-threatening conditions or damage to the rail right-of-way;
• Derailments, including both mainline and yard derailments, as well as non-revenue vehicle derailments;

National Transit Summaries & Trends 2016
Safety and Security — 29
• Rail transit vehicle collisions at rail grade crossing;
• Rail transit vehicle collision with an individual on the right-of-way; and
• Collision between a rail transit vehicle and a second rail transit vehicle or rail transit non-revenue vehicle.
Any of these events qualify as a Major Event that the agency must report within 30 days to help FTA more rapidly address safety and security issues in public transit.
Important Considerations for NTD Safety Data:
• All safety data presented on the following pages are sourced from Calendar Year 2016 NTD major event reports. At the time of this document’s publication, NTD reporters can still add, modify, and delete major event data for Calendar Year 2016. As such, these data are considered “preliminary” and data may change based on ongoing validation activity.
• The analyses on the following pages use Calendar Year service data sourced from the NTD’s Monthly Ridership data collection to calculate Calendar Year safety rates.
• The Federal Railroad Administration oversees safety for commuter rail (CR) systems and a select set of Hybrid Rail (YR) and Heavy Rail (HR) systems. These agencies do not report safety data to the NTD and are therefore excluded from any safety analyses in this document.
National Transit Summaries & Trends 2016
30 — Safety and Security
2016 NTD Safety Statistics by Mode
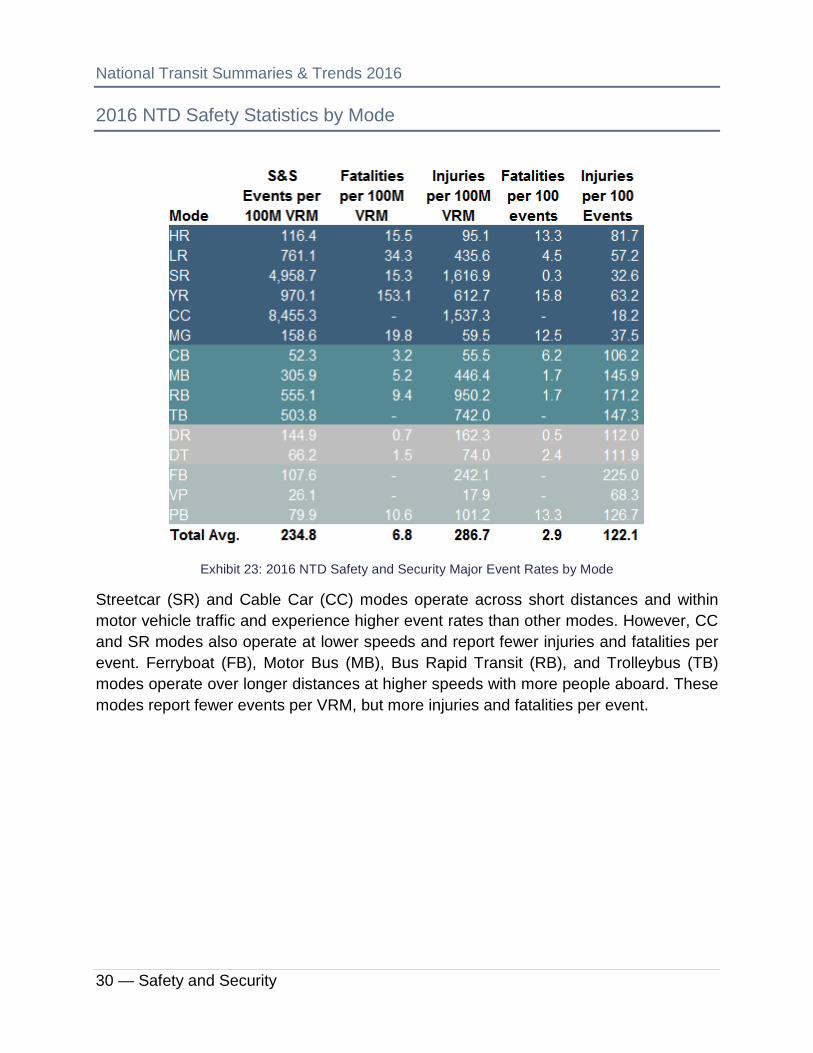
Exhibit 23: 2016 NTD Safety and Security Major Event Rates by Mode
Streetcar (SR) and Cable Car (CC) modes operate across short distances and within motor vehicle traffic and experience higher event rates than other modes. However, CC and SR modes also operate at lower speeds and report fewer injuries and fatalities per event. Ferryboat (FB), Motor Bus (MB), Bus Rapid Transit (RB), and Trolleybus (TB) modes operate over longer distances at higher speeds with more people aboard. These modes report fewer events per VRM, but more injuries and fatalities per event.
National Transit Summaries & Trends 2016
Safety and Security — 31
Non-Rail Safety Events
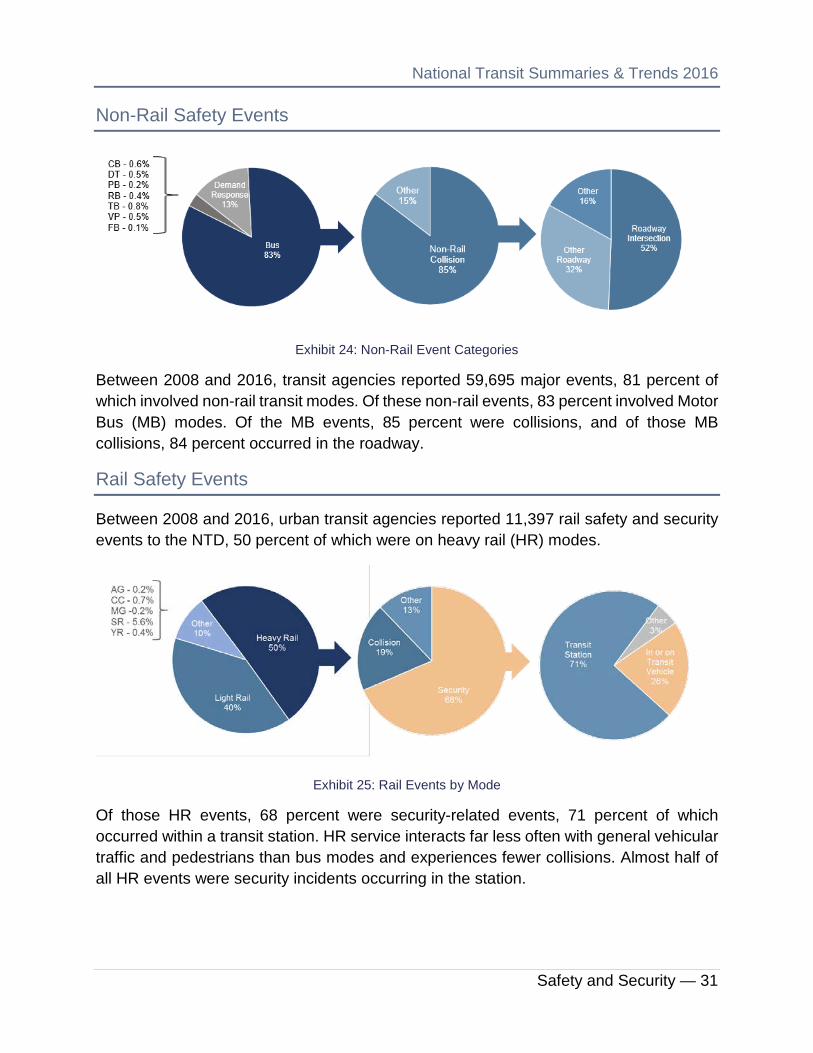
Exhibit 24: Non-Rail Event Categories
Between 2008 and 2016, transit agencies reported 59,695 major events, 81 percent of which involved non-rail transit modes. Of these non-rail events, 83 percent involved Motor Bus (MB) modes. Of the MB events, 85 percent were collisions, and of those MB collisions, 84 percent occurred in the roadway.
Rail Safety Events
Between 2008 and 2016, urban transit agencies reported 11,397 rail safety and security events to the NTD, 50 percent of which were on heavy rail (HR) modes.
Exhibit 25: Rail Events by Mode
Of those HR events, 68 percent were security-related events, 71 percent of which occurred within a transit station. HR service interacts far less often with general vehicular traffic and pedestrians than bus modes and experiences fewer collisions. Almost half of all HR events were security incidents occurring in the station.
National Transit Summaries & Trends 2016
32 — Safety and Security
Fatalities
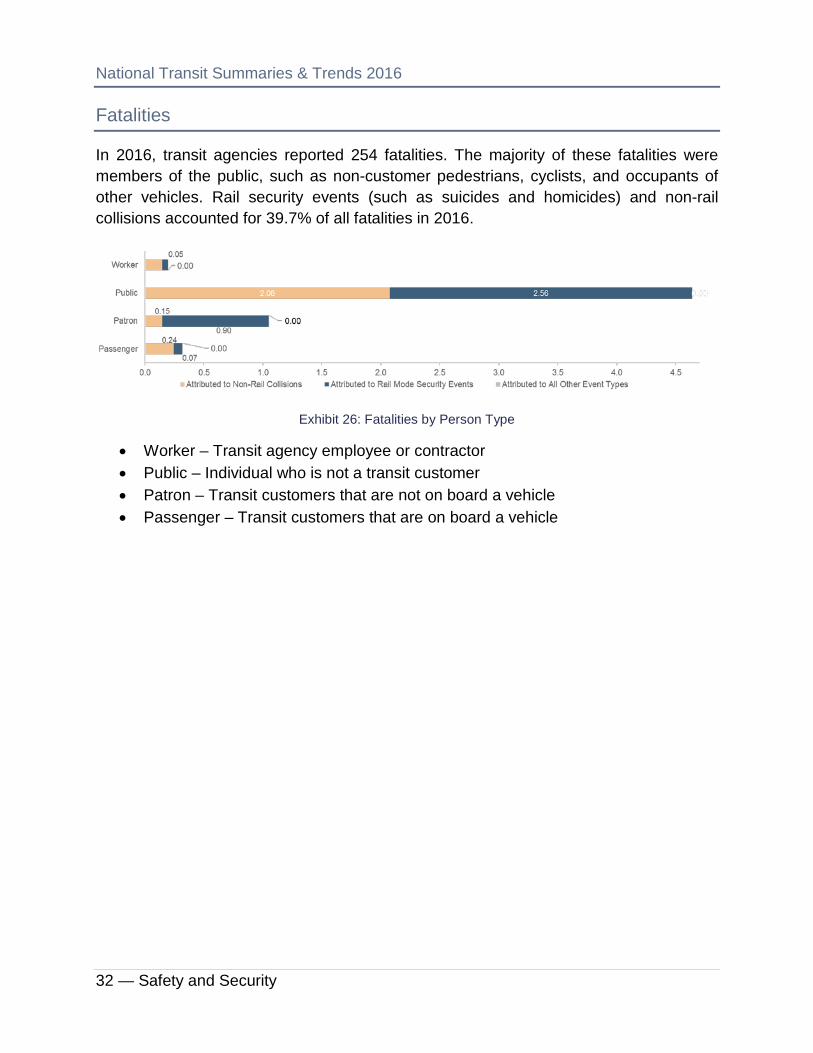
In 2016, transit agencies reported 254 fatalities. The majority of these fatalities were members of the public, such as non-customer pedestrians, cyclists, and occupants of other vehicles. Rail security events (such as suicides and homicides) and non-rail collisions accounted for 39.7% of all fatalities in 2016.
Exhibit 26: Fatalities by Person Type
• Worker – Transit agency employee or contractor• Public – Individual who is not a transit customer• Patron – Transit customers that are not on board a vehicle• Passenger – Transit customers that are on board a vehicle

National Transit Summaries & Trends 2016
Unique Modes — 33
Service Consumed
Population and Transit
Public Transit Service is dependent on population density in order to function efficiently. In the United States, most UZAs have populations of less than 1 million people, but most people live in those UZAs, and they consume most of the public transit service.
Only 42 (8.6%) of the UZAs in the US have a population over 1 million people.
UZA Count by Population Size
62.5% of UZA residents live in those 42 UZAs.
Resident Population per UZA Size
Residents of these 42 UZAs consume 88.2% of the public transit service captured in the NTD as measured by Passenger Miles Traveled.
Service Consumed (PMT) per UZA Size
Exhibit 27:UZA Count, Population, and Total Passenger Miles Traveled

National Transit Summaries & Trends 2016
34 — Service Consumed
Trips per Capita
UZAs over 1 million have more trips on public transit per capita. The median ridership density for UZAs under 1 million in 2016 is 5.66 trips per capita, whereas the median for UZAs over 1 million is 24.19. Owning and driving your own vehicle in a dense urbanized area can be both expensive and inconvenient. Choosing public transit over private cars, bicycles, motorcycles, or walking is called a “discretionary trip” and indicates a personal choice that is not out of necessity, medical or otherwise.
Exhibit 28: 2016 Ridership Density (Passenger Trips per Capita)
Operating Cost per Passenger Trip
Cost per trip varies widely in UZAs under 1 million, from $1.13 to over $42.50. In UZAs over 1 million, the range is narrower, between $2.97 and just over $7.89 per trip. There is less difference between the median cost per trip between UZA size categories (a difference of $1.63), suggesting that there are more rural demand response services (comparatively expensive) in UZAs under 1 million. These rural demand response services on average carry the fewest number of passengers per trip. UZAs over 1 million more often have extensive fixed-route and fixed-guideway systems that carry more passengers per trip, dramatically dropping the average cost per trip.

National Transit Summaries & Trends 2016
Unique Modes — 35
Operating Cost per Revenue Hour
UZAs over 1 million have a slightly lower cost per trip than UZAs under 1 million, but a higher average cost per hour. The lowest average cost per hour in UZAs over 1 million is $81.57, the median for UZAs under 1 million is $74.29. Intensive urban transit carries significantly more passengers at a time, requiring more workers, equipment, and space. Additionally, prices are higher in dense cities as reflected in wages, property costs, and supply prices.
Exhibit 30: Operating Cost per Vehicle Revenue Hour
Exhibit 29: Operating Cost per Passenger Trip
National Transit Summaries & Trends 2016
36 — Service Consumed
Event Rate Comparison
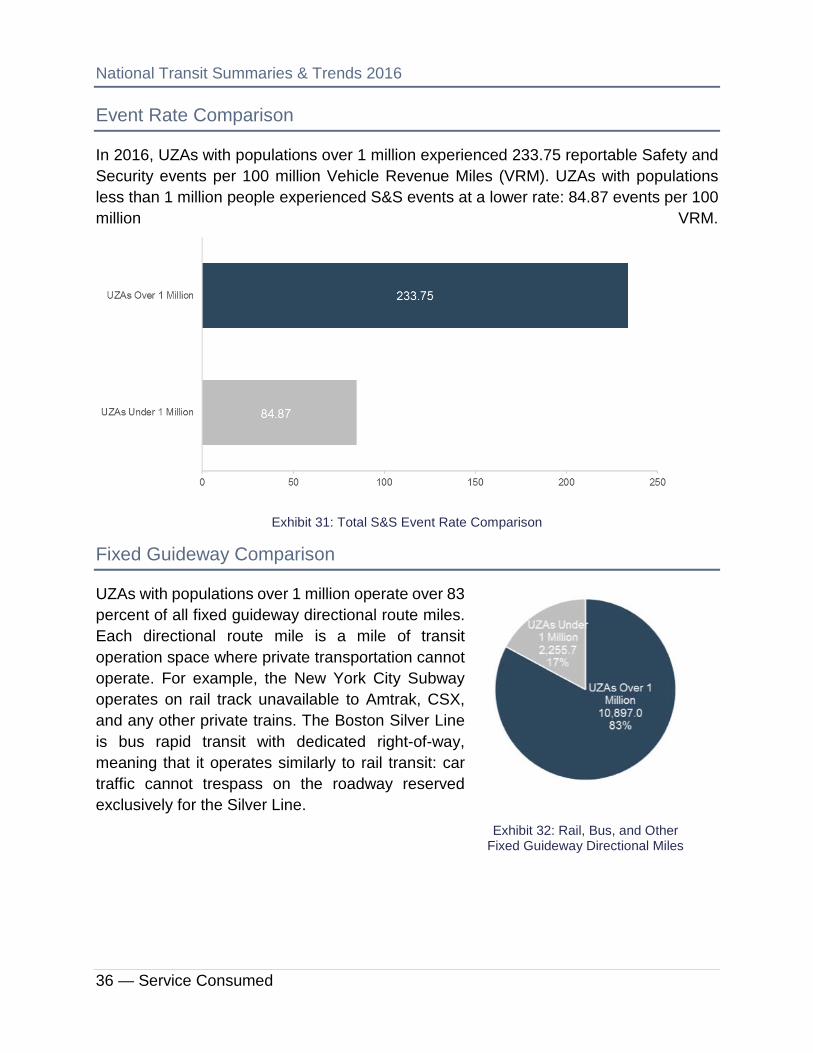
In 2016, UZAs with populations over 1 million experienced 233.75 reportable Safety and Security events per 100 million Vehicle Revenue Miles (VRM). UZAs with populations less than 1 million people experienced S&S events at a lower rate: 84.87 events per 100 million VRM.
Exhibit 31: Total S&S Event Rate Comparison
Fixed Guideway Comparison
UZAs with populations over 1 million operate over 83 percent of all fixed guideway directional route miles. Each directional route mile is a mile of transit operation space where private transportation cannot operate. For example, the New York City Subway operates on rail track unavailable to Amtrak, CSX, and any other private trains. The Boston Silver Line is bus rapid transit with dedicated right-of-way, meaning that it operates similarly to rail transit: car traffic cannot trespass on the roadway reserved exclusively for the Silver Line.
Exhibit 32: Rail, Bus, and Other Fixed Guideway Directional Miles

National Transit Summaries & Trends 2016
Unique Modes — 37
National Ridership Trends: A Five-Year Snapshot
As indicated in Exhibit 2, annual transit ridership has declined comparing 2012 to 2016. To examine this trend further, we will source only agencies that reported to NTD during this period and further dissect the ridership trend.
A majority of the overall increase of 2.3 in Region VIII can be explained by increases to ridership in UZAs Denver, Salt Lake, and Fort Collins, accounting for an increase in 4.1 million trips. The region saw an increase of 3.7 million trips.
Data from Region X reveal a similar trend. Within Region X, UZA 14 (Seattle) experienced a 9.6 percent increase in UPT, which accounted for an increase in 20.8 million total trips. This is nearly double the total increase accounted for within all of Region X, 10.6 million trips.
Because changes within the Region are clearly not indicative of all large UZAs, we will explore changes by mode.
Exhibit 33: Ridership Changes by State (Regions VIII and X)
National Transit Summaries & Trends 2016
38 — Service Consumed
Ridership by Mode and Urbanized Area
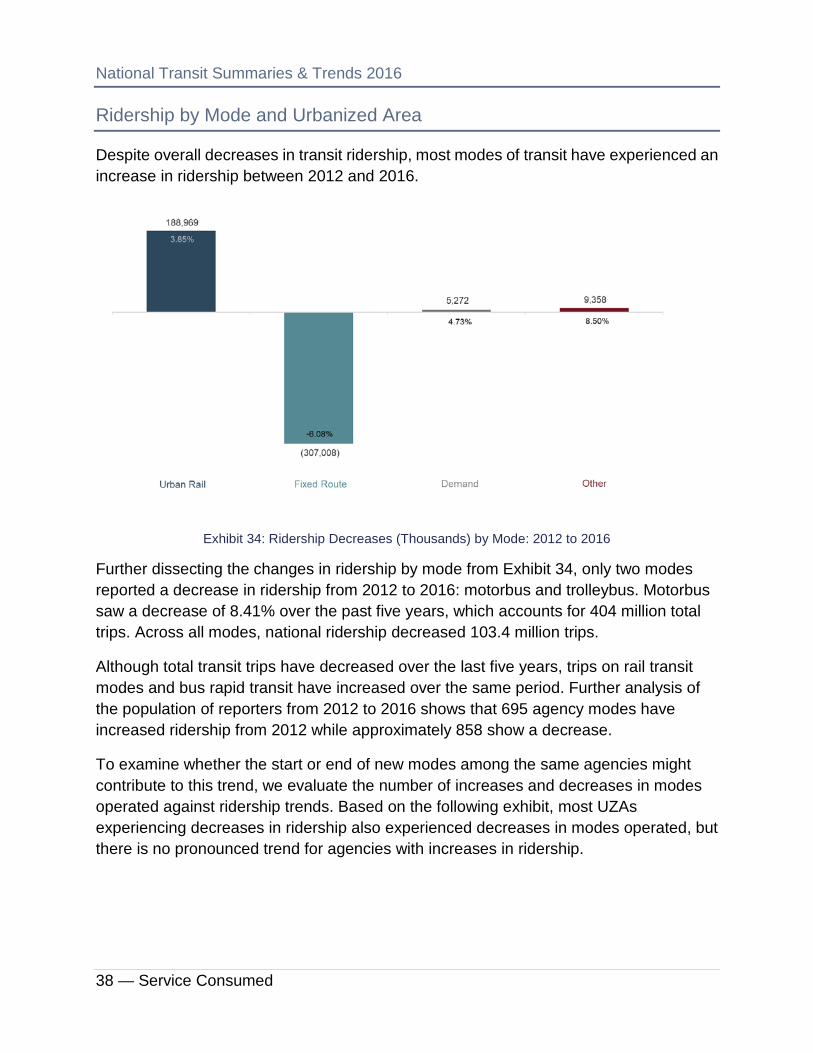
Despite overall decreases in transit ridership, most modes of transit have experienced an increase in ridership between 2012 and 2016.
Exhibit 34: Ridership Decreases (Thousands) by Mode: 2012 to 2016
Further dissecting the changes in ridership by mode from Exhibit 34, only two modes reported a decrease in ridership from 2012 to 2016: motorbus and trolleybus. Motorbus saw a decrease of 8.41% over the past five years, which accounts for 404 million total trips. Across all modes, national ridership decreased 103.4 million trips.
Although total transit trips have decreased over the last five years, trips on rail transit modes and bus rapid transit have increased over the same period. Further analysis of the population of reporters from 2012 to 2016 shows that 695 agency modes have increased ridership from 2012 while approximately 858 show a decrease.
To examine whether the start or end of new modes among the same agencies might contribute to this trend, we evaluate the number of increases and decreases in modes operated against ridership trends. Based on the following exhibit, most UZAs experiencing decreases in ridership also experienced decreases in modes operated, but there is no pronounced trend for agencies with increases in ridership.

National Transit Summaries & Trends 2016
Unique Modes — 39
Decrease in # Modes Operated
Increase in # Modes Operated
Decrease in Ridership 227 120 Increase in Ridership 25 145
Exhibit 35: UZA Ridership Trend Against Modes Operated
As depicted in the previous section, the largest absolute impacts to ridership appeared among the densest UZAs, many of which carry more than 100 million riders per year. Trends are easily observable when binning UZAs by ridership. Notably, the New York City UZA (UZA 1) is the most populous and consistently accounts for almost two times the ridership of the next most populous, Los Angeles-Long Beach-Anaheim. This UZA is excluded from the summaries and trends below.
Exhibit 36: UZA Ridership by Type of Mode, 2012 vs. 2016
Among these large UZAs, there are both consistent increases and decreases from 2012 to 2016. We will further investigate to allow for comparisons among UZAs on hypothesized ridership influencers such as gasoline prices and estimated UZA population change.

National Transit Summaries & Trends 2016
40 — Service Consumed
Ridership Factors
Gas Prices
Overlaying Regular Gasoline Retail Price on NTD ridership activity for the largest UZAs, a similar trend is evident. Using data from the U.S. Energy Information Administration, Exhibit 37 shows similar common decrease in gasoline prices and ridership. Seasonality plays a role in both ridership and gas prices, and the most substantial decrease in ridership during this period occurred during the sharpest decline in fuel prices between November 2014 and February 2015. Across this period, the national average price for a gallon of gasoline decreased 21.4 percent and ridership among these largest 6 UZAs declined 9.9 percent.
Exhibit 37: Ridership and Gasoline Price, 2012 to 2016
Source: https://www.eia.gov/petroleum/data.php#prices

National Transit Summaries & Trends 2016
Unique Modes — 41
Population
The Census Bureau American Community Survey provides estimates for Cities and Towns as of July of each year. From July 2012 to July 2016, there are no observable trends between population of the largest city within a UZA and average annual or absolute Unlinked Passenger Trip change for the same UZA.
UZA Absolute UPT Change
Avg. Annual UPT Change
Estimated Population Change (Largest City in UZA)
Los Angeles-Long Beach-Anaheim, CA (54,638,645.00) -2.06% 3.06%
Miami, FL (14,149,926.00) -2.14% 8.90%
Cleveland, OH (4,400,855.00) -2.23% -1.41% Dallas-Fort Worth-Arlington, TX (3,647,908.00) -1.15% 6.15% Salt Lake City-West Valley City, UT 1,876,417.00 1.47% 2.24% Houston, TX 9,569,802.00 2.84% 6.32% Seattle, WA 21,038,670.00 2.66% 10.87% San Francisco-Oakland, CA 27,519,289.00 1.69% 5.08%
Exhibit 38: Population vs. Unlinked Passenger Trips Change for Selected UZAs, 2012 to 2016
Source: https://www.census.gov/data/tables/2016/demo/popest/total-cities-and-towns.html
Funding Sources
Operating and Capital Expenses
The Report Year 2015 NTST included an analysis of FTA investment in capital projects. This year the NTST revisits that topic and reviews how funding sources are different across the ten national FTA regions. FTA’s commitment to transit is placed on providing both operating and capital assistance. Federal operating assistance grants are administered through programs such as the Urbanized Area Formula program (5307), the Rural Area Formula program (5311), and the Enhanced Mobility of Seniors & Individuals with Disabilities (5310). Federal Capital assistance grants are provided through Bus and Bus Facilities Infrastructure Investment Program (5339), FTA’s Capital Investment Grants Program (5309) and the State of Good Repair (5337) Program.
National Transit Summaries & Trends 2016
42 — Service Consumed
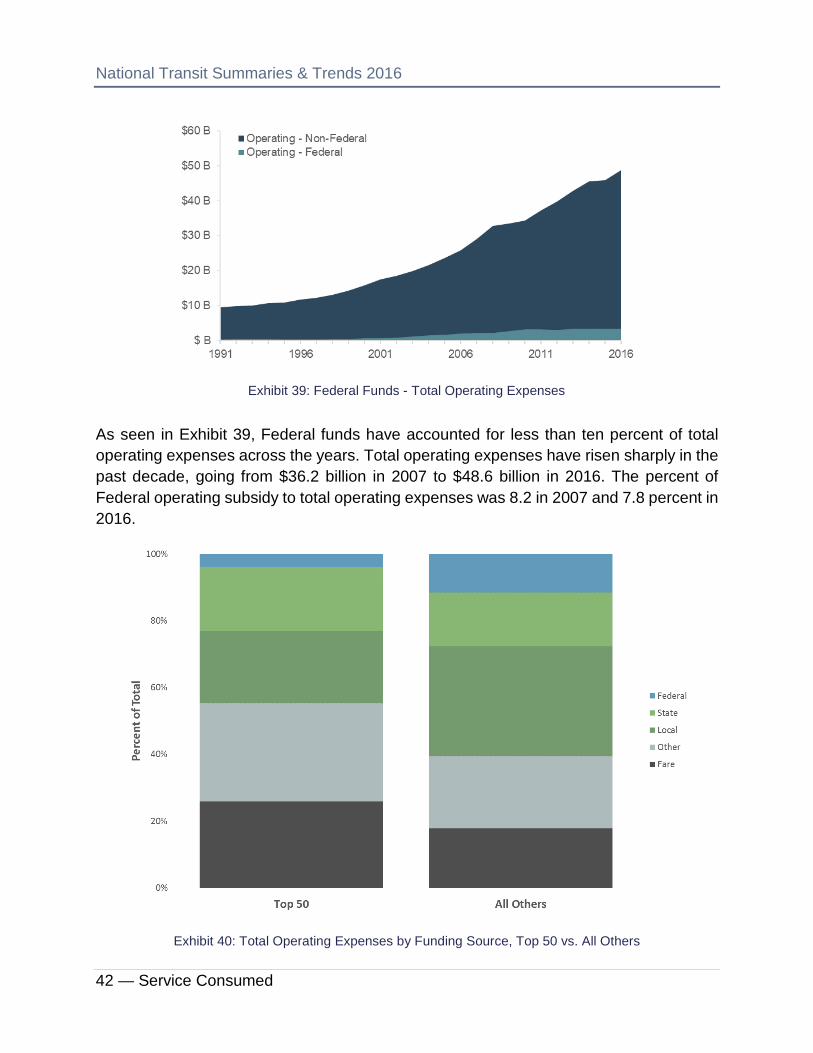
Exhibit 39: Federal Funds - Total Operating Expenses
As seen in Exhibit 39, Federal funds have accounted for less than ten percent of total operating expenses across the years. Total operating expenses have risen sharply in the past decade, going from $36.2 billion in 2007 to $48.6 billion in 2016. The percent of Federal operating subsidy to total operating expenses was 8.2 in 2007 and 7.8 percent in 2016.
Exhibit 40: Total Operating Expenses by Funding Source, Top 50 vs. All Others

National Transit Summaries & Trends 2016
Unique Modes — 43
Exhibit 41: Total Federal Operating Expenses for Selected UZAs – Time Series
Exhibit 40 depicts funding differences between funds expended binned by service consumed; fares and other directly generated funds make up a higher percent of operating expenditures for the collective Top 50 providers of service. State funds make up the largest source of funding for the remaining urban reporting agencies, collectively. Exhibit 41 shows trends in Federal funds expended over time for selected UZAs.
Exhibit 42: Federal Funds - Total Capital Expenses

National Transit Summaries & Trends 2016
44 — Service Consumed
According to FTA’s mission for the State of Good Repair Program, “helping transit agencies maintain bus and rail systems in a State of Good Repair (SGR) is one of FTA’s highest priorities.” Comparing Exhibit 39 to Exhibit 42, it is evident that Federal funds account for a much larger percentage of total capital expenses compared to total operating expenses. In the past decade, Federal funding has hovered around 41 percent of total capital costs. In 2016, the industry expended $19.4 billion on capital, $7.9 billion of which was federally funded.
Exhibit 43: 2016 Capital Funding by Source, Top 50 vs. All Others
Exhibit 43 illustrates that Federal funds represent the largest source of the total capital funds expended across by Top 50 and smaller agencies alike.
National Transit Summaries & Trends 2016
Unique Modes — 45
Exhibit 44: Total Federal Capital Expenses for Selected UZAs – Time Series
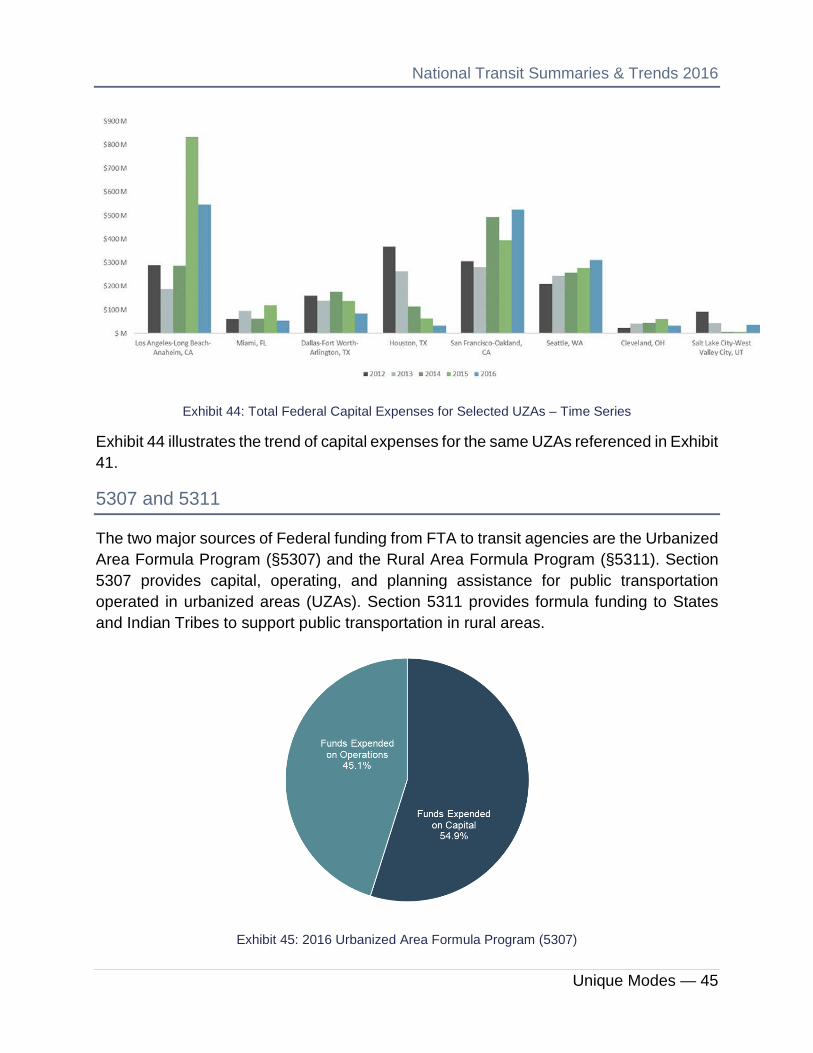
Exhibit 44 illustrates the trend of capital expenses for the same UZAs referenced in Exhibit 41.
5307 and 5311
The two major sources of Federal funding from FTA to transit agencies are the Urbanized Area Formula Program (§5307) and the Rural Area Formula Program (§5311). Section 5307 provides capital, operating, and planning assistance for public transportation operated in urbanized areas (UZAs). Section 5311 provides formula funding to States and Indian Tribes to support public transportation in rural areas.
Exhibit 45: 2016 Urbanized Area Formula Program (5307)

National Transit Summaries & Trends 2016
46 — Service Consumed
In 2016, 54.9 percent of §5307 funds were expended on capital, while the remaining 45.1 percent were expended on operations. In total, $2.4 billion were expended on operations, $1.9 billion of which were capital assistance spent on operations. Capital Assistance typically includes preventive maintenance of equipment necessary to support transit services. Agencies must meet certain requirements in order to be matched at a capital rate by providing local funding in conjunction with federal grants.
Exhibit 46: 2016 Rural Area Program (5311)
In 2016, 15.1 percent of §5311 funds were expended on capital, while the remaining 84.9 percent was expended on operations. In total, $497 million were expended on operations, of which $8 million was capital assistance spent on operations.
Alternative Fuels Over the past several years, there has been an increased focus on the use of alternative and renewable energy sources. The U.S. Department of Energy identifies electricity, hydrogen, natural gas, and propane as sources of alternative energy. While gasoline and diesel fuels are still the primary fuel sources for most fixed route, paratransit, and vanpool vehicles, there has been a growing trend towards alternative energy sources. Natural gas and propane are alternative fuel sources used in transit vehicles and their uses in RY 2016 are detailed below.

National Transit Summaries & Trends 2016
Unique Modes — 47
Natural Gas and Propane
Natural gas is typically a mixture of hydrocarbons. Though derived from fossil fuels, it is considered an alternative fuel from the Energy Policy Act of 1992. Natural gas has similar energy densities to gasoline and diesel fuels, but can be produced domestically.
Propane is another hydrocarbon based fuel, an advantage of which is that leaks pose no threat to soil, surface or ground water. It is also a domestically available fuel source with high energy density.
Natural gas is naturally occurring, while propane is a byproduct created during the process of refining and cleaning natural gas and petroleum. While natural gas and propane are considered fossil fuels, the use of these fuel sources have increased significantly due to their domestic abundance and relatively cheap cost.
Exhibit 47: Natural Gas Consumption
The number of vehicles using natural gas have increased 17.3 percent since 2010. Over the same timeframe, natural gas consumption has increased 19.3 percent.
National Transit Summaries & Trends 2016
48 — Service Consumed
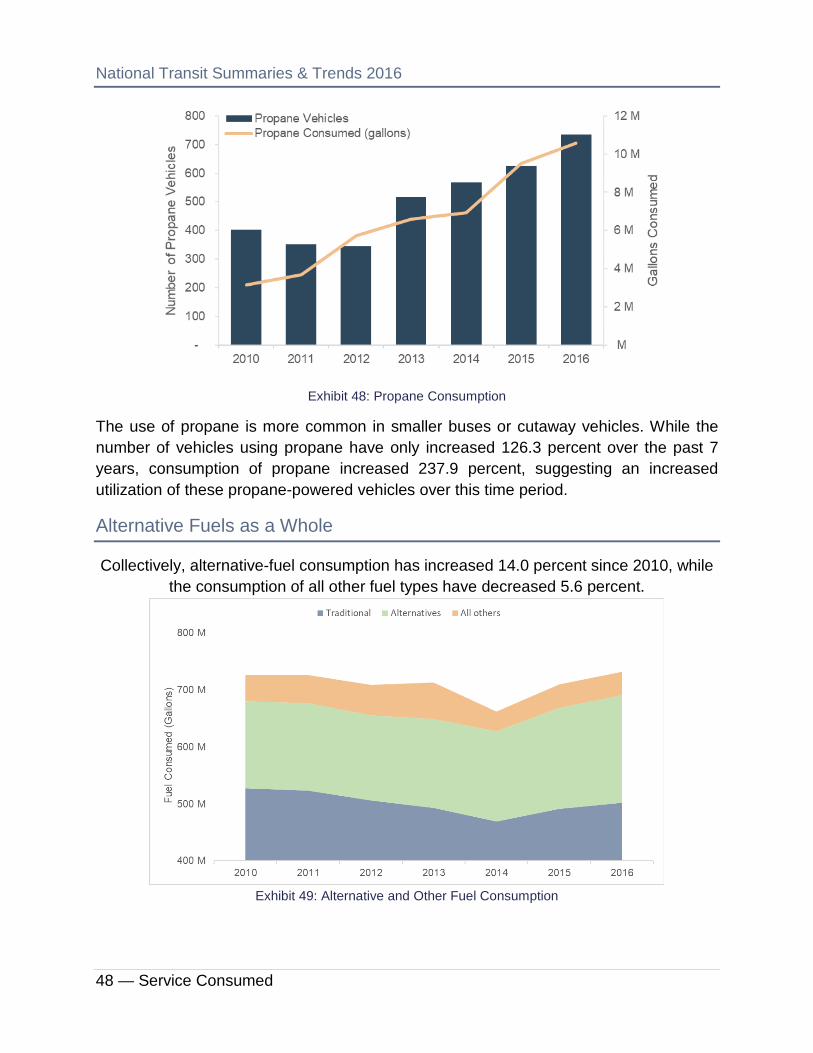
Exhibit 48: Propane Consumption
The use of propane is more common in smaller buses or cutaway vehicles. While the number of vehicles using propane have only increased 126.3 percent over the past 7 years, consumption of propane increased 237.9 percent, suggesting an increased utilization of these propane-powered vehicles over this time period.
Alternative Fuels as a Whole
Collectively, alternative-fuel consumption has increased 14.0 percent since 2010, while the consumption of all other fuel types have decreased 5.6 percent.
Exhibit 49: Alternative and Other Fuel Consumption
National Transit Summaries & Trends 2016
Unique Modes — 49
Traditional Energy Sources
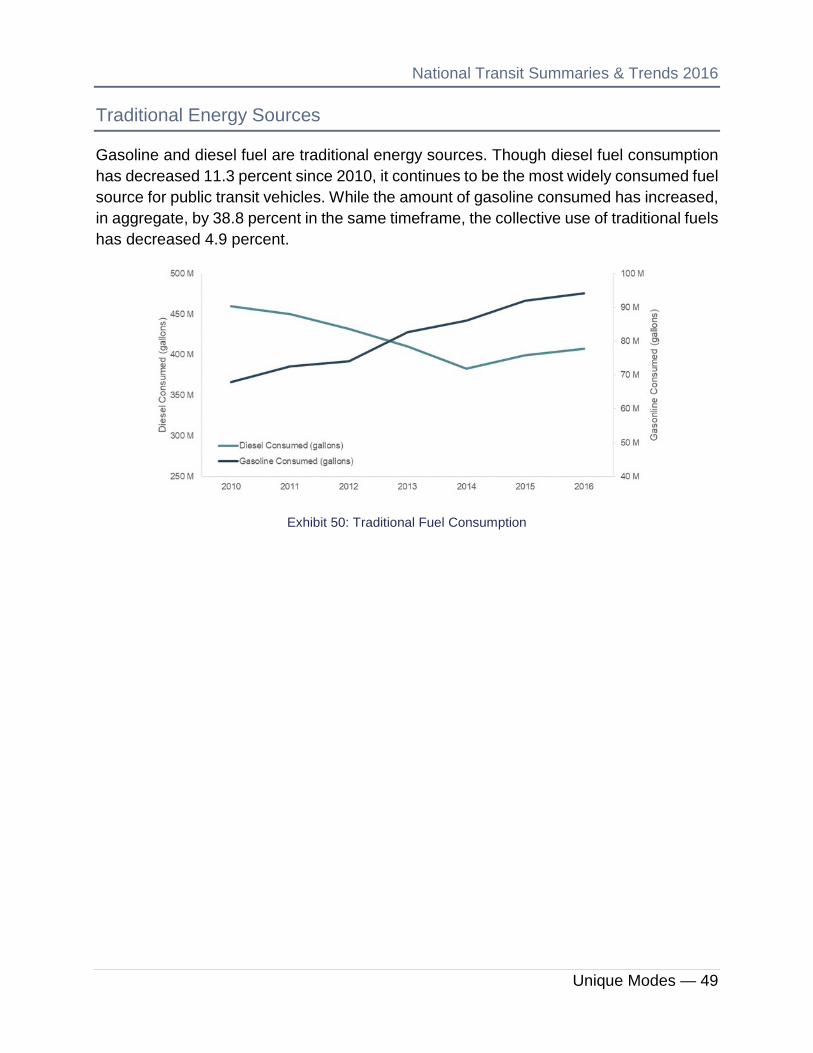
Gasoline and diesel fuel are traditional energy sources. Though diesel fuel consumption has decreased 11.3 percent since 2010, it continues to be the most widely consumed fuel source for public transit vehicles. While the amount of gasoline consumed has increased, in aggregate, by 38.8 percent in the same timeframe, the collective use of traditional fuels has decreased 4.9 percent.
Exhibit 50: Traditional Fuel Consumption

National Transit Summaries & Trends 2016
50 — Service Consumed
Unique Transit Modes
More modes were described in the Introduction than were included in most exhibits. This is because some modes are so rare and unique in their service characteristics that they appear as outliers in comparison to all other modes.
Passenger Miles Traveled (PMT) provides insight into the use of public transit services. The majority of PMT is concentrated in three transit modes: Bus (MB), Heavy Rail (HR), and Commuter Rail (CR) (Exhibit 51). About 85 percent of the PMT are on these three modes. The remaining modes are responsible for about 15 percent of transit service across the United States, of which the unique modes subset accounts for less than 1 percent. The NTD includes the following under unique modes of service:
• Aerial Tramways (TR)
• Alaska Railroad (AR)
• Cable Car (CC)
• Inclined Plane (IP)
• Monorail/Automated Guideway (MG)
• Públicos (PB)
Aerial tramways, cable cars, inclined planes, and automated guideway systems are unique because of the technology required to run these systems. The Alaska Railroad, for example, services the widest area of any rail system in the country, using more than 500 miles of track across Alaska. The Público system is the largest transit system in Puerto Rico, and each driver operates as a separate business unit.
Exhibit 51: 2016 PMT by Mode

National Transit Summaries & Trends 2016
Unique Modes — 51
Aerial Tramway
Aerial tramway (TR) is a transit mode where vehicles shuttle along suspended cables between two tram terminals at differing heights. In most cases, one or two fixed cables support the vehicle while the vehicle’s electrically powered wheels roll up and down a third cable, or haulage rope. This propulsion method and cable setup enables aerial trams to move forward or backwards as needed.
Different variations of tramways have been in use for hundreds of years, especially for industrial cargo and in mountainous regions to carry ore in mining operations. As time passed, aerial trams began to carry passengers instead of exclusively cargo.
However, as electric power became more widely used in transit services in the 1930 – 1940s, aerial tramways became obsolete. Since then, tramways have been largely used for recreational purposes such as ski lifts. However, there has been a recent interest in operating tramways in the urban
market. There now are two aerial tramways that provide mass transit service in the country. The Roosevelt Island Tramway connects Roosevelt Island to the upper east side of Manhattan in New York City, which does not benefit from federal funding.
The City of Portland is the only NTD reporter that reports aerial tramway service. The Portland Aerial Tram opened in 2006 and operates a two-vehicle line service that can carry 78 passengers per cabin. The tramway connects the Oregon Health & Science University (OHSU) campus with the South Waterfront district of Portland.
While an aerial tramway does not operate on rails or roadway, it operates in exclusive air space. For the purposes of NTD reporting, the NTD considers aerial tramway a non-rail, fixed route mode operating exclusively on fixed guideway.
Exhibit 53: Aerial Tramway PMT
Exhibit 52: Portland Aerial Tram
National Transit Summaries & Trends 2016
52 — Service Consumed
Alaska Railroad
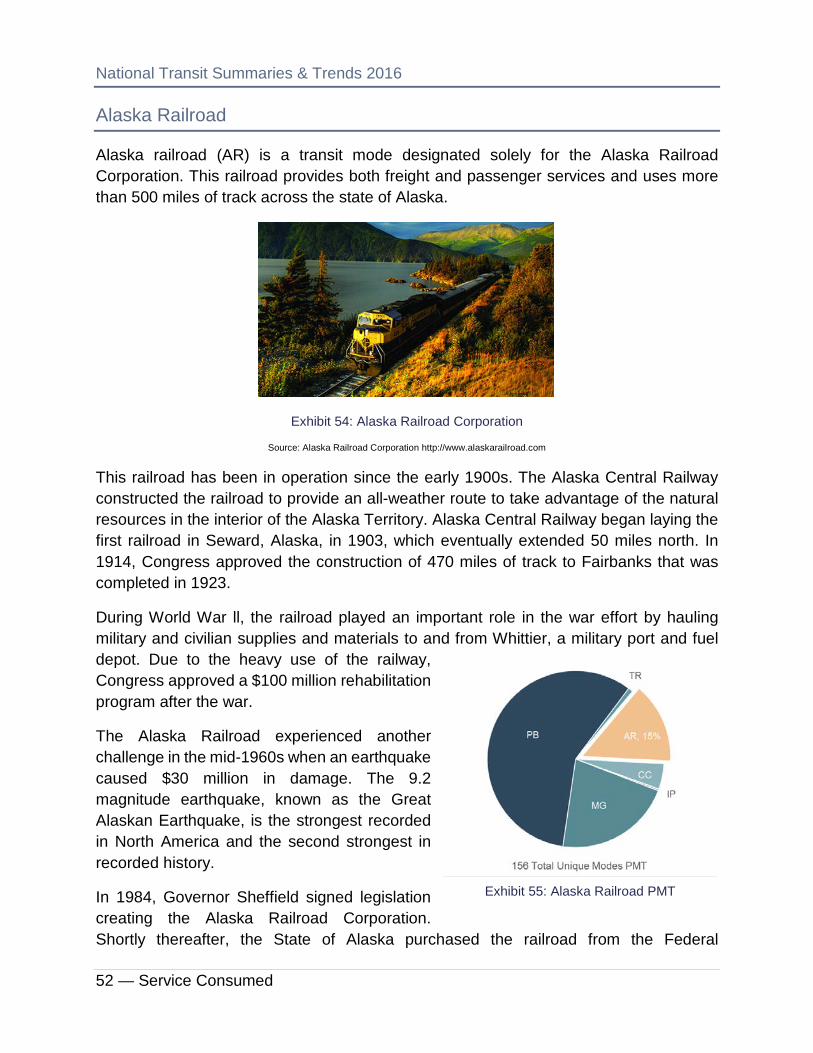
Alaska railroad (AR) is a transit mode designated solely for the Alaska Railroad Corporation. This railroad provides both freight and passenger services and uses more than 500 miles of track across the state of Alaska.
Exhibit 54: Alaska Railroad Corporation
Source: Alaska Railroad Corporation http://www.alaskarailroad.com
This railroad has been in operation since the early 1900s. The Alaska Central Railway constructed the railroad to provide an all-weather route to take advantage of the natural resources in the interior of the Alaska Territory. Alaska Central Railway began laying the first railroad in Seward, Alaska, in 1903, which eventually extended 50 miles north. In 1914, Congress approved the construction of 470 miles of track to Fairbanks that was completed in 1923.
During World War ll, the railroad played an important role in the war effort by hauling military and civilian supplies and materials to and from Whittier, a military port and fuel depot. Due to the heavy use of the railway, Congress approved a $100 million rehabilitation program after the war.
The Alaska Railroad experienced another challenge in the mid-1960s when an earthquake caused $30 million in damage. The 9.2 magnitude earthquake, known as the Great Alaskan Earthquake, is the strongest recorded in North America and the second strongest in recorded history.
In 1984, Governor Sheffield signed legislation creating the Alaska Railroad Corporation. Shortly thereafter, the State of Alaska purchased the railroad from the Federal
Exhibit 55: Alaska Railroad PMT
National Transit Summaries & Trends 2016
Unique Modes — 53
government. The Alaska Railroad continues to provide freight and passenger services today.
The Alaska Railroad Corporation provided 22.9 million passenger miles of service in Report Year 2016. This service accounted for approximately 15 percent of the total unique mode PMT.
Cable Car
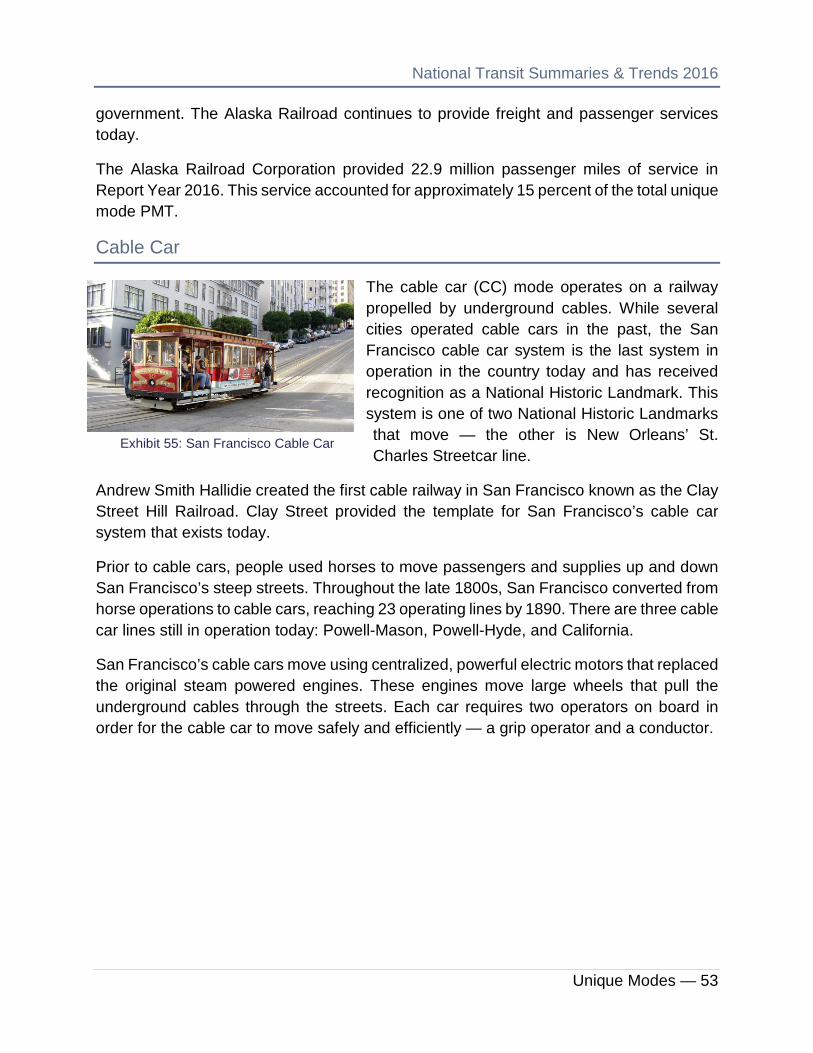
The cable car (CC) mode operates on a railway propelled by underground cables. While several cities operated cable cars in the past, the San Francisco cable car system is the last system in operation in the country today and has received recognition as a National Historic Landmark. This system is one of two National Historic Landmarks that move — the other is New Orleans’ St. Charles Streetcar line.
Andrew Smith Hallidie created the first cable railway in San Francisco known as the Clay Street Hill Railroad. Clay Street provided the template for San Francisco’s cable car system that exists today.
Prior to cable cars, people used horses to move passengers and supplies up and down San Francisco’s steep streets. Throughout the late 1800s, San Francisco converted from horse operations to cable cars, reaching 23 operating lines by 1890. There are three cable car lines still in operation today: Powell-Mason, Powell-Hyde, and California.
San Francisco’s cable cars move using centralized, powerful electric motors that replaced the original steam powered engines. These engines move large wheels that pull the underground cables through the streets. Each car requires two operators on board in order for the cable car to move safely and efficiently — a grip operator and a conductor.
Exhibit 55: San Francisco Cable Car
National Transit Summaries & Trends 2016
54 — Service Consumed
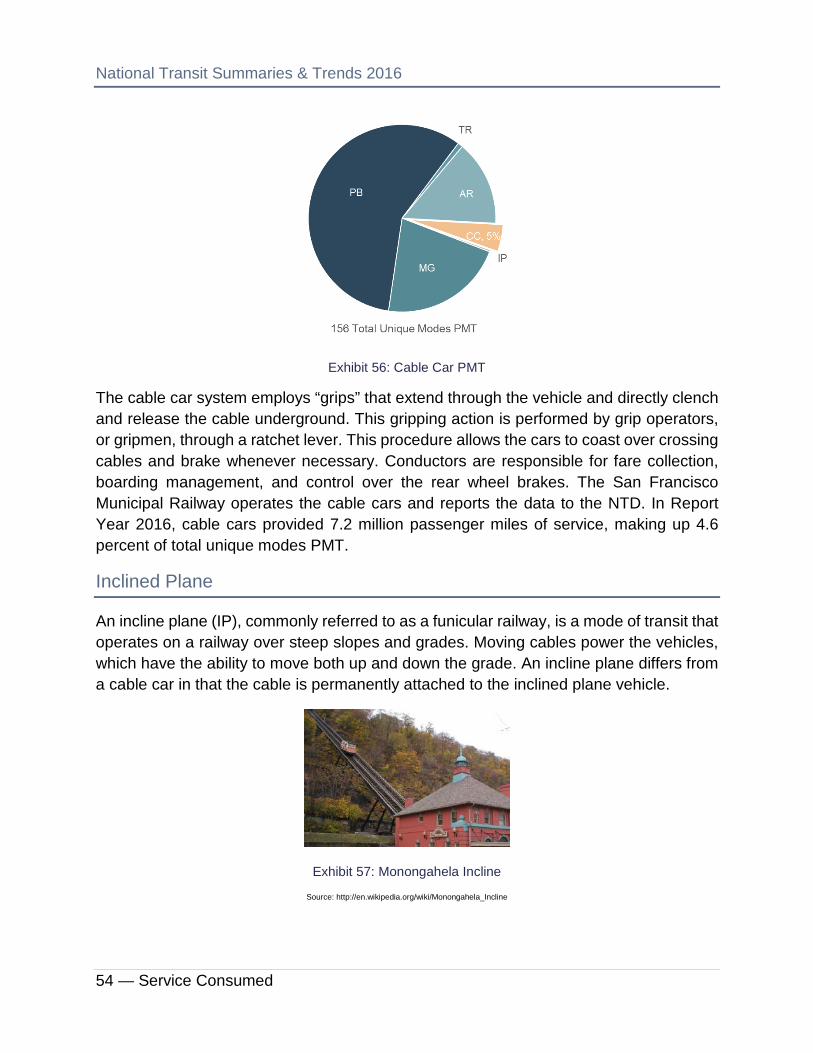
Exhibit 56: Cable Car PMT
The cable car system employs “grips” that extend through the vehicle and directly clench and release the cable underground. This gripping action is performed by grip operators, or gripmen, through a ratchet lever. This procedure allows the cars to coast over crossing cables and brake whenever necessary. Conductors are responsible for fare collection, boarding management, and control over the rear wheel brakes. The San Francisco Municipal Railway operates the cable cars and reports the data to the NTD. In Report Year 2016, cable cars provided 7.2 million passenger miles of service, making up 4.6 percent of total unique modes PMT.
Inclined Plane
An incline plane (IP), commonly referred to as a funicular railway, is a mode of transit that operates on a railway over steep slopes and grades. Moving cables power the vehicles, which have the ability to move both up and down the grade. An incline plane differs from a cable car in that the cable is permanently attached to the inclined plane vehicle.
Exhibit 57: Monongahela Incline
Source: http://en.wikipedia.org/wiki/Monongahela_Incline

National Transit Summaries & Trends 2016
Unique Modes — 55
There are three NTD reporters that provide data for inclined plane: Port Authority of Allegheny County (PAAC), Cambria County Transit Authority (CCTA), and Chattanooga Area Regional Transportation Authority (CARTA).
PAAC owns and operates the Monongahela Incline, also known as the Mon Incline, which is the oldest continuously operating incline plane in the country. John Endres built the incline plane in 1870 in response to the rapid expansion of Pittsburgh. As the factories and mills grew on flats near the river, people built houses nearby on top of Mount Washington. The construction of the incline facilitated further development and accessibility to the area.
Exhibit 58: Inclined Plane PMT
CCTA owns and operates the Johnstown Inclined Plane, another transit service rich in history. This incline is 118-years-old and carries nearly 100,000 riders each year.
Lookout Mountain Incline Railway is the inclined plane operated by CARTA. Located in Chattanooga, Tennessee, this incline began operation in 1895 and today is one of the word’s steepest passenger railways.
Inclined planes operate using two cars that attach to a cable. This cable runs through a pulley at the top of the grade. The two cars run simultaneously; one car moves up the incline while the other moves down. This procedure allows the cars to counterbalance, therefore minimizing the energy required to propel the car going up the incline.
The inclined plane mode generates the smallest amount of passenger miles traveled of all NTD transit modes. During Report Year 2016, the IP passengers traveled just over 534,000 miles.

National Transit Summaries & Trends 2016
56 — Service Consumed
Monorail/Automated Guideway
Automated Guideway (MG) is a type of public transit system where trains operate over a single electric rail. Automated guideway systems are typically above grade, or elevated, and may either operate over or suspend from the central beam. Many airports utilize automated guideway systems for transferring passengers to and from terminals.
Henry Palmer invented and patented one of the earliest monorail designs in 1821. Since that time, many engineers experimented with a single rail system as a cheaper alternative to existing rail transport.
In 1903, Louis Brennan patented a gyroscopically balanced monorail, or gyrocar, as shown on the left-hand side of Exhibit 60. While he intended to use this system for military purposes, it did not move past the prototype stage.
Since then, automated guideway systems have become significantly more modern. Today’s automated guideway systems straddle center beams that support and guide the train, and use pneumatic, or air-filled, rubber tires. The electric motors use third rails or contact wires that power the straddle beam to propel the trains forward.
Exhibit 60: Unique Modes PMT
Automated guideway systems benefit from being elevated above normal traffic, allowing them to operate free of congestion and pedestrians. Additionally, monorail systems are
Exhibit 59: Louis Brennan's Gyrocar and Miami-Dade Metromover
National Transit Summaries & Trends 2016
Unique Modes — 57
typically quiet and environmentally friendly due to their electrical propulsion, and costs tend to be lower than tunneling options.
There are six agencies that reported data for MG services to the NTD: Seattle Center Monorail Transit, Morgantown Personal Rapid Transit, Miami-Dade Transit, Detroit Transportation Corporation, Jacksonville Transit Authority, and Las Vegas Monorail Company.
Públicos
The Público system (PB) is a transit mode unique to Puerto Rico, and provides fixed route services predominantly in Puerto Rico’s urbanized areas. The Público system is the largest public transportation system in Puerto Rico.
Públicos are similar to informal transport systems operated in developing countries. The biggest distinction between the Público service and other transit modes is the way in which Públicos operate. Drivers own their vehicle and are given exclusive rights to the route where they provide service. The drivers, or route owners, are responsible for their service and operate as independent business units. Besides maintaining the vehicles and routes, drivers must determine their schedule and supply the funds to run the service.
Puerto Rico Highway and Transportation Authority (PRHTA) manages the Público service and grants permission to potential drivers. PRHTA surveys the area and determines if there is a need for transit. If approved, PRHTA franchises the rights for that particular route to the prospective operator.
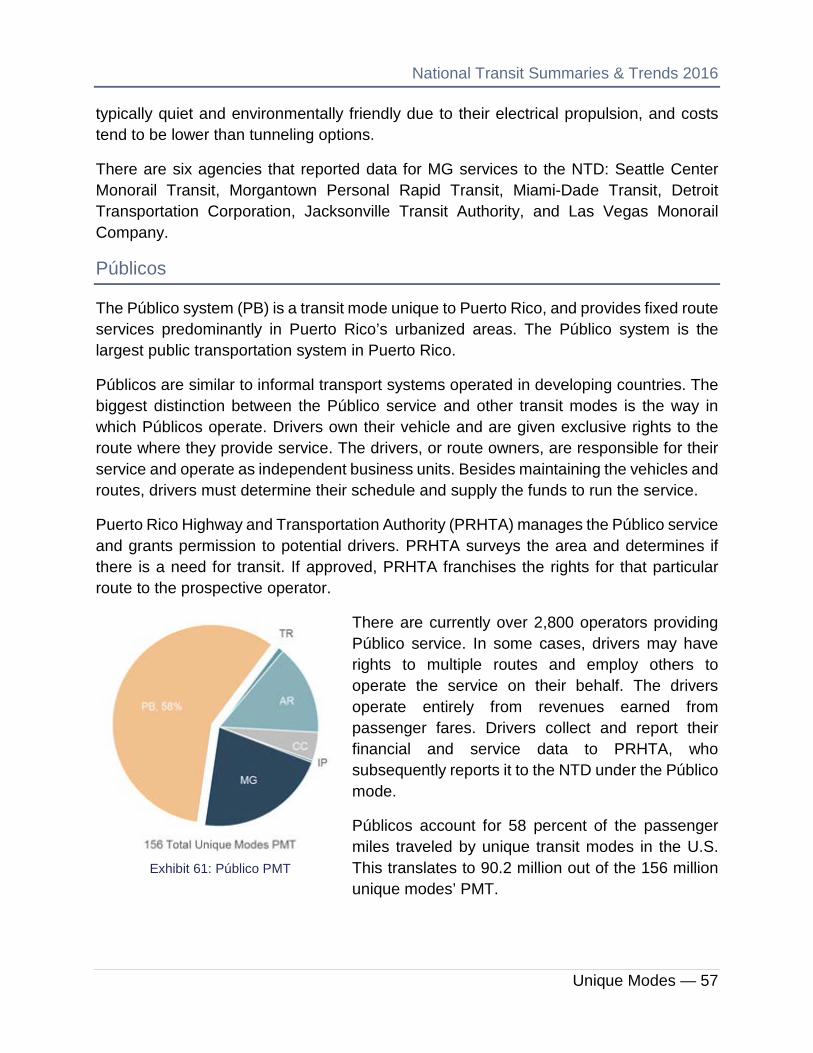
There are currently over 2,800 operators providing Público service. In some cases, drivers may have rights to multiple routes and employ others to operate the service on their behalf. The drivers operate entirely from revenues earned from passenger fares. Drivers collect and report their financial and service data to PRHTA, who subsequently reports it to the NTD under the Público mode.
Públicos account for 58 percent of the passenger miles traveled by unique transit modes in the U.S. This translates to 90.2 million out of the 156 million unique modes’ PMT.
Exhibit 61: Público PMT