national visitor use monitoring results - us forest service · national visitor use monitoring...
TRANSCRIPT

National Visitor Use Monitoring Survey Results U.S. Forest Service
National Summary Report Data collected Through FY 2014

Table of Contents National Visitor Use Monitoring Survey Results .............................................................................................. 0 EXECUTIVE SUMMARY ................................................................................................................................ 2 METHODOLOGY AND USE .......................................................................................................................... 3
Background and Methods .............................................................................................................................. 4 Satisfaction measures ..................................................................................................................................... 4
Spending and Economic Contributions ...................................................................................................... 5 Terms Used in this Report.................................................................................................................................. 7 Using this Report ............................................................................................................................................... 8
Forest Service Use of Visitor Data ................................................................................................................ 8 VISITATION ESTIMATES .......................................................................................................................... 8
Table 1a. Overall annual visitation estimate for the National Forest System, for FY2014. ...................... 9 Table 1b. National visitation estimate for the National Forest System, FY-2005-FY2014 ....................... 9 Figure 1. Purpose of Trip for FY2010 - FY2014. .................................................................................... 10
DESCRIPTION OF THE RECREATION VISIT ........................................................................................... 11 Demographics .............................................................................................................................................. 11
Table 3. Percent of National Forest and wilderness visits by gender, for FY2010 - FY2014 ................. 11 Visit Descriptions ........................................................................................................................................... 9
CUSTOMER SATISFACTION ...................................................................................................................... 12 Disabilities ................................................................................................................................................... 17
VISITOR SPENDING AND ECONOMICS ................................................................................................... 18 Household Income ........................................................................................................................................... 19 Substitute behavior ........................................................................................................................................... 20 Appendix A. Detailed Satisfaction Results ...................................................................................................... 22

EXECUTIVE SUMMARY The U.S. Forest Service develops estimates of the volume of recreation use on National Forests through the National Visitor Use Monitoring program. Onsite surveys are a key part of the process. These surveys help show the characteristics of recreation-related visits to National Forests and the benefits recreation brings to Americans
Completed in five-year cycles, the Visitor Use Monitoring results help the Forest Service manage recreational resources in such a way that best meets the needs of visitors while maintaining the quality of the natural resources. Baseline data for examining long-term trends started in 2005. Although trend information is not yet available, the results do provide a snapshot of annual forest visitation.
Results in this report reflect the most recent field data on each National Forest and includes FY2010 to FY 2014.
Results from the field data yield an estimate of just fewer than 147 million recreation visits to National Forests. Estimates for the last several years are shown below:
140
141
142
143
144
145
146
147
148
2005 -2009
2006 -2010
2007 -2011
2008 -2012
2009 -2013
2010 -2014
Visits (millions) to national forests
Visits
The agency also estimates an additional 300 million occasions where people traveled on the 138 scenic byways and other similar routes near, on or through National Forests for the purpose of viewing scenery on National Forests.
Why people choose to recreate on National Forests varies, but most said they do so to improve their physical, psychological and/or spiritual wellbeing. Their chosen activities vary widely, both in character and location. Some relax as they view natural features or wildlife from the roadside, whereas others pursue solitude as they hike in the remote backcountry. Some engage in off highway vehicle use. Others enjoy water-based recreation, hunt, or camp
The two most common primary recreational activities are hiking/walking and downhill skiing. Almost sixty percent of visitors engage in a primary activity that is physically active, which contribute significantly to the American public’s efforts to stay healthy.
The characteristics of recreation visitors are as diverse as their chosen activities. More than 37 percent of visits to National Forest sites and more than 40 percent of visits to Wilderness Areas are made by females.

• Children under the age of 16 account for about one out of every six visits to National Forests. • All income classes are represented in the recreating public. • About half of visitors to National Forests live within 50 miles of the forest they visited, while
around a quarter of them traveled more than 200 miles. • Many visits – about 60 percent – are by people who visit that forest fewer than 10 times per year. • Over 15 percent of visits are from people who come back more than 50 times each year.
Our visitors said their visits to National Forests and Grasslands make them happy:
• 95 percent of visitors are satisfied with their overall experiences, including more than 80 percent who report being very satisfied.
• More than 94 percent are satisfied with their feeling of safety. • Only 7 percent reported being dissatisfied with the value received for any fees paid in connection
with their visit.
Visitors to National Forests and Grasslands give back in terms of economic vitality of the nation, especially for rural communities. Annual spending by recreation visitors in areas near National Forests and Grasslands is about $10 billion. Visitors who live more than 50 miles from a forest or Grassland account for about half of that total. As visitor spending ripples through the U.S. economy, roughly $10.3 billion is reflected in the gross domestic product and sustains about 143,000 full- and part-time jobs.
The survey data highlights the contribution of forest-based recreation in connecting the American people to their natural and cultural heritage, an important element of the Forest Service Recreation Strategy. Such connections are critical to the cultivation of a conservation ethic and sense of resource stewardship among Americans. Recreation also directly facilitates the improvement of American health, a priority in both the Recreation Strategy and among Forest Service leadership. This report also emphasizes the importance of recreation in the creation of rural wealth, a priority emphasized by Secretary of Agriculture Tom Vilsack.
The management of public lands for recreation is consistent with U.S. Department of Agriculture and Forest Service goals to sustain our nation’s forests and Grasslands, deliver benefits to the public, and excel as a high-performing agency.
Our visitors help us evaluate how we are doing.
METHODOLOGY AND USE The National Visitor Use Monitoring program provides estimates of the volume and characteristics of recreation visitation National Forest System lands. The National Forest System is an area of the agency that oversees 154 National Forests and Grasslands on 193 million acres of public lands.
Information about the quantity and quality of recreation visits is required for National Forest plans; Executive Order 12862, Setting Customer Service Standards; and implementation of the National Recreation Agenda. The agency’s Strategic and Annual Performance Plans require the measurement of user satisfaction and use level.
The National Visitor Use Monitoring program ensures that all visitor statistics for National Forests and Grasslands produced by the Forest Service use a standardized measure. These standards were originally established by the agency in the 1970s. However, application of those standards is now under stricter protocols. For example, in order to count a visitor, that person must be physically recreating on Forest Service-managed lands and not merely passing through, stopping to use a facility or viewing a National Forest or Grassland from a non-Forest Service managed road.

Background and Methods
Results in this report are derived by adding the results from the most recent survey fieldwork for each National Forest and Grassland. The results included here are from field work completed from FY2010 to FY2014. Each forest is sampled once in five years. That means that in any given year, roughly 24 forests are engaged in field data collection. Those forests that completed their survey work in 2014 were updating visitation estimates from 2009. That means there is not yet sufficient data for accurate trend measures. Instead, this report represents an iteration of the survey process, or a snapshot of the most current visitation patterns and activities on lands managed by the agency.
The basic methodology is explained in detail in Forest Service National Visitor Use Monitoring Process: Research Method Documentation. In essence, visitation is estimated through a combination of traffic counts and surveys of visitors leaving a forest or Grassland. Both are obtained from random locations and days on a forest or Grassland over a period of one year.
Recreation visitors who are surveyed are asked about the length of their visit, activities they participated in while on a forest or Grassland, demographics about themselves such as where they are from, their age, ethnicity and other information, the distance they traveled, how often they visit and their overall satisfaction. About one-third also were asked a series of detailed satisfaction questions about specific aspects of their visit. Another one-third of visitors were asked to provide information about their income, spending while on their trip, and the next best substitute for the visit.
Satisfaction measures Survey participants were asked to provide an overall rating of their recreation experiences on a 5-point Likert scale. A Likert scale is a numerical measurement of a respondent’s level of agreement with a provided statement. About one-third of visitors were asked to rate their satisfaction with and the importance of fourteen items related to the recreation facilities and services at the site or area at which they recreated. The Likert scale for importance ranges from not important to very important. The Likert scale for performance (satisfaction) ranges from very dissatisfied to very satisfied. Results are summarized by site type:
• day use developed • overnight use developed • undeveloped general forest and wilderness
The satisfaction responses are analyzed and reported in several ways. 1. A graph of overall satisfaction is presented in Figure 5. 2. There are two aggregate measures:
o Percent Satisfied Index is the proportion of all ratings for 14 items in each category in which the satisfaction was denoted as either “Somewhat satisfied” or “Very Satisfied.” The agency’s national target for this measure is 85 percent. Table 11 displays the aggregate scores.
o Percent Meet Expectations aggregate measures the proportion of satisfaction ratings that are equal to or greater than the importance rating for a given item. This indicator tracks the similarity between the agency’s performance and customer evaluations of importance. Figure 6 displays these scores.
The satisfaction elements most readily controlled by managers were aggregated into four categories:
• developed facilities

• access • services • visitor safety
The site types sampled were aggregated into three groups:
• developed sites, which includes day use and overnight developed sites • undeveloped areas • wilderness
3. Importance-Performance Analysis was calculated for the mean values of the importance and satisfaction scores. A target level of importance and performance divides the possible set of score pairs into four quadrants. In the context of the recreation visitor survey, the target level for each of the 14 satisfaction items was a numerical average score of 4.0. The quadrant titles help to interpret each score and can provide general guidance for management. The quadrants definitions are:
• Importance at or above 4.0, Satisfaction at or above 4.0: Keep up the good work. These are functions that are important to visitors and which the agency is performing quite well.
• Importance at or above 4.0, Satisfaction under 4.0: Concentrate here. These are functions that are highly important to the public, but performance is not at a satisfactory level. Increasing effort here is likely to have the greatest payoff in overall customer satisfaction.
• Importance below 4.0, Satisfaction above 4.0: Possible overkill. These are functions that are not of the highest importance to visitors but performance is quite good. It may be possible to reduce effort here without greatly harming overall customer satisfaction.
• Importance below 4.0; Satisfaction below 4.0: Low priority. These are functions where performance is not at high levels, but neither are the importance ratings. Focusing effort here is unlikely to have as great an impact on overall satisfaction.
The numerical scores for visitor satisfaction and importance for each of the satisfaction items by site type are presented in Appendix A (Tables A1 – A4). Special attention should be paid to the numeric scores in the Appendix in reviewing and evaluating the Importance-Performance Analysis results for each item. Particular emphasis should be placed on those ratings that are close to but slightly below the 4.0 value, which separates the four quadrants. For these, the distribution of responses as well as the average rating should be reviewed, as the average value could be affected by a relatively small set of very low ratings.
Visitors rated their perception of how crowded their recreation site or area felt to them. Perceptions take into account the type of site and visitors’ expectations. Ratings ranged from 1 (hardly anyone there) to 10 (Overcrowded).
Spending and Economic Contributions
Spending by visitors has important effects to the health of forest-depended economies and supports thousands of jobs in communities near National Forest System lands. To estimate total spending associated with recreation visits this information is collected:
• overall visitation estimate • proportion of visits in each of a series of visitor types • Average spending total for each of the respective visitor types.
Multiplying these three variables gives the total amount of spending by each type of visitor. Summing over all visitor types gives total spending associated with recreation on National Forests and Grasslands.

One-third of the visitor surveys included questions about trip-related spending made within 50 miles of the site visited. Dr. Daniel Stynes of Michigan State University and Dr. Eric White of Oregon State University developed a typology of visitor types and average spending amounts for each. The spending that occurs on a recreation trip is greatly influenced by the type of trip taken. Visitors on overnight trips away from home pay for some form of lodging, such as hotel rooms or campground fees, while day-trip visitors do not. Visitors on overnight trips also generally purchase more food during their trip in restaurants or grocery stores than visitors on day trips. Visitors who are close to home usually spend less than visitors traveling longer distances, especially on items such as fuel and food.
Analysis of spending patterns has shown that segments of the visitor market with consistent spending patterns are:
• local visitors on day trips • local visitors on overnight trips staying on the National Forest • local visitors on overnight trips staying off the National Forest • non-local visitors on day trips • non-local visitors on overnight trips staying on the National Forest • non-local visitors on overnight trips staying off the National Forest • non-primary visitors
In addition, these surveys included questions about household income and what the individual considered to be the most likely substitute for their visit to the forest. National results are presented here. Greater detail on the contribution of visitor spending to economic regions around individual National Forest units is available at the National Forest Recreation Economic Contributions website.
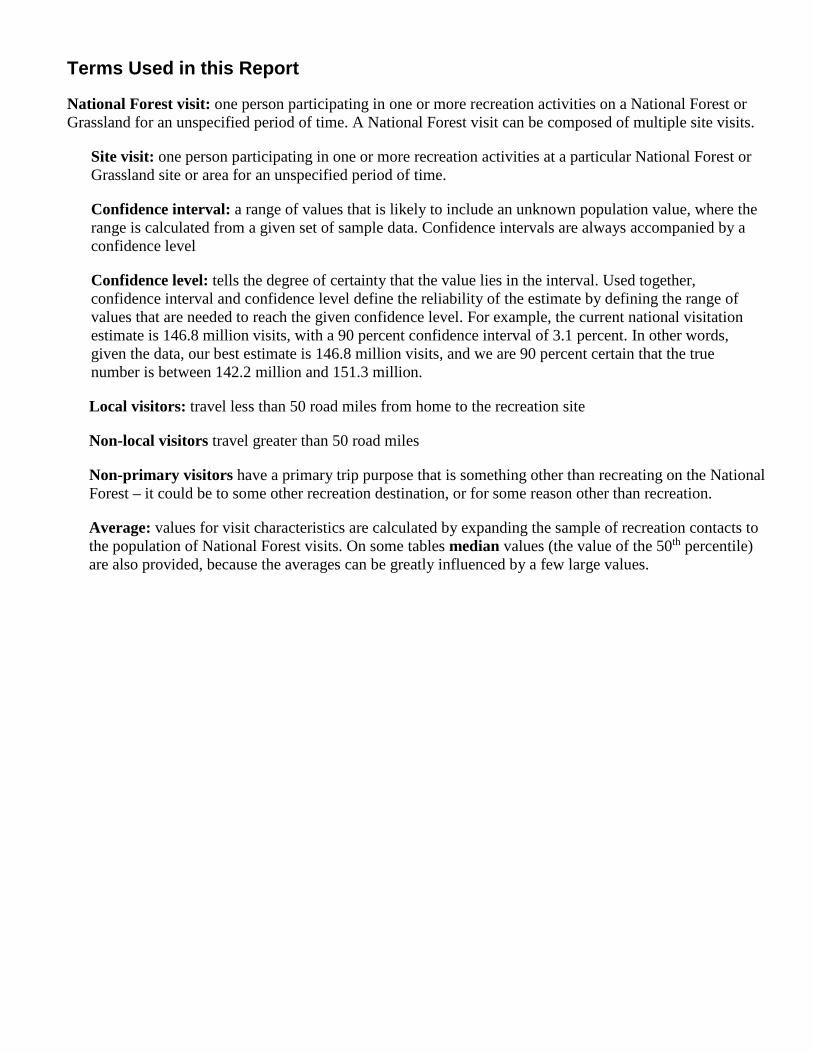
Terms Used in this Report
National Forest visit: one person participating in one or more recreation activities on a National Forest or Grassland for an unspecified period of time. A National Forest visit can be composed of multiple site visits.
Site visit: one person participating in one or more recreation activities at a particular National Forest or Grassland site or area for an unspecified period of time.
Confidence interval: a range of values that is likely to include an unknown population value, where the range is calculated from a given set of sample data. Confidence intervals are always accompanied by a confidence level
Confidence level: tells the degree of certainty that the value lies in the interval. Used together, confidence interval and confidence level define the reliability of the estimate by defining the range of values that are needed to reach the given confidence level. For example, the current national visitation estimate is 146.8 million visits, with a 90 percent confidence interval of 3.1 percent. In other words, given the data, our best estimate is 146.8 million visits, and we are 90 percent certain that the true number is between 142.2 million and 151.3 million.
Local visitors: travel less than 50 road miles from home to the recreation site
Non-local visitors travel greater than 50 road miles
Non-primary visitors have a primary trip purpose that is something other than recreating on the National Forest – it could be to some other recreation destination, or for some reason other than recreation.
Average: values for visit characteristics are calculated by expanding the sample of recreation contacts to the population of National Forest visits. On some tables median values (the value of the 50th percentile) are also provided, because the averages can be greatly influenced by a few large values.

Using this Report
While the National Visitor Use Monitoring program provides a national standard for measuring recreation visitor use, it currently cannot be used to identify trends or make assumptions about changing use patterns:
• Trend analysis is typically based on four or more data points from the same location. No forest or Grassland has yet gone through the survey process that many times.
• Results presented here reflect forest-level data collected during the period FY2010 through FY2014. The national results summarize the data for all reporting units.
The results do provide a good ‘snapshot’ representation of the characteristics of visitors, their visitation patterns, activities, satisfactions, expectations, and the benefits they bring to communities surrounding National Forests.
This report has been written and formatted for a diverse audience. Readers who are interested in accessing the data utilized here can double click the figures throughout the report (in MS Word) to view a table of the data. More results from the National Visitor Use Monitoring program including results for individual reporting units are available at more results from the Visitor Use Monitoring Program
Forest Service Use of Visitor Data Results from the Visitor Use Monitoring program are used for a number of purposes.
• To report the best current estimate of visitation to National Forests and Wilderness Areas, including the proportion of visits that come from targeted demographic groups, including children and minorities.
• To provide a sense of the recreation niche for individual National Forests and their unique contributions to the set of outdoor recreation opportunities available to the public.
• To measure the contribution the Forest Service makes to the health of American public through participation in active outdoor pursuits.
• To provide guidance for how to maintain and improve the set of recreation opportunities the agency provides.
• To document the contribution that Forest Service recreation visitation makes to the economic well-being of both forest-dependent communities and to the nation.
VISITATION ESTIMATES
Table 1a displays the number of annual National Forest visits and National Forest site visits for the entire National Forest System estimated for FY2014. The site visit estimate includes visits to Wilderness Areas. Table 1b shows the estimates for visitation since FY2010. Table 2 shows the number of National Forest and Wilderness visits in each Forest Service region. The current annual visitation estimate is about 147 million National Forest visits. The 90 percent confidence interval for that estimate ranges from 142 million to 151 million. Wilderness accommodates more than 8 million annual recreational visits. Visitation estimates over the last five or six years shows that the number of National Forest visits has generally been stable to slightly increasing.
Most people (85 percent) who recreate on a particular National Forest describe recreating on that forest as their primary destination for the trip away from home (Figure 1). That is, the recreation opportunities provided on land managed by the agency lands were the main reason these visitors decided to make a trip away from home. The rest were people who made a side trip to recreate on the forest, while on a trip whose destination was either recreating someplace other than the National Forest or on a non-recreation trip.

Table 1a. Overall annual visitation estimate for the National Forest System, for FY2014.
National Forest Visits
Visit type Visits (Thousands)
90 Percent Confidence
Interval Width
(Percent)
90 Percent
Confidence Interval Range (Thousands
Of Visits) Total Estimated Site Visits
191,658 2.9 186,099 – 197,216
Designated Wilderness Visitsa
8,304 6.7 7,748 – 8,860
Total Estimated National Forest Visits
146,810 3.1 142,259 – 151,361
a Designated Wilderness visits are included in the Site Visits estimate.
Table 1b. National visitation estimate for the National Forest System, FY-2005-FY2014
Visits (Thousands)
Visit type FY2005-FY2009
FY2006-FY2010
FY2007-FY2011
FY2008-FY2012
FY2009 –
FY2013
FY2010-FY2014
Day Use Developed Sites
69,767 69,232 70,293 70,532 72,356 72,833
Overnight Use Developed Sites
14,858 16,060 18,173 17,455 16,473 15,846
General Forest Areas
93,321 94,116 95,266 97,171 94,967 94,673
Wilderness 6,471 6,794 7,701 8,038 8,098 8,304 Total Site Visits
184,417 186,202 191,384 193,196 191,893 191,658
National Forest Visits
142,664 143,626 145,504 147,470 146,662 146,810

Table 2. Regional annual visitation estimates for the National Forest System, for FY2010 - FY2014.
Region National Forest Visits (1000s)
90 Percent Confidence Interval, As Percent Of
Visits
Wilderness Visits (1000s)
90 Percent Confidence Interval, As Percent Of
Visits
01: Northern 8,470 8.8 439 14.2
02: Rocky Mountain 29,538 8.3 1,407 12.9
03: Southwestern 13,782 7.2 1,897 21.8
04: Intermountain 18,806 11.1 880 22.3
05: Pacific Southwest
22,755 8.9 1,024 12.0
06: Pacific Northwest
13,187 5.4 1,099 8.1
08: Southern 25,156 6.9 775 21.5
09: Eastern 12,690 89.2 533 15.2
10: Alaska 2,428 10.7 42 37.3
TOTAL 146,810 3.1 8,096 6.8
Figure 1. Purpose of Trip for FY2010 - FY2014.
85%
9%
6%
Recreation at this Forest
Recreation at someother destination
Non-Recreation trip

DESCRIPTION OF THE RECREATION VISIT
Demographics Demographic characteristics provide an overall picture of the customer base for National Forest recreation. Table 3 shows the percentage of visits by men and women. Table 4 presents racial and ethnic distribution of visits, and Table 5 shows the age distribution. A large proportion of National Forest visits and visits to designated wilderness come from people who live nearby (Figure 3). Foreign visitors are not overly common (Table 6); Europeans account for almost half of all foreign visits, and Canadians about one-third of foreign visits.
Table 3. Percent of National Forest and wilderness visits by gender, for FY2010 - FY2014
Gender National Forest Visits (Percent)
Wilderness Visits (Percent)
Female 37.5 41.0 Male 62.5 59.0 Total 100.0 100.0
Table 4. Percent of National Forest and wilderness visits by race and ethnicity, for FY2010 - FY2014.
Race/Ethnicitya National Forest Visits (Percent)
Wilderness Visits (Percent)
American Indian/Alaska Native
2.3 1.7
Asian 2.3 3.1 Black/African American
1.2 0.7
Native Hawaiian or other Pacific Islander
1.2 0.7
White 94.9 95.6 Spanish, Hispanic, or Latino
5.5 5.9
A“Spanish, Hispanic or Latino” is presented in a separate question because it is an ethnicity, not a race. Respondents first stated whether they were of this ethnicity, then a separate question asked which of the racial categories applied to them. Respondents could choose more than one racial group.
Table 5. Percent of National Forest and wilderness visits by age class, for FY2010 - FY2014.
Age National Forest Visits
(Percent)
Wilderness Visits (Percent)
Under 16 16.2 12.4 16-19 3.6 3.1 20-29 13.5 17.0

- 8 -
Age National Forest Visits
(Percent)
Wilderness Visits (Percent)
30-39 15.1 16.3 40-49 17.5 16.2 50-59 17.6 18.8 60-69 12.2 12.5 70 and over 4.3 3.7 Total 100.0 100.0
Figure 2. Distribution of National Forest and wilderness visits by age group.
201816141210
86420
% of Visits
Under 1616-19 20-29 30-39 40-49 50-59 60-69Over 70
Age group
National forest visits
Wilderness visits

- 9 -
Figure 3. Distribution of National Forest visits by travel distance categories, for FY2010 - FY2014.
35
30
25
20
15
10
5
0Under 25-49 50-74 75-99 100-199 200-499 Over25 mi. mi. mi. mi. mi. mi. 500 mi.
Distance travelled
% NF visits
% Wilderness visits
% of Visits
Table 6. Percent of National Forest visits by origin for foreign visitors, for FY2010 - FY2014.
Origin % National Forest Visits
Asia 0.1
Canada 0.6
Europe 0.9
Mexico 0.1
South America <0.1
Some other origin
0.4
Visit Descriptions
Characteristics of the recreation visit such as length of visit, types of sites visited, activity participation and visitor satisfaction with forest facilities are of interest to a variety of stakeholders. Short visits to National Forests and Wilderness Areas are typical (Table 7) and the great majority of visitors to National Forests only go to one location on the forest during their visit (Table 8). However, some visitors do go to more than one recreation site or area. Often, these are the people who stay for a relatively long time, and visit a large number of different locations. Visitors were asked how often they visit a given National Forest for all recreational activities, and how often for their primary activity (Table 9). Most visits are made by people who visit the forest on which they were surveyed only a few times per year Most of the people who visit frequently are people who live close to the forests they visit.
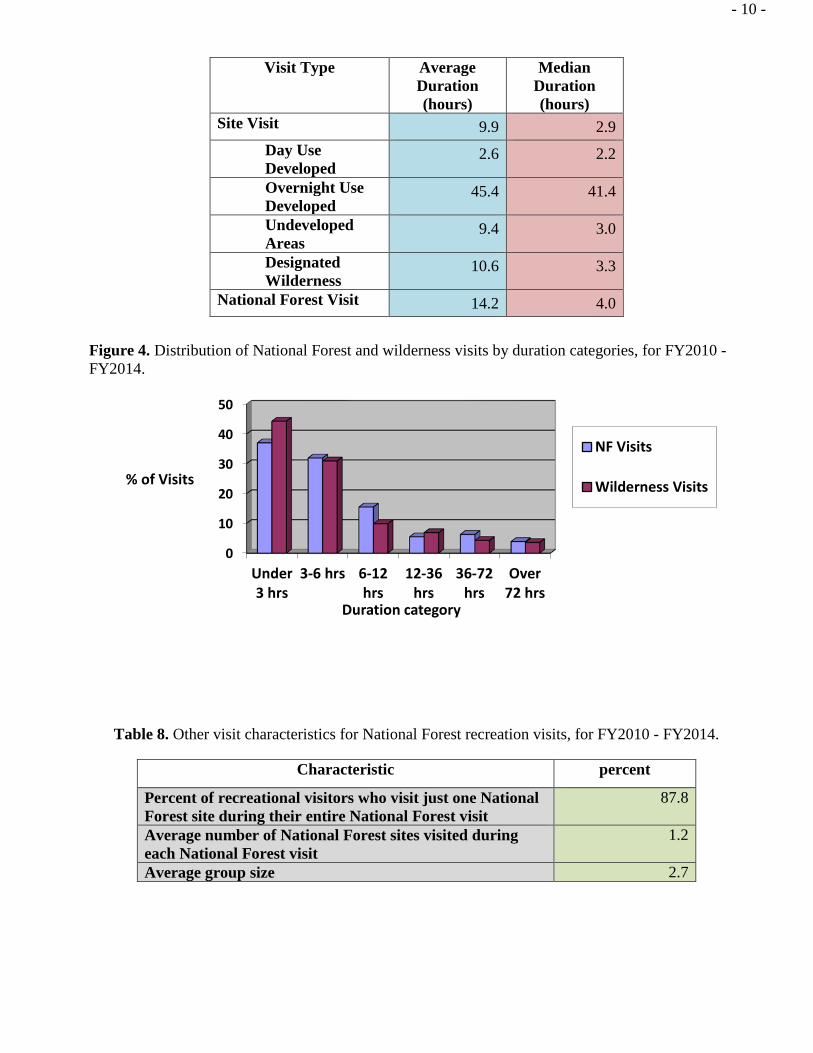
Table 7. Visit duration for National Forest visits, for FY2010 - FY2014.
- 10 -
Visit Type Average Duration (hours)
Median Duration (hours)
Site Visit 9.9 2.9 Day Use Developed
2.6 2.2
Overnight Use Developed
45.4 41.4
Undeveloped Areas
9.4 3.0
Designated Wilderness
10.6 3.3
National Forest Visit 14.2 4.0
Figure 4. Distribution of National Forest and wilderness visits by duration categories, for FY2010 - FY2014.
50
40
30
20
10
0
% of Visits
Under 3-6 hrs 6-12 12-36 36-72 Over3 hrs hrs hrs hrs 72 hrs
Duration category
NF Visits
Wilderness Visits
Table 8. Other visit characteristics for National Forest recreation visits, for FY2010 - FY2014.
Characteristic percent
Percent of recreational visitors who visit just one National Forest site during their entire National Forest visit
87.8
Average number of National Forest sites visited during each National Forest visit
1.2
Average group size 2.7

- 11 -
Table 9. Percent of National Forest visits by annual visit frequency, for FY2010 - FY2014
Number of reported Annual visits
All Activities Primary Activity
1 – 5 times per year 48.6% 55.9% 6 – 10 times per year 11.8% 12.6% 11 – 15 times per year 6.1% 6.0% 16 – 20 times per year 4.9% 4.5% 21 – 25 times per year 2.9% 2.9% 26 – 30 times per year 3.6% 3.2% 31 – 35 times per year 0.6% 0.6% 36 – 40 times per year 2.1% 1.7% 41 – 50 times per year 3.9% 3.3% 51 – 100 times per year 7.1% 5.4% 101 – 200 times per year 5.1% 2.6% 201 – 300 times per year 1.9% 0.8% Over 300 times per year 1.3% 0.5%
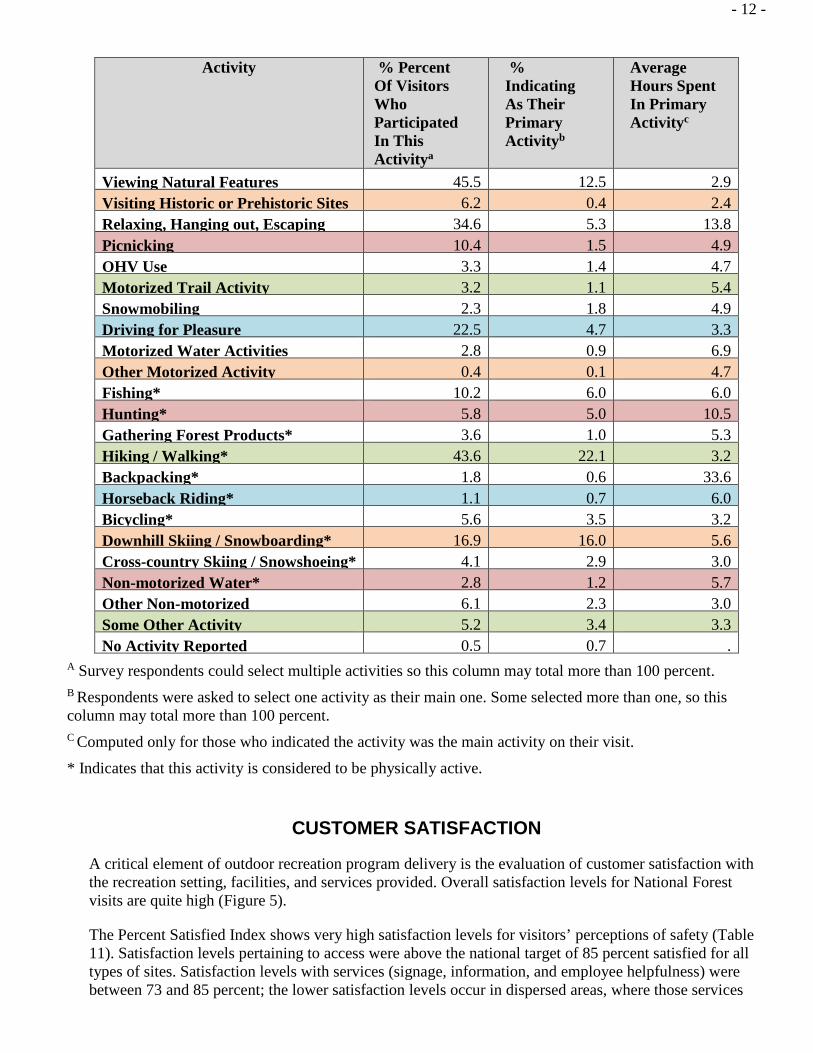
Activities Most National Forest visitors participate in several recreation activities during each visit. Nearly all identify a single primary activity for the visit. A small portion list more than one primary activity; a few do not specify any primary activity. Visitors were asked how many hours they spent doing their primary activity (Table 10).
Recreation on National Forests also contributes to the overall health of those who visit. Around 59 percent of visits come primarily to engage in a physically active pursuit. On average, these people spend about 7 hours per visit participating in their primary activity.
Table 10. Activity participation for National Forest recreation visits, for FY2010 - FY2014.
Activity
% Percent Of Visitors Who Participated In This Activitya
% Indicating As Their Primary Activityb
Average Hours Spent In Primary Activityc
Developed Camping 8.1 3.0 38.2 Primitive Camping 2.6 0.5 31.4 Resort Use 2.4 0.2 36.4 Nature Center Activities 7.1 0.5 2.0 Nature Study 6.2 0.3 3.8 Viewing Wildlife 30.2 1.8 3.5
- 12 -
Activity
% Percent Of Visitors Who Participated In This Activitya
% Indicating As Their Primary Activityb
Average Hours Spent In Primary Activityc
Viewing Natural Features 45.5 12.5 2.9 Visiting Historic or Prehistoric Sites 6.2 0.4 2.4 Relaxing, Hanging out, Escaping
34.6 5.3 13.8
Picnicking 10.4 1.5 4.9 OHV Use 3.3 1.4 4.7 Motorized Trail Activity 3.2 1.1 5.4 Snowmobiling 2.3 1.8 4.9 Driving for Pleasure 22.5 4.7 3.3 Motorized Water Activities 2.8 0.9 6.9 Other Motorized Activity 0.4 0.1 4.7 Fishing* 10.2 6.0 6.0 Hunting* 5.8 5.0 10.5 Gathering Forest Products* 3.6 1.0 5.3 Hiking / Walking* 43.6 22.1 3.2 Backpacking* 1.8 0.6 33.6 Horseback Riding* 1.1 0.7 6.0 Bicycling* 5.6 3.5 3.2 Downhill Skiing / Snowboarding* 16.9 16.0 5.6 Cross-country Skiing / Snowshoeing* 4.1 2.9 3.0 Non-motorized Water* 2.8 1.2 5.7 Other Non-motorized 6.1 2.3 3.0 Some Other Activity 5.2 3.4 3.3 No Activity Reported 0.5 0.7 .
A Survey respondents could select multiple activities so this column may total more than 100 percent. B Respondents were asked to select one activity as their main one. Some selected more than one, so this column may total more than 100 percent. C Computed only for those who indicated the activity was the main activity on their visit. * Indicates that this activity is considered to be physically active.
CUSTOMER SATISFACTION
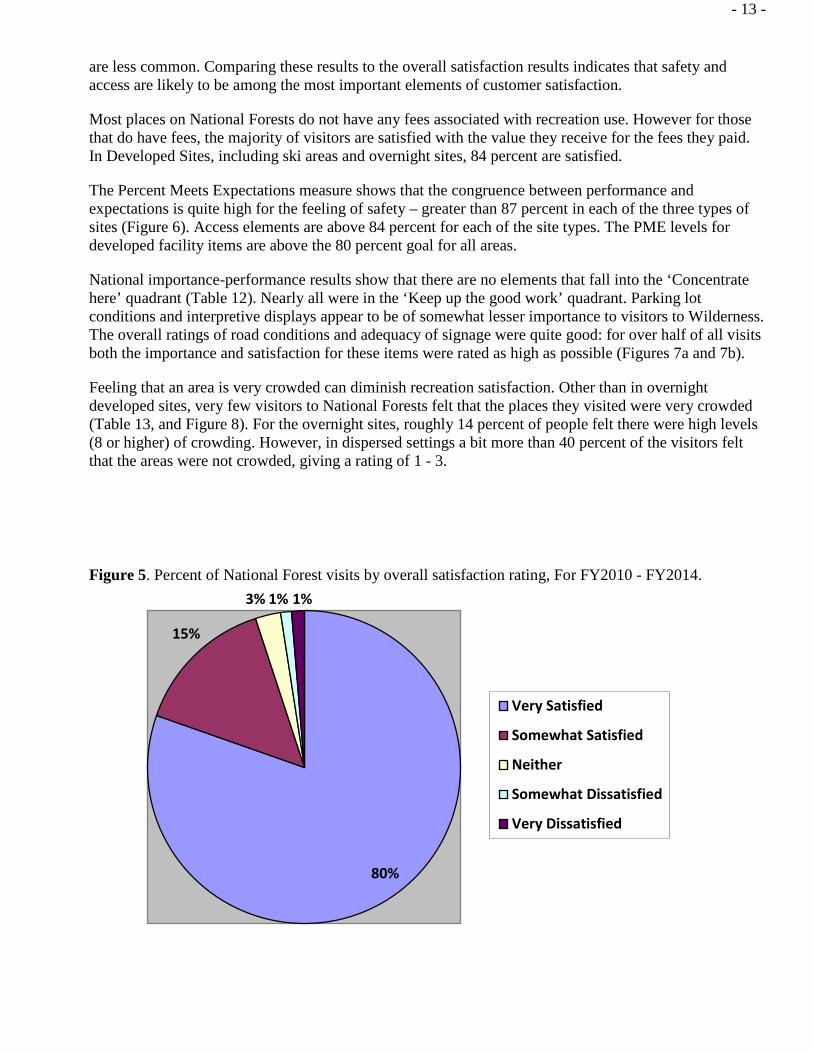
A critical element of outdoor recreation program delivery is the evaluation of customer satisfaction with the recreation setting, facilities, and services provided. Overall satisfaction levels for National Forest visits are quite high (Figure 5).
The Percent Satisfied Index shows very high satisfaction levels for visitors’ perceptions of safety (Table 11). Satisfaction levels pertaining to access were above the national target of 85 percent satisfied for all types of sites. Satisfaction levels with services (signage, information, and employee helpfulness) were between 73 and 85 percent; the lower satisfaction levels occur in dispersed areas, where those services
- 13 -
are less common. Comparing these results to the overall satisfaction results indicates that safety and access are likely to be among the most important elements of customer satisfaction.
Most places on National Forests do not have any fees associated with recreation use. However for those that do have fees, the majority of visitors are satisfied with the value they receive for the fees they paid. In Developed Sites, including ski areas and overnight sites, 84 percent are satisfied.
The Percent Meets Expectations measure shows that the congruence between performance and expectations is quite high for the feeling of safety – greater than 87 percent in each of the three types of sites (Figure 6). Access elements are above 84 percent for each of the site types. The PME levels for developed facility items are above the 80 percent goal for all areas.
National importance-performance results show that there are no elements that fall into the ‘Concentrate here’ quadrant (Table 12). Nearly all were in the ‘Keep up the good work’ quadrant. Parking lot conditions and interpretive displays appear to be of somewhat lesser importance to visitors to Wilderness. The overall ratings of road conditions and adequacy of signage were quite good: for over half of all visits both the importance and satisfaction for these items were rated as high as possible (Figures 7a and 7b).
Feeling that an area is very crowded can diminish recreation satisfaction. Other than in overnight developed sites, very few visitors to National Forests felt that the places they visited were very crowded (Table 13, and Figure 8). For the overnight sites, roughly 14 percent of people felt there were high levels (8 or higher) of crowding. However, in dispersed settings a bit more than 40 percent of the visitors felt that the areas were not crowded, giving a rating of 1 - 3.
Figure 5. Percent of National Forest visits by overall satisfaction rating, For FY2010 - FY2014.
80%
15%
3% 1% 1%
Very Satisfied
Somewhat Satisfied
Neither
Somewhat Dissatisfied
Very Dissatisfied

- 14 -
Table 11. National Forest visitation percent satisfaction indexa scores for aggregate categories, for FY2010 - FY2014.
Satisfied Survey Respondents (percent)
Items Rated Developed Sitesb General Forest Areas
Designated Wilderness
Developed Facilities (includes restroom cleanliness and facility condition)
89.4 82.0 83.8
Access (includes parking availability, parking lot condition, road condition and trail condition)
88.6 85.2 87.6
Services (includes availability of information, signage and employee helpfulness)
85.0 73.5 79.4
Perception of Safety 97.1 93.3 95.8 Value received for any Fee Paid at the site
83.9 82.1 90.4
A Composite ratings of the proportion of satisfaction ratings scored by visitors as satisfied or very satisfied. The values are computed as the percentages of all ratings for the elements within the groupings that are at or above the target level, and indicate the percent of all visits where the person was satisfied with agency performance. B This category includes both Day Use and Overnight Use Developed Sites.
Figure 6. Percent meets expectations results for National Forest visits by type of site, for FY2010 - FY2014.
100
80
60
40
20
0
% of Visits
Developed Access Services PerceptionFacilities of Safety
Developed Sites
Undeveloped Areas
DesignatedWilderness

- 15 -
Table 12. Importance-performance ratings for satisfaction items, by type of site.
ITEM Day Use
Developed Sites Overnight Use Developed Sites
Undeveloped Areas
Designated Wilderness
Restroom cleanliness Keep up the Good Work
Keep up the Good Work
Keep up the Good Work
Keep up the Good Work
Developed facility condition
Keep up the Good Work
Keep up the Good Work
Keep up the Good Work
Keep up the Good Work
Condition of environment
Keep up the Good Work
Keep up the Good Work
Keep up the Good Work
Keep up the Good Work
Employee helpfulness Keep up the Good Work
Keep up the Good Work
Keep up the Good Work
Keep up the Good Work
Interpretive display Keep up the Good Work
Keep up the Good Work
Possible Overkill Possible Overkill
Parking availability Keep up the Good Work
Keep up the Good Work
Keep up the Good Work
Keep up the Good Work
Parking lot condition Keep up the Good Work
Keep up the Good Work
Keep up the Good Work
Possible Overkill
Rec. info. available Keep up the Good Work
Keep up the Good Work
Keep up the Good Work
Keep up the Good Work
Road condition Keep up the Good Work
Keep up the Good Work
Keep up the Good Work
Keep up the Good Work
Feeling of safety Keep up the Good Work
Keep up the Good Work
Keep up the Good Work
Keep up the Good Work
Scenery Keep up the Good Work
Keep up the Good Work
Keep up the Good Work
Keep up the Good Work
Signage adequacy Keep up the Good Work
Keep up the Good Work
Keep up the Good Work
Keep up the Good Work
Trail condition Keep up the Good Work
Keep up the Good Work
Keep up the Good Work
Keep up the Good Work
Value for fee paid Keep up the Good Work
Keep up the Good Work
Keep up the Good Work
Keep up the Good Work

- 16 -
Figure 7a. Overall satisfaction with forest-wide road conditions and signage adequacy, for FY2010 - FY2014.
100%
80%
sit 60%
isf Vo 40%
%
20%
0%Roads Signage
Very Dissatisfied
Somewhat Dissatisfied
Neither
Somewhat Satisfied
Very Satisfied
Figure 7b. Overall Importance ratings for road condition and signage adequacy, for FY2010 - FY2014.
100%
80%
tsis 60%
f Vi
o 40%
%
20%
0%Roads Signage
1 (Low)
2
3
4
5 (High)
Table 13. National Forest visitor perceptions of crowding by site type, for FY2010 - FY2014.
Perception of Crowding by Site Types (Percent site visits percent)
Crowding Rating Day Use
Developed SitescOvernight Use Developed Sites
General Forest Areas
Designated Wilderness
Areas10 Overcrowded 0.7 1.4 0.7 0.9
9 3.4 5.7 2.8 2.4
8 5.2 6.6 4.0 4.3
7 6.3 5.9 5.7 3.9

- 17 -
Crowding Rating Day Use Developed Sitesc
Overnight Use Developed Sites
General Forest Areas
Designated Wilderness
Areas
6 18.0 28.3 17.8 19.3
5 12.9 8.6 8.6 12.3
4 18.9 15.3 14.9 17.0
3 15.5 13.1 16.4 17.0
2 18.1 13.6 27.5 22.0
1 Hardly anyone there 1.0 1.5 1.6 0.9
Figure 8. Distribution of site visits into general crowding categories.
100%90%80%70%
sit 60%
is 50%
f Vo 40%
% 30%20%10%
0%Day Use Overnight GFAs Wilderness
Use
Site Type
High ( 8 - 10)
Moderate (4 - 7)
Low (1 - 3)
Disabilities The Forest Service is committed to integrating accessibility considerations into its sustainable recreation planning so all people, including those with disabilities, can recreate. The accessibility of recreation facilities is an important part of this policy. Around seven percent of National Forest visits are made by people in groups where one or more group members have a disability (Table 14). For more than 85 percent of these parties, the facilities they used were rated as accessible.
Table 14. Accessibility for National Forest visits by persons with disabilities, for FY2010 - FY2014.
Item Percent Percent of visitors interviewed with group member having a disability 6.8 Of this group, percent who said facilities at site visited were accessible 85.7

- 18 -
VISITOR SPENDING AND ECONOMICS
Visitor Spending Visitors to National Forests often spend money in nearby communities during the time they are on their recreation trips. These communities benefit directly from that spending. About 47 percent of visits to National Forests are from residents of the local area who are on day trips. Few local residents stay overnight on or near the forests. About 10 percent of non-local residents make visits while on day trips away from home. More non-locals on overnight trips spend the night in facilities off the forest than on the forest. For 1 out of about every 8 visits, a National Forest was not the primary destination for the trip away from home. Visitors spend money in towns that are near National Forests for things like gasoline, food, lodging, and souvenirs. The spending segments differ markedly in the amount of money per party. In general, visitors who come from outside the local area spend more than do those who are from the local area. Those parties staying overnight off of National Forest lands spend more than those who spend the night on the National Forest. Those coming for the primary purpose of downhill skiing typically spend more per visit than for other types of recreation.
Overall, recreating visitors spent about $10 billion in areas around National Forest System lands (Table 15). Many downhill skiers are from outside the local area and are staying in off-forest lodging. As a result, downhill skiers account for around $3 billion in local spending. Visitors for wildlife-related recreation spend least as a group, largely because roughly two-thirds of these visits are made by people on day trips away from home. As visitor spending ripples through the economy, further economic activity is created. In total, spending by visitors to National Forests and Grasslands contributes about $10.3 billion to the US economy and sustains over 140,000 full-and part-time jobs. Greater detail on the contribution of visitor spending to economic regions around individual National Forest units is available in the Economic Contribution of Recreation: Website User Guide.
Table 15. Visitor spending and associated economic effects of recreation visits to National Forest land, for FY2010 - FY2014.
Visitor influence Downhill Skiing Visits
Wildlife-Related Visits
Other Recreation
Visits TOTAL, ALL VISITS
Millions of National Forest Visits
21.6 19.8 105.4 146.8
Direct spending in local economies, (millions of $2014)
$2,889 $1,094 $5,591 $9,574
Total GDP contributions (millions of $2014)
$2,717 $1,128 $6,419 $10,265
Full- and part-time jobs sustained, (thousands)
41.2 14.6 87.0 142.8

- 19 -
About 38 percent of visits to National Forests are made by people who are spending at least one night away from home (Table 16). For most of them, it includes at least one night spent within 50 miles of the forest they visited. Those spending the night within 50 miles of the forest stay an average of about 5 nights. For those spending one or more nights on or near the forest, about 38 percent stay in hotels or lodges off the forest. About 19 percent camp at developed campgrounds on the National Forest, and about 9 percent camp in undeveloped areas of the forest.
Table 16. Visitor trip information, for FY2010 - FY2014.
Item Percent
Percent of visits that occur on trips with an overnight stay away from home
38.7
Percent of visits that occur on trips with an overnight stay within 50 miles of the visited forest
36.0
For overnight visits, average number of nights within 50miles of the forest
5.6
For those staying overnight within 50 miles of the forest,
percent indicating each type of lodging
Percent
NF campgrounds ON the National Forest 19.2 Camping in undeveloped areas of the National Forest 8.9 Cabins, lodges, hotels or huts ON the National Forest 7.8 Other public campgrounds (Park Service, BLM, State Park, other) 2.5 Private campgrounds NOT on the National Forest 2.3 Rented home, condo, cabin, lodge or hotel NOT on the NF 38.3 Private home of friend or relative 13.1 Home, cabin, or condo owned by visitor 9.9 Other 1.1
Household Income The income distribution of visitors to National Forests is varied (Figure 9). About fourteen percent of visits are made by individuals whose household income is over $150,000 per year. A slightly smaller percentage (11 percent) comes from people in households earning less than $25,000 per year. Forty-two percent of all visits come from people in households earning between $25,000 and $75,000 per year.

- 20 -
Figure 9. Household income of National Forest recreation visits, for FY2010 - FY2014.
11%
19%
23%17%
16%
14%
Under $25,000
$25,000 - $49,999
$50,000 - $74,999
$75,000 - $99,999
$100,000 - $149,999
$150,000 plus
Substitute behavior
Travel cost models of economic value must include some measure of substitute behavior. The question we asked was what people would do if the forest was not available for recreation for this visit. Almost half (48 percent) indicate that their substitute behavior choice is activity driven – that is, their substitute is going elsewhere for same activity (Figure 10). About twenty percent indicate they would come back later for the same activity. Very few (2 percent) said they would have gone to work instead. Visitors who said they would have gone somewhere else for recreation also indicated how far from their home this alternate destination was (Figure 11). The distribution of travel distances to alternative locations is very similar to the distribution of travel distances for National Forest visits, which may indicate that a reasonable set of alternative destinations indeed exists for most visits.

- 21 -
Figure 10. Substitute behavior choices of National Forest visitors, for FY2010 - FY2014.
Figure 11. Reported distance visitors would travel to alternative recreation locations, for fy2010 - fy2014.
48%
20%
10%
16%
2%4%
Go elsewhere, sameactivity
Come Later
Go elsewhere, otheractivity
Stay home
Go to work
Other
40
35
30
25
% of Visits20
15
10
5
00-25 mi. 26-50 mi. 51-75 mi. 76-100 101-200 201-300 Over 300
mi. mi. mi. mi.Distance

- 22 -
Appendix A. Detailed Satisfaction Results
Table A-1. Satisfaction of National Forest recreation visitors at developed day use sites, for FY2010 - FY2014.
ITEM Very Dissatisfied
Somewhat Dissatisfied
Neither Somewhat Satisfied
Very Satisfie
d
Avg. Rating
Mean Importance
Restroom cleanliness
1.8 3.4 9.1 21.8 63.8 4.4 4.5
Developed facility condition
0.3 1.2 5.7 22.2 70.6 4.6 4.4
Condition of environment
0.6 1.5 5.2 21.8 70.9 4.6 4.7
Employee helpfulness
1.1 0.6 5.1 13.4 79.8 4.7 4.5
Interpretive displays
1.4 4.9 16.2 26.2 51.3 4.2 4.0
Parking availability
2.5 4.3 6.6 16.5 70.1 4.5 4.4
Parking lot condition
1.1 1.9 9.0 18.3 69.8 4.5 4.1
Rec. info. availability
1.0 2.9 11.7 22.9 61.5 4.4 4.3
Road condition
0.8 2.4 8.7 23.3 64.8 4.5 4.4
Feeling of safety
0.1 0.5 2.5 13.3 83.6 4.8 4.7
Scenery 0.2 0.3 2.9 10.7 85.9 4.8 4.6
Signage adequacy
1.1 4.1 9.6 22.2 63.0 4.4 4.3
Trail condition
0.3 1.9 7.5 23.5 66.8 4.5 4.5
Value for fee paid
3.1 4.4 9.9 19.8 62.7 4.3 4.6
*Scale is: Very Dissatisfied = 1 Dissatisfied = 2 Neither = 3 Satisfied = 4 Very Satisfied = 5 ** Scale is: 1= Not Important 2= Somewhat Important 3= Moderately Important 4= Important 5 = Very Important

- 23 -
Table A-2. Satisfaction of National Forest recreation visitors at developed overnight sites, for FY2010 - FY2014.
ITEM Very
Dissatisfied
Somewhat Dissatisfie
d
Neither Somewhat Satisfied
Very Satisfied
Avg. Rating
Mean Importance
Restroom cleanliness
2.7 4.2 8.0 22.1 63.0 4.4 4.7
Developed facility condition
0.2 1.4 5.2 25.3 67.9 4.6 4.5
Condition of environment
0.2 2.5 3.2 18.1 75.9 4.7 4.8
Employee helpfulness
1.4 0.8 2.5 10.2 85.1 4.8 4.7
Interpretive displays
1.4 3.5 16.6 26.9 51.6 4.2 4.2
Parking availability
1.0 1.5 5.0 16.6 76.0 4.7 4.4
Parking lot condition
0.2 1.1 4.6 19.7 74.4 4.7 4.3
Rec. info. availability
1.4 4.5 11.2 28.1 54.8 4.3 4.4
Road condition
1.1 3.8 8.0 27.5 59.6 4.4 4.4
Feeling of safety
0.3 0.4 1.5 14.7 83.2 4.8 4.7
Scenery 0.2 0.4 2.0 12.0 85.4 4.8 4.7
Signage adequacy
1.1 3.2 9.7 22.5 63.6 4.4 4.5
Trail condition
0.8 1.7 5.7 22.3 69.5 4.6 4.5
Value for fee paid
0.9 2.8 6.8 23.0 66.6 4.5 4.6
*Scale is: Very Dissatisfied = 1 Dissatisfied = 2 Neither = 3 Satisfied = 4 Very Satisfied = 5 ** Scale is: 1= Not Important 2= Somewhat Important 3= Moderately Important 4= Important 5 = Very Important

- 24 -
Table A-3. Satisfaction of National Forest recreation visitors in dispersed areas, for FY2010 - FY2014.
ITEM Very Dissatisfie
d
Somewhat Dissatisfied
Neither Somewhat Satisfied
Very Satisfied
Avg. Rating
Mean Importanc
e
Restroom cleanliness
3.2 5.9 14.1 23.8 52.9 4.2 4.3
Developed facility condition
0.6 2.3 10.8 25.3 61.0 4.4 4.2
Condition of environment
0.6 2.9 6.7 21.6 68.2 4.5 4.7
Employee helpfulness
1.0 0.4 9.9 13.8 74.9 4.6 4.3
Interpretive displays
2.3 6.5 22.4 26.0 42.7 4.0 3.7
Parking availability
1.6 4.3 8.1 18.5 67.5 4.5 4.2
Parking lot condition
0.9 2.7 8.8 21.9 65.8 4.5 4.0
Rec. info. availability
1.7 5.6 21.3 25.5 45.8 4.1 4.1
Road condition
2.2 5.1 11.3 27.9 53.5 4.3 4.3
Feeling of safety
0.4 1.1 5.3 15.8 77.4 4.7 4.5
Scenery 0.4 0.6 3.8 13.2 82.0 4.8 4.6
Signage adequacy
3.0 6.5 16.5 23.8 50.2 4.1 4.1
Trail condition
0.7 3.4 9.7 26.5 59.8 4.4 4.5
Value for fee paid
2.2 3.2 12.4 14.6 67.6 4.4 4.3
*Scale is: Very Dissatisfied = 1 Dissatisfied = 2 Neither = 3 Satisfied = 4 Very Satisfied = 5 ** Scale is: 1= Not Important 2= Somewhat Important 3= Moderately Important 4= Important 5 = Very Important
- 25 -
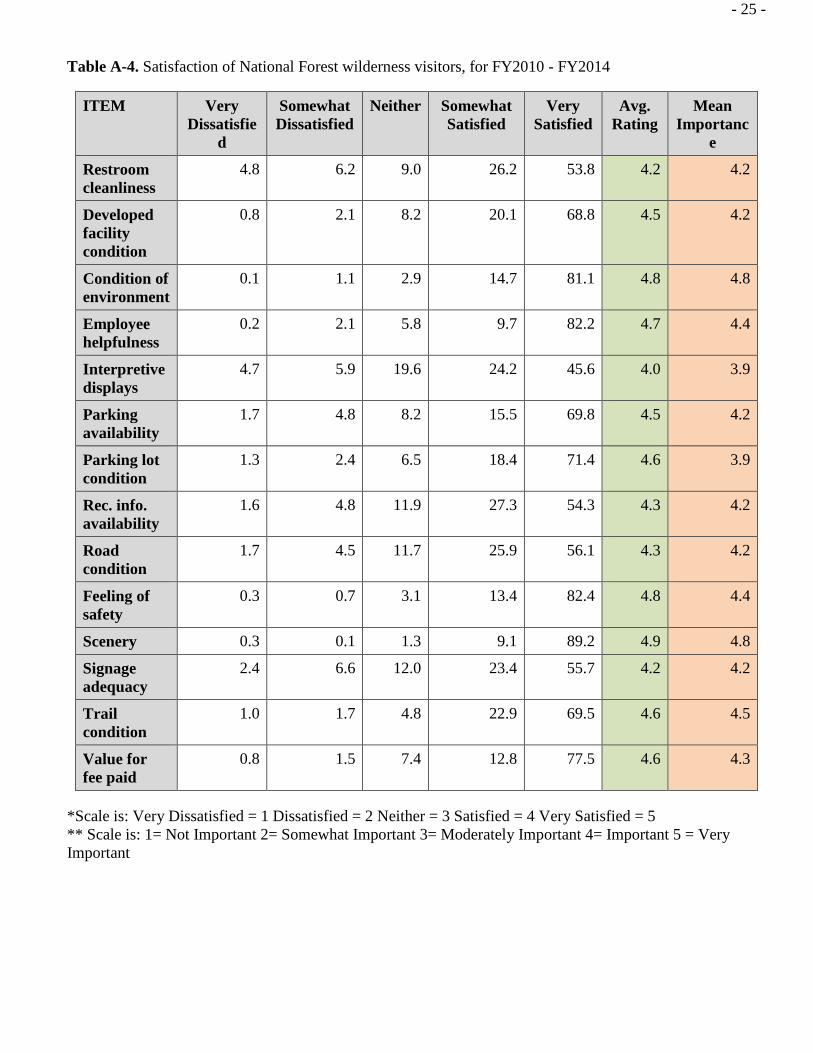
Table A-4. Satisfaction of National Forest wilderness visitors, for FY2010 - FY2014
ITEM Very Dissatisfie
d
Somewhat Dissatisfied
Neither Somewhat Satisfied
Very Satisfied
Avg. Rating
Mean Importanc
e
Restroom cleanliness
4.8 6.2 9.0 26.2 53.8 4.2 4.2
Developed facility condition
0.8 2.1 8.2 20.1 68.8 4.5 4.2
Condition of environment
0.1 1.1 2.9 14.7 81.1 4.8 4.8
Employee helpfulness
0.2 2.1 5.8 9.7 82.2 4.7 4.4
Interpretive displays
4.7 5.9 19.6 24.2 45.6 4.0 3.9
Parking availability
1.7 4.8 8.2 15.5 69.8 4.5 4.2
Parking lot condition
1.3 2.4 6.5 18.4 71.4 4.6 3.9
Rec. info. availability
1.6 4.8 11.9 27.3 54.3 4.3 4.2
Road condition
1.7 4.5 11.7 25.9 56.1 4.3 4.2
Feeling of safety
0.3 0.7 3.1 13.4 82.4 4.8 4.4
Scenery 0.3 0.1 1.3 9.1 89.2 4.9 4.8
Signage adequacy
2.4 6.6 12.0 23.4 55.7 4.2 4.2
Trail condition
1.0 1.7 4.8 22.9 69.5 4.6 4.5
Value for fee paid
0.8 1.5 7.4 12.8 77.5 4.6 4.3
*Scale is: Very Dissatisfied = 1 Dissatisfied = 2 Neither = 3 Satisfied = 4 Very Satisfied = 5 ** Scale is: 1= Not Important 2= Somewhat Important 3= Moderately Important 4= Important 5 = Very Important