national vital statistics reports · national vital statistics reports, vol. 64 no. 5 june 1, 2015...
TRANSCRIPT

National Vital Statistics Reports Volume 64, Number 5 June 1, 2015
Measuring Gestational Age in Vital Statistics Data: Transitioning to the Obstetric Estimate Joyce A. Martin, M.P.H.; Michelle J.K. Osterman, M.H.S.; Sharon E. Kirmeyer, Ph.D.; and Elizabeth C.W. Gregory, M.P.H., Division of Vital Statistics
0
5
10
15
20
25
30
35
40
Per
cent
OE
LMP
34 35 36 37 38 39 40 41 42 and overCompleted weeks of gestation
NOTES: OE is the obstetric estimate of the newborn; the LMP is the date of the mother’s last normal menses. SOURCE: CDC/NCHS, National Vital Statistics System.
Figure 1. OE- and LMP-based measures of gestational age for selected weeks: United States, 2013
U.S. DEPARTMENT OF HEALTH AND HUMAN SERVICES Centers for Disease Control and Prevention
National Center for Health Statistics National Vital Statistics System

2 National Vital Statistics Reports, Vol. 64 No. 5 June 1, 2015
Abstract Objectives—Beginning with the 2014 data year, the National
Center for Health Statistics is transitioning to a new standard for estimating the gestational age of a newborn. The new measure, the obstetric estimate of gestation at delivery (OE), replaces the measure based on the date of the last normal menses (LMP). This transition is being made because of increasing evidence of the greater validity of the OE compared with the LMP-based measure. This report describes the relationship between the two measures. Agreement between the two measures is shown for 2013. Comparisons between the two measures for single gestational weeks and selected gestational age categories for 2013, and trends in the two measures for 2007–2013 by gestational category, focusing on preterm births, are shown for the United States and by race and Hispanic origin and state.
Methods—Data are derived from U.S. birth certificates for 2007–2013 for 100% of reported resident births.
Results—Estimates of pregnancy length were the same for the OE- and LMP-based measures for 62.1% of all births, and within 1 week for 83.4% in 2013. The mean OE-based gestational age for all 2013 births was 38.5 weeks, lower than the LMP-based average of 38.7. Births were less likely to be classified as preterm using the OE (9.62%) than with the LMP (11.39%). The 2013 OE preterm rate was lower than the LMP rate for 49 states and the District of Columbia. The OE-based percentage of full-term deliveries was higher than the LMP-based percentage; levels of late-term and postterm deliveries were lower. Preterm birth rates declined for both measures from 2007 through 2013 (8% compared with 10%). The OE-based 2013 preterm infant mortality rate was 19% higher than the LMP rate.
Keywords: LMP-based gestational age estimate • infant mortality
Introduction Information on the gestational age of the newborn derived from
vital statistics is used extensively for surveillance of preterm birth, to determine optimum gestational age for delivery, and to advance understanding of the etiologies of adverse perinatal outcome (1–7). The Centers for Disease Control and Prevention’s National Center for Health Statistics (NCHS) has measured vital statistics gestational age data based primarily on the difference between the date of the last normal menses (LMP) and the date of infant’s birth since national LMP data first became available in 1981. However, the quality of LMP-based data has long been of concern. Imperfect maternal recall, misinterpretation of bleeding early in pregnancy, irregular menstrual cycles, and data entry errors have been shown to result in the misclassification of gestational age, particularly at preterm (under 37 completed weeks) and postterm (42 weeks and over) (8–13).
An alternative measure of gestational age, the clinical estimate (CE), was added to the 1989 U.S. Standard Certificate of Live Birth. Detailed definitions and instructions for the new measure were not developed or released, however (14,15). Concerns with data quality and the lack of national reporting (California did not report the CE) precluded the estimate from being used as a national measure of gestational age. The CE was replaced with the similar item, the ‘‘obstetric estimate of gestation at delivery’’ (OE) with the 2003 birth certificate revision (16). More detailed definitions and instructions were developed and distributed for the OE, which in brief is defined as ‘‘the
best estimate of the infant’s gestation in completed weeks based on the birth attendant’s final estimate of gestation’’ (17). Despite differences in definitions and instructions, data for the CE and OE appear comparable and are combined in natality public-use files. National data for a combined OE-CE item did not become available until the 2007 data year, however.
Compared with LMP-based estimates, recent studies suggest higher consistency between OE-CE-based estimates and birthweight (18) and better agreement between the OE-CE-based estimates and estimates of gestational age based on an early ultrasound (considered the gold standard) (19). Agreement was also closer between the OE-CE estimates and gestational ages for births conceived using assisted reproductive technology, for which dates of conception were well documented (13). Studies also indicate high to moderate agreement between OE reporting on the birth certificate and information on best estimates of gestational age and estimated delivery dates on hospital medical records (20,21)
Increasing evidence of the greater validity of OE-based data compared with LMP-based data, and the national availability of OE data, have prompted NCHS to transition to the use of the OE as its standard, primary measure of gestational age beginning with the 2014 data year. This report presents a detailed comparison of the two gestational age measures to better understand the implications of this change. The exact agreement between the two measures by detailed gestational age for 2013 is presented. Comparisons are made between the mean OE- and LMP-based gestational ages and percent distributions, focusing on preterm births for the country overall, and by race and Hispanic origin and by state for 2007–2013. Differences in gestation-specific infant mortality rates by measure for 2013 are also described.
Methods
Data for the obstetric estimate measure are based primarily on the 2003 U.S. Standard Certificate of Live Birth item ‘‘Obstetric estimate of gestation.’’ Forty-one states and the District of Columbia (DC), representing 90% of births, reported this item for 2013 (22). The obstetric estimate of gestation is defined as ‘‘the best obstetric estimate of the infant’s gestation in completed weeks based on the birth attendant’s final estimate of gestation’’ (17).
Data for the remaining nine states (10% of records) are based on the 1989 revision of the U.S. Standard Certificate of Live Birth item ‘‘Clinical estimate of gestation.’’ The instructions to hospitals for the 1989 revision simply state that the birth attendant should provide a clinical estimate of gestation not based on the date of LMP and the date of birth (14). For changes in the revised reporting area over the 2007–2013 study period, see ‘‘User Guide to the 2013 Natality Public Use File’’ (22). Despite differences in terminology and instructions, studies (18) and NCHS’ own internal review of CE and OE data for the study period (available upon request; e-mail [email protected]) suggest that estimates based on the obstetric estimate and the clinical estimate of gestation are comparable (18). Accordingly, data for these two measures are combined for this report and are subsequently referred to as the OE.
The OE is edited for an allowable range of 17 through 47 completed weeks of gestation. Less than 1% of all 2013 birth records (0.2%) were either outside of this range or were missing information

3 National Vital Statistics Reports, Vol. 64 No. 5 June 1, 2015
for the OE. Additional standard NCHS edits typically made to the LMP-based data [i.e., for inconsistency with birthweight and substitutions for missing data (see reference 23)] are not applied to the OE data presented in this report. These editing procedures had not been used for OE data in NCHS natality data files prior to 2014, and they were not applied for this report due to the complexity of these edits, resource constraints, and the need to ensure that findings can be replicated using NCHS natality public-use files. Another factor influencing the decision not to further edit these data is the minimal impact of such edits. A comparison of 2014 preliminary data edited for both the allowable range and birthweight-gestational age consistency checks with 2014 preliminary OE data edited only for the allowable range (as the 2007–2013 data shown in this report) indicates that the impact of the birthweight-gestational age consistency check and substitutions for missing data is negligible. For example, the 2014 preliminary OE-based preterm birth rate was 9.57% for both the minimally (range only) and fully edited (birthweight-gestational age consistency check) data. (Detailed data are available upon request.)
The LMP-based measure used in this report is the standard edited gestational age measure used by NCHS since the 1981 data year (COMBGEST field in the public-use birth data file). This measure is based primarily on the difference between the infant’s date of birth and the date of the mother’s last normal menses. The LMP measure is also edited for a range of 17 through 47 completed weeks. Where the date of the LMP is missing, weeks of gestation are imputed based on a previous record with the same month of LMP and birthweight within 500 grams. This imputation was performed for 2.7% of records for 2013. Where the LMP is missing or inconsistent with birthweight, the OE is used if valid and consistent with birthweight (0.4% of 2013 records) (22).
In sum, OE data in this report are edited only for range, whereas the LMP-based data are further edited for missing data and inconsistency with birthweight. The impact of this difference in editing procedures on the OE data and comparisons of the two measures appears negligible. The OE data for 2007–2013 will not be further updated to incorporate these edits and should be considered final estimates. Full editing procedures of the OE will be used beginning with the 2014 birth data files.
Race and Hispanic origin are reported independently on the birth certificate. This report shows ‘‘bridged’’ race categories consistent with those presented in previous NCHS vital statistics reports to facilitate consistency with LMP-based trends for these groups (1). The categories shown are non-Hispanic white, non-Hispanic black, American Indian or Alaska Native (AIAN), Asian or Pacific Islander (API), and Hispanic.
This report presents both absolute (expressed as percentage points) and relative differences in gestational age rates. Unless otherwise stated, all differences noted in the text are statistically significant. For information and discussion on random variation and significance testing see the ‘‘User Guide’’ (22).
The mean gestational age is the arithmetic average of the gestational age of the newborn in completed weeks. The difference between means was tested for statistical significance based on the calculated test statistic, z.
Infant mortality data are from the 2013 period linked birth/infant death file. In this file, information from the death certificate is linked with information from the birth certificate for each infant under age 1 year
who died during 2013. For 2013, 99.0% of all infant death records were successfully linked to the corresponding birth certificate (24).
Consistent with commonly used gestational age categories, ‘‘preterm’’ is defined as under 37 completed weeks of gestation, ‘‘late preterm’’ as 34–36 weeks, ‘‘early term’’ as 37–38 weeks, ‘‘full term’’ as 39–40 weeks, ‘‘late term’’ as 41 weeks, and ‘‘postterm’’ as 42 weeks and over.
Results
Percent agreement—the OE compared with the LMP-based measure of gestational age
• Weeks of gestation were the same for the OE- and LMP-based measures for 62.1% of all 2013 records for which gestational age was known (Table 1). The OE was within 1 week of the LMP for a total of 83.4% of records, and within 2 weeks for 91.4% of all 2013 records.
• When the imputed OE is excluded from the LMP-based measure (as noted in ‘‘Methods,’’ for the LMP-based measure, the OE is substituted where the LMP date is missing or inconsistent with birthweight), exact agreement between the measures was 59.9%; agreement within 1 week was 82.4%; and agreement within 2 weeks was 90.9%.
• When examined by gestational week (including imputed values for the LMP), exact agreement was lowest at the higher gestational ages—1% agreement and less at 43 weeks and over, and 8% at 42 weeks. Exact agreement between the measures was highest at 39 weeks (79%), followed by 40 weeks (67%), and 17–24 weeks (60.6%–68.7%). Patterns of agreement by single gestational week were similar where the imputed OE was excluded.
Mean gestational age—the OE compared with the LMP-based measure of gestational age
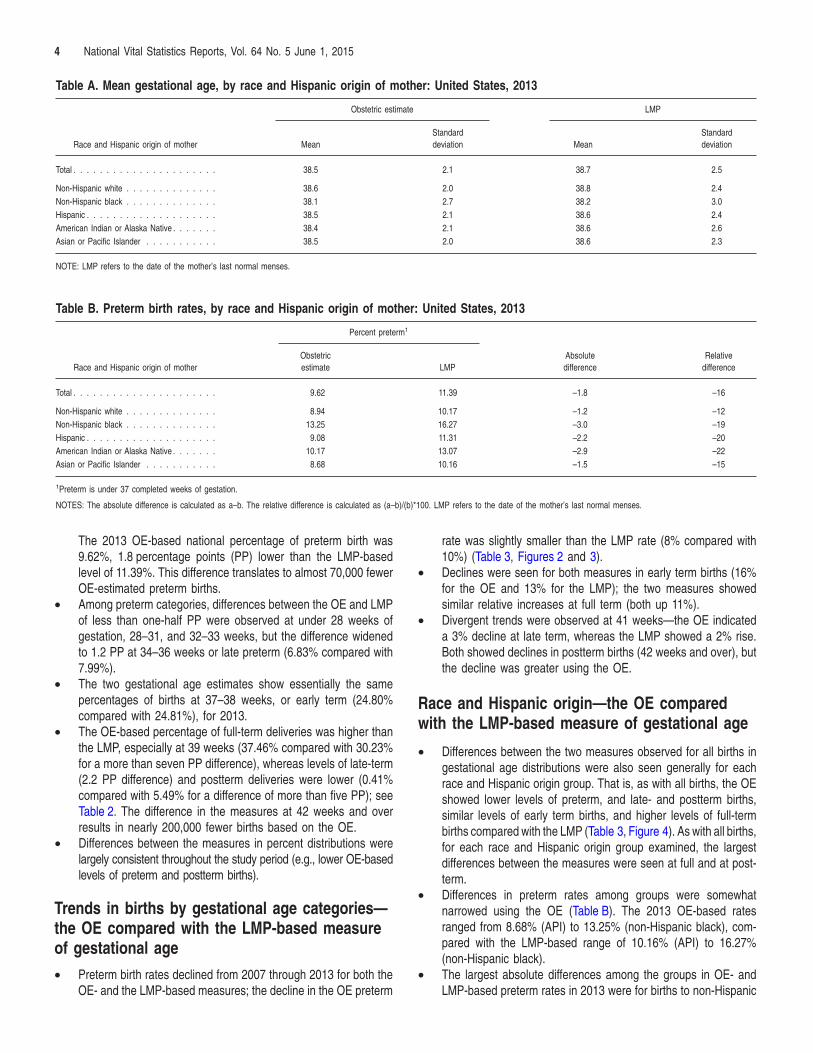
• The mean OE-based gestational age for all births for 2013 was 38.5 weeks, slightly lower than the LMP-based average of 38.7 weeks (Table A).
• Mean OE gestational ages for all race and Hispanic origin groups ranged from 38.1 to 38.6 weeks compared with an LMP-based average range of 38.2 to 38.8 weeks. Differences in means between measures were statistically significant for all groups; however, the largest difference between measures for all groups was 0.2 weeks.
Percent distributions—the OE compared with the LMP-based gestational age
• When the percent distributions of the OE and LMP were examined by single week of gestation for 2013, the smallest absolute differences were observed at under 39 weeks, and the largest at 39–44 weeks (Figure 1, Table 2).
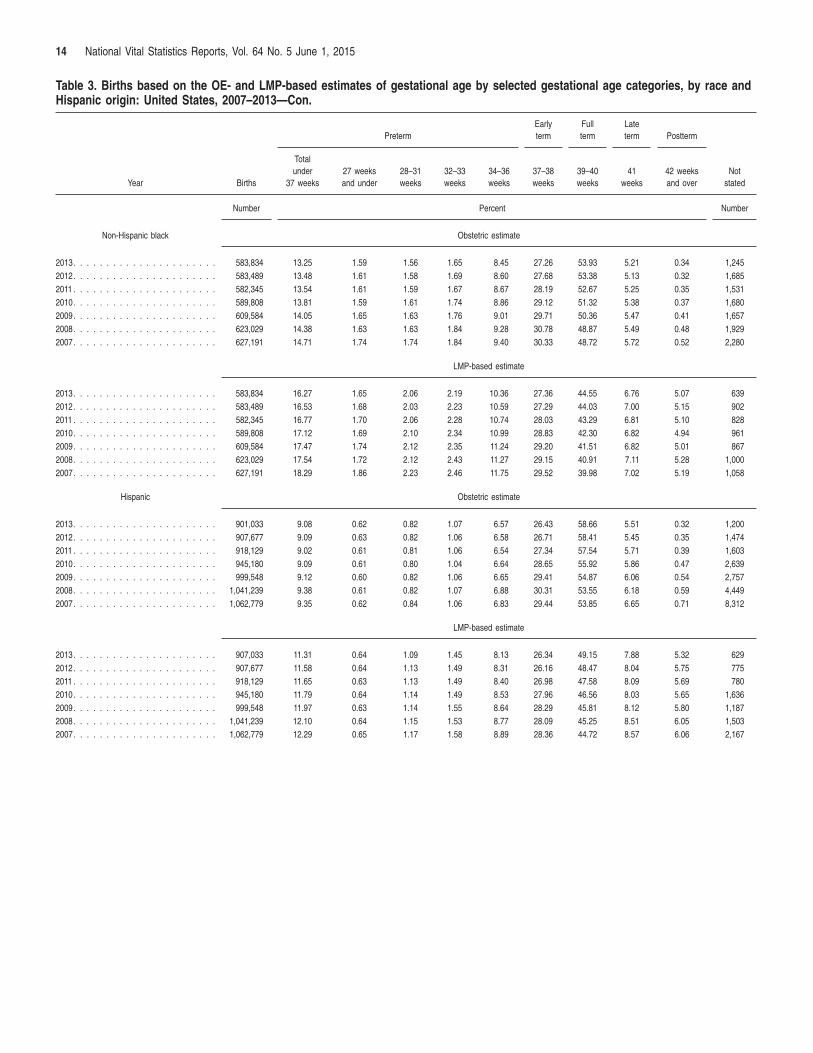
• When examined by selected gestational age categories, births were somewhat less likely to be classified as preterm (under 37 completed weeks) using the OE than with the LMP (Tables B and 3).
4 National Vital Statistics Reports, Vol. 64 No. 5 June 1, 2015
Table A. Mean gestational age, by race and Hispanic origin of mother: United States, 2013
Obstetric estimate LMP
Standard Standard Race and Hispanic origin of mother Mean deviation Mean deviation
Total . . . . . . . . . . . . . . . . . . . . . . 38.5 2.1 38.7 2.5
Non-Hispanic white . . . . . . . . . . . . . . 38.6 2.0 38.8 2.4
Non-Hispanic black . . . . . . . . . . . . . . 38.1 2.7 38.2 3.0
Hispanic . . . . . . . . . . . . . . . . . . . . 38.5 2.1 38.6 2.4
American Indian or Alaska Native . . . . . . . 38.4 2.1 38.6 2.6
Asian or Pacific Islander . . . . . . . . . . . 38.5 2.0 38.6 2.3
NOTE: LMP refers to the date of the mother’s last normal menses.
Table B. Preterm birth rates, by race and Hispanic origin of mother: United States, 2013
Race and Hispanic origin of mother
Percent preterm1
Obstetric estimate LMP
Absolute difference
Relative difference
Total . . . . . . . . . . . . . . . . . . . . . . 9.62 11.39 –1.8 –16
Non-Hispanic white . . . . . . . . . . . . . . 8.94 10.17 –1.2 –12
Non-Hispanic black . . . . . . . . . . . . . . 13.25 16.27 –3.0 –19
Hispanic . . . . . . . . . . . . . . . . . . . . 9.08 11.31 –2.2 –20
American Indian or Alaska Native . . . . . . . 10.17 13.07 –2.9 –22
Asian or Pacific Islander . . . . . . . . . . . 8.68 10.16 –1.5 –15
1Preterm is under 37 completed weeks of gestation.
NOTES: The absolute difference is calculated as a–b. The relative difference is calculated as (a–b)/(b)*100. LMP refers to the date of the mother’s last normal menses.
The 2013 OE-based national percentage of preterm birth was 9.62%, 1.8 percentage points (PP) lower than the LMP-based level of 11.39%. This difference translates to almost 70,000 fewer OE-estimated preterm births.
• Among preterm categories, differences between the OE and LMP of less than one-half PP were observed at under 28 weeks of gestation, 28–31, and 32–33 weeks, but the difference widened to 1.2 PP at 34–36 weeks or late preterm (6.83% compared with 7.99%).
• The two gestational age estimates show essentially the same percentages of births at 37–38 weeks, or early term (24.80% compared with 24.81%), for 2013.
• The OE-based percentage of full-term deliveries was higher than the LMP, especially at 39 weeks (37.46% compared with 30.23% for a more than seven PP difference), whereas levels of late-term (2.2 PP difference) and postterm deliveries were lower (0.41% compared with 5.49% for a difference of more than five PP); see Table 2. The difference in the measures at 42 weeks and over results in nearly 200,000 fewer births based on the OE.
• Differences between the measures in percent distributions were largely consistent throughout the study period (e.g., lower OE-based levels of preterm and postterm births).
Trends in births by gestational age categories— the OE compared with the LMP-based measure of gestational age
• Preterm birth rates declined from 2007 through 2013 for both the OE- and the LMP-based measures; the decline in the OE preterm
rate was slightly smaller than the LMP rate (8% compared with 10%) (Table 3, Figures 2 and 3).
• Declines were seen for both measures in early term births (16% for the OE and 13% for the LMP); the two measures showed similar relative increases at full term (both up 11%).
• Divergent trends were observed at 41 weeks—the OE indicated a 3% decline at late term, whereas the LMP showed a 2% rise. Both showed declines in postterm births (42 weeks and over), but the decline was greater using the OE.
Race and Hispanic origin—the OE compared with the LMP-based measure of gestational age
• Differences between the two measures observed for all births in gestational age distributions were also seen generally for each race and Hispanic origin group. That is, as with all births, the OE showed lower levels of preterm, and late- and postterm births, similar levels of early term births, and higher levels of full-term births compared with the LMP (Table 3, Figure 4). As with all births, for each race and Hispanic origin group examined, the largest differences between the measures were seen at full and at post-term.
• Differences in preterm rates among groups were somewhat narrowed using the OE (Table B). The 2013 OE-based rates ranged from 8.68% (API) to 13.25% (non-Hispanic black), compared with the LMP-based range of 10.16% (API) to 16.27% (non-Hispanic black).
• The largest absolute differences among the groups in OE- and LMP-based preterm rates in 2013 were for births to non-Hispanic

5 National Vital Statistics Reports, Vol. 64 No. 5 June 1, 2015
0
2
4
6
8
10
12
14 OELMP
Per
cent
12.68
10.44
12.33
10.36
12.18
10.07
11.99
9.98
11.73
9.81
11.55
9.76
11.39
9.62
2007 2008 2009 2010 2011 2012 2013
Year NOTES: OE is the obstetric estimate of the newborn; the LMP is the date of the mother’s last normal menses. Preterm is defined as under 37 completed weeks of gestation. SOURCE: CDC/NCHS, National Vital Statistics System.
Figure 2. Preterm births, by OE- and LMP-based measures of gestational age: United States, 2007–2013
–35
–30
–25
–20
–15
–10
–5
0
5
10
15
42 and over4139–4037–38Under 3734–3632–3328–31Under 28
OELMP
Completed weeks of gestation
Per
cent
NOTES: OE is the obstetric estimate of the newborn; the LMP is the date of the mother’s last normal menses. SOURCE: CDC/NCHS, National Vital Statistics System.
Figure 3. Percent change in OE- and LMP-based estimates of gestational age, by gestational age: United States, 2007 and 2013
black (3.02 PP), AIAN (2.90 PP), and Hispanic (2.23 PP) women. The smallest difference (1.23 PP) was for births to non-Hispanic white women (Table B).
• According to the LMP, the 2013 preterm rate for API births (10.16% in 2013) was essentially the same as for non-Hispanic white births (10.17%). However, the 2013 API preterm rate based on the OE was lower than for non-Hispanic white births (8.68% and 8.94%).
• A small but statistically significant difference of 0.1 PP was observed for 2013 between the Hispanic and non-Hispanic white OE-based preterm rate (9.08% and 8.94%, respectively), compared with a 1.1 PP difference between the groups in LMP-based rates (11.31% and 10.17%).

0
2
4
6
8
10
12
14
16
18 OELMP
Per
cent
10.16
8.68
10.17
8.94 9.08
11.31 10.17
13.07
16.27
13.25
Asian or Pacific Non-Hispanic Hispanic American Indian or Non-Hispanic Islander white Alaska Native black
NOTES: OE is the obstetric estimate of the newborn; the LMP is the date of the mother’s last normal menses. Preterm is defined as under 37 completed weeks of gestation. SOURCE: CDC/NCHS, National Vital Statistics System.
Figure 4. Preterm births by OE- and LMP-based gestational age, by race and Hispanic origin: United States, 2013
6 National Vital Statistics Reports, Vol. 64 No. 5 June 1, 2015
–14
–12
–10
–8
–6
–4
–2
0
Asian or Pacific Islander
American Indian or Alaska Native
HispanicNon-Hispanic black
Non-Hispanic white
Total
OELMP
Completed weeks of gestation
Per
cent
NOTES: OE is the obstetric estimate of the newborn; the LMP is the date of the mother’s last normal menses. Preterm is defined as under 37 completed weeks of gestation. SOURCE: CDC/NCHS, National Vital Statistics System.
Figure 5. Percent change in OE- and LMP-based estimates of preterm birth rates, by race and Hispanic origin: United States, 2007 and 2013
• Both measures showed declines in preterm birth rates for all race and Hispanic origin groups from 2007 through 2013. However, as with all births, the OE-based decline was somewhat less pronounced than the LMP for all groups; see Table 3 and Figure 5.
State preterm birth rates—the OE compared with the LMP-based measure of gestational age
• The range in state OE-based preterm rates for 2013 was narrower (5.5 PP difference) than the LMP-based range (8.5 PP) (Table 4).

7 National Vital Statistics Reports, Vol. 64 No. 5 June 1, 2015
(The full OE gestational age distributions for each state are shown in Table 5.)
• The 2013 OE-based preterm rate was lower than the LMP-based rate for 49 states and DC; the difference for Vermont was not statistically significant.
• Both measures show Vermont with the lowest rate of preterm deliveries among the 50 states and DC in 2013 (OE = 7.6%; LMP = 8.1%), and Mississippi with the highest level (OE = 13.1%; LMP= 16.6%).
• Trends in state preterm rates for 2007–2013 were similar for the two gestational age measures, but fewer significant declines by state were observed in OE preterm rates (Figure 6).
• OE-based preterm rates declined for 39 states and DC. Rates were lower, but not significantly so in 10 of the remaining states; the preterm rate increased in 1 state.
• Declines in LMP-based preterm rates were observed for 46 states and DC; no state reported increases in LMP-measured preterm births.
Infant mortality rates—the OE compared with the LMP-based measure of gestational age • The OE-based infant mortality rate (IMR) among preterm births
was 19% higher than the LMP-based IMR (41.51 deaths per 1,000 births compared with 34.77). OE-based IMRs were higher for each preterm and early term category under 28 weeks, 28–31, 32–33, 34–36, and 37–38 weeks, with the greatest difference (30%) at 32–33 weeks (Table 6, Figure 7).
• In contrast to differences in preterm infant mortality rates, OE-based rates at term (full and late) were lower than LMP-based IMRs—the OE rate at 40 weeks was 14% lower than the LMP, and the OE rate at 41 weeks was 16% lower.
Obstetric estimate
WA MT VT ME
ND OR MN NH
ID WI MASD NY RIWY MI
IA CTPA NJNENV OHIL IN DE CA UT CO WV VA MD
KS MO KY NCTNAZ OK ARNM SC
AL GAMS TX LA
FL
AK
HI
*Changes not significant at p = 0.05. NOTES: OE is the obstetric estimate of the newborn; the LMP is the date of the mother’s last norSOURCE: CDC/NCHS, National Vital Statistics System.
Figure 6. Percent change in OE- and LMP-based preterm births: U
• Similar to preterm IMRs, the OE-based IMR was higher than that of the LMP-based IMR at 42 weeks and over (3.29 and 2.39, respectively).
Discussion
Similarities and differences between the two gestational age measures
This report documents similarities and differences between OE-and LMP-based estimates of gestational age. For more than 6 of every 10 records, estimates of pregnancy length were exactly the same; for about 3 of every 4 records, the estimates were within 1 week. Although differences between the mean number of weeks for the two measures were statistically significant, the average gestational ages differed by only 0.1–0.2 weeks overall, and for each of the race and Hispanic origin groups studied. The two measures showed consistent trends in U.S. preterm birth rates from 2007 through 2013. Preterm trends were also generally consistent between the OE and LMP by race and Hispanic origin, and often by state, confirming that U.S. preterm deliveries generally have been on the decline over the study period.
Key differences between measures in commonly tracked and studied gestational categories were observed, however. The OE exhibits lower levels of preterm births (nearly 70,000 fewer 2013 births) and postterm births (about 200,000 fewer births) than the LMP, and higher levels of births at full term, particularly at 39 weeks. Higher preterm and postterm risk of infant mortality was also evident using the OE compared with the LMP. Differences between the two measures in preterm and postterm birth rates may be related to LMP misclassification of term births as preterm and postterm. This misclassification has
IncreaseDecrease No change*
Last normal menses
WA MT ND VT ME
OR MN NH
CA NV UT
ID
CO
WY
NE
KS
SD
MO
WI
IL IA
OH
KY
MI NY
PA
WV VA IN
MA
CT RI
NJ DE
MD
AZ NM OK AR TN NC
SC
MS AL GA TX LA
FL
AK
HI
mal menses. Preterm is defined as under 37 completed weeks of gestation.
nited States, 2007–2013

8 National Vital Statistics Reports, Vol. 64 No. 5 June 1, 2015
0
5
10
15
20
25
30
35
40
45
42 and over4139–40
OELMP
Per
1,0
00 b
irths
35.72
42.25
16.04
20.79
7.23 8.54
3.01 3.16 1.85 1.73 1.80 1.52 2.39 3.29
28–31 32–33 34–36 37–38
Completed weeks of gestation NOTES: OE is the obstetric estimate of the newborn; the LMP is the date of the mother’s last normal menses. SOURCE: CDC/NCHS, National Vital Statistics System.
Figure 7. Infant mortality rates, by OE- and LMP-based gestational age: United States, 2013
important public health implications, including the overestimation of LMP-based preterm birth rates and underestimation of the risk of death for newborns delivered preterm and postterm. Similar findings have been suggested elsewhere (13,25).
The larger differences between OE and LMP estimates for non-Hispanic black, AIAN, and Hispanic births may be related to the higher levels of missing and invalid LMP data and accordant gestational age misclassification for these groups (15). A recent study found that the LMP overestimated preterm births among non-Hispanic black and Hispanic women and reported less reliable LMP dates among younger, less-educated women and those who entered prenatal care after the first trimester of pregnancy (11,12). Despite the narrowing of differences among race and Hispanic origin groups using the OE, this study shows non-Hispanic black women remained about 50% more likely than non-Hispanic white and API women to give birth before 37 completed weeks.
Among Hispanic women, the difference between the OE-based Hispanic preterm birth rate and those of other race and Hispanic origin groups may be more consistent with other birth outcome measures such as low birthweight (LBW) compared with the LMP-based rate. For example, whereas the 2013 LMP-based Hispanic preterm rate is 11% higher than for non-Hispanic white births, the Hispanic OE preterm rate is 2% higher, consistent with the difference between the Hispanic LBW rate (LBW is well reported and closely associated with preterm birth) and the non-Hispanic white LBW rate (also 2%) (1).
This report’s findings of lower OE estimates of preterm birth are consistent with most recent research comparing LMP-based data with estimated date of delivery (EDD) and ultrasound estimates. Lower and similar preterm estimates have also been observed in LMP-ultrasound comparisons (11,12,26); however, these inconsistent findings may be
attributable to differences in sample characteristics and study methods (12). The finding of lower postterm estimates is consistent with other research (10–13,26).
Assessing and improving data quality
While research demonstrates that the OE is an improved measure of gestational age compared with the LMP, the OE has limitations. The national recommended definition for this item has been publicized since 2003, but the derivation of the OE remains uncertain. Studies comparing the OE with results from early ultrasound may be less informative because the OE is not recommended to be based solely on ultrasound; it is to be ‘‘the best obstetric estimate . . . determined by all perinatal factors and assessments such as ultrasound . . .’’ (17). A recent unpublished study based on interviews with 25 hospital staff responsible for collecting or entering OE information for the birth certificate found incorrect rounding procedures (i.e., rounding to the nearest whole number instead of rounding down to completed weeks) (27). Another recent study comparing birth certificate OE data with information from hospital medical records (EDD or best obstetric estimates) for two states found exact agreement between the OE and hospital records to be high in one state but only moderate in another (20). Another study found that sensitivity between preterm rates based on the OE and those calculated from the EDD (considered the best obstetric estimate) was excellent in one jurisdiction but moderate in another (21).
Efforts are underway to improve OE reporting across the country. In collaboration with the National Association for Public Health Statistics and Information Systems (NAPHSIS), which represents the vital

9 National Vital Statistics Reports, Vol. 64 No. 5 June 1, 2015
statistics jurisdictions, and clinical experts, NCHS is refining and updating its ‘‘Guide to Completing the Facility Worksheets for the Certificate of Live Birth and Report of Fetal Death (2003 revision)’’ (‘‘Facility Guidebook’’). This update will ensure consistency with the American College of Obstetricians and Gynecologists Revitalize Obstetric Data Definitions for establishing estimated due date (28). NCHS and NAPHSIS are also collaborating to develop web-based training for relevant hospital staff for use in all vital statistics jurisdictions. Among other features, the training will link with the Facility Guidebook, include information on the relevance and uses of gestational age data, and offer continuing education credits for both clinicians and nonclinicians.
Despite switching to use of the OE estimate in lieu of the LMP as the primary measure of gestational age in vital statistics data, NCHS will continue to collect and publish LMP-based data as in the past to allow for the analysis of national trends prior to 2007 (LMP data are available since 1981), and as an alternative to the OE. The OE estimates presented in this report for 2007–2013 will serve as standard OE estimates. The national transition to the OE should improve monitoring of trends in gestational age, identification of disparities in preterm birth among population groups, estimation of mortality risk by gestational age, and understanding of why pregnancies end too soon.
References
1. Martin JA, Hamilton BE, Osterman MJK, et al. Births: Final data for 2013. National vital statistics reports; vol 64 no 1. Hyattsville, MD: National Center for Health Statistics. 2015. Available from: http://www.cdc.gov/ nchs/data/nvsr/nvsr64/nvsr64_01.pdf.
2. HHS. Healthy People 2020. Topics & objectives: Maternal, infant, and child health. Available from: http://www.healthypeople.gov/2020/topicsobjectives/topic/maternal-infant-and-child-health.
3. Allen B Jr, Green NS. March of Dimes prematurity campaign: A call to action. J Natl Med Assoc 96(5):686–8. 2004.
4. Osterman MJ, Kochanek KD, MacDorman MF, Strobino DM, Guyer B. Annual summary of vital statistics: 2012–2013. Pediatrics peds. 2015–0434. 2015.
5. Davidoff MJ, Dias T, Damus K, Russell R, Bettegowda VR, Dolan S, et al. Changes in the gestational age distribution among U.S. singleton births: Impact on rates of late preterm birth, 1992 to 2002. Semin Perinatol 30(1):8–15. 2006.
6. Tomashek KM, Shapiro-Mendoza CK, Davidoff MJ, Petrini JR. Differences in mortality between late-preterm and term singleton infants in the United States, 1995–2002. J Pediatr 151(5):450–6. 2007.
7. Callaghan WM, MacDorman MF, Rasmussen SA, Qin C, Lackritz EM. The contribution of preterm birth to infant mortality rates in the United States. Pediatrics 118(4):1566–73. 2006.
8. Hammes LM, Treloar AE. Gestational interval from vital records. Am J Public Health Nations Health 60(8):1496–505. 1970.
9. David RJ. The quality and completeness of birthweight and gestational age data in computerized birth files. Am J Public Health 70(9):964–73. 1980.
10. Kramer MS, McLean FH, Boyd ME, Usher RH. The validity of gestational age estimation by menstrual dating in term, preterm, and postterm gestations. JAMA 260(22):3306–8. 1988.
11. Savitz DA, Terry JW Jr, Dole N, Thorp JM Jr, Siega-Riz AM, Herring AH. Comparison of pregnancy dating by last menstrual period, ultrasound scanning, and their combination. Am J Obstet Gynecol 187(6):1660–6. 2002.
12. Dietz PM, England LJ, Callaghan WM, Pearl M, Wier ML, Kharrazi M. A comparison of LMP-based and ultrasound-based estimates of gestational age using linked California live birth and prenatal screening records. Paediatr Perinat Epidemiol 21(Suppl 2):62–71. 2007.
13. Callaghan WM, Schieve LA, Dietz PM. Gestational age estimates from singleton births conceived using assisted reproductive technology. Paediatr Perinat Epidemiol 21(Suppl 2):79–85. 2007.
14. NCHS. Hospitals’ and physicians’ handbook on birth registration and fetal death reporting. 1987.
15. Martin JA. United States vital statistics and the measurement of gestational age. Paediatr Perinat Epidemiol 21(Suppl 2):13–21. 2007.
16. NCHS. Report of the Panel to Evaluate the U.S. Standard Certificates and Reports. 2000.
17. NCHS. Guide to completing the facility worksheets for the certificate of live birth and report of fetal death (2003 revision). 2012.
18. Callaghan WM, Dietz PM. Differences in birth weight for gestational age distributions according to the measures used to assign gestational age. Am J Epidemiol 171(7):826–36. 2010.
19. Barradas DT, Dietz PM, Pearl M, England LJ, Callaghan WM, Kharazzi M. Validation of obstetric estimate using early ultrasound: 2007 California birth certificates. Paediatr Perinat Epidemiol 28(1):3–10. 2014.
20. Martin JA, Wilson EC, Osterman MJK, et al. Assessing the quality of medical and health data from the 2003 birth certificate revision: Results from two states. National vital statistics reports; vol 62 no 2. Hyattsville MD: National Center for Health Statistics. 2013.
21. Dietz PM, Bombard JM, Hutchings YL, Gauthier JP, Gambatese MA, Ko JY, et al. Validation of obstetric estimate of gestational age on US birth certificates. Am J Obstet Gynecol 210(4):335.e1–5. 2014.
22. NCHS. User guide to the 2013 natality public use file. Available from: ftp://ftp.cdc.gov/pub/Health_Statistics/NCHS/Dataset_Documentation/ DVS/natality/UserGuide2013.pdf.
23. NCHS. National vital statistics system: Computer edits for natality data, Version 2. 2015 [Forthcoming].
24. NCHS. User guide to the 2013 period linked birth-infant death data files. Available from: http://www.cdc.gov/nchs/data_access/Vitalstatsonline.htm.
25. Russell R, Dias T, Carrino G, Gambatese M. The impact of differences in gestational age measurement on estimates of infant mortality using birth certificate data. In: CityMatch Leadership and MCH Epidemiology Conference. Phoenix, AZ: March of Dimes. 2014.
26. Yang H, Kramer MS, Platt RW, Blondel B, Bréart G, Morin I, et al. How does early ultrasound scan estimate of gestational age lead to higher rates of preterm birth? Am J Obstet Gynecol 186(3):433–7. 2002.
27. England L, Brustrom J, Pazol K, Dohack JL. Assessing gestational age measurement in the birth certificate. [Unpublished].
28. American College of Obstetricians and Gynecologists. reVITALize: Obstetric data definitions (version 1.0). 2014. Available from: http://www.acog.org/-/media/Departments/Patient-Safety-and-QualityImprovement/2014reVITALizeObstetricDataDefinitionsV10.pdf.

10 National Vital Statistics Reports, Vol. 64 No. 5 June 1, 2015
List of Detailed Tables 1. Exact agreement between the OE- and LMP-based gestational
ages, by single week of gestation: United States, 2013 . . . . . . 11 2. Percent distributions of the OE- and LMP-based estimates of
gestational age: United States, 2013 . . . . . . . . . . . . . . . . . . . 12 3. Births based on the OE- and LMP-based estimates of gestational
age by selected gestational age categories, by race and Hispanic origin: United States, 2007–2013 . . . . . . . . . . . . . . . . . . . . . 13
4. OE- and LMP-based preterm birth rates, by state: United States and each state, 2007–2013 . . . . . . . . . . . . . . . . . . . . . . . . . 16
5. Percent and number of births based on the obstetric estimate, by selected gestational age categories: United States and each state, 2013 . . . . . . . . . . . . . . . . . . . . . . . . . . . . . . . . . . . . 18
6. Infant mortality rates based on the obstetric estimate and LMP measures of gestation: United States, 2013 linked file . . . . . . . 19

National Vital Statistics Reports, Vol. 64 No. 5 June 1, 2015 11
Table 1. Exact agreement between the OE- and LMP-based gestational ages, by single week of gestation: United States, 2013
Exact agreement
Including imputed values1 Excluding imputed values1
Gestational age Number Percent Number Percent
Total Exact agreement . . . . . . . . . . . . . Agreement within 1 week. . . . . . . . Agreement within 2 weeks . . . . . . .
Exact agreement by week 17 . . . . . . . . . . . . . . . . . . . . . 18 . . . . . . . . . . . . . . . . . . . . . 19 . . . . . . . . . . . . . . . . . . . . . 20 . . . . . . . . . . . . . . . . . . . . . 21 . . . . . . . . . . . . . . . . . . . . . 22 . . . . . . . . . . . . . . . . . . . . . 23 . . . . . . . . . . . . . . . . . . . . . 24 . . . . . . . . . . . . . . . . . . . . . 25 . . . . . . . . . . . . . . . . . . . . . 26 . . . . . . . . . . . . . . . . . . . . . 27 . . . . . . . . . . . . . . . . . . . . . 28 . . . . . . . . . . . . . . . . . . . . . 29 . . . . . . . . . . . . . . . . . . . . . 30 . . . . . . . . . . . . . . . . . . . . . 31 . . . . . . . . . . . . . . . . . . . . . 32 . . . . . . . . . . . . . . . . . . . . . 33 . . . . . . . . . . . . . . . . . . . . . 34 . . . . . . . . . . . . . . . . . . . . . 35 . . . . . . . . . . . . . . . . . . . . . 36 . . . . . . . . . . . . . . . . . . . . . 37 . . . . . . . . . . . . . . . . . . . . . 38 . . . . . . . . . . . . . . . . . . . . . 39 . . . . . . . . . . . . . . . . . . . . . 40 . . . . . . . . . . . . . . . . . . . . . 41 . . . . . . . . . . . . . . . . . . . . . 42 . . . . . . . . . . . . . . . . . . . . . 43 . . . . . . . . . . . . . . . . . . . . . 44 . . . . . . . . . . . . . . . . . . . . . 45 . . . . . . . . . . . . . . . . . . . . . 46 . . . . . . . . . . . . . . . . . . . . . 47 . . . . . . . . . . . . . . . . . . . . .
2,435,775 3,272,669 3,587,849
208 325 468 806
1,072 1,329 1,722 2,441 2,553 2,886 3,336 3,881 4,340 5,845 7,446
10,972 16,195 29,011 44,312 86,986
202,038 390,992 936,987 515,714 154,683
8,389 541 184 64 30 19
62.1 83.4 91.4
60.6 62.7 64.8 68.7 63.8 64.7 61.7 63.2 58.3 57.6 56.6 51.2 45.4 45.0 44.4 47.1 46.7 49.0 48.3 53.5 59.9 61.5 79.0 67.0 46.4 8.0 1.0 0.6 0.4 0.4 0.4
2,221,455 3,058,364 3,373,529
135 205 323 593 798 985
1,316 1,877 1,955 2,271 2,632 3,099 3,556 4,830 6,269 9,294
13,953 25,106 38,853 77,215
182,335 356,096 862,669 474,131 142,673
7,515 494 172 62 26 17
59.9 82.4 90.9
50.0 51.5 56.0 61.7 56.8 57.6 55.2 56.9 51.7 51.7 50.7 45.6 40.5 40.3 40.2 43.0 43.0 45.4 45.0 50.5 57.4 59.2 77.6 65.1 44.4 7.2 0.90.60.40.30.3
1Imputed
NOTES:
values are those for which
OE is the obstetric estimate
the
of
obstetric estimate-based
the newborn; LMP refers
measure is
to the date
substituted for the LMP-based measure
of the mother’s last normal menses.
when the LMP date is missing or inconsistent with birthweight.

12 National Vital Statistics Reports, Vol. 64 No. 5 June 1, 2015
Table 2. Percent distributions of the OE- and LMP-based estimates of gestational age: United States, 2013
OE LMP Absolute difference
Relative difference
Weeks of gestation Number Percent Number Percent Percentage
points Percent
Total . . . . . . . . . . . . . . . . . . . . . .
Under 37 . . . . . . . . . . . . . . . . . . .
Under 28 . . . . . . . . . . . . . . . . . .
17 . . . . . . . . . . . . . . . . . . . .
18 . . . . . . . . . . . . . . . . . . . .
19 . . . . . . . . . . . . . . . . . . . .
20 . . . . . . . . . . . . . . . . . . . .
21 . . . . . . . . . . . . . . . . . . . .
22 . . . . . . . . . . . . . . . . . . . .
23 . . . . . . . . . . . . . . . . . . . .
24 . . . . . . . . . . . . . . . . . . . .
25 . . . . . . . . . . . . . . . . . . . .
26 . . . . . . . . . . . . . . . . . . . .
27 . . . . . . . . . . . . . . . . . . . .
28–31. . . . . . . . . . . . . . . . . . . .
28 . . . . . . . . . . . . . . . . . . . .
29 . . . . . . . . . . . . . . . . . . . .
30 . . . . . . . . . . . . . . . . . . . .
31 . . . . . . . . . . . . . . . . . . . .
32–33. . . . . . . . . . . . . . . . . . . .
32 . . . . . . . . . . . . . . . . . . . .
33 . . . . . . . . . . . . . . . . . . . .
34–36. . . . . . . . . . . . . . . . . . . .
34 . . . . . . . . . . . . . . . . . . . .
35 . . . . . . . . . . . . . . . . . . . .
36 . . . . . . . . . . . . . . . . . . . .
37–38 . . . . . . . . . . . . . . . . . . . . .
37. . . . . . . . . . . . . . . . . . . . . .
38. . . . . . . . . . . . . . . . . . . . . .
39–40 . . . . . . . . . . . . . . . . . . . . .
39. . . . . . . . . . . . . . . . . . . . . .
40. . . . . . . . . . . . . . . . . . . . . .
41 . . . . . . . . . . . . . . . . . . . . . . .
42 and over . . . . . . . . . . . . . . . . . .
42. . . . . . . . . . . . . . . . . . . . . .
43. . . . . . . . . . . . . . . . . . . . . .
44. . . . . . . . . . . . . . . . . . . . . .
45. . . . . . . . . . . . . . . . . . . . . .
46. . . . . . . . . . . . . . . . . . . . . .
47. . . . . . . . . . . . . . . . . . . . . .
Unknown . . . . . . . . . . . . . . . . . . .
3,932,181
377,655
27,550
290
483
758
1,313
1,590
2,129
2,691
3,927
4,172
4,775
5,422
36,096
6,399
7,234
9,926
12,537
45,789
18,847
26,942
268,220
48,467
74,112
145,641
973,569
331,667
641,902
2,309,888
1,470,101
839,787
247,476
16,126
14,844
840
266
92
37
47
7,467
100.00
9.62
0.70
0.01
0.01
0.02
0.03
0.04
0.05
0.07
0.10
0.11
0.12
0.14
0.92
0.16
0.18
0.25
0.32
1.17
0.48
0.69
6.83
1.23
1.89
3.71
24.81
8.45
16.36
58.85
37.46
21.40
6.31
0.41
0.38
0.02
0.01
0.00
0.00
0.00
. . .
3,932,181
447,361
28,492
353
522
730
1,181
1,681
2,056
2,794
3,870
4,380
5,015
5,910
46,972
7,595
9,573
13,008
16,796
58,039
23,327
34,712
313,858
59,231
91,919
162,708
974,162
337,498
636,664
1,957,937
1,187,678
770,259
333,531
215,510
105,082
53,625
28,477
14,870
8,203
5,253
3,680
100.00
11.39
0.73
0.01
0.01
0.02
0.03
0.04
0.05
0.07
0.10
0.11
0.13
0.15
1.20
0.19
0.24
0.33
0.43
1.48
0.59
0.88
7.99
1.51
2.34
4.14
24.80
8.59
16.21
49.84
30.23
19.61
8.49
5.49
2.67
1.37
0.72
0.38
0.21
0.13
. . .
. . .
–1.8
0.0
0.0
0.0
0.0
0.0
0.0
0.0
0.0
0.0
0.0
0.0
0.0
–0.3
0.0
–0.1
–0.1
–0.1
–0.3
–0.1
–0.2
–1.2
–0.3
–0.5
–0.4
0.0
–0.1
0.1
9.0
7.2
1.8
–2.2
–5.1
–2.3
–1.3
–0.7
–0.4
–0.2
–0.1
. . .
. . .
–16
–4
0
0
0
0
0
0
0
0
0
–8
–7
–23
–16
–25
–24
–26
–21
–19
–22
–15
–19
–19
–10
0
–2
1
18
24
9
–26
–93
–86
–99
–99
–100
–100
–100
. . .
. . . Category not applicable. 0.0 or 0 Quantity more than 0 but less than 0.05.
NOTES: OE is the obstetric estimate of the newborn; LMP refers to the date of the mother’s last normal menses.

National Vital Statistics Reports, Vol. 64 No. 5 June 1, 2015 13
Table 3. Births based on the OE- and LMP-based estimates of gestational age by selected gestational age categories, by race and Hispanic origin: United States, 2007–2013
Early Full Late Preterm term term term Postterm
Total under 27 weeks 28–31 32–33 34–36 37–38 39–40 41 42 weeks Not
Year Births 37 weeks and under weeks weeks weeks weeks weeks weeks and over stated
Number Percent Number
All races and Hispanic origins Obstetric estimate
2013. . . . . . . . . . . . . . . . . . . . . . 3,932,181 9.62 0.70 0.92 1.17 6.83 24.81 58.85 6.31 0.41 7,467
2012. . . . . . . . . . . . . . . . . . . . . . 3,952,841 9.76 0.71 0.92 1.17 6.96 25.47 58.30 6.06 0.40 8,380
2011 . . . . . . . . . . . . . . . . . . . . . . 3,953,590 9.81 0.70 0.93 1.18 6.99 26.09 57.51 6.16 0.43 9,290
2010. . . . . . . . . . . . . . . . . . . . . . 3,999,386 9.98 0.71 0.94 1.18 7.15 27.29 56.08 6.19 0.46 10,538
2009. . . . . . . . . . . . . . . . . . . . . . 4,130,665 10.07 0.71 0.94 1.18 7.24 28.24 54.98 6.23 0.48 11,748
2008. . . . . . . . . . . . . . . . . . . . . . 4,247,694 10.36 0.71 0.95 1.22 7.47 29.69 53.26 6.17 0.52 14,194
2007. . . . . . . . . . . . . . . . . . . . . . 4,316,233 10.44 0.74 0.97 1.22 7.51 29.46 53.02 6.50 0.58 20,286
2013. . . . . . . . . . . . . . . . . . . . . .
LMP-based estimate
3,932,181 11.39 0.73 1.20 1.48 7.99 24.80 49.84 8.49 5.49 3,680
2012. . . . . . . . . . . . . . . . . . . . . . 3,952,841 11.55 0.73 1.19 1.49 8.13 24.96 49.33 8.55 5.62 4,080
2011 . . . . . . . . . . . . . . . . . . . . . . 3,953,590 11.73 0.73 1.20 1.52 8.28 25.86 48.48 8.36 5.57 4,846
2010. . . . . . . . . . . . . . . . . . . . . . 3,999,386 11.99 0.74 1.22 1.53 8.49 26.88 47.41 8.24 5.48 5,279
2009. . . . . . . . . . . . . . . . . . . . . . 4,130,665 12.18 0.74 1.23 1.55 8.66 27.59 46.51 8.19 5.54 5,285
2008. . . . . . . . . . . . . . . . . . . . . . 4,247,694 12.33 0.74 1.24 1.57 8.77 27.85 45.71 8.44 5.68 5,809
2007. . . . . . . . . . . . . . . . . . . . . . 4,316,233 12.68 0.77 1.27 1.60 9.04 28.60 44.79 8.30 5.62 6,846
Non-Hispanic white Obstetric estimate
2013. . . . . . . . . . . . . . . . . . . . . . 2,129,196 8.94 0.51 0.80 1.10 6.54 23.10 60.44 7.04 0.48 3,892
2012. . . . . . . . . . . . . . . . . . . . . . 2,134,044 9.13 0.52 0.80 1.09 6.72 24.00 59.74 6.67 0.46 4,070
2011 . . . . . . . . . . . . . . . . . . . . . . 2,146,566 9.21 0.51 0.82 1.11 6.77 24.74 58.90 6.67 0.47 4,974
2010. . . . . . . . . . . . . . . . . . . . . . 2,162,406 9.41 0.53 0.83 1.11 6.94 26.02 57.44 6.64 0.49 5,011
2009. . . . . . . . . . . . . . . . . . . . . . 2,212,552 9.50 0.52 0.83 1.09 7.05 27.14 56.24 6.62 0.49 5,911
2008. . . . . . . . . . . . . . . . . . . . . . 2,267,817 9.81 0.53 0.85 1.14 7.30 28.96 54.26 6.46 0.51 6,142
2007. . . . . . . . . . . . . . . . . . . . . . 2,310,333 9.90 0.55 0.84 1.14 7.37 29.11 53.69 6.74 0.56 7,564
2013. . . . . . . . . . . . . . . . . . . . . .
LMP-based estimate
2,129,196 10.17 0.52 1.03 1.32 7.31 23.19 51.53 9.30 5.80 1,569
2012. . . . . . . . . . . . . . . . . . . . . . 2,134,044 10.29 0.54 1.01 1.30 7.44 23.59 51.04 9.28 5.80 1,602
2011 . . . . . . . . . . . . . . . . . . . . . . 2,146,566 10.50 0.52 1.02 1.34 7.62 24.64 50.17 8.95 5.73 2,380
2010. . . . . . . . . . . . . . . . . . . . . . 2,162,406 10.77 0.54 1.04 1.35 7.84 25.77 49.04 8.77 5.65 1,892
2009. . . . . . . . . . . . . . . . . . . . . . 2,212,552 10.92 0.54 1.04 1.34 8.00 26.73 48.02 8.66 5.67 2,350
2008. . . . . . . . . . . . . . . . . . . . . . 2,267,817 11.14 0.54 1.06 1.38 8.16 27.29 47.03 8.82 5.71 2,325
2007. . . . . . . . . . . . . . . . . . . . . . 2,310,333 11.50 0.56 1.08 1.40 8.46 28.39 45.91 8.58 5.61 2,557
14 National Vital Statistics Reports, Vol. 64 No. 5 June 1, 2015
Table 3. Births based on the OE- and LMP-based estimates of gestational age by selected gestational age categories, by race and Hispanic origin: United States, 2007–2013—Con.
Early Full Late Preterm term term term Postterm
Total under 27 weeks 28–31 32–33 34–36 37–38 39–40 41 42 weeks Not
Year Births 37 weeks and under weeks weeks weeks weeks weeks weeks and over stated
Number Percent Number
Non-Hispanic black Obstetric estimate
2013. . . . . . . . . . . . . . . . . . . . . . 583,834 13.25 1.59 1.56 1.65 8.45 27.26 53.93 5.21 0.34 1,245
2012. . . . . . . . . . . . . . . . . . . . . . 583,489 13.48 1.61 1.58 1.69 8.60 27.68 53.38 5.13 0.32 1,685
2011 . . . . . . . . . . . . . . . . . . . . . . 582,345 13.54 1.61 1.59 1.67 8.67 28.19 52.67 5.25 0.35 1,531
2010. . . . . . . . . . . . . . . . . . . . . . 589,808 13.81 1.59 1.61 1.74 8.86 29.12 51.32 5.38 0.37 1,680
2009. . . . . . . . . . . . . . . . . . . . . . 609,584 14.05 1.65 1.63 1.76 9.01 29.71 50.36 5.47 0.41 1,657
2008. . . . . . . . . . . . . . . . . . . . . . 623,029 14.38 1.63 1.63 1.84 9.28 30.78 48.87 5.49 0.48 1,929
2007. . . . . . . . . . . . . . . . . . . . . . 627,191 14.71 1.74 1.74 1.84 9.40 30.33 48.72 5.72 0.52 2,280
2013. . . . . . . . . . . . . . . . . . . . . .
LMP-based estimate
583,834 16.27 1.65 2.06 2.19 10.36 27.36 44.55 6.76 5.07 639
2012. . . . . . . . . . . . . . . . . . . . . . 583,489 16.53 1.68 2.03 2.23 10.59 27.29 44.03 7.00 5.15 902
2011 . . . . . . . . . . . . . . . . . . . . . . 582,345 16.77 1.70 2.06 2.28 10.74 28.03 43.29 6.81 5.10 828
2010. . . . . . . . . . . . . . . . . . . . . . 589,808 17.12 1.69 2.10 2.34 10.99 28.83 42.30 6.82 4.94 961
2009. . . . . . . . . . . . . . . . . . . . . . 609,584 17.47 1.74 2.12 2.35 11.24 29.20 41.51 6.82 5.01 867
2008. . . . . . . . . . . . . . . . . . . . . . 623,029 17.54 1.72 2.12 2.43 11.27 29.15 40.91 7.11 5.28 1,000
2007. . . . . . . . . . . . . . . . . . . . . . 627,191 18.29 1.86 2.23 2.46 11.75 29.52 39.98 7.02 5.19 1,058
Hispanic Obstetric estimate
2013. . . . . . . . . . . . . . . . . . . . . . 901,033 9.08 0.62 0.82 1.07 6.57 26.43 58.66 5.51 0.32 1,200
2012. . . . . . . . . . . . . . . . . . . . . . 907,677 9.09 0.63 0.82 1.06 6.58 26.71 58.41 5.45 0.35 1,474
2011 . . . . . . . . . . . . . . . . . . . . . . 918,129 9.02 0.61 0.81 1.06 6.54 27.34 57.54 5.71 0.39 1,603
2010. . . . . . . . . . . . . . . . . . . . . . 945,180 9.09 0.61 0.80 1.04 6.64 28.65 55.92 5.86 0.47 2,639
2009. . . . . . . . . . . . . . . . . . . . . . 999,548 9.12 0.60 0.82 1.06 6.65 29.41 54.87 6.06 0.54 2,757
2008. . . . . . . . . . . . . . . . . . . . . . 1,041,239 9.38 0.61 0.82 1.07 6.88 30.31 53.55 6.18 0.59 4,449
2007. . . . . . . . . . . . . . . . . . . . . . 1,062,779 9.35 0.62 0.84 1.06 6.83 29.44 53.85 6.65 0.71 8,312
2013. . . . . . . . . . . . . . . . . . . . . .
LMP-based estimate
907,033 11.31 0.64 1.09 1.45 8.13 26.34 49.15 7.88 5.32 629
2012. . . . . . . . . . . . . . . . . . . . . . 907,677 11.58 0.64 1.13 1.49 8.31 26.16 48.47 8.04 5.75 775
2011 . . . . . . . . . . . . . . . . . . . . . . 918,129 11.65 0.63 1.13 1.49 8.40 26.98 47.58 8.09 5.69 780
2010. . . . . . . . . . . . . . . . . . . . . . 945,180 11.79 0.64 1.14 1.49 8.53 27.96 46.56 8.03 5.65 1,636
2009. . . . . . . . . . . . . . . . . . . . . . 999,548 11.97 0.63 1.14 1.55 8.64 28.29 45.81 8.12 5.80 1,187
2008. . . . . . . . . . . . . . . . . . . . . . 1,041,239 12.10 0.64 1.15 1.53 8.77 28.09 45.25 8.51 6.05 1,503
2007. . . . . . . . . . . . . . . . . . . . . . 1,062,779 12.29 0.65 1.17 1.58 8.89 28.36 44.72 8.57 6.06 2,167

National Vital Statistics Reports, Vol. 64 No. 5 June 1, 2015 15
Table 3. Births based on the OE- and LMP-based Hispanic origin: United States, 2007–2013—Con.
estimates of gestational age by selected gestational age categories, by race and
Preterm Early term
Full term
Late term Postterm
Not stated
Number
Year Births
Number
Total under
37 weeks 27 weeks and under
28–31 weeks
32–33 34–36 weeks weeks
Percent
37–38 weeks
39–40 weeks
41 weeks
42 weeks and over
American Indian or Alaska Native Obstetric estimate
2013. . . . . . . . . . . . . . . . . . . . . .
2012. . . . . . . . . . . . . . . . . . . . . .
2011 . . . . . . . . . . . . . . . . . . . . . .
2010. . . . . . . . . . . . . . . . . . . . . .
2009. . . . . . . . . . . . . . . . . . . . . .
2008. . . . . . . . . . . . . . . . . . . . . .
2007. . . . . . . . . . . . . . . . . . . . . .
Asian or Pacific Islander
45,991
46,093
46,419
46,760
48,665
49,537
49,443
10.17
10.39
10.24
10.57
10.04
10.38
10.58
0.62
0.70
0.64
0.62
0.63
0.68
0.65
0.94
0.90
0.93
0.93
0.88
0.90
0.85
1.21 7.41
1.24 7.56
1.17 7.50
1.22 7.80
1.18 7.34
1.14 7.67
1.33 7.75
LMP-based estimate
27.27
27.43
27.27
27.67
28.55
28.94
28.39
55.81
55.63
55.49
54.53
54.07
53.15
52.96
6.34
6.12
6.52
6.69
6.72
6.84
7.27
0.41
0.43
0.49
0.54
0.62
0.69
0.80
122
124
144
125
145
163
210
45,991
46,093
46,419
46,760
48,665
49,537
49,443
13.07
13.25
13.50
13.60
13.45
13.60
13.92
0.66
0.76
0.68
0.71
0.72
0.73
0.69
1.44
1.37
1.43
1.48
1.41
1.42
1.44
1.73 9.24
1.86 9.25
1.75 9.64
1.79 9.62
1.88 9.44
1.74 9.70
1.85 9.94
Obstetric estimate
25.88
25.59
25.35
26.57
27.04
26.88
27.70
45.55
45.60
45.42
44.37
44.19
43.59
42.71
8.58
8.40
8.61
8.50
8.52
8.97
8.60
6.92
7.16
7.11
6.96
6.80
6.97
7.06
75
67
79
68
70
81
87
2013. . . . . . . . . . . . . . . . . . . . . .
2012. . . . . . . . . . . . . . . . . . . . . .
2011 . . . . . . . . . . . . . . . . . . . . . .
2010. . . . . . . . . . . . . . . . . . . . . .
2009. . . . . . . . . . . . . . . . . . . . . .
2008. . . . . . . . . . . . . . . . . . . . . .
2007. . . . . . . . . . . . . . . . . . . . . .
265,673
272,802
253,915
246,886
251,089
253,185
254,488
8.68
8.75
8.84
9.01
9.02
9.15
9.13
0.52
0.51
0.51
0.51
0.51
0.51
0.49
0.79
0.76
0.79
0.78
0.75
0.77
0.81
0.98 6.38
1.01 6.46
1.02 6.51
1.04 6.67
1.00 6.76
1.01 6.86
1.02 6.82
LMP-based estimate
27.33
27.93
28.20
28.89
29.63
31.36
30.87
58.29
57.85
57.32
56.56
55.92
54.11
54.19
5.44
5.22
5.34
5.22
5.10
5.05
5.39
0.26
0.26
0.30
0.31
0.33
0.34
0.43
360
367
426
554
681
869
1,331
265,673
272,802
253,915
246,886
251,089
253,185
254,488
10.16
10.15
10.40
10.69
10.85
10.71
10.93
0.54
0.52
0.52
0.53
0.53
0.52
0.50
0.98
0.93
0.98
1.01
0.95
0.99
1.00
1.22 7.42
1.24 7.46
1.29 7.62
1.31 7.84
1.32 8.06
1.28 7.92
1.33 8.09
26.75
26.72
27.34
28.07
28.54
28.91
29.50
51.01
50.72
49.84
49.16
48.57
47.91
47.22
7.76
7.85
7.82
7.65
7.57
7.82
7.68
4.32
4.56
4.60
4.43
4.47
4.64
4.67
177
166
231
277
297
367
486
NOTES: OE is the obstetric estimate of the newborn; LMP refers to the date of the mother’s last normal menses.

16 National Vital Statistics Reports, Vol. 64 No. 5 June 1, 2015
Table 4. OE- and LMP-based preterm birth rates, by state: United States and each state, 2007–2013
Area Measure 2013 2012 2011 2010 2009 2008 2007
Percent change
2007–2013
United States . . . . . . . . . . . . . . . .
Alabama . . . . . . . . . . . . . . . . . . .
Alaska . . . . . . . . . . . . . . . . . . . .
Arizona . . . . . . . . . . . . . . . . . . . .
Arkansas . . . . . . . . . . . . . . . . . . .
California. . . . . . . . . . . . . . . . . . .
Colorado . . . . . . . . . . . . . . . . . . .
Connecticut . . . . . . . . . . . . . . . . .
Delaware. . . . . . . . . . . . . . . . . . .
District of Columbia . . . . . . . . . . . .
Florida . . . . . . . . . . . . . . . . . . . .
Georgia . . . . . . . . . . . . . . . . . . .
Hawaii . . . . . . . . . . . . . . . . . . . .
Idaho . . . . . . . . . . . . . . . . . . . . .
Illinois . . . . . . . . . . . . . . . . . . . .
Indiana . . . . . . . . . . . . . . . . . . . .
Iowa . . . . . . . . . . . . . . . . . . . . .
Kansas . . . . . . . . . . . . . . . . . . . .
Kentucky . . . . . . . . . . . . . . . . . . .
Louisiana. . . . . . . . . . . . . . . . . . .
Maine. . . . . . . . . . . . . . . . . . . . .
Maryland . . . . . . . . . . . . . . . . . . .
Massachusetts . . . . . . . . . . . . . . .
Michigan . . . . . . . . . . . . . . . . . . .
Minnesota . . . . . . . . . . . . . . . . . .
Mississippi . . . . . . . . . . . . . . . . . .
OE LMP
OE LMP
OE LMP
OE LMP
OE LMP
OE LMP
OE LMP
OE LMP
OE LMP
OE LMP
OE LMP
OE LMP
OE LMP
OE LMP
OE LMP
OE LMP
OE LMP
OE LMP
OE LMP
OE LMP
OE LMP
OE LMP
OE LMP
OE LMP
OE LMP
OE LMP
9.6 11.4
11.8 15.1
8.5 10.0
9.1 11.6
10.2 12.7
8.4 8.8
8.6 10.3
9.3 9.8
9.4 12.4
10.4 13.3
10.0 13.6
10.7 12.7
10.2 12.6
9.0 10.5
10.0 11.7
9.6 11.0
9.0 11.1
8.9 10.8
11.0 12.6
12.5 15.1
8.1 9.3
9.8 11.9
8.8 10.0
9.7 11.6
8.3 9.8
13.1 16.6
9.8 11.5
11.9 14.6
7.6 9.2
9.2 11.6
10.4 13.3
8.4 9.6
8.9 10.4
9.7 9.7
9.5 12.3
9.9 12.8
10.2 13.7
10.9 12.7
9.9 12.2
8.5 10.3
10.0 12.0
9.6 10.9
9.5 11.5
9.0 11.0
11.0 12.7
12.5 15.3
7.8 9.3
10.3 12.2
8.7 10.1
10.1 11.8
8.6 10.2
13.8 17.1
9.8 11.7
11.9 14.9
8.9 10.4
9.3 12.1
10.8 13.2
8.5 9.8
8.8 10.3
9.8 10.1
9.3 11.2
11.0 13.7
10.3 13.0
11.0 13.2
9.9 12.3
8.1 10.2
10.1 12.1
10.0 11.6
9.2 11.1
9.1 11.2
11.3 13.4
12.4 15.6
8.3 9.6
10.2 12.5
8.6 10.5
10.0 12.0
8.5 9.9
13.5 16.9
10.0 12.0
12.5 15.6
8.3 9.7
9.7 12.2
10.8 12.7
8.6 9.9
9.1 10.8
9.9 10.3
10.1 12.8
10.4 13.6
10.5 13.3
11.3 13.8
10.5 12.2
8.9 10.3
10.3 12.2
10.1 11.7
9.6 11.6
8.8 10.6
11.7 13.7
12.3 15.1
8.2 9.7
10.4 12.7
8.6 10.7
10.2 12.2
8.8 10.2
13.8 17.6
10.1 12.2
12.5 15.6
9.0 11.0
10.1 12.7
11.1 13.1
8.8 10.3
9.3 11.3
10.0 10.2
10.0 12.5
11.0 14.2
10.6 13.5
11.3 13.8
11.1 12.6
9.0 10.1
10.0 12.4
10.2 11.9
9.4 11.3
9.2 11.2
11.6 13.6
12.4 14.7
8.3 9.9
10.4 12.7
8.8 10.9
10.1 12.4
8.7 10.1
13.9 18.0
10.4 12.3
12.9 15.7
8.7 10.3
10.2 12.9
11.7 13.5
9.1 10.5
9.6 11.4
10.1 10.4
10.1 12.9
12.2 15.5
11.2 13.8
11.7 13.4
10.6 12.8
9.4 9.8
10.4 12.7
10.6 12.4
9.8 11.5
9.3 11.2
11.8 14.0
12.6 15.4
8.7 10.3
11.0 13.0
8.8 10.8
10.5 12.7
8.8 10.0
13.7 18.0
10.4 12.7
13.0 16.6
8.8 10.4
10.3 12.7
11.7 13.9
9.1 10.9
9.8 12.2
10.1 10.5
11.2 14.3
12.1 15.6
10.9 13.8
11.6 13.9
10.6 12.4
9.3 10.5
10.6 13.0
10.9 12.9
9.7 11.6
9.2 11.6
12.7 15.2
13.0 16.6
9.2 10.6
11.0 13.4
9.0 11.2
10.4 12.5
9.0 10.4
14.2 18.3
–8 –10
–9 –9
–3 –4
–12 –9
–13 –9
–8 –19
–12 –16
–8 –7
–16 –13
–14 –15
–8 –1
–8 –9
–4 2
–3 0
–6 –10
–12 –15
–7 –4
–3 –7
–13 –17
–4 –9
–12 –12
–11 –11
–2 –11
–7 –7
–8 –6
–8 –9

National Vital Statistics Reports, Vol. 64 No. 5 June 1, 2015 17
Table 4. OE- and LMP-based preterm birth rates, by state: United States and each state, 2007–2013—Con.
Percent change
Area Measure 2013 2012 2011 2010 2009 2008 2007 2007–2013
Missouri . . . . . . . . . . . . . . . . . . . OE 9.6 9.9 9.6 10.0 9.9 10.3 10.0 –4 LMP 11.3 11.7 11.6 12.1 12.2 12.3 12.5 –10
Montana . . . . . . . . . . . . . . . . . . . OE 9.0 9.4 8.8 10.1 9.0 9.9 9.9 –9 LMP 10.5 11.2 10.8 12.0 10.9 11.5 11.9 –12
Nebraska. . . . . . . . . . . . . . . . . . . OE 8.7 9.3 9.1 9.8 9.7 9.6 9.5 –8 LMP 10.6 11.1 10.6 11.4 11.5 11.8 11.9 –11
Nevada. . . . . . . . . . . . . . . . . . . . OE 9.8 10.4 10.5 10.9 10.8 11.2 11.5 –15 LMP 12.6 13.0 13.2 13.9 13.8 13.5 14.3 –12
New Hampshire. . . . . . . . . . . . . . . OE 8.2 8.6 8.5 8.4 8.7 8.5 8.1 1 LMP 9.0 9.4 9.5 9.4 9.9 9.6 9.4 –4
New Jersey . . . . . . . . . . . . . . . . . OE 9.7 9.7 9.9 9.7 10.0 10.5 10.6 -8 LMP 11.5 11.2 11.7 11.6 12.0 12.5 12.7 –9
New Mexico . . . . . . . . . . . . . . . . . OE 9.3 9.5 9.7 9.1 9.3 9.8 10.3 –10 LMP 11.6 11.5 11.8 11.9 12.3 12.3 12.8 –9
New York . . . . . . . . . . . . . . . . . . OE 8.9 9.1 9.2 9.4 9.5 9.6 9.7 –8 LMP 10.7 10.7 10.9 11.5 12.2 12.0 12.3 –13
North Carolina. . . . . . . . . . . . . . . . OE 9.9 10.1 10.2 10.4 10.6 10.7 11.1 –11 LMP 12.0 12.0 12.6 12.7 13.0 12.9 13.3 –10
North Dakota . . . . . . . . . . . . . . . . OE 8.5 9.1 8.5 9.7 9.2 9.8 9.6 –11 LMP 9.9 9.9 9.9 10.9 10.6 11.1 11.6 –15
Ohio . . . . . . . . . . . . . . . . . . . . . OE 10.3 10.5 10.2 10.3 10.4 10.7 11.0 –6 LMP 12.1 12.1 12.1 12.2 12.3 12.6 13.2 –8
Oklahoma . . . . . . . . . . . . . . . . . . OE 10.6 10.9 10.8 11.2 10.9 11.0 10.6 0 LMP 12.8 13.0 13.2 13.9 13.8 13.4 13.5 –5
Oregon . . . . . . . . . . . . . . . . . . . . OE 7.6 7.5 7.4 7.9 7.8 7.9 8.0 –5 LMP 9.3 9.1 9.1 9.9 9.8 10.1 10.3 –10
Pennsylvania . . . . . . . . . . . . . . . . OE 9.3 9.5 9.6 9.9 10.1 10.3 10.3 –10 LMP 10.7 10.8 11.1 11.4 11.5 11.6 11.8 –9
Rhode Island . . . . . . . . . . . . . . . . OE 8.7 9.7 9.0 9.6 10.0 10.0 10.8 –19 LMP 10.2 11.0 10.4 10.8 11.4 11.2 12.0 –15
South Carolina . . . . . . . . . . . . . . . OE 11.1 11.3 11.5 11.5 11.7 11.8 12.2 –9 LMP 13.7 13.7 14.1 14.2 14.5 14.3 15.5 –12
South Dakota . . . . . . . . . . . . . . . . OE 8.1 7.8 7.9 8.6 7.9 8.6 9.5 –15 LMP 10.8 10.7 11.2 11.4 10.9 11.9 12.6 –14
Tennessee . . . . . . . . . . . . . . . . . . OE 11.1 11.2 11.1 11.4 11.3 11.5 11.8 –6 LMP 12.6 12.5 12.8 12.9 13.0 13.5 14.2 –11
Texas . . . . . . . . . . . . . . . . . . . . . OE 10.4 10.5 10.7 10.9 11.1 11.2 11.3 –8 LMP 12.3 12.4 12.8 13.1 13.1 13.3 13.6 –10
Utah . . . . . . . . . . . . . . . . . . . . . OE 9.2 9.1 9.4 9.5 9.8 9.7 9.5 –3 LMP 10.2 10.2 10.9 10.9 11.3 11.0 10.9 –6
Vermont . . . . . . . . . . . . . . . . . . . OE 7.6 7.6 7.6 7.2 8.2 8.4 8.2 –7 LMP 8.1 8.7 8.8 8.4 9.3 9.5 9.1 –11
Virginia . . . . . . . . . . . . . . . . . . . . OE 9.4 9.5 9.5 10.1 10.2 10.5 10.7 –12 LMP 11.0 11.3 11.2 11.6 11.4 11.3 12.1 –9
Washington . . . . . . . . . . . . . . . . . OE 8.1 8.3 8.2 8.5 8.5 8.9 8.9 –9 LMP 9.7 9.9 9.8 10.2 10.3 10.7 10.6 –8
West Virginia . . . . . . . . . . . . . . . . OE 10.5 10.7 11.2 10.6 10.8 11.9 11.9 –12 LMP 12.5 12.4 12.8 12.1 12.9 13.7 13.9 –10
Wisconsin . . . . . . . . . . . . . . . . . . OE 9.0 9.4 9.3 8.2 8.2 8.5 8.3 8 LMP 10.4 10.5 10.4 10.8 10.9 11.1 11.1 –6
Wyoming . . . . . . . . . . . . . . . . . . . OE 10.4 9.0 9.9 10.5 9.9 10.2 11.1 –6 LMP 11.6 10.8 10.2 11.0 11.2 11.2 12.7 –9
NOTES: OE is the obstetric estimate of the newborn; LMP refers to the date of the mother’s last normal menses.

18 National Vital Statistics Reports, Vol. 64 No. 5 June 1, 2015
Table 5. Percent and number of births based on the obstetric estimate, by selected gestational age categories: United States and each state, 2013
Obstetric estimate
Preterm Early term
Full term
Late term Postterm
Area Births
Total under
37 weeks Under
28 weeks 28–31 weeks
32–33 weeks
34–36 weeks
37–38 weeks
39–40 weeks
41 weeks
42 weeks and over
Not stated
Number Percent Number
United States . . . . . . . . . . . 3,932,181 9.62 0.70 0.92 1.17 6.83 24.81 58.85 6.31 0.41 7,467
Alabama . . . . . . . . . . . . . . 58,167 11.77 1.04 1.20 1.40 8.13 25.65 59.32 3.13 0.14 27 Alaska . . . . . . . . . . . . . . . 11,446 8.54 0.48 0.78 0.97 6.32 25.17 55.99 9.49 0.81 113 Arizona . . . . . . . . . . . . . . . 85,600 9.09 0.57 0.75 1.10 6.67 25.36 59.65 5.60 0.31 43 Arkansas . . . . . . . . . . . . . . 37,832 10.16 0.79 1.00 1.22 7.15 25.01 59.87 4.62 0.35 179 California . . . . . . . . . . . . . . 494,705 8.42 0.57 0.74 1.02 6.08 24.43 59.38 7.25 0.52 805 Colorado . . . . . . . . . . . . . . 65,007 8.57 0.53 0.89 1.01 6.15 22.95 59.03 8.76 0.69 36 Connecticut . . . . . . . . . . . . 36,085 9.31 0.69 0.91 1.16 6.54 22.29 59.96 8.13 0.31 16 Delaware . . . . . . . . . . . . . . 10,831 9.45 0.80 0.97 1.09 6.58 22.68 59.06 8.51 0.30 13 District of Columbia. . . . . . . . 9,288 10.39 1.23 1.29 1.42 6.45 22.06 57.00 10.00 0.55 68 Florida . . . . . . . . . . . . . . . 215,407 10.04 0.77 0.97 1.23 7.06 26.35 59.02 4.39 0.20 239 Georgia . . . . . . . . . . . . . . . 128,748 10.66 0.92 1.13 1.22 7.39 26.09 58.42 4.57 0.25 584 Hawaii . . . . . . . . . . . . . . . 18,987 10.17 0.70 0.87 1.07 7.54 26.50 55.50 7.33 0.51 28 Idaho . . . . . . . . . . . . . . . . 22,383 9.04 0.60 0.75 1.20 6.49 23.22 60.26 7.02 0.46 54 Illinois . . . . . . . . . . . . . . . . 156,931 9.96 0.75 0.96 1.22 7.03 24.73 59.78 5.32 0.21 181 Indiana . . . . . . . . . . . . . . . 83,102 9.62 0.72 0.90 1.12 6.88 24.76 58.96 5.88 0.79 52 Iowa. . . . . . . . . . . . . . . . . 39,094 8.99 0.55 0.88 1.04 6.51 22.29 61.80 6.59 0.33 24 Kansas . . . . . . . . . . . . . . . 38,839 8.88 0.66 0.86 1.14 6.21 23.02 62.43 5.33 0.34 15 Kentucky . . . . . . . . . . . . . . 55,686 11.05 0.70 1.06 1.21 8.07 28.20 56.47 4.03 0.25 33 Louisiana . . . . . . . . . . . . . . 63,201 12.54 0.98 1.31 1.45 8.79 28.91 55.66 2.73 0.16 40 Maine . . . . . . . . . . . . . . . . 12,776 8.10 0.56 0.75 0.93 5.85 20.73 57.61 12.28 1.29 17 Maryland . . . . . . . . . . . . . . 71,953 9.83 0.88 0.97 1.24 6.74 24.65 58.25 6.96 0.31 195 Massachusetts. . . . . . . . . . . 71,788 8.84 0.60 0.86 1.04 6.33 21.04 58.93 10.63 0.57 333 Michigan . . . . . . . . . . . . . . 113,489 9.75 0.83 1.03 1.17 6.72 22.94 59.11 7.80 0.41 99 Minnesota . . . . . . . . . . . . . 69,159 8.30 0.59 0.76 1.03 5.91 21.47 59.73 9.75 0.75 101 Mississippi . . . . . . . . . . . . . 38,634 13.14 1.01 1.34 1.49 9.30 32.87 51.94 1.89 0.16 44 Missouri . . . . . . . . . . . . . . 75,296 9.61 0.67 0.88 1.18 6.88 24.20 60.70 5.09 0.40 394 Montana . . . . . . . . . . . . . . 12,377 8.99 0.45 0.74 1.00 6.81 22.96 60.18 7.25 0.62 21 Nebraska . . . . . . . . . . . . . . 26,095 8.73 0.51 0.96 1.02 6.23 23.22 62.41 5.22 0.41 32 Nevada . . . . . . . . . . . . . . . 35,030 9.84 0.62 0.85 1.21 7.16 25.70 59.82 4.29 0.34 93 New Hampshire . . . . . . . . . . 12,396 8.25 0.53 0.70 1.16 5.85 19.08 59.13 12.76 0.78 27 New Jersey . . . . . . . . . . . . 102,575 9.70 0.70 0.95 1.29 6.75 23.85 59.49 6.66 0.31 48 New Mexico . . . . . . . . . . . . 26,354 9.29 0.56 0.88 1.25 6.60 27.28 56.91 6.16 0.36 99 New York. . . . . . . . . . . . . . 236,980 8.90 0.65 0.85 1.12 6.27 22.91 59.22 8.50 0.48 422 North Carolina . . . . . . . . . . . 119,002 9.92 0.94 1.05 1.24 6.70 23.67 57.79 8.28 0.34 106 North Dakota . . . . . . . . . . . 10,599 8.52 0.58 0.87 0.91 6.16 22.25 62.19 6.66 0.38 6 Ohio. . . . . . . . . . . . . . . . . 138,936 10.31 0.86 0.97 1.29 7.19 24.47 59.56 5.31 0.36 581 Oklahoma . . . . . . . . . . . . . 53,369 10.56 0.65 0.92 1.32 7.66 27.84 58.09 3.27 0.24 85 Oregon . . . . . . . . . . . . . . . 45,155 7.60 0.49 0.66 0.91 5.54 20.63 60.01 10.63 1.12 44 Pennsylvania. . . . . . . . . . . . 140,921 9.35 0.73 0.98 1.22 6.42 21.77 60.14 8.32 0.42 1,146 Rhode Island . . . . . . . . . . . 10,809 8.70 0.70 0.77 0.93 6.30 22.75 59.29 9.05 0.21 39 South Carolina . . . . . . . . . . 56,795 11.14 0.83 1.26 1.40 7.66 25.39 59.27 4.02 0.18 28 South Dakota . . . . . . . . . . . 12,248 8.13 0.43 0.76 0.78 6.15 22.87 59.67 8.24 1.10 27 Tennessee . . . . . . . . . . . . . 79,992 11.08 0.75 1.09 1.30 7.94 26.17 58.59 3.93 0.23 301 Texas . . . . . . . . . . . . . . . . 387,340 10.42 0.70 0.93 1.22 7.57 28.39 56.92 3.89 0.39 148 Utah. . . . . . . . . . . . . . . . . 50,957 9.16 0.46 0.76 0.94 7.00 27.48 58.05 5.05 0.26 4 Vermont . . . . . . . . . . . . . . 5,975 7.64 0.32 0.60 1.00 5.71 19.31 58.03 13.92 1.11 4 Virginia . . . . . . . . . . . . . . . 102,147 9.40 0.76 0.93 1.18 6.53 24.30 59.08 6.77 0.45 64 Washington . . . . . . . . . . . . 86,577 8.14 0.49 0.76 1.02 5.86 22.24 58.93 9.93 0.76 256 West Virginia . . . . . . . . . . . 20,825 10.53 0.63 0.85 1.27 7.78 26.77 57.47 4.98 0.26 22 Wisconsin . . . . . . . . . . . . . 66,649 8.97 0.61 0.83 1.11 6.42 24.46 59.11 7.02 0.44 130 Wyoming . . . . . . . . . . . . . . 7,644 10.36 0.48 1.05 1.19 7.64 25.45 57.82 5.69 0.68 1

National Vital Statistics Reports, Vol. 64 No. 5 June 1, 2015 19
Table 6. Infant mortality rates based on the OE and LMP measures of gestation: United States, 2013 linked file
Absolute Relative OE LMP difference difference
Infant Infant deaths deaths
per 1,000 per 1,000 Percentage Weeks of gestation Number births Number births points Percent
Total . . . . . . . . . . . . . . . . . . . . . . 23,447 5.90 23,446 5.91 0.0 0
Under 37 . . . . . . . . . . . . . . . . . . . 15,675 41.51 15,553 34.77 6.7 19
Under 28 . . . . . . . . . . . . . . . . . . 10,908 395.93 10,676 374.70 21.2 6
17 . . . . . . . . . . . . . . . . . . . . 256 882.76 293 830.03 52.7 6
18 . . . . . . . . . . . . . . . . . . . . 423 875.78 438 839.08 36.7 4
19 . . . . . . . . . . . . . . . . . . . . 667 879.95 645 883.56 –3.6 0
20 . . . . . . . . . . . . . . . . . . . . 1,129 859.86 1,010 855.21 4.7 1
21 . . . . . . . . . . . . . . . . . . . . 1,427 897.48 1,431 851.28 46.2 5
22 . . . . . . . . . . . . . . . . . . . . 1,870 878.35 1,599 777.72 100.6 13
23 . . . . . . . . . . . . . . . . . . . . 1,618 601.26 1,593 570.15 31.1 5
24 . . . . . . . . . . . . . . . . . . . . 1,426 363.13 1,321 341.34 21.8 6
25 . . . . . . . . . . . . . . . . . . . . 920 220.52 997 227.63 –7.1 –3
26 . . . . . . . . . . . . . . . . . . . . 674 141.15 734 146.36 –5.2 –4
27 . . . . . . . . . . . . . . . . . . . . 498 91.85 615 104.06 –12.2 –12
28–31. . . . . . . . . . . . . . . . . . . . 1,525 42.25 1,678 35.72 6.5 18
28 . . . . . . . . . . . . . . . . . . . . 402 62.82 416 54.77 8.1 15
29 . . . . . . . . . . . . . . . . . . . . 339 46.86 404 42.20 4.7 11
30 . . . . . . . . . . . . . . . . . . . . 391 39.39 416 31.98 7.4 23
31 . . . . . . . . . . . . . . . . . . . . 393 31.35 442 26.32 5.0 19
32–33 . . . . . . . . . . . . . . . . . . . 952 20.79 931 16.04 4.8 30
32 . . . . . . . . . . . . . . . . . . . . 437 23.19 410 17.58 5.6 32
33 . . . . . . . . . . . . . . . . . . . . 515 19.12 521 15.01 4.1 27
34–36 . . . . . . . . . . . . . . . . . . . 2,290 8.54 2,268 7.23 1.3 18
34 . . . . . . . . . . . . . . . . . . . . 654 13.49 649 10.96 2.5 23
35 . . . . . . . . . . . . . . . . . . . . 677 9.13 714 7.77 1.4 18
36 . . . . . . . . . . . . . . . . . . . . 959 6.58 905 5.56 1.0 18
37–38 . . . . . . . . . . . . . . . . . . . . . 3,078 3.16 2,934 3.01 0.1 5
37. . . . . . . . . . . . . . . . . . . . . . 1,407 4.24 1,322 3.92 0.3 8
38. . . . . . . . . . . . . . . . . . . . . . 1,671 2.60 1,612 2.53 0.1 3
39–40 . . . . . . . . . . . . . . . . . . . . . 3,990 1.73 3,617 1.85 –0.1 –6
39. . . . . . . . . . . . . . . . . . . . . . 2,721 1.85 2,267 1.91 –0.1 –3
40. . . . . . . . . . . . . . . . . . . . . . 1,269 1.51 1,350 1.75 –0.2 –14
41 . . . . . . . . . . . . . . . . . . . . . . . 376 1.52 601 1.80 –0.3 –16
42 and over . . . . . . . . . . . . . . . . . . 53 3.29 514 2.39 0.9 38
42. . . . . . . . . . . . . . . . . . . . . . 43 2.90 216 2.06 0.8 41
43. . . . . . . . . . . . . . . . . . . . . . 5 * 135 2.52 * * 44. . . . . . . . . . . . . . . . . . . . . . 3 * 69 2.42 * * 45. . . . . . . . . . . . . . . . . . . . . . 1 * 43 2.89 * * 46. . . . . . . . . . . . . . . . . . . . . . 1 * 34 4.14 * * 47. . . . . . . . . . . . . . . . . . . . . . – * 17 * * *
Unknown . . . . . . . . . . . . . . . . . . . 275 . . . 227 . . . . . . . . .
0.0 or 0 Quantity more than 0 but less than 0.05. * Figure does not meet standards of reliability or precision. – Quantity zero. . . . Category not applicable.
NOTES: OE is the obstetric estimate of the newborn; LMP refers to the date of the mother’s last normal menses.

U.S. DEPARTMENT OF HEALTH & HUMAN SERVICES
Centers for Disease Control and Prevention National Center for Health Statistics 3311 Toledo Road, Room 5419 Hyattsville, MD 20782–2064
FIRST CLASS MAIL POSTAGE & FEES PAID
CDC/NCHS PERMIT NO. G-284
OFFICIAL BUSINESS PENALTY FOR PRIVATE USE, $300
For more NCHS NVSRs, visit: http://www.cdc.gov/nchs/products/nvsr.htm.
National Vital Statistics Reports, Vol. 64 No. 5 June 1, 2015
Contents
Abstract . . . . . . . . . . . . . . . . . . . . . . . . . . . . . . . . . . . . . . . 2 Introduction . . . . . . . . . . . . . . . . . . . . . . . . . . . . . . . . . . . . . 2 Methods . . . . . . . . . . . . . . . . . . . . . . . . . . . . . . . . . . . . . . . 2 Results . . . . . . . . . . . . . . . . . . . . . . . . . . . . . . . . . . . . . . . . 3
Percent agreement—the OE compared with the LMP-based measure of gestational age . . . . . . . . . . . . . . . . . . . . . . . . . . . . . . . . 3 Mean gestational age—the OE compared with the LMP-based measure of gestational age. . . . . . . . . . . . . . . . . . . . . . . . . . . 3 Percent distributions—the OE compared with the LMP-based gestational age . . . . . . . . . . . . . . . . . . . . . . . . . . . . . . . . . . 3 Trends in births by gestational age categories—the OE compared with the LMP-based measure of gestational age . . . . . . . . . . . . . . 4 Race and Hispanic origin—the OE compared with the LMP-based measure of gestational age. . . . . . . . . . . . . . . . . . . . . . . . . . . 4 State preterm birth rates—the OE compared with the LMP-based measure of gestational age. . . . . . . . . . . . . . . . . . . . . . . . . . . 6 Infant mortality rates—the OE compared with the LMP-based measure of gestational age. . . . . . . . . . . . . . . . . . . . . . . . . . . 7
Discussion . . . . . . . . . . . . . . . . . . . . . . . . . . . . . . . . . . . . . . 7 Similarities and differences between the two gestational age measures . . . 7 Assessing and improving data quality . . . . . . . . . . . . . . . . . . . . . 8
References. . . . . . . . . . . . . . . . . . . . . . . . . . . . . . . . . . . . . . 9 List of Detailed Tables . . . . . . . . . . . . . . . . . . . . . . . . . . . . . . 10
Copyright information
All material appearing in this public domain and may be recopied without permission; cisource, however, is apprecia
For e-mail updates on NCHS publication releases, subscribe For questions or general information about NCHS: Tel: 1–800–CD
Internet: http://www.cdc.gov/nchs • Online req
DHHS Publication No. 2015–
Acknowledgments
The authors gratefully acknowledge the contributions of Brady E. Hamilton and Marian F. MacDorman to this report.
report is in the produced or tation as to ted.
National Center for Health Statistics
Charles J. Rothwell, M.S., M.B.A., Director Nathaniel Schenker, Ph.D., Deputy Director
Jennifer H. Madans, Ph.D., Associate Director for Science
Division of Vital Statistics Delton Atkinson, M.P.H., M.P.H., P.M.P.,
Suggested citation
Martin JA, Osterman MJK, Kirmeyer SE, Gregory ECW. Measuring gestational age in vital statistics data: Transitioning to the obstetric estimate. National vital statistics reports; vol 64 no 5. Hyattsville, MD: National Center for Health Statistics. 2015.
Director
online at: http://www.cdc.gov/nchs/govdelivery.htm. C–INFO (1–800–232–4636) • TTY: 1–888–232–6348 uest form: http://www.cdc.gov/info
1120 • CS256506