nationellt samverkansprojekt biogas i fordon
TRANSCRIPT

Svenska Biogasföreningen Telefon Telefax Hemsida e-post:Box 49134 08 – 692 18 50 08 – 654 46 15 www.sbgf.org [email protected] 29 STOCKHOLM
Nationellt Samverkansprojekt Biogas i Fordon
ISSN 1651-5501
Projektet delfinansieras av Energimyndigheten
Identifiering av parametrar som påverkar igensättning av fyllkroppar i uppgraderingsanläggningar med vattenskrubber
Microbial Grotwh on Pall-rings – A problem when upgradingbiogas with the technique absorption with water wash
610408

This project was initiated by the Biogas Group at the Swedish Gas Centre, www.sgc.se. The report was written in English to spread the results of the project. This project has been funded by: C4 Teknik, Kristianstad kommun Jönköping kommun Malmberg Water Stockholm Vatten Svensk Biogas Sydkraft Gas Trollhättan kommun YIT Vatten och Miljöteknik Swedish Energy Agency

Microbial Growth on Pall-rings
A problem when upgrading biogas with the technique absorption with water wash
Åsa Tynell

2
Foreword This project is a student thesis within the engineering programme Technical Biology at Linköping Institute of Technology. The project was commissioned by the Swedish Gas Centre in Malmö, Sweden. I would like to thank Margareta Persson at SGC and Gunnar Börjesson at Linköping University for good guidance, proofreading and ideas during the project. I would especially like to thank all personal at the biogas plants that I’ve contacted for helpfully answering my questions and showing me around the plants. I am also thankful to everyone else, nobody mentioned –nobody forgotten, who has helped me with this project. Linköping, January 2005

3
Sammanfattning Uppgradering av biogas med tekniken vattenabsorption är vanligt i Sverige. Elva biogasanläggningar med tillsammans fjorton uppgraderingsanläggningar använder sig av tekniken. Problem med igensättning av fyllkroppar i absorptionskolonnen, samt i ett fall i desorptionskolonnen är vanligt förekommande och har en negativ effekt på uppgraderingen av rågas till fordonsgas. Fem av de nio anläggningarna i denna studie har problem med mikrobiell tillväxt på fyllkropparna. Syftet med denna rapport var att identifiera den mikrobiella tillväxten och avgöra vilka faktorer som reglerar den för att kunna rådgiva driftsansvariga hur man motverkar tillväxt. En enkät skickades ut och studiebesök gjordes för att samla information om anläggningarna. En fosfolipid fettsyra (PLFA)-analys utfördes för att bestämma mikrobiell biomassa och organismer, vilka PLFA biomarkörer är en typ av indikator för. Prover samlades in från fyra uppgraderingsanläggningar: Jönköping, Kristianstad, Linköping och Uppsala. Proverna som samlades in var till utseendet olika, allt från gult slem från Linköping till röd-brun gegga som liknade kaffe-sump från Uppsala. I proverna från Linköping och Uppsala detekterades biomarkörer för metanotrofer av typ I. Metanotrofer finns i jord, vatten och luft i miljöer med tillgång till metan och syre. De hämmas av bland annat acetylen. I Jönköpingproverna detekterades biomarkörer för bakterien actinomyceter som är en vanligt förekommande bakterie i vattnet i avloppsreningsverkens luftningsbassänger. Den mikrobiella tillväxten som samlades in från Kristianstad räckte enbart till ett prov och därför är det resultatet ej tillförlitligt. I samtliga prover detekterades fungi (svamp) som förmodligen etablerats efter andra organismer. Faktorer som påverkar den mikrobiella tillväxten ansågs vara processvattnets kvalitet, pH och temperatur. Rent vatten (dricksvatten) innehåller mindre mängd organiskt material, samtliga anläggningar som använder sig av avloppsvatten upplever problem. Lågt pH är gynnsamt för att minska den mikrobiella tillväxten eftersom de flesta organismer trivs bäst vid neutralt pH. Låg temperatur är gynnsamt eftersom lösligheten för koldioxid och divätesulfid är bättre vid lägre temperaturer, vilket gynnar uppgraderingen av biogas.
4
Abstract Upgrading of biogas performed using the technique absorption with water wash is common in Sweden where eleven biogas plants, comprising a total of fourteen upgrading plants use this technique. However problems with microbial growth on the pall-rings in the absorption column, and in one case in the desorption column, have negative impact on upgrading the raw gas to vehicle gas. Five of the nine biogas plants studied here have experienced problems with microbial growth. The objective of this report was to identify the microbial growth and determine possible factors regulating microbial growth in order to give advice to process management. A questionnaire was sent out and visits were made to the upgrading plants to collect information about the plants. A phospholipid fatty acid (PLFA) analysis was performed to determine microbial biomass and community structure, for which PLFA biomarkers are one type of indicator. Samples were analysed from four upgrading plants: Jönköping, Kristinstad, Linköping and Uppsala. The cultures collected were visually different, varying from yellow and slimy to reddish brown with the consistency of coffee grounds. In the Linköping and Uppsala samples, biomarkers for type I methanotrophs were detected. Methanotrophs live in environments with access to methane and oxygen and are inhibited by e.g. acetylene. In the Jönköping samples biomarkers indicating the bacteria actinomycetes common in the water of aeration tanks in sewage treatment plants, were detected. In Kristianstad there was only enough culture for one sample, so no reliable result was obtained. Fungi were detected in all samples and probably established after other organisms. Factors affecting development of microbial growth were found to be water quality, pH and temperature of the process water. Clean water (drinking water) contains less organic material than cleaned water from sewage treatment plants. All plants using water from sewage treatment plants have experienced microbial growth. Low pH is beneficial for reducing microbial growth since most organisms prefer a neutral environment. Low temperature is beneficial for minimising microbial growth since the solubility of carbon dioxide and hydrogen sulphide increases with decreasing temperature.

5
TABLE OF CONTENTS FOREWORD .....................................................................................................................2
SAMMANFATTNING......................................................................................................3
ABSTRACT .......................................................................................................................4
1 INTRODUCTION .....................................................................................................7 1.1 OBJECTIVES..........................................................................................................7 1.2 METHODS .............................................................................................................8 1.3 LIMITATIONS ........................................................................................................8
2 THEORY....................................................................................................................9 2.1 PRODUCTION OF BIOGAS.......................................................................................9
2.1.1 Anaerobic digestion.....................................................................................9 2.1.2 Digestion of sewage sludge .......................................................................10 2.1.3 Co-digestion of organic waste...................................................................10 2.1.4 Upgrading of biogas as vehicle fuel ..........................................................11
2.2 ABSORPTION WITH WATER WASH ......................................................................11 2.2.1 The technique.............................................................................................11
2.2.1.1 Regenerating water wash plants ............................................................12 2.2.1.2 Single pass water wash plants ...............................................................13
2.2.2 Water wash plants in Sweden ....................................................................13 2.2.3 Problems with absorption by water wash..................................................14
3 QUESTIONNAIRE .................................................................................................15 3.1 MATERIALS AND METHODS................................................................................15 3.2 RESULTS .............................................................................................................16
3.2.1 Raw gas quality .........................................................................................16 3.2.2 Water quality .............................................................................................17
3.2.2.1 pH of the process water .........................................................................17 3.2.2.2 Temperature of process water................................................................18 3.2.2.3 BOD and COD of the process water .....................................................18
3.2.3 Plant design ...............................................................................................19 3.2.4 Water velocity in the absorption column...................................................19 3.2.5 Pall-rings ...................................................................................................19 3.2.6 Cleaning of pall-rings................................................................................21 3.2.7 Detergents used for cleaning.....................................................................22
4 LABORATORY STUDIES ....................................................................................23 4.1 MATERIALS AND METHOD ..................................................................................23
4.1.1 Samples......................................................................................................23 4.1.2 Phospholipid fatty acid (PLFA) analysis...................................................24
4.1.2.1 Samples for PLFA analysis ...................................................................25 4.1.2.2 PLFA extraction ....................................................................................25 4.1.2.3 Fatty Acid Methyl Ester -FAME ...........................................................26 4.1.2.4 Derivatisation.........................................................................................26
6
4.1.2.5 GC and GC/MS analysis........................................................................26 4.1.2.6 Fatty acid nomenclature.........................................................................26
4.1.3 Methane oxidation .....................................................................................26 4.2 RESULTS .............................................................................................................27
4.2.1 PLFA analysis............................................................................................27 4.2.2 Methane oxidation .....................................................................................29
5 DISCUSSION...........................................................................................................30 5.1 LINKÖPING AND UPPSALA ..................................................................................31 5.2 JÖNKÖPING .........................................................................................................32 5.3 KRISTIANSTAD....................................................................................................33 5.4 FACTORS THAT MAY CAUSE MICROBIAL GROWTH...............................................33
5.4.1 Raw gas quality .........................................................................................33 5.4.2 Water Quality ............................................................................................34
5.4.2.1 pH of the process water .........................................................................34 5.4.2.2 Temperature of the process water..........................................................34 5.4.2.3 BOD & COD .........................................................................................35
5.4.3 Plant design and dimensions .....................................................................35 5.4.4 Water velocity through the absorption column .........................................35 5.4.5 Pall-rings ...................................................................................................36
5.5 PREVENTIVE MEASURES.....................................................................................36 5.5.1 Cleaning methods ......................................................................................36 5.5.2 Detergents for cleaning .............................................................................36
6 CONCLUSIONS......................................................................................................38
7 REFERENCES ........................................................................................................40
APPENDIX A: QUESTIONNAIRE ..............................................................................45
APPENDIX B: EVALUATION .....................................................................................50

7
1 Introduction In Sweden there are fourteen biogas plants in eleven cities (2004) that use the technique absorption with water wash for upgrading raw gas to vehicle fuel. Together they have capacity to produce around 5000 Nm3 vehicle fuel per hour, which is equivalent to 5400 l gasoline (Svensk Biogas, 2005-01-02). In upgrading of biogas the methane content in the gas is increased by removing carbon dioxide. The technique is based on flushing raw gas from the bottom of a column called the absorption column, and flushing water from the top of the column. When the gas and water meet, carbon dioxide dissolves into carbonic acid and the methane concentration is increased. To create a larger contact surface between the raw gas and the water, the absorption column is randomly filled with plastic packing called pall-rings. Pall-rings come in many different models but are usually in cylindrical form with dimensions 25x25 mm2. Some upgrading plants experience problems with growth of some type of biofilm on the pall-rings. The appearance of the biofilm differs between the upgrading plants. The growth of microorganisms lowers the efficiency of the upgrading plant and the upgraded biogas fails to fulfil the criteria for vehicle fuel due to the low methane content. When problems with growth of microorganisms occur, most plants reduce incoming flow rates of the raw gas. When the situation is no longer manageable the plant shuts down operations to clean the pall-rings. The pall-rings are either cleaned in the absorption column using a detergent or removed from the column and cleaned mechanically. The growth of microorganisms on pall-rings impacts negatively on the production of vehicle fuel at several of the Swedish upgrading plants. Therefore, identifying the microorganisms growing on pall-rings and learning how to inhibit their growth would secure and improve production of vehicle fuel in upgrading plants using the water absorption technique.
1.1 Objectives The objectives of this report were to:
1. Identify the organisms in the organic material that cause microbial growth on the pall-rings in the absorption column and in some cases in the desorption column. 2. Investigate and determine possible factors regulating microbial growth on pall-rings in the different biogas upgrading systems, in order to give advice to process management.
These objectives were approached by analysing the microbial growth on pall-rings and comparing parameters such as pH, temperature and raw gas quality. With better knowledge of the constituents of the growth, new methods of inhibiting or destroying the growth on pall-rings could be developed. If the growth on pall-rings could be reduced or, even better, be prevented, the upgrading plants would not have to shut down to clean the system.

8
1.2 Methods A questionnaire was sent out to the upgrading plants selected for the study, followed by interviews and visits to some of the plants. The questionnaire (see Appendix A) asked for information about raw gas quality, water quality, plant design, operational disturbances and other facts that considered likely to fulfil the objectives in section 1.1. This is described more thoroughly in Chapter 3. Information about the upgrading plants was the collected. Microbial growth from four out of five upgrading plants experiencing growth was also collected and the laboratory part of the project commenced. One longer elaboration and one shorter test were performed (see Chapter 4).
1.3 Limitations This project was conducted under a limited time period, from September 2004 until January 2005, and therefore some limitations had be placed on the methods to fulfil the objectives mentioned in section 1.1. In Sweden several techniques are used for upgrading biogas. These include pressure swing adsorption (PSA), absorption with water and absorption with selexol® (SGC, 2003). Only plants using absorption with water wash have experienced problems with microbial growth in the upgrading process and therefore only this technique is treated in this report. There was only time to perform one longer elaboration. Since six plants were visited from Uppsala in the middle of Sweden, down to Kristianstad in the south of Sweden, some time had to be set aside for travel. The amount of microbial growth that was collected also limited performance of the number of elaboration studies, since not all the plants experiencing problems with microbial growth could supply enough material.

9
2 Theory
2.1 Production of biogas Biogas, or raw gas, is produced by complete anaerobic digestion of organic material. The raw gas consists mainly of methane and carbon dioxide, but also smaller amounts of hydrogen sulphide. The methane content is usually around 55-75 vol.%. The carbon dioxide content is 25-45 vol.% and the hydrogen sulphide content is approximately 20-1000 ppm (de Mes et al., 2003). These figures vary depending on parameters such as the type of organic material digested, the temperature range within with the process is taking place (thermophilic or mesophilic), the retention time and the loading rate. For example, digestion of lipids and proteins increase the methane content in the raw gas more than digestion of carbon hydrates. Thermophilic processes operate at temperatures ranging between 50-70°C and mesophilic processes operate at temperatures between 20-40°C. The thermophilic digestion process is usually faster than the mesophilic.
2.1.1 Anaerobic digestion The anaerobic degradation of organic carbon into its most reduced form, methane, is a process performed by many types of microorganisms. Several types of organisms are needed since the methane-forming bacteria cannot degrade complex compounds (Lagerkvist, 2003). The anaerobic degradation process is divided into four steps (see legend to Figure 1). 1 Hydrolysis: Degradation of large organic molecules into smaller, soluble organic substances called monomers. 2 Acidogenesis or fermentation: Further degradation of the now soluble organic substances to e.g. volatile fatty acids (VFA). 3 Acetogenesis: Conversion of the fermentation products to acetic acid, hydrogen (H2) and carbon dioxide (CO2). 4 Methanogenesis: Conversion of the products of the acetogenesis to methane (CH4) and CO2. Different types of fermentative bacteria perform steps 1-3. The methanogenesis is performed by methanogen bacteria. Acetate-splitting methanogenes degrade acetate to CH4 and CO2 while other methanogens oxidise H2 and CO2 to produce CH4 (White & Burt, 2003).

10
Figure 1. The pathways of the anaerobic degradation. (White & Burt, 2003) The production of biogas is either performed by digesting sewage sludge solely or by co-digesting several types of organic material.
2.1.2 Digestion of sewage sludge The municipal sewage treatment plants that produce biogas digest the sludge produced during wastewater treatment. This sludge is digested in an anaerobic tank, during which process it is stabilised, and its volume is decreased. Biogas is produced after about one month of incubation. Digestion of sewage sludge is the most common way to produce biogas in Sweden. The dried sludge residue is in some cases used as agricultural fertiliser after first being tested for bacteria.
2.1.3 Co-digestion of organic waste Digestion of waste products from the food and beverage industry such as abbatoirs and meat processes, dairy, fish-processing, starch-processing, beverages and distilleries etc is common. These waste products have high energetic values. Some biogas plants also degrade organic waste from households, but since the degrading process is sensitive to non-organic compounds, the waste used for degradation must be well separated and controlled so that no non-organic waste is present. Anaerobic digestion is performed in an anaerobic tank and the material is sanitised (heated at minimum 70°C during at least one hour) in order to eliminate bacteria before degradation preventing bacteria from contaminating the sludge that later is used as a fertiliser. Usually, more energy is obtained from degradation of other organic waste than from sewage sludge since the concentration of organic compounds is higher (de Mes et al.,

11
2003). For example, fat from restaurants is good material for anaerobic degradation since fat contains a lot of energy and is also classed as low risk material.
2.1.4 Upgrading of biogas as vehicle fuel An effective use of biogas as vehicle fuel requires a methane content of at least 95%. The raw gas usually contains about 55-75% methane, the remaining gas consists mainly of carbon dioxide and hydrogen sulphide. By upgrading the methane content in the gas, storage volumes are kept low and longer driving distances are obtained. In Sweden, the methane level is kept at 97% so that the same vehicles can be driven both on natural gas and biogas.
2.2 Absorption with Water Wash There are two different types of water absorption plants, regenerating plants and single pass plants. The most common is the regenerating plant. The water absorption technique is the same for the two types as described in section 2.2.1.
2.2.1 The technique The process removes mainly carbon dioxide but also hydrogen sulphide, which is unique for this technique, from the raw gas. This is achieved by water absorption under pressure. Both carbon dioxide, solubility 3.37 g/l, and hydrogen sulphide, solubility 7.1 g/l are more soluble in water than methane 0.03865 g/l (Airliquide, 2005-01-16), the solubilities in water are measured at 1 atm and at 0˚C (the lower the solubility (g/l), the more difficult the compound is to dissolve). Therefore, most of the methane remains in a gaseous state while the carbon dioxide and the hydrogen sulphide are dissolved in water. Condensed water and particles are removed from the raw gas in a separator before entering the absorption column, also called the scrubber. The gas is then led to a compressor where it is compressed in two stages. The raw gas is pressurised to 9-12 bar. The higher the pressure, the more soluble the carbon dioxide is in water, in accordance with Henry’s law. After pressurising, the gas is cooled (SGC, 2001; Flotech, 2004) in the heat exchanger. Water is flushed through a high, cylindrical column, usually measuring about 10 meters in height and 0.5 metres in diameter. The water enters at the top of the column, and the pressurised raw gas enters from the bottom of the column. Usually a pressure of 9-12 bars is kept in the absorption column. When the gas and water meet, carbon dioxide and hydrogen sulphide dissolve in the water. Methane, to a much smaller extent, also dissolves in pressurised water. To create a greater area of contact between the gas and water and thereby achieve a greater solubility of carbon dioxide, the column is filled with randomly packed pall-rings. Pall-rings come in many different forms and composition (Figure 5 in section 3.2.7). New models are tested in order to find the optimum absorption rate. When the carbon dioxide is absorbed in the water, some of the carbon dioxide molecules react with water to form carbonic acid, H2CO3. The carbonic acid lowers the pH of the water in the column from neutral pH (7-8) to slightly acid pH (5). Clean gas exits at the
12
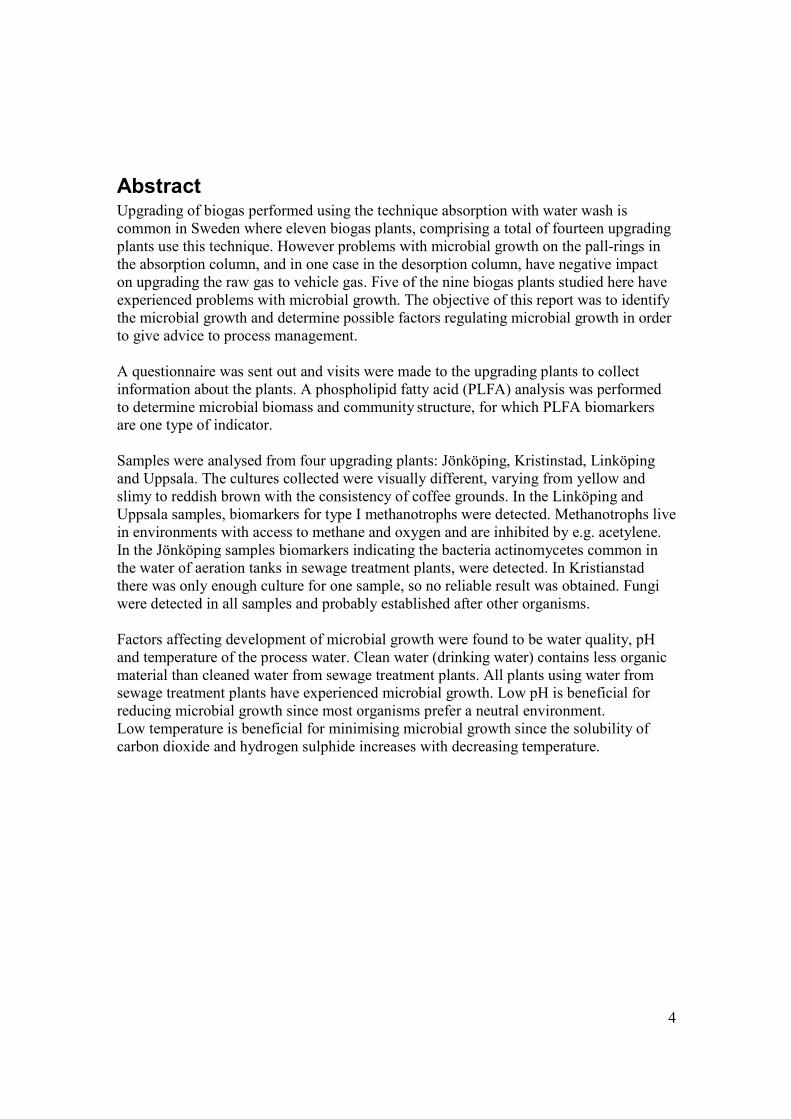
top of the absorption column through a gas vent. The purified gas is collected, dried and pressurised to about 200 bars before being used as vehicle fuel (Swedish Biogas Association, 1998). 2.2.1.1 Regenerating water wash plants In regenerating plants, the water from the absorption column continues to a flash tank (see legend Figure 2) where methane that has dissolved to water, is separated to gas under an intermediate pressure of 2-4 bars. The methane gas is collected and returned to the process system with the raw gas before the raw gas enters the compressor. This is done to yield as much methane as possible (Flotech, 2004).
Upgraded gas
Gas dryer
Water pump
Absorptioncolumn
Flashtank
Desorptioncolumn
Vent gas(CO2)
Cooler
Biofilter
Filter
Airblower
Raw biogas
Waterseparator
Compressor
Figure 2. Regenerating water wash plant (SGC, 2001) The process water then continues to the desorption column, also called the stripper, which has the main purpose of removing the dissolved carbon dioxide from the process water. Like the absorption column, the desorption column is randomly packed with pall-rings. The water enters the column at the top and air is blown from the bottom of the column. The pressure is most often atmospheric (1 bar). Vent gas exits the column at the top. The vent gas from the desorption column, consisting of carbon dioxide and other possible gases such as hydrogen sulphide, is deodorised by passing it through a gas filter and then released to the atmosphere. The low pressure removes dissolved carbon dioxide from the water by returning it to gaseous form according to the reaction: H2CO3 + O2 (g) → CO2 (g) + H2O

13
The pH of the process water is increased to around neutral when this occurs and the water temperature increases. The water has to be cooled in a heat exchanger to the absorption temperature of 15 °C. This is the process water design temperature of most regenerating water wash plants (Malmberg Water, 2004). The water is then ready to be reused in another loop in the regeneration process. The process water is drinking water and is replaced a little at a time. 2.2.1.2 Single pass water wash plants The single pass water wash plants mostly use cleaned water from sewage treatment plants as process water to keep the cost of water supply low. The process water temperature is much more variable in single pass plants since the water temperature usually follows the seasonal variations. Water temperatures in the range 4-21 °C are common.
Figure 3. Single pass water wash plant (SGC, 2001) Single pass water wash plants are based on the same principle as regenerating water wash plants regarding the absorption column and the flash tank. The water interacts with the raw gas in the absorption column and methane that has been absorbed by the water is converted into gas again by depressurising in the flash tank. The water exits the system from the flash tank (Figure 3) and is returned to the sewage treatment plant. The process water is not reused in the system. The gas in the flash tank is returned to the gas inlet.
2.2.2 Water wash plants in Sweden In Sweden (2004) there is a total of 11 biogas plants (Table 1) that use absorption with water wash as their gas upgrading method. The Linköping plant has two different models of regeneration plants with two systems of each. When one pair runs, the other is idle. Both the Trollhättan plant and the Uppsala plant have back-up systems, which are only used in case of breakdown of the main upgrading system.

14
Two manufacturers dominate the Swedish market, YIT Water & Environment and Malmberg Water. In Europe, only Lille and Tours in France, Tilburg in the Netherlands and five plants in the Czech Republic (IEA Bioenergy, 2003) upgrade biogas using absorption with water wash. Compared to the rest of Europe, Sweden has more experience with the techniques and problems regarding water wash.
2.2.3 Problems with absorption by water wash
Figure 4. Culture on pall-rings in Kristianstad, 2001. (Photo: R Johansson) Some of the biogas plants using absorption with water wash have problems with microbial growth on the pall-rings. In most cases the growth of microorganisms occurs in the absorption column. This microbial growth causes inefficiency in the upgrading process, manifested by a decreasing methane content in the purified gas. Visually the growth found in the plants have been of two kinds: a yellow-red, slimy culture found in Linköping and Kristianstad 2001(Figure 4), and culture that looks like coffee grounds found in Jönköping, Uppsala, Eslöv and Kristianstad 2004 (Figure 5, page 21).
Table 1. Upgrading plants in Sweden using absorption with water wash. Eskilstuna Regenerative 2003Eslöv single pass 1997Henriksdal Regenerative 2003Jönköping single pass 2000Kalmar Regenerative 1998Kristianstad single pass 1999Linköping Regenerative 2002 Regenerative 1997Norrköping single pass 2004Trollhättan Regenerative 2002 back-up 1996Uppsala single pass 2002 back-up 1997Västerås Regenerative 2004

15
3 Questionnaire To this author’s knowledge, studies on microbial growth in upgrading plants have not been reported outside Sweden. Sweden is the country where the technique of upgrading with water wash is most used. To gather information from all the upgrading plants using the absorption technique with water wash a questionnaire was sent to the process manager, or persons recommended by the process manager with adequate knowledge to answer the questionnaire correctly. The questionnaire was sent to nine upgrading plants. Visits were made to six of these nine plants. The upgrading plants in Norrköping and in Västerås also use the method absorption with water wash, but these plants were regarded as less interesting to study since the Norrköping plant had been in operation for less than a year (June, 2004) and the Västerås plant was not yet in operation (started in October, 2004) when this investigation commenced (September, 2004). Microbial growth on pall-rings during the first year of operation is uncommon but has been observed in Jönköping.
3.1 Materials and Methods The questions used in the questionnaire (see appendix A) were based on the previously known problem of upgrading with water wash namely growth of undefined microorganisms on the pall-rings (Persson, person. comm., 2004). The questionnaire was also composed to document design differences in the plants, and also the quality of incoming process water and gas. Details of the pall-rings used and washing techniques for all plants had to this author’s knowledge never previously been documented and were therefore part of the questionnaire. During visits and interviews new questions and ideas came up and additional questions, for example on hydrogen sulphide content in the raw gas, were added. The information collected from the questionnaire and visits was used to compare parameters between the upgrading plants with problems of growth of microorganisms on pall-rings and those without such problems, but also between plants of the regenerating and single pass types. Raw gas quality was studied to determine whether the material digested and the content of the raw gas had any impact on the upgrading process. Water properties and temperature were interesting since a high content of nutrients or bacteria can favour growth of microorganisms. The factors selected for study were:
• Raw gas quality: Depending on the material digested, the raw gas content of methane and carbon dioxide varies. The methane content in raw gas of digested sewage sludge is usually lower than that in raw gas from co-digestion (SGC, 2001). The H2S-level in raw gas is generally also studied, since a high level of hydrogen sulphide can cause corrosion on metals, odour and problems at the separation of carbon dioxide (SGC, 2003).
• pH was an interesting factor to study since a low pH value can inhibit growth of certain bacteria.
• Temperature was studied to compare variations since most plants experience more growth at higher temperatures.
• Biological Oxygen Demand (BOD) and Chemical Oxygen Demand (COD) of the process water.

16
BOD and COD are different ways to measure the amount of oxygen required to degrade organic material. BOD determines the amount of oxygen that is consumed at complete biological degradation of organic compounds in sewage treatment water (SGAB, 2004-12-12). BOD is a part-value of COD. A high BOD-value indicates that the normal oxygen rate in the water is likely to decrease. BOD-values are used to approximate the amount of material in the water that can be easily degraded. A high BOD-value in this case could mean that growth could occur more easily, since there is access to a lot of organic material. COD is a measure of the amount of oxygen that is consumed at complete chemical degradation of organic compounds in water. A high COD-value results in a decreasing oxygen content in the water. COD-values are used to measure the amount of organic compounds in the water (SGAB, 2004-12-12).
• Water velocity: This factor was studied since a high water velocity through the water column could perhaps prevent certain bacteria from establishing on the pall-rings.
• Dimensions of the absorption column, desorption column and raw gas capacity were compared to see whether distribution of water and process load affected the upgrading.
• The model, size and density of pall-rings used in the absorption column were compared to see whether there was any correlation between these factors and microbial growth.
• Cleaning methods and detergents used by the plants to clean the pall-rings were compared to study the effectiveness of these.
3.2 Results Information was successfully collected from all nine biogas plants. Answers to almost all questions were obtained and put together in a chart (see Appendix B).
3.2.1 Raw gas quality The biogas plants in Henriksdal and Eskilstuna digest sludge from sewage treatment plants together with fat from fat separators in restaurant kitchens (Table 2). In Eslöv, sludge from sewage treatment plants and sludge from starch produced in the food industry are co-digested. Linköping, Uppsala and Kristianstad co-digest mainly waste from the slaughter and food industry. Jönköping, Trollhättan and Kalmar digest mainly sludge from sewage treatment plants, but also waste from the food industry, although Jönköping and Kalmar also digest some waste from the slaughter industry.
17
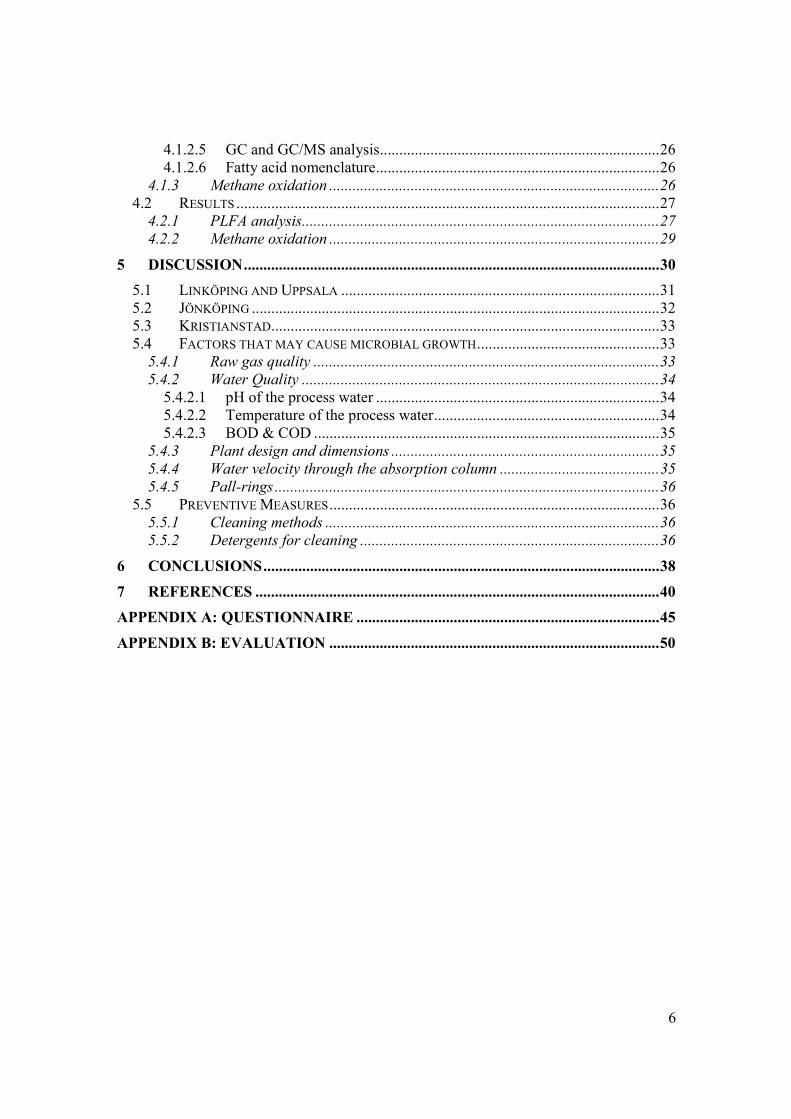
Table 2. Degradation material used for producing biogas at studied plants.Plant Degrades Eskilstuna sludge fr. sewage treatment plant Fat fr restaurants Henriksdal sludge fr. sewage treatment plant fat fr. Restaurants Linköping sludge fr. sewage treatment plant waste fr. slaughteries, liquid manure waste fr.the food industry degrade in 2 separate chambers Trollhättan sludge fr. sewage treatment plant remainders from the fish industry so called Drank, mask Kalmar Sludge and waste fr. the slaughter industry, liquid manure, fat fr. Restaurants Eslöv sludge fr. sewage treatment plant sludge of starch (co-degrades) from Procordia Jönköping sludge fr. sewage treatment plant food remainders fr. industry kitchens, potatoe peels, drank-liquid slaughter waste Kristianstad sludge fr. sewage treatment plant waste fr. food & slaughtery industry degrade in 2 separate chambers Uppsala sludge fr. sewage treatment plant solid waste: waste fr slaughteries liquid waste: blood, polyglukose degrade in 2 separate chambers The methane content of the raw gas in the plants studied ranged between 55-70%. The Eslöv plant, which has the lowest raw gas capacity, had the lowest methane content, 55-62%, followed by the Henriksdal plant at 62-64% and the Eskilstuna plant at 64%. All three of them digest mainly sewage sludge in production of biogas. The Trollhättan plant and the Jönköping plant have a reported methane content of 65%. Higher values of methane content were reported from the plants in Kalmar (69%), Linköping (68%), Kristianstad (66-70%) and Uppsala (65-70%). All of these plants produce biogas by co-digestion. The hydrogen sulphide content in the raw gas ranged between 200 and 800 ppm (see Appendix B) in the incoming raw gas. Kalmar reported the highest H2S values, ranging between 650 and 800 ppm.
3.2.2 Water quality 3.2.2.1 pH of the process water Table 3. pH values of the incoming process water of the studied plants. A.C.=absorption column Plant pH Eskilstuna ~8 Henriksdal 8.5 Linköping 8.4, 3.9 after A.C. Trollhättan 7.8 in, 4.5 after A.C. Kalmar 7.7 Eslöv ~7 Kristianstad ~7 Jönköping 7.5 Uppsala ~7

18
Reported pH values of incoming process water in the upgrading plants were neutral to slightly basic, ranging between pH 7-8.5 (Table 3). The pH of the water decreases downward in the column since more CO2 has been converted to H2CO3 further down. 3.2.2.2 Temperature of process water The regenerating plants in Trollhättan, Kalmar and Henriksdal keep the temperature constant at 15°C during the whole year. The older regenerating plants in Linköping constructed by Flotech have a water temperature of 10-20°C depending on the season. The higher temperature is measured during the summer and the lower during winter. The upgrading plants in Linköping from 2002 have water temperatures between 15 and 20°C. The upgrading plant in Eskilstuna has a temperature range of between 5 and 20°C, depending on the season. Since most sewage treatment plants treat their wastewater outdoors, the seasonal variations in temperature affects the temperature of the process water. Temperatures between 4 and 15°C have been measured in the Eslöv single pass plant, 5 and 15°C in the Jönköping plant and temperatures up to 20°C have been measured in summertime in the Kristianstad plant. Uppsala has reported a relatively constant water temperature of 10-12°C. 3.2.2.3 BOD and COD of the process water Table 4. BOD-values of sewage treatment water used as process water.Plant BOD (mg/l) Eslöv 10 Jönköping <15 Kristianstad <10 Uppsala <4 All single pass plants reported BOD-values and all regenerative plants reported COD-values. The BOD-values reported were all acceptable according to the Swedish law SNFS 1990:14 on sewage water effluent (Table 4). The Jönköping plant had the highest value of detection limit, for detection with 15 mg/l, and may therefore have the highest BOD value. Table 5. COD-values of drinking water used as process water.Plant COD (mg/l) Eskilstuna <3 Henriksdal 2,8 Linköping 1-3 Trollhättan 2,2 Kalmar <4 COD-values of the drinking water used in regenerating plants were all below 4 mg/l (Table 5). All values are acceptable for drinking water according to the Swedish National Food Administration law SLVFS 2001:30.

19
3.2.3 Plant design The dimension of the absorption column varies greatly between the plants (see Appendix B). Plants that are designed for upgrading smaller amounts of raw gas are smaller in diameter than those designed for larger amounts of raw gas. The plants are designed for maximum capacity of raw gas inflow. The desorption column in regenerating plants is smaller in size than the absorption column in all plants except for in Linköping (designed by YIT) and Kalmar (designed by Flotech) where the absorption column and the desorption column are of the same size. Linköping, Henriksdal and Uppsala have the largest raw gas capacity, 650, 600 and 600 Nm3/h respectively. Eslöv followed by Kalmar have the smallest raw gas capacity, with 80 and 85 Nm3/h respectively.
3.2.4 Water velocity in the absorption column Table 6. Water velocity through the absorption column.
Plant water velocity (m/s) Eskilstuna 0.02-0.03 Henriksdal 0.02-0.06 Linköping 0.07 Trollhättan 0.03 Kalmar 0.06 Eslöv 0.01-0.02 Jönköping 0.06-0.33 Kristianstad 0.07 Uppsala 0.06-0.07 The calculated water velocity depends on the variable raw gas input and the area of the absorption column. The calculated velocities are between 0.01 and 0.33 m/s (Table 6), which is a large variation. The low velocity calculated in the Eslöv plant depends on the low inflow of water compared to the relatively large diameter (see Appendix B). The variations in the water velocity in, for example, the Jönköping plant depend on the raw gas inflow of the plants. The highest value, 0.33 m/s, is obtained when the plant has a raw gas inflow of 150 Nm3/h, which is only half the maximum raw gas capacity.
3.2.5 Pall-rings The pall-rings differ in size and model in the upgrading plants (Figure 5). A trend is that the pall-rings used today are smaller in size than those used a couple of years ago. The most usual dimension of pall-rings is 25 mm in height and 25 mm in diameter.

20
Figure 5. Pall-rings collected from the top left: a) Linköping, most of the culture has been removed from the pall-rings. b) Kristianstad, pall-rings as they looked when collected from the absorption column. c) Uppsala pall-rings have a reddish colour caused by the microbial growth on them. d) Pall-ring that has been used in the Kalmar plant, notice that it is worn. e) A Jönköping pall-ring with the remaining of dark brown microbial growth on it.(Photo:a,d & e: D.Tynell, b: R.Johansson and c: Å.Tynell). Note that the pall-rings are not shown in natural size.

21
3.2.6 Cleaning of pall-rings Table 7. Methods for cleaning pall-rings and how often cleaning is done.
Plant Cleaning method how often? Eskilstuna - - Henriksdal in column once, system capacity dropped Linköping outside column twice a year Trollhättan in column Once, in preventing purpose Kalmar in column once every other year Eslöv outside column 3-4 times a year Jönköping in column every other month Kristianstad in column once a month Uppsala in column every three weeks The upgrading plants that have problems with microbial growth on pall-rings clean their pall-rings either in the column, or by taking the pall-rings out of the column (Table 7). The Henriksdal, Kalmar and Trollhättan plants all clean their columns as a preventive measure. The Eskilstuna plant has not had any problems with microbial growth, therefore they have never cleaned their pall-rings. In-column wash is more convenient but not all plants are constructed in such a way that they can use this method. Taking the pall-rings out of the column is difficult because the column usually only has two openings (Figure 6) and the pall-rings have to be taken out manually. Washing the pall-rings requires a shutdown of the process varying in time between six to ten hours depending on the technique used. How often a plant washes their pall-rings varies. Some plants experiencing growth wash only two to four times a year, while others wash every three weeks.
Figure 6. The lower opening of the absorption column of the Kristianstad plant. The column is filled with pall-rings. (Photo: R.. Johansson)

22
3.2.7 Detergents used for cleaning Table 8. Detergents used for cleaning of pall-rings.Plant Detergent Eskilstuna - Henriksdal Hypochlorite Linköping mechanically with water Trollhättan Hypochlorite Kalmar Pineline, industrial, alkaline detergent Eslöv Water Kristianstad Floating green, alkaline detergent Jönköping Alkaclean 28, alkaline cleaning agent Uppsala P3-asepto FL, industrial cleaning agent Each plant has chosen their detergent using information obtained through laboratory experiments, experience and consulting the manufacturer,. Common for many detergents (Table 8) is that they are alkaline and are made for industrial use. Hypochlorite (NaClO) and caustic soda (NaOH) are two common ingredients in the detergents. Potassium hydroxide (KOH) is also an ingredient in several of the detergents in Table 8. The Linköping and Eslöv plants successfully clean the pall-rings mechanically using only hot water.

23
4 Laboratory studies
4.1 Materials and method Cultures were collected from the upgrading plants in Jönköping, Linköping, Kristianstad and Uppsala. Besides these plants, only the Eslöv plant has experienced growth on pall-rings. No culture was collected in Eslöv since the plant had operational problems during the summer of 2004.
4.1.1 Samples Samples of the culture on the pall-rings were collected from the absorption column in all plants except for the Linköping plant, where culture was collected from the pall-rings of the desorption column. Cultures were also present, but to less extent, in the absorption column in the Linköping plant. Due to lack of information, no culture was collected from the absorption column in Linköping. This author collected culture from the Kristianstad and Jönköping plants. These samples were frozen directly after collection. The culture from Jönköping was one month old (counting from the latest wash) and the culture from Kristianstad was 12 days old. There was probably one kilo of culture in the whole absorption column in Jönköping when the samples were collected. In Kristianstad there was almost no culture in the absorption column. Culture from the Linköping plant was collected by plant technicians and was not frozen or stored cold until about six hours after collection. The Linköping culture was six months old and in great quantity (several kilos). Culture from the Uppsala plant was also collected by plant technicians and was stored cold directly. The Uppsala sample was sent by mail with cooling blocks to keep the sample cold. The culture from Uppsala was three weeks old and was present in mediocre quantity (less than Linköping, but more than Jönköping and Kristianstad). All samples were stored in the freezer (-18˚C) until microbiological analysis was conducted (see sections 4.1.2 and 4.1.3).

24
Figure 7. Collected culture, from the left: Linköping, Jönköping and Uppsala. See the Kristianstad culture in figure 4. (Photo D. Tynell)
Visually the cultures collected were of two kinds:
1. A yellow, slimy culture collected in Linköping (Figure 7) that very much resembled the culture from Kristianstad 2001 in Figure 4.
2. Culture that looked like coffee grounds found in Jönköping, Uppsala (Figure 7) and Kristianstad 2004 (Figure 5).
The culture collected in Uppsala was reddish-brown, while the culture from Jönköping was brown and oily with a rank smell and the culture from Kristianstad was nearly black.
4.1.2 Phospholipid fatty acid (PLFA) analysis Phospholipids consist of long chain fatty acyl groups that are linked to a polar phosphate head group. Their function in cell membranes, where they are a major component, is to control passage in and out of the cell (Microbial Insights, 2004-10-06). All intact cells contain polar lipids. In microbes these are primarily phospholipids. Phospholipid fatty acid (PLFA) analysis determines quantitatively the fatty acids in membranes of living cells. Fatty acids vary much in chain length, content of saturated/unsaturated groups, rings and hydroxyl groups. This makes the fatty acid profile of a specific bacterium useful for defining the collected samples. Signature lipid biomarker analysis cannot detect every type of microorganism, but some functional groups, for example methanotrophs, have a special PLFA-pattern (Pinkart et al., 1999). The PLFA method was chosen since the collected samples were hypothesised to contain methanotrophs. This hypothesis was based on:
1. The environmental conditions of the absorption column, which are optimal for methanotrophs (plenty of methane and some oxygen).

25
2. Growth of microorganisms was present in the absorption column. This point contributes to the hypothesis since methanotrophs have the ability to produce exopolymeric substances (EPS), which can appear as both capsules and as plentiful slime (Hilger et al., 2000). The amount of EPS produced can vary a lot in the microbial community and under different environmental conditions.
PLFA analysis shows the whole population in one sample and is therefore also a useful method when only one analysis is performed, as for example in this case due to limited time. Several reports indicate the liability of PLFA analysis as a both quantitative and qualitative method to measure viable biomass and determine the microbial community (Thompson et al., 1993; Macnaughton et al., 1999). 4.1.2.1 Samples for PLFA analysis For PLFA analysis, three replicates were taken from the cultures growing on the pall-rings from the upgrading plants in Jönköping, Linköping and Uppsala. Since only small amounts of growth were collected in Kristianstad only one sample was taken. Aliquots of 1 g subsamples were transferred to pre-cleaned 50 ml glass tubes for further extraction. 4.1.2.2 PLFA extraction The extractions were performed according to a method commencing with a one-phase extraction of lipids from the samples, continuing with lipid extract that is dissolved in chloroform and transferred to a silicic acid column, followed by separation into neutral lipid, glycolipid and polar lipid fractions (Figure 8) using eluents of increasing polarity. The polar lipid fraction containing the phospholipid fatty acids (Pinkart et al., 1999) was then stored at -18°C for the methanolysis step.
Figure 8. Extraction of the polar lipid phase from the samples.(Photo: Å.Tynell)

26
4.1.2.3 Fatty Acid Methyl Ester -FAME Methanolysis was performed with a hexane/CHCl3 (4:1) mixture in order to make the fatty acids volatile, in contrast to the sole fatty acids, so that they could then be analysed with gas chromatography (GC). The extracted fatty acids in the polar lipid fraction were therefore supplemented with a methyl ester. Fatty Acid Methyl Ester (FAME) is the product. A methyl ester contains a CH3-group in place of the proton on the carboxylic acid group (COOH) of the fatty acid (Madigan et al., 2000). The FAME fractions were dried under a stream of N2 at room temperature. The samples were stored in the freezer at a temperature of -18°C until GC analysis was performed. 4.1.2.4 Derivatisation Half the dried FAME-samples were dissolved in hexane and placed in new glass tube to be derivatised. Dimethyl-disulphide (DMDS)-derivatisation is performed to determine the positions of the double bonds of 16:1 and 18:1 PLFA. Only unsaturated PLFAs are derivatised (Börjesson et al., 1998). 4.1.2.5 GC and GC/MS analysis The FAME samples were analysed in a GC-FID (flame ionisation detector) model Hewlett Packard 6890. The temperature was programmed to increase from 50°C to 320°C during 60 minutes, according to Steger et al. (2003). The carrier gas used was helium, and the cylindrical columns used were cross-linked methyl siloxane of dimensions 30m x 250µm x 0.1 µm. To identify the fatty acid methyl esters the retention times were compared to the retention times for standard fatty acid mixtures. Selective ion monitoring (SIM) was used to identify and quantify the monounsaturated, derivatised fatty acids (Steger et al., 2003) with GC-MS mass spectrometry. The instrument used was a Hewlett Packard 6890 GC-system and a Hewlett Packard 5973 Mass Selective Detector. The same temperature programme as for the GC was used. The fatty acids were quantified by comparing peak areas to the peak area of the internal standard 19:0 (from Larodan Fine Chemicals, Malmö, Sweden). 4.1.2.6 Fatty acid nomenclature Fatty acids are named by the total number of carbon atoms followed by the number of double bonds, followed by the position of the double bond indicated from the methyl end, ω (Pinkart et al., 1999). “c” and “t” refer to cis and trans conformation respectively. The prefixes “i” and “a” signify methyl branching in iso and anteiso positions. The prefix “10Me” marks out methyl branching on the tenth carbon atom from the carboxyl end and “cy” refers to cyclopropane fatty acids.
4.1.3 Methane oxidation Methane oxidation activity was measured on the samples from Jönköping, Linköping and Uppsala. Not enough sample was obtained from the Kristianstad plant to be able to perform this study.

27
Three grams of material were placed into 118 ml glass bottles. The bottles were sealed with a rubber septum and 1 ml CH4 was added to each bottle. The methane oxidation was studied over time by measuring the methane content in gas chromatography. Possible methane consumption was studied by calculating the methane content to ppm and plotting the results over time.
4.2 Results
4.2.1 PLFA analysis PLFA 10Me18:0 with 25.8% mean value of total mol volume (Table 9) dominated in the three samples from Jönköping. However the standard deviation (S.D.) of 22.1% questions the reliability of this result. PLFA 18:1 ω9c at 13.5% (S.D. of 5.0%) was the second most common PLFA found. In the Kristianstad sample the PLFAs i17:0 (13.1%), 18:1ω9c (12.0%), and 16:1ω7c (8.2%) were the most common. In the Linköping samples the most dominating PLFAs were 18:1ω7c (22%) followed by 16:0 (15.7%) and 16:1ω7c (8.1%). Indicators of biomarkers for methanotrophs of type I were also present in form of 16:1ω8c (2.1%), 16:1ω6c (2.3%) and 16:1ω5t (2.5%) (Bowman et al., 1991).
Table 9. A selection of detected PLFA shown in percent of mol volume with standard deviation for three of the Jönköping samples and all the Linköping and Uppsala samples. The fourth Jönköping sample was diluted five times and is therefore not comparable with the other Jönköping samples. The Kristianstad sample is only one and therefore it is not possible to calculate the standard deviation. n= number of samples, ND= not detected. The colours refer to the PLFA results mentioned in the text.

28
PLFA Jönköping S.D. Kristianstad Linköping S.D Uppsala S.D. N=3 n=1 n=4 n=4 br16:0 0.75 0.37 0.25 0.23 0.2 0.27 0.31i16:1 0.05 0.08 0.39 0.05 0.04 0.18 0.22i16:0 0.5 0.17 0.68 0.72 0.08 0.17 0.1716:1ω9c 059 0.07 0.11 0.44 0.18 1.75 0.7316:1ω9t 0.12 0.17 ND ND - ND -16:1ω8c 0.09 0.02 0.6 2.05 0.87 4.25 1.6216:1ω7c 7.75 1.3 8.19 8.11 6.5 23.02 10.3916:1ω7t ND - ND 3.35 1.34 2.08 2.5116:1ω6c 0.03 0.02 0.19 2.34 1.21 1.87 0.5716:1ω6t ND - ND 0.13 0.16 0.04 0.0816:1ω5c 0.24 0.33 ND 4.52 1,42 1.28 1.5216:1ω5t 0.19 0.27 ND 2.5 1,03 2.52 2.8116:0 6.94 2.57 ND 15.66 0,77 12.45 3.8717:1ω9 1.7 1.02 7.5 0.05 0,05 0.32 0.27i17:1ω8 0.92 0.34 3.98 1.1 0.63 3.38 4.8317:1ω7 0.12 0.11 0.9 0.33 0.17 0.37 0.3717:1ω6c 0.42 0.19 0.67 0.3 0.08 0.57 0.7517:1ω6t ND - ND ND - ND -10Me16:0 ND - ND 1.6 1.1 0.56 0.41i17:0 0.94 0.23 13.14 1.15 0.19 0.59 0.27Unknown 17 0.25 0.08 ND ND - ND -a17:0 1.17 0.36 1.47 1.77 0.18 1.15 0.7cy17:0 0.58 0.17 0.93 2.62 0.51 1.75 0.1817:0 0.36 0.11 5.28 0.7 0.09 0.45 0.34br18:0 0.28 0.07 ND 0.07 0.04 0.14 0.24Unknown 18 0.16 0.05 ND ND - 0.39 0.3418:4 0.22 0.11 0.58 0.2 0.03 0.25 0.0710Me17:0 0.42 0.18 0.71 0.1 0.1 0.45 0.0818:2 3.31 1.22 ND 1.07 0.1 3.71 0.2918:3 1.19 0.38 2.02 ND - ND -18:1ω11c 0.01 0.01 0.04 0.05 0.01 0.02 0.0218:1ω11t ND - 0.03 ND - ND -18:1ω10c 0.04 0.01 0.34 0.05 0.01 0.05 0.0318:1ω10t 0.01 0.02 ND ND - 0.01 0.0118:1ω9c 13.5 5.04 11.99 4.02 0.44 10.5 4.3218:1ω9t ND - 5.97 ND - 0.29 0.3518:1ω8c 0.05 0.02 0.06 0.09 0.01 0.13 0.1318:1ω8t 0.02 0.03 0.14 0,02 0.03 ND -18:1ω7c 1.95 0.72 2.93 21.95 1,55 5.48 2.6518:1ω7t ND - 0.9 0.55 0.46 0.06 0.1118:1ω6c 0.01 0.01 0.02 0.02 0.01 0.02 0.0118:1ω5c 0.02 0.01 ND 0.07 0.01 0.01 0.0118:1ω5t ND - ND ND - ND 0.0118:0 3.86 1.25 0.49 2.93 0.11 2.01 0.7919:1a 4.59 1.23 3.1 2.1 0.19 0.68 0.11 10Me18:0 25.84 22.09 8.81 0.77 0.07 0.5 0.52

29
In the Uppsala samples the fatty acids 16:1ω7c (23%), 16:0 (12.5%) and 18:1ω9c (10.5%) were dominant. Indicators of methanotrophs of type I were also present in form of 16:1ω8c (4.2%), 16:1ω6c (1.9%) and 16:1ω5t (2.81%). Note that methanotrophs of type II, indicated by PLFA biomarker 18:1ω8 (Bowman et al., 1991) were indicated in all samples, but in no substantial amount.
4.2.2 Methane oxidation No methane consumption was noted in the samples studied. A slight decrease in the methane rate in a sample from Jönköping could be observed the first three hours of the study (Figure 9), but during the continuous sampling a slight increase occurred and the methane rate at the end of study (Figure 10) was about same as the initial rate. In one of the Uppsala samples, which was representative for the Linköping and Uppsala samples, the methane concentration in the test bottles was constant during the first five hours of measurement (Figure 11) and somewhat unsteady but not decreasing during the whole test period (Figure 12).
J3
0
5000
10000
15000
20000
0 100 200 300 400
time(min)
ppm Serie1
Linjär (Serie1)
J3 3 days
0
5000
10000
15000
20000
0 1000 2000 3000 4000 5000
time (min)
ppm Serie1
Figure 9 and 10. Time series of the methane oxidation measured on GC in one of the Jönköping samples. Figure 9 is the methane oxidation during the first four hours and figure 10 is during the whole test period of 3 days.
U2
0
5000
10000
15000
20000
0 100 200 300 400
time (min)
ppm Serie1
Linjär (Serie1)
U2 3 days
0
5000
10000
15000
20000
0 1000 2000 3000 4000 5000
time (min)
ppm Serie1
Figure 11 and 12. Time series of one of the Uppsala samples.

30
5 Discussion In section 4.1.2 it was hypothesised that the samples studied contained methanotrophs. This was confirmed by the results of the Linköping and Uppsala samples, where various type I methanotroph bacteria were indicated by the specific PLFAs 16:1ω8c, 16:1ω6c and 16:1ω5t (Bowman et al., 1991). Biomarkers for type II methanotroph bacteria, indicated by PLFAs 18:1ω8c and t, were present in all samples (Table 10), but not in substantial amounts.
Table 10. A selection of biomarkers found in the PLFA analysis. Results are in percent of total mol volume ± standard deviation. ND=not detected (below detection limit).
Indicated biomarker PLFA Jönköping Kristianstad Linköping Uppsala Methanotroph type I 16:1ω8c 0.09 ±0.02 0.6 2.05 ±0.87 4.25 ±1.6 Gram-negative bacteria 16:1ω7c 7.75 ±1.30 8.19 8.11 ±6.5 23.02 ±10.3 16:1ω7t ND ND 3.35 ±1.34 2.08 ±2.5 Methanotroph type I 16:1ω6c 0.03 ±0.02 0.19 2.34 ±1.21 1.87 ±0.5 16:1ω6t ND ND 0.13 ±0.16 0.04 ±0.04 16:1ω5c 0.24 ND 4.52 ±1.42 1.28 ±1.5 Methanotroph type I 16:1ω5t 0.19 ±0.27 ND 2.50 ±1.03 2.52 ±2.8 unspecific PLFA 16:0 6.94 ±2.57 ND 15.66 ±0.77 12.45 ±38 Gram-positive bacteria i17:0 0.94 ±0.23 13.14 1.15 ±0.19 0.59 ±0.2 Gram-positive bacteria 18:1ω9c 13.50 ±5.04 11.99 4.02 ±0.44 10.5 ±4.3 Methanotroph type II 18:1ω8c 0.05 ±0.02 0.06 0.09 ±0.01 0.13 ±0.1 18:1ω8t 0.02 ±0.03 0.14 0.02 ±0.03 ND Gram-negative bacteria 18:1ω7c 1.95 ±0.72 2.93 21.95 ±1.55 5.48 ±2.6 18:1ω7t ND 0.9 0.55 ±0.46 0.06 ±0.1 Actinomycetes 10Me18:0 25.84 ±22.09 8.81 0.77 ±0.07 0.50 ±0.5 Fungi 18:2 3.31 ±1.22 ND 1.07 ±0.1 3.71 ±0.2 The PLFAs 18:1ω7c and 16:1ω7c are typical for Gram-negative bacteria (Frostegård et al., 1993b; Bååth et al., 2003). These PLFA were indicated in the Linköping samples with 21.95% and 8.11% respectively, and with 5.48% and 23.02 % of total PLFAs in the Uppsala samples, and can be major constituents of methanotroph PLFAs since the majority of methanotroph PLFAs consist of more or less specific PLFA. PLFA 16:0 was indicated in the samples from Linköping (15.66%), Uppsala (12.45%) and Jönköping (6.94%). PLFA 16:0 is an unspecific PLFA and cannot be associated with any particular groups of microorganisms (Arao, 1999; Feng et al. 2003). 18:1ω9c indicates that Gram-positive bacteria (Frostegård et al., 1993b) were present in all samples, with 13.5% in Jönköping, 12.0% in Kristianstad, 10.5% in Uppsala and 4.02% in Linköping. Fungi are indicated by the specific PLFA 18:2 (Guckert et al., 1985) and were represented in the samples from Jönköping (3.31%), Linköping (1.07%) and Uppsala (3.71%).

31
For example the PLFA 18:1ω9c, common in all samples and a more or less specific PLFA, can be a major component of fungal PLFA.
5.1 Linköping and Uppsala The Linköping and Uppsala PLFA-results were similar, both indicated biomarkers for type I methanotrophs in the samples analysed, and the presence of Gram-negative bacteria, Gram-positive bacteria and fungi was also indicated. The Linköping and Uppsala plants digest similar materials, such as waste products from the slaughter and the food industry. Some differences between the two plants are that the Linköping plants are of the regenerating type and use drinking water as process water, while the Uppsala plant is of the single pass type and uses water from sewage treatment plants. Since the growth from the Linköping plant was collected from the desorption column and not the absorption column, it would have been interesting to analyse the growth in the absorption column as well. Indications that methanotroph type I were present are strengthened by: As mentioned in section 4.1.2, methanotrophs have the ability to produce exopolymeric substances (EPS) (Hilger et al., 2000). The metabolic RuMP pathway utilised by type I methanotrophs is energetically more favourable when producing EPS than the serine pathway, used by type II methanotrophs. Hence, type I methanotrophs are probably responsible for EPS formation. Slime produced from a methanotroph enrichment culture has been characterised by Huq et al. (1978) and polysaccharides were found to be the significant component of the material, which agrees with studies performed by Hilger et al. (2000). Therefore, it would be interesting to perform polysaccharide staining of the samples to see whether the material contains significant amounts of polysaccharide. High EPS production under high oxygen concentrations (10.5%) has been observed in a study by Wilshusen et al. (2004a, 2004b) and could explain why large amounts of EPS are assumed to be produced in the oxygen-rich environment of the desorption column of the Linköping plant. The exact oxygen concentration that is required for formation of EPS is, however, unknown and no information is available on how to prevent formation of EPS (Wilshusen et al., 2004b). Since methanotrophs of type I cannot fix gaseous nitrogen and compete for recycled nitrogen, production of EPS may be their way to prevent accumulation of excess carbon (Linton et al., 1986; Wilshusen et al., 2004a). The EPS production may also serve as protection for the methanotrophs against predators or desiccation (Hilger et al., 2000). The same methanotroph population is able to produce two forms of polymer with physical distinctions (Fassel et al., 1992; Hilger et al., 2000), and this could explain the physical differences between the Linköping and Uppsala samples.

32
Fungi, like actinomycetes, are contaminants in wastewater (Dizer & Hagendorf, 1991) but can also survive as spores in the raw gas, and probably enter the absorption column either via the cleaned wastewater or via the raw gas. Fungi can survive many types of environments as spores, and different types of fungi can grow at environmental extremes such as low pH or high temperatures (up to 62°C) (Madigan et al., 2000). Methane Oxidation No methane consumption was noted in the samples studied, despite the fact that PLFA analyses indicated growth of methanotrophs in the Linköping and Uppsala samples. The samples were frozen for two weeks before the study initiated, which may have caused damage to the cells and their methane oxidising ability. In addition, the sample from the Linköping plant was not stored cold during six hours prior to freezing, which decreases the methane oxidation activity by about 20% per hour (Börjesson, pers. comm. 2004). According to Skogland et al. (1988), samples of soil kept frozen prior to laboratory studies may damage cells severely. The effects of freezing the microbial growth from pall-rings has to my knowledge never previously been studied, but one can assume that the cells were damaged since no oxidation activity at all was noted.
5.2 Jönköping In the Jönköping samples, the PLFA 10Me18:0 (25.84% of total mol. volume), which is a biomarker for the filamentous bacteria actinomycetes (Tunlid & White, 1992), dominated. Even though the S.D. was high (22.9%), this result is considered reliable since the PLFA 10Me18:0 was present in substantial amounts in all the Jönköping samples. Fungi were indicated by PLFA biomarker 18:2 in the Jönköping samples with 3.31%, see section 5.1. Actinomycetes are present in sewage treatment plants and cause the scumming of the sludge in the aeration tanks (Lemmer, 1986; Lechevalier & Lechevalier, 1974; Lechevalier, 1975 ). The actinomycetes lower the effluent water quality of the sewage treatment plant, survive in the cleaned wastewater (Dizer & Hagendorf, 1991) and probably enter the absorption column with incoming process water. Actinomycetes are able to create a fungus-like mycelium (slime) (Reponen et al., 1998) and are also common as air contaminants in soil and agricultural/waste composts (Reponen et al., 1998) or in any decaying vegetation, where they break down organic substances and release carbon, nitrogen and ammonia. Some actinomycetes have a characteristic earthy odour and can also give taste and smell to water (Reponen et al., 1998; Oppong et al., 2000). This could explain the rank smell emitted by the Jönköping samples. Like other filamentous organisms (Safade, 1988), extensive growth of actinomycetes could give rise to particulate matter, which is in accordance with the appearance of the

33
samples from Jönköping. Actinomycetes contribute to the stability of slime. Like fungi, they are adapted to life on solid surfaces and can produce dry spores. Methane Oxidation No methane oxidation activity was observed in the Jönköping samples, which is in accordance with the PLFA results. The cells might have been damaged when the samples were kept frozen prior to analyses (see methane oxidation in section 5.1)
5.3 Kristianstad In the Kristianstad sample the biomarkers for PLFAs i17:0, 18:1ω9c, and 16:1ω9c were the most common. The fatty acids i17:0 (13.14%) and 18:1ω9c (11.99%) are biomarkers of Gram positive bacteria, and the 16:1ω9c (8.19%) is a more or less specific PLFA. Since only enough growth for one sample could be collected from the Kristianstad plant, these results are very uncertain. A picture (Figure 4) of pall-rings from the Kristianstad plant from the autumn of 2001 indicates that the culture then had a different physical appearance compared to that collected (Figure 5). This could depend on several factors such as:
1. The culture in Figure 4 is older than the culture collected (aged two years compared to barely two weeks) and has had more time to establish and more organisms have colonised.
2. The process water used in 2001 was from the sewage treatment plant, while the water used when sample was collected in September 2004 was drinking water. Water from sewage treatment plants probably contains more bacteria.
Methane Oxidation No methane consumption was observed in the Kristianstad sample, which is in accordance with the PLFA results. However, the cells might have been damaged since they were frozen prior to analysis (see methane oxidation in section 5.1)
5.4 Factors that may cause microbial growth
5.4.1 Raw gas quality Organic material that is classed as high-risk material (in terms of the bacterial content), such as waste from the food and slaughter industries, is sanitised before digestion. However, even though the material is sanitised, some bacteria, for example methanotrophs, can survive the high temperatures in capsules that the bacteria develop for protection. Because of the survival abilities of some bacteria, they may not completely be eliminated in the sanitation process. Particles may enter the absorption column with the raw gas despite the fact that the gas is filtered before entering the upgrading system. This could explain why the upgrading plant in Uppsala, which digests waste from the slaughter industry, has microbial growth in the heat exchanger, which is positioned before the absorption column. The raw gas probably contains organic material that causes microbial growth. Good filters or more efficient designs than those used today might prevent (some) particles from entering the upgrading system.
34
Plants such as Henriksdal and Eskilstuna digest sludge from sewage treatment plants and fat from fat separators in restaurants, which are both well-defined materials. Neither of these plants have had any problems with growth. This could be explained by the fact that a more homogeneous material is digested than in plants that co-digest for example slaughter waste and waste from other food industries, like Kristianstad, Linköping and Uppsala. Contradictory to this theory is that the Trollhättan plant co-digests sewage sludge and waste from the fish industry, yet has never experienced any problems with microbial growth. The methane content of the raw gas was, as predicted, slightly lower in plants that digest mainly sewage sludge (Eslöv, Henriksdal, Eskilstuna, Trollhättan and Jönköping) and higher in those that co-digest (Kalmar, Linköping, Kristianstad and Uppsala) (see section 3.2.1). No correlation between a lower or higher methane content and microbial growth was observed. Only the Kalmar plant reported high levels of hydrogen sulphide (650-800 ppm), but since they have not experienced problems with growth of microorganisms, this probably does not affect the establishing of culture.
5.4.2 Water Quality Since all the plants studied that use single pass water wash (water from sewage treatment plants) have experienced problems with growth of microorganisms on the pall-rings compared to only one regenerating water wash plant (which uses drinking water), it can be presumed that the water quality may result in microbial growth. The single pass plant in Kristianstad has tested drinking water as process water for some periods, with good results as the microbial growth in the column declined. This is another indicator that the water quality probably contributes to the growth. Since water from sewage treatment plants easily produces foam, it is important to add a foam-reducing agent to the water before it enters the process. 5.4.2.1 pH of the process water The plants studied have process water with neutral to slightly basic pH (Table 3). The pH of the process water in many upgrading plants varies with the season. Many plants have experienced that the pH of the process water is lower during high temperatures. pH is therefore probably correlated with process water temperature. In a laboratory study by Gordienko et al. (1997), increasing pH in soil samples was found to thicken the EPS capsule produced by a methanotroph type I strain. The Jönköping and Linköping upgrading plants both reported that microbial growth mainly occurs in the top of the absorption column. This could be an indication that microbial growth is favourable at high pH conditions (see section 3.2.2). This is in good accordance with the relatively high pH value of 8.4 reported by Linköping, but not as good with the pH value of 7.5 reported by the Jönköping plant. 5.4.2.2 Temperature of the process water In the plants that experience large variations in process water temperature (see section 3.2.3.), all these reported that problems increase during the summer when water temperatures are high. This could correlate with the fact that at high temperatures the
35
CO2 does not dissolve well to H2CO3 and the pH of the process water is kept high. At low temperatures, the CO2 dissolves more easily to H2CO3 and the pH of the process water decreases. A lower pH can inhibit growth on pall-rings since most organisms prefer a neutral environment to enrich. Hence, a constant temperature, or at least a lower maximum temperature of the process water, could to a certain extent prevent growth. In general most microorganisms have a growth optimum at higher temperatures and therefore benefit from high temperatures. 5.4.2.3 BOD & COD The single pass plants in the study experience microbial growth on pall-rings. Jönköping, Kristianstad and Eslöv, all of which experience microbial growth, reported relatively high, but permissible values of BOD (Table 4). A high BOD-value indicates that the water contains a lot of organic material that could establish and enrich microbial colonies under favourable conditions. Although Uppsala has a lower reported BOD-value than the other single-pass plants, they experience microbial growth and clean their column most often of the plants studied. The plants using drinking water reported their COD-values (Table 5) and all have values under 4 mg/l, which are permissible. The COD-values cannot be used to determine microbial growth probability since the Linköping upgrading plant is the only with problems and has the same COD-value as the other plants.
5.4.3 Plant design and dimensions The plants studied vary much in plant design and dimensions (see section 3.2.5). A wide column diameter could make the spreading of the water in the column more difficult. If the water is not evenly distributed, most of it may take the same path through the column and the contact area between the gas and water will not be great enough to dissolve the carbon dioxide from the raw gas. In Trollhättan, for example, several spreading plates are used to distribute the water evenly in the column and thereby avoid this problem. Plants with narrow columns can more easily distribute the water evenly in the column, but they also have the disadvantage of a smaller area of contact between the gas and water.
5.4.4 Water velocity through the absorption column Water velocity through the absorption column seems to vary greatly between the different plants (Table 5) but does not correlate with problems with microbial growth. For example, both Eslöv and Jönköping, with a relatively low and high water velocity respectively (0.02 m/s and minimum 0.33 m/s at half of inflow rate of raw gas) have problems with growth on pall-rings. One could assume that a lower water velocity through the column could give the organisms in the process water a greater opportunity to establish in the column. A high water velocity through the column could result in organisms being prevented from establishing on the pall-rings and flushing away already established organisms. However, some bacteria, for example methanotrophs, attach strongly to surfaces and would not be flushed away by a high water speed. Since plants with both high and low water velocity

36
through the absorption column show growth, this parameter probably does not contribute to or inhibit growth on pall-rings.
5.4.5 Pall-rings Since the pall-rings come in many different sizes and models (Figure 5), it is difficult to come to any conclusion regarding the effect they have on upgrading. A trend for all plants is that the sizes of pall-rings used are smaller than the initial type of pall-ring used in the plant. The size of pall-rings used must correlate with the size of the absorption column. If a larger size of pall-rings is used, the upgrading effect would decrease. To compensate for the loss of effect larger columns would be required (Lloyd, 2004). All plants have randomly packed their columns, and most of them are packed to around 80% of the total column volume. It would be interesting, but very time-consuming, to pack the pall-rings in the column in organised cells, so called honey cells, to see whether the upgrading efficiency would increase. It is important that the size of the pall-rings is chosen to correlate with the dimensions of the column to prevent too large/small an area of contact between water and gas. If too small an area is available, the gas will not be purified to 97% methane, while if the area is too large, microbial growth may establish since the water has trouble passing through the column.
5.5 Preventive Measures
5.5.1 Cleaning methods Of the two cleaning methods studied (see section 3.2.8), in-column cleaning is the most convenient. Shorter operational disturbances and easier ways to clean the column for the maintenance crews are some of the advantages of this method. For cleaning outside of the column, there is no good technique for taking out the pall-rings, which is time-consuming. It is most important to ensure that all growth is removed after cleaning, otherwise bacteria may establish quickly again.
5.5.2 Detergents for cleaning If preventive measures are considered to reduce the microbial growth, these measures should be tested and proven not to:
• Harm the plant equipment • Contaminate the gas • Contaminate the outlet process water
The detergents used today for cleaning differ between the upgrading plants and they cannot be compared in effectiveness since the tolerance of microbial growth is unknown in the plants. For example, plant A may only find it necessary to clean their plant twice a year, while plant B only accepts a smaller decrease in effectiveness of upgrading gas and therefore cleans their plant more often. Some plants compensate for the disturbance by lowering the inflow of raw gas. These plants choose to lower the capacity instead of shutting down the upgrading plant to clean. The most efficient detergents used are hypochlorite and concentrated caustic soda. The effects of using these detergents for in-

37
column cleaning during operation have not been studied, but a minor operational disturbance was observed in the Henriksdal plant when using hypochlorite. Hypochlorite has also been used for other foam-producing filamentous bacteria in sewage treatment plants and in the anaerobic tank used for production of biogas (Blackall et al., 1996; Käppala, 2001). Svensk Biogas, owner of the Linköping upgrading plants, has tested several detergents in a laboratory experiment and has found that concentrated caustic soda is the best detergent tested, in terms of time and efficiency, to eliminate the growth on the pall-rings (Andersson, 2004). The best results were obtained with high alkaline detergents with a pH 10 or higher. It would be interesting to perform a more extensive laboratory study where several other detergents than those in the Linköping study were tested and compared to detergents used today. Methanotrophs are sensitive to chlorine-compounds such as sodium chloride (NaCl) and ammonium chloride (NH4Cl) (Adamsen & King, 1993). Ammonia and acetylene (C2H2) also inhibit growth of methanotrophs (King, 1990; McDonald et al., 1996). One percent acetylene in the gas volume in the absorption column is the concentration needed to inhibit methanotroph population (Adamsen & King, 1993). In a study by Saari et al. (2004), both ammonia salt [(NH4)2SO4] and non-ammonium salt [K2SO4] inhibited methanotrophs of boreal forest soil. Salts in general cause cell death by osmotic stress, but high concentrations of salt may have a corrosive effect on the plant equipment. Acetylene is presumably the most suitable chemical of the above-mentioned, since it would not harm the process equipment, contaminate the biogas or contaminate the process water. Acetylene is easily soluble in water (2.21 g/l), a characteristic which must be considered if used as a detergent. The foam caused by actinomycetes, indicated in the Jönköping sample, may be inhibited by foam-reducing detergents used at sewage treatment plants (CDM, 2005-01-17).

38
6 Conclusions The following results were based on a phospholipid fatty acid (PLFA) analysis, which is a reliable method for determining biomarkers of PLFAs. Biomarkers for PLFA are one type of microbial biomass and community structure indicator (Tunlid & White, 1992).
o In the samples from Linköping and Uppsala, methanotrophs of type I were indicated. This is strengthened by the fact that type I methanotrophs are able produce EPS, which can appear both as slime and particulate matter as a reaction to excess carbon in environments containing oxygen (Hilger et al., 2000). Acetylene is a well-known inhibitor of methane-oxidising enzymes.
o Actinomycetes, probably from the water of the sewage treatment plant, were
indicated in the Jönköping samples. Actinomycetes produce foam, so to avoid foaming in the absorption column, a foam-reducing agent could be added to the process water.
o Fungi were present in the Jönköping, Linköping and Uppsala samples and
probably colonise after other bacteria.
o Visually judging the samples indicated that the culture in Figure 4 from Kristianstad 2001 resembled the culture collected in Linköping (Figure 7). Both were older than the other samples in the study, therefore the author of this report believes that after a longer time range, for example six months, many different types of bacteria and fungi have had the opportunity to colonise. However, the results from the Kristianstad sample are uncertain since only one sample was analysed.
Factors affecting development of microbial growth:
o Water quality affects the upgrading process. In most cases cleaner water gives less microbial growth. All plants using water from sewage treatment plants experience substantial growth.
o pH and temperature are important factors. A low constant temperature and a low pH are beneficial for minimizing microbial growth, by improved solubility and making the environment unfriendly for bacteria. A low and constant temperature could be achieved by adding a cooling system to the water inlet. By adding a pH-lowering substance to the process water microbial growth can to some extent be prevented or slowed down.
o Organic material in form of particles may enter with the raw gas. Bacteria may enrich by consuming this organic material. Good filters are needed.

39
More research is needed to determine the content of the microbial growth. Some interesting studies would be to: • Test the effectiveness of the recommended cleaning detergents on the microbial
growth. • Test to improve the filter that the gas passes before entering the upgrading process • Perform polysaccharide staining according to Hilger et al. (2000) on the growth to
see whether the material contains polysaccharides that are the main component of EPS produced by e.g.methanotrophs (shown in earlier studies). Hilger et al. (2000) suggest that methanotrophs can also produce polyhydroxybutyrate under limited oxygen conditions. A low glucose/high viscosity material may therefore indicate the presence of material other than EPS.

40
7 References Adamsen, A.P.S and King, G.M (1993) Methane consumption in temperate and subarctic forest soils. Applied Environmental Microbiology, 59:2(1993)485-490 Andersson, Fräs-A., (2003) Evaluation of detergents used for dissolving microbial growth on pall-rings. Tekniska Verken in Linköping Arao, T. (1999) In situ detection of changes in soil bacterial and fungal activities by measuring 13C incorporation into soil phospholipid fatty acids from 13C acetate. Soil Biology & Biochemistry, 31:7(1999)1015-1020 Blackall, L., Seviour, E., Bradford, D. et al. (1996) To understanding some of the filamentous bacteria causing bulking and foaming in activated sludge plants. Water Science & Technology, 34:5-6(1996)137-144 Bowman, J.P., Skerratt, J.H., Nichols, P.D., Sly, L.I. (1991) Phospholipid fatty acid and lipopolysaccharide fatty acid signature lipids in methane-utilizing bacteria. FEMS Microbiology Letters, 85:1(1991)15-21 Bååth, E and Andersson, T.H. (2003) Comparison of soil fungal/bacterial ratios in a pH gradient using physiological och PLFA-based techniques. Soil Biology and Biochemistry, 35:955-963. Börjesson,G., Sundh, I., Tunlid A. and Svensson, B. (1998) Methane oxidation in landfill cover soils, as revealed by potential oxidation measurements and phospholipid fatty acid analyses. Soil Biology Biochemistry, 30:10-11(1998)1423-1433 Dizer, H. and Hagendorf, U. (1991) Microbial contamination as an indicator of sewer leakage. Water Research, 25:7(1991)791-796 Fassel, T.A., Vanover, J.E., Hauser, C.C. et al. (1992) Evaluation of bacterial glycocalyx preservation and staining by ruthenium red, ruthenium redlysine and alcian blue for several methanotroph and staphylococcal species. Cells and Materials, 2(1992) 37-48. Feng, Y., Motta, A.C, Reeves, D.W, Burmester, C.H, van Santen, E and Osborne J.A (2003) Soil microbial communities under conventional-till and no-till continuous cotton systems. Soil Biology & Biochemistry, 35:12(2003)1693-1703 Flotech (2004) Trollhättan CSFR Biogas Uppgrading System Technical Report

41
Frostegård A, Tunlid A, Bååth E. (1993b) Shifts in the structure of soil microbial communities in limed forests as revealed by phospholipid fatty acid analysis. Soil Biol Biochem, 25:723 Gordienko, A.S., Kurdish, I.K., Kisten, A.G., (1997) Surface proper- ties and adhesion of methanetrophic bacteria. Journal of Water Chemistry and Technology, 19(1997) 40-43 Guckert , J. B., Antworth, C. P., Nichols, P. D. and White, D. C. (1985) Phospholipid ester-linked fatty acid profile as reproducible assays for changes in prokaryotic community structure of estuarine marine sediments. FEMS Microbiol. Ecology, 31(1985)147-158 Hilger H.A, Cranford, D.F. and Barlaz, M.A. (2000) Methane oxidation and microbial exopolymer production in landfill cover soil. Soil Biology & Biochemistry 32(2000) 457-467 Huq, M.N., Ralph, B.J. and Rickard, P.A.D. (1978) The extracellular polysaccharide of a methylotrophic culture. Australian Journal of Biological Science, 31(1978)311–316 IEA Bioenergy (2003) Biogas upgrading and utilisation Task 24: Energy from biological conversion of organic waste King, G.M (1990) Dynamics and controls of methane oxidation in a Danish wetland sediment. FEMS Microbiology Letters, 74:4(1990)309-323 Lagerkvist A, (2003) Landfill Technology Division of Waste Science & Technology, Luleå University of Technology Lechevalier, M.P and Lechevalier, H.A. (1974) Norcardia amare sp. nov., an actinomycete common in foaming activated sludge. International Journal of Systematic Bacteriology, 24 (1974)278–288. Lechevalier, H.A., (1975) Actinomycetes of sewage treatment plants. Environmental Protection Technology Series, EPA-600/2-75-031, US Environmental Protection Agency. Lemmer, H., (1986). The ecology of scum causing actinomycetes in sewage treatment plants. Water Research, 20:4(1986)531-535 Linton, J. D., Watts, P. D., Austin, R. M. et al.(1986). The energetics and kinetics of extracellular polysaccharide production from methanol by micro-organisms possessing different pathways of C1 assimilation. J Gen Microbiol, 132(1986)779–788. Madigan, M.T., Martinko, J.M., Parker, J. (2000) Brock Biology of Microorganisms Prentice Hall, 9th edition

42
McDonald I.R., Hall G.H., Pickup, R.W. and Murrell, J.C. (1996) Methane oxidation potential and preliminary analysis of methanotrophs in blanket bog peat using molecular ecology techniques. FEMS Microbiology Ecology, 21:3(1996)197-211 Macnaughton, S.J., Cormier, M.R., Jenkins, T.L., Davis and White, D.C. (1999) Quantitative sampling of indoor air biomass by signature lipid biomarker analysis. Journal of Industrial Microbiology & Biotechnology, 22(1999)80-87 de Mes, T.Z.D, Stams, A.J.M, Reith, J.H and Zeeman, G. (2003) Methane production by anaerobic digestion of wastewater and solid wastes. Dutch Biological Hydrogen Foundation ISBN: 90-9017165-7 Oppong, D., King, V.M., Zhou, X. and Bowen, J. (2000) Cultural and biochemical diversity of pink-pigmented bacteria isolated from paper mill slimes. Journal of Industrial Microbiology and Biotechnology, 25(200)74–80 Pinkart, H.C., Ringelberg D.B., et. al. (1999) Biochemical Approaches to Biomass Measurements and Community Structure Analysis. Manual of environmental microbiology 2nd edition Reponen, T., Gazenko, S.V, Grinshpun, S.a. et al. (1998) Characteristics of Airborne Actinomycete Spores. Applied and Environmental Microbiology, 64:10(1998)3807-3812 Saari, A., Rinnan, R. and Martikainen, P. (2004) Methane oxidation in boreal forest soils: kinetics and sensitivity to pH and ammonium. Soil Biology and Biochemistry, 36:7(1037-1046) Safade, T.L (1988) Tackling the slime problem in a paper-mill. Paper Technology and Industry (1998) pp. 280–285 SGC, Swedish Gas Center (2001) Adding gas from biomass to the gas grid Report SGC 118 SGC, Swedish Gas Center (2003) Evaluation of upgrading techniques for biogas Report SGC 142 Skogland, T., Lomeland, S., Goksöyr, J. (1988) Respiratory burst after freezing and thawing of soil. Experiments with soil bacteria. Soil Biology & Biochemistry, 20(1988) 851-856 Steger, K., Jarvis, Å., Smårs, S., and Sundh, I. (2003) Comparison of signature lipid methods to determine microbial community structure in compost. Journal of microbial methods, 55:2(2003)371-382

43
Swedish Biogas Association (1998) Biogas…or what you can make out of rotten apples An information folder about biogas from the Swedish Biogas Association. Thompson, I.P., Bailey, M.J., Ellis, R.J. and Purdy, K.J. (1993) Subgrouping of bacterial populations by cellular fatty acid composition. FEMS Microbiology Ecology, 102(1993)75-84 Tunlid, A. and White, D.C. (1992) Biochemical analysis of biomass, community structure, nutritional status, and metabolic activity of the microbial communities in soil. Soil biochemistry, 7(1992)229–262 Wilshusen, J.H, Hettiaratchi J.P.A, De Visscher, A. and Saint-Fort, R. (2004a) Methane oxidation and formation of EPS in compost: effect of oxygen concentration. Environmental Pollution, 129:2(2004)305-314 Wilshusen, J.H, Hettiaratchi J.P.A and Stein V.B (2004b) Long-term behavior of passively aerated compost methanotrophic biofilter columns. Waste Management, 24:7(2004b)643-653 Internet sources Airliquide, Solubility of compounds in water (2005-01-17) http://www.airliquide.com/en/business/products/gases/gasdata/index CDM (2005-01-17) ENA-389 http://www.cdm.se Käppala Industries (2005-10-17) http://www.kappala.se/miljorapporter2001.pdf Microbial Insights Inc (2004-10-06) PLFA Analysis http://www.microbe.com/plfa.html SGAB Analytica (2004-12-12) BOD & COD http://www.sgab.se/hem2001/sv/help/ordlista.asp White, C., Burt, D. (2004-09-26) Anaerobic digestion http://www.biotank.co.uk/anaerobic_digestion.htm, 2003 Figures
1: White, C., Burt, D. (2004-09-26) Anaerobic digestion http://www.biotank.co.uk/anaerobic_digestion.htm, 2003 2,3: SGC (2001) 4, 5b & 6: Johansson, R (2001&2004) Kristianstad Kommun 5a, d, e & 7: Tynell, D. (2005) student 5c & 8: Tynell, Å. (2004) author

44
Biogasplants Eskilstuna Alsbro, Roland Eskilstuna kommun Dialogue October 7 Eslöv Embrand, Kaj Eslövs kommun Dialogue October 6 Henriksdal Lind, Mikael Stockholm Vatten Visit September 23
Wiklund, Olle Jönköping Eskilsson, Fridolf Jönköpings kommun Visit September 28
Strandsäter, Wilford Kalmar Pettersson, Linda Kalmar Vatten och E-mail October 7 Renhållnings AB Kristianstad Johansson, Rikard C4-teknik – Visit October 12
Persson, Magnus Kristianstad kommun
Linköping Ahlbert, Jonas Tekniska Verken i Visit October 15 Johansson, Peter Linköping Wallin, Lina Trollhättan Skoog, Krister Trollhättan kommun Visit September 13 Uppsala Ekvall, Cecilia Uppsala kommun Visit September 24 Manufacturers Malmberg Water Simonsson, Rune Conversation October 11 AB Sandell, Anders YIT Ericsson, Håkan Conversation November 5 Design Lloyd Engineering Lloyd, Ola Conversation October 21 AB
Guidance
Börjesson, G. Linköping University, Department of water and environmental studies
Persson, M. Swedish Gas Centre

45
Appendix A: Questionnaire 1 Allmänna Uppgifter
a. Uppgiftslämnare_______________________________________________ b. Funktion/titel__________________________________________________
c. Adress_______________________________________________________ d. Telefon_______________________________________________________ e. E-post________________________________________________________ f. Biogasanläggning_______________________________________________
g. Driftsansvarig__________________________________________________
2 Biogasanläggningen
a. Vad rötas? slam från reningsverk samrötning
b. Vid samrötning, vad samrötas?
____________________________________________________________
____________________________________________________________ c. Uppgraderingensanläggningens dimensionerade rågaskapacitet:
________ Nm3/h d. Vilken metanhalt har gasen innan uppgradering? _________________ % metan
3 Vattenskrubber
a. Är anläggningen av recirkulerande eller genomströmmande typ?
___________________________________________________

46
b. Vilken dimension har skrubbern (höjd och diameter)?
_____________________________________________________
c. Vilket tryck är det i skrubbern? ______________________
d. Vilket vattenflöde är det genom skrubbern? ___________________________
e. Vilken typ av vatten används? avloppsvatten dricksvatten
o grundvatten o sjövatten
annat ___________________________________
f. Vilket pH har vattnet i skrubbern? _______________________ g. Vilken temperatur har vattnet i skrubbern? ______________________
h. Är vattnet som används klorerat? ___________________________________
i. Vilken BOD-halt har vattnet? _______________________________________ j. Har ni haft problem med luftläckage in i er skrubber?
________________________________________________________________
________________________________________________________________
4 Stripper
a. Vilken dimension har strippern (höjd och diameter)? __________________________
b. Vilket tryck är det i strippern? __________________________ bar c. Vart sitter luftintaget till strippern? _______________________
d. Var får luftintaget luft ifrån (ex utomhus, från processhall…)?
____________________________

47
5 Igensättning av fyllkroppar
a. Har ni vid er anläggning upplevt igensättning av fyllkroppar i skrubbern?
Ja Nej
• Om nej, fortsätt till fråga 5e.
b. Om ja, hur märker ni att fyllkropparna sätter igen?
_____________________________________________________________ _____________________________________________________________
c. Beskriv bäst utseende på det slem som orsakar igensättningen av fyllkropparna.
-färg ___________________________________________ -mängd_________________________________________ -konsistens______________________________________
d. Har igensättningen skett i en viss del av skrubbern? Ja, i övre delen av kolonnen Ja, i mitten av kolonnen Ja, i nedre delen av kolonnen Nej, igensättningen är utspridd i kolonnen
Ev. kommentarer: _______________________________________ ______________________________________________________
Anläggningar med recirkulerande vatten bör svara på frågorna 4e-h angående stripper: e. Har ni vid er anläggning upplevt igensättning av fyllkroppar i strippern?
Ja Nej
• Om nej, fortsätt till fråga 5i.

48
f. Om ja, hur märker ni att fyllkropparna sätter igen?
_____________________________________________________________
______________________________________________________________
g. Beskriv bäst utseende på det slem som orsakar igensättningen av fyllkropparna.
-färg ___________________________________________ -mängd_________________________________________ -konsistens______________________________________
h. Har igensättningen skett i en viss del av strippern? Ja, i övre delen av kolonnen Ja, i mitten av kolonnen Ja, i nedre delen av kolonnen Nej, igensättningen är utspridd i kolonnen
Ev. kommentarer: _______________________________________ _________________________________________________________
i. Rent spontant, vad tror du att slemmet består av?
______________________________________________________________
______________________________________________________________
6 Fyllkroppar
a. Hur gamla är fyllkropparna?
________________________________________ b. Leverantör av fyllkroppar? _____________________________________ c. Hur ser fyllkropparna ut, (ex. diameter och höjd)?
___________________________________________________________

49
d. Med vilken täthet (antal/m3) sitter fyllkropparna i skrubbern?
________________________________________________________
e. Med vilken täthet (antal/m3) sitter fyllkropparna i ev stripper?
_________________________________________________________
f. Har ni upplevt andra problem med fyllkropparna än ev igensättning, och i så fall vad?
______________________________________________________________
___________________________________________________________
g. Tvättar ni fyllkropparna, och i så fall hur ofta?
_______________________________________________________________
________________________________________________________________ h. Med vilken metod tvättar ni fyllkropparna?
tar ut och tvättar dem sköljer dem på plats i kolonnen annat sätt
___________________________________________________________
i. Använder ni någon produkt vid tvätt av fyllkroppar och i så fall vilken?
________________________________________________________________ j. Underhålls fyllkropparna på något annat sätt än ev tvättning och i så fall hur?
_______________________________________________________________

50
Appendix B: Evaluation Parameter Eskilstuna Henriksdal Linköping Trollhättan Kalmartype of upgrading plant regenerating regenerating regenerating regenerating regenerating & single passdriftstart 2003 (may) 2003 (july) linje 1,2:1997, Linje 3,4:2002 2002 (nov) 1998 (nov)distibutor of plant YIT Malmberg Water (MW), Lloyd design new YIT, old Flotech Flotech, N Z Flotech
degrade sludge fr. sewage treatment plant sludge fr. sewage treatment plant sludge fr. sewage treatment plant sludge fr. sewage treatment plant waste fr. the slaughter industry,fat fr restaurants fat fr. restaurants waste fr. slaughter, liquid manure remainders from the fish industry liquid manure,
waste fr.the food industry so called draff & mash sludge fr. the slaughterhouse sedegrade in 2 separate chambersremove H2S in hyg. tank with FeCl2
raw gas capacity (Nm3/h) 250 600 2*650, 2*300 400methane rate in raw gas 64% 62-64% ~68 % ~65 % H2S rate in raw gas <0,5 ppm <0.5 ppm 10-20 ppm in ?, out <1ppm 650-800 ppmSCRUBBERdimension 8.46m*712 mm 13m*800mm 7m*800 mm 14m* 800mm 10m*200mmpressure (bar) 10.6 bar 12 bar 9 bar 18-19 bartype of water drinking water drinking water fr lake Mälaren drinking water fr Motala river drinking water fr Göta river drinking waterchemical used in sewage treatment p - Fe2SO4 Fe2SO4, polymeres - -chlorated water yes, total of ~0.01 mg/l no, have once added hypochlorite 11 mg/l in drinking water no (drinking water is chlorated?) yesflow stream through scrubber 30-50 m3/h 45-100 m3/h max 130 m3/h 60 m3/h 6.4 m3/h varav 2.5 m2/h är färsregenerating exchanges 0.18 m3/h 1m3/h 0,5-2 m3/h winter & 5-10 m3/h summ2m3/h watervelocity thr scrubber (m/s) ~100 m/s 90-199 m/s ~258 m/s ~119 m/s ~21 m/spH in water ~8 8.5 in, 3.9 after 8,4 7.8 in, 4.5 after scrubber ~7.7water temperature 5-20 C 15 C 10-20 C (L1&L2 kallare än L3&L4) ~15 C 15 C
BOD-rate < 3 mg/l COD 2,8 mg/l COD 1-3 mg/l COD 2,2 mg/l COD-<4 ug/lproblem with growth no no yes no noappearance of growth - brownish-yellow, yellow-white, - -
slimy mucusamount growth before cleaning - ~100 l in stripper, less in scrubber -how does the growth notice decreased capacity, incoming rate of raw gas is decreased automatically where in the scrubber - mostly at the top, more growth -
in stripper than in scrubberSTRIPPERdimension of stripper 7.225m*1110mm 10m*960mm 7m*800 mm 8.7m * 600 mm 10m*200mmpressure atmospheric just below atmospheric 0 bar atmospheric atmosphericproblem with growth no no yes, more than in scrubber no noPALL-RINGSage in use ca 1.5 years 2 years 4 years 2 years 6 years
manufacturer Kock-Glitsch via Malmberg Water Norton, England via YIT Kock-Glitsch, Italien via Flotechdensity in scrubber ? 3,9 m3 (77%) 3 m3 (85%) ? 0,28 m3 (89%)
stripper 0,1 m3 (31%)size of pall-rings (mm*mm) 30*30 mm 25*25 30*10 25*25 45*10mmCLEANINGmethod - in column outside column in column in columndetergent - hypochlorite clean mechanically with water hypochlorite Pineline, alkaline industrial detehow often? - once, system capacity dropped twice a year once in preventing cause once every other year

51
Eslöv Jönköping Kristianstad Uppsalasingle pass single pass single pass single pass
1999 2000 (april) 1999 (nov) 2002Malmberg kolonn, egen desMW, Lloyd design MW, Lloyd design MW, Lloyd design
sludge fr. sewage treatmentsludge fr. sewage treatment psludge fr. sewage treatment plant sludge fr. sewage treatment plantsludge of starch (co-degrad food remainders fr. industry kwaste fr. food & slaughter solid waste:from Procordia draff-liquid slaughter waste degrade in 2 separate chambers liquid waste: blood, polyglukose
degrade in 2 separate chambers
80 300, but only run 150 300 of which 80 fr.sewage treatment plan 60055-62% ~65 % ~66-70 % (70 fr Kappa Lund) 65-70 %ut <1 ppm ~20 ppm max 200ppm in, max 10 ppm ut <100 ppm (not detected)
6m*500mm 14,5m*400mm 10m* 500 mm 12m*600mm8 bar 10 bar 12 bar 10-12 barwastewater fr sewage treatmwastewater fr sewage treatm wastewater fr sewage treatment plant, drwastewater fr sewage treatment plFeCl2 betbad FeCl2 ?no no chlore-tablet added at wash no10-14 m3/h 25 m3/ h till 150 m3/h max 50 m3/h 60-70 m3/h
~71 m/s 200-1100 m/s ~255 m/s ~230 m/s7 7,5 7 ~7
4-15 C depending on seaso5-15 C depending on the sea10 C drinking water, up to 20 C 10-12 Cduring the summer in waste water
10 mg/l in waste water <15 mg/l <10 mg/l in waste water <4 mg/lyes yes yes yesdark-brown dark-brown, oily, slimy yellow, slimy like coffe ground, reddish brown
a rank smell colors the pall-rings reddish-brown50-100 l a lot! ?pressure change in scrubbeCO2-rate in clean gas increases foam & gas pipe is flooded spread out in the column mostly at the top in the middle
growth also in heat-exchanger
7 years 5 years 3 years 1,5 year(replaced with new ones in nov -04
Norton, England via Malmberg Auscher, Germany via MW via MW? 1,63 m3 (89%) 1,76 m3 (90%) 4,8 m3
25*40mm 25*25 new 25*25, the older are larger 20*31, 25*25
outside column in column in column in column, new tombola outsidewater Alkaclean 28, Lahega Kemi AFloating green P3-asepto FL3-4 times a year every other month once a month every three weeks