native prairie adaptive management monitoring › of › 2013 › 1279 › downloads › ... · 3....
TRANSCRIPT

Native Prairie Adaptive Management Monitoring
SharePoint Database version 6.0 User Guide
July 2012

2 | P a g e
The Native Prairie Adaptive Management Monitoring Database (Database) was developed for the purpose of
entering and storing monitoring and treatment data for lands managed under the Native Prairie Adaptive
Management Project (NPAM). The NPAM is collaboration between the U.S. Fish and Wildlife Service (FWS)
and the U.S. Geological Society (USGS) designed to facilitate management of FWS‐owned native prairies in
the Prairie Pothole region (spanning FWS Regions 3 & 6). Database version 3.5 was finalized and released to
field stations in July, 2010. An updated version of the database, version 5.0, was finalized and released to
field stations in July, 2011. A centralized web database was developed in SharePoint 2012 housed on the
Department of Interior Connect site in July 2012. This User Guide is updated to reflect database version 6.0.
The NPAM database was a created through the work of many people, including a design team and a
programming team.
The following individuals developed the software of the original database, version 3.5, in
Microsoft Access:
Kevin McAbee – FWS Region 6 – Utah Ecological Services Field Office
Todd Sutherland – FWS Region 3 – Biological Monitoring and Database Team
Sarah Jacobi of Chicago Botanical Garden updated and modified version 3.5 of the database to create the
5.0 version and again modified the Access database 6.5 to import the data from the SharePoint application.
The Access database 6.5 will now be used by the NPAM coordinator to generate the recommended
management actions each year.
Vicky Hunt with the Chicago Botanical Garden created the first version of the centralized NPAM web database 6.0 which allows cooperators to enter all monitoring and management action data in SharePoint 2010. Members of the NPAM Science Team, and other individuals, provided design criteria and tested
the database for functionality before final release to all field stations. These individuals include:
Kim Bousquet – FWS Region 3 – Big Stone National Wildlife Refuge
Cami Dixon – FWS Region 6 – Division of Biological Resources
Pauline Drobney – FWS Region 3 – Neal Smith National Wildlife Refuge
Justin Dupey – FWS Region 6 – Huron Wetland Management District
Vanessa Fields – FWS Region 6 – Benton Lake National Wildlife Refuge
Todd Grant – FWS Region 6 – J. Clark Salyer National Wildlife Refuge
Sara Vacek – FWS Region 3 – Morris Wetland Management District
Jennifer Zorn – FWS Region 6 – Division of Biological Resources
Jill Gannon – USGS – Northern Prairie Wildlife Research Center
Clint Moore – USGS – Patuxent Wildlife Research Center
Terry Shaffer – USGS – Northern Prairie Wildlife Research Center
Volunteer Cooperators: Kristine Askerooth –Tewaukon NWR and Brent Jamison – Huron WMD

3 | P a g e
Overview ------- -------------------------------------------------------------------------------------------------------------- 3
NPAM SharePoint Site ---------------------------------------------------------------------------------------------------- 4
NPAM Main Menu --------------------------------------------------------------------------------------------------------- 5
Enter/Edit Observers ------------------------------------------------------------------------------------------------------ 5
Enter/Edit Treatment Data ---------------------------------------------------------------------------------------------- 6
Haying -------------------------------------------------------------------------------------------------------------- 8
Grazing -------------------------------------------------------------------------------------------------------------- 8
Burn ------------------------------------------------------------------------------------------------------------------ 9
Enter Special Treatment -------------------------------------------------------------------------------------------------- 11
Enter/Edit Transect Monitoring Data ---------------------------------------------------------------------------------- 12
Enter/Edit Response to Actions ----------------------------------------------------------------------------------------- 15
Cooperator Summary Datasheets and Queries ---------------------------------------------------------------- 16
Access to the centralized NPAM SharePoint Database will be provided to the primary and secondary
contact for each participating station. Permissions will be restricted to ensure data quality.
Participating stations can access the database by navigating to the NPAM home page located at
https://connect.doi.gov/fws/Portal/R6DBR/NPAM/default.aspx and clicking on the NPAM database icon.
OVERVIEW

4 | P a g e
NPAM Database is hosted on the DOI Connect SharePoint Site. The username and password is your FWS
email and active directory password. (https://connect.doi.gov/fws/Portal/R6DBR/NPAM/default.aspx)
To access the database main menu click on the NPAM database picture located on the home page
NPAM SharePoint Site

5 | P a g e
The main menu contains the links to four steps that need to be completed on a yearly basis.
1. Enter/Edit Observers 2. Enter/Edit Treatment Actions 3. Enter/Edit Monitoring Data 4. Enter/Edit Response to Actions
1. Enter observer names for people that collected monitoring data or applied treatment actions. Click in
the empty box right of ‘Observer Name’; enter the first and last name of the observer.
2. To enter more than one name click on ‘Add more observers’ and continue to add names. Once you
have all the names entered hit ‘Submit’ to save. You have the option to navigate back to the Main
Menu or select Treatment Actions, Monitoring Data, or Response to Actions forms.
Enter/Edit Observers
NPAM MAIN MENU

6 | P a g e
3. To query existing date click on the arrow next to ‘edit user name’ to see the list of observer names that
already exist in the database. You will not be able to submit a name that already exists in the database
but you can edit an existing name. A red dashed box will appear around the name if there is a duplicate
name.
1. To enter new data complete the orange boxes to set the default fields. Select the complex and enter
the correct password for that complex. * All data in the Management Actions is locked with a
password for each complex. The password was sent to the primary and secondary contact for each
station.
2. Select Management Unit
3. Select Management Unit Contact. If the person responsible for the treatment action is not listed scroll
to the bottom of the page and click on the ‘Enter/Edit Observers’ and follow the steps listed under that
section. Note, if you navigate to the ‘Add/Edit Observer’ you will lose any existing data for the
treatment actions.
4. Select the ‘Management Year’, which is the year, as defined by NPAM, in which the treatment took
place. A description of the management year is found to the right of the year. For example, any
treatment that took place from September 1, 2008 to August 31, 2009 is considered to take place in
management year 2009.
5. Select the ‘Management Type’, which is limited to the three or four NPAM choices based on the
Grassland Type (Mixed or Tall Grass Prairie) for the management unit.
6. Enter the ‘Start Date’ and ‘End Date’ for the treatment. You can enter the dates using the calendar
or manually (format mm/dd/yyyy).
For Rest treatments, the start and end dates will be automatically set to the beginning and
ending dates of the chosen management year. These dates cannot be edited.
7. After the Unit is selected, the ‘Native Sod Uplands’ field will be auto‐populated with the native sod
portion of the unit, in acres, retrieved from GIS. This field is grayed‐out and is not editable; it is
primarily there as a reference for the user.
Enter/Edit Treatment Data

7 | P a g e
8. Enter the ‘Native Sod Uplands Treated’. If the entire native sod portion of the unit was treated,
enter the number as seen in the ‘Native Sod Uplands’ field just above. If for some reason only a
portion of the native sod on the unit was treated, for example, a partial prescribed burn, enter the
number of acres that was treated. The number entered must be greater than zero but less than or
equal to the value in the ‘Native Sod Uplands’ field above.
9. After the management type is selected, if other than ‘Rest’, a secondary form will appear to the right
allowing the user to enter required treatment specific data. The tab will default to the specific
management type that was selected. For example, if ‘Graze’ is selected, the user will only be able to
enter data in the fields of the ‘Grazing Data’ tab; all other tabs will be grayed‐out and will not be
editable. See the section on ‘Treatment Specific Data’ below for more details on these fields.
Warning: When the management type is changed, the previous treatment specific data entered in the
secondary form will be lost. For example, if a user selected ‘Graze’ as the management type and entered
grazing specific data in the fields of the ‘Grazing Data’ tab (i.e., Number of animals, Grazing Animal Type,
Stocking Rate, and Grass Utilization) and then changes the management type to ‘Burn’, the grazing specific
information that was entered will be lost and the user will need to enter data in the fields found in the
‘Burning Data’ tab that are relevant to the ‘Burn’ treatment selected. There is no ‘undo’ function. The Start
Date, End Date, and Native Sod Uplands Treated fields will remain as initially entered; however, you will be
prompted to verify that these fields are still accurate for the newly selected treatment and to change them
accordingly if they are not accurate.
10. For Tall Grass Prairie units, additional ‘Phenological Stage’ field(s) within the ‘Grazing Data’ and
‘Burning Data’ tabs will appear. The drop down list for each phenological stage is determined by the
Start Date. For this reason, the user must fill the dates in first before entering the phenological
data. See the section on ‘Treatment Specific Data’ below for more details on these fields.
Special Note about Combination Treatments:
For a Burn/Graze combo, a user must enter each treatment individually in two separate records: one for
the Burn treatment and one for the Graze treatment. For example, a prescribed burn in March followed
by a graze in August must be entered as two separate treatments, in two separate records, that occur
during different dates.
Similarly, for rotational grazing, each instance of grazing must be entered separately. That is, if the unit is
grazed for a week in June, the cattle are removed, and then the unit is grazed for another week in July, these
two grazing events must be entered as two separate records.
11. If any “special treatments” (i.e., treatments other than the recognized NPAM treatments in the
Management Type drop down list) were applied to the management unit during the management
year, the user must select the check box next to ‘Special treatment?’ After submitting the data you
must click on ‘Enter Special Treatment’ link at the bottom of the form to enter the information.
Note: The special treatment window doesn’t automatically open after checking the box.

8 | P a g e
12. To enter addition treatment actions using the same default values (Orange colored boxes) click on
‘Open additional forms’ and then on ‘Copy’ to auto fill the orange boxes. Note: The data is not
saved until you click ‘Submit’
*Remember to check if there are any red boxes showing around any of the attributes that need to be populated.
If a red box exists you can’t submit the data until those are fixed. If you fixed all the red error boxes and the
Submit button is still grayed out, check to see if the password was typed correctly for the complex selected.
********************************************************************************************
TREATMENT SPECIFIC DATA
After the ‘Management Type’ is selected, if other than Rest, a secondary form will appear to the right.
This secondary form contains other attributes for ‘Haying Data’, ‘Grazing Data’, and ‘Burning Data’. This
form contains required fields for the treatment specific data. The secondary form will default to the
specific management type that was selected. For example, if Graze is the selected management type, the
user will only be able to enter data for the fields within the ‘Grazing Data’ form; all other management
type forms will not be available unless you change the ‘Management Type’.
Haying Data (Tall Grass Prairie Units Only)
The Use of Rake to Remove litter is a yes/no question indicating whether or not litter was removed after the haying treatment.
The Approximate Stubble Height is recorded in inches. Enter this value manually.
b. Grazing Data
Record the Number of Animals and Grazing Animal Type used.
The Stocking Rate is calculated by the manager and recorded in AUMs per acre.
The Grazing Utilization is a qualitative pull down describing the approximate intensity of the graze. This is a visual assessment for which the user has separate guidelines on how to make.

9 | P a g e
For tallgrass units only. The user must enter the Phenological Stage of the unit on the Start Date that the grazing treatment began and on the End Date that the grazing treatment ended. The user selects the stage from a drop‐down menu. The choices in the drop‐down menu depend on the Start Date of the grazing treatment. If the Start Date is before January 1 of the management year, the phenological descriptions are relative to the fall season. If the Start Date is January 1 or later of the management year, the phenological descriptions are relative to the spring season. Because it may be difficult for managers to be present on the site when the grazing animals are put on or taken off the unit, there is an option to select “Not able to visit site to assess at time of event”.
c. Burning Data
The Fire Type is either a prescribed or wildland (natural) fire.
The Burn Intensity provides a list of qualitative descriptions of the fire. The burn intensity is affected by the firing techniques (e.g., backing fire, head fire), firing pattern, vegetation dryness or green‐up,

10 | P a g e
and weather conditions during the burn. A complete description is found in the table below:
The Fire Coverage is the portion of the total native sod uplands on the management unit that was actually burned.
For tallgrass units only. The user must enter the Phenological Stage of the unit on the Start Date of the Burn. The user selects the stage from a drop‐down menu. The choices in the drop‐down menu depend on the Start Date of the burning treatment. If the Start Date is before January 1 of the management year, the phenological descriptions are relative to the fall season. If the Start Date is January 1 or later of the management year, the phenological descriptions are relative to the spring season.
Substrate Vegetation
Unburned Not burned Not burned
Scorched Litter partially blackened; duff nearly unchanged; leaf structure unchanged
Foliage scorched
Lightly burned
Litter charred to partially consumed, but some plant parts are still discernible; charring may extend slightly into soil surface, but soil is not visibly altered; surface appears black(this soon becomes inconspicuous); burns may be spotty to uniform depending on the grass continuity
Grasses with about two inches of stubble; foliage and smaller twigs of associated species partially to completely consumed; some plant parts may still be standing; bases of plants are not deeply burned and are still recognizable
Moderately burned
Leaf litter consumed, leaving coarse, light gray or white colored ash immediately after the burn; ash soon disappears leaving bare mineral soil; charring may extend slightly into soil surface
Unburned grass stubble usually less than two inches tall, and mostly confined to an outer ring; for other species, foliage completely consumed, plant bases are burned to ground level and obscured in ash immediately after burning; burns tend to be uniform
Heavily burned
Leaf litter completely consumed, leaving a fluffy fine white ash, this soon disappears leaving bare mineral soil; charring extends to a depth of 1 cm(0.5 in) into the soil; this severity class is usually limited to situations where heavy fuel load on mesic sites has burned under dry conditions and low wind
No unburned grasses above the root crown; for other species, all plant parts consumed leaving some or no major stems or trunks, any left are deeply charred; this severity class is uncommon due to the short burnout time of grasses
Not applicable
Inorganic preborn; None present preborn;

11 | P a g e
13. To query existing date fill in the field in blue (Complex, password, and mgmt. year) and click search.
Once the search is complete a list of all records that match the query fields will display below. If you
need to edit existing data, make changes where appropriate and click ‘Submit’ at the bottom of the page.
If you would like to add new records after you compeleted a query click on ‘Open additional forms’ at the
bottom and either enter all new information or click on ‘Copy’ button to copy the last submitted records
default fields (orange boxes).
1. Enter Special Treatment Information
The user enters a description of the special treatment in the Description field. The Start and
End dates are entered the same way as they are on the main Management Form (i.e., using
Enter Special Treatment

12 | P a g e
the calendar or manually in the format mm/dd/yyyy). The Acres Treated must be a value
greater than zero and less than or equal to the full size of the Native Sod Uplands on the
unit. You may enter multiple special treatments for the same NPAM unit. Once you’re done
filling in the information, hit the submit button and return to either the main menu or
treatment actions form.
Examples of Special treatments include spot spaying chemical for invasive or noxious weeds, spot
mowing invasive or noxious weeds, or hand-pulling invasive or noxious weeds.
1. To enter new data complete the orange boxes to set the default fields. Select the complex and enter
the correct password for that complex. Enter the Org, Unit, Monitoring Yr., Date, Primary obs,
Secondary obs, and select the confirm unit. * All data in the Transect Monitoring Section is locked with
a password for each complex. The password was sent to the primary contact for each station.
Enter/Edit Transect Monitoring Data

13 | P a g e

14 | P a g e
2. Scroll up and hit ‘Edit plot’ to populate Plot 0.5-25. The plot data is greyed out until you click ‘Edit Plot’,
once it is in edit mode the plot boxes will turn green. Options for filling in the plot data include
manually entering the plant code and ‘Tab’ button on your keyboard to advance to the next plot number
and/or use the fill buttons located in the green section (two locations).
1. Fill Blanks – use the drop down list to select the plant code you would like to fill in for all blank
plots.
2. Fill Next – fill the next plot with the same plant code above.
3. Fill next several – Enter the plot number you wish to fill the previous entered plant code to.
4. Clear All – Will clear the entire plot data. *The fill buttons only work for plots that do not
have existing data.
3. Once you entered plot data for a transect, you must click on the ‘Check for errors’ located at the bottom
of the plots data before the data can be submitted. This checks all 50 plots to make sure that a valid
plant code was entered. If there are any red boxes round a plant code, that code was invalid. You
must go up and click on ‘Edit plots’ button again and fix the errors before you can submit the data.

15 | P a g e
4. After you ‘Check for errors’ you can submit you monitoring data. To save all the transect data you must
hit the ‘Submit’ button. After you hit the ‘Submit’ button you will get a message box saying the data
was submitted successfully and return you to a fresh Monitoring Data Form or you will receive an error
message. All errors will have a red dashed box around the attributes that need attention. * By clicking
the ‘Submit’ button you set the default values for the next transect.
5. To enter data for a new transect click on ‘Copy’ button to fill in the orange default boxes, scroll down and
select a new transect and repeat step 2-3.
6. To continue entering data for other transect with the same default values click on ‘Add additional form’
and repeat steps 2-3. *Caution, if you enter too many transects at one time you may get an error
stating you exceeded the limit. Do not enter data for more than 8 transects at one time without hitting
the ‘Submit’ button.
7. To save all the transect data you must hit the ‘Submit’ button. After you hit the ‘Submit’ button you will
get a message box saying the data was submitted successfully and return you to a fresh Monitoring Data
Form or you will receive an error message. All errors will have a red dashed box around the attributes
that need attention.
* By hitting the ‘Submit’ button, the last entry will set the default values.
1. From the main menu click on ‘Enter/Edit Response to Actions’
2. Select Management Year, Complex, Password, Org, and Unit. After you select the Unit the
recommended action for the Management Year will automatically populate in the grey box.
3. Check the box if you implemented the recommended management action. If you did not implement
the recommended action then check all the reasons that apply in the box below. Please add any
comments as to why the recommend treatment action was not completed.
4. Repeat steps 2 and 3 for all units in your complex.
Enter/Edit Response to Actions

16 | P a g e
1. From the main menu click on the appropriate link to either the ND plant code list or SD plant code list.
(Units in MT, ND, MN use ND plant list, units in SD use SD plant list).
2. Click ‘Open’ from the Windows Internet Explorer box.
3. If a yellow Security Warning shows on the top of the excel sheet, click on “Enable Content’
Cooperator Summary Datasheets

17 | P a g e
4. Enter the password for the complex you wish to retrieve data. (Same password used to enter data)
followed by and “_” and year. Click OK.
5. The excel sheet will open up with all the data for the complex. There are several tabs on the sheet.
The following pages describe the summaries that were created for each transect/unit. To save the excel
file, go up to file, save as and navigate to a location on your computer or sever where you would like to
store the summary datasheet.
BASIC DATA QUERIES USING NORTH DAKOTA AND SOUTH DAKOTA PLANT LISTS
Basic frequency calculation and potential storage and/or exportation of transect data
Each 25-m transect is composed of 50 0.5-m segments. Frequency for each plant group is derived by
summing the number of belt segments classified for each group (e.g., 41 native cool-season prairie [ND
list]) and dividing by 50, the total number of segments. Convert proportional frequencies to percentage by
multiplying by 100.
Below is a description of 6 basic summaries we have found useful. Queries are first derived for EACH
TRANSECT. To fill the “query categories”, frequency data for relevant plant groups are simply added
together according to the query (e.g., using the SD list, we derive the percentage of low-shrub (Life Form
Query) by adding plant groups 11-14. Data are usually summarized for each management unit or
alternatively for each complex (i.e., data are averaged across all transects that comprise the management
unit – measures of variation [i.e., summary statistics should be provided based on the number of transects
summarized]). Pages that follow show ND and SD plant lists, plus basic queries associated with each list.
Again, for each query, plant groups are added together to get values for query categories.
Query 1) Life Form
What proportion each management unit is composed of 4 major life form categories: 1) grass-forb, 2) low
shrub, 3) tall shrub, and 4) tree? This query primarily addresses the degree to which units are invaded by
woody vegetation. A unique forb component also can be derived by subtracting transects = “49” from the
grass-forb component 1 above for the ND list and “25” for the SD list.

18 | P a g e
Query 2) Degree of Invasion (grass-forb categories only)
What proportion of each management unit is 1) mostly invaded by introduced plants, 2) somewhat invaded
by introduced plants, or 3) in near pristine condition? This query can only be used for the ND list. It
describes current state and restoration potential of management units. Units with a high proportion of
“mostly invaded” are less likely to be restored or more costly to restore. Units in pristine condition can be
considered in a maintenance phase. “Somewhat invaded” units offer restoration opportunities above those
that are “mostly invaded”.
Query 3) Grass-forb Composition
What proportion of each management unit is dominated by 1) native grass-forb, 2) Kentucky bluegrass, 3)
smooth brome, 4) quackgrass, 5) crested wheatgrass, and 6) weedy forb categories? Woody vegetation
categories are excluded. This is the query most useful for the NPAM project. Also, this is the principal
query used to identify restoration issues (e.g., KY bluegrass vs. smooth brome vs. weedy forbs) for a unit.
Depending on type and degree of invasion, specific (short- and long-term) management prescriptions are
formulated. For those using the SD plant list, this query is an analogous (but less informative) substitute
for the query #2 above: “degree of invasion (grass-forb only)”.
Query 4) Low shrub Composition
What proportion of each management unit is composed of different low-shrub types, including 1)
snowberry, 2) silverberry, 3) meadowsweet, and 4) other types? This query can only be used for the ND
list and is most relevant for units with known invasions by woody vegetation that differ substantially from
the presettlement period (see life form query). Depending on type and degree of invasion (e.g., silverberry
vs. snowberry), specific management prescriptions may be formulated.
Query 5) Understory Composition of Low Shrub Community
Given the low shrub component, what is the predominant understory vegetation type, including 1) native
grass-forb, 2) Kentucky bluegrass, and 3) smooth brome? This query can only be used for the ND list and is
most relevant for tracts with known woody vegetation invasions (see life form query). Low shrubs,
especially western snowberry are often transitional sites. Historically these sites were often dominated by
mesic warm-season native vegetation; smooth brome or Kentucky bluegrass are predicted to replace many
low-shrubs, especially under rest-dominated management. As such, degraded low shrub communities
may be considered invasion sites for bluegrass or brome.
Query 6) Weedy Forb Composition
What proportion of each management unit is dominated by 1) leafy spurge, 2) Canada thistle, 3)
wormwood, 4) sweet clover, or other 5) introduced weeds? The total frequency of all weedy forb groups
is derived from the query of “Grass-forb Composition”. This query provides information on the relative
importance of different weedy forbs in compromising the integrity of management units. Depending on

19 | P a g e
type and degree of invasion, unique, specific short- and long-term management prescriptions are
formulated.

20 | P a g e
North Dakota Plant List
Description of class Code
snowberry dense; other plants few or none 11
snowberry; remainder mostly NATIVE grass-forb types 12
snowberry; remainder mostly Kentucky bluegrass 13
snowberry; remainder mostly smooth brome (or quackgrass) 14
silverberry; add modifier 15[2] = NATIVE grass-forb, 15[3] = KY bluegrass, 15[4] = brome (or quack), 15[5] = crested 15
silverberry/natives 152
silverberry/ky blue 153
siverberry/brome 154
snowberry; remainder mostly crested wheatgrass 16
meadowsweet; add modifier as above 18[2], 18[3], or 18[4], 18[5] = crested 18
meadowsweet/natives 182
meadowsweet/ky blue 183
meadowsweet/brome 184
other low shrub (user defined – add modifier) 19
native shrub (chokecherry, buffaloberry, hawthorn, willow) 21
shrub-stage aspen 22
introduced shrub (caraganna, Russian olive) 23
aspen 31
shade-tolerant woodland tree (green ash, box elder, American elm) 33
oak 34
introduced tree (Siberian elm, Juniper, spruce) 35
dry cool season (sedges, green needlegrass, needle-and-thread, wheatgrass spp., prairie junegrass, forbs) 41
dry warm season (little bluestem, prairie sandreed, blue gramma, frobs) 42
mesic cool-warm mix (big bluestem, switchgrass, porcupine grass, prairie dropseed, forbs) 43
meadow (fowl bluegrass, foxtail barley, northern reedgrass, fine-stem sedge spp., baltic rush, cordgrass). 46
wetland; robust emergent vegetation or open water (cattail, river bulrush, bur-reed, phragmites, manna grass) 47
clubmoss/lichen 48
native forb 49
Kentucky bluegrass >95% (or >50% if mixed with other non-natives) 51
Kentucky bluegrass and NATIVE grass-forbs, KY bluegrass 50-95% 52
NATIVE grass-forbs and Kentucky bluegrass, KY bluegrass 5-50% 53
smooth brome >95% (or >50% if mixed with other non-natives) 61
smooth brome and NATIVE grass-forbs, brome 50-95% 62
NATIVE grass-forbs and smooth brome, brome 5-50% 63
crested wheatgrass >95% (or >50% if mixed with other non-natives) 71
crested wheatgrass and NATIVE grass-forbs, crested wheatgrass 50-95% 72
NATIVE grass-forbs and crested wheatgrass, crested wheatgrass 5-50% 73
quackgrass >95% (or >50% if mixed with other non-natives) 74
quackgrass and NATIVE grass-forbs, quackgrass 50-95% 75
NATIVE grass-forbs and quackgrass, quackgrass 5-50% 76
reed-canary grass 77
tall, interm, or pub wheatgrass 78
other introduced grass (user defined) 79
leafy spurge 81
Canada thistle 85
wormwood 87
other introduced weeds (user-defined) 88
barren/unvegetated (e.g., rock, anthill, bare soil); dead vegetation 91
tall introduced legume: sweet clover of alfalfa 98
other – user defined 99

21 | P a g e
Summation of categories for several basic data queries ND List
Life Form
Grass-forb 40s, (Exclude 47), 50s, 60s, 70s, 80s, 98
Low shrub 11-19
Tall shrub 20s
Tree 30s
Forb only 49
Degree of Invasion (grass-forb only)
Mostly invaded 51, 52, 61, 62, 71, 72, 74, 75, 77, 78, 81, 85, 87, 88,
98
Somewhat invaded 53, 63, 73, 76
Devoid of invasives “pristine” 41, 42, 43, 46, 48, 49 (Exclude 47)
Grass-forb Composition
Native-dominated 41, 42, 43, 46, 48, 49, (Exclude 47), 53, 63, 73, 76
Kentucky bluegrass-dominated 51, 52
Smooth brome-dominated 61, 62
Quack grass-dominated 74, 75
Crested wheat grass-dominated 71, 72
Reed-canary grass-dominated 77
Weedy forb-dominated 80s, 98
22 | P a g e
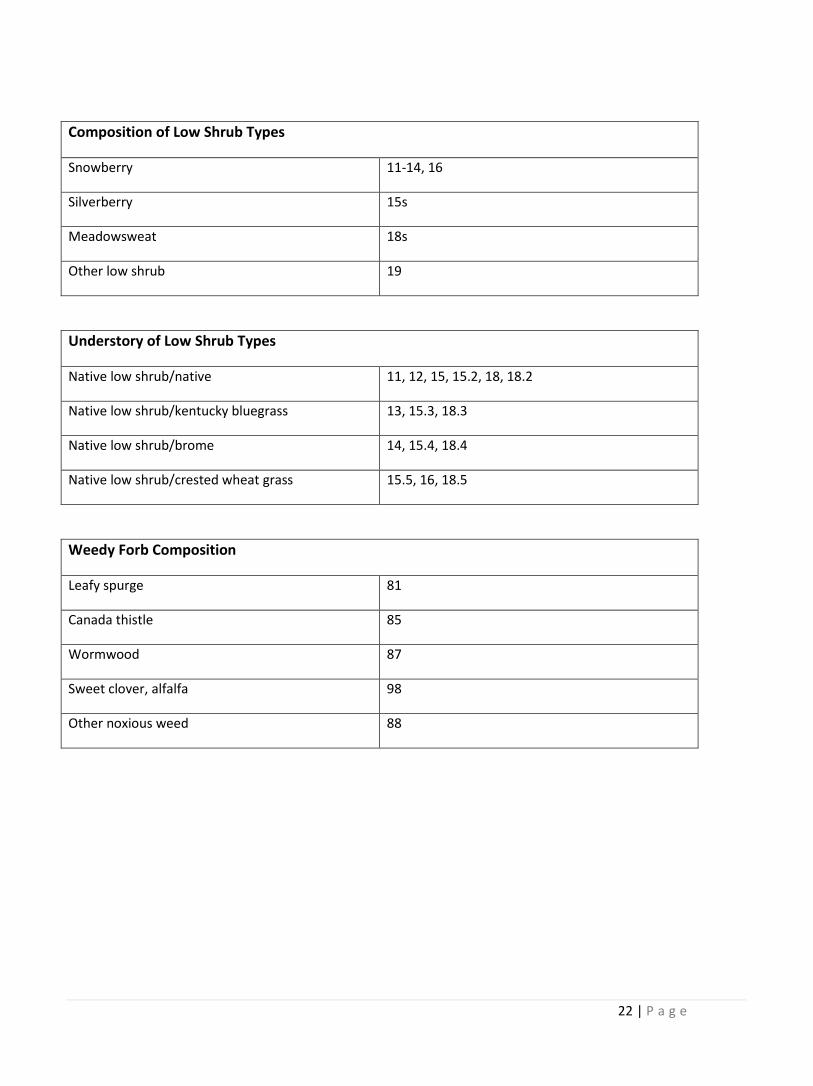
Composition of Low Shrub Types
Snowberry 11-14, 16
Silverberry 15s
Meadowsweat 18s
Other low shrub 19
Understory of Low Shrub Types
Native low shrub/native 11, 12, 15, 15.2, 18, 18.2
Native low shrub/kentucky bluegrass 13, 15.3, 18.3
Native low shrub/brome 14, 15.4, 18.4
Native low shrub/crested wheat grass 15.5, 16, 18.5
Weedy Forb Composition
Leafy spurge 81
Canada thistle 85
Wormwood 87
Sweet clover, alfalfa 98
Other noxious weed 88

23 | P a g e
South Dakota Plant List
Description of class Code
dense low shrub, other plants few or none 11
low shrub, remainder native grass and forb 12
low shrub, remainder KY bluegrass 13
low shrub, remainder brome or quackgrass 14
low shrub, remainder crested 19
tall shrub, native 15
tall shrub, exotic 16
native trees (e.g. cottonwood, green ash, bur oak) 17
non-native trees (e.g. Japanese elm, Russian olive) 18
cool season grasses & forbs A) green needle, B) western wheatgrass, C) porcupine grass 21
warm season grasses & forbs A) big bluestem, B) switch, C) Indian, D) little bluestem 22
meadow (sedges, baltic rush, dock, smartweed, cordgrass, reedgrass, horsetail, foxtail barley, etc.) 23
wetland; robust emergent vegetation or open water (cattail, river bulrush, bur-reed, Phragmites, manna grass) 24
forb 25
Kentucky bluegrass dominant 31
smooth brome dominant 41
crested wheatgrass dominant 51
quackgrass 52
reed-canary grass 53
tall, intermediate, or pubescent wheatgrass 61
other non-native grass – user defined (downy/Japanese brome, etc.) 62
leafy spurge 71
canada thistle 72
sow thistle 73
wormwood 74
other weeds (kochia, ragweed, cocklebur, etc.) 75
other noxious weed (user-defined) 76
tall introduced legume (sweet clover or alfalfa) 81
cactus 83
clubmoss/Lichen 84
barren, unvegetated (bare soil, gopher mound) 91
other (rock, manure, hole, ant hill) 92

24 | P a g e
Summation of categories for several basic data queries SD List
Life Form
Grass-forb 20s, (Exclude 24), 30s, 40s, 50s, 60s, 70s, 80s
Low shrub 11-14, 19
Tall shrub 15, 16
Tree 17, 18
Forb only 25
Grass-forb Composition
Native-dominated 21, 22, 23, (Exclude 24), 25, 83, 84
Kentucky bluegrass-dominated 31
Smooth brome-dominated 41
Quack grass-dominated 52
Crested wheat grass-dominated 51
Reed-canary grass-dominated 53
Weedy forb-dominated 70s, 81
Understory of Low Shrub Types
Native low shrub/native 11, 12
Native low shrub/kentucky bluegrass 13
Native low shrub/brome 14
Native low shrub/crested wheat grass 19

25 | P a g e
Weedy Forb Composition
Leafy spurge 71
Canada thistle 72
Sweet clover, alfalfa 81
Other noxious weed 73, 74, 75, 76