natural beauty 2012 interim results
TRANSCRIPT

Natural Beauty
2012 Interim Results
16 August 2012

Agenda
• Introduction
• Financial Summary
• Retailing Overview
• Marketing Strategy
• Outlook
• Open Forum
2

Financial Summary Andy Chan
3
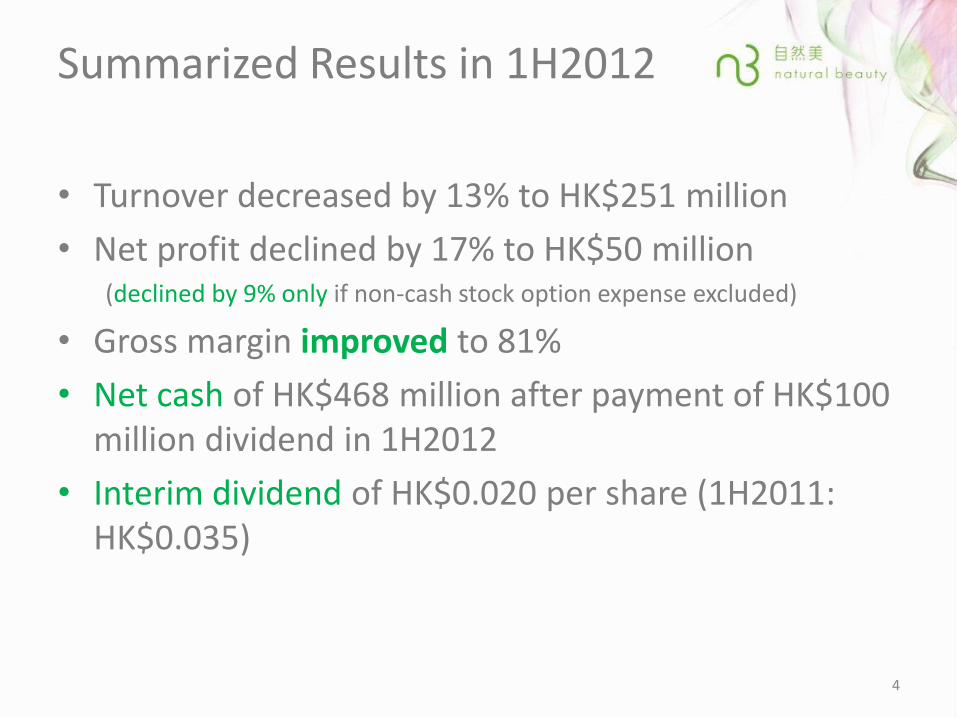
Summarized Results in 1H2012
• Turnover decreased by 13% to HK$251 million
• Net profit declined by 17% to HK$50 million (declined by 9% only if non-cash stock option expense excluded)
• Gross margin improved to 81%
• Net cash of HK$468 million after payment of HK$100 million dividend in 1H2012
• Interim dividend of HK$0.020 per share (1H2011: HK$0.035)
4

Financial Summary
5
For six months ended
HK$ Million 30 June, Chg %
2011 2012
Turnover 288.5 250.9 -13.0%
Gross profit 224.4 204.1 -9.1%
Profit before tax 80.1 77.6 -3.1%
Net profit 60.4 50.0 -17.1%
Dividend per share (HK cents)
- Interim (HK cents) 3.50 2.00 -42.9%
Dividend payout (%) 115.9 79.7 -36.2
Basic EPS (HK cents) 3.02 2.51 -16.9%
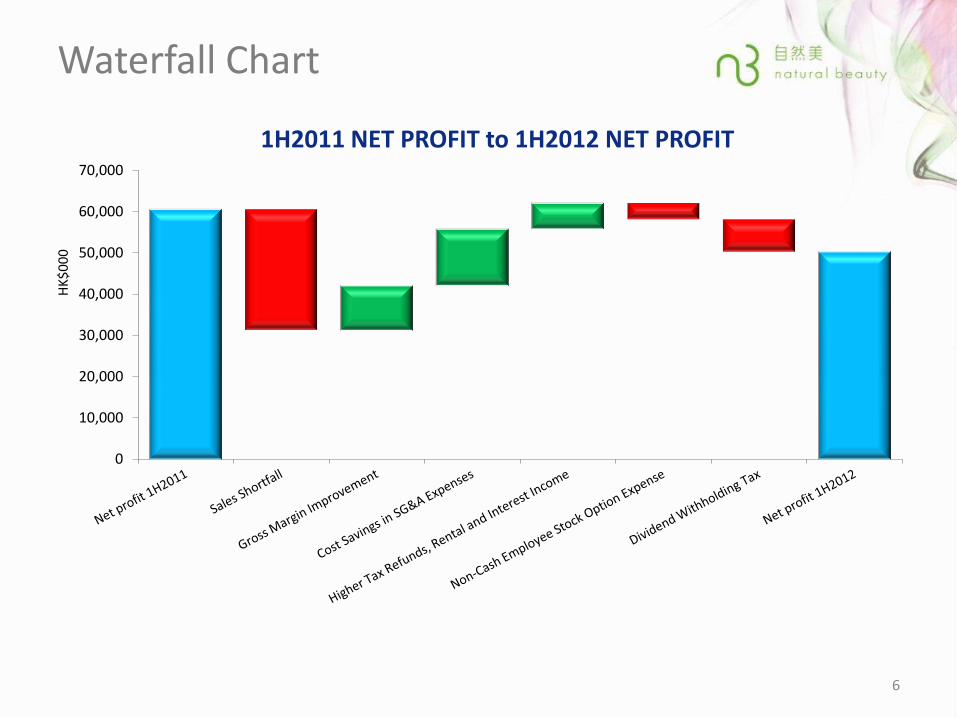
Waterfall Chart
6
0
10,000
20,000
30,000
40,000
50,000
60,000
70,000
HK
$0
00
1H2011 NET PROFIT to 1H2012 NET PROFIT

Dividend
104%
522%
148%
80%
0%
100%
200%
300%
400%
500%
600%
-
20,000
40,000
60,000
80,000
100,000
120,000
140,000
160,000
180,000
FY2008 FY2009 FY2010 FY2011
Div
iden
d p
ayo
ut
rati
o (
%)
HK
$'0
00
Interim dividend Final dividend Dividend payout ratio
The Board has declared an interim dividend of HK$0.02 per share for 1H2012, with dividend payout rate at 80%
Dividend payout 100% line
7

1H2012 Key Ratios
8
For year ended For six months
31 December, ended 30 June, Chg
2011 2012
A/R months * 0.5 mths 0.8 mths 0.3 mths
A/P months * 2.2 mths 3.7 mths 1.5 mths
Inventory turnover months * 4.0 mths 7.6 mths 3.6 mths
ROE * (%) 14.6 12.3 -2.3 pts
ROA * (%) 12.0 10.5 -1.5 pts
Cash (HK$ million) 558.3 468.3 -16.1%
Gearing Ratio Net cash Net cash N/A
Dividend payout (%) 147.8 79.7 -68.1 pts
Basic EPS (HK cents) 5.75 2.51 -56.3% * Annualized for comparison purpose.
Cash represents 52.0% of total assets as of 30 June 2012.
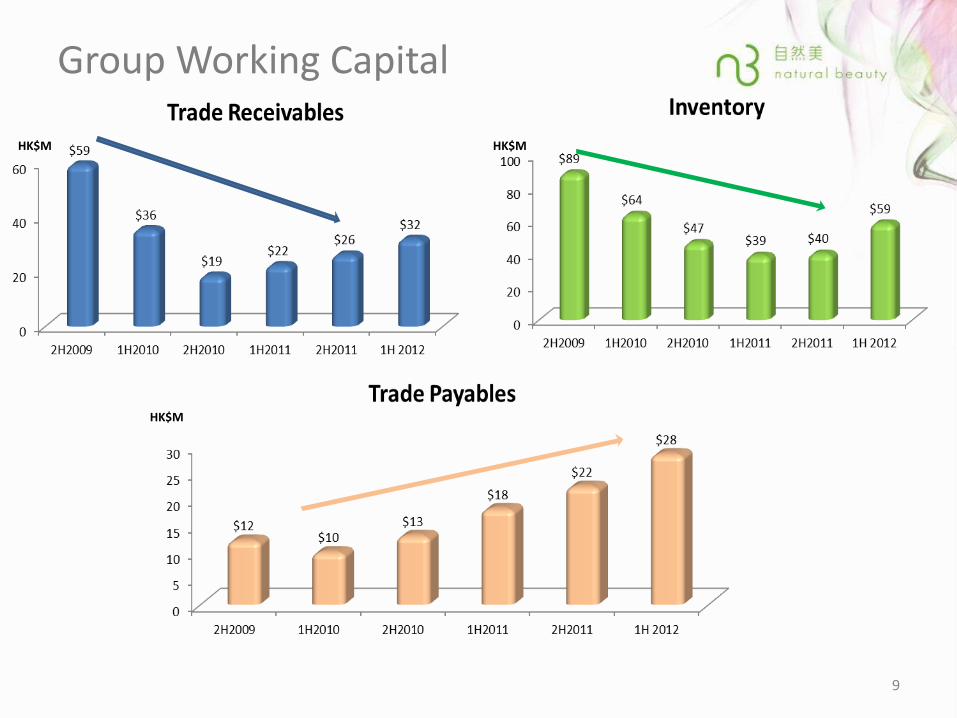
Group Working Capital
9
HK$M HK$M
HK$M
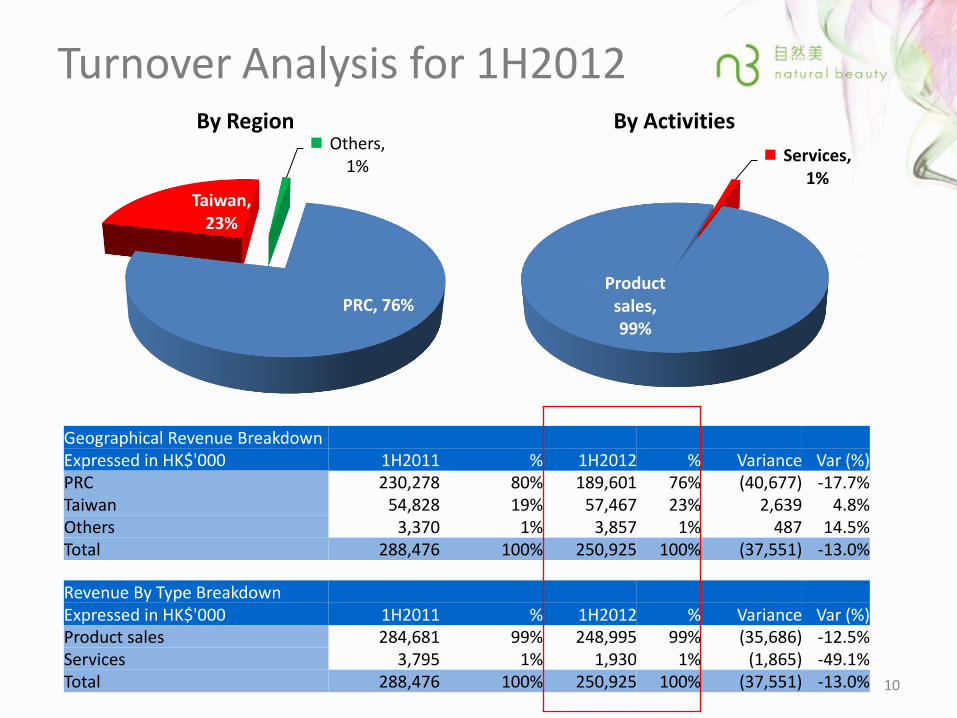
Turnover Analysis for 1H2012
PRC, 76%
Taiwan, 23%
Others, 1%
By Region
10
Product sales, 99%
Services, 1%
By Activities
Geographical Revenue Breakdown Expressed in HK$'000 1H2011 % 1H2012 % Variance Var (%) PRC 230,278 80% 189,601 76% (40,677) -17.7% Taiwan 54,828 19% 57,467 23% 2,639 4.8% Others 3,370 1% 3,857 1% 487 14.5% Total 288,476 100% 250,925 100% (37,551) -13.0%
Revenue By Type Breakdown Expressed in HK$'000 1H2011 % 1H2012 % Variance Var (%) Product sales 284,681 99% 248,995 99% (35,686) -12.5% Services 3,795 1% 1,930 1% (1,865) -49.1% Total 288,476 100% 250,925 100% (37,551) -13.0%

Store Count at 30 June 2012
11
As at 30 June 2012
Franchisee
owned Entrusted Self-
owned Self-
owned
Total Spas Counters Spas Counters
The PRC 1,242 1,186 27 2 27
Taiwan 315 312 - 3 -
Others HK
33 1 - - -
Malaysia 32 - - -
Total 1,590 1,531 27 5 27
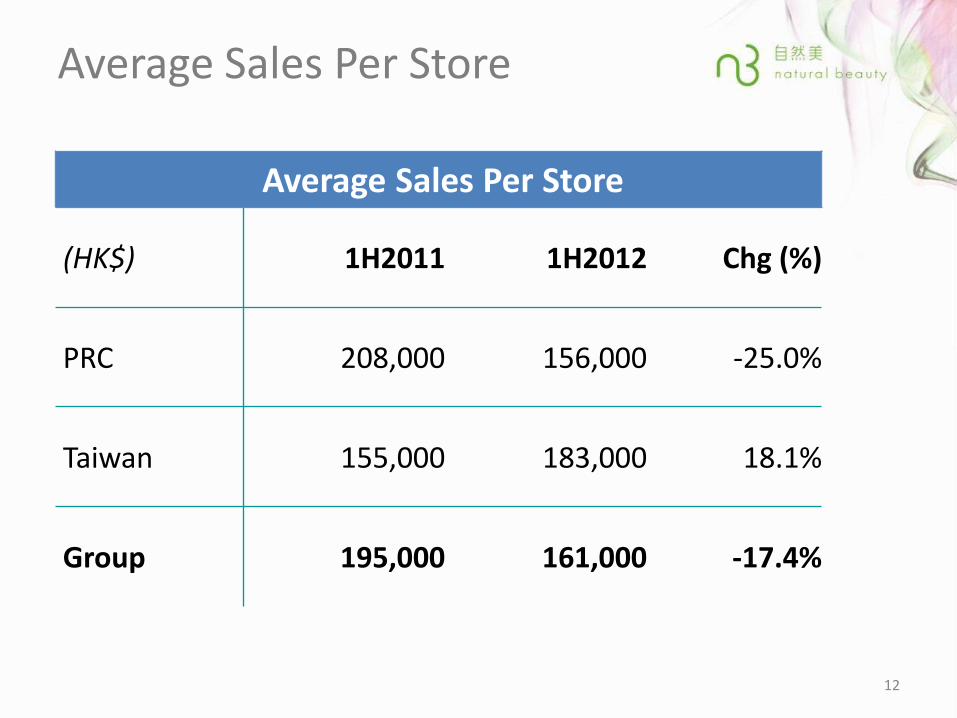
Average Sales Per Store
12
Average Sales Per Store
(HK$) 1H2011 1H2012 Chg (%)
PRC 208,000 156,000 -25.0%
Taiwan 155,000 183,000 18.1%
Group 195,000 161,000 -17.4%
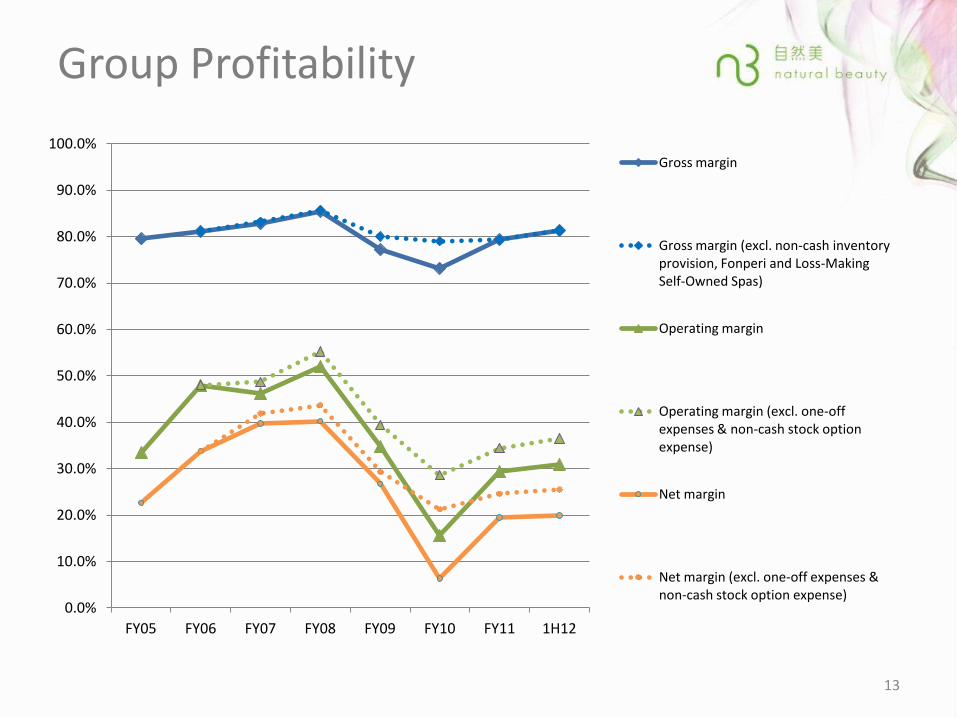
Group Profitability
0.0%
10.0%
20.0%
30.0%
40.0%
50.0%
60.0%
70.0%
80.0%
90.0%
100.0%
FY05 FY06 FY07 FY08 FY09 FY10 FY11 1H12
Gross margin
Gross margin (excl. non-cash inventory provision, Fonperi and Loss-Making Self-Owned Spas)
Operating margin
Operating margin (excl. one-off expenses & non-cash stock option expense)
Net margin
Net margin (excl. one-off expenses & non-cash stock option expense)
13

Retailing Overview Antonio Lee
14

1st Half 2012
NCS Store Growth in China
0
10
20
30
40
50
60
70
80
New Store Upgrading
2011 1st Half 2012 1st Half
70* 30 65
+35
52*
+18
*Gross store number *21 new stores (30%) in 1st half 2012 are converted from other brand
15

0
400
800
1200
1600
2008 2009 2010 2011 2012 1st Half
SPA Counter Franchisee Store
Total Consumer Touch Points
1509 1195 1085 1192
2008 2009 2010 2011 2012 1st Half SPA 7 7 4 2 2
Counter 56 63 47 56 54 Franchisee Store 1446 1125 1034 1134 1186
Total 1509 1195 1085 1192 1242 +/- -314 -110 107 50
1242
16
17
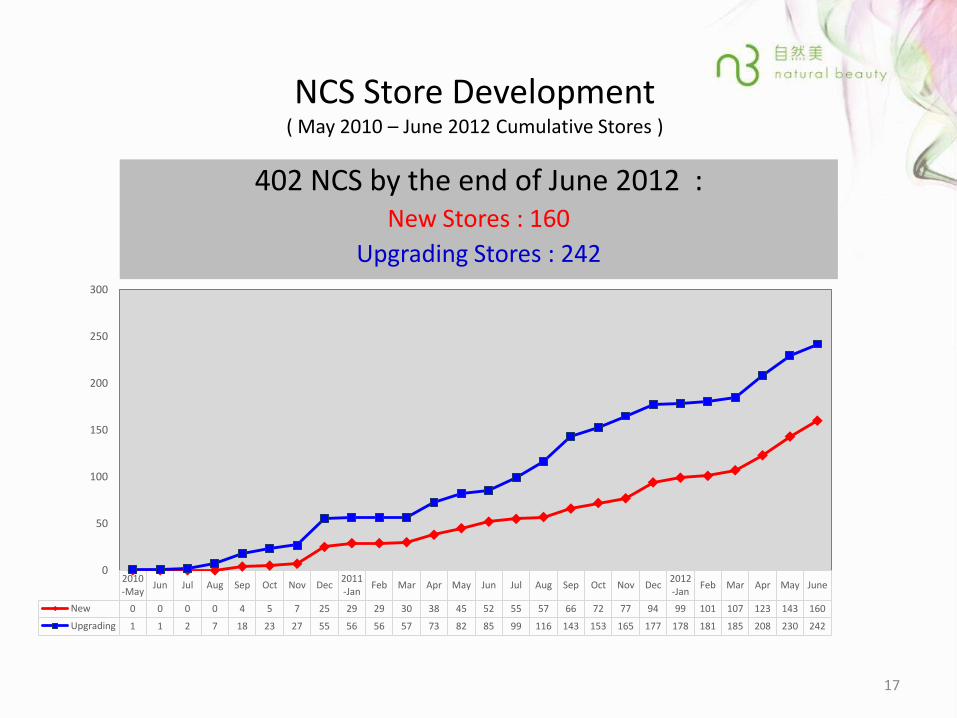
NCS Store Development ( May 2010 – June 2012 Cumulative Stores )
2010-May
Jun Jul Aug Sep Oct Nov Dec 2011-Jan
Feb Mar Apr May Jun Jul Aug Sep Oct Nov Dec 2012-Jan
Feb Mar Apr May June
New 0 0 0 0 4 5 7 25 29 29 30 38 45 52 55 57 66 72 77 94 99 101 107 123 143 160
Upgrading 1 1 2 7 18 23 27 55 56 56 57 73 82 85 99 116 143 153 165 177 178 181 185 208 230 242
0
50
100
150
200
250
300
402 NCS by the end of June 2012 : New Stores : 160
Upgrading Stores : 242

Yr 2009 Yr 2010 Yr 2011 2012 1st Half
NCS 0 80 271 402
H&B 190 210 291 289
Old 935 744 572 495
0
200
400
600
800
1,000
1,200
1,400
2012 1st Half
NCS Store Growth in China
18
+131 stores
One NCS opened per working day
Franchisee Store Tiers Allocation
17%
83% 72% 50%
20%
8%
26%
24% 34%
24%
42%
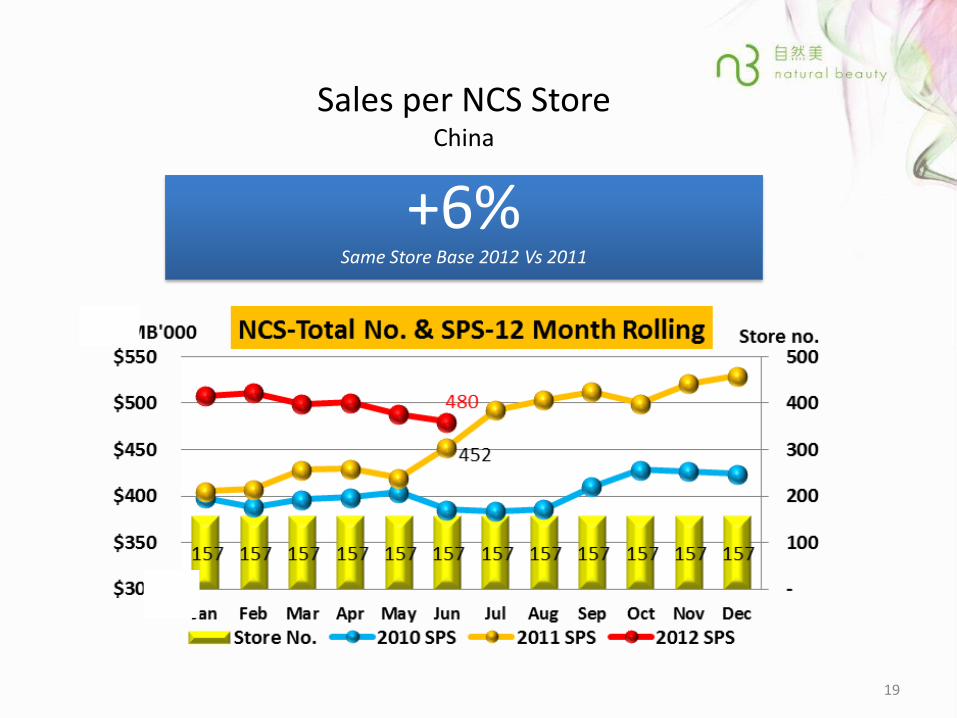
Sales per NCS Store China
19
+6% Same Store Base 2012 Vs 2011

Sales per Old Store China
20
-22% Same Store Base 2012 Vs 2011

Retail Outlook
• Continue Other Brand Conversion
• Accelerate store upgrading
• Kicking off in-store Standard Operating Procedures (SOP) implementation
21

Marketing Strategy Shirley Tai
22

Brand Portfolio and Architecture
Beauty Needs
Low Involvement Medical Needs
High Involvement
Training
Channel
R&D
Masstige 10-14 CAGR 8 - 10%
NB - Herbal: 18 – 25 females - Counter:
Anmi
Herbal Yabai
- 18 – 25 females - RMB100 - 300
- KA/ Counter - E Commerce/ SPA
Prestige 10-14 CAGR 15 - 20%
NB - Bio Tech: 22-28 females RMB 200-400 - NB-1: >28 female
- RMB700 - 3,000
- Dept & Speciality - E Commerce / SPA
Cosmeceuticals 07-16 CAGR 20%
NB - Stremark - Problem skin - >18 Females & Males - RMB 200 - 3,000
- Pharmacy - Clinic
Source of Data: 2010 Euromonitor Report
23

2012 Strategic Imperatives Deliver Growth and Drive Brand Awareness and Preference
Build Power Brands - Continue to drive brand growth bull’s-eye 25 -35 affluent females. - Drive new launches of NB-1 and Bio-Tech to retain and recruit consumers. - Re-launch Anmi and Herbal Counter brands to recruit young consumers.
Drive Channel Growth - TM Programs (Thyroid Awareness, Bride, New Mum) to drive NCS growth. - New communications programs to retain and recruit new consumers. - Rebuild counter portfolio and promotion strategy.
Integrated Brand Investment - Continue to use PR, WOM and digital to build trials and preference.
- Improve TOM via TVC, print to speed up brand revamp & recruitment. - Maximize new TVC awareness via video websites and outdoor. - Tactical campaigns to drive NCS traffic via print and outdoor.
24
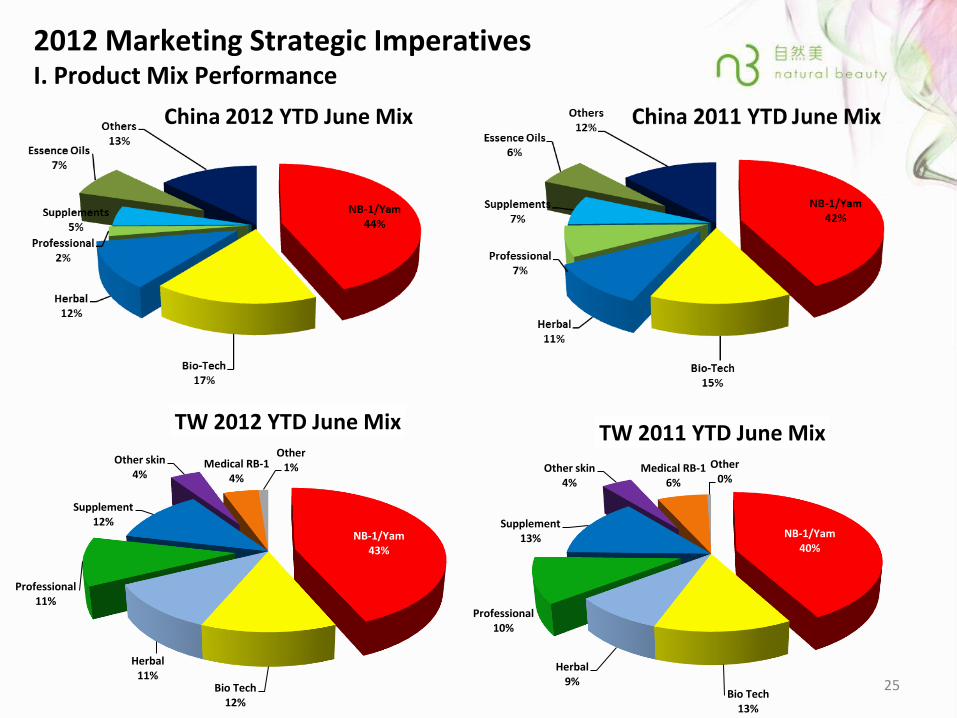
2012 Marketing Strategic Imperatives I. Product Mix Performance
China 2012 YTD June Mix
NB-1/Yam 40%
Bio Tech 13%
Herbal 9%
Professional 10%
Supplement 13%
Other skin 4%
Medical RB-1 6%
Other 0%
TW 2011 YTD June Mix
NB-1/Yam 43%
Bio Tech 12%
Herbal 11%
Professional 11%
Supplement 12%
Other skin 4%
Medical RB-1 4%
Other 1%
TW 2012 YTD June Mix
25

1. Drive category growth via new launches: - total 32 skus for 2012; represents > 3% of total net sales.
26
2. Total 12 new product launches for NB-1:
- new patient SCT-MRT granted in US in Q1,12
- precious Cordyceps (冬蟲夏草), Yunzhi mushrooms (雲芝) and Deep Sea Algae (黃金藻)
3. Total 12 new product launches for Bio-Tech: - smart capsules marine sources
- anti-oxidant Pomegranate (石榴), Green Grapefruit (綠柚子) and Sea buckthorn (沙竹).
4. Launch Collagen Drinks for firming and detoxing in 2H
5. Kick off all new launches in Taiwan in 2H
2012 Marketing Strategic Imperatives II. New Products Launch

2012 1H PR Event
27
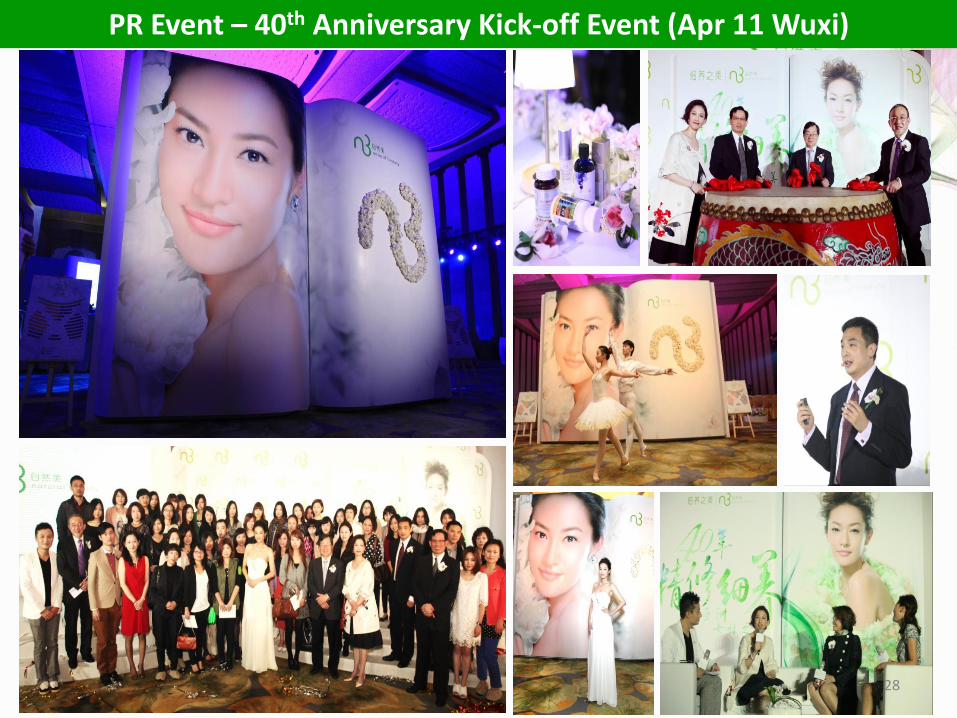
PR Event – 40th Anniversary Kick-off Event (Apr 11 Wuxi)
28
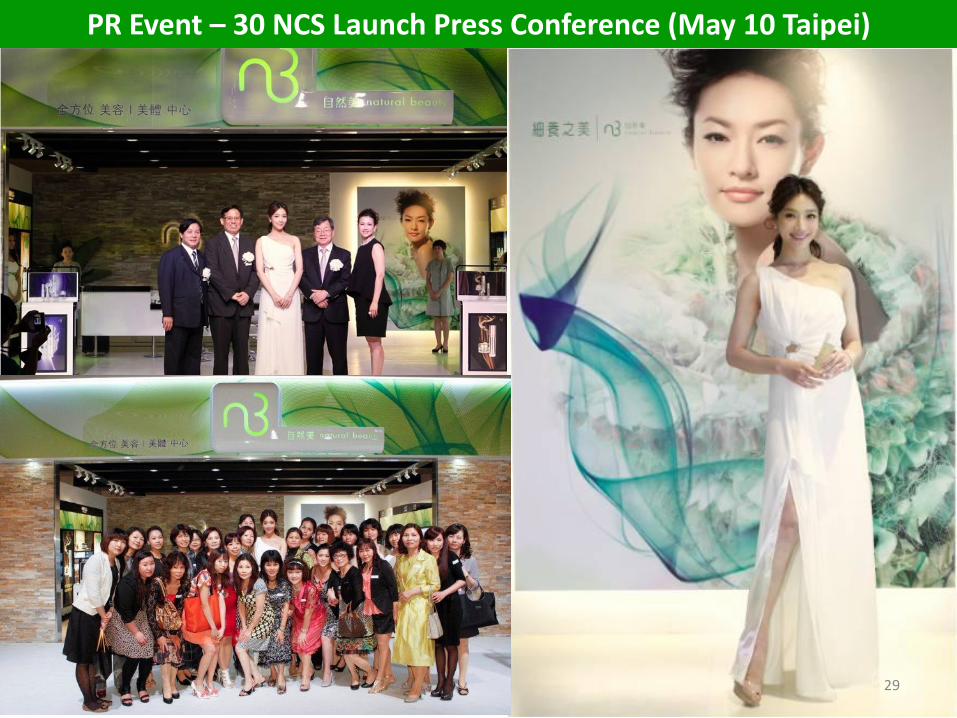
PR Event – 30 NCS Launch Press Conference (May 10 Taipei)
29

2011 Media Clippings Modern Weekly: Leading local high end business fashion & lifestyle weekly Circulation: 830,000
30

2011 Media Clippings Trends Health: No.1 Intl. women health & lifestyle monthly Circulation: 817,040
31

2011 Media Clippings Elle: Leading Intl. fashion & lifestyle monthly Circulation: 615,200
32

2011 Media Clippings Figaro: Leading Intl. fashion & lifestyle weekly Circulation: 478,000
33

2012 1H Product Portfolio Campaign
34

Whitening National Advertising - Print (Apr – May)
35

Brand/Whitening Advertising Bus Panel (Apr – May)
36

Brand TVC National Advertising - Digital (Apr-May)
37

Whitening Campaign (Apr – May) Brand Awareness Performance
NB Brand Awareness
Baidu + 282%
Consumer Registration
Mini-site + 81%
7 Times of Benchmark
38
2012 1H Target Marketing Program 25 – 35 White Collar Females Health Conscious
39

In-store Support - Corporate Video - Banner (celebrity) - Questionnaire/ DM - Campaign Pin
Target Marketing Program (May – June) Thyroid Awareness (Purple Butterfly Campaign)
40

Target Marketing Program (May) Franchisee Training
41

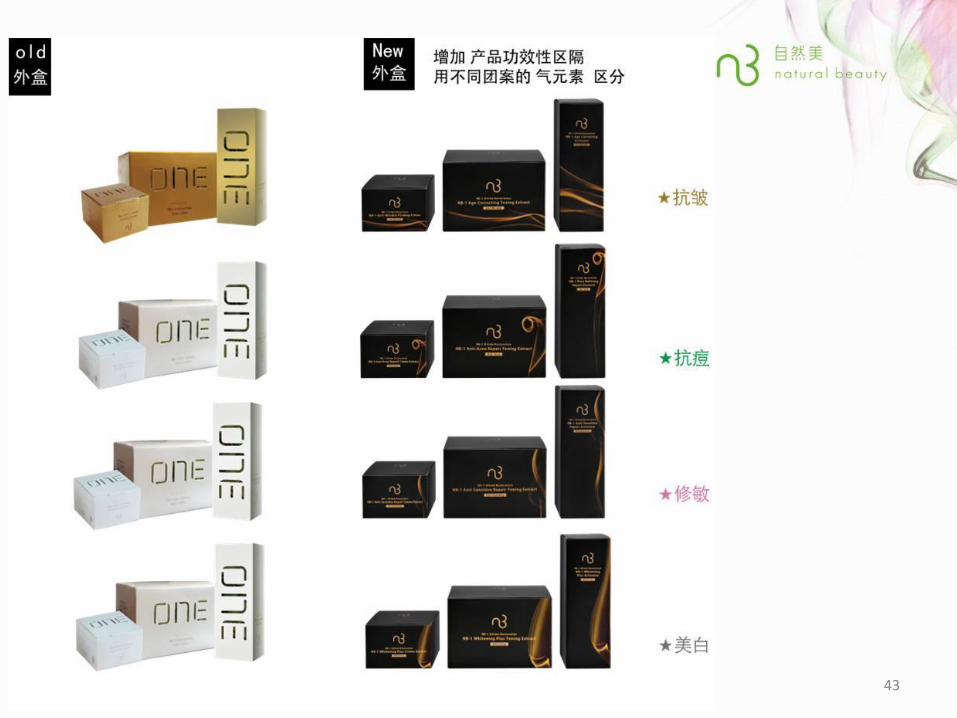
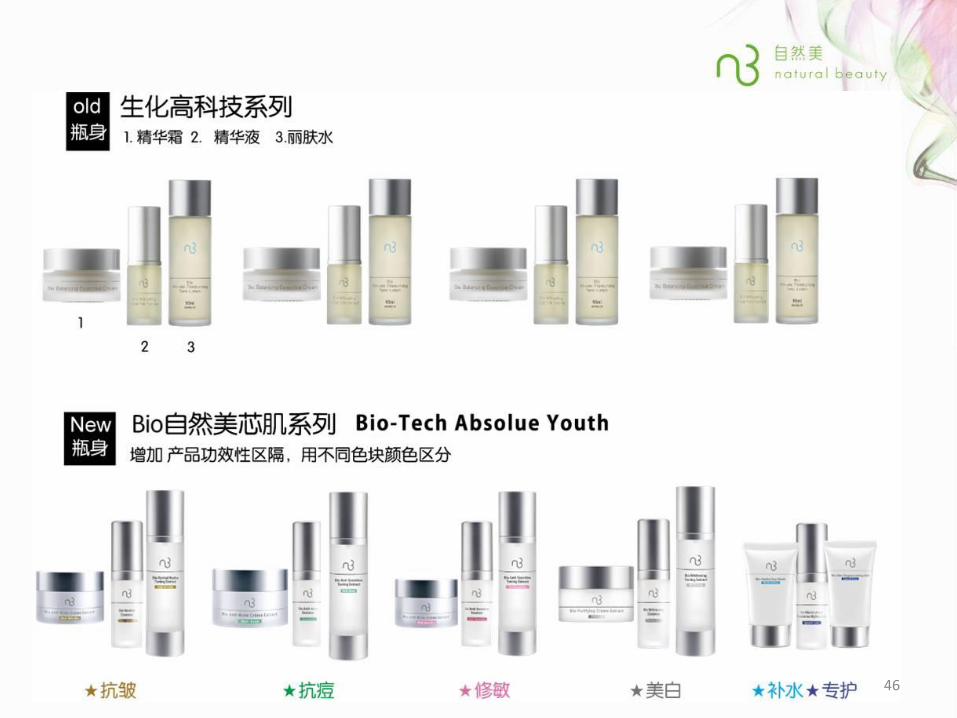
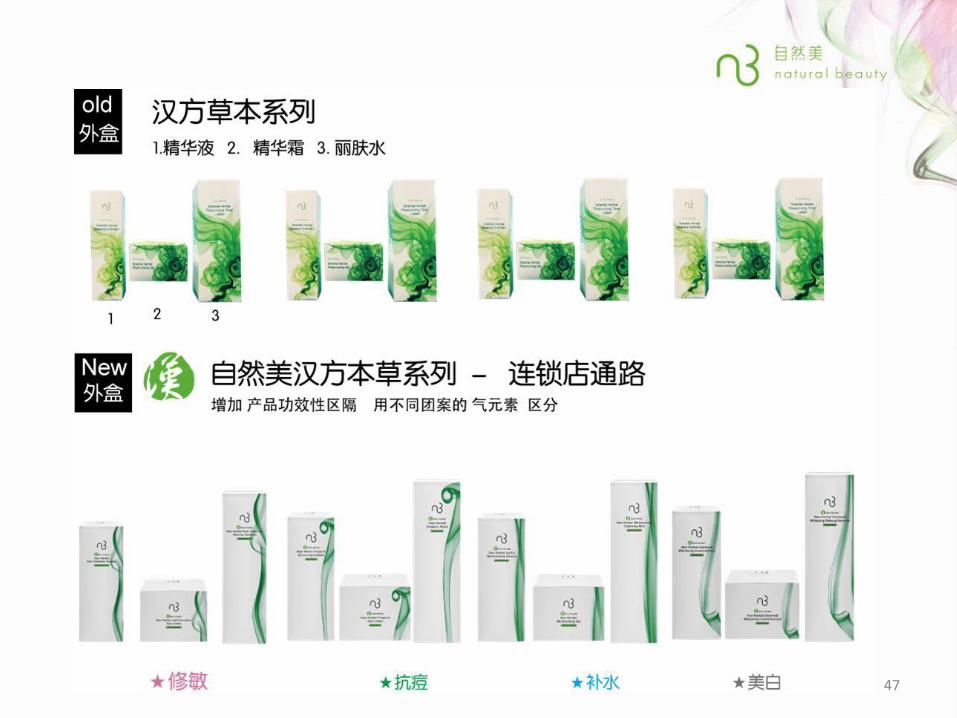
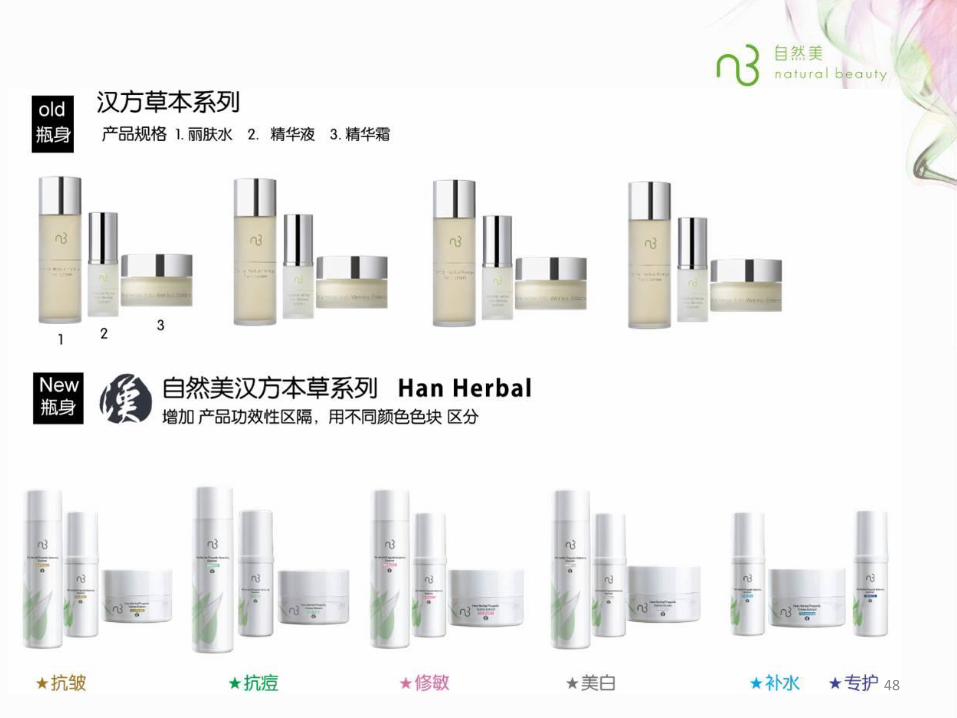
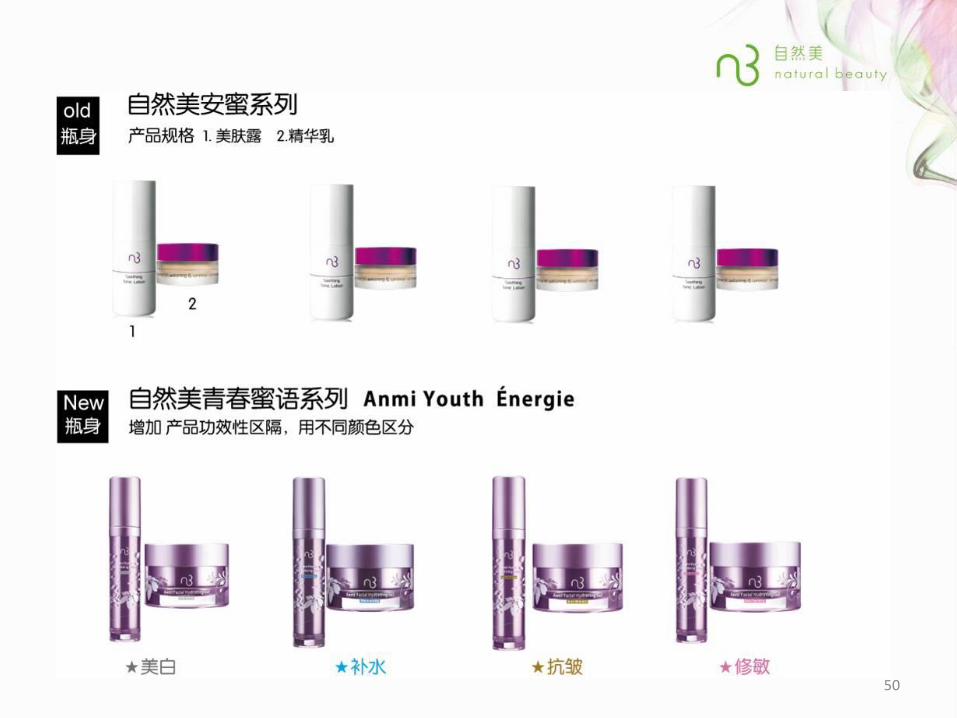
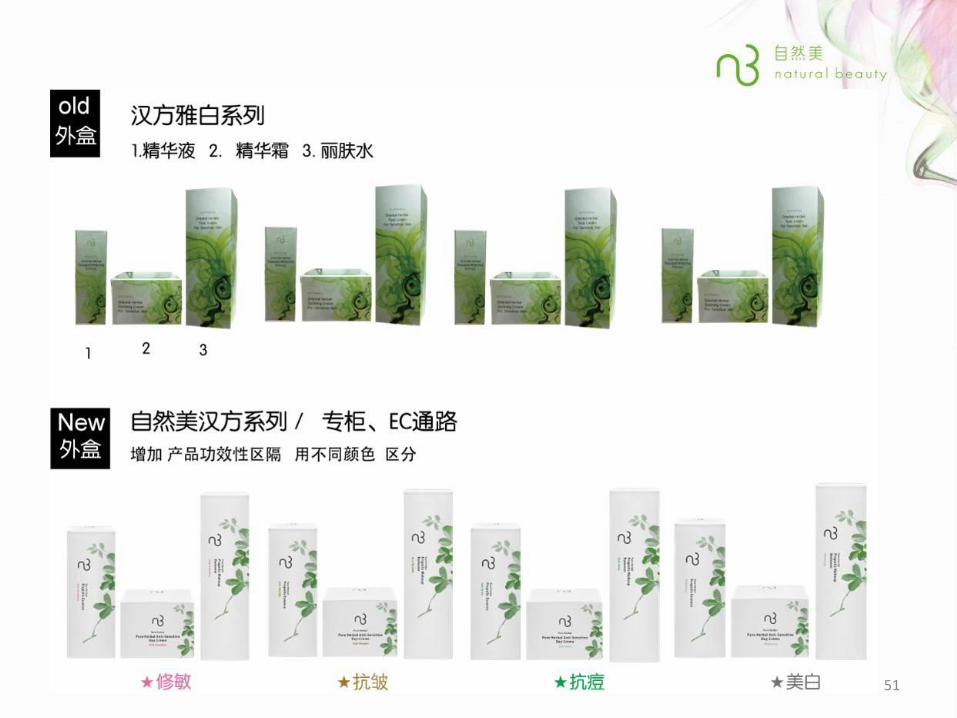
2012 Brand Revamp New Marcom.
42
43

44

45
46
47
48

49
50
51

汉方草本系列
52

2012 Marketing Strategic Imperatives 2H Key Initiatives Outlook
Continue to drive premium and high margin portfolio: NB-1, Yam and Bio-Tech product lines
Invest in target marketing programs and joint promotions: Brides and New Mums
Develop Herbal/ Anmi to recruit new and young consumers: NCS expansion in T2 – 3 cities Counter as new consumer touch points
Continue to drive brand awareness and trials via: WOM and digital marketing Magazine, Outdoor and TVC (digital) to build Top-of-mind
53

Outlook Jacky Chan
54

PRC Macro Economics
55

Jan.08 13.6%
Mar.09 6.6%
Jun.12 7.6%
Mar.10 11.9%
Jul.08 10%
Jul.09 -8.2%
Jul.11 7.5%
Jun.12 -2.1%
Feb.08 8.7%
Aug.09 -1.8%
Jun.11 6.4%
Jun.12 2.2%
CPI June 2.2%
PPI June -2.1%
56
AOP: 9.1%
AOP: 6.5% AOP: 7.5%
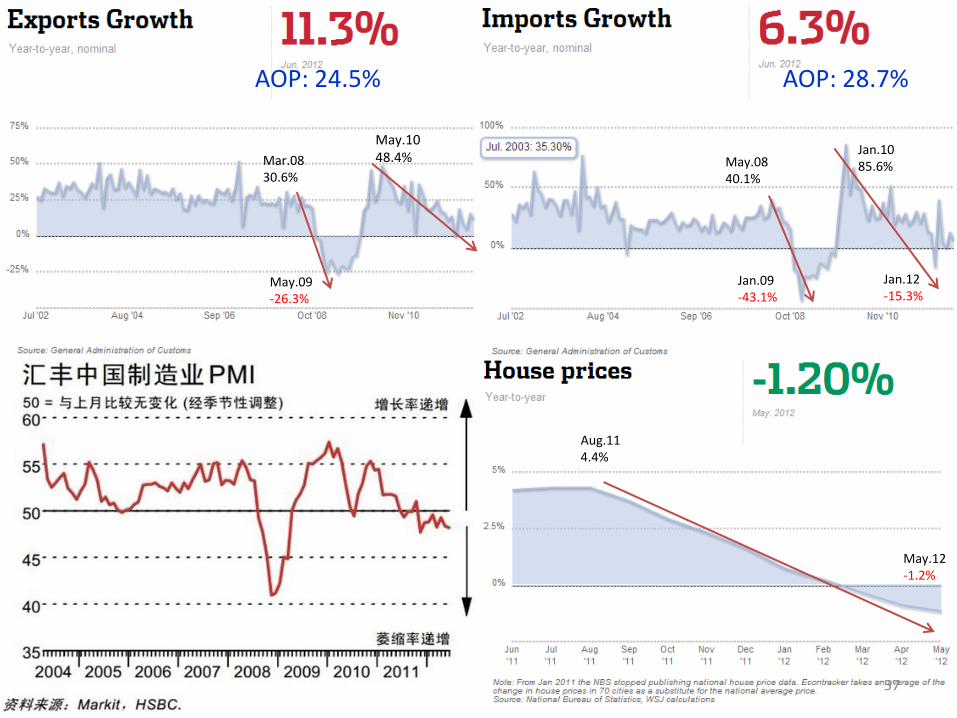
Mar.08 30.6%
May.09 -26.3%
May.10 48.4% May.08
40.1%
Jan.09 -43.1%
Jan.10 85.6%
Jan.12 -15.3%
Aug.11 4.4%
May.12 -1.2%
57
AOP: 24.5% AOP: 28.7%
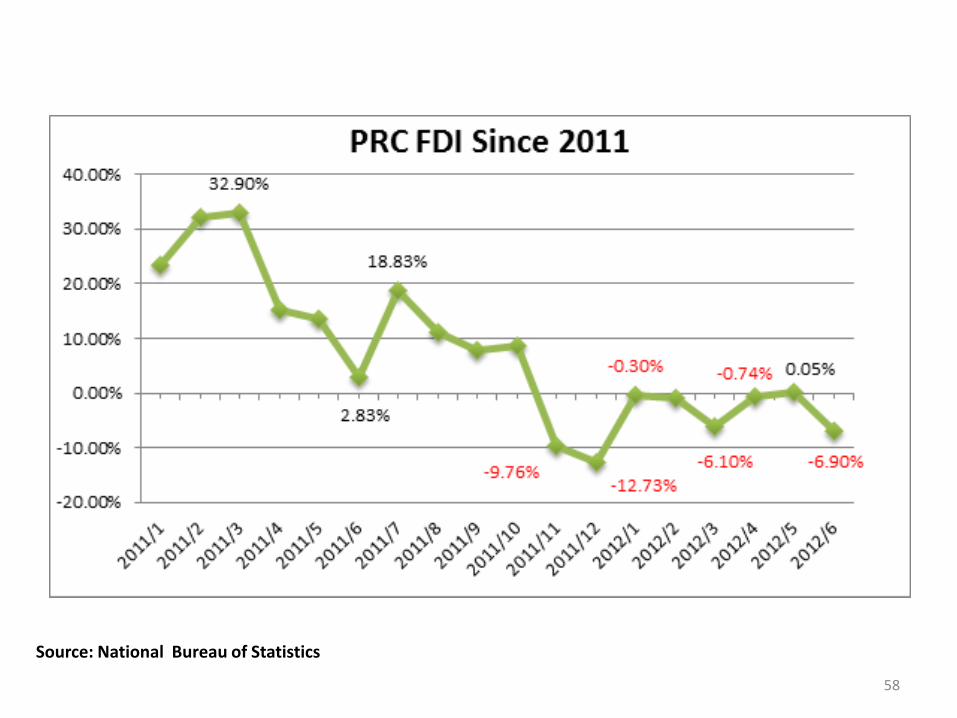
Source: National Bureau of Statistics
58
Taiwan Macro Economics
59

60
GDP % Q1 -0.11%
CPI % Jul +2.46% Jul -1.71% PPI (WPI) %

Export Growth (%)
Import Growth (%)
61

PRC Industry Trend
• SPA shop closure accelerated
• Consumer traded down spending
• Investors were more cautious
• Industry consolidation commenced
• Government started to ease monetary supply and introduce stimulus packaging
62
Our Focus
• Continue other brand conversion and NCS upgrading
• Introduce SOP (Quality improvement)
• Cost control
• Hold margin
63