natural england commissioned report necr123 - monitor of
TRANSCRIPT

Natural England Commissioned Report NECR123
Monitor of Engagement with the Natural Environment: The national survey on people and the natural environment
Technical Report (2012-13 survey)
www.naturalengland.org.uk
First published 30 July 2013


Foreword Natural England commission a range of reports from external contractors to provide evidence and advice to assist us in delivering our duties. The views in this report are those of the authors and do not necessarily represent those of Natural England.
Background In 2009 Natural England, Defra and the Forestry Commission commissioned TNS to undertake the Monitor of Engagement with the Natural Environment (MENE) survey.
In the four years since MENE was commissioned, a wealth of information has been collected regarding visits taken to the natural environment and related behaviours and attitudes.
The survey is commissioned in order to: • Understand how people use, enjoy and are
motivated to protect the natural environment. • Provide data that monitors changes in use and
enjoyment of the natural environment over time, at a range of different spatial scales and for key groups within the population.
How will Natural England use the findings? In relation to its remit for promoting public understanding, conservation and enjoyment of the natural environment, Natural England will use the findings to:
• Inform its work, and that of other interested parties, to link it more closely to need.
• Evaluate the impact and effectiveness of this work.
The technical report provides full details of the survey methodology, including approaches to sampling, grossing and weighting, and estimates of confidence intervals.
Published alongside this report are:
• Annual reports presenting the official statistics from the survey.
• A number of other outputs from the survey covering areas including attitudes to the environment and the geographical distribution of visits.
All of the survey outputs are available from the Natural England website.
Official Statistics The information within this report is categorised as ‘Official Statistics’, and has been produced and published according to arrangements approved by the UK Statistics Authority. A document detailing Natural England’s compliance with the Code of Practice for Official Statistics is available separately on the Natural England website.
Natural England Project Manager - Erica Wayman [email protected]
Contractor - Duncan Stewart, TNS, 23 Alva Street, Edinburgh EH2 4PS
Keywords - visits, engagement, natural environment, participation, motivations, barriers, activities, expenditure
Further information For further information relating to the statistics in this report contact [email protected] This report can be downloaded from the Natural England website: www.naturalengland.org.uk/ourwork/enjoying/research/monitor. For information on Natural England publications contact the Natural England Enquiry Service on 0845 600 3078 or e-mail [email protected].
This report is published by Natural England under the Open Government Licence - OGLv2.0 for public sector information. You are encouraged to use, and reuse, information subject to certain conditions. For details of the licence visit www.naturalengland.org.uk/copyright. Natural England photographs are only available for non
commercial purposes. If any other information such as maps or data cannot be used commercially this will be made clear within the report.
ISBN 978-1-78354-128-7 © Natural England and other parties 2013

Contents 1 Introduction .............................................................................................................................. 1
Background ................................................................................................................................... 1
Survey aims and objectives ........................................................................................................... 1
Survey scope ................................................................................................................................ 1
Structure of the report.................................................................................................................... 2
2 Data collection ......................................................................................................................... 3
Scoping stages and piloting ........................................................................................................... 3
Summary of approach ................................................................................................................... 4
TNS in-home omnibus survey ....................................................................................................... 4
Sampling approach ....................................................................................................................... 4
Sample sizes achieved .................................................................................................................. 5
Sample sizes by region and groups of interest ........................................................................... 7
Questionnaire design..................................................................................................................... 9
A seven day recall period ............................................................................................................ 10
Communicating the survey scope ................................................................................................ 11
Interviewer briefings .................................................................................................................... 11
Christmas gap ............................................................................................................................. 12
Strengths of the survey data ........................................................................................................ 12
Limitations of the survey data ...................................................................................................... 13
3 Data analysis .......................................................................................................................... 14
Data checking and coding of ‘other’ responses............................................................................ 14
Destination geocoding ................................................................................................................. 14
Error checking .......................................................................................................................... 15
Start point geocoding................................................................................................................... 16
Weighting and grossing up of the survey data ............................................................................. 16
Weighting and grossing procedures ......................................................................................... 16
Results of weighting review ...................................................................................................... 19
Conclusions of weighting review .............................................................................................. 21
4 Levels of accuracy ................................................................................................................. 22
Analysis of respondent-based data.............................................................................................. 22
Analysis of visit-based data ......................................................................................................... 24
Accuracy of visit estimates .......................................................................................................... 29
Accuracy of expenditure estimates .............................................................................................. 33
i Monitor of Engagement with the Natural Environment: Technical Report

Appendices Appendix 1 MENE questionnaire ................................................................................................. 35
Appendix 2 Standard classification questions included in TNS-RI Omnibus ........................... 48
Appendix 3 Weighting targets ...................................................................................................... 52
Appendix 4 Review of demographics used in weighting ........................................................... 54
ii
List of tables Table 2-1 Total samples achieved – respondents and visits .......................................................... 6
Table 2-2 Total samples achieved by region and groups of interest Year One (March 2009 to February 2010), Year Two (March 2010 to February 2011), Year Three (March 2011 to February 2012) and total period ..................................................................................................................... 8
Table 2-3 Questionnaire topics and frequency of inclusion in survey fieldwork .............................. 9
Table 3-1 Weeks included in each MENE month ......................................................................... 17
Table 4-1 Levels of accuracy – respondent based results Year 1 to Year 3 and cumulative total . 23
Table 4-2 Levels of accuracy – all visit based results Year 1 to Year 3 and cumulative total ........ 26
Table 4-3 Levels of accuracy – selected visit based results Year 1 to Year 3 and cumulative total ............................................................................................................................................... 28
Table 4-4 Visit estimates – total, and by region of residence ........................................................ 30
Table 4-5 Visit estimates – by general place visited ..................................................................... 31
Table 4-6 Visit estimates – by specific place visited ..................................................................... 32
Table 4-7 Expenditure estimates .................................................................................................. 34
Appendix 1: Table A MENE questionnaire ....................................................................................................... 35
Appendix 3: Table B Weighting targets ............................................................................................................ 52
Appendix 4: Table C Review of demographics used in weighting – March 2009 to February 2010 targets ...... 54
iii Monitor of Engagement with the Natural Environment: Technical Report

List of figures Figure 2-1 Introduction to MENE interview 11
iv

1 Introduction 1.1 This report outlines the methods and technical details of the Monitor of Engagement with
the Natural Environment (MENE) survey. The survey collects detailed information on people’s use and enjoyment of the natural environment, focusing on visits to the natural environment. This report relates to the four years of surveying from March 2009 to February 2013.
1.2 The survey was undertaken by TNS on behalf of Natural England, the Department for Environment, Food and Rural Affairs (Defra) and the Forestry Commission.
Background 1.3 Prior to the start of MENE, there was a growing evidence base about the benefits that
people derive from contact with the natural environment, however, there was also a lack of information about how and why people engaged with the natural environment. Natural England, Defra and the Forestry Commission therefore commissioned TNS to undertake the Monitoring Engagement with the Natural Environment (MENE) survey.
1.4 In the four years since the survey commenced, a wealth of evidence on outdoor recreation behaviour and attitudes has been collected. In addition, the survey has provided a basis for specific analysis on areas such as how members of diversity groups and children’s engage with the outdoors.
Survey aims and objectives 1.5 This survey aims to provide information about the relationship between people and the
natural environment. Whilst the main focus of the survey is on visits, it also seeks to capture other ways of using or enjoying the natural environment such as time spent in the garden and watching nature programmes on television.
1.6 The objectives of the survey are to:
• provide estimates of the number of visits to the natural environment by the English adult population (16 years and over);
• measure the extent of participation in visits to the natural environment and find out the barriers and drivers that shape participation;
• provide robust information on the characteristics of visitors and visits to the natural environment;
• measure other ways of using and enjoying the natural environment; and • identify patterns in use and participation for key groups within the population and at a
range of spatial scales.
Survey scope 1.7 The survey relates to engagement with the natural environment. By natural environment we
mean all green open spaces in and around towns and cities as well as the wider countryside and coastline.
1.8 The main focus of the survey is on visits to the natural environment. By visits to the natural environment we mean time spent outdoors in the natural environment, away from home and private gardens.
1 Monitor of Engagement with the Natural Environment: Technical Report

1.9 The survey also includes a smaller section of questions regarding engagement with the
natural environment other than that experienced during visits. This includes activities such as time spent in private gardens, watching nature programmes on television and undertaking pro-environmental activities such as recycling.
Structure of the report 1.10 This technical report provides details of the methods used for MENE and the levels of
accuracy of the survey outputs. These appear under the following section headings:
Section 2: Data collection – covering the rationale for the survey approach, a description of the TNS in-home omnibus, sampling, questionnaire and interviewer training.
Section 3: Data analysis – covering data checking and coding, geocoding and the weighting and grossing of survey data.
Section 4: Levels of accuracy – the results of an analysis of the Complex Standard Errors associated the MENE data.
Appendices:
Appendix 1: MENE Questionnaire – including details of base, timing and additional notes
Appendix 2: Standard classification questions included in the TNS Omnibus
Appendix 3: Weighting targets
Appendix 4: Review of demographics used in weighting of results
2

2 Data collection 2.1 This section of the report describes the approach to data collection. Areas covered include
survey scoping and piloting, sampling approach, achieved sample size, questionnaire design and interviewer briefing.
Scoping stages and piloting 2.2 The methods used in MENE were developed through a scoping study undertaken in 2007.
The aim of the study was to identify the most appropriate survey methods to measure participation in visits to the natural environment amongst the English adult population.
2.3 It involved:
• Consultations with the organisations likely to be end users of a study of this type, to ensure that their information needs were taken into account.
• Qualitative research with members of the public to test their understanding of potential questionnaire wording options.
• Pilot surveys using online, telephone and face-to-face survey approaches, allowing a direct comparison of the results obtained using each method.
2.4 The study concluded that an in-home interview method was the most appropriate and that the inclusion of a series of questions on a weekly basis in a consumer omnibus survey would represent the most cost effective approach for a future study.
2.5 Undertaking interviewing using a face to face approach was recommended for a study of this type, as it would provide the best quality of data, with interviewers able to clarify points to respondents. This approach also facilitated the use of show prompts, such as lists of answer options.
2.6 Including the questions on every wave of a weekly omnibus survey meant that respondents could be asked about any visit they had taken during the last seven days, providing better quality data than if a longer recall period was used1. Also, the nationally representative sample obtained in every week of the survey allowed for the questionnaire to be split into modules with certain questions asked every week, some asked once a month and others asked less often or on a one off, ‘ad hoc’ basis.
2.7 Following the recommendations of the scoping study, data collection for the first year of MENE commenced with a pilot wave of fieldwork in February 2009, prior to the launch of the main survey period.
2.8 This pilot survey involved 1,763 interviews undertaken between 13th February 2009 and 17th February 2009 and allowed for final testing of the questionnaire. The purpose of this phase was to verify certain key elements of the survey approach including:
• Refining the definitions used in the survey including ‘a visit’, ‘the outdoors’ and ‘the natural environment’. This included agreeing the best ways to communicate these definitions to survey respondents and finalising the relevant introductory wording in the questionnaire.
1 A review of the 2002/03 Great Britain Day Visits Survey concluded that ‘a two week recall period is simply too long for respondents’ see Day Visits Quality Assurance, National Centre, 2004
3 Monitor of Engagement with the Natural Environment: Technical Report
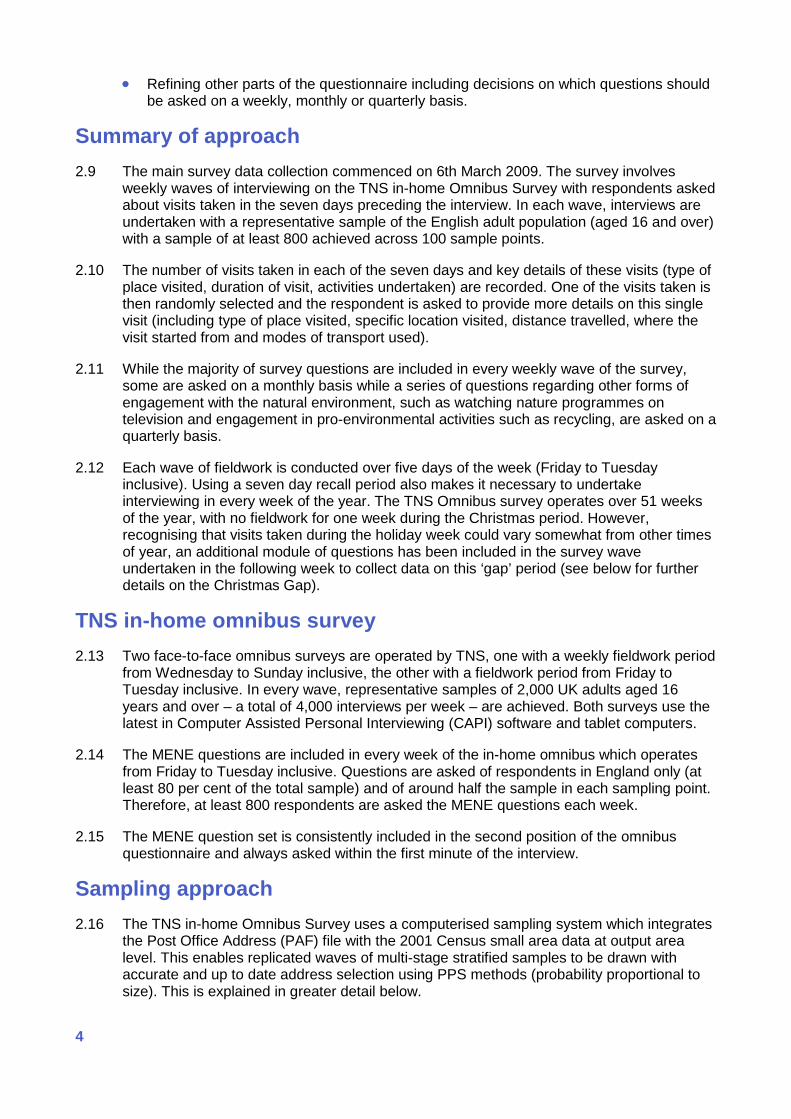
• Refining other parts of the questionnaire including decisions on which questions should
be asked on a weekly, monthly or quarterly basis.
Summary of approach 2.9 The main survey data collection commenced on 6th March 2009. The survey involves
weekly waves of interviewing on the TNS in-home Omnibus Survey with respondents asked about visits taken in the seven days preceding the interview. In each wave, interviews are undertaken with a representative sample of the English adult population (aged 16 and over) with a sample of at least 800 achieved across 100 sample points.
2.10 The number of visits taken in each of the seven days and key details of these visits (type of place visited, duration of visit, activities undertaken) are recorded. One of the visits taken is then randomly selected and the respondent is asked to provide more details on this single visit (including type of place visited, specific location visited, distance travelled, where the visit started from and modes of transport used).
2.11 While the majority of survey questions are included in every weekly wave of the survey, some are asked on a monthly basis while a series of questions regarding other forms of engagement with the natural environment, such as watching nature programmes on television and engagement in pro-environmental activities such as recycling, are asked on a quarterly basis.
2.12 Each wave of fieldwork is conducted over five days of the week (Friday to Tuesday inclusive). Using a seven day recall period also makes it necessary to undertake interviewing in every week of the year. The TNS Omnibus survey operates over 51 weeks of the year, with no fieldwork for one week during the Christmas period. However, recognising that visits taken during the holiday week could vary somewhat from other times of year, an additional module of questions has been included in the survey wave undertaken in the following week to collect data on this ‘gap’ period (see below for further details on the Christmas Gap).
TNS in-home omnibus survey 2.13 Two face-to-face omnibus surveys are operated by TNS, one with a weekly fieldwork period
from Wednesday to Sunday inclusive, the other with a fieldwork period from Friday to Tuesday inclusive. In every wave, representative samples of 2,000 UK adults aged 16 years and over – a total of 4,000 interviews per week – are achieved. Both surveys use the latest in Computer Assisted Personal Interviewing (CAPI) software and tablet computers.
2.14 The MENE questions are included in every week of the in-home omnibus which operates from Friday to Tuesday inclusive. Questions are asked of respondents in England only (at least 80 per cent of the total sample) and of around half the sample in each sampling point. Therefore, at least 800 respondents are asked the MENE questions each week.
2.15 The MENE question set is consistently included in the second position of the omnibus questionnaire and always asked within the first minute of the interview.
Sampling approach 2.16 The TNS in-home Omnibus Survey uses a computerised sampling system which integrates
the Post Office Address (PAF) file with the 2001 Census small area data at output area level. This enables replicated waves of multi-stage stratified samples to be drawn with accurate and up to date address selection using PPS methods (probability proportional to size). This is explained in greater detail below.
4

2.17 The TNS in-home Omnibus Survey has Random Location Sampling as its sampling basis
and a unique sampling system has been developed for this purpose. Utilising 2001 UK Census small area statistics and the Post Office Address File (PAF), Great Britain - south of the Caledonian Canal has been divided into 600 areas of equal population. From these 600 areas, a master sampling frame of 300 sample points has been selected to reflect the country’s geographical and socio-economic profile. The areas within each Standard Region are stratified into population density bands and within band, in descending order by percentage of the population in socio-economic Grade I and II.
2.18 To maximise the statistical accuracy of the sampling, sequential waves of fieldwork are allocated systematically across the sampling frame to ensure maximum geographical dispersion. The 300 primary sampling units are allocated to 12 sub-samples of 25 points each, with each sub-sample in itself being a representative drawing from the frame. For each wave of fieldwork, a set of sub-samples is selected in order to provide the number of sample points required (typically c. 139 for 2,000 interviews). Across sequential waves of fieldwork all sub-samples are systematically worked, thereby reducing the clustering effects on questionnaires asked for two or more consecutive weeks.
2.19 Each primary sampling unit is divided into two geographically distinct segments, both containing, as far as possible, equal populations. The segments comprise aggregations of complete postcode sectors. Within each half (known as the A and B halves) postcode sectors have been sorted by the percentage of the population in socio-economic groups I and II. One postcode sector from each primary sampling unit is selected for each survey wave, alternating on successive selections between the A and B halves of the primary sampling unit, again to reduce clustering effects. For each wave of interviewing, each interviewer is supplied with two blocks of 70 addresses, drawn from different parts of the sector.
2.20 To ensure a balanced sample of adults within the effective contacted addresses, a quota is set by sex (male, female housewife, female non-housewife); within the female housewife quota, presence of children and working status and within the male quota, working status. In each weekly wave of the survey, a target of 2,000 interviews is set and the survey data is weighted to ensure that the sample is representative of the UK population in terms of the standard demographic characteristics (see Section 3 for details of the bespoke weighting procedures used in MENE).
2.21 In each weekly wave, at least 1,600 interviews are undertaken in England. The MENE survey is included within a half sample of the English element of the survey, generating at least 800 interviews per week across at least 100 sample points. The half sample is obtained by automatically asking the questions of every other respondent included in an interviewing shift.
2.22 Within each sample point, only one interview is undertaken per household and a minimum of three households is left between each successful interview. As the MENE questions are asked in every other interview, this interval is increased to at least six households. This procedure ensures that interviewing in each sample point is not restricted to a small geographic area containing individuals with similar demographic and lifestyle characteristics thereby further minimising the effects of clustering within the sample.
Sample sizes achieved 2.23 The total samples of respondents and visits asked about in each of the four years of
surveying and in total, including the Christmas gap additional survey wave are shown in Table 2-1 below.
5 Monitor of Engagement with the Natural Environment: Technical Report
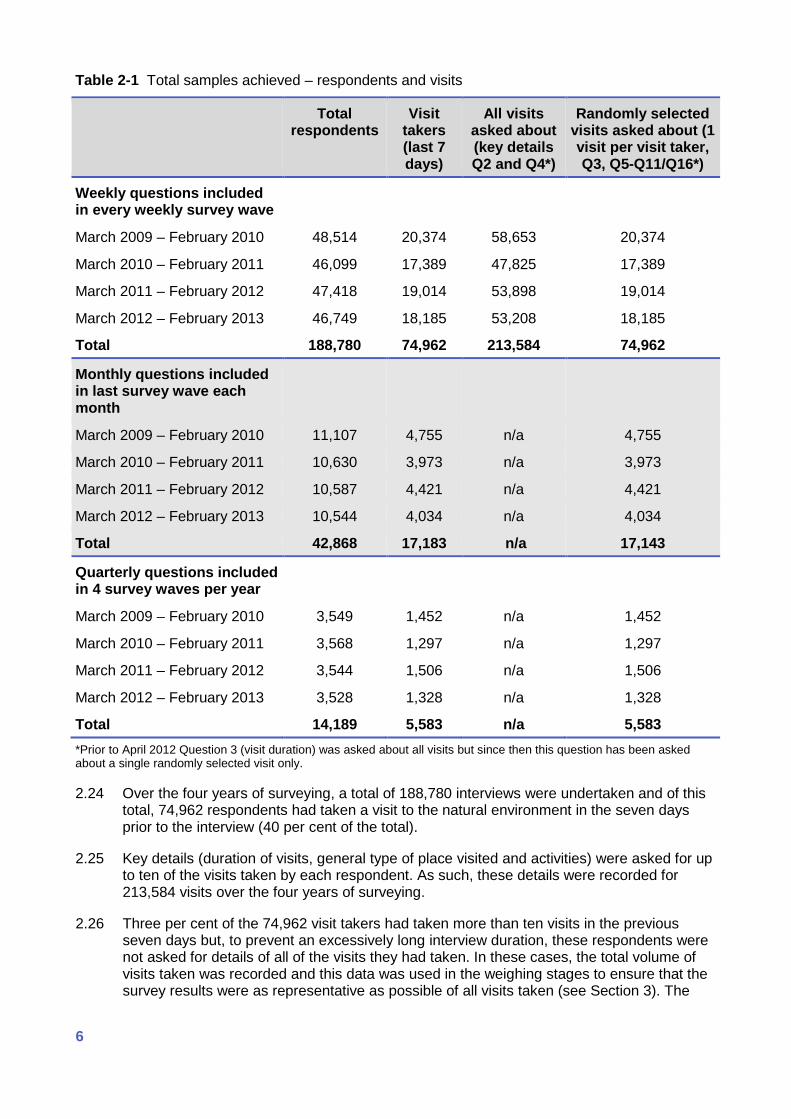
Table 2-1 Total samples achieved – respondents and visits
Total respondents
Visit takers (last 7 days)
All visits asked about (key details Q2 and Q4*)
Randomly selected visits asked about (1 visit per visit taker, Q3, Q5-Q11/Q16*)
Weekly questions included in every weekly survey wave
March 2009 – February 2010 48,514 20,374 58,653 20,374
March 2010 – February 2011 46,099 17,389 47,825 17,389
March 2011 – February 2012 47,418 19,014 53,898 19,014
March 2012 – February 2013 46,749 18,185 53,208 18,185
Total 188,780 74,962 213,584 74,962
Monthly questions included in last survey wave each month
March 2009 – February 2010 11,107 4,755 n/a 4,755
March 2010 – February 2011 10,630 3,973 n/a 3,973
March 2011 – February 2012 10,587 4,421 n/a 4,421
March 2012 – February 2013 10,544 4,034 n/a 4,034
Total 42,868 17,183 n/a 17,143
Quarterly questions included in 4 survey waves per year
March 2009 – February 2010 3,549 1,452 n/a 1,452
March 2010 – February 2011 3,568 1,297 n/a 1,297
March 2011 – February 2012 3,544 1,506 n/a 1,506
March 2012 – February 2013 3,528 1,328 n/a 1,328
Total 14,189 5,583 n/a 5,583 *Prior to April 2012 Question 3 (visit duration) was asked about all visits but since then this question has been asked about a single randomly selected visit only.
2.24 Over the four years of surveying, a total of 188,780 interviews were undertaken and of this total, 74,962 respondents had taken a visit to the natural environment in the seven days prior to the interview (40 per cent of the total).
2.25 Key details (duration of visits, general type of place visited and activities) were asked for up to ten of the visits taken by each respondent. As such, these details were recorded for 213,584 visits over the four years of surveying.
2.26 Three per cent of the 74,962 visit takers had taken more than ten visits in the previous seven days but, to prevent an excessively long interview duration, these respondents were not asked for details of all of the visits they had taken. In these cases, the total volume of visits taken was recorded and this data was used in the weighing stages to ensure that the survey results were as representative as possible of all visits taken (see Section 3). The
6

213,584 visits for which details have been recorded represents 94 per cent of the total number of 227,511 taken by respondents during the survey period.
2.27 Each visit-taking respondent was asked to provide further information on one of the visits they had taken (the visit is automatically selected at random by the CAPI script). As such over the four years of surveying, further details were collected for a total of 74,962 visits.
2.28 As described in more detail below, while most questions were asked every week, certain questions were only asked in the last week of each month while others were asked once a quarter. Table 2-1 illustrates the respondent and visit base sizes for these question modules.
Sample sizes by region and groups of interest
2.29 Table 2-2 overleaf illustrates the respondent and visit sample sizes achieved in each year of surveying and overall by region and for certain key demographic groups of interest to Natural England.
7 Monitor of Engagement with the Natural Environment: Technical Report
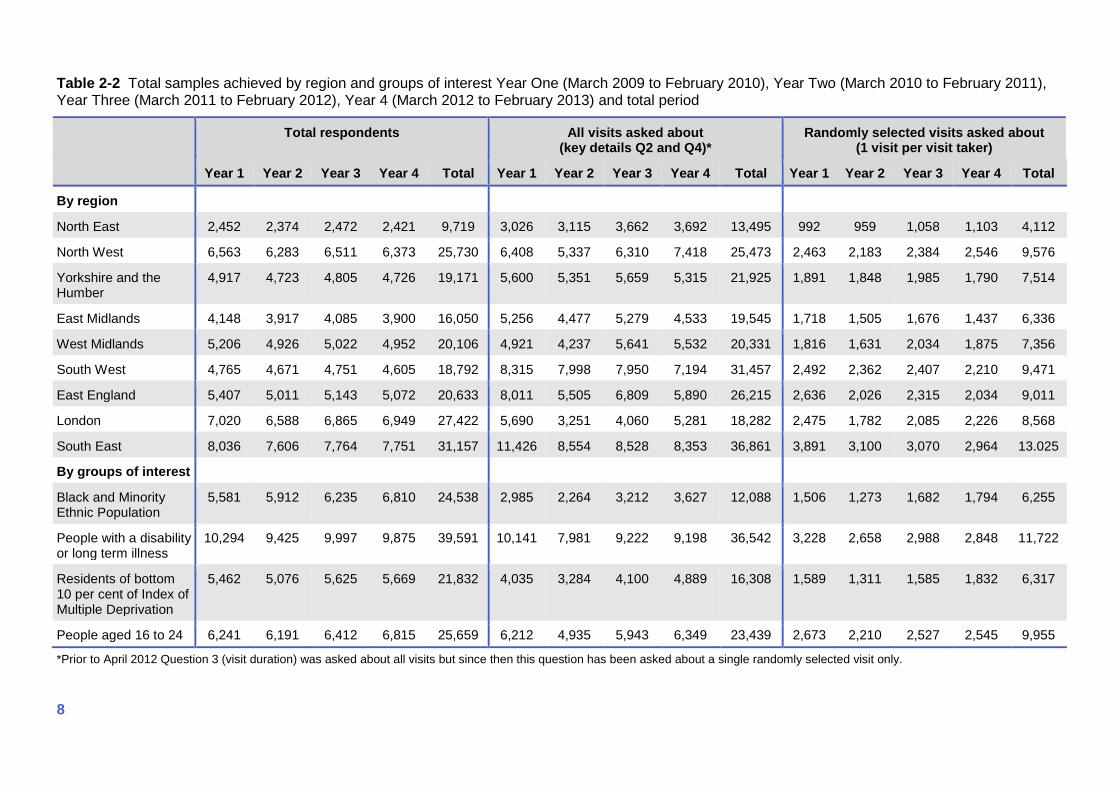
Table 2-2 Total samples achieved by region and groups of interest Year One (March 2009 to February 2010), Year Two (March 2010 to February 2011), Year Three (March 2011 to February 2012), Year 4 (March 2012 to February 2013) and total period
Total respondents All visits asked about (key details Q2 and Q4)*
Randomly selected visits asked about (1 visit per visit taker)
Year 1 Year 2 Year 3 Year 4 Total Year 1 Year 2 Year 3 Year 4 Total Year 1 Year 2 Year 3 Year 4 Total
By region
North East 2,452 2,374 2,472 2,421 9,719 3,026 3,115 3,662 3,692 13,495 992 959 1,058 1,103 4,112
North West 6,563 6,283 6,511 6,373 25,730 6,408 5,337 6,310 7,418 25,473 2,463 2,183 2,384 2,546 9,576
Yorkshire and the Humber
4,917 4,723 4,805 4,726 19,171 5,600 5,351 5,659 5,315 21,925 1,891 1,848 1,985 1,790 7,514
East Midlands 4,148 3,917 4,085 3,900 16,050 5,256 4,477 5,279 4,533 19,545 1,718 1,505 1,676 1,437 6,336
West Midlands 5,206 4,926 5,022 4,952 20,106 4,921 4,237 5,641 5,532 20,331 1,816 1,631 2,034 1,875 7,356
South West 4,765 4,671 4,751 4,605 18,792 8,315 7,998 7,950 7,194 31,457 2,492 2,362 2,407 2,210 9,471
East England 5,407 5,011 5,143 5,072 20,633 8,011 5,505 6,809 5,890 26,215 2,636 2,026 2,315 2,034 9,011
London 7,020 6,588 6,865 6,949 27,422 5,690 3,251 4,060 5,281 18,282 2,475 1,782 2,085 2,226 8,568
South East 8,036 7,606 7,764 7,751 31,157 11,426 8,554 8,528 8,353 36,861 3,891 3,100 3,070 2,964 13.025
By groups of interest
Black and Minority Ethnic Population
5,581 5,912 6,235 6,810 24,538 2,985 2,264 3,212 3,627 12,088 1,506 1,273 1,682 1,794 6,255
People with a disability or long term illness
10,294 9,425 9,997 9,875 39,591 10,141 7,981 9,222 9,198 36,542 3,228 2,658 2,988 2,848 11,722
Residents of bottom 10 per cent of Index of Multiple Deprivation
5,462 5,076 5,625 5,669 21,832 4,035 3,284 4,100 4,889 16,308 1,589 1,311 1,585 1,832 6,317
People aged 16 to 24 6,241 6,191 6,412 6,815 25,659 6,212 4,935 5,943 6,349 23,439 2,673 2,210 2,527 2,545 9,955
*Prior to April 2012 Question 3 (visit duration) was asked about all visits but since then this question has been asked about a single randomly selected visit only.
8

Questionnaire design 2.30 The MENE questionnaire was divided into a series of modules with certain questions
included in every weekly survey wave while others were included in one survey wave per month or once every three months. Table 2-3 details the question areas included at each level of frequency and the base of respondents asked each question. A copy of the questionnaire is provided in Appendix 1.
Table 2-3 Questionnaire topics and frequency of inclusion in survey fieldwork
Questions included in every weekly survey wave.
Questions asked in 1 survey wave per month. Included during last week of each month.
Questions asked in 4 survey waves. Included during last week of June 2009, May 2010 and 2012, August 2009 to 2012, November 2009 to 2012, February 2010 to 2013.
Question asked of all respondents Q1 – Volume of visits per day over last 7 days
Questions asked of visit takers regarding all visits taken (up to a maximum of 10 visits) Q2 – Type of place visited (general) Q4 – Activities undertaken
Questions asked of visit takers regarding single randomly selected visit only Q3 – Visit duration* Q5 – Type of place visited (specific) Q6 – Village/town/city visited Q7 – Name of actual place visited or details of location if no name Q8 – Distance travelled to place visited Q9/10 – Where journey started from Q11 – Mode of transport used Q12 – Reasons for visit**
Profile questions asked of all respondents Q19 – Access to car Q20 – Dog ownership Q21 – Frequency of undertaking exercise Q22 – Disability and long term illness
Questions asked of visit takers regarding single randomly selected visit only Q13 – Party composition Q14 – Whether a dog/dogs were taken on visit Q15/16 – Expenditure during visit
Visit participation question asked of all respondents Q17 – Frequency of visits during last 12 months
Barriers question asked of respondents who normally take visits less than once a month Q18 – Barriers to visits during last 12 months
Question asked of visit takers regarding single randomly selected visit only E1 – Outcomes of visit
Environmental attitudes and behaviours questions asked of all respondents E2 – Attitudes to environment E3 – Activities in the natural environment E4 – Pro-environmental activities E5 – Changes in lifestyle
*Prior to April 2012 Question 3 (visit duration) was asked about all visits but since then this question has been asked about a single randomly selected visit only. **Prior to April 2012 Question 12 was included in the survey in a single monthly wave but since then has been included in every weekly wave.
9 Monitor of Engagement with the Natural Environment: Technical Report

2.31 The approach followed involved respondents firstly being asked about the volume of visits
taken in each of the seven days preceding the interview (Q1). Key details of up to ten of these visits were then recorded (Q2 type of place visited and Q4 activities undertaken since April 2013 and, prior to this date, Q3 duration of visit). In practice, the vast majority of respondents had taken ten or less visits (97 per cent of respondents in all four years of surveying).
2.32 If more than one visit had been taken in the last seven days (22 per cent of respondents in year 4), one of the visits was randomly selected as the basis for further questions. This approach ensured that there was no bias in the visit selection and the CAPI software was used to automatically make the random selection of one of the visits taken by each respondent.
2.33 In each wave, the questionnaire also contained profiling questions which were asked of all respondents regarding access to a car, dog ownership, frequency of undertaking exercise and disabilities and long term illnesses. These are in addition to the classification questions included as standard in the TNS in-home Omnibus Survey. In addition, the following data was collected for all respondents (also see Appendix 2):
• Age; • Sex; • Socio-economic status (A, B, C1, C2, D and E groups); • Working status; • Marital status; • Children in home/ life stage (for example, Young Independents, Family, Empty Nester); • Region of residence; • Full home postcode (available for all respondents, used for Index of Multiple
Deprivation, urban – rural classification and other classifications); • Ethnicity; • Internet access and usage; and • Housing tenure.
2.34 Other questions are asked of all respondents once a month about their normal frequency of visit taking and (if less than once a month), barriers to participation. In each quarter, other questions are asked of all respondents regarding other forms of engagement with the natural environment, attitudes to the environment and pro-environmental behaviours.
A seven day recall period 2.35 Evaluations of previous studies undertaken for Natural England and its predecessors have
recognised there is trade-off between the recall period people are asked to consider, and the number of visits that can be recorded within the interview.
2.36 In the 2002 Great Britain Day Visits Survey (GBDVS), respondents were asked about visits taken during the two weeks before the interview. An independent review of the results, undertaken by the National Centre for Social Research in 20042, found that respondents were likely to have a higher level of recall of trips taken in the seven days immediately prior to the interview than for the preceding seven days. This issue related particularly to shorter, more regularly taken visits, which were less likely to be recalled for the earlier period. Given the conclusions of this review and experience in other surveys of participation, it was
2 Day Visits Quality Assurance, National Centre, 2004
10

decided that a seven day recall period provided the best approach for MENE, collecting accurate data for a large base of visits.
2.37 Ensuring the accurate collection of data on all of the visits taken on every day in the recall period was a priority at the questionnaire design stage and an area covered extensively in the interviewer briefings.
Communicating the survey scope 2.38 Reflecting the survey aims, the main focus of MENE is on time spent in the natural
environment for leisure purposes. However, unlike previous surveys, MENE collects details of both visits to the natural environment such as on days out to the coast and countryside and more routine trips taken close to home for purposes such as dog walking or exercise - including those taken in urban green spaces. Whilst previous studies including the 2005 England Leisure Visits Survey are likely to have under-represented close to home visits to the natural environment, significant efforts have been made to ensure that MENE records the full spectrum of recreation in the natural environment undertaken by adults in England.
2.39 The outcomes of the aforementioned scoping study informed the wording of the introductory text used in MENE, as shown in Figure 2-1. The wording used aims to ensure that survey respondents are clear that participation in activities in both urban and rural locations are of interest and that there is no upper or lower time limit on the duration of the visit. Respondents are informed that routine shopping trips and time spent in the garden are not included in the definition of a visit. Interviewers are also provided with further guidance to provide to respondents who may be uncertain of what is and is not included within the definition of a visit.
Figure 2-1 Introduction to MENE interview
Interviewer briefings 2.40 It is particularly important that interviewers who undertake the MENE fieldwork are clear
regarding key areas such as the definition of a visit and the level of detail to be recorded in questions regarding destinations visited, visit start points and visit expenditure.
2.41 Therefore, interviewer briefings have been undertaken by means of the following channels:
• Written instructions displayed to interviewers via their CAPI machine. These must be read prior to commencing every interviewing shift and can be referred to at any time during the interview.
• A video ‘pod cast’ provided on a DVD to all interviewers who work on the survey. This short training video communicates key points regarding the survey scope and the importance of collecting the correct data regarding visit destinations and start points and expenditure.
Now I am going to ask you about occasions in the last week when you spent your time out of doors. By out of doors we mean open spaces in and around towns and cities, including parks, canals and nature areas; the coast and beaches; and the countryside including farmland, woodland, hills and rivers. This could be anything from a few minutes to all day. It may include time spent close to your home or workplace, further afield or while on holiday in England. However this does not include: - routine shopping trips or; - time spent in your own garden.
11 Monitor of Engagement with the Natural Environment: Technical Report

• Presentations in March 2009, March 2010, October 2010, October 2011 and November
2012 to regional fieldwork supervisors outlining the survey objectives and the importance of their interviewing teams following the instructions with a focus on the key areas mentioned above. Also, articles in the newsletter which is distributed to interviewers updating them on the survey progress, reinforcing the key areas to focus on in the interview.
2.42 Also, interviewers are periodically sent feedback forms inviting them to comment on the questionnaire design and any issues from both the interviewer’s and respondent’s perspectives.
Christmas gap 2.43 Fieldwork for the TNS in-home omnibus takes place from Friday to Tuesday every week
with the exception of the Christmas period when no interviewing is undertaken (25th to 29th December 2009, 24th to 28th December 2010, 23rd to 27th December 2011 and 21st to 25th December 2012).
2.44 As MENE records details of visits taken during the seven days prior to interview, this gap in fieldwork coverage meant that full data could not collected through the normal survey process for the preceding periods (i.e. 18th to 28th December 2009, 17th to 27th December 2010 and 16th to 26th December 2011, 14th to 24th December 2012).
2.45 It was anticipated that, given the timing of this gap in the fieldwork, the volume and characteristics of visit taking could differ from other periods. As such, it was important to find a way to collect data for this period whilst recognising that it was not viable to continue normal interviewing over the Christmas weekend.
2.46 The solution was to undertake additional interviewing during the omnibus waves immediately following Christmas. The half of the English sample who were not asked the normal MENE questions, were asked a similar series of questions regarding the visits they had taken in the period between 14 days and eight days prior to the interview date.
2.47 Questions identical to those normally asked regarding the previous seven days were asked of this sample, the only difference being the period asked about and the addition of extra prompts to ensure that respondents were clear about the days for which they were being asked about. Given the aforementioned issues regarding poor recall of visits taken more than seven days prior to interview, additional efforts were made to ensure that respondents were prompted to recall the correct day and also given adequate time to consider their responses. The ‘special’ nature of the period being asked about was used with respondents given prompts such as ‘this was the day before Christmas Day’ to remind them of what they had done during each of the seven days within the survey period.
2.48 A total of 846 interviews were undertaken for this exercise in Year One, 839 were undertaken in Year Two, 870 were undertaken in Year Three and 935 in Year Four. The results of these interviews were reviewed and have been integrated into the main monthly, quarterly and annual datasets.
Strengths of the survey data 2.49 Face to face interviews provide the best quality of data. The MENE data is collected
through face to face personal interviews conducted in the respondent’s home. The presence of the interviewer allows clear communication of requirements and the opportunity for the respondent to clarify points. The face to face approach also allows for the use of prompt materials to facilitate the interview (for example, lists of answer options to be read
12

from). Also, the in-home approach allows for longer interview durations than the alternative telephone approach.
2.50 Consistency of weekly sampling. The MENE question set is included on the weekly in-home TNS omnibus survey. This longstanding omnibus survey uses quota sampling approaches to provide a sample representative of the UK population on the basis of a number of demographic criteria including sex, age, working status, and car ownership. Target weekly sample sizes are consistently achieved, providing a robust basis for tracking the key survey measures.
2.51 Short recall period. MENE respondents are asked to provide specific details of visits to the natural environment taken in the seven days before the interview. This relatively short recall period has been proven to provide more accurate information on the volume and characteristics of visits taken than asking respondents to comment on visits taken over a longer period (for example, last fortnight or month).
2.52 Survey scope. MENE is the largest survey of its type. It collects information about visits to the natural environment. This includes the type of destination, the duration of the visit, mode of transport, distance travelled, expenditure, main activities and motivations and barriers to visiting. The survey also collects information about other ways that people engage with the natural environment, such as watching wildlife and volunteering. In addition there are a range of questions on health and wellbeing, and other environmental topics such as pro-environmental behaviors and awareness of biodiversity issues.
Limitations of the survey data 2.53 Quota sampling approach. MENE uses a sampling approach which involves the weekly
selection of around 100 interviewing locations (sampling points) throughout England. In each of these locations interviewers find and interview a sample of respondents meeting demographic quota targets which reflect the wider population. This approach could under represent those types of people less likely to be available when fieldwork is undertaken, including regular recreation participants who are generally less likely to be at home. To reduce this potential bias interviewing is conducted on a range of times of day and days of the week.
2.54 Geographical clustering. The sampling approach used in MENE results in geographical clustering of respondents i.e. the weekly sample of 800 is focused on 100 locations rather than evenly distributed across England. As people who live in a neighbourhood tend to have similar demographics and lifestyles, this clustering of the sample can have an impact on the overall accuracy of results. To minimise this effect in each sample point, only one interview is undertaken per household and a minimum of six households is left between each successful interview.
2.55 English language interviewing. As all MENE interviews are conducted in English, the survey will under represent those people who do not speak English. Also the face-to-face interview approach means that people who find it difficult to communicate on this basis will be under represented in the sample (for example, deaf or with learning difficulties).
2.56 Geocoding success. In MENE all respondents who have taken a visit to the Natural Environment in the previous seven days are asked to provide details of the final visit destination. This information is used to source a geocode for the destination, identifying the specific visit destination. In around a fifth of cases it is not possible to allocate a geocode to the destination due to a lack of detail in the response provided in the interview.
13 Monitor of Engagement with the Natural Environment: Technical Report

3 Data analysis 3.1 This section of the report describes the approach followed to check, code and analyse the
data following its collection. Areas covered include the coding of standard survey responses, geocoding, weighting and grossing procedures.
Data checking and coding of ‘other’ responses 3.2 The CAPI (Computer Assisted Personal Interviewing) approach allows for checks on the
validity of the data to be incorporated into the script programming and conducted ‘live’ in the course of the interview. For MENE this includes a check at Question 1 where the interviewer is prompted to ‘double check’ if a respondent claims to have taken five or more natural environment visits in a single day.
3.3 While the MENE questionnaire does not include any fully open-ended questions, a number of questions provide an ‘other’ option which, if selected, requires the interviewer to record a response by handwriting this on their CAPI machine screen so that it can be digitally recorded. Following the interview, these responses are then reviewed and either ‘back coded’ to one of the existing answer options, if any are appropriate, or allocated a new code so that they can be included within the subsequent data analysis. This coding is undertaken for the ‘other’ responses to the following questions:
• Question 4 – Activities undertaken; • Question 5 – Type of place visited (specific); • Question 11 – Mode of transport used; • Question 12 – Reasons for visit; and • Question 18 – Barriers to visits during last 12 months.
Destination geocoding 3.4 Respondents are asked the following two questions about the location of the main
destination of their visit. These questions are asked only of the single, randomly selected visit:
• Question 6 - “What is the name of the city, town or village or nearest city, town or village to the place you visited?”
• Question 7 - “Now please provide the name of the actual place you visited, for example the park, wood or canal.”
3.5 At Question 6, a Gazetteer which contains the names of all of England’s cities, towns and villages is used. Around 21,000 places are included in this Gazetteer. The interviewer selects the place named by the respondent from this list and it is then possible to analyse responses at a range of geographical levels including region, County or Local Authority. Following this approach, over the four years of fieldwork, 73,130 of the 74,962 visits recorded were ‘allocated’ to a city, town or village (98 per cent).
3.6 At Question 7, a place name Gazetteer containing details of places which could be the main destination of visits to the natural environment is used. This Gazetteer was compiled on the basis of a number of existing sources provided to TNS by Natural England including the Ordnance Survey 1: 50,000 Scale Gazetteer, and listings of designated areas and other potential outdoor recreation sites including Open Access Land, woodland and allotments. As well as place names, the Gazetteer contains location details in terms of six figure
14
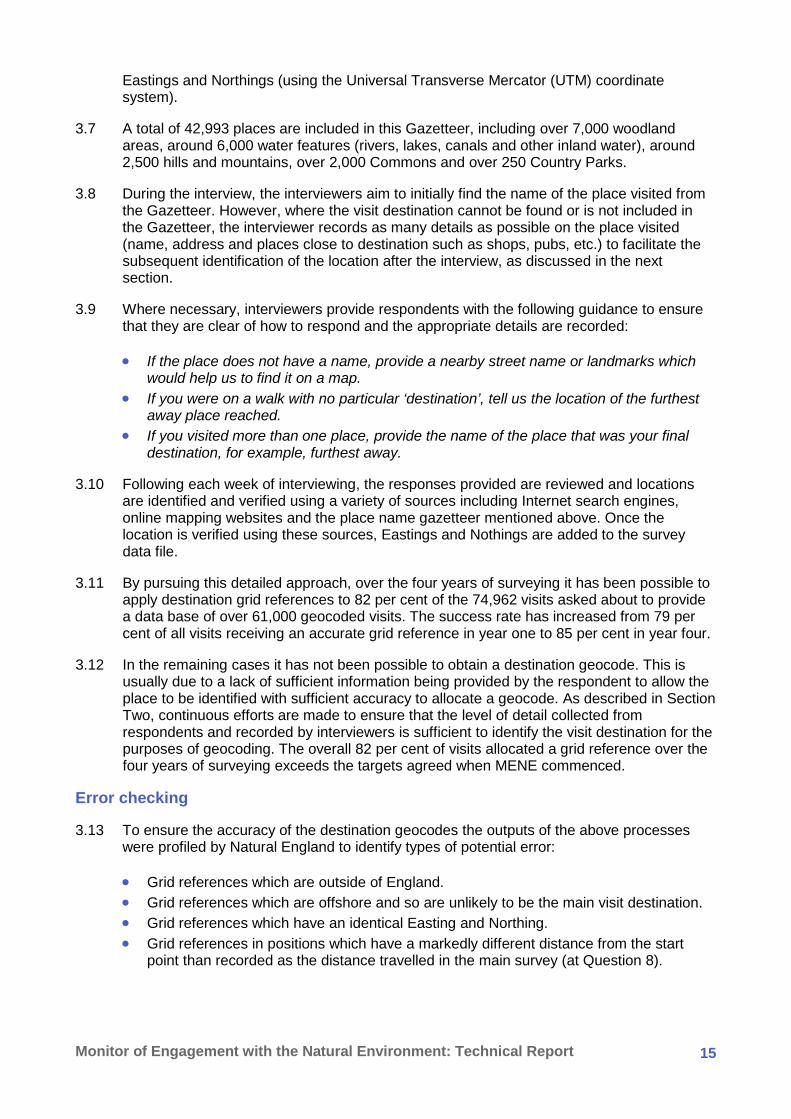
Eastings and Northings (using the Universal Transverse Mercator (UTM) coordinate system).
3.7 A total of 42,993 places are included in this Gazetteer, including over 7,000 woodland areas, around 6,000 water features (rivers, lakes, canals and other inland water), around 2,500 hills and mountains, over 2,000 Commons and over 250 Country Parks.
3.8 During the interview, the interviewers aim to initially find the name of the place visited from the Gazetteer. However, where the visit destination cannot be found or is not included in the Gazetteer, the interviewer records as many details as possible on the place visited (name, address and places close to destination such as shops, pubs, etc.) to facilitate the subsequent identification of the location after the interview, as discussed in the next section.
3.9 Where necessary, interviewers provide respondents with the following guidance to ensure that they are clear of how to respond and the appropriate details are recorded:
• If the place does not have a name, provide a nearby street name or landmarks which would help us to find it on a map.
• If you were on a walk with no particular ‘destination’, tell us the location of the furthest away place reached.
• If you visited more than one place, provide the name of the place that was your final destination, for example, furthest away.
3.10 Following each week of interviewing, the responses provided are reviewed and locations are identified and verified using a variety of sources including Internet search engines, online mapping websites and the place name gazetteer mentioned above. Once the location is verified using these sources, Eastings and Nothings are added to the survey data file.
3.11 By pursuing this detailed approach, over the four years of surveying it has been possible to apply destination grid references to 82 per cent of the 74,962 visits asked about to provide a data base of over 61,000 geocoded visits. The success rate has increased from 79 per cent of all visits receiving an accurate grid reference in year one to 85 per cent in year four.
3.12 In the remaining cases it has not been possible to obtain a destination geocode. This is usually due to a lack of sufficient information being provided by the respondent to allow the place to be identified with sufficient accuracy to allocate a geocode. As described in Section Two, continuous efforts are made to ensure that the level of detail collected from respondents and recorded by interviewers is sufficient to identify the visit destination for the purposes of geocoding. The overall 82 per cent of visits allocated a grid reference over the four years of surveying exceeds the targets agreed when MENE commenced.
Error checking
3.13 To ensure the accuracy of the destination geocodes the outputs of the above processes were profiled by Natural England to identify types of potential error:
• Grid references which are outside of England. • Grid references which are offshore and so are unlikely to be the main visit destination. • Grid references which have an identical Easting and Northing. • Grid references in positions which have a markedly different distance from the start
point than recorded as the distance travelled in the main survey (at Question 8).
15 Monitor of Engagement with the Natural Environment: Technical Report
3.14 These checks have been undertaken annually with potential errors flagged and checked.
Where necessary data has then been corrected and further checks have been added at the data collection and coding stages to reduce the incidence of these types of error.
Start point geocoding 3.15 In addition to the identification of the position of visit destinations, efforts have been made
to identify the location of visit start points.
3.16 For the majority of visits taken (95 per cent in Year One, 91 per cent in Year Two and 94 per cent in Years Three and Four) the start point was the survey respondent’s home. In the vast majority of these cases (86 per cent in Year One and 99 per cent in Years Two, Three and Four), the address and full postcode included in the survey sample file has been used to identify the Easting and Northing of this point. This is done by matching the respondent’s address to the corresponding record in OS Address Layer.
3.17 For a very small proportion of addresses, it has not been possible to obtain a precise grid reference for the address, usually because the format of the address in the sample file varied significantly from that used in the OS Address Layer file.
3.18 In Year Four, six per cent of visits started from a point other than the respondent’s home (five per cent in Year One, nine per cent in Year Two, six per cent in Year Three). In these cases, the survey respondent was asked to specify the address and postcode of the start point or, if they did not know these details, to provide other information which could then be used to identify the address. OS Address Layer was then used to obtain an Easting and Northing for this point.
3.19 Following this approach it was possible to obtain a grid reference for 36 per cent of visit start points which were not the respondent’s home in Year One, 24 per cent in Year Two, 56 per cent in Year Three and 30 per cent in Year Four. It was not possible to obtain a geocode for the remaining visits as insufficient information was provided by the respondent to allow for the point to be accurately identified. Recording more detailed information regarding start points other than home is a priority in the ongoing survey and a focus of interviewer briefings (see Section 2).
3.20 Therefore, in total, during the fourth year of interviewing, it has been possible to obtain a start point grid reference for 95 per cent of the visits recorded.
Weighting and grossing up of the survey data 3.21 This section provides details of the approaches taken to weight and gross up the MENE
data. The outputs of this process are estimates of the total volume of visits taken to the natural environment by the English adult population and results representative of the adult population and the visits they have taken over the study period.
3.22 Reviews of these procedures were undertaken following the first six months of data collection and again after 12 months. The results of this more recent review of the Year One data are provided later in this section.
Weighting and grossing procedures
A) Questions asked every week 3.23 Monthly data is based on the results of survey weeks which fell entirely or mainly within the
reporting month. As such, monthly outputs for the four years of surveying were based on the following periods (week numbers shown are weeks of the year).
16
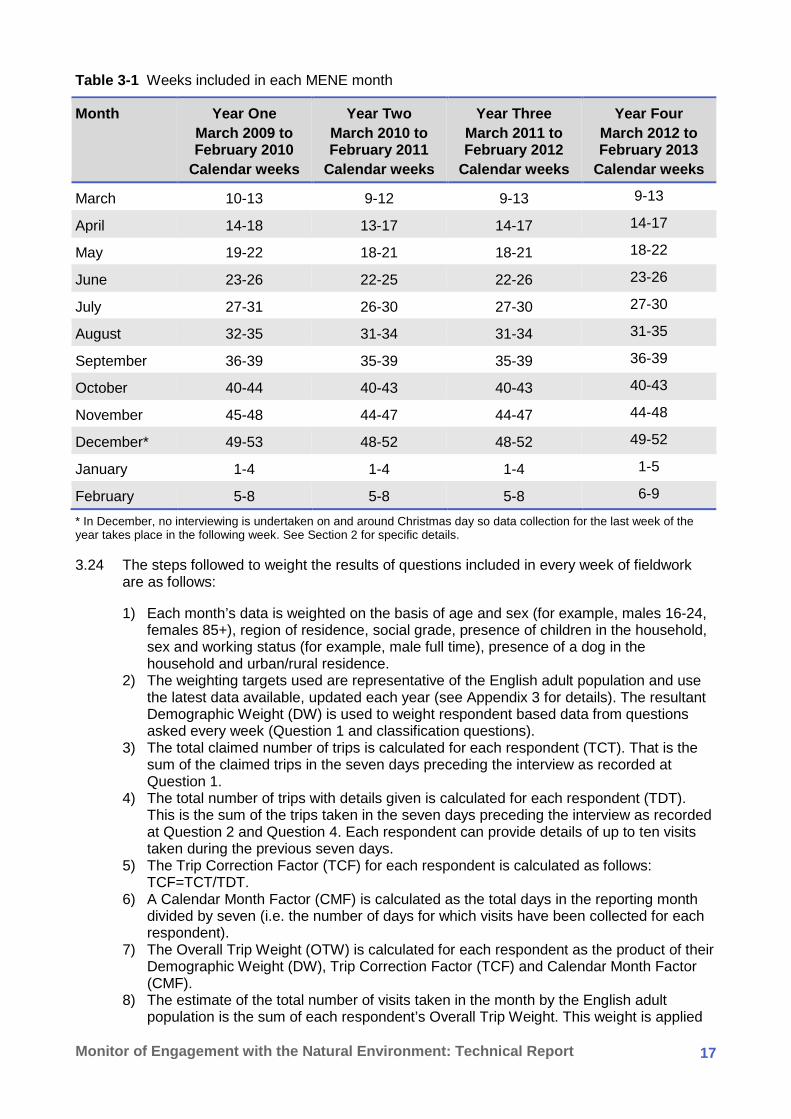
Table 3-1 Weeks included in each MENE month
Month Year One March 2009 to February 2010
Calendar weeks
Year Two March 2010 to February 2011
Calendar weeks
Year Three March 2011 to February 2012
Calendar weeks
Year Four March 2012 to February 2013
Calendar weeks
March 10-13 9-12 9-13 9-13
April 14-18 13-17 14-17 14-17
May 19-22 18-21 18-21 18-22
June 23-26 22-25 22-26 23-26
July 27-31 26-30 27-30 27-30
August 32-35 31-34 31-34 31-35
September 36-39 35-39 35-39 36-39
October 40-44 40-43 40-43 40-43
November 45-48 44-47 44-47 44-48
December* 49-53 48-52 48-52 49-52
January 1-4 1-4 1-4 1-5
February 5-8 5-8 5-8 6-9
* In December, no interviewing is undertaken on and around Christmas day so data collection for the last week of the year takes place in the following week. See Section 2 for specific details.
3.24 The steps followed to weight the results of questions included in every week of fieldwork are as follows:
1) Each month’s data is weighted on the basis of age and sex (for example, males 16-24, females 85+), region of residence, social grade, presence of children in the household, sex and working status (for example, male full time), presence of a dog in the household and urban/rural residence.
2) The weighting targets used are representative of the English adult population and use the latest data available, updated each year (see Appendix 3 for details). The resultant Demographic Weight (DW) is used to weight respondent based data from questions asked every week (Question 1 and classification questions).
3) The total claimed number of trips is calculated for each respondent (TCT). That is the sum of the claimed trips in the seven days preceding the interview as recorded at Question 1.
4) The total number of trips with details given is calculated for each respondent (TDT). This is the sum of the trips taken in the seven days preceding the interview as recorded at Question 2 and Question 4. Each respondent can provide details of up to ten visits taken during the previous seven days.
5) The Trip Correction Factor (TCF) for each respondent is calculated as follows: TCF=TCT/TDT.
6) A Calendar Month Factor (CMF) is calculated as the total days in the reporting month divided by seven (i.e. the number of days for which visits have been collected for each respondent).
7) The Overall Trip Weight (OTW) is calculated for each respondent as the product of their Demographic Weight (DW), Trip Correction Factor (TCF) and Calendar Month Factor (CMF).
8) The estimate of the total number of visits taken in the month by the English adult population is the sum of each respondent’s Overall Trip Weight. This weight is applied
17 Monitor of Engagement with the Natural Environment: Technical Report

to visit based results which are collected for up to ten visits taken in the last seven days at Question 2 and Question 4.
9) A Randomly Selected Trip Weight is calculated for each respondent as the product of their Demographic Weight (DW), Total Claimed Trips (TCT) and the Calendar Month Factor (CMF). This weight is applied to visit based results which are collected for a single randomly selected visit from Question 5 to Question 12 (and Question 3 since April 2012).
B) Questions asked once a month and once a quarter 3.25 The steps followed to weight the results of questions which are included in one wave of
fieldwork per month or one wave of fieldwork every three months are as follows:
1) Questions asked once a month and once a quarter are only included in quarterly tables with results based on the March to May, June to August, September to November and December to February periods.
2) For each of the quarterly periods, the combined three months’ sample (for example, March, April and May) is weighted to the same demographic targets as the monthly data. This Quarterly Demographic Weight (QDW) is used to weight respondent based data from questions asked once a month or once a quarter.
3) A Quarter Factor (QF) is calculated as the number of days in the quarter divided by seven.
4) The Initial Quarterly Weights (IQW) to be applied to the monthly questions is then calculated for each respondent as the product of their Quarterly Demographic Weight (QDW), the Quarter Factor (QF) and their Total Claimed Trips (TCT).
5) An estimate of the total trips made in the quarter is calculated as a sum of the Initial Quarterly Weights. This sum will differ from the sum of the total trips in the quarter produced from the analysis of data collected every week (i.e. as described in bullet 8 above).
6) It is therefore necessary to calculate a Processing Correction (PC) as the estimate of trips taken in the quarter as estimated in the analysis of data collected every week divided by the estimate obtained in bullet 5 above.
7) The Final Quarterly Weight (FQW) for each individual is calculated as their IQW x PC. This weight is applied to visit based results which are collected on a monthly basis for a single randomly selected visit from Question 13 to Question 16 (and question 12 prior to April 2013).
3.26 In summary the following outputs are produced by undertaking the above weighting processes:
• Estimates of the total volume of visits taken by the English adult population during each month – this is the sum of every respondent’s Overall Trip Weight which takes account of the volume of adults resident in England (through the Demographic Weight), the number of visits taken by each respondent in the previous seven days (Total Claimed Trips) and the number of days in the month (through the Calendar Month Factor). The monthly estimates of visits are added together to obtain estimates of visits for longer periods.
• Results which relate to the English adult population such as percentages of the population taking visits at a certain level of frequency. These ‘respondent based’ results are produced for Question 1 (number of visits in last 7 days), Question 17 (normal frequency of visits in last 12 months), Question 18 (reasons for not taking visits) and all of the demographic classification questions. These results are obtained by applying the Demographic Weight.
• Results which relate to visits taken by English adult population such as the percentages of all visits involving a certain activity or taken to a particular type of place. These ‘visit based’ results are produced for Questions 2 and 4 for all of the visits
18
taken by respondents (up to a maximum of ten per respondent) and for Questions 3 and 5 to 16 for questions asked about a single randomly selected visit. These results are obtained by applying the Overall Trip Weight to questions 2 and 4, Randomly Selected Trip Weight to questions 5 to 12 which are asked every week and Final Quarterly Weight to questions are asked monthly or quarterly.
3.27 The MENE Annual Reports include an estimate of total expenditure during visits to the natural environment. This estimate is obtained by multiplying the estimate of total visits taken by the mean expenditure per visit (i.e. as collected at question 15).
Results of weighting review
3.28 The purpose of weighting survey data is to ensure that outputs are representative of the population. In the case of MENE, the approaches outlined on the previous pages aim to ensure that the survey results are representative of the visits taken by the English adult population, in terms of volume and characteristics.
3.29 In designing the weighting approach for MENE, the demographic variables which were considered to be most closely related to levels and types of visit taking and those which were expected to be important reporting categories were selected. These consist of a combination of ‘standard’ demographic characteristics (such as age and sex) and other characteristics expected to be closely related to participation levels, such as having a dog in the home.
Review of demographics currently used in weighting 3.30 The table in Appendix 4 provides details of the unweighted number of visits reported by
respondents during the first 12 months of interviewing and estimates of total visits following the application of weights. This review was undertaken following the first year of surveying using the data collected over this period and has not been repeated for the second year. Comparing the unweighted and weighted profiles of visits illustrates the following:
• The application of weighting inflates the visit estimates for men aged 16 to 64 (from 36 per cent of unweighted visits to 40 per cent with weighting), members of the ABC1 socio-economic group (from 51 per cent to 56 per cent) and men who work full time (from 23 per cent to 29 per cent).
• Conversely, the application of weighting deflates the visit estimates for women aged 65 and over (from 11 per cent to 8 per cent), those in the E socio-economic group (from 16 per cent to 10 per cent) and women who work part time or are not working (from 40 per cent to 35 per cent).
3.31 The above variations reflect varying response rates amongst these population groups, with those listed in the second bullet above more likely to be available for interview and therefore included in the survey. The demographic weighting corrects for these variations.
3.32 The next stage of the review involved an analysis of the average number of visits per adult amongst the groups which weighting is based upon. Across the population as a whole an estimated 68.7 visits were taken per adult during the first 12 months of interviewing.
3.33 As the table in Appendix 4 illustrates (see column furthest to right), there are significant differences in average levels of visit-taking across all of the categories used in the weighting except for children in household. One of the most notable differences relates to having a dog in the household.
3.34 Most of the differences confirm preconceptions, for example, smaller numbers of visits taken by residents of London and the elderly population.
19 Monitor of Engagement with the Natural Environment: Technical Report
3.35 These large differences in visit taking levels indicate that these characteristics are relevant
variables to use in the MENE weighting. Therefore, our recommendation is for these characteristics to continue to be used in the weighting of future years’ outputs.
Review of other demographics considered for weighting 3.36 A similar review was undertaken using the Year One data with a focus on a further two
demographic characteristics which were considered as potential weighting factors but not applied - access to a car and having a long standing illness or disability.
3.37 While these characteristics were seen as potential weighting factors due to their likely influence on the ability to take visits, they were not used due to a lack of accurate and up to date population data (data on car access and long standing illness were collected in the Census in 2001 but it was felt that weighting to such out of date targets could produce a bias in the results).
3.38 As the table in Appendix 4 illustrates, unsurprisingly, more visits are taken by those with access to a car than those without and fewer trips are taken by those with a long term illness or disability than those in good health.
3.39 Twenty per cent of the sample during the first 12 months of interviewing had a long term illness or disability. This group represented 18 per cent of the weighted sample and made 16 per cent of the weighted visits. By comparison this group formed 21 per cent of the population at the time of the 2001 Census.
3.40 As we know that those aged over 65 years are over represented in the unweighted data and are more likely to have a limiting long term illness or disability, the reduction of this group following weighting by age is to be expected. The Census data is out of date by ten years now and therefore the percentage of the population with a limiting long term illness or disability may have changed. Also, as this is a self certification question, the perception amongst respondents of what constitutes a limiting long term illness or disability may well have changed since the Census.
3.41 Given the lack of up to date targets for weighting and the fact the percentage in the weighted sample has reduced as expected given the demographics of the unweighted sample, we would recommend not including this as a variable in the weighting.
3.42 In terms of car access, 68 per cent of the sample had access to a car. This group represented 70 per cent of the weighted sample and made 83 per cent of the weighted visits. By comparison the 2001 Census recorded 73 per cent of households as having access to a car - data for adults was not published. No more recent data is available.
3.43 Weighting to the 2001 Census data could be incorrect as car ownership levels will almost certainly have changed and would be different for individuals compared to household. Car ownership is linked to other demographics and the existing weighting using other demographics already increases the unweighted sample of those with car ownership from 68 per cent to 70 per cent.
3.44 Given the fact we do not have up to date information on car ownership, the fact that the Census data is at the household level and not at the individual level and as the differences in visit taking frequency between those with and without car access are smaller than for some other characteristics, we would recommend not including this as a variable in the weighting.
20

Conclusions of weighting review
3.45 The results of this review suggest that the demographics used in the weighting procedures are appropriate. In particular, the variations in frequency of visit taking on the basis of presence of a dog in the household demonstrate the importance of including this characteristic in the weighting.
3.46 We do not recommend any significant changes to the current procedures being followed but this approach will be kept under review.
21 Monitor of Engagement with the Natural Environment: Technical Report
4 Levels of accuracy 4.1 This section of the report provides details of the outputs of an analysis of Complex
Standard Errors associated with the MENE data undertaken following four years of interviewing. As described in detail in section 2.4, during this period some 188,780 interviews were completed, key details were collected on 213,584 visits and full details were collected on 74,962 selected visits.
4.2 Normal confidence intervals and standard errors assume that the data has come from a Simple Random Sample (SRS). In such a sample, every individual in the population (for MENE, the English adult population) has an equal chance of being included in the survey sample.
4.3 In most surveys, however - including MENE - the sampling approach followed means that the survey sample is not a SRS. Complex Standard Errors (CSE) therefore take into account the extra information from the sampling design. Two sources of sample design are taken into account:
• Strata – showing homogenous groups, for example, gender, region. • Clusters – points where the data was sampled from (if not an SRS).
4.4 The following estimates have been produced using a resampling method which resamples the original sample 1,000 times and then takes an average of all the estimates calculated in order to provide a more robust estimate of variance, taking account of the complex survey design.
Analysis of respondent-based data 4.5 Some of the MENE results are analysed and presented as proportions of the adult
population in England. For example the percentages taking visits in the last 7 days or last 12 months. At an overall level these results are based on the full sample of 48,514 respondents in Year One, 46,099 respondents in Year Two, 47,418 respondents in Year Three and 46,749 respondents in Year Four.
4.6 Table 4-1 overleaf illustrates the design effect associated with the overall sample and the sub-samples obtained in each of the English regions during each year of surveying and for the total, cumulative sample. The design effect is an indication of how much larger the sample variance is with the complex survey design used in MENE than it would be if the survey was based on the same sample size but selected randomly (i.e. a Simple Random Sample (SRS)).
4.7 Dividing the sample size by the design effect provides the effective sample size which, for a complex survey design, is an estimate of the sample size that would have been required to obtain the same level of precision in an SRS. In MENE the estimated effective sample size for respondent based results following the fourth year of interviewing is 22,837- 49 per cent of the actual achieved sample.
4.8 The table also includes the design factor which is an inflation factor for the standard errors obtained using a complex survey design. The design factor is calculated as the square root of the design effect. In Year Four the design factor at the all respondent level of 1.43 indicates that standard errors for the 12 months’ data are 1.43 times as large as they would have been had the design been an SRS.
22
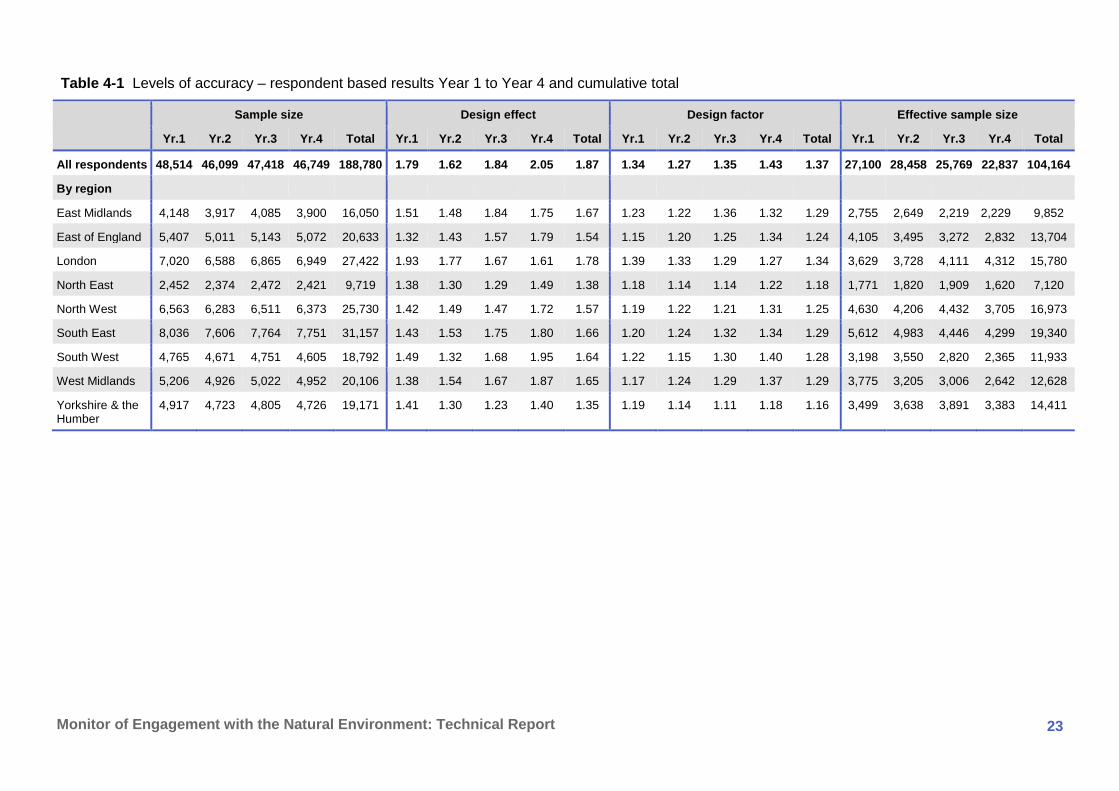
Table 4-1 Levels of accuracy – respondent based results Year 1 to Year 4 and cumulative total
Sample size Design effect Design factor Effective sample size
Yr.1 Yr.2 Yr.3 Yr.4 Total Yr.1 Yr.2 Yr.3 Yr.4 Total Yr.1 Yr.2 Yr.3 Yr.4 Total Yr.1 Yr.2 Yr.3 Yr.4 Total
All respondents 48,514 46,099 47,418 46,749 188,780 1.79 1.62 1.84 2.05 1.87 1.34 1.27 1.35 1.43 1.37 27,100 28,458 25,769 22,837 104,164
By region
East Midlands 4,148 3,917 4,085 3,900 16,050 1.51 1.48 1.84 1.75 1.67 1.23 1.22 1.36 1.32 1.29 2,755 2,649 2,219 2,229 9,852
East of England 5,407 5,011 5,143 5,072 20,633 1.32 1.43 1.57 1.79 1.54 1.15 1.20 1.25 1.34 1.24 4,105 3,495 3,272 2,832 13,704
London 7,020 6,588 6,865 6,949 27,422 1.93 1.77 1.67 1.61 1.78 1.39 1.33 1.29 1.27 1.34 3,629 3,728 4,111 4,312 15,780
North East 2,452 2,374 2,472 2,421 9,719 1.38 1.30 1.29 1.49 1.38 1.18 1.14 1.14 1.22 1.18 1,771 1,820 1,909 1,620 7,120
North West 6,563 6,283 6,511 6,373 25,730 1.42 1.49 1.47 1.72 1.57 1.19 1.22 1.21 1.31 1.25 4,630 4,206 4,432 3,705 16,973
South East 8,036 7,606 7,764 7,751 31,157 1.43 1.53 1.75 1.80 1.66 1.20 1.24 1.32 1.34 1.29 5,612 4,983 4,446 4,299 19,340
South West 4,765 4,671 4,751 4,605 18,792 1.49 1.32 1.68 1.95 1.64 1.22 1.15 1.30 1.40 1.28 3,198 3,550 2,820 2,365 11,933
West Midlands 5,206 4,926 5,022 4,952 20,106 1.38 1.54 1.67 1.87 1.65 1.17 1.24 1.29 1.37 1.29 3,775 3,205 3,006 2,642 12,628
Yorkshire & the Humber
4,917 4,723 4,805 4,726 19,171 1.41 1.30 1.23 1.40 1.35 1.19 1.14 1.11 1.18 1.16 3,499 3,638 3,891 3,383 14,411
23 Monitor of Engagement with the Natural Environment: Technical Report
4.9 The design factor may be used to obtain an indication of the levels of accuracy of results
obtained at a total sample level and for certain sub sets of the data. For example with an SRS, a result of 50 per cent with the total Year Four sample of 46,749 would have a margin of error of +/-0.45 percentage points at the 95 per cent levels of confidence. Multiplying this value by 1.43 provides us with the margin of error when taking account of the MENE sample design i.e. +/-0.64 percentage points. This is equal to the margin of error that would be obtained for this result with a simple random sample of 22,837. The design factors may be applied in a similar way to the results obtained for the sub samples obtained in each region.
4.10 Following this approach the following margins of error may be estimated for certain key respondent based results from the fourth year of data collection:
• 40.9 per cent of the population had visited the natural environment in the last seven days. This result ranges from 37.6 per cent to 44.3 per cent.
• 54.7 per cent of the population stated that they normally visited the natural environment at least once a week. This result ranges from 53.6 per cent to 56.2 per cent.
4.11 It should be borne in mind that those questions which were included in the survey once a month (Q17 and Q18) and once a quarter (E2 to E5) have smaller sample sizes. A similar design factor is applicable to these sub-samples.
4.12 On the basis of the overall respondent based data design factor of 1.37 when four years cumulative data is analysed, the following provides an indication of the general levels of accuracy of respondent based MENE results:
• Where the sample size is in excess of 40,000 respondents, the data will generally be accurate to around +/-0.6% at the 95% confidence level.
• When the sample size is around 10,000 respondents, the data will generally be accurate to around +/-1.3% at the 95% confidence level.
• Where the sample size is around 5,000 respondents, the data will generally be accurate to around +/-1.8% at the 95% confidence level.
• Where the sample size is around 1,000 respondents, the data will generally be accurate to around +/-4.1% at the 95% confidence level.
Analysis of visit-based data 4.13 Some of the MENE results are analysed and presented as proportions of the visits taken by
the adult population in England. For example the percentages of the visits taken in the last week which involved time spent in the countryside. At an overall level some of these results are based on all of the visits for which key details were collected ( a sample of 58,653 visits in Year One, 47,825 visits in Year Two, 53,898 in Year Three and 53,208 in Year Four, referred to below as ‘all visit’ data) while other results are based on the randomly selected visits which more details were collected for (a sample of 20,374 visits in Year One, 17,389 visits in Year Two, 19,014 in Year Three and 18,185 in Year 4, referred to below as ‘selected visit’ data).
4.14 Table 4-2 illustrates the design effects and design factors associated with the all visits data obtain from the overall sample of visits which were asked about. The design factors relating to sub-samples of visits to different general types of place are also shown (as recorded at question two). These may be applied as outlined for the respondent based results. For example, in Year Four, with an SRS sample, a result of 50 per cent of visits taken to seaside coastline would be accurate to around +/-2.2 percentage points at the 95% levels of confidence. Applying the seaside coastline visits design factor of 1.27 provides the
24

margin of error when taking account of the MENE sample design i.e. +/-2.8 percentage points.
25 Monitor of Engagement with the Natural Environment: Technical Report
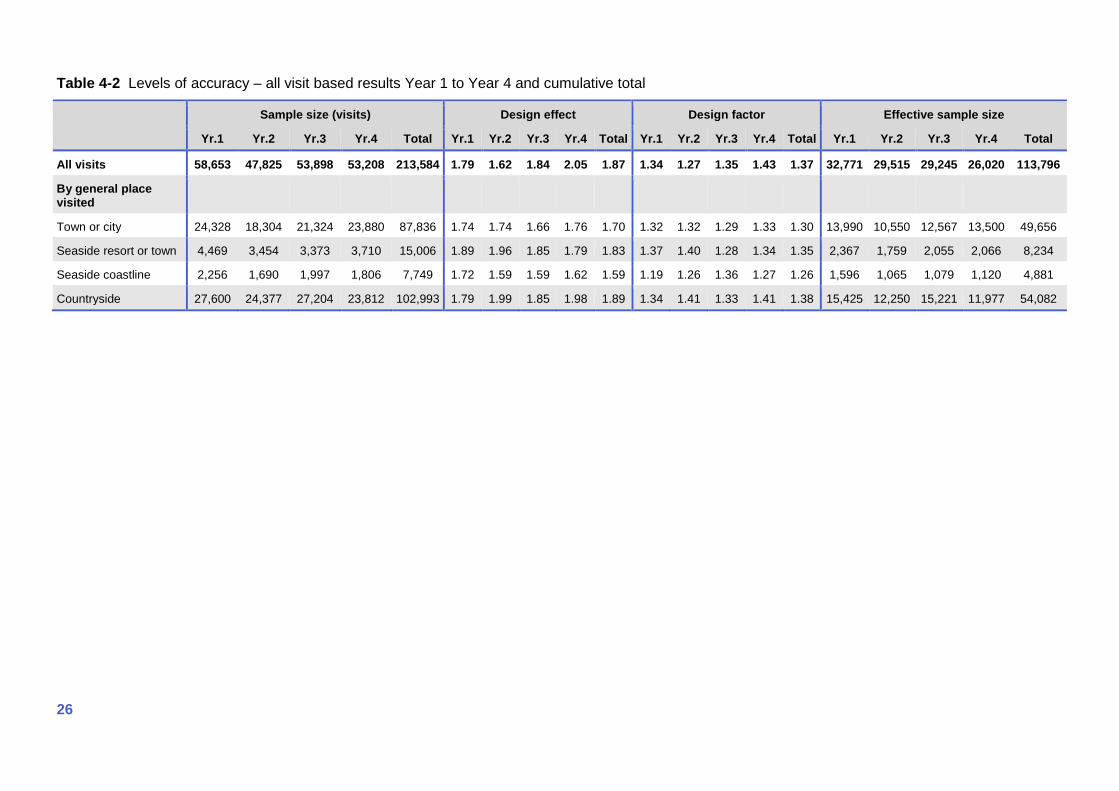
Table 4-2 Levels of accuracy – all visit based results Year 1 to Year 4 and cumulative total
Sample size (visits) Design effect Design factor Effective sample size
Yr.1 Yr.2 Yr.3 Yr.4 Total Yr.1 Yr.2 Yr.3 Yr.4 Total Yr.1 Yr.2 Yr.3 Yr.4 Total Yr.1 Yr.2 Yr.3 Yr.4 Total
All visits 58,653 47,825 53,898 53,208 213,584 1.79 1.62 1.84 2.05 1.87 1.34 1.27 1.35 1.43 1.37 32,771 29,515 29,245 26,020 113,796
By general place visited
Town or city 24,328 18,304 21,324 23,880 87,836 1.74 1.74 1.66 1.76 1.70 1.32 1.32 1.29 1.33 1.30 13,990 10,550 12,567 13,500 49,656
Seaside resort or town 4,469 3,454 3,373 3,710 15,006 1.89 1.96 1.85 1.79 1.83 1.37 1.40 1.28 1.34 1.35 2,367 1,759 2,055 2,066 8,234
Seaside coastline 2,256 1,690 1,997 1,806 7,749 1.72 1.59 1.59 1.62 1.59 1.19 1.26 1.36 1.27 1.26 1,596 1,065 1,079 1,120 4,881
Countryside 27,600 24,377 27,204 23,812 102,993 1.79 1.99 1.85 1.98 1.89 1.34 1.41 1.33 1.41 1.38 15,425 12,250 15,221 11,977 54,082
26

4.15 On the basis of this all visit based data design factor of 1.37 when analysing four years
cumulative data, the following provides an indication of the general levels of accuracy of all visit based MENE results:
• When the sample size is around 50,000 visits, the data will generally be accurate to around +/-0.6% at the 95% confidence level.
• When the sample size is around 20,000 visits, the data will generally be accurate to around +/-0.9% at the 95% confidence level.
• When the sample size is around 10,000 visits, the data will generally be accurate to around +/-1.3% at the 95% confidence level.
• Where the sample size is around 5,000 visits, the data will generally be accurate to around +/-1.8% at the 95% confidence level.
4.16 Table 4-3 illustrates the design effects and design factors associated with the sample of selected visits and the sub-samples of visits taken to different specific types of place (as recorded at question five).
.
27 Monitor of Engagement with the Natural Environment: Technical Report
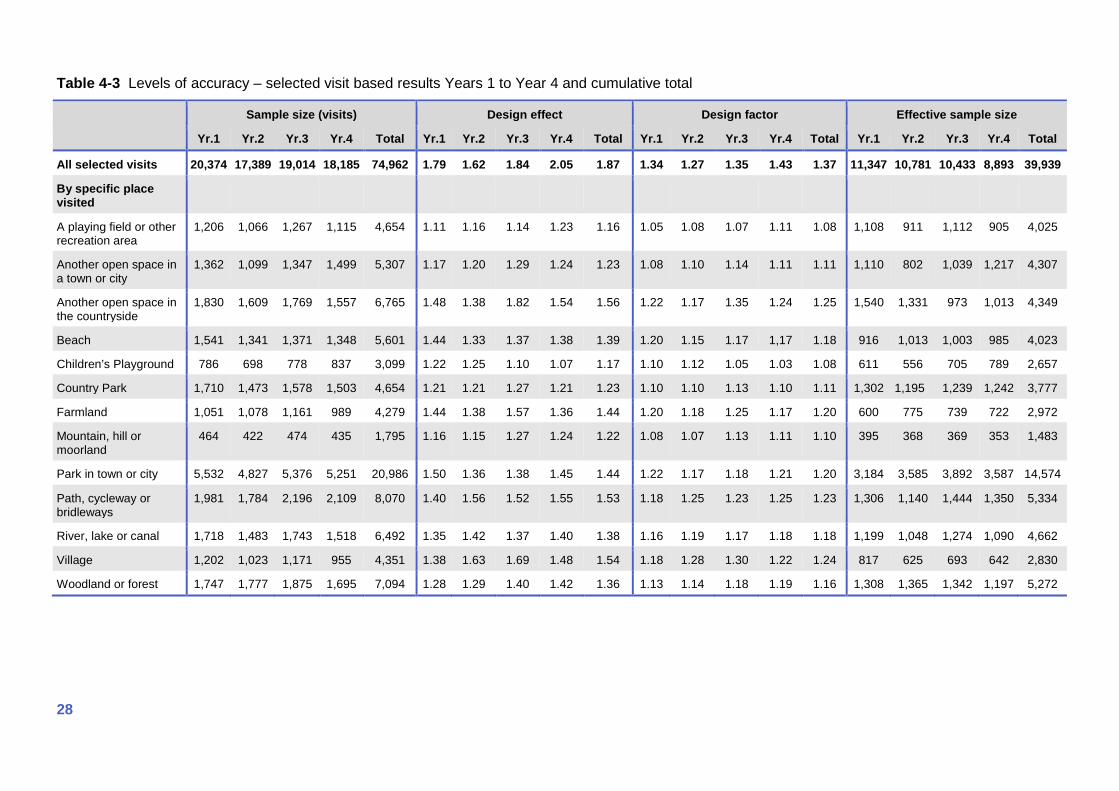
Table 4-3 Levels of accuracy – selected visit based results Years 1 to Year 4 and cumulative total
Sample size (visits) Design effect Design factor Effective sample size
Yr.1 Yr.2 Yr.3 Yr.4 Total Yr.1 Yr.2 Yr.3 Yr.4 Total Yr.1 Yr.2 Yr.3 Yr.4 Total Yr.1 Yr.2 Yr.3 Yr.4 Total
All selected visits 20,374 17,389 19,014 18,185 74,962 1.79 1.62 1.84 2.05 1.87 1.34 1.27 1.35 1.43 1.37 11,347 10,781 10,433 8,893 39,939
By specific place visited
A playing field or other recreation area
1,206 1,066 1,267 1,115 4,654 1.11 1.16 1.14 1.23 1.16 1.05 1.08 1.07 1.11 1.08 1,108 911 1,112 905 4,025
Another open space in a town or city
1,362 1,099 1,347 1,499 5,307 1.17 1.20 1.29 1.24 1.23 1.08 1.10 1.14 1.11 1.11 1,110 802 1,039 1,217 4,307
Another open space in the countryside
1,830 1,609 1,769 1,557 6,765 1.48 1.38 1.82 1.54 1.56 1.22 1.17 1.35 1.24 1.25 1,540 1,331 973 1,013 4,349
Beach 1,541 1,341 1,371 1,348 5,601 1.44 1.33 1.37 1.38 1.39 1.20 1.15 1.17 1,17 1.18 916 1,013 1,003 985 4,023
Children’s Playground 786 698 778 837 3,099 1.22 1.25 1.10 1.07 1.17 1.10 1.12 1.05 1.03 1.08 611 556 705 789 2,657
Country Park 1,710 1,473 1,578 1,503 4,654 1.21 1.21 1.27 1.21 1.23 1.10 1.10 1.13 1.10 1.11 1,302 1,195 1,239 1,242 3,777
Farmland 1,051 1,078 1,161 989 4,279 1.44 1.38 1.57 1.36 1.44 1.20 1.18 1.25 1.17 1.20 600 775 739 722 2,972
Mountain, hill or moorland
464 422 474 435 1,795 1.16 1.15 1.27 1.24 1.22 1.08 1.07 1.13 1.11 1.10 395 368 369 353 1,483
Park in town or city 5,532 4,827 5,376 5,251 20,986 1.50 1.36 1.38 1.45 1.44 1.22 1.17 1.18 1.21 1.20 3,184 3,585 3,892 3,587 14,574
Path, cycleway or bridleways
1,981 1,784 2,196 2,109 8,070 1.40 1.56 1.52 1.55 1.53 1.18 1.25 1.23 1.25 1.23 1,306 1,140 1,444 1,350 5,334
River, lake or canal 1,718 1,483 1,743 1,518 6,492 1.35 1.42 1.37 1.40 1.38 1.16 1.19 1.17 1.18 1.18 1,199 1,048 1,274 1,090 4,662
Village 1,202 1,023 1,171 955 4,351 1.38 1.63 1.69 1.48 1.54 1.18 1.28 1.30 1.22 1.24 817 625 693 642 2,830
Woodland or forest 1,747 1,777 1,875 1,695 7,094 1.28 1.29 1.40 1.42 1.36 1.13 1.14 1.18 1.19 1.16 1,308 1,365 1,342 1,197 5,272
28

Accuracy of visit estimates 4.17 An output of the weighting and grossing procedures used in MENE (see Section 3) is a
series of estimates of the total number of visits taken by adults in England during each of the four years of surveying. Estimates are produced at various different levels including visits taken by residents of particular regions and visits taken to general and specific types of place.
4.18 Table 4-4 to Table 4-6 illustrates the upper and lower confidence limits associated with these estimates. These estimates take account of two sources of variation: the uncertainty associated with respondent based results and the sample variation in terms of the number of visits respondents report to have taken in the 7 days prior to interview.
4.19 The regional estimates shown relate to visits taken by residents of each region rather than visits where the destination is within the region. The confidence limits associated with estimates of visits taken within destinations which are included in the annual results report are slightly wider than those shown.
29 Monitor of Engagement with the Natural Environment: Technical Report
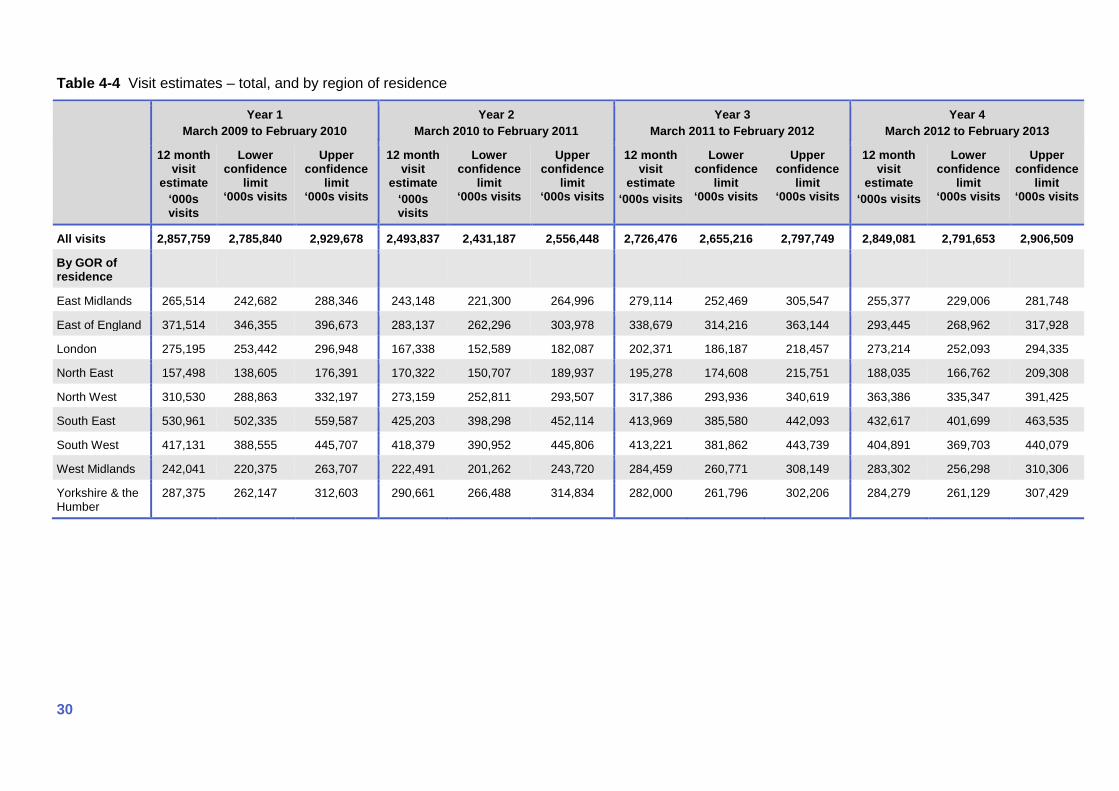
Table 4-4 Visit estimates – total, and by region of residence
Year 1 March 2009 to February 2010
Year 2 March 2010 to February 2011
Year 3 March 2011 to February 2012
Year 4 March 2012 to February 2013
12 month visit
estimate ‘000s visits
Lower confidence
limit ‘000s visits
Upper confidence
limit ‘000s visits
12 month visit
estimate ‘000s visits
Lower confidence
limit ‘000s visits
Upper confidence
limit ‘000s visits
12 month visit
estimate ‘000s visits
Lower confidence
limit ‘000s visits
Upper confidence
limit ‘000s visits
12 month visit
estimate ‘000s visits
Lower confidence
limit ‘000s visits
Upper confidence
limit ‘000s visits
All visits 2,857,759 2,785,840 2,929,678 2,493,837 2,431,187 2,556,448 2,726,476 2,655,216 2,797,749 2,849,081 2,791,653 2,906,509
By GOR of residence
East Midlands 265,514 242,682 288,346 243,148 221,300 264,996 279,114 252,469 305,547 255,377 229,006 281,748
East of England 371,514 346,355 396,673 283,137 262,296 303,978 338,679 314,216 363,144 293,445 268,962 317,928
London 275,195 253,442 296,948 167,338 152,589 182,087 202,371 186,187 218,457 273,214 252,093 294,335
North East 157,498 138,605 176,391 170,322 150,707 189,937 195,278 174,608 215,751 188,035 166,762 209,308
North West 310,530 288,863 332,197 273,159 252,811 293,507 317,386 293,936 340,619 363,386 335,347 391,425
South East 530,961 502,335 559,587 425,203 398,298 452,114 413,969 385,580 442,093 432,617 401,699 463,535
South West 417,131 388,555 445,707 418,379 390,952 445,806 413,221 381,862 443,739 404,891 369,703 440,079
West Midlands 242,041 220,375 263,707 222,491 201,262 243,720 284,459 260,771 308,149 283,302 256,298 310,306
Yorkshire & the Humber
287,375 262,147 312,603 290,661 266,488 314,834 282,000 261,796 302,206 284,279 261,129 307,429
30
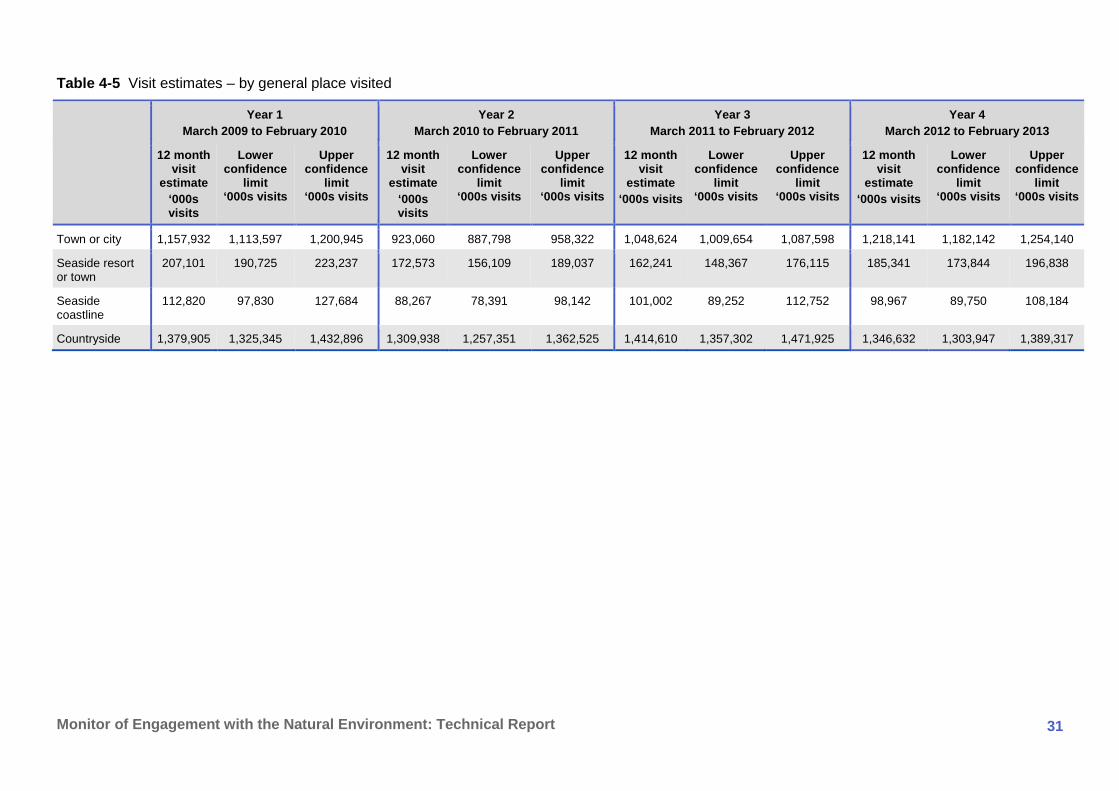
Table 4-5 Visit estimates – by general place visited
Year 1 March 2009 to February 2010
Year 2 March 2010 to February 2011
Year 3 March 2011 to February 2012
Year 4 March 2012 to February 2013
12 month visit
estimate ‘000s visits
Lower confidence
limit ‘000s visits
Upper confidence
limit ‘000s visits
12 month visit
estimate ‘000s visits
Lower confidence
limit ‘000s visits
Upper confidence
limit ‘000s visits
12 month visit
estimate ‘000s visits
Lower confidence
limit ‘000s visits
Upper confidence
limit ‘000s visits
12 month visit
estimate ‘000s visits
Lower confidence
limit ‘000s visits
Upper confidence
limit ‘000s visits
Town or city 1,157,932 1,113,597 1,200,945 923,060 887,798 958,322 1,048,624 1,009,654 1,087,598 1,218,141 1,182,142 1,254,140
Seaside resort or town
207,101 190,725 223,237 172,573 156,109 189,037 162,241 148,367 176,115 185,341 173,844 196,838
Seaside coastline
112,820 97,830 127,684 88,267 78,391 98,142 101,002 89,252 112,752 98,967 89,750 108,184
Countryside 1,379,905 1,325,345 1,432,896 1,309,938 1,257,351 1,362,525 1,414,610 1,357,302 1,471,925 1,346,632 1,303,947 1,389,317
31 Monitor of Engagement with the Natural Environment: Technical Report
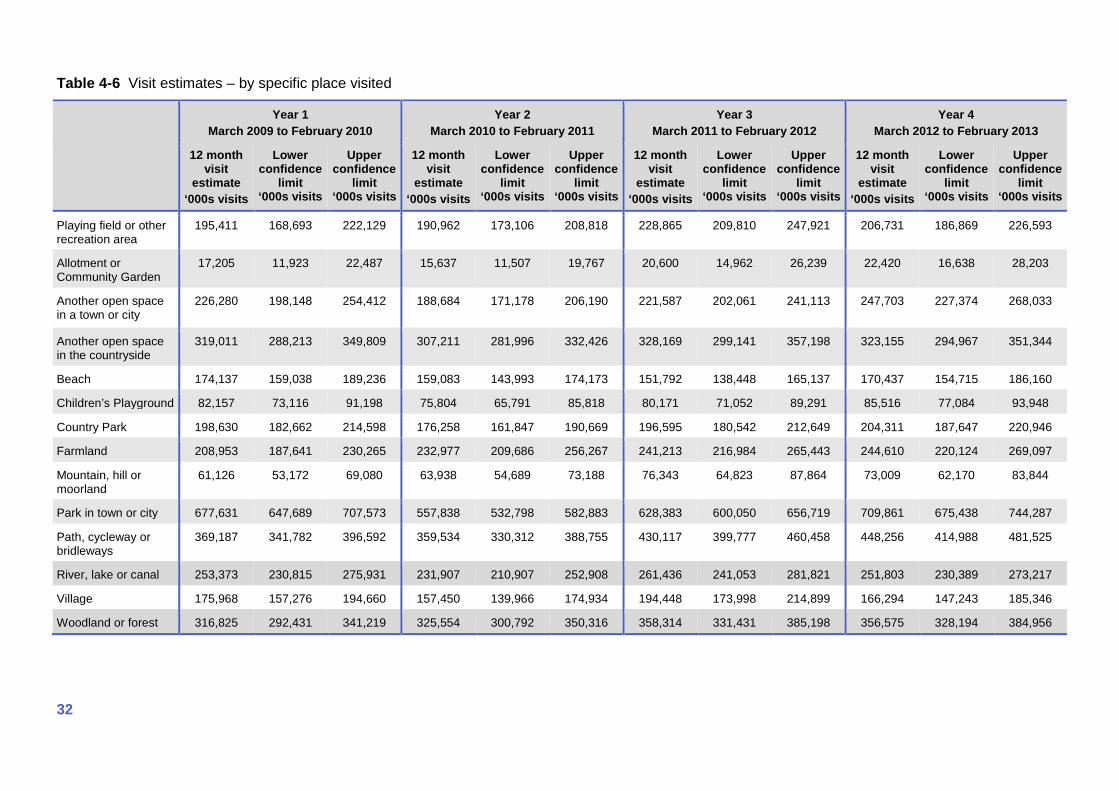
Table 4-6 Visit estimates – by specific place visited
Year 1 March 2009 to February 2010
Year 2 March 2010 to February 2011
Year 3 March 2011 to February 2012
Year 4 March 2012 to February 2013
12 month visit
estimate ‘000s visits
Lower confidence
limit ‘000s visits
Upper confidence
limit ‘000s visits
12 month visit
estimate ‘000s visits
Lower confidence
limit ‘000s visits
Upper confidence
limit ‘000s visits
12 month visit
estimate ‘000s visits
Lower confidence
limit ‘000s visits
Upper confidence
limit ‘000s visits
12 month visit
estimate ‘000s visits
Lower confidence
limit ‘000s visits
Upper confidence
limit ‘000s visits
Playing field or other recreation area
195,411 168,693 222,129 190,962 173,106 208,818 228,865 209,810 247,921 206,731 186,869 226,593
Allotment or Community Garden
17,205 11,923 22,487 15,637 11,507 19,767 20,600 14,962 26,239 22,420 16,638 28,203
Another open space in a town or city
226,280 198,148 254,412 188,684 171,178 206,190 221,587 202,061 241,113 247,703
227,374 268,033
Another open space in the countryside
319,011 288,213 349,809 307,211 281,996 332,426 328,169 299,141 357,198 323,155 294,967 351,344
Beach 174,137 159,038 189,236 159,083 143,993 174,173 151,792 138,448 165,137 170,437 154,715 186,160
Children’s Playground 82,157 73,116 91,198 75,804 65,791 85,818 80,171 71,052 89,291 85,516 77,084 93,948
Country Park 198,630 182,662 214,598 176,258 161,847 190,669 196,595 180,542 212,649 204,311 187,647 220,946
Farmland 208,953 187,641 230,265 232,977 209,686 256,267 241,213 216,984 265,443 244,610 220,124 269,097
Mountain, hill or moorland
61,126 53,172 69,080 63,938 54,689 73,188 76,343 64,823 87,864 73,009 62,170 83,844
Park in town or city 677,631 647,689 707,573 557,838 532,798 582,883 628,383 600,050 656,719 709,861 675,438 744,287
Path, cycleway or bridleways
369,187 341,782 396,592 359,534 330,312 388,755 430,117 399,777 460,458 448,256 414,988 481,525
River, lake or canal 253,373 230,815 275,931 231,907 210,907 252,908 261,436 241,053 281,821 251,803 230,389 273,217
Village 175,968 157,276 194,660 157,450 139,966 174,934 194,448 173,998 214,899 166,294 147,243 185,346
Woodland or forest 316,825 292,431 341,219 325,554 300,792 350,316 358,314 331,431 385,198 356,575 328,194 384,956
32

Accuracy of expenditure estimates 4.20 MENE also collects data on the amounts spent during visits to the natural environment.
This data is then applied to estimates of the total volume of visits taken to obtain an estimate of the total amount spent on all visits taken over a 12 month period.
4.21 Table 4-7 below illustrates the confidence limits associated with these estimates during each of the four years of the survey.
33 Monitor of Engagement with the Natural Environment: Technical Report
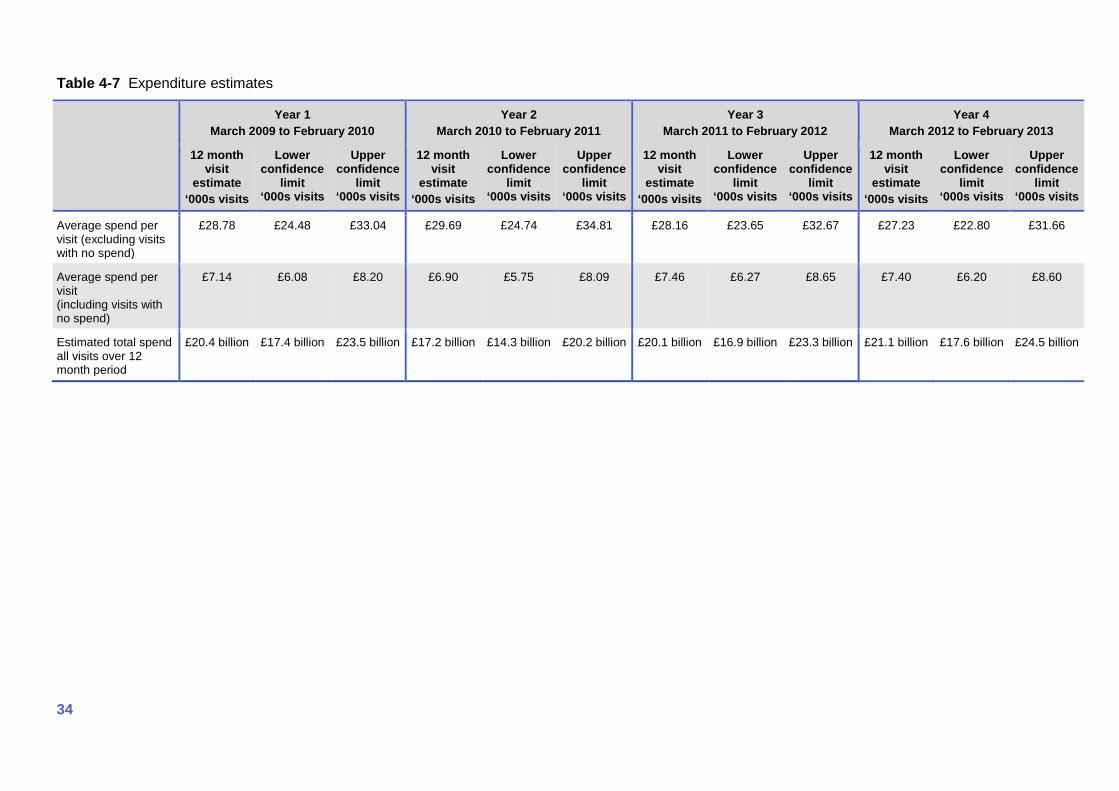
Table 4-7 Expenditure estimates
Year 1 March 2009 to February 2010
Year 2 March 2010 to February 2011
Year 3 March 2011 to February 2012
Year 4 March 2012 to February 2013
12 month visit
estimate ‘000s visits
Lower confidence
limit ‘000s visits
Upper confidence
limit ‘000s visits
12 month visit
estimate ‘000s visits
Lower confidence
limit ‘000s visits
Upper confidence
limit ‘000s visits
12 month visit
estimate ‘000s visits
Lower confidence
limit ‘000s visits
Upper confidence
limit ‘000s visits
12 month visit
estimate ‘000s visits
Lower confidence
limit ‘000s visits
Upper confidence
limit ‘000s visits
Average spend per visit (excluding visits with no spend)
£28.78 £24.48 £33.04 £29.69 £24.74 £34.81 £28.16 £23.65 £32.67 £27.23 £22.80 £31.66
Average spend per visit (including visits with no spend)
£7.14 £6.08 £8.20 £6.90 £5.75 £8.09 £7.46 £6.27 £8.65 £7.40
£6.20 £8.60
Estimated total spend all visits over 12 month period
£20.4 billion £17.4 billion £23.5 billion £17.2 billion £14.3 billion £20.2 billion £20.1 billion £16.9 billion £23.3 billion £21.1 billion £17.6 billion £24.5 billion
34

Appendix 1 MENE questionnaire Table A MENE questionnaire
Asked of Frequency Notes
INTRODUCTION
READ THE FOLLOWING TEXT IN FULL TO RESPONDENTS AND ENSURE THAT THEY UNDERSTAND. SEE INSTRUCTIONS FOR FURTHER CLARIFICATION. Now I am going to ask you about occasions in the last week when you spent your time out of doors. By out of doors we mean open spaces in and around towns and cities, including parks, canals and nature areas; the coast and beaches; and the countryside including farmland, woodland, hills and rivers. This could be anything from a few minutes to all day. It may include time spent close to your home or workplace, further afield or while on holiday in England. However this does not include: - routine shopping trips or; - time spent in your own garden.
Interviewer to check respondent is clear over definition. More detailed briefing note provided to interviewer.
7 DAY TRIP DIARY SECTION
1) Firstly I would like to record details of occasions when you made out of door visits during each of the last 7 days. How many times, if at all, did you make this type of visit yesterday/on <DAY>? __________
ALL RESPONDENTS
WEEKLY – 51 WAVES
Set up so the number of visits taken on each of last 7 days, starting with yesterday, is asked separately, from most recent day to 7 days before interview.
35 Monitor of Engagement with the Natural Environment: Technical Report
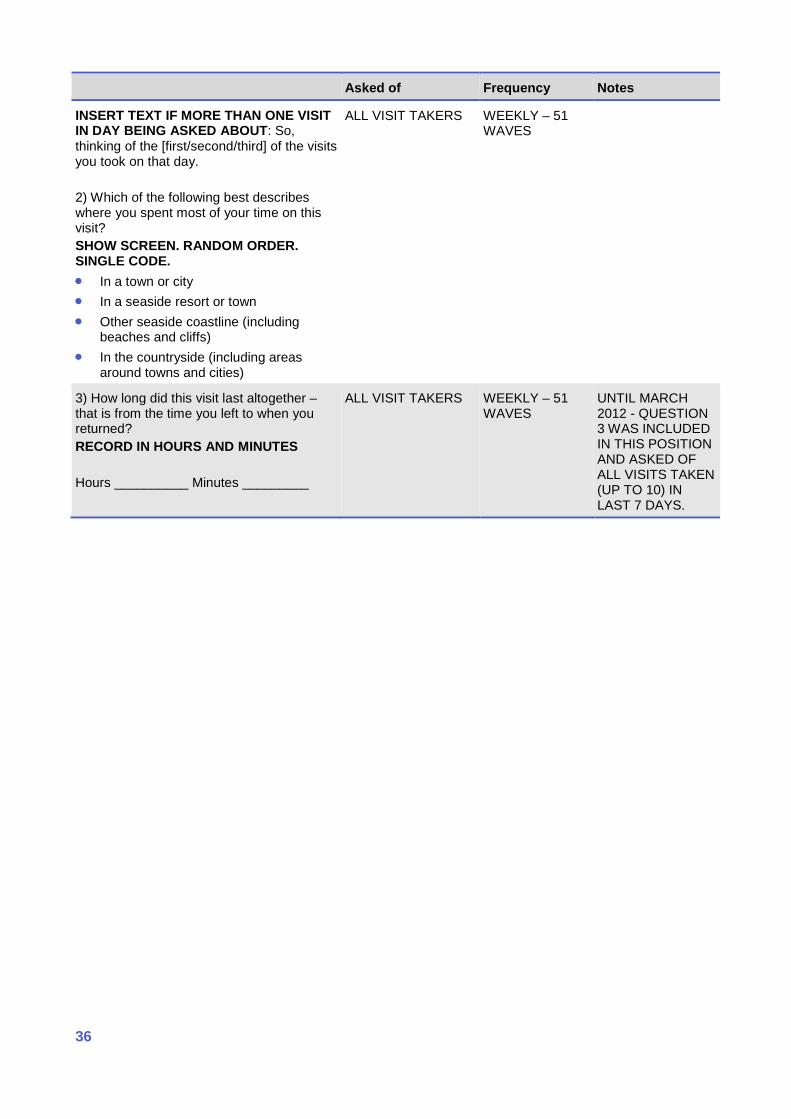
Asked of Frequency Notes
INSERT TEXT IF MORE THAN ONE VISIT IN DAY BEING ASKED ABOUT: So, thinking of the [first/second/third] of the visits you took on that day. 2) Which of the following best describes where you spent most of your time on this visit? SHOW SCREEN. RANDOM ORDER. SINGLE CODE. • In a town or city • In a seaside resort or town • Other seaside coastline (including
beaches and cliffs) • In the countryside (including areas
around towns and cities)
ALL VISIT TAKERS WEEKLY – 51 WAVES
3) How long did this visit last altogether – that is from the time you left to when you returned? RECORD IN HOURS AND MINUTES Hours __________ Minutes _________
ALL VISIT TAKERS WEEKLY – 51 WAVES
UNTIL MARCH 2012 - QUESTION 3 WAS INCLUDED IN THIS POSITION AND ASKED OF ALL VISITS TAKEN (UP TO 10) IN LAST 7 DAYS.
36

Asked of Frequency Notes
4) Which of these activities, if any, did you undertake? SHOW SCREEN. RANDOM ORDER. CODE ALL MENTIONED. • Eating or drinking out • Fieldsports (for example, shooting and
hunting) • Fishing • Horse riding • Off-road cycling or mountain biking • Off-road driving or motorcycling • Picnicking • Playing with children • Road cycling • Running • Appreciating scenery from your car (for
example, at a viewpoint) • Swimming outdoors • Visits to a beach, sunbathing or
paddling in the sea • Visiting an attraction • Walking, not with a dog (including short
walks, rambling and hill walking)? • Walking, with a dog (including short
walks, rambling and hill walking)? • Watersports • Wildlife watching OPTIONS BELOW NOT RANDOMISED – ALWAYS AT END OF LIST: • Informal games and sport (for example,
frisbee or golf) (SPECIFY) • Any other outdoor activities (for
example, climbing) (SPECIFY)
ALL VISIT TAKERS WEEKLY – 51 WAVES
ABOVE QUESTIONS 2 TO 4 REPEATED FOR SECOND AND THIRD VISIT ON EACH DAY IF APPLICABLE. QUESTION 1 THEN ASKED AGAIN FOR EACH DAY OF WEEK, WORKING BACKWARDS. QUESTION 1 ASKED FOR ALL 7 DAYS BUT QUESTIONS 2 TO 4 ASKED FOR A MAXIMUM OF 10 VISITS.
IF NO VISITS TAKEN IN ANY OF LAST 7 DAYS SKIP TO Q17
MORE DETAIL ON SINGLE RANDOMLY SELECTED VISIT SECTION
37 Monitor of Engagement with the Natural Environment: Technical Report

Asked of Frequency Notes
I would now like to ask you some further questions about the [first/second/third] visit to the out of doors you took Yesterday/ on <DAY>. This visit was to [location from Q2] and involved [activities from Q4].
Script set up so that one of the visits taken in last 7 days is randomly selected and asked about in Q5 to Q16
3) How long did this visit last altogether – that is from the time you left to when you returned? RECORD IN HOURS AND MINUTES Hours __________ Minutes _________
ALL VISIT TAKERS WEEKLY – 51 WAVES
FROM APRIL 2013 - QUESTION 3 WAS INCLUDED IN THIS POSITION AND ASKED ABOUT SINGLE RANDOMLY SELECTED VISIT ONLY.
5) Which of the following list of types of place best describe where you spent your time during this visit? Select more than one if necessary. SHOW SCREEN. RANDOM ORDER. CODE ALL MENTIONED. • A woodland or forest (including
community woodland) • Farmland • A mountain, hill or moorland • A river, lake or canal • A village • A path, cycleway or bridleway • Country park • Another open space in the countryside ---- KEEP TOGETHER IN THIS ORDER: • A park in a town or city • An allotment or community garden • A children’s playground • A playing field or other recreation area • Another open space in a town or city ---- KEEP TOGETHER IN THIS ORDER: • A beach • Other coastline --- ALWAYS AT END: • Other (specify)
ALL VISIT TAKERS WEEKLY – 51 WAVES
38
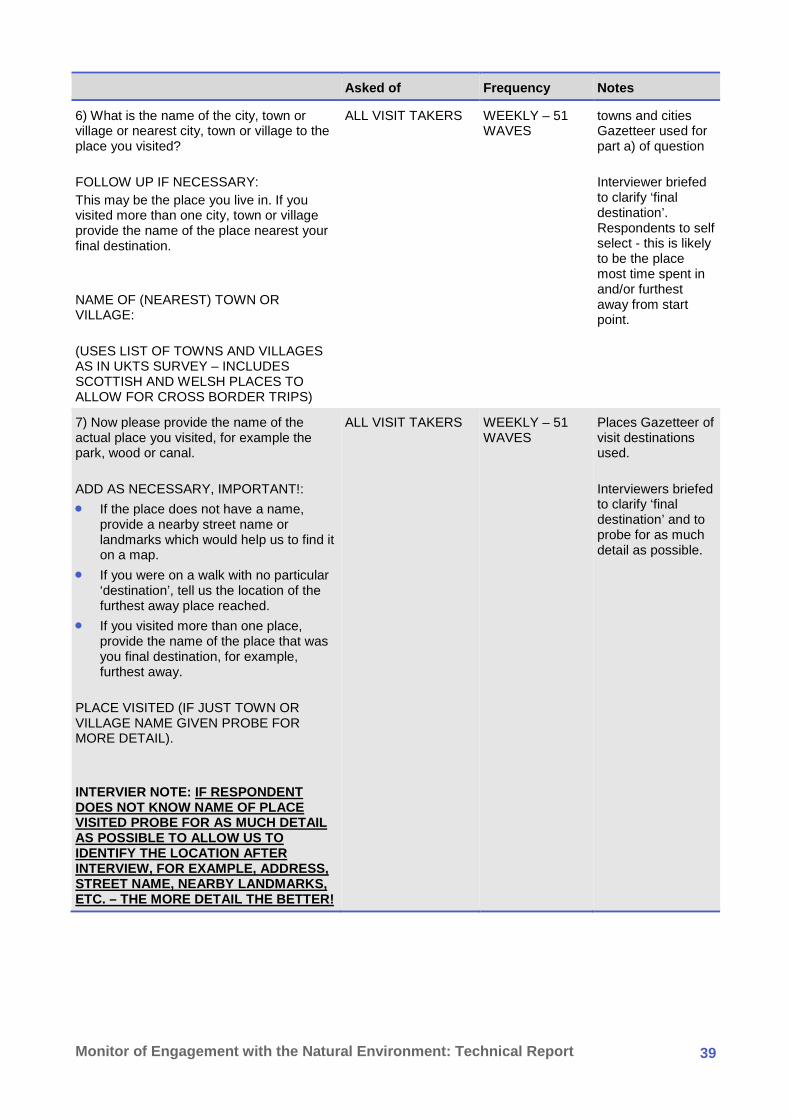
Asked of Frequency Notes
6) What is the name of the city, town or village or nearest city, town or village to the place you visited? FOLLOW UP IF NECESSARY: This may be the place you live in. If you visited more than one city, town or village provide the name of the place nearest your final destination. NAME OF (NEAREST) TOWN OR VILLAGE: (USES LIST OF TOWNS AND VILLAGES AS IN UKTS SURVEY – INCLUDES SCOTTISH AND WELSH PLACES TO ALLOW FOR CROSS BORDER TRIPS)
ALL VISIT TAKERS WEEKLY – 51 WAVES
towns and cities Gazetteer used for part a) of question Interviewer briefed to clarify ‘final destination’. Respondents to self select - this is likely to be the place most time spent in and/or furthest away from start point.
7) Now please provide the name of the actual place you visited, for example the park, wood or canal. ADD AS NECESSARY, IMPORTANT!: • If the place does not have a name,
provide a nearby street name or landmarks which would help us to find it on a map.
• If you were on a walk with no particular ‘destination’, tell us the location of the furthest away place reached.
• If you visited more than one place, provide the name of the place that was you final destination, for example, furthest away.
PLACE VISITED (IF JUST TOWN OR VILLAGE NAME GIVEN PROBE FOR MORE DETAIL). INTERVIER NOTE: IF RESPONDENT DOES NOT KNOW NAME OF PLACE VISITED PROBE FOR AS MUCH DETAIL AS POSSIBLE TO ALLOW US TO IDENTIFY THE LOCATION AFTER INTERVIEW, FOR EXAMPLE, ADDRESS, STREET NAME, NEARBY LANDMARKS, ETC. – THE MORE DETAIL THE BETTER!
ALL VISIT TAKERS WEEKLY – 51 WAVES
Places Gazetteer of visit destinations used. Interviewers briefed to clarify ‘final destination’ and to probe for as much detail as possible.
39 Monitor of Engagement with the Natural Environment: Technical Report
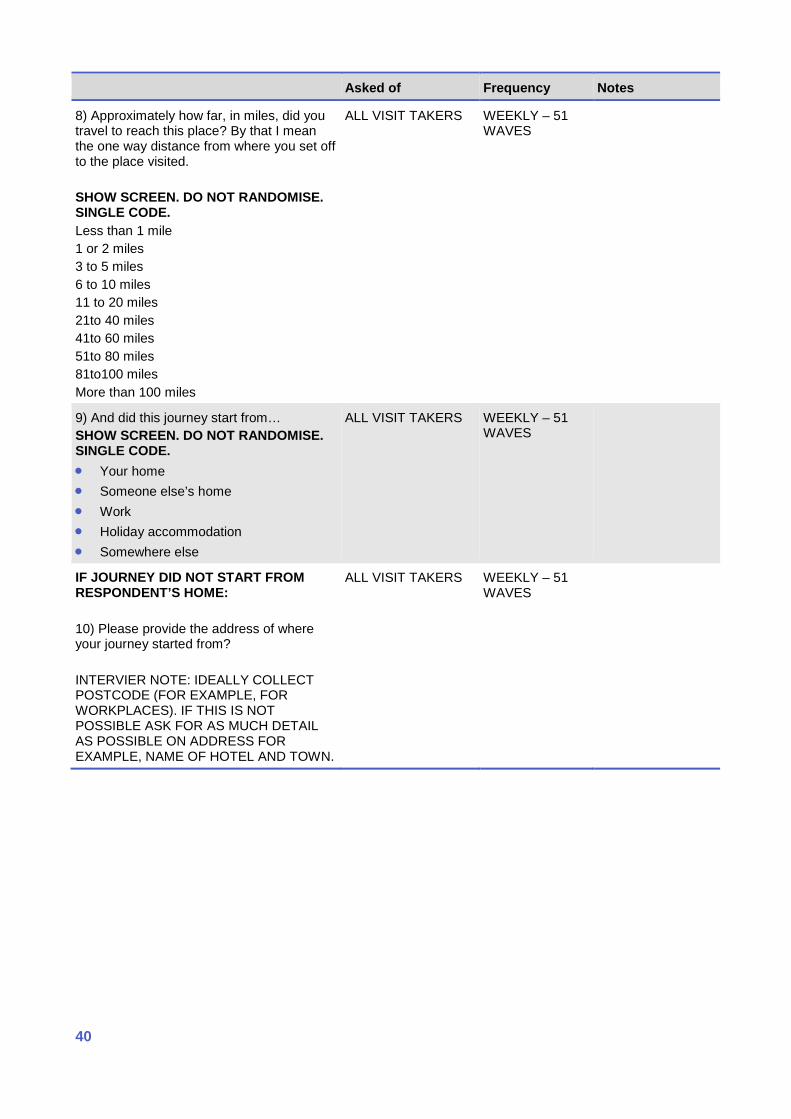
Asked of Frequency Notes
8) Approximately how far, in miles, did you travel to reach this place? By that I mean the one way distance from where you set off to the place visited. SHOW SCREEN. DO NOT RANDOMISE. SINGLE CODE. Less than 1 mile 1 or 2 miles 3 to 5 miles 6 to 10 miles 11 to 20 miles 21to 40 miles 41to 60 miles 51to 80 miles 81to100 miles More than 100 miles
ALL VISIT TAKERS WEEKLY – 51 WAVES
9) And did this journey start from… SHOW SCREEN. DO NOT RANDOMISE. SINGLE CODE. • Your home • Someone else’s home • Work • Holiday accommodation • Somewhere else
ALL VISIT TAKERS WEEKLY – 51 WAVES
IF JOURNEY DID NOT START FROM RESPONDENT’S HOME: 10) Please provide the address of where your journey started from? INTERVIER NOTE: IDEALLY COLLECT POSTCODE (FOR EXAMPLE, FOR WORKPLACES). IF THIS IS NOT POSSIBLE ASK FOR AS MUCH DETAIL AS POSSIBLE ON ADDRESS FOR EXAMPLE, NAME OF HOTEL AND TOWN.
ALL VISIT TAKERS WEEKLY – 51 WAVES
40

Asked of Frequency Notes
11) What form of transport did you use on this journey? INTERVIEWER NOTE: IF MORE THAN ONE FORM OF TRANSPORT USED RECORD THAT USED FOR LONGEST DISTANCE. SHOW SCREEN. RANDOM ORDER. SINGLE CODE. • Car or van • Train (includes tube/underground) • Public bus or coach (scheduled service) • Coach trip/ private coach • Motorcycle/ scooter • Bicycle/ mountain bike • On foot/ walking • Wheelchair/mobility scooter • On horseback • Boat (sail or motor) • Taxi ALWAYS AT END: • Other
ALL VISIT TAKERS WEEKLY – 51 WAVES
12) Which of the following, if any, best describe your reasons for this visit? Select all of those which apply to you. SHOW SCREEN. RANDOM ORDER. CODE ALL MENTIONED. • To spend time with family • To spend time with friends • To learn something about the outdoors • For fresh air or to enjoy pleasant
weather • For health or exercise • For peace and quiet • To relax and unwind • To exercise your dog • To enjoy scenery • To enjoy wildlife • To entertain children • To challenge yourself or achieve
something • To be somewhere you like • For other reasons (SPECIFY)
ALL VISIT TAKERS UNTIL MARCH 2012 MONTHLY - 12 WAVES – EACH IN LAST WEEK OF MONTH FROM APRIL 2013 WEEKLY – 51 WAVES
41 Monitor of Engagement with the Natural Environment: Technical Report

Asked of Frequency Notes
13) On this visit… a) how many adults aged 16 or over, including yourself, were on this visit? _____ ZERO NOT ALLOWED AS INCLUDES RESPONDENT b) how many children aged under 16 were on this visit? ____ MAY BE ZERO
ALL VISIT TAKERS MONTHLY - 12 WAVES – EACH IN LAST WEEK OF MONTH
14) Were you accompanied by a dog on this visit? • Yes • No
ALL VISIT TAKERS MONTHLY - 12 WAVES – EACH IN LAST WEEK OF MONTH
15) During this visit , did you personally spend any money on any of the items listed on the screen? PROBE Any others? SHOW SCREEN. RANDOM ORDER. CODE ALL MENTIONED. • Food and drink • Petrol\diesel\LPG • Car parking • Bus\train\ferry fares • Hire of equipment • Purchase of equipment • Maps\guidebooks\leaflets • Gifts\souvenirs • Admission fees • Other items • Didn't spend any money
ALL VISIT TAKERS MONTHLY - 12 WAVES – EACH IN LAST WEEK OF MONTH
16) How much did you spend on… ASKED FOR THOSE SELECTED AT Q17 Food and drink ____ Petrol\diesel\LPG____ Car parking____ Bus\train\ferry fares____ Hire of equipment____ Purchase of equipment____ Maps\guidebooks\leaflets____ Gifts\souvenirs____ Admission fees____ Other items____
ALL VISIT TAKERS MONTHLY - 12 WAVES – EACH IN LAST WEEK OF MONTH
42

Asked of Frequency Notes
E1) And still thinking of this visit, how much do you agree or disagree with the following statements? SHOW SCREEN. SINGLE CODE …I enjoyed it …It made me feel calm and relaxed …It made me feel refreshed and revitalised …I took time to appreciate my surroundings …I learned something new about the natural world …I felt close to nature • Strongly agree • Agree • Neither agree nor disagree • Disagree • Strongly disagree
ALL VISIT TAKERS QUARTERLY - 4 WAVES – LAST WEEK OF JUNE 09, AUGUST 09, NOVEMBER 09, FEBRUARY 10
LAST 12 MONTHS SECTION
17) Now thinking about the last 12 months, how often, on average, have you spent your leisure time out of doors, away from your home? Again, by out of doors we mean open spaces in and around towns and cities, the coast and the countryside. This could be anything from a few minutes to all day. It may include time spent close to your home, further afield or while on holiday in England. However this does not include routine shopping trips or time spent in your own garden. SHOW SCREEN. SINGLE CODE. • More than once per day • Every day • Several times a week • Once a week • Once or twice a month ---------------------------------------- • Once every 2-3 months • Once or twice • Never
ALL RESPONDENTS MONTHLY - 12 WAVES – EACH IN LAST WEEK OF MONTH
43 Monitor of Engagement with the Natural Environment: Technical Report
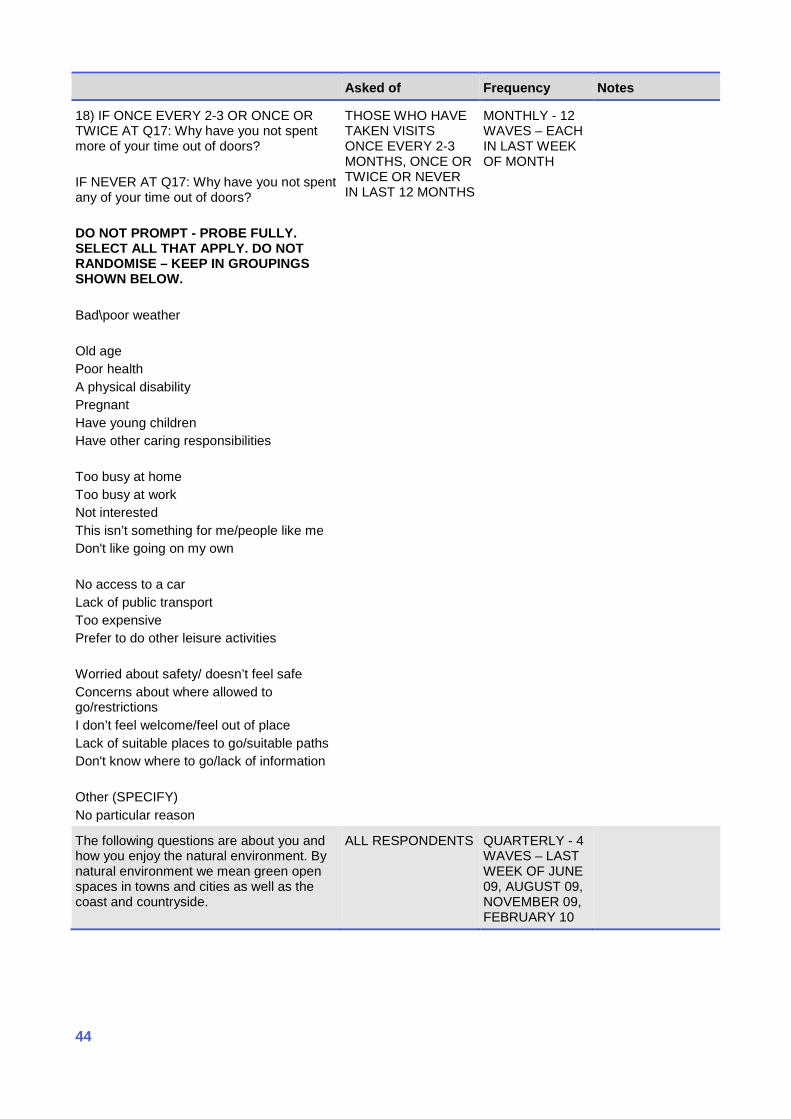
Asked of Frequency Notes
18) IF ONCE EVERY 2-3 OR ONCE OR TWICE AT Q17: Why have you not spent more of your time out of doors? IF NEVER AT Q17: Why have you not spent any of your time out of doors? DO NOT PROMPT - PROBE FULLY. SELECT ALL THAT APPLY. DO NOT RANDOMISE – KEEP IN GROUPINGS SHOWN BELOW. Bad\poor weather Old age Poor health A physical disability Pregnant Have young children Have other caring responsibilities Too busy at home Too busy at work Not interested This isn’t something for me/people like me Don't like going on my own No access to a car Lack of public transport Too expensive Prefer to do other leisure activities Worried about safety/ doesn’t feel safe Concerns about where allowed to go/restrictions I don’t feel welcome/feel out of place Lack of suitable places to go/suitable paths Don't know where to go/lack of information Other (SPECIFY) No particular reason
THOSE WHO HAVE TAKEN VISITS ONCE EVERY 2-3 MONTHS, ONCE OR TWICE OR NEVER IN LAST 12 MONTHS
MONTHLY - 12 WAVES – EACH IN LAST WEEK OF MONTH
The following questions are about you and how you enjoy the natural environment. By natural environment we mean green open spaces in towns and cities as well as the coast and countryside.
ALL RESPONDENTS QUARTERLY - 4 WAVES – LAST WEEK OF JUNE 09, AUGUST 09, NOVEMBER 09, FEBRUARY 10
44

Asked of Frequency Notes
E2) How much do you agree or disagree with the following statements? SHOW SCREEN. SINGLE CODE …Spending time out of doors (including my own garden) is an important part of my life …I am concerned about damage to the natural environment …There are many natural places I may never visit but I am glad they exist …Having open green spaces close to where I live is important • Strongly agree • Agree • Neither agree nor disagree • Disagree • Strongly disagree
ALL RESPONDENTS QUARTERLY - 4 WAVES – LAST WEEK OF JUNE 09, AUGUST 09, NOVEMBER 09, FEBRUARY 10
E3) Which of the following activities involving the natural environment do you take part in? Please choose everything you do, both regularly and occasionally. SHOW SCREEN. RANDOM ORDER. CODE ALL MENTIONED • Watching or listening to nature
programmes on the TV or radio • Looking at books, photos or websites
about the natural world • Looking at natural scenery from indoors
or whilst on journeys • Sitting or relaxing in a garden • Gardening • Watching wildlife (including bird
watching) • Choosing to walk through local parks or
green spaces on my way to other places
• Doing unpaid voluntary work out of doors
• None of these (fix at bottom)
ALL RESPONDENTS QUARTERLY - 4 WAVES – LAST WEEK OF JUNE 09, AUGUST 09, NOVEMBER 09, FEBRUARY 10
45 Monitor of Engagement with the Natural Environment: Technical Report

Asked of Frequency Notes
E4) Which of the following environment-related activities do you do? Please choose all that apply. SHOW SCREEN. RANDOM ORDER. CODE ALL MENTIONED • I usually recycle items rather than throw
them away • I usually buy eco-friendly products and
brands • I usually buy seasonal or locally grown
food • I choose to walk or cycle instead of
using my car when I can • I encourage other people to protect the
environment • I am a member of an environmental or
conservation organisation • I volunteer to help care for the
environment • None of these (fix at bottom)
ALL RESPONDENTS QUARTERLY - 4 WAVES – LAST WEEK OF JUNE 09, AUGUST 09, NOVEMBER 09, FEBRUARY 10
E5) Please think about whether or not you are likely to make changes to your lifestyle to protect the environment, for example by recycling rather than throwing things away, using your car less and buying local food. Which of these statements best describes your intentions? SHOW SCREEN. SINGLE CODE • I like my lifestyle the way it is and am
not likely to change it • I’d like to make changes to my lifestyle
but I don’t know what to do • I’d like to make changes to my lifestyle
but it’s too difficult • I’d make changes to my lifestyle if I
knew other people were willing to make changes
• I intend to make changes to my lifestyle • I already do a lot to protect the
environment so it would be difficult to do more
• Don’t know (fix at bottom)
ALL RESPONDENTS QUARTERLY - 4 WAVES – LAST WEEK OF JUNE 09, AUGUST 09, NOVEMBER 09, FEBRUARY 10
CLASSIFICATION QUESTIONS
19) Do you own or have access to a car? Yes No
ALL RESPONDENTS
WEEKLY – 51 WAVES
46
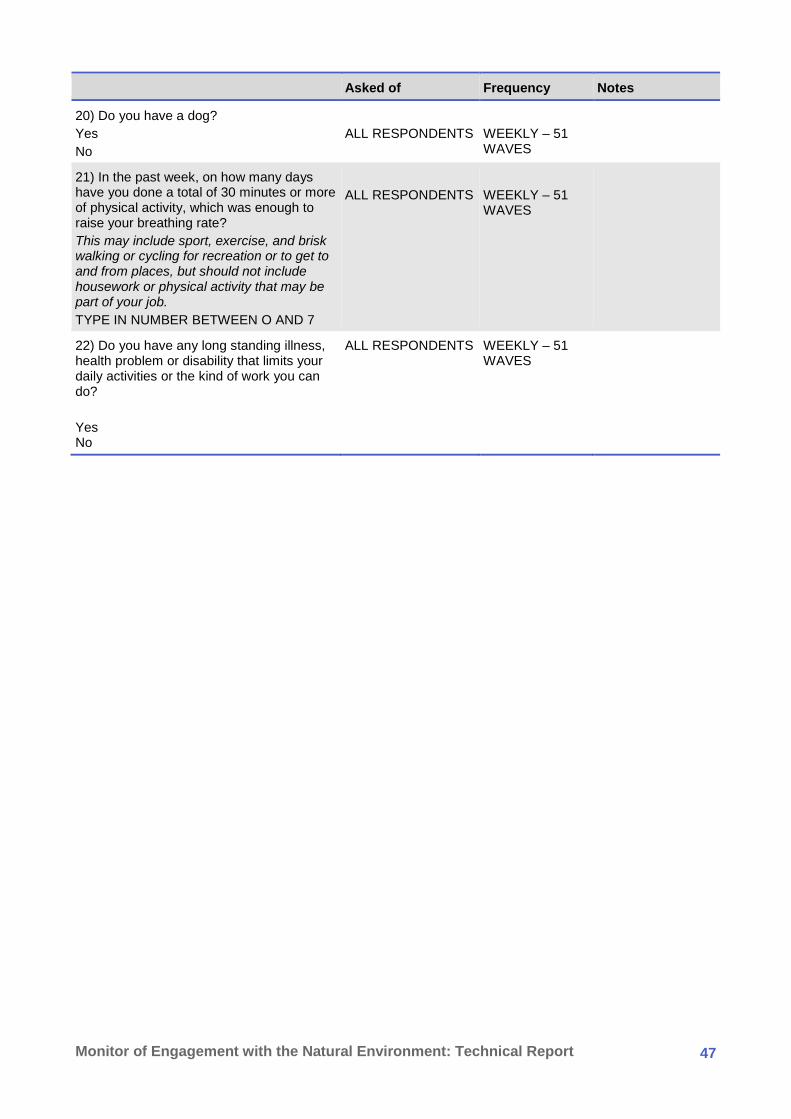
Asked of Frequency Notes
20) Do you have a dog? Yes No
ALL RESPONDENTS
WEEKLY – 51 WAVES
21) In the past week, on how many days have you done a total of 30 minutes or more of physical activity, which was enough to raise your breathing rate? This may include sport, exercise, and brisk walking or cycling for recreation or to get to and from places, but should not include housework or physical activity that may be part of your job. TYPE IN NUMBER BETWEEN O AND 7
ALL RESPONDENTS
WEEKLY – 51 WAVES
22) Do you have any long standing illness, health problem or disability that limits your daily activities or the kind of work you can do? Yes No
ALL RESPONDENTS WEEKLY – 51 WAVES
47 Monitor of Engagement with the Natural Environment: Technical Report

Appendix 2 Standard classification questions included in TNS Omnibus Question 1 Sex of respondent ? 1 MALE 2 FEMALE Question 2a What was your age last birthday ? Question 2b INTERVIEWER - ESTIMATE AGE GROUP OF RESPONDENT Age of respondent 1 16-17 2 18-24 3 25-34 4 35-44 5 45-54 6 55-64 7 65-74 8 75+ Question 3 Thinking about your household's food and grocery shopping, are you personally responsible for selecting HALF OR MORE of the items to be bought from supermarkets and food shops ? 1 YES - HALF OR MORE 2 NO - LESS THAN HALF Question 4 Do you have any children under 16 ? 1 YES 2 NO Question 5 Working status ? 1 FULL-TIME PAID WORK (30+ HOURS PER WEEK) 2 PART-TIME PAID WORK (8-29 HOURS PER WEEK) 3 PART-TIME PAID WORK (UNDER 8 HOURS PER WEEK) 4 RETIRED 5 STILL AT SCHOOL 6 IN FULL TIME HIGHER EDUCATION 7 UNEMPLOYED (SEEKING WORK) 8 NOT IN PAID EMPLOYMENT (NOT SEEKING WORK)
48

Question 6 SHOW SCREEN - MULTI CHOICE Through which of the following ways, if any, do you receive television in your household? Please think about all the TV sets in your household. 1 Digital Satellite TV through Sky for a monthly subscription (i.e. satellite dish) 2 Free-Sat TV through any satellite dish WITHOUT a monthly subscription 3 Cable through Virgin Media (previously ntl\Telewest) 4 Freeview TV through TV aerial and set-top box without a monthly subscription 5 Top-Up TV through TV aerial and set-top box for a monthly subscription
6 TV which has Freeview channels built in (IDTV using TV aerial, without a separate set-top box)
7 TV from Tiscali\Homechoice 8 TV from BT Vision 9 TV through a normal aerial but receiving the main 4 or 5 channels only 10 Other Question 7 SHOW SCREEN - MULTI CHOICE Q.1 Do you have any of the following ? INTERNET ACCESS E-MAIL 1 Access to the Internet at home on a computer\laptop 2 Access to the Internet at work on a computer\laptop 3 An e-mail address at home 4 An e-mail address at work 6 Access to the Internet via a mobile phone 7 Other Internet access 8 Other e-mail address 11 Access to the Internet at school\college\university on a computer 12 Access to the Internet at home on a games console 13 Internet at home through your TV screen via a computer 14 Internet access from a library on a computer 15 Internet access in a café\bar on a computer 18 Access to the Internet on a Palmtop or Personal Digital Assistant (PDA)\Pocket PC 19 Internet access at a friends or relatives house on a computer Question 8 Marital status of respondent 1 MARRIED\LIVING AS MARRIED 2 SINGLE 3 WIDOWED\DIVORCED\SEPARATED Question 9 ENTER YOUR RESPONSE USING THE PAD ON SCREEN How many people are there in your household altogether, including any children and yourself ? And how many children under the age of 16 are there in the household ? Question 10 COLLECT SEX AND AGE OF CHILDREN STARTING WITH THE ELDEST
49 Monitor of Engagement with the Natural Environment: Technical Report

Question 11 SHOW SCREEN - MULTICHOICE Which, if any, of the following apply to you ? 1 A. I am currently up to 3 months pregnant 2 B. I am currently 4-6 months pregnant 3 C. I am currently 7-9 months pregnant 4 D. My partner is currently up to 3 months pregnant 5 E. My partner is currently 4-6 months pregnant 6 F. My partner is currently 7-9 months pregnant 7 G. I have a baby aged 0-3 months 8 H. I have a baby aged 4-6 months 9 I. I have a baby aged 7-12 months Question 12 Tenure 1 OWN OUTRIGHT 2 OWN WITH A MORTGAGE 3 RENT FROM COUNCIL 4 RENT PRIVATELY 5 OTHER Question 13 SHOW SCREEN Which of these best describes your ethnic group ? (IF NECESSARY: By this I mean your cultural background) 1 White British 2 White Irish 3 Any other white background 4 White & Black Caribbean 5 White & Black African 6 White & Asian 7 Any other mixed background 8 Indian 9 Pakistani 10 Bangladeshi 11 Any other Asian background 12 Caribbean 13 African 14 Any other Black background 15 Chinese 16 Any other Question 14 Working status of Chief Income Earner (CIE) 1 EMPLOYED 2 SELF-EMPLOYED 4 NOT WORKING, DEPENDENT ON STATE BENEFIT 5 NOT WORKING, OTHER INCOME
50

Question 15 Social grade 1 . A . 2 . B . 3 . C1 . 4 . C2 . 5 . D . 6 . E .
51 Monitor of Engagement with the Natural Environment: Technical Report
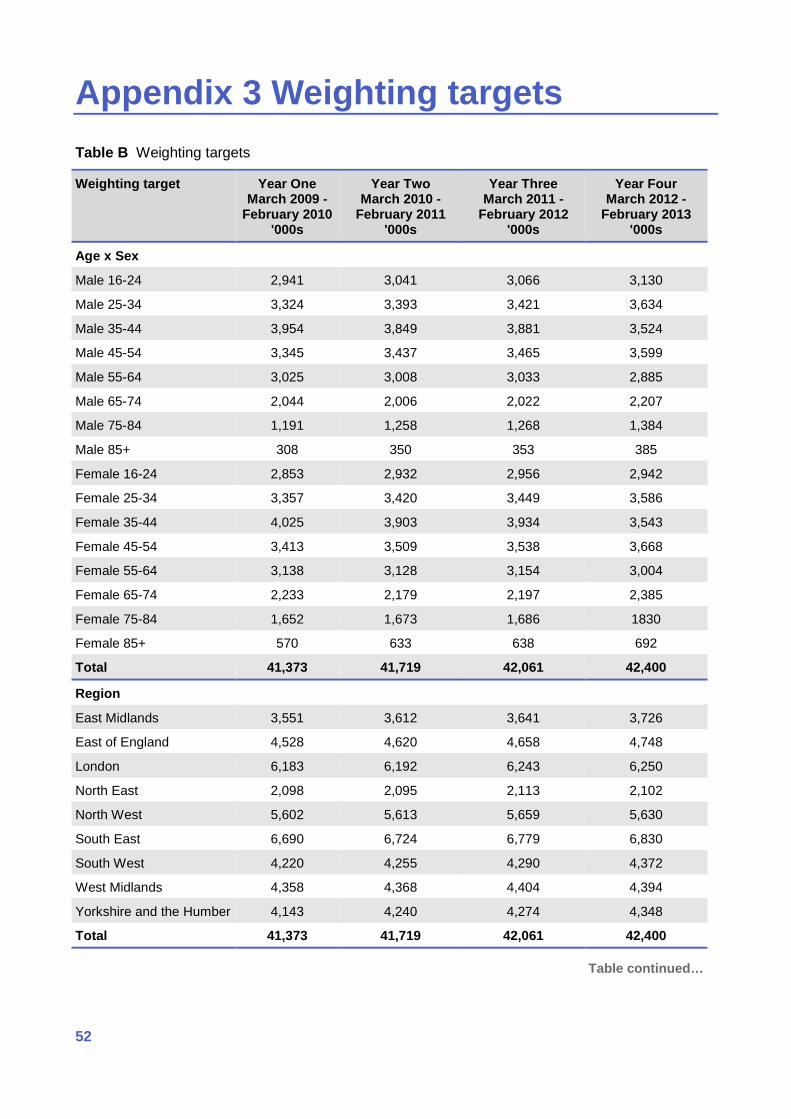
Appendix 3 Weighting targets Table B Weighting targets
Weighting target Year One March 2009 -
February 2010 '000s
Year Two March 2010 -
February 2011 '000s
Year Three March 2011 -
February 2012 '000s
Year Four March 2012 -
February 2013 '000s
Age x Sex
Male 16-24 2,941 3,041 3,066 3,130
Male 25-34 3,324 3,393 3,421 3,634
Male 35-44 3,954 3,849 3,881 3,524
Male 45-54 3,345 3,437 3,465 3,599
Male 55-64 3,025 3,008 3,033 2,885
Male 65-74 2,044 2,006 2,022 2,207
Male 75-84 1,191 1,258 1,268 1,384
Male 85+ 308 350 353 385
Female 16-24 2,853 2,932 2,956 2,942
Female 25-34 3,357 3,420 3,449 3,586
Female 35-44 4,025 3,903 3,934 3,543
Female 45-54 3,413 3,509 3,538 3,668
Female 55-64 3,138 3,128 3,154 3,004
Female 65-74 2,233 2,179 2,197 2,385
Female 75-84 1,652 1,673 1,686 1830
Female 85+ 570 633 638 692
Total 41,373 41,719 42,061 42,400
Region
East Midlands 3,551 3,612 3,641 3,726
East of England 4,528 4,620 4,658 4,748
London 6,183 6,192 6,243 6,250
North East 2,098 2,095 2,113 2,102
North West 5,602 5,613 5,659 5,630
South East 6,690 6,724 6,779 6,830
South West 4,220 4,255 4,290 4,372
West Midlands 4,358 4,368 4,404 4,394
Yorkshire and the Humber 4,143 4,240 4,274 4,348
Total 41,373 41,719 42,061 42,400
Table continued…
52
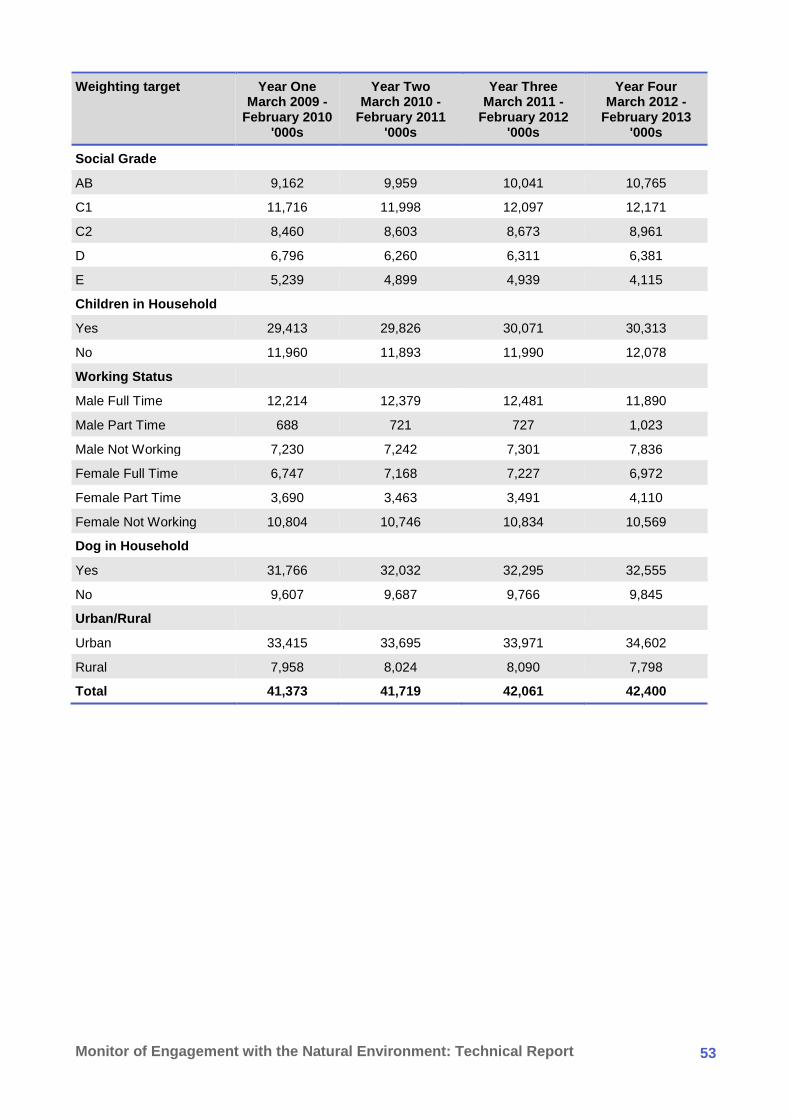
Weighting target Year One
March 2009 - February 2010
'000s
Year Two March 2010 -
February 2011 '000s
Year Three March 2011 -
February 2012 '000s
Year Four March 2012 -
February 2013 '000s
Social Grade
AB 9,162 9,959 10,041 10,765
C1 11,716 11,998 12,097 12,171
C2 8,460 8,603 8,673 8,961
D 6,796 6,260 6,311 6,381
E 5,239 4,899 4,939 4,115
Children in Household
Yes 29,413 29,826 30,071 30,313
No 11,960 11,893 11,990 12,078
Working Status
Male Full Time 12,214 12,379 12,481 11,890
Male Part Time 688 721 727 1,023
Male Not Working 7,230 7,242 7,301 7,836
Female Full Time 6,747 7,168 7,227 6,972
Female Part Time 3,690 3,463 3,491 4,110
Female Not Working 10,804 10,746 10,834 10,569
Dog in Household
Yes 31,766 32,032 32,295 32,555
No 9,607 9,687 9,766 9,845
Urban/Rural
Urban 33,415 33,695 33,971 34,602
Rural 7,958 8,024 8,090 7,798
Total 41,373 41,719 42,061 42,400
53 Monitor of Engagement with the Natural Environment: Technical Report
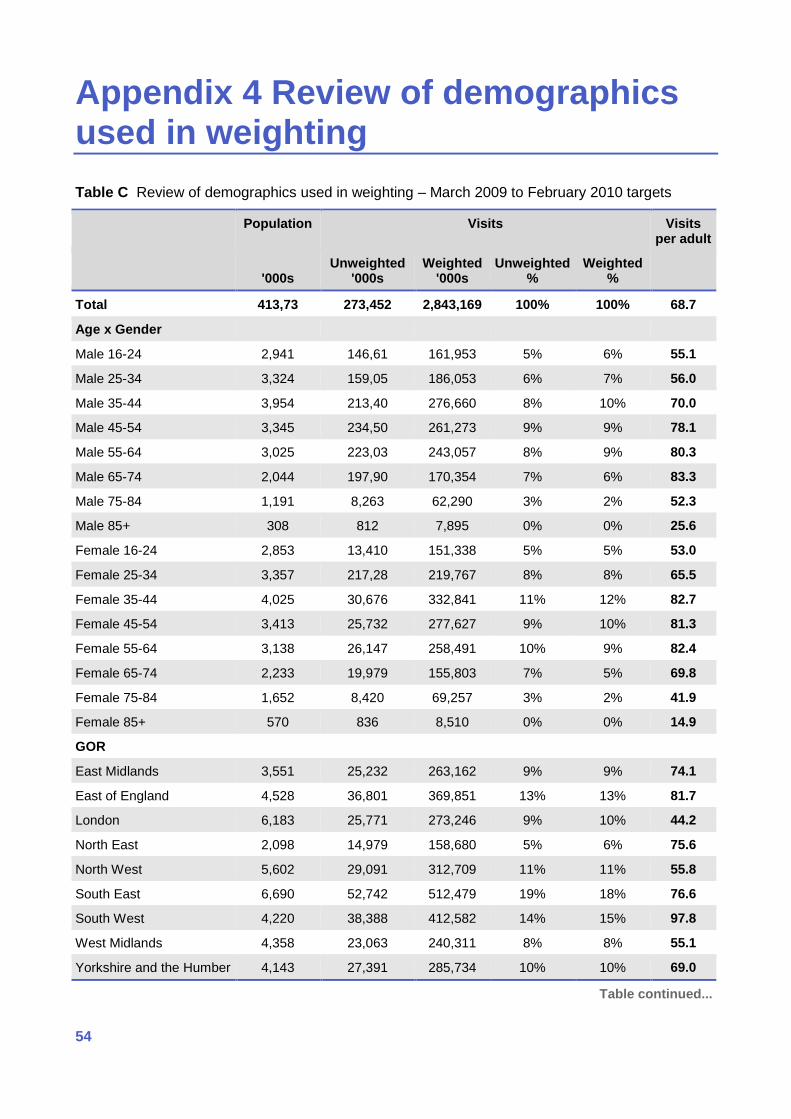
Appendix 4 Review of demographics used in weighting Table C Review of demographics used in weighting – March 2009 to February 2010 targets
Population Visits Visits per adult
'000s
Unweighted '000s
Weighted '000s
Unweighted %
Weighted %
Total 413,73 273,452 2,843,169 100% 100% 68.7
Age x Gender
Male 16-24 2,941 146,61 161,953 5% 6% 55.1
Male 25-34 3,324 159,05 186,053 6% 7% 56.0
Male 35-44 3,954 213,40 276,660 8% 10% 70.0
Male 45-54 3,345 234,50 261,273 9% 9% 78.1
Male 55-64 3,025 223,03 243,057 8% 9% 80.3
Male 65-74 2,044 197,90 170,354 7% 6% 83.3
Male 75-84 1,191 8,263 62,290 3% 2% 52.3
Male 85+ 308 812 7,895 0% 0% 25.6
Female 16-24 2,853 13,410 151,338 5% 5% 53.0
Female 25-34 3,357 217,28 219,767 8% 8% 65.5
Female 35-44 4,025 30,676 332,841 11% 12% 82.7
Female 45-54 3,413 25,732 277,627 9% 10% 81.3
Female 55-64 3,138 26,147 258,491 10% 9% 82.4
Female 65-74 2,233 19,979 155,803 7% 5% 69.8
Female 75-84 1,652 8,420 69,257 3% 2% 41.9
Female 85+ 570 836 8,510 0% 0% 14.9
GOR
East Midlands 3,551 25,232 263,162 9% 9% 74.1
East of England 4,528 36,801 369,851 13% 13% 81.7
London 6,183 25,771 273,246 9% 10% 44.2
North East 2,098 14,979 158,680 5% 6% 75.6
North West 5,602 29,091 312,709 11% 11% 55.8
South East 6,690 52,742 512,479 19% 18% 76.6
South West 4,220 38,388 412,582 14% 15% 97.8
West Midlands 4,358 23,063 240,311 8% 8% 55.1
Yorkshire and the Humber 4,143 27,391 285,734 10% 10% 69.0
Table continued...
54
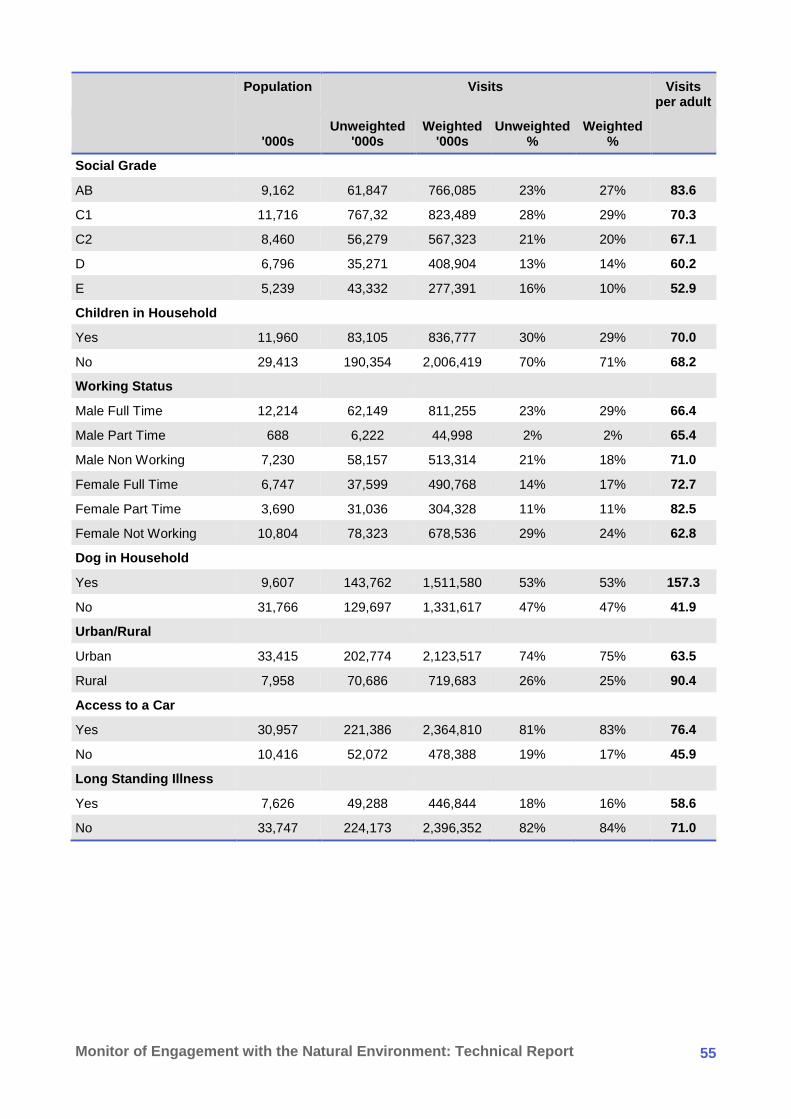
Population Visits Visits
per adult
'000s
Unweighted '000s
Weighted '000s
Unweighted %
Weighted %
Social Grade
AB 9,162 61,847 766,085 23% 27% 83.6
C1 11,716 767,32 823,489 28% 29% 70.3
C2 8,460 56,279 567,323 21% 20% 67.1
D 6,796 35,271 408,904 13% 14% 60.2
E 5,239 43,332 277,391 16% 10% 52.9
Children in Household
Yes 11,960 83,105 836,777 30% 29% 70.0
No 29,413 190,354 2,006,419 70% 71% 68.2
Working Status
Male Full Time 12,214 62,149 811,255 23% 29% 66.4
Male Part Time 688 6,222 44,998 2% 2% 65.4
Male Non Working 7,230 58,157 513,314 21% 18% 71.0
Female Full Time 6,747 37,599 490,768 14% 17% 72.7
Female Part Time 3,690 31,036 304,328 11% 11% 82.5
Female Not Working 10,804 78,323 678,536 29% 24% 62.8
Dog in Household
Yes 9,607 143,762 1,511,580 53% 53% 157.3
No 31,766 129,697 1,331,617 47% 47% 41.9
Urban/Rural
Urban 33,415 202,774 2,123,517 74% 75% 63.5
Rural 7,958 70,686 719,683 26% 25% 90.4
Access to a Car
Yes 30,957 221,386 2,364,810 81% 83% 76.4
No 10,416 52,072 478,388 19% 17% 45.9
Long Standing Illness
Yes 7,626 49,288 446,844 18% 16% 58.6
No 33,747 224,173 2,396,352 82% 84% 71.0
55 Monitor of Engagement with the Natural Environment: Technical Report