natural gas hydrate in india: prospect identification ... gas hydrate in india: prospect...
TRANSCRIPT

_____________________________________________________________________________________________________ *Corresponding author: Email: [email protected];
Journal of Geography, Environment and Earth Science International
3(2): 1-24, 2015; Article no.JGEESI.18860
SCIENCEDOMAIN international
www.sciencedomain.org
Natural Gas Hydrate in India: Prospect Identification, Production Technologies and Associated
Challenges
Nagendra Pratap Singh1* and Anand Prakash2
1Department of Geophysics, Banaras Hindu University, Varanasi- 221 005, (U.P.), India.
2Regional Computer Centre, Oil and Natural Gas Corporation Ltd., Kolkata-700088, India.
Authors’ contributions
This work was carried out in collaboration between both the authors. Author NPS designed the study and wrote the protocol and first draft of the manuscript. Author AP performed the literature searches,
analyses of the study and prepared relevant figures for interpretation and conclusion. Both the authors have read and approved the final manuscript.
Article Information
DOI: 10.9734/JGEESI/2015/18860
Editor(s): (1) Wen-Cheng Liu, Department of Civil and Disaster Prevention Engineering, National United University, Taiwan
and Taiwan Typhoon and Flood Research Institute, National United University, Taipei, Taiwan. Reviewers:
(1) Anonymous, University of Cincinnati, Cincinnati, USA. (2) Anonymous, Chinese Academy of Sciences, China.
Complete Peer review History: http://sciencedomain.org/review-history/10358
Received 13th
May 2015 Accepted 3rd June 2015
Published 30th
July 2015
ABSTRACT This article outlines the prospect of natural gas hydrate in India, its identification, resource estimation and production technologies, and vital challenges associated with the viable production of natural gas from gas hydrates. It contains a brief review of petro-physical and chemical properties of gas hydrate, geological conditions, formation processes, morphology and accumulation of gas hydrate, geophysical, geochemical and microbiological indicators of gas hydrate accumulation, potential locales of gas hydrate, role of geophysical as well as well logging techniques for prospect investigation, conventional production technologies and theirs limitations, production scenario and the environmental issues related with commercial production of gas hydrate in India. The seismic studies for investigation of gas hydrate in Mahanadi and Andaman deepwater basins are depicted to exemplify the scenario of gas hydrate in India. Analysis of seismic data (Bottom simulating reflector (BSR), Coherency inversion and Amplitude-versus-offset (AVO) studies) in combination with geological preconditions (such as high rate of sedimentation, adequate
Review Article

Singh and Prakash; JGEESI, 3(2): 1-24, 2015; Article no.JGEESI.18860
2
depth and temperature coinciding with the BSR) indicate a large area of the order of 250 km2 in the central part of the basin as a probable gas hydrate accumulation area in Mahanadi deepwater basin. The analysis of AVO anomaly of BSR and seismic signatures of the study area in Andaman deep water basin reveal a pool of free gas beneath the hydrate layer which has been corroborated by drilling results of a well in the area.
Keywords: Natural gas hydrate; bottom simulating reflector; geophysical indicators of gas hydrate;
seismic signatures; coherency inversion; amplitude-versus-offset.
1. INTRODUCTION
The ever-increasing demand for sustained industrial growth has forced all of us to look for the future, renewable and alternative energy resources such as coal bed methane in coal seams, gas found in shale, and gas hydrates found below or on the ocean floor in form of ice-like substances. India being one of the fastest growing economies in the world with nearly 6-8% GDP growth rate expects three to four fold increase in the energy demand of the country in coming decades. To meet such a huge demand of energy, India has taken initiatives for harnessing the natural gas associated with unconventional energy resources available as Coal bed methane, Shale gas and the Gas hydrate. This article is intended to describe the prospect of natural gas hydrates in India with regards to its identification and resource estimation techniques, production technologies and vital challenges associated with commercial production of gas from gas hydrates.
Gas hydrates are ice like crystals where gas molecules, methane in most cases, are encaged in hydrogen bonded water lattices at high pressure and low temperature. Natural gas hydrates are unconventional energy resource, and do have the potential of becoming an alternate unconventional energy resource due to its huge deposits envisaged worldwide [1]. The potential reserves of gas trapped in gas hydrate around the world are estimated at over 1.5x10
16
m3 [2,3,4]. About 97% of natural gas hydrates are located offshore and only 3% on land. The huge reserve of methane trapped in gas hydrates around the world has prompted a recent increase in hydrate researches worldwide. India has also initiated active researches for establishing the gas hydrate reserves in east and west coast by collecting geophysical, geological, geochemical and microbiological data under its National Gas Hydrate Programme (NGHP) initiated and funded by Ministry of Petroleum and Natural Gas, Government of India.
India has shown its presence on World Gas Hydrate Map (Fig. 1) by striking a huge gas hydrate deposit in Krishna-Godawari (KG) basin under its National Gas Hydrate Program (NGHP) Expedition-1 [5,6], and development programs are in process under the NGHP consortium of National Institute of Oceanography (NIO), National Institute of Ocean Technology (NIOT), National Geophysical Research Institute (NGRI), Oil India Limited, Gas Authority of India limited and Oil and Natural Gas Corporation Limited (ONGC). Gas hydrate deposits in India are expected in the East and West coast deepwater areas and in Andaman Deep Water Basin [5,7-20].
Gas hydrates are also of interest because of their potential role in climate change. Gas hydrates in continental shelf sediments can become unstable either as a result of warming bottom water, or as a result of a pressure drop due to a reduction in sea level (such as during an ice age). If these marine gas hydrates begin to rapidly disassociate into gas + water, then the methane trapped in the gas hydrates can be released to the atmosphere. Therefore, if the flux of methane to the atmosphere from dissociating hydrates is sufficient in quantity, this methane can cause global warming. This process is believed to have influenced past climate changes [21-25], and the Late Quaternary (about 15000 yrs ago) climate change is believed thought to be caused by the hydrates which (in a process called ‘hydrate gun hypothesis’) led to significant global warming [26].
2. PROPERTIES OF GAS HYDRATE
2.1 Petro-physical and Chemical Properties of Gas Hydrate
Physical properties of gas hydrate is very similar to those of ice, since the hydrate has 85% (mole) water and 15% (mole) gas, if all the cages of the hydrate structure sI, sII, and sH are filled by gas [27]. Gas hydrates are white, crystalline, ice-like materials comprised of a methane molecule

Singh and Prakash; JGEESI, 3(2): 1-24, 2015; Article no.JGEESI.18860
3
surrounded by a cage of water molecules. The hydrates are mostly methane rich, but are sometimes associated with ethane, propane, butane, carbon dioxide and hydrogen sulfide. Gas hydrates, also called clathrates, are mechanical mixtures of natural gas and water, forming a crystalline solid in cold environments and are stable under low temperature and high pressure. These mixtures are called ‘inclusion compounds’. The water molecules surround the gas molecules to form cages that trap the gas into the crystals (Fig. 2). There is no chemical bond between the water and the gas, so the crystal is not a chemical compound. Natural gas hydrate is also known as methane hydrate, hydromethane, methane ice, and fire ice. Common clathrate compounds of interest are those formed from CO2/H2O and CH4/H2O mixtures. The CO2/H2O clathrate is used for carbon sequestration whereas CH4/H2O clathrate is used for the extraction of methane gas. In appearance, hydrates are inter-grown, transparent-to-translucent, white-to-grey and yellow crystals, with poorly defined crystal form. Hydrates may cement sediments in which they occur, or they may occur in pore spaces in uncemented sediment grains. Hydrates can occupy a significant percentage of pore space in high-porosity sediments, and can occur in large, contiguous deposits.
The gas hydrates are mainly found in the permafrost and outer continental margins of the world where the methane concentration exceeds its solubility limit [22,28-30]. They can extend below the base of permafrost, even though formation temperature is above 0°C. Hydrates are formed at high pressure (8-30 MPa) and low
temperature (10–20°C) in shallow sediments, and are stable up to a few hundred meters below the sea floor [31,32]. Methane trapped in hydrates and free gas below the hydrate-bearing sediments is found in huge amount. The quantity of gas in hydrate does not depend on the depth, pressure, or temperature of the reservoir.
2.2 Conditions for Formation and Deposition of Gas Hydrate
The fundamental conditions controlling hydrate formation and stability are (1) adequate supplies of water and methane, (2) suitable temperatures and pressures, and (3) geochemical conditions. The sediment types and textures may also be other controlling factors. 2.2.1 Formation of Gas Hydrate Hydrates can form in several ways. In the arctic, there is a belief that many hydrate accumulations represent pre-existing free gas accumulations that have been converted to hydrate by subsequent change in environmental conditions. In the marine environment, hydrate is often considered to have formed from solution, as methane is generated by in-situ microbial processes to the point where the water becomes saturated with methane and hydrate growth begins. There is also a high possibility that methane hydrate could accumulate in coarser-grained marine sediments by the migration of gas from deeper, warmer zones, up through various pathways such as faults, and into water-bearing shallow sediments where it is then converted to methane hydrate.
Fig. 1. Distribution of discovered gas hydrate deposits [3]

Fig. 2. Schematic drawing of one type of natural gas clathrate structure in which a methane
molecule (grey) is encaged by a lattice of water molecule (red)
Methane is formed in two ways. First, biogenic methane is the common by-product of bacterial ingestion of organic matter. Methane is produced in shallow subsurface environments through biological alteration of organic matter (with original ratio of Carbon: Nitrogen: Phosphorus of 106:16:1). The equation (1) describes the successive stages of oxidation by oxygen and reduction by nitrates, sulfates, and carbonates [34].
(CH20)106(NH3)16(H2PO4) 53CO+16NH3+H2PO4
The same process which produces methane in swamps, landfills, rice paddies, and the digestive tracts of mammals occurs continually within buried sediments in geologic environments all around the globe. Biogenic processes are capable of producing vast amounts of methane, and are considered to be the dominant source of the methane trapped in hydrate layers within shallow sea floor sediments. Second, thermogenic methane is produced by the combined action of heat, pressure and time on buried organic material. In the geologic past, conditions have periodically recurred in which vast amounts of organic matter were preserved within the sediment of shallow, inland seas. Over the time and with deep burial, these organicsource beds are literally pressure
Singh and Prakash; JGEESI, 3(2): 1-24, 2015; Article no.
4
Schematic drawing of one type of natural gas clathrate structure in which a methane molecule (grey) is encaged by a lattice of water molecule (red) [33]
Methane is formed in two ways. First, biogenic
product of bacterial ingestion of organic matter. Methane is produced in shallow subsurface environments through biological alteration of organic matter (with
Nitrogen: Phosphorus of 106:16:1). The equation (1) describes the successive stages of oxidation by oxygen and reduction by nitrates, sulfates, and carbonates
53CO2+53CH4
(1)
The same process which produces methane in swamps, landfills, rice paddies, and the digestive tracts of mammals occurs continually within buried sediments in geologic environments all
processes are capable of producing vast amounts of methane, and are considered to be the dominant source of the methane trapped in hydrate layers within shallow sea floor sediments. Second, thermogenic methane is produced by the
ressure and time on buried organic material. In the geologic past, conditions have periodically recurred in which vast amounts of organic matter were preserved within the sediment of shallow, inland seas. Over the time and with deep burial, these organic-rich source beds are literally pressure-cooked with
the output being the production of large quantities of oil and natural gas. In this process, the thermal cracking of organically derived materials occurs at considerable depth [> 2 km] in sedimentary basins where temperatures exceed l00°C. Along with the oil, the gas (largely methane, but also ethane, propane and other larger molecules) slowly migrates upwards due to its buoyancy relative to water. If sufficient quantities reach the zone of hydrate stabilitgas will combine with local formation water to form hydrate. Thermogenic methane may also be derived by thermal degradation of oil at even greater depths, and by the maturation of coal. Thus biogenic methane formation may take place both in situ [within the hydrate stability zone] and beneath it, whilst thermogenic methane must be formed below the Hydrate Stability Zone (HSZ), and move up into it. Geo-chemical and isotopic techniques are used to identify the biogenic or thermogenic origin of the methprogressively fills and cements the sediment pore-spaces and fractures, giving rise to massive and vein type hydrate deposits. 2.2.2 Temperature and pressures Methane hydrates are thermodynamically stable within a limited range of pressure and temperature (P-T) conditions, and exist where suitable P-T conditions and sufficient quantities
; Article no.JGEESI.18860
Schematic drawing of one type of natural gas clathrate structure in which a methane
the output being the production of large quantities of oil and natural gas. In this process, the thermal cracking of organically derived materials occurs at considerable depth [> 2 km]
s where temperatures exceed l00°C. Along with the oil, the gas (largely methane, but also ethane, propane and other larger molecules) slowly migrates upwards due to its buoyancy relative to water. If sufficient quantities reach the zone of hydrate stability, the gas will combine with local formation water to form hydrate. Thermogenic methane may also be derived by thermal degradation of oil at even greater depths, and by the maturation of coal. Thus biogenic methane formation may take place
thin the hydrate stability zone] and beneath it, whilst thermogenic methane must be formed below the Hydrate Stability Zone (HSZ),
chemical and isotopic techniques are used to identify the biogenic or thermogenic origin of the methane. Hydrate progressively fills and cements the sediment
spaces and fractures, giving rise to massive
pressures
Methane hydrates are thermodynamically stable within a limited range of pressure and
T) conditions, and exist where T conditions and sufficient quantities

Singh and Prakash; JGEESI, 3(2): 1-24, 2015; Article no.JGEESI.18860
5
of gas and water are available in the pore spaces of sediments. Worldwide these sediments are found in polar region in association with permafrost and in the deep-water sedimentary basins. Gas hydrates are concentrated at the depocenters of the continental margins where both organic detritus (from which bacteria generate methane) and sediments (which protect detritus from oxidation) accumulate rapidly. The temperature and pressure conditions for hydrate stability depend on the composition of the gas and on the presence of salts and other components in seawater. It is generally believed that pore water has to be fully saturated with methane before natural hydrate can form. The various phases of water, ice, hydrates and free gas are determined by a phase diagram, which depends on the specific gravity of the gas, salinity of the water, temperature, and pressure. Since temperature and pressure are functions of depth, so the phase diagrams are often plotted versus depth, using assumed pressure and temperature gradients. The schematic examples of phase diagram for on-shore and off-shore situations are shown in Fig. 3. These diagrams show the combination of temperatures and pressures (the phase boundary) that mark the transition from a system of co-existing free methane gas and water/ice to solid methane hydrate. When conditions move to the left across the boundary, hydrate formation will occur, whereas moving to the right across the boundary results in the dissociation (akin to melting) of the hydrate structure and the release of free water and methane. In general, a combination of low temperature and high pressure is needed to support methane hydrate formation.
2.2.3 Geochemical conditions
In addition to temperature and pressure, the composition of water and gas are critically important for predictions of stability of gas hydrates in specific settings for both the fresh water and the seawater. However, natural subsurface environments exhibit significant variations in formation water chemistry which create local shifts in the pressure/temperature phase boundary such as a higher salinity restricts hydrate formation causing the phase boundary to shift to the left (Fig. 4). Similarly, the presence of small amounts of other natural gases, such as carbon dioxide (CO2), hydrogen sulfide (H2S) and larger hydrocarbons such as ethane (C2,H6), will increase the stability of the hydrate, shifting the curve to the right. As a result, hydrates that appear to be well above the
base of hydrate stability (from pressure-temperature relationships) may actually be very close to the phase boundary due to local geochemical conditions.
2.2.4 Morphology of methane hydrate
Gas hydrate occurs in various modes such as the grain-displacing modes in various forms and sizes as nodules or lenses; interconnected veins and fracture fills. Malone described four types of possible morphologies- disseminated, nodular, vein, and massive [35]. Disseminated hydrate occurs within the pore space of the sediment, while others occur where sediments are disturbed either by regional tectonic stresses or through the stress generated by the hydrate crystal growth [36]. Within KG basin, India, the largest accumulation of gas hydrate is found in fractured, fine grained sediment at site NGHP-01-10 [5,37]. Fig. 5 depicts different types of morphology of hydrates found in KG Basin, India. However, some researchers disagree with this classification. Theoretical studies on hydrate formation [38-40] concluded that coarser grained sediments having large pores are better host than fine grained mud/clay. Holland et al. suggested two basic hydrate morphologies: pore filling and grain displacing [41].
2.3 Geological Settings where Gas Hydrate Occur
Gas hydrates occur in two discrete geological situations:
(1). Marine shelf sediments distributed worldwide [22,43].
(2). On-shore polar regions beneath permafrost.
The hydrates occur in these two settings because these are the settings where the pressure-temperature conditions are within the hydrate stability limits [44]. Hydrates have been discovered along the coastlines of all continents, even at temperate latitudes, and in deep water trenches in the Pacific. Significant gas hydrate accumulations have been identified on the North Slope of Alaska, USA; in the Northwest Territories of Canada; in the Gulf of Mexico; and offshore Japan, India, South Korea and China. The prospective gas hydrate deposits in India occur in marine shelf sediments settings.
3. LOCALE OF GAS HYDRATE IN INDIA
Indian offshore gas hydrates are formed in the continental slope area. Rivers bring a lot of

Singh and Prakash; JGEESI, 3(2): 1-24, 2015; Article no.JGEESI.18860
6
sediments with organic material and dump them into the sea. Depending on the shelf width these sediments travel further and settle in the slope region, where the organic material (called Total Organic Content or TOC) are acted upon by methane producing bacteria (methanogens) in anaerobic environment and produces methane. This methane when already within the GHSZ forms hydrate within the pore spaces. The
Krishna-Godavary (KG), Cauvery and Andaman basins are prospective Gas hydrate offshore basins in India [8,45], and the studies are in progress to establish the gas hydrate in Cambay and Mahanadi deepwater basins [13-16], and Konkan-Kerala offshore [46]. The prospective gas hydrate deposit locations in India are shown in Fig. 1.
Fig. 3. Schematic phase diagram for (Left): on-shore situation where temperature is low enough to permit hydrate formation (blue shading), (Right): deep water off-shore situation having different temperature profile, due to which hydrates can form near seafloor in very
recent sediments (blue shading)
Fig. 4. Left: Graph showing effect of salinity on hydrate phase. Right: Effect of gas specific gravity on hydrate phase [42]

Singh and Prakash; JGEESI, 3(2): 1-24, 2015; Article no.JGEESI.18860
7
Fig. 5. Gas hydrate samples from KG Basin, India showing different morphology [5]
4. TECHNIQUES FOR IDENTIFICATION OF GAS HYDRATE
Gas hydrates in sediments can be identified by various direct and indirect methods. Geophysical data, particularly seismic is the most commonly used method which utilizes the acoustic velocity of hydrate sediments as distinguishing property for identification of gas hydrates. The seismic attributes such as reflection strength and instantenious frequency also provide some clues for presence of gas hydrate. Logging while drilling measurements (LWD) and Wire-line logging provide most valuable clues for the presence of gas hydrates in the sediments. Geochemical and microbilogical indicators also provide valuable symptom for the hydrate accumulation in sediments.
4.1 Geophysical Indicators of Gas Hydrate
Geophysical surveys are the primary tools for detecting the gas hydrate accumulations in marine sediments. Seismic surveys (2D/3D seismic, ocean bottom seismic, vertical seismic profiling, and cross-well and multi-component seismic), well logging, and controlled source magneto telluric surveys are the commonly used geophysical techniques for identification and
evaluation of gas hydrate deposits. Followings are the robust geophysical indicators of gas hydrate accumulation in sediments. 4.1.1 Bottom Simulating Reflector (BSR) and
Gas Hydrate Stability Zone (GHSZ) thickness
Most of gas hydrates, worldwide have been inferred from the detection of Bottom Simulating Reflector (BSR) and mapping of Gas Hydrate Stability Zone (GHSZ) thickness [47-50]. The BSR is recognized on the basis of its characteristic features such as; (i) mimicking the shape of sea floor because the BSR follows isotherms, which are nearly parallel to the morphology of sea floor, (ii) cutting across the underlying/overlying dipping strata and (iii) exhibiting large amplitude but opposite polarity to that of the seafloor reflections [51]. BSR is the interface between gas hydrate-bearing sediments above and free-gas saturated sediments below the interface and is often associated with the base of the gas hydrate stability field [22]. The GHSZ is defined by the maximum range of depth from BSR to seafloor through which gas hydrate can exist in seafloor sediments. The BSR is generated due to the strong impedance (velocity * density) contrast between hydrated sediments above the

Singh and Prakash; JGEESI, 3(2): 1-24, 2015; Article no.JGEESI.18860
8
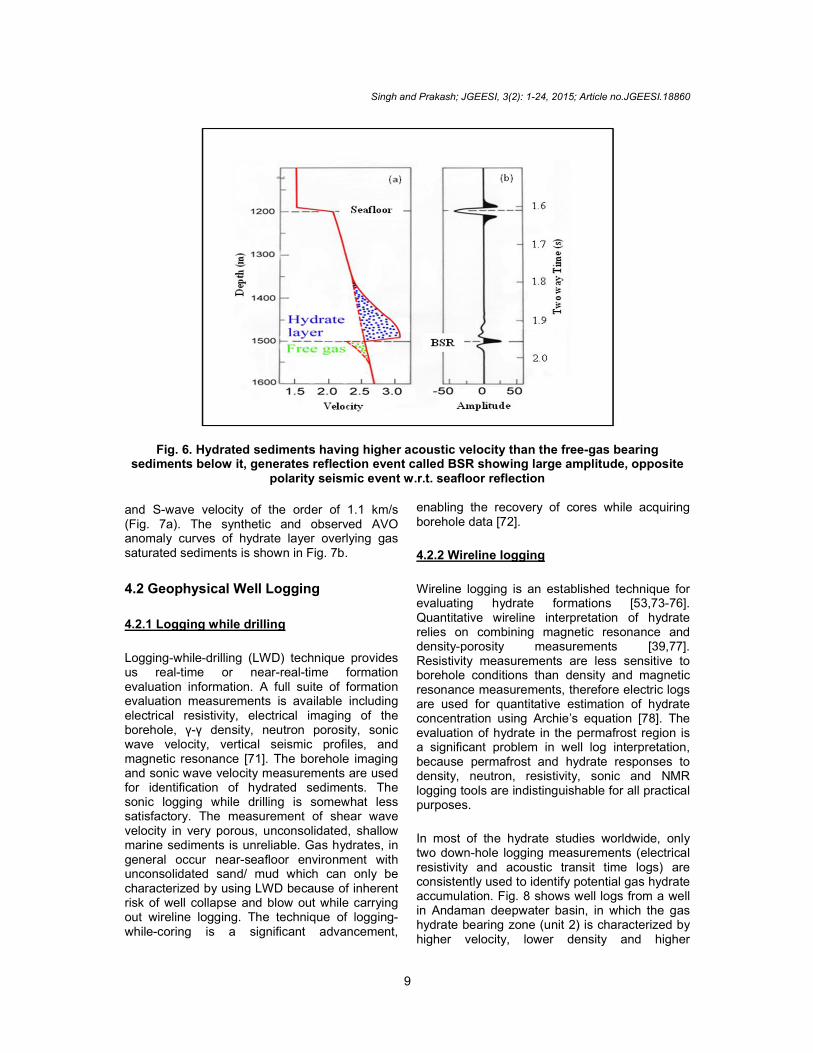
water/gas bearing sediments giving rise to large negative reflection coefficient (Fig. 6).
The BSR may not be continuous, indicating an upward gradation between a hydrate layer above and a free gas layer below the BSR. The Gulf of Mexico, Blake Ridge, Cascadia Margin, MacKenzie Delta, Nankai Trough and KG basin are some of the best known examples depicting BSR associated with gas hydrate accumulations [5,52-57]. Theoretical models [58], and synthetic studies [54] indicate that the BSR is not a necessary condition for the presence of hydrate, as it only occurs when there is free gas beneath the distinct gas hydrate phase boundary. If there is no free gas below gas hydrate, there will not be BSR. Indeed, sediments containing gas hydrate have been recovered from areas where there is no BSR [52,59,60]. Further, all the BSR–like reflections are not generated from gas hydrate sediments but they may also be generated by the temprature-controlled diagenetic effects. In fact, BSR represents an acoustic velocity contrast in the sediments (assuming densities to be almost same) that may be attributed to lithology transitions. Nonetheless, BSR coupled with other seismic evidence is the most robust indirect indicator of hydrate accumulation in the sub-seafloor sediments. 4.1.2 Seismic velocity of hydrate-bearing
sediments Seismic data analysis provides acoustic velocities- P-wave and S-wave (Vp and Vs) information across the BSR. Vertical seismic profile (VSP) data, sonic log and laboratory tests are some other techniques which provide seismic velocities of the hydrated sediments. The conventional seismic data provides Vp, and in most of the cases Vs is estimated through indirect methods such as from Amplitude variation with angle (AVA) response of P-wave seismic data. The multicomponent seismic data can provide more accurate estimate of Vs. Waveform inversion of seismic data [61] provides most reliable and higher resolution seismic velocity than conventional velocity analysis methods. Hydrated sediments normally show higher interval velocities than sediments without gas hydrate [47,62]. The inerval velocity may be as higher as 2600 m/s and as low as 1750 m/s [13,16]. This velocity decrease across BSR is known as inversion. The velocity analysis, such as stacking/ migration velocity analysis, depicts veocity inversion across the BSR. The velocity pannels showing acoustic velocities across BSR
in Mahanadi and Andaman deepwater basins are shown in Figs. 10 and 14 (section 5) respectively. In Andaman deepwater basin (Fig. 14), the possible hydrated sediments shows Vp of the order of 1950 m/s against the background velocity of 1650 m/s; 18% higher which may be attributed to the higher saturation of gas hydrate. Hence, the velocity inversion across the BSR is also an important indicator of hydrate accumulation in the marine sediments.
4.1.3 Amplitude blanking
The amplitudes of seismic reflections from within the gas hydrate zones are generally much lower in the areas of an observed BSR as compared to the adjecent areas where gas hydrate seems to be absent. Such sudden seismic refelction amplitude reduction caused by hydrate cementation of the sediment is called blanking and this phenomenon is a useful seismic attribute for locating possible hydrate deposits [63,64]. Lee et al. have attempted to correlate the amont of hydrates in the sediments with the amplitude blanking on the seismic data in the Blake Ridge area, Southeastern USA [65].
4.1.4 Amplitude-versus- offset (AVO)/
Amplitude-versus- Angle (AVA)
In petroleum industry, high amplitude reflection event (bright spot) in seismic data is one of the direct hydrocarbon indicators, particularly gas. AVO analyses of common depth point (CDP) gathers to determine the change in reflection amplitude as a function of offset or angle are carried out to validate that the amplitude anomalies are associated with gas charged sediments [66]. AVO interpretations are based upon the theory and observation that free gas substantially reduces P-wave velocity with little effect on S-wave velocity [67]. The P-wave reflection amplitude changes with reflection angle depending on shear wave as well as compreesional wave velocities above and below the reflecting interface, especially to the Vp/Vs
ratio or to Poisson’s Ratio [66,68,69]. Ecker and Lumley have carried out AVO analysis of seismic data in the Blake outer Ridge offshore, Florida showing very strong BSR associated with methane hydrate deposits in deep marine sediments [70]. The hydrate bearing sediments show high P-wave velocity of the order of 2.5 km/s and anomalously low S-wave velocity (~0.5 km/s), while the underlying gas-bearing sediments show low P-wave velocity (1.6 km/s)
Singh and Prakash; JGEESI, 3(2): 1-24, 2015; Article no.JGEESI.18860
9
Fig. 6. Hydrated sediments having higher acoustic velocity than the free-gas bearing sediments below it, generates reflection event called BSR showing large amplitude, opposite
polarity seismic event w.r.t. seafloor reflection
and S-wave velocity of the order of 1.1 km/s (Fig. 7a). The synthetic and observed AVO anomaly curves of hydrate layer overlying gas saturated sediments is shown in Fig. 7b.
4.2 Geophysical Well Logging
4.2.1 Logging while drilling
Logging-while-drilling (LWD) technique provides us real-time or near-real-time formation evaluation information. A full suite of formation evaluation measurements is available including electrical resistivity, electrical imaging of the borehole, γ-γ density, neutron porosity, sonic wave velocity, vertical seismic profiles, and magnetic resonance [71]. The borehole imaging and sonic wave velocity measurements are used for identification of hydrated sediments. The sonic logging while drilling is somewhat less satisfactory. The measurement of shear wave velocity in very porous, unconsolidated, shallow marine sediments is unreliable. Gas hydrates, in general occur near-seafloor environment with unconsolidated sand/ mud which can only be characterized by using LWD because of inherent risk of well collapse and blow out while carrying out wireline logging. The technique of logging-while-coring is a significant advancement,
enabling the recovery of cores while acquiring borehole data [72].
4.2.2 Wireline logging
Wireline logging is an established technique for evaluating hydrate formations [53,73-76]. Quantitative wireline interpretation of hydrate relies on combining magnetic resonance and density-porosity measurements [39,77]. Resistivity measurements are less sensitive to borehole conditions than density and magnetic resonance measurements, therefore electric logs are used for quantitative estimation of hydrate concentration using Archie’s equation [78]. The evaluation of hydrate in the permafrost region is a significant problem in well log interpretation, because permafrost and hydrate responses to density, neutron, resistivity, sonic and NMR logging tools are indistinguishable for all practical purposes.
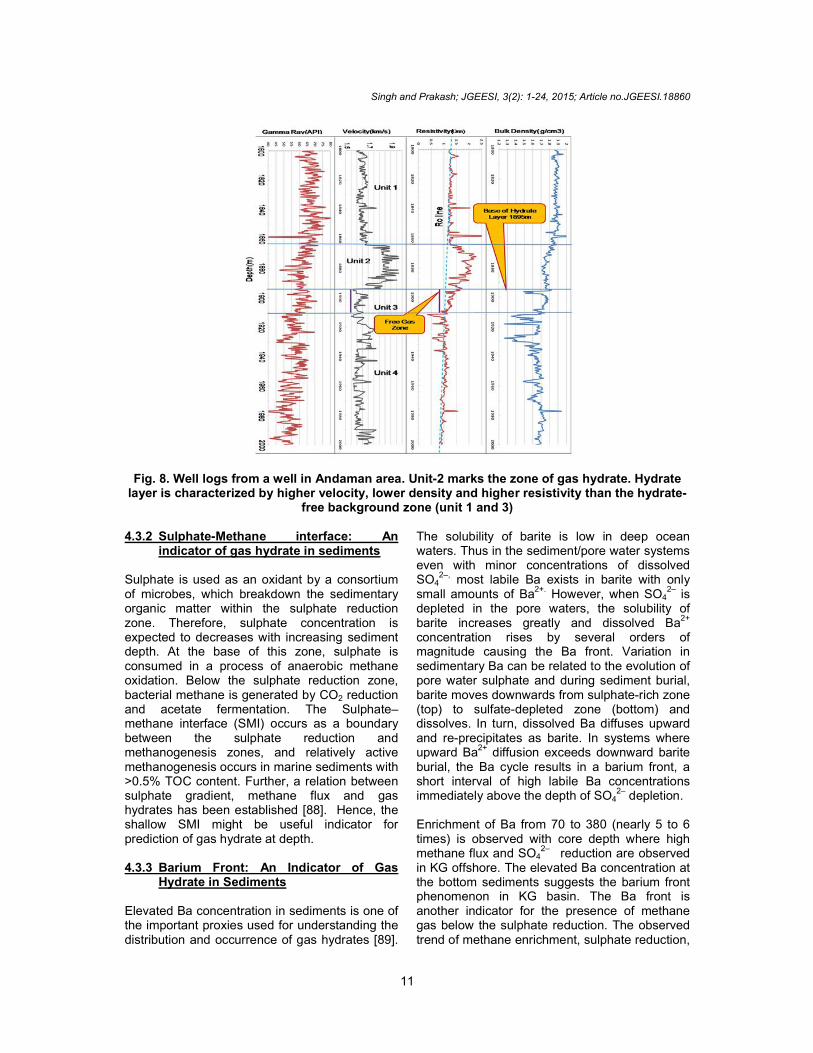
In most of the hydrate studies worldwide, only two down-hole logging measurements (electrical resistivity and acoustic transit time logs) are consistently used to identify potential gas hydrate accumulation. Fig. 8 shows well logs from a well in Andaman deepwater basin, in which the gas hydrate bearing zone (unit 2) is characterized by higher velocity, lower density and higher

Singh and Prakash; JGEESI, 3(2): 1-24, 2015; Article no.JGEESI.18860
10
resistivity than the hydrate-free background zone (unit 1 and 3) [16].
4.3 Geo-chemical Indicators of Gas Hydrate
The most important geochemical indicators for gas hydrate deposits in the sediments are SO42- and Cl- concentrations of the pore water. Barium front is also another indicator for gas hydrate in the sediments.
4.3.1 Chloride anomaly: An indicator of gas hydrate in sediments
During gas hydrate formation process (similar to ice formation process) salt ions are excluded from the crystal structure of hydrates. The excluded salt increases the pore-water chlorinity in the sediments initially [79]. If the diffusion rate of the salt is less than the rate of hydrate formation then the concentration of Cl
- in the pore
water of the sediments would be more than the adjacent areas, but high salinity pore water
diffuses back to the ambient levels with time if hydrate formation is slower than the rate of diffusion. Further, on destabilization of gas hydrates, the elevated chloride concentration gets diluted with the release of pure water back into the pore space; causing freshening. Thus pore water freshening is considered as one of the most common indirect geochemical indicators of gas hydrates in sediments, but they can also be generated by the fluid flows [80], clay dehydration and opal formation [81-83]. In analysis of core from Goa, the observed gentle depletion trend of Cl- perhaps indicate the ongoing process of freshening due to destabilizing of gas hydrate at deeper level. But the cores from KG basin do not show any anomalous behavior. The decreasing pore water chlorinity trend with depth in gas hydrate bearing sediments are also reported in the Blake Outer Ridge [84], offshore Guatemala [85], and in offshore Peru [86]. Takeuchi and Matsumoto estimated gas hydrate saturation in the sediments pore to be 65% to 80% from the chloride anomalies in the interstitial water from the Nanakai Trough, Japan [87].
Fig. 7. (a) Interval Velocity model in the hydrated sediments overlying gas-bearing sediments, (b) Synthetic AVO curve of hydrate layer overlying gas saturated sediments (solid line)
compared with observed one (stars) [70]
Singh and Prakash; JGEESI, 3(2): 1-24, 2015; Article no.JGEESI.18860
11
Fig. 8. Well logs from a well in Andaman area. Unit-2 marks the zone of gas hydrate. Hydrate layer is characterized by higher velocity, lower density and higher resistivity than the hydrate-
free background zone (unit 1 and 3) 4.3.2 Sulphate-Methane interface: An
indicator of gas hydrate in sediments Sulphate is used as an oxidant by a consortium of microbes, which breakdown the sedimentary organic matter within the sulphate reduction zone. Therefore, sulphate concentration is expected to decreases with increasing sediment depth. At the base of this zone, sulphate is consumed in a process of anaerobic methane oxidation. Below the sulphate reduction zone, bacterial methane is generated by CO2 reduction and acetate fermentation. The Sulphate– methane interface (SMI) occurs as a boundary between the sulphate reduction and methanogenesis zones, and relatively active methanogenesis occurs in marine sediments with >0.5% TOC content. Further, a relation between sulphate gradient, methane flux and gas hydrates has been established [88]. Hence, the shallow SMI might be useful indicator for prediction of gas hydrate at depth. 4.3.3 Barium Front: An Indicator of Gas
Hydrate in Sediments Elevated Ba concentration in sediments is one of the important proxies used for understanding the distribution and occurrence of gas hydrates [89].
The solubility of barite is low in deep ocean waters. Thus in the sediment/pore water systems even with minor concentrations of dissolved SO4
2–, most labile Ba exists in barite with only small amounts of Ba
2+. However, when SO4
2– is
depleted in the pore waters, the solubility of barite increases greatly and dissolved Ba
2+
concentration rises by several orders of magnitude causing the Ba front. Variation in sedimentary Ba can be related to the evolution of pore water sulphate and during sediment burial, barite moves downwards from sulphate-rich zone (top) to sulfate-depleted zone (bottom) and dissolves. In turn, dissolved Ba diffuses upward and re-precipitates as barite. In systems where upward Ba2+ diffusion exceeds downward barite burial, the Ba cycle results in a barium front, a short interval of high labile Ba concentrations immediately above the depth of SO4
2– depletion. Enrichment of Ba from 70 to 380 (nearly 5 to 6 times) is observed with core depth where high methane flux and SO4
2– reduction are observed in KG offshore. The elevated Ba concentration at the bottom sediments suggests the barium front phenomenon in KG basin. The Ba front is another indicator for the presence of methane gas below the sulphate reduction. The observed trend of methane enrichment, sulphate reduction,

Singh and Prakash; JGEESI, 3(2): 1-24, 2015; Article no.JGEESI.18860
12
Cl- depletion and sulphate methane interface (SMI) with depth in conjecture of Ba front can be used as proxy indicators for occurance of gas hydrate below sea floor. 4.3.4 Authigenic carbonates: An indicator of
gas hydrate in sediments
Methane seep sites are generally associated with the presence of authigenic carbonates [90-93]. The dissociated methane gas releases CO2 (either by reduction or by oxidation) which reacts with calcium and magnesium in sea water, precipitating carbonate slabs and nodules that are enriched in the light carbon isotopes.
4.4 Microbiological Indicators of Gas Hydrate
The dissociated gas from the hydrates at depths contains methane, small amount of hydrogen sulfide, ammonia and fresh water. These gases oxidized into carbon dioxide, sulfates and nitrates which are rich nutrients for the bacteria such as methanotrophs. The presence of vestmentifera, tubes or calm colonies are the indicator for buried hydrates at depths [94]. The occurrence of sulphate reducing bacteria SRB_r (reducers) and SRB_f (fermenters) in the sediments indicates gas hydrate deposits. The presence of bacteria found in the core analysis has validated the hydrate deposits in KG basin [8].
5. EXAMPLES OF SEISMIC STUDIES FOR PROSPECT IDENTIFICATION OF GAS
HYDRATE IN INDIA
Presence of gas hydrates have been established through drilling samples recovered under different natural gas hydrate projects. However, their presence over large areas can only be detected more effectively by seismic reflection surveys. Seismic reflection techniques are important tools for characterizing the gas hydrate zones. The gas hydrates have very strong effects on seismic reflections because of high acoustic impedance contrast across the boundary separating overlying gas hydrate and underlying water saturated or free gases saturated zone. The presence of massive gas hydrate accumulation (>80 m thick) in KG basin has been confirmed by drilling core recovered under NGHP Expedition-1 [5]. Seismic studies to identify the prospect of gas hydrates in Andaman deepwater
basin, Mahanadi deepwater basin, Kerla-Konkan offshore and other locations of Western Continental Margin of India are in progress [95]. In this section, it is devised to present the results of seismic studies in Mahanadi and Andaman Deepwater Basins.
5.1 Results of Seismic Studies in Mahanadi Deepwater Basin, India
In Mahanadi deepwater basin, BSR-like anomalous features are reported in many areas. Therefore, with the view of establishing the presence of gas hydrate, 3D seismic data of Mahanadi deepwater basin revealing BSR in certain part of the basin area, are analyzed [13]. The velocity and amplitude (VAMP) study of BSR is performed and velocity inversion is carried out to examine whether these BSRs are due to gas hydrate accumulation in the basin. The results of seismic analyses are as following.
The study area in Mahanadi deepwater basin covers the mid slope to abyssal region of the eastern continental margin of India [13,14]. Depth of the sea bed varies from 200 m to 2700 m with steep slope from 200 m to 2200 m in the northern part and a gentle increase in water depth up to 2700 m in the southern part. The Neogene section in the area comprises predominantly clay-stones with minor sand and silts. Polygonal faults are dominant in upper few hundred meter sections. The 85° East Ridge passes through the middle of the study area. The gas escape features such as gas chimney, zones of gas masking/saturation, and mud diapirs are not seen clearly on the seismic sections of the area. The possible reason for this could be the low frequency seismic data (3-120 Hz) acquired for hydrocarbon exploration with deeper interest. The seismic sections in the area show the presence of BSR-like anomalous reflections 300-400 ms below the seabed. These BSR-like features are distinct and follow the characteristic features such as mimicking the seafloor, polarity reversal, cross-cutting the lithological formations, and blanking above and below the BSR. A typical PSTM gather from area depicts BSR reflection with opposite polarity to sea bottom reflection (Fig. 9). The bottom simulating reflections are very strong at some places and feeble at other places. The reflection strengths of BSRs may be attributed to the saturation of free gas beneath reflector as well as upward gradation of gas hydrate and its saturation level.

Singh and Prakash; JGEESI, 3(2): 1-24, 2015; Article no.JGEESI.18860
13
The analysis of seismic data in the area reveals that these BSR reflections are present in the region of structural low at the Neogene level, indicating that the gas hydrate accumulation may be restricted in and around the depositional center. In these areas, the sedimentary thickness is more than the usual thickness in the area and therefore the methane gas generation might be restricted to this depositional center. The gas hydrate stability zone thickness calculated using BSRs is found to be of the order of 350-450 m, which is lower than the GHSZ thickness (600-700 m) in Mahanadi basin area estimated on the basis of geothermal gradient, sea bed temperature, and bathymetry data [96,97]. The difference may be attributed to the estimation errors of geothermal gradient, sea temperature, heat flow, interval velocity, etc. However, the estimate of GHSZ thickness calculated by seismic methods should be more reliable. Therefore, on the basis of mapping of GHSZ thickness, it can be envisaged that the thin GHSZ areas might be indicative of fluid flow, and thus likely areas of methane flux that could have generated the gas hydrate deposits. The BSRs are mapped and delineated throughout the area and the areal extent of these features is quite large, of the order of 250 km
2 in the central
western part of the area. Coherency inversion of PSTM gathers (Fig. 10), indicates a velocity inversion at the base of the BSR. The interval velocity reduces from 1750 m/s to 1520 m/s across the BSR. The interval velocity of hydrate bearing sediment above BSR
is lower than the interval velocity usually encountered in the classic cases. This might be due to the low hydrate saturation in the sediments and/or the presence of clay sediments in the host rock. The drilled wells in the area also confirmed the presence of clay in the top few hundred meters from the sea bed. However, the presence of very good reflection events (Fig. 9) may be due to some silt content, fine sand layers, and laminated clay layers in the top few hundred meters of lithological section. Extensive faulting in the shallow seismic section is polygonal in nature and may be the result of fluid expulsion during the digenetic processes and neo-tectonics in the area. Further, a correlation of depositional model in the area with GHSZ thickness reveals that the clay-dominant depositional center, the possible gas hydrate deposition area in Mahanadi deep water basin, is associated with a thin gas hydrate stability zone. AVO analysis of PSTM gathers show increase of amplitude with offset, which indicates that sediments below the hydrate might be saturated with the free gas. Fig. 11 shows AVO response of a particular PSTM gather from which it can be observed that BSR shows noticeable increase of amplitude with angle. Normally, the BSR shows increase in amplitude with offset [98]; therefore, the observed AVO response for BSR is similar to that expected. The overall analysis of 3-D seismic data depicts BSR-like features in the central part of basin confined to the areas of structural low at
Fig. 9. Seismic section showing BSR and sagging at Neogene level (Inline-A)

Singh and Prakash; JGEESI, 3(2): 1-24, 2015; Article no.JGEESI.18860
14
Fig. 10. Velocity panel showing interval velocity inversion below the BSR. The interval velocity across the BSR reduces from 1750 m/s to 1520 m/s
Neogene level. The BSR observed in the area fulfill all the characteristics of a classic case of gas hydrate accumulation. The coherency inversion of PSTM gathers shows definite inversion of interval velocity below the BSR (i.e., 1750 m/s above the BSR and 1520 m/s below the BSR). The geological preconditions such as high rate of sedimentation, adequate depth and temperature coinciding with the delineated BSR, indicate gas hydrate accumulation in Neogene sediments. The delineation and mapping of bottom simulating reflectors indicate a large area of the order of 250 km
2 in the central part of the
basin as a probable gas hydrate accumulation area in Mahanadi deepwater basin. The AVO responses of BSR suggest presence of free gas below the hydrate sediments. The low order of interval velocity (1750 m/s) of the hydrate layer might be due to the poor saturation of hydrate in the sediments.
5.2 Results of Seismic Studies in Andaman Deepwater Basin, India
The 2D/3D seismic data from Andaman deep water basin are analyzed to establish the gas hydrate deposits in the area [15,16]. AVO analysis, pre-stack depth migration and velocity inversion lead to positive indication for the gas
hydrate deposits in the area. Some of the seismic sections show double BSRs indicating changes in Pressure-Temperature conditions of the area in the past 10-20K years. Model based and Grid-based tomography of seismic data provided detail velocity profile which indicates free gas below the hydrate layer. Few wells drilled for hydrocarbon exploration recently have indicated presence of gas hydrate accumulations in the area. The results are as following. The Andaman Basin situated between 6°N to 14°N latitude and 91°E to 94°E longitude has a thick succession of marine sediments (6000 m+) from Cretaceous to Recent. It extends 1200 km from Myanmar in the north to Sumatra in the south. It is 650 km wide with Malay Peninsula in the east and Andaman-Nicobar islands in the west. The morphology and structure of the Andaman Islands suggest that they are an Island Arc-Orogen developed due to subduction of the Indian plate beneath the Southeast-Asian plate, since Late Cretaceous. Major geotectonic units from east to west are back arc, volcanic arc, fore arc, island arc and fore deep; which are related to the subduction tectonics. During Paleocene –Eocene time, subduction of Indian plate beneath Burmese plate caused the rise of accretionary zone and formation of Fore-arc sub-basin.

Singh and Prakash; JGEESI, 3(2): 1-24, 2015; Article no.JGEESI.18860
15
Fig. 11. AVO response showing amplitude variation with average angle θ for (a) Sea bottom
reflection, (b) BSR reflection. Theoretical calculation using Shuey approximation [68] matches the observed trend
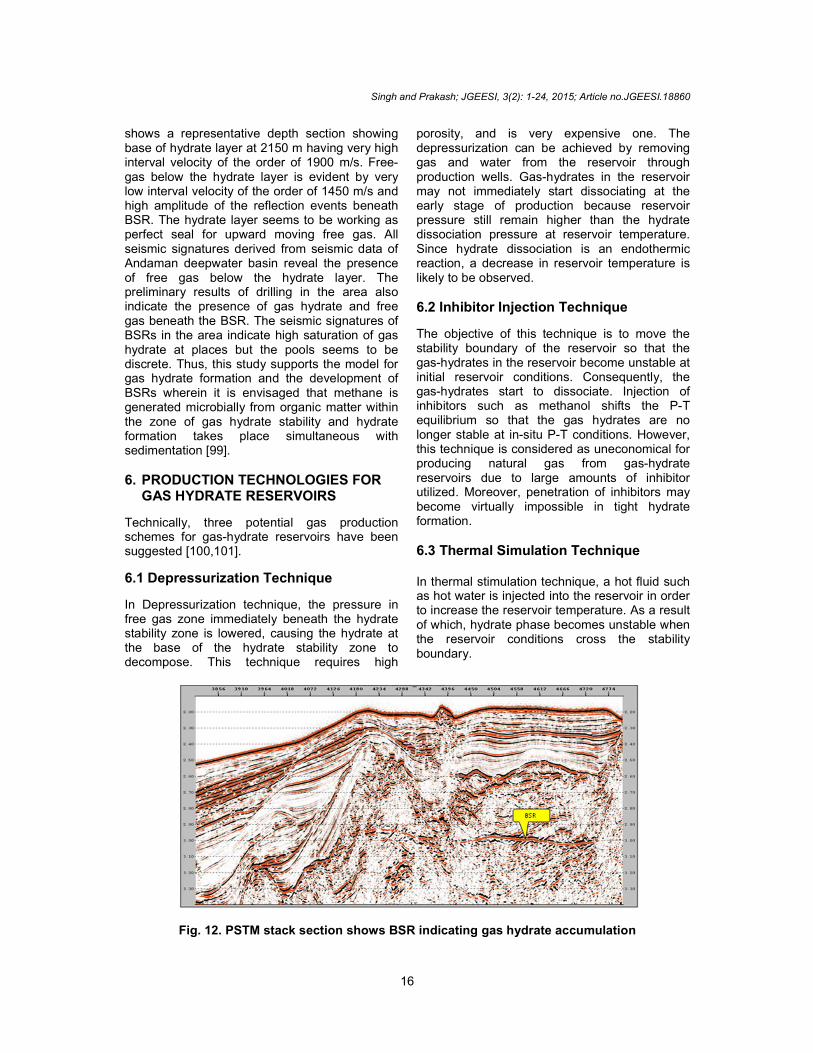
Seismic sections from Andaman area (Fig. 12) show BSRs at 200-800 ms below the sea bottom. These BSR events are distinct and have characteristic features (i) mimicking the sea floor, (ii) polarity reversal, (iii) cross-cutting the lithological boundaries, and (iv) blanking above and below the BSRs. There is abundance of BSRs seen in the seismic sections of deepwater area of Andaman basin, somewhere it is as shallow as 400 ms while at some other places it is quite deep about 800 ms below the sea bottom. The reason could be the varying pressure-temperature regime at different locations in the area. The BSR events are very strong at some locations and weak at other places, the reflection strengths may be attributed to the saturation of gas hydrate. Gas Hydrate stability zone thickness in the area has been calculated to the order of 300-650 m which is in agreement to the findings of Rastogi et al. [96]. BSR is discontinuous with varying amplitudes, at places where very high amplitude is observed. BSR is observed as shallow as 200 ms below the sea bottom at some places, which might be possible due to high heat flow in the area. It is also noticed that some of the seismic sections in area reveal two distinct BSRs. The upper BSR is traced as a continuous reflector over about 3km. The lower BSR is traced at 50-350 m below the upper one at various locations and is localized one. It is interpreted that upper BSR is an active methane hydrate BSR and the lower BSR is a residual hydrate-related BSR. Migration of methane hydrate stability zone from lower BSR to upper BSR might have happened due to sea bottom warming and tectonic uplift during the past 10-20 K years.
The AVO analyses of PSTM gathers at various locations in the area are carried out. At far offsets the amplitude increases rapidly and there a phase shift at higher offset. Fig. 13 shows the AVO anomaly obtained at three representative locations. Fig. 13-A represents AVO response at locations where there is significant evidence of free gas below the hydrate layer such as very low interval velocity and high amplitude. The AVO anomaly is very strong at these locations. But very weak AVO anomaly is observed (Fig. 13-C) at locations where there is no evidence of free gas below the hydrate layer. Moderate AVO anomaly (Fig. 13-B) is observed at locations where some indication for free gas beneath the BSR is observed such as lowering of interval velocity as compared to the background velocity. The study of AVO responses of BSR at various locations in the area reveal that AVO anomaly is mainly due to underlying free gas rather than due to the hydrate layer above the BSR [16]. The similar AVO results have been reported in Blake Outer Ridge [70]. Pre-stack time migration (PSTM) velocity analysis of 2D and 3D seismic data reveals variation in hydrate layer velocity between 2000 m/s to 1750 m/s. Fig. 14 shows one such a panel indicating hydrate layer velocity of 1950 m/s. The hydrate layer velocity reduces to 1750 m/s at places where BSR amplitude is weak. There must be a relationship between saturation of hydrate and interval velocity and reflection strength of BSR. Coherency inversion followed by model based and grid based tomography is applied to get the best estimates of depth model and interval velocity model of 3D data. Fig. 15
Singh and Prakash; JGEESI, 3(2): 1-24, 2015; Article no.JGEESI.18860
16
shows a representative depth section showing base of hydrate layer at 2150 m having very high interval velocity of the order of 1900 m/s. Free-gas below the hydrate layer is evident by very low interval velocity of the order of 1450 m/s and high amplitude of the reflection events beneath BSR. The hydrate layer seems to be working as perfect seal for upward moving free gas. All seismic signatures derived from seismic data of Andaman deepwater basin reveal the presence of free gas below the hydrate layer. The preliminary results of drilling in the area also indicate the presence of gas hydrate and free gas beneath the BSR. The seismic signatures of BSRs in the area indicate high saturation of gas hydrate at places but the pools seems to be discrete. Thus, this study supports the model for gas hydrate formation and the development of BSRs wherein it is envisaged that methane is generated microbially from organic matter within the zone of gas hydrate stability and hydrate formation takes place simultaneous with sedimentation [99].
6. PRODUCTION TECHNOLOGIES FOR GAS HYDRATE RESERVOIRS
Technically, three potential gas production schemes for gas-hydrate reservoirs have been suggested [100,101].
6.1 Depressurization Technique
In Depressurization technique, the pressure in free gas zone immediately beneath the hydrate stability zone is lowered, causing the hydrate at the base of the hydrate stability zone to decompose. This technique requires high
porosity, and is very expensive one. The depressurization can be achieved by removing gas and water from the reservoir through production wells. Gas-hydrates in the reservoir may not immediately start dissociating at the early stage of production because reservoir pressure still remain higher than the hydrate dissociation pressure at reservoir temperature. Since hydrate dissociation is an endothermic reaction, a decrease in reservoir temperature is likely to be observed.
6.2 Inhibitor Injection Technique
The objective of this technique is to move the stability boundary of the reservoir so that the gas-hydrates in the reservoir become unstable at initial reservoir conditions. Consequently, the gas-hydrates start to dissociate. Injection of inhibitors such as methanol shifts the P-T equilibrium so that the gas hydrates are no longer stable at in-situ P-T conditions. However, this technique is considered as uneconomical for producing natural gas from gas-hydrate reservoirs due to large amounts of inhibitor utilized. Moreover, penetration of inhibitors may become virtually impossible in tight hydrate formation.
6.3 Thermal Simulation Technique In thermal stimulation technique, a hot fluid such as hot water is injected into the reservoir in order to increase the reservoir temperature. As a result of which, hydrate phase becomes unstable when the reservoir conditions cross the stability boundary.
Fig. 12. PSTM stack section shows BSR indicating gas hydrate accumulation

Singh and Prakash; JGEESI, 3(2): 1-24, 2015; Article no.JGEESI.18860
17
Fig. 13. AVO analysis of PSTM data. (a) Strong AVO anomaly where free gas below the BSR is indicated by velocity and amplitude anomalies, (b) Moderate AVO anomaly where some
seismic indication for free gas below BSR, and (c) Low or no AVO anomaly where no free gas indication below BSR
Fig. 14. (a) PSTM gather showing BSR and phase change at higher offset at a selected location, (b) Migration velocity analysis showing higher interval velocity (1950 m/s) above the
BSR in gas hydrate layer than the background velocity
b
c
a

Singh and Prakash; JGEESI, 3(2): 1-24, 2015; Article no.JGEESI.18860
18
Fig. 15. Pre-stack Depth Migrated section overlain by Interval velocity section showing BSR. Very low Interval velocity below the BSR indicates free gas below Gas hydrate layer which is
working as barrier for upward migration of the gas
Typically, average reservoir pressure decreases during the production. At fixed pressure and operating at temperatures above hydrate formation temperature, thermal injection can be achieved by insulation or heating of the equipment. The source of heat provided directly in the form of injected steam or hot water or indirectly via electric or sonic means, is applied to the hydrate stability zone to raise its temperature, causing the hydrate to decompose. The main drawback of this technique is that a considerable portion of the energy introduced into the system is lost in the injection path and surroundings, and therefore, only a fraction of injected energy is utilized towards the dissociation of gas hydrates. This makes this technique a costly affair.
7. PRODUCTION CHALLENGES NGHP has set up a deadline of mid 2015 to commence commercial production of methane from Indian gas hydrate field. However, before the start of production, there are a number of production related challenges to be met successfully.
1. Deep water drilling/production challenges. 2. Lack of proven technology to exploit the
methane from gas hydrate on a commercial scale.
3. Sustained production of methane, since gas hydrate accumulations are generally found as disseminated and gradational deposits.
4. Managing water production rate, as high amount of water is expected to be produced along with the gas.
5. Sand control since the hydrate reservoir is mostly unconsolidated formations and very shallow below the sea bed (400-700 m).
6. Reservoir subsidence causing collapse of sea floor foundation and disturbing the P-T equilibrium resulting in melting or dissociation of methane hydrate. The melting/dissociation of methane hydrate will result in release of large volumes of methane in the atmosphere, and thereby raising the levels of green house gases and exacerbating global warming.
8. CONCLUSION The prospect of natural gas hydrate in India is described in light of its identification, resource estimation, production techniques and the crucial challenges to be met before the start of commercial production of gas hydrate in India. The petro-physical and chemical properties of gas hydrate, geological preconditions for formation and deposition of gas hydrates, geophysical and non-geophysical indicators of gas hydrate accumulation, potential production technologies and theirs limitations, production scenario and environmental issues associated with commercial production of gas hydrate are described in detail to cover all the facets of gas hydrate in India. The case studies of seismic data analysis for prospect identification of gas

Singh and Prakash; JGEESI, 3(2): 1-24, 2015; Article no.JGEESI.18860
19
hydrate in Mahanadi and Andaman deepwater basins are illustrated to depict the development of gas hydrate in India. The seismic results (BSR, Coherency inversion and AVO studies) of Mahanadi basin and associated geological preconditions such as high rate of sedimentation, adequate depth and temperature coinciding with the delineated BSR indicates a large area of the order of 250 km
2 in the central part of the basin
at the Neogene level as a potential gas hydrate accumulation area in the basin, while the AVO anomaly of BSR and seismic attributes of Andaman deepwater basin divulge a pool of free gas beneath the hydrate layer, which has been validated by drilling results of a well in the area. The AVO responses of BSR in Mahanadi deepwater basin suggest the presence of free gas below the hydrate sediments. The low order of interval velocity (1750 m/s) of the hydrate layer in Mahanadi deepwater basin indicates poor saturation of hydrate in the sediments.
India has established huge gas hydrate reserves in Krishna-Godavari and Andaman deepwater basins. Mahanadi deepwater areas also show positive seismic signatures for huge deposits of gas hydrate. The prospect identification of gas hydrate in Western Continental Margin of India, especially Kerala-Konkan offshore, near Lakshyadeep Iceland and Bombay offshore are in progress and there are good chances of hydrate accumulation in these areas. The commercial production of gas from gas hydrate in India still requires a lot of challenges to be met successfully.
COMPETING INTERESTS
Authors have declared that no competing interests exist.
REFERENCES
1. Kvenvolden KA. Gas hydrates as a potential energy resource - A review of their methane content. In: Howell DG, editor. The future of energy gases. United States Government Printing Office, Washington. USGS Professional Paper. 1993;1570:555-561.
2. Makogon YF, Holditch SA, Makogon TY. Proven reserves and basics for development of gas hydrate deposits. American Association of Petroleum Geologists, Vankouver; 2004.
3. Makogon YF. Natural gas hydrates - A promising source of energy. Journal of Natural Gas Science and Engineering. 2010;2:49-59.
4. Economides MJ, Wood DA. The state of natural gas. Journal of Natural Gas Science and Engineering. 2009;1(1-2):1-13.
5. Collett TS, Riedel M, Cochran J, Boswell R, Presley J, Kumar P, Sathe AV, Sethi AK, Lall M, Sibal VK, the NGHP Expedition 01 Scientists. NGHP EXPEDITION 01 (2006), Initial Reports. Directorate General of Hydrocarbons, NOIDA and Ministry of Petroleum & Natural Gas, India. 2008;4.
6. Lee MW, Collett TS. Gas hydrate saturations estimated from fractured reservoir at Site NGHP-01-10, Krishna-Godavari Basin, India. Journal of Geophysical Research. 2009;114:B07102. DOI:10.1029/2008JB006237.
7. Sethi AK, Sathe AV, Ramana MV. Potential natural gas hydrates resources in Indian offshore areas. AAPG Hedberg conference on Gas Hydrates: energy resource potential and associated geologic hazards, Vancouver, BC, Canada; 2004.
8. Ramana MV, Ramprasad T, Desa M, Sathe AV, Sethi AK. Gas hydrate related proxies inferred from multidisciplinary investigations in the Indian offshore area. Current Science. 2006;91(2):183-189.
9. Ramana MV, Ramprasad T, Kamlesh Raju KA, Desa M. Occurrence of gas hydrates along the continental margins of India, particularly the KG offshore basin. International Journal of Environmental Studies. 2007;64(6):675-693. DOI: 10.1080/00207230701476321.
10. Ramana MV, Ramprasad T, Paropkari AL, Borole DV, Rao BR, Karisiddaiah SM, Desa M, Kocherla M, Joao HM, Lokabharati P, Gonsalves MJ, Pattan JN, Khadge NH, Babu CP, Sathe AV, Kumar P, Sethi AK. Multidisciplinary investigations exploring indicator of gas hydrate occurrence in the Krishna-Godavari basin offshore, east coast of India. Geo-Marine Letters. 2009;29:25-38. DOI: 10.1007/s00367-008-0121-7.
11. Riedel M, Collett TS, Shankar U. Documenting channel features associated with gas hydrates in the Krishna-Godavari Basin, offshore India. Marine Geology. 2010;279(1-4):1-11. DOI: 10.1016/j.margeo.2010.10.008.

Singh and Prakash; JGEESI, 3(2): 1-24, 2015; Article no.JGEESI.18860
20
12. Riedel M, Collett TS, Kumar P, Sathe AV, Cook A. Seismic imaging of a fractured gas hydrate system in the Krishna-Godavari Basin offshore India. Journal of Marine Petroleum Geology. 2010;27: 1476-1493. DOI: 10.1016/j.marpetgeo.2010.06.002.
13. Prakash A, Samanta BG, Singh NP. A seismic study to investigate the prospect of gas hydrate in Mahanadi deep water basin, northeastern continental margin of India. Marine Geophysical Researches. 2010; 31:253–262. DOI: 10.1007/s11001-010-9106-9.
14. Prakash A, Samanta BG, Singh NP. Gas hydrate: Prospect and potential of Mahanadi deepwater and Andaman basins -A comparative study. Proceedings of 9th
International Oil & Gas Conference and Exhibition, PETROTECH; 2010. Paper ID: 20100590, 6p.
15. Prakash A, Samanta BG. A Seismic Study to Investigate the Prospect of Gas Hydrate in Andaman Deep Water Basin, India. The 9th Biennial Conference & Exposition on Petroleum Geophysics, HICC, Hyderabad, India; 2012. Paper ID_072.
16. Prakash A, Samantha BG, Singh NP. Evidence of gas hydrate accumulation and its resource estimation in Andaman deep water basin from seismic and well log data. Marine Geophysical Research. 2013;34:1-16. DOI: 10.1007/s11001-012-9163-3.
17. Shankar U, Riedel M. Seismic and heat flow constraints from the Krishna-Godavari Basin gas hydrate system. Marine Geology. 2010;76(1-4):1-13.
18. Shankar U, Riedel M, Sathe AV. Geothermal modeling of the gas hydrate stability zone along the Krishna Godavari Basin. Marine Geophysical Researches. 2010;31(1-2):17-28. DOI: 10.1007/s11001-010-9089-6.
19. Sain K. Seismic detection and quantification of gas hydrates- Application to Indian continental margin. Proceedings of the 7
th International Conference on Gas
Hydrates (ICGH 2011), Edinburgh, Scotland, United Kingdom; 2011.
20. Shukla KM, Tyagi AK, Bhowmick PK. Geophysical studies for Natural gas Hydrate in East seacoast of India. Geohorizons. 2012;73-81.
21. Kvenvolden KA. A review of Arctic gas hydrates as a source of methane in global change. In: Weller G, Wilson CL, Severin
BAB, editors. Proceedings of International Conference on the role of the polar regions in global change, at geophysical institute and center for global change and arctic system research, University of Alaska Fairbanks (June 11-15, 1990). 1991;696-701.
22. Kvenvolden KA. Gas hydrates—geological perspective and global change. Review of Geophysics. 1993;31:173–187.
DOI: 10.1029/93RG00268. 23. Henriet JP. Gas Hydrates: Relevance to
World Margin Stability and Climate Change. In: Henriet J-P, Mienert J, editors. Gas Hydrates: Relevance to World Margin Stability and Climate Change. The Geological Society, London. 1998; Special Publications.
24. Hesselbo SP, Gröcke DR, Jenkyns HC, Bjerrum CJ, Farrimond P, Morgans Bell HS, Green OR. Massive dissociation of gas hydrate during a Jurassic oceanic anoxic event. Nature. 2000;406:392-395.
25. Krev V, Canadell JG, Nakicenovic N, Abe Y, Andruleit H, Archer D, Grubler A, Hamilton NTM, Johnson A, Kostov V, Lamarque JF, Langhorne N, Nisbet EG, O'Neill B, Riahi K, Riedel M, Wang W, Yakushev V. Gas hydrates: Entrance to a methane age or climate threat ?. Environmental Research Letters. 2009; 4(3). Art no 034007.
26. Kennett JP, Cannariato G, Hendy IL, Behl RJ. Methane Hydrates in Quaternary Climate Change: The Clathrate Gun Hypothesis. American Geophysical Union, Washington DC. 2003;216.
27. Sloan ED Jr. Gas hydrates: review of physical/chemical properties. Energy and Fuels. 1998;12(2):191–196.
28. Sloan ED Jr. Clathrate Hydrates of Natural Gases. Marcel Dekker, New York; 1997.
29. Kvenvolden KA. A Review of the geochemistry of methane in natural gas hydrate. Organic Geochemistry. 1995;23: 997-1008.
30. Kvenvolden KA. Biogenic methane and gas hydrate. In: Marshall C P, Fairbridge R W, editors, Encyclopedia of Geochemistry. Kluwer Academic Publishers, Dordrecht, The Netherlands. 1999;30.
31. Collett TS. Natural gas hydrates of the Prudhoe Bay and Kuparuk River area, North slope Alaska. AAPG Bulletin. 1993; 77(5):793-812.
32. Dallimore SR, Collett TS, Uchida T, Weber M, Takahashi H, Mallik Gas Hydrate well

Singh and Prakash; JGEESI, 3(2): 1-24, 2015; Article no.JGEESI.18860
21
program. Proceedings of the 4th International Conference on Gas Hydrates, Yakohama, Japan. 2002;19-23.
33. Taylor CE, Lekse J, English N. NETL'S Methane hydrate research. Proceedings Research Team. Overview of the 2002 Mallik gas hydrate production research of AAPG Hedberg conference Gas hydrates: Energy resource potential and associated geologic hazards, Vancouver, BC, Canada; 2004.
34. Sloan ED Jr. Gas Hydrates: Review of physical/chemical properties. Energy Fuels. 1990;19:191–196.
35. Malone R. Gas hydrates topical report, Tech. Rep. DOE/METC/SP-218 (DE85001986). Department of Energy, Morgantown Energy Technology Center, Morgantown, WVa, USA; 1985.
36. Riedel M, Long PE, Collett TS. Estimates of in situ gas hydrate concentration from resistivity monitoring of gas hydrate bearing sediments during temperature equilibration. Marine Geology. 2006; 227(3-4):215-225.
37. Riedel M, Collett TS, Sathe AV. Seismic mapping of gas hydrate deposits in the Krishna-Godawari basin offshore India. Proceedings of the 6
th International
Conference on Gas Hydrates (ICGH 2008), Vancouver, British Columbia, Canada; 2008.
38. Henry P, Thomas M, Clennell MB. Formation of natural gas hydrates in marine sediments 2: Thermodynamic calculations of stability conditions in porous sediments. Journal of Geophysical Research. 1999;104(B10):23005-23022.
39. Kleinberg RL, Flaum C, Collett TS. Magnetic resonance log of Mallik 5L-38: hydrate saturation, growth habit, relative permeability and control of accumulation. In: Dallimore SR, Collett TS, editors. Scientific results from the Mallik 2002 gas hydrate production research well, Mackenzie Delta, Northwest Territories, Canada. Geological Survey of Canada, Ottawa; 2005. Bulletin 585.
40. Camps AP. Hydrate formation in near surface ocean sediments. Ph.D. Thesis (unpublished), Leicester University; 2007.
41. Holland M, Schultheiss P, Roberts J, Druce M. Observed Gas Hydrate Morphologies in Marine Sediments. In: Englezos P, editor. 6th International Conference on Gas Hydrates; 2008.
Available:https://circle.ubc.ca/handle/2429/1201
42. Katz DL, Cornell D, Kobayashi R, Poetmann FH, Vary JA, Elenblass JR, Weinaug CF. Handbook of Natural Gas Engineering. McGraw-Hill, New York. 1959;802.
43. Kvenvolden KA, Lorenson TD. The global occurrence of natural gas hydrate. In: Paull CK, Dillon WP, editors. Natural gas hydrates: Occurrence, Distribution, and Dynamics. AGU Monograph. 2001;55.
44. Lerche I, Bagirov E. Guide to gas hydrate stability in various geological settings. Marine and Petroleum Geology. 1998;15: 427- 438.
45. Satyavani N, Sain K, Lall M, Kumar BJP. Seismic attribute study for gas hydrates in the Andaman Offshore India. Marine Geophysical Researches. 2008;29:167-175. DOI: 10.1007/s11001-008-9053-x.
46. Satyavani N, Thakur NK, Arvind Kumar N, Reddi SI. Migration of methane at the diapiric structure of the western continental margin of India- insights from seismic data. Marine Geology. 2005;219(1):19–25.
47. Shipley TH, Houston MH, Buller RT, Shaub FJ, McMillen KJ, Ladd JW, et al. Seismic reflection evidence for widespread occurrence of possible gas-hydrate horizons on continental slopes and rises. AAPG Bulletin. 1979;63:2204-2213.
48. Yuan T, Hyndman RD, Spence GD, Desmons B. Seismic velocity increase and deep-sea gas hydrate concentration above a bottom-simulating reflector on the northern Cascadia continental slope. Journal of Geophysical Research. 1996; 101:13655–13671.
49. Sain K, Minshull TA, Singh SC, Hobbs RW. Evidence for a thick free gas layer beneath the bottom simulating reflector in the Makran accretionary prism. Marine Geology. 2000;164:3–12.
50. Dewangan P, Ramprasad T. Velocity and AVO analysis for the investigation of gas hydrate along a profile in the western continental margin of India. Marine Geophysical Researches. 2007;28:201–211.
51. Brooks JM, Cox HB, Bryant WR, Kennicutt II MC, Mann RG, McDonald TJ. Association of gas hydrate and oil seepage in Gulf of Mexico. Organic Geochemistry. 1986;10(1-3):221-234.
Singh and Prakash; JGEESI, 3(2): 1-24, 2015; Article no.JGEESI.18860
22
52. Holbrook WS, Hooskins H, Wood WT, Stephen RA, Lizarralde D, ODP Leg 164 Seismic Party. Methane hydrate, bottom simulating reflectors, and gas bubbles: results of vertical seismic profiles on the Blake Ridge. Science. 1996;273:1840-1843. DOI: 10.1126/science. 273. 5283.1840.
53. Dallimore SR, Collett TS, Uchida T, JAPEX/JNOC/GSC, et al. Mallik 2L-38 gas hydrate research well, Mackenzie Delta, Northwest Territories, Canada. In: Dallimore SR, Uchida T, Collett TS, editors. Overview of science program. Geological Survey of Canada Bulletin. 1999;544:11–17.
54. Wood WT, Ruppel C. Seismic investigations of the Blake ridge gas hydrate area: A synthesis. In: Paull CK, Matsumoto R, Wallace PJ, Dillon WP, editors. Proceedings of the ocean drilling program scientific results. 2000;164:253–264.
55. Hyndman RD, Spence GD, Chapman NR, Riedel M, Edwards RN. Geophysical Studies of Marine Gas Hydrate in Northern Cascadia. In: Paull CK, Dillon WP, editors. Natural Gas Hydrates, Occurrence, Distribution and Detection. Geophysical Monograph Series No. 124, American Geophysical Union. 2001:273 – 295.
56. Ashi J, Tokuyama H, Taira A. Distribution of methane hydrates BSRs and its implications for the prism growth in the Nankai Trough. Marine Geology. 2002; 187:77–191.
DOI:10.1016/S0025-3227(02)00265-7. 57. Hornbach MJ, Saffer DM, Holbrook WS,
Van Avendonk HJA, Gorman AR. Three-dimensional seismic imaging of the Blake Ridge methane hydrate province; evidence for large, concentrated zones of gas hydrate and morphologically driven advection. Journal of Geophysical Research. 2008;113(B0710):1-15.
58. Xu W, Ruppel C. Predicting the occurrence, distribution, and evolution of methane gas hydrate in porous sediments. Journal of Geophysical Research. 1999; 104(B3):5081-5095.
59. Mathew MA, Huen R von. Site 570 methane hydrate zone. In: Huene von R, Aubouin J, et al. editors. Initial reports of the deep sea drilling project covering leg 84 of the cruises of the drilling vessel glamour challanger; Balboa Panama to Manzanillo, Mexico (Jan-Feb 1982). Ocean
Drilling Program, College Station. 1985. TX:773-790.
60. Yuan J, Edwards RN. The assessment of marine gas hydrates through electrical remote sounding: Hydrate without a BSR?. Geophysical Research Letter. 2000;27: 2397-2400.
61. Korenga J, Holbrook WS, Singh SC, Minshull TA. Natural gas hydrate on the southeast U S margin: constraints from full waveform and travel time inversions of wide-angle seismic data. Journal of Geophysical Research. 1997;102(B7): 15345–15365.
62. Stoll RD, Bryan GM. Physical properties of the sediments containing gas hydrates. Journal of Geophysical Research. 1979; 84:1629-1634.
63. Lee MW, Hutchinson DR, Agena WF, Dillon WP, Miller JJ, Swift BA. Seismic character of gas hydrates on the Southeastern United States continental margin. Marine Geophysical Research. 1994;16:163-184.
64. Lee MW, Dillon WP. Amplitude blanking related to the pore-filling of gas hydrate in sediments. Marine Geophysical Research. 2001;22:101-109.
65. Lee MW, Hutchinson DR, Dillon WP, Miller JJ, Agena WF, Swift BA. Method of estimating the amount of in situ gas hydrates in deep marine sediments. Marine and Petroleum Geology. 1993; 10(5):493-506.
66. Ostrander WJ. Plane wave reflection coefficients for gas sands at non-normal angles of incidence. Geophysics. 1984;49: 1637-1648.
67. Gregory AR. Fluid saturation effects on dynamic elastic properties of sedimentary rocks. Geophysics. 1976;41: 895-921.
68. Shuey RT. A simplification of the Zoeppritz equation. Geophysics. 1985;50: 609-614.
69. Rutherford SR, Willium RH. Amplitude-versus-offset variations in gas sands. Geophysics. 1989;54(6):680-688.
70. Ecker C, Lumley DE. Seismic AVO analysis of Methane Hydrate Structure. Stanford Exploration Project Report. 2001; 80:1-288.
71. Bargach S, Falconer I, Maeso C, Rasmus J, Bornemann T, Plumb R, Codazzi D, Hodenfield K, Ford G, Hartner J, Grether B, Rohler H. Real-Time LWD: Logging for Drilling. Oilfield Review. 2000;12(3):58–78.
72. Goldberg D, Saito S. Detection of gas hydrates using downhole logs. In: Henriet

Singh and Prakash; JGEESI, 3(2): 1-24, 2015; Article no.JGEESI.18860
23
JP, Mienert J, editors. Gas Hydrates - Relevance to World Margin Stability and Climate Change. The Geological Society, London. 1998;129-132.
73. Collett TS. Well log evaluation of gas hydrate saturations. Trans. Society of Professional Well Log Analysts (SPWLA) 39th Ann. Logging Symp; 1998. Paper MM.
74. Collett TS. Well Log Characterization of Sediment Porosities in Gas-Hydrate-Bearing Reservoirs. Society of Petroleum Engineers. Paper SPE 49298; 1998.
75. Collett TS. Natural-gas hydrates: resource of the twenty first century. Journal of the American Association of Petroleum Geologists. 2001;74:85–108.
76. Akihisa K, Tezuka K, Senoh O, Uchida T. Well Log Evaluation of Gas Hydrate Saturation in the MITI Nankai Trough Well, Offshore East Japan. SPWLA 43
rd Annual
Logging Symposium, Japan. Paper BB; 2002.
77. Takahashi H, Yonezawa T, Takedomi Y. Exploration for natural hydrate in the Nankai-Trough well offshore Japan. Offshore Technology Conference, Houston, TX, Resource Geology. 2001;54. Paper OTC13040.
78. Archie GE. Electrical resistivity log as an aid in determining some reservoir characteristics. Trans AIME. 1942;146:54-61.
79. Kvenvolden KA. A primer on the geological occurrence of gas hydrate. Geol Soc London, Spec. Publ. 1998;137:9-30.
80. Milkov AV. Global estimate of hydrate bound gas in marine sediments: how much is really out there?. Earth Science Reviews. 2004;66(3-4):183-197.
81. Egeberg PK, Dickens GR. Thermodynamic and pore water halogen constraints on gas hydrate distribution at ODP Site 997 (Blake Ridge). Chemical Geology. 1999;153:53–79.
82. Ussler III W, Paull CK. Ion Exclusion associated with marine gas hydrate deposits. In: Paull CK, Dillon WP, editors. Natural Gas Hydrates: Occurrence, Distribution, and Detection. Geophysical Monograph Series, American Geophysical Union, Washington, DC. 2001;124:41-65.
83. Torres ME, Teichert B, Tréhu AM, Borowski W, Tomaru H. Relationship of pore- water freshening to accretionary processes in the Cascadia margin: Fluid
sources and gas hydrate abundance. Geophysical Research Letters. 2004;3: L22305.
84. Jenden PD, Gieskes JM. Chemical and isotopic composition of interstitial water from Deep Sea Drilling Project sites 533 and 534. In: Shipley TH, Orlofsky S, et al. editors. Initial Reports, Deep Sea Drilling Project. 1983;76:453–461.
85. Hesse R, Lebel J, Gieskes JM. International water chemistry of gas hydrate-bearing sections on Middle America Trench slope, Deep-Sea Drilling Project Leg 84. In: Huene von R, et al. editors. Initial Reports of Deep Sea Drilling Project. 1985;84:727-736.
86. Kvenvolden KA, Kastner M. Gas hydrates of the Peruvian outer continental margin. In Suess ER, von Huene R, and others, editors. Proceedings of the Ocean Drilling Program, Scientific Results: U.S. Government Printing office, Washington, DC. 1990;112:517-526.
87. Takeuchi R, Matsumoto R. Geochemistry of interstitial water in the Nankai Trough, South Japan. In: Proceedings of Fifth International Conference on Gas Hydrates, (ICGH5). 2005:908–912.
88. Borowski WS, Paull CK, Ussler III W. Global and local variations of interstitial sulfate gradients in deep-water, continental margin sediments: sensitivity to underlying methane and gas hydrates. Marine Geology. 1999;159:131–154.
89. Dickens GR. The potential volume of oceanic methane hydrates with variable external conditions. Organic Geochemistry. 2001;32:1179-1193.
90. Kulm LD, Suess E, Moore JC, Carson B, Lewis BT, Ritger SD, Kadko DC, Thornburg TM, Embley RW, Rugh WD, Massoth GJ, Langseth MG, Cochrane GR, Scamman LR. Oregon subduction zone: Venting, fauna, and carbonates. Science. 1986;231:561–566.
91. Bohrmann G, Greinert J, Suess E, Torres M. Authigenic carbonates from the casscadia subduction zone and their relations to gas hydrate stability. Geology. 1998;26:647-650.
92. Stakes DS, Orange D, Paduan JB, Salamy KA, Maher N. Cold-seeps and authigenic carbonate formation in Monterey Bay, California. Marine Geology. 1999;159:93-109.
93. Greinert J, Bohrmann G, Suess E. Gas hydrate-associated carbonates and

Singh and Prakash; JGEESI, 3(2): 1-24, 2015; Article no.JGEESI.18860
24
methane-venting at Hydrate Ridge: Classification, distribution and origin of authigenic lithologies. In: Paull CK, Dillon WP, editors. Natural Gas Hydrates: Occurrence, Distribution, and Detection. Geophysical Monograph. 2001;124:99–113.
94. Desa E. Submarine methane hydrates potential fuel resource of the 21
st century.
Proceedings of AP Akademi of Sciences. 2001;5(2):101 -114.
95. Satyavani N, Uma Shankar TNK, Reddi SI. Probable gas hydrate/free gas model over western continental margin of India. Marine Geophysical Research. 2002;23:423–430.
96. Rastogi A, Deka B, Bhattacharya GC, Ramprasad T, Kamesh Raju KA, Srinivas K, Murty GPS, Chaubey AK, Ramana MV, Subrahmanyam V, Sharma KVLN, Desa M, Paropkari AL, Menezes AAA, Murthy VSN, Anthony MK, Subbaraju LV, Desa E, Veerayya M. Gas hydrate stability thickness map of Indian deep offshore areas- a GIS based approach. Proceeding of 3rd International Petroleum Conference
and Exhibition, Petrotech-99.1999;4:489-494.
97. National Institute of Oceanography. Gas hydrate resource map of India no. NIO/SP-25/97. NIO, Dona Paula, Goa; 1997.
98. Xun H, Bangs NL, Stoffa PL. Estimation of free gas saturation using AVO analysis on 3D seismic data at south hydrate ridge, cascadia accretionary complex. AGU 2004 fall meeting, Eos Trans. AGU. 2004; 85(47): Abstract OS41C-0492.
99. Claypool GE, Kaplan IR. The origin and distribution of methane in marine sediments. In: Kaplan IR, editor. Natural Gases in Marine Sediments. Plenum Publishing Corp, New York; 1974:99–139.
100. Collett TS. Energy resource potential of natural gas hydrates. American Association of Petroleum Geologists Bulletin. 2002;86:1971-1992.
101. Suntichai Silpngarmler. Numerical Modeling of Gas Recovery from Methane Hydrate Reservoirs. Ph.D. dissertation, Pennsylvania State University, PA, USA; 2007.
_________________________________________________________________________________ © 2015 Singh and Prakash; This is an Open Access article distributed under the terms of the Creative Commons Attribution License (http://creativecommons.org/licenses/by/4.0), which permits unrestricted use, distribution, and reproduction in any medium, provided the original work is properly cited.
Peer-review history: The peer review history for this paper can be accessed here:
http://sciencedomain.org/review-history/10358