natural gas report - apia.net.au · pdf filein the simplest case, natural gas can be burned on...
TRANSCRIPT

Australian Pipeline Industry Association
NNAATTUURRAALL
GGAASS
RREEPPOORRTT
JJaannuuaarryy 22000099

‐ 1 ‐
Natural Gas in Australia
Australia has abundant reserves of natural gas. Natural gas predominantly comprises methane, a colourless and odourless gas. (Natural gas that is delivered to the general population is not odourless; as a safety measure, the distinctive smell of gas is a result of an additive which assists detection of leaks.) Natural gas is found in two main forms in Australia: as conventional natural gas, found in subterranean petroleum reservoirs (both onshore and offshore); and as coal seam gas, extracted from subterranean coal beds.
Natural gas can also be produced from renewable sources, where it is emitted in the decomposition of landfill and sewage (biogas) or organic waste such as wood or sugarcane residue (biomass).
Natural Gas Composition
While the main component of natural gas is methane, the overall composition of natural gas depends upon its source, with coal seam gas being almost pure methane and the composition of conventional gas varying widely, depending upon the characteristics of the geology and geography of its source. A typical processed stream of gas comprises:
Component Presence Conventional Gas (%) Presence Coal Seam Gas (%) Methane 90.0 97.0 Ethane 4.0 0 Propane 1.7 0 Butane 0.4 0 Pentane 0.11 0 Hexane 0.08 0 Heptane 0.01 0 Carbon dioxide 2.7 2.0 Nitrogen 1.0 1.0
Australian Gas Consumption
In 2006/07, Australian domestic consumption of natural gas totalled 1158 PJ1, representing about 19% of Australia’s total annual energy needs, which in 2006/07 was 5770 PJ. Natural gas consumption has grown strongly in recent years, with average annual growth since 2001/02 of 5.2% and annual growth in 2006/07 of 7.2%. The Australian Bureau of Agricultural and Resource Economics (ABARE) expects growth in consumption of natural gas to continue. ABARE forecasts consumption of natural gas will increase to 2000 PJ/year by 2029/30, at an average annual growth rate of 2.5%2. According to the ABARE estimates, gas should become the fastest growing source of energy in Australia over the next few decades.
Due to the disparate location of natural gas reserves, Australia’s consumption and usage of natural gas varies widely.
1 ABARE Energy Update 08 2 ABARE Australian Energy Projections to 2029‐20, 2007

‐ 2 ‐
Primary natural gas consumption by state, 2006/073
State Natural gas consumption PJ Share of natural gas consumption Western Australia 411.4 36.9% Victoria 252.2 22.6% Queensland 148.6 13.3% New South Wales & ACT 135.9 12.2% South Australia 106.6 9.6% Northern Territory 47.6 4.3% Tasmania 12.7 1.1%
Australian Gas Usage
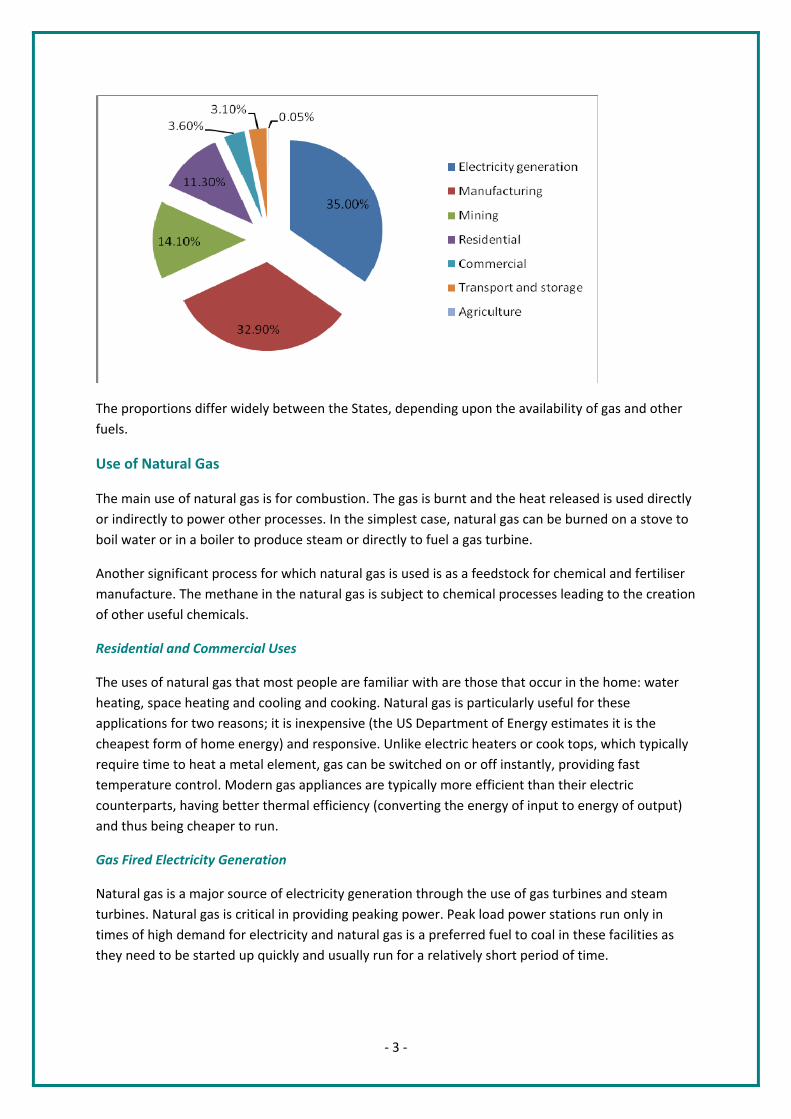
At a national level, natural gas consumption is dominated by the electricity generation and manufacturing sectors, as shown below:
Primary natural gas consumption by sector, 2006/074
Sector Share of natural gas consumption Electricity generation 35.0% Manufacturing 32.9% Mining 14.1% Residential 11.3% Commercial 3.6% Transport and storage 3.1% Agriculture 0.05%
3 ABARE Australian Energy Projections to 2029‐20, 2007 4 ABARE Australian Energy Projections to 2029‐20, 2007
‐ 3 ‐
The proportions differ widely between the States, depending upon the availability of gas and other fuels.
Use of Natural Gas
The main use of natural gas is for combustion. The gas is burnt and the heat released is used directly or indirectly to power other processes. In the simplest case, natural gas can be burned on a stove to boil water or in a boiler to produce steam or directly to fuel a gas turbine.
Another significant process for which natural gas is used is as a feedstock for chemical and fertiliser manufacture. The methane in the natural gas is subject to chemical processes leading to the creation of other useful chemicals.
Residential and Commercial Uses
The uses of natural gas that most people are familiar with are those that occur in the home: water heating, space heating and cooling and cooking. Natural gas is particularly useful for these applications for two reasons; it is inexpensive (the US Department of Energy estimates it is the cheapest form of home energy) and responsive. Unlike electric heaters or cook tops, which typically require time to heat a metal element, gas can be switched on or off instantly, providing fast temperature control. Modern gas appliances are typically more efficient than their electric counterparts, having better thermal efficiency (converting the energy of input to energy of output) and thus being cheaper to run.
Gas Fired Electricity Generation
Natural gas is a major source of electricity generation through the use of gas turbines and steam turbines. Natural gas is critical in providing peaking power. Peak load power stations run only in times of high demand for electricity and natural gas is a preferred fuel to coal in these facilities as they need to be started up quickly and usually run for a relatively short period of time.

‐ 4 ‐
Steam Generation Turbines
Natural gas can be used to generate electricity in a variety of ways. The most basic natural gas fired electric generation consists of a steam generation unit, where fossil fuels are burned in a boiler to heat water and produce steam, which turns a turbine to generate electricity. Natural gas may be used for this process, although these basic steam units are more typical of large coal or nuclear generation facilities.
Gas Turbines
Gas turbines and combustion engines are also used to generate electricity. In these types of units, instead of heating steam to turn a turbine, hot gases from natural gas are used to turn the turbine and generate electricity. Gas turbine and combustion engine power stations are traditionally used primarily for peak‐load demands, as it is possible to quickly and easily turn them on.
Combined Cycle Units Many of the new natural gas fired power stations are 'combined‐cycle' units. In these types of generating facilities, there is both a gas turbine and a steam unit, in the one facility. The gas turbine operates in much the same way as a normal gas turbine, using the hot gases released from burning natural gas to turn a turbine and generate electricity. In combined‐cycle stations, the waste heat from the gas‐turbine process is directed towards generating steam, which is then used to generate electricity. Because of this efficient use of the heat energy released from the natural gas, combined‐cycle stations are much more efficient than gas‐fired steam units or gas turbines alone. In fact, combined‐cycle power stations can achieve thermal efficiencies of up to 50 to 60 per cent
Manufacturing
Natural gas is used by manufacturing industries for many applications, including ore smelting, minerals processing, drying and dehumidification, glass smelting, food processing, waste treatment and incineration, and fueling industrial boilers. Because it is easily controlled, natural gas is particularly useful to those manufacturing industries that utilise high temperature kilns, such as the alumina, glass, brick and cement industries.
Natural gas may also be used as a feedstock for the manufacturing of a number of chemicals and products. Gases such as butane, ethane, and propane can be extracted from natural gas to be used as a feedstock for products such as fertilisers, plastics and pharmaceutical products. Natural gas as a feedstock is commonly found as a building block for methanol, which in turn has many industrial applications.
Mining
In the mining sector natural gas is mainly used to provide onsite electricity generation through smaller scale gas and steam turbines.
Transport
Gas has a long history in transportation. The first gas engine was invented in the mid‐1800s. During World War II, some cars in Australia were converted to run on "town gas", a methane gas produced
‐ 5 ‐
from coking coal and widely used in the 19th and first half of the 20th century. Today, natural gas is available in abundance and its most common use in transport fuel is as compressed natural gas (CNG). CNG is made by compressing natural gas to less than 1% of its volume at standard atmospheric pressure. Although its combustion does produce greenhouse gases, it is a more environmentally clean alternative to other fuels, and it is much safer than other fuels in the event of a spill. (Natural gas is lighter than air, but disperses quickly when released.)
CNG is distinct from the more commonly used (in passenger cars) LPG, or liquefied petroleum gas, which is a mixture of hydrocarbon gases other than methane. The gases used to make LPG are often produced with petroleum or natural gas and are separated out during processing.
CNG is also different from liquefied natural gas (LNG). While both are stored forms of natural gas, the key difference is that CNG is in compressed form, while LNG is in liquefied form, i.e. it is compressed/chilled further [cryogenic process] until it becomes liquid. CNG has a lower cost of production and storage compared to LNG as it does not require an expensive cooling process and cryogenic tanks.
The adoption of compressed natural gas (CNG) as a vehicle fuel is now increasing worldwide. The number of CNG vehicles around the world has increased 500% from around 1 million vehicles in 1996 to more than 5 million vehicles in 2006.
In Australia, CNG has been successfully used in commercial bus fleets. A trial in South Australia showed that natural gas was a cheaper and significantly cleaner fuel than diesel for public transport.
South Australian data shows that, compared to existing diesel buses, each natural gas bus emits approximately
♦ 80% less carbon monoxide ♦ 59% less hydrocarbons ♦ 89% less nitrogen oxide ♦ 95% less particulate matter ♦ with 50% less noise. 5
Liquefied Natural Gas (LNG)
LNG is natural gas that has been converted to liquid form for ease of storage or transport. Liquefied natural gas takes up about 1/600th the volume of natural gas.
The liquefaction process involves removal of certain components, such as dust, helium, water, and heavy hydrocarbon. The natural gas is then condensed into a liquid at close to atmospheric pressure by cooling it to approximately −163°C. The reduction in volume makes it more cost‐efficient to transport over long distances where pipelines do not exist, especially over water by cryogenic sea vessels (LNG carriers).
5 Transport SA

‐ 6 ‐
Gas Fired Electricity Generation in Australia
In 2005/06, gas fired electricity generation accounted for 15% of Australia’s total electricity production.6 ABARE predicts that natural gas could account for 24% of total electricity production by 2029/30, however this prediction was made in 2007 prior to the release of information about the Renewable Energy Target and the Carbon Pollution Reduction Scheme (CPRS). The impacts of the RET could slow the transition from coal to gas in the electricity supply sector and possibly slow the reduction of Australia’s greenhouse gas emissions.
Australian Gas Reserves
The PJ, or petajoule, is a commonly used term for measuring commercially available reserves of natural gas and refers to the energy content of the gas. As the composition of natural gas can vary from source to source, it is a useful measure for comparison between sources. For example, one PJ of natural gas is the energy equivalent of about 43,000 tonnes of black coal or 29 million litres of petrol. The common unit of energy measurement in the electricity sector, the kilowatt hour, is equal to 3.6 megajoules, or 0.0000036 PJ.
Australia has abundant reserves of both conventional natural gas and coal seam gas. As of June 2008, proved plus probable reserves (reserves calculation is an estimation; proved plus probable indicates there is a 50% likelihood of more reserves being present) of conventional natural gas totalled slightly over 40,000 PJ, with 75% located in the offshore Carnarvon Basin in north‐west Australia, 4.5% located in offshore Northern Territory waters and 20.5% located in the Eastern Australian fields ranging from offshore Victoria to onshore South Australia and Queensland.7
Coal seam gas is a relatively new source of gas. Production in Australia commenced in 1994 and has increased over the decade, from around 2PJ in 1994 to 45PJ in 20048. Production has expanded dramatically, reaching 133PJ in 2007/08. Almost all Australian coal seam gas reserves and production are located in Queensland, however fields in New South Wales are being developed and it is expected reserves elsewhere will become available. Current proved plus probable reserves of coal seam gas are about 12,000 PJ, with 94% being located in the Surat‐Bowen Basin of Queensland and the remainder in New South Wales9.
Australian Gas Production
In 2006/07, total Australian production of natural gas was 1793 PJ10.
Approximately 40% of Australia’s production of natural gas is converted to liquefied natural gas (LNG) and exported, primarily to north Asia, with Japan, Korea, China and Taiwan accounting for the majority of demand. In 2006/07, LNG exports accounted for 635PJ of Australia’s natural gas
6 ABARE Australian Energy Projections to 2029‐20, 2007 7 Energy Quest, Energy Quarterly August 2008 8 Geoscience Australia, OGRA 2004 9 Energy Quest, Energy Quarterly August 2008 10 ABARE Energy Update 08

‐ 7 ‐
production, with 15.2 million tonnes of LNG being exported at a value of $5.2 billion, making LNG Australia’s 6th most valuable export.11
The remaining 1158PJ was consumed domestically, as outlined above.
The Gas Industry Sectors
Most natural gas is delivered to industrial, commercial and residential consumers through a supply chain involving four major sectors: production, transmission, distribution and retailing.
Upstream
The ‘upstream’ natural gas production industry includes the exploration for and extraction of raw natural gas from petroleum reservoirs and, increasingly in Australia, coal seams. The raw gas is then processed either into pipeline quality gas for the domestic market or LNG for export.
Midstream
The ‘midstream’ gas transmission sector transports processed natural gas through high pressure pipelines from the production fields and processing facilities to the city gate or major manufacturing or generation customers. The pipelines typically have high operating pressure to optimise shipping capacity and are, therefore, storage vessels as well as modes of transport. They are located underground to prevent damage that could create safety issues or disrupt gas supplies. In total, Australia’s gas transmission pipeline network covers around 25,000km and reliably supplies natural gas to Australian consumers.
Considerable effort is devoted to ensuring this supply is not disrupted. The Australian gas transmission industry sets a world bench mark for research, safety and maintenance due to its efforts in this field, and the industry‐developed standard AS2885 is respected internationally as a high‐quality standard for the design and maintenance of high pressure gas transmission pipelines.
Downstream
The gas distribution and gas retail sectors form the final ‘downstream’ component of the gas supply industry. The gas distribution sector operates the low pressure gas network, taking gas from city gate stations to homes, offices and factories. The gas retail sector sells natural gas to end use customers.
Retail Price of Gas
Retail gas prices between states vary substantially. These variations result from a range of factors, including distance from sources and usage patterns. For example, an average residential user in Victoria annually consumes more than three times the gas consumed by an average Queensland user, while an average residential user in Perth is over 1500km away from the main sources of gas in that State. As a result, prices vary from around $15.50/GJ in Melbourne to almost $28/GJ in Brisbane.12
11 DFAT Trade Statistics 2008 12 ACIL Tasman, AER State of Energy Markets 2008

‐ 8 ‐
Nevertheless, the components of the final retail price are relatively similar across States, with the four components of price relating to the separate sectors of the gas supply industry.
1. Production – the price component to produce the gas, which must cover all the costs of producing the gas including, exploration, development and processing. Accounts for 11‐21% of the final retail price.
2. Transmission – the price component to transport the gas through high pressure transmission pipelines from the source to the market. Accounts for 2‐7% of the final retail price.
3. Distribution – the price component to distribute the gas to consumers through low pressure distribution pipelines. Significant infrastructure is required to service each consumer, as a result, this component accounts for 38‐58% of the final retail price.
4. Retailing – the price component to retail the gas, including marketing, customer service and revenue collection. Accounts for around 30% of the final retail price.
Manufacturing & Power Generation Price
The electricity, manufacturing and mining sectors typically do not require the services of natural gas distributers or retailers and with their substantial volumes pay significantly lower prices per unit for natural gas than do residential customers. Larger users will deal direct with producers to purchase gas, and then negotiate with a transmission service provider for delivery of the gas.
Gas in a carbon constrained economy: Gas and the environment
Households
The advantages of using gas in the home are well known; gas can heat more quickly and more efficiently and has greater control than electricity in equivalent appliances. In addition to these advantages, using natural gas in the home in place of electricity results in significantly fewer greenhouse gas emissions.
On average, using 3.6MJ of gas produces 75% fewer emissions than 1kwh of electricity, despite it having the same energy content. Combined with the fact that modern gas appliances are more efficient, most estimates show that gas appliances cause around 1/6th the emissions of their electric counterparts. APIA estimates that by switching to gas appliances for cooking, space heating and water heating, a household could reduce these energy related emissions by over 40%.
Switching to gas for home appliances would see households significantly reduce their carbon footprint while, at the same time, improving the efficiency and performance of heating, cooling and cooking appliances.

‐ 9 ‐
Electricity generation
Natural gas is the cleanest fossil fuel energy source available. When used in electricity generation, natural gas generates around 40% of the carbon dioxide emissions of a black coal power station and less than 33% the emissions of a brown coal power station. Gas fired power stations also use around half the water required for coal fired power stations. For details on the operation of a combined cycle natural gas power station, see the “Uses of Gas” section above.
Thermal efficiency of gas and coal fired electricity:
Generation and Fuel Type Thermal Efficiency (%) CO2 Emissions (tonnes/MWH) Combined Cycle Natural Gas 48‐55 0.39 Thermal Natural Gas 38 0.49 Thermal Black Coal 35‐40 0.93 Thermal Brown Coal 29 1.23
Also, ABARE predicts that, in the future, as natural gas power stations evolve, they will extend their thermal efficiency (and thus their emissions intensity) advantage over coal power stations. This is because coal fired electricity generation has been in use longer than has gas fired electricity generation. Coal technology has been investigated and improved over a longer period of time, therefore it is expected that the efficiency of gas fired electricity generation will continue to be improved.
Average annual rate of improvement in fuel thermal efficiencies13
Period Black Coal (%) Brown Coal (%) Oil (%) Gas (%) 2005/06 – 2009/10 0.2 0.53 0.39 1.69 2010/11 – 2019/20 0.37 0.7 0.39 1.35 2020/21 – 2029/30 0.50 0.7 0.39 1.0
Role of Natural Gas in Emissions Reduction
In the short to medium term, natural gas can play a vital role in reducing Australia’s greenhouse gas emissions. Emissions from Australia’s stationary energy sector totalled 287.4 million tonnes of carbon dioxide equivalent in 200614, 52.3% of the total national emissions of 549.9 million tonnes of carbon dioxide equivalent. The vast majority of these emissions result from coal fired electricity. As demonstrated above, natural gas fired electricity is significantly cleaner than coal fired electricity, and it is estimated that for every coal fired power station that is replaced with a gas fired power station millions of tonnes of carbon dioxide equivalent emissions (exact figures are not available, as every power station is different) would be saved. Indeed, Environment Victoria has found, in its November 2008 paper Turning it around: environment solutions for Victoria that:
“The most significant early impact (in the stationary energy sector) comes from the use of gas as early as possible to deliver early reductions in greenhouse gas emissions. Indeed,
13 ABARE Australian Energy Projections to 2029‐20, 2007 14 National Greenhouse Gas Inventory 2006, Australian Greenhouse Office, Department of the Environment and Water Resources, June 2008.

‐ 10 ‐
possible uncertainty in short term investment in coal‐fired generation presents an early opportunity for a greater reliance on Gas Powered Generation (GPG) to meet Victoria’s base‐load energy requirements. Whether coal‐fired generation completely goes off‐line, or even just varies its generation activities in the interim period until CCS comes on‐line, there is certainly an opportunity to move to a greater reliance on GPG. However, it is stressed that this wedge would require urgent and major energy infrastructure investment in Victoria.”
Natural gas fired power stations also enjoy an economic advantage over many other types of electricity generation, including lower construction costs. Natural gas compares favourably to most base load electricity generation options, as shown in the table below. When the CPRS creates an economic value for emissions, the comparative advantage of gas fired power generation could increase further.
Electricity base load generation options:15
Technology Commercial
Operation Construction Cost $/kW
Fuel Cost $/MWh(SO)
CO2 kg/MWh(SO)
Ultra‐supercritical coal (USC). The most advanced coal power stations.
currently available
1400 ‐ 1950 8 ‐ 14 785‐860
USC with CCS CCS available 2020
3000 ‐ 3500 11 ‐ 20 ~ 100
Natural Gas Combined Cycle (CCGT). The most advanced gas power stations.
currently available
800 ‐ 940 >28 345
CCGT with CCS CCS available 2020
1300 – 1700 >33 ~ 50
Integrated Gasification Combined Cycle (IGCC). Coal is converted to gas and then used as fuel.
2015
2100 – 2600 9 ‐ 14 785 ‐ 840
IGCC with CCS CCS available 2020
3100 ‐ 3500 9 ‐ 16 ~ 100
Nuclear
Currently available but no regulatory regime
2800 – 3000 5 0
15 NSW Power Generation and CO2 Emissions Reduction Technology Options 2007

‐ 11 ‐
Solar Thermal.
Currently available but in early phase
~ 4600 0 0
Hot dry rocks. Research underway
unknown, site specific 0 0
Hydro Currently available
site specific 0 0
Biomass thermal Currently available
2000 0* ‐ 30 0
Government Policy regarding Natural Gas
Government climate change policy appears to be directed towards energy options other than natural gas, primarily clean coal technology and renewable energy technology.
The only gas specific policy in Australia is the Queensland Government’s Gas Scheme, which requires 13% of fuel for electricity generation to be natural gas (increasing to 15% in 2010).
The Carbon Pollution Reduction Scheme and the Renewable Energy Target
Australia is an energy intensive economy and will continue to be so in order to maintain a strong economy. The Carbon Pollution Reduction Scheme (CPRS) places an economic value on carbon emissions and a cap on the total amount of emissions permissible by the Australian economy. In its most appropriate form, the CPRS would encourage a market response to the need for emissions reduction and, therefore, minimise the economic impact of achieving greater carbon efficiency. By encouraging the market to determine the best way to reduce emissions, the CPRS would encourage the entities that create emissions to determine the most efficient way to reduce their emissions.
The creation of an unfettered carbon market under the CPRS will affect the investment and operating decisions of Australia’s electricity industry. It is to be expected that it will also increase the use of low and zero emissions electricity generation alternatives.
The national Renewable Energy Target (RET) mandates that 20% of Australia’s electricity must be provided by renewable sources by 2020. This will require a legislated increase of renewable electricity generation to 45,000GWh in 2020, compared to the requirement of 9,500GWh under the existing MRET scheme.
By operating concurrently with the CPRS, the RET would undermine the efficiency of the CPRS. Currently, renewable energy is significantly more expensive than alternative, low emission electricity generation options such as natural gas. By mandating the use of expensive, renewable electricity generation through the RET, the national level of emissions saved through renewable energy used will remain available to other emission intensive industries.
‐ 12 ‐
The RET forces the electricity generation industry to significantly contribute to national emissions reduction through an economically expensive option, providing scope for other industries and sectors to have a lesser share of the burden of reducing emissions.
Also, because of the expense of renewable technology, the electricity generation industry will also look to the least expensive method of generation for the remaining 80% of its output, which could lead to less use of natural gas, and continuing use of coal.
It is estimated that a CPRS without the RET would see natural gas as the fastest growing energy source to 2029/30, almost doubling from its 2006/07 consumption of 1158 PJ to an annual consumption of 2000PJ in 2029/30.16 ABARE attributes the majority of this growth to an increase in gas fired electricity generation.
With the RET at 20%, it has been calculated that gas consumption in the electricity sector will actually fall to 13% below 2006/07 levels by 2020.17 Through the RET, Government is forcing the electricity sector away from lower cost, reliable natural gas for electricity generation and towards expensive, intermittent options.
“Clean” Coal Initiatives
Carbon Capture and Storage is an approach to reducing emissions based on capturing carbon dioxide from large point sources such as fossil fuel power plants. The carbon dioxide can then be permanently stored away from the atmosphere, usually underground.
While the focus of carbon capture and storage technology is to ensure that coal fired power stations remain a viable source of electricity into the future, the technology will also be applicable to gas fired power stations and will also enable gas fired power stations to reduce their emissions.
The Government has several policy initiatives aimed at developing these “clean coal” technologies. (While the coal is not actually “clean”, capturing and burying the emissions from coal will reduce greenhouse gas emissions from coal fired electricity generation.) In total, the Government has committed:
$500 million through the National Clean Coal Initiative over 8 years from 2007/08
$100 million/annum to the Global Carbon Capture and Storage Institute (this funding is ongoing)
The Government has also indicated some of the revenue from the CPRS will be allocated to clean coal technologies, in addition to the:
$3.5 billion to offset the impact of the CPRS to coal fired power stations over 5 years from 2010/11
$500 million to offset the impact of the CPRS to coal miners over 5 years from 2010/11
16 ABARE Energy Projections 17 CRA International

‐ 13 ‐
Summary
Natural gas is a viable, abundant, low cost, low emission option already in use in every sector of the Australian economy.
The increased use of natural gas in Australia would see a significant reduction in national greenhouse gas emissions.
Reducing Australia’s emissions will come at considerable economic cost. Estimates vary widely as to the actual cost.
It is vital for the Australian economy that emissions reduction is achieved at as low an economic cost as possible.
In the stationary energy sector, which is the largest contributor to Australia’s national emissions, natural gas is the lowest cost method to achieve emissions reduction.
Natural gas provides a significant and immediate opportunity to meet Australia’s commitment to emissions reduction.
Australian Pipeline Industry Association PO Box 5416, Kingston, ACT, 2604
Ph: 02/62730577; Email: [email protected]