natural history of fibrodysplasia ossificans progressiva
TRANSCRIPT
Pignolo et al. Orphanet Journal of Rare Diseases (2019) 14:98 https://doi.org/10.1186/s13023-019-1068-7
RESEARCH Open Access
Natural history of fibrodysplasia ossificans
progressiva: cross-sectional analysis ofannotated baseline phenotypes Robert J. Pignolo1*, Geneviève Baujat2, Matthew A. Brown3, Carmen De Cunto4, Maja Di Rocco5, Edward C. Hsiao6,Richard Keen7, Mona Al Mukaddam8, Kim-Hanh Le Quan Sang2, Amy Wilson9, Barbara White9,Donna R. Grogan9 and Frederick S. Kaplan10*Abstract
Background: Fibrodysplasia Ossificans Progressiva (FOP; OMIM#135100) is an ultra-rare, severely disabling geneticdisease characterized by congenital malformation of the great toes and progressive heterotopic ossification (HO) inmuscles, tendons, ligaments, fascia, and aponeuroses often preceded by painful, recurrent soft tissue swelling(flare-ups). The formation of HO leads to progressive disability, severe functional limitations in joint mobility,and to a shortened life-span. In this prospective natural history study, we describe the baseline, cross-sectionaldisease phenotype of 114 individuals with FOP.
Methods: All subjects underwent protocol-specified baseline assessments to determine their disease status. Cross-sectional analyses were performed using linear regression in which functional evaluations (Cumulative Analogue JointInvolvement Scale [CAJIS] and the FOP-Physical Function Questionnaire [FOP-PFQ]) and the burden of HO as measuredby low-dose whole body CT (volume of HO and number of body regions with HO) were assessed.
Results: Findings from 114 subjects (age range 4 to 56 years) were evaluated. While subject age was significantly(p < 0.0001) correlated with increased CAJIS (r = 0.66) and FOP-PFQ scores (r = 0.41), the estimated mean increases peryear (based on cross-sectional average changes over time) were small (0.47 units and 1.2%, respectively). There was alsoa significant (p < 0.0001) correlation between baseline age and HO volume (r = 0.56), with an estimated mean increaseof 25,574mm3/year. There were significant (p < 0.0001) correlations between the objective assessment of HO volumeand clinical assessments of CAJIS (r = 0.57) and FOP-PFQ (r = 0.52).
Conclusions: Based on the cross-sectional analysis of the baseline data, functional and physical disability as assessed byCAJIS and the FOP-PFQ increased over time. Although longitudinal data are not yet available, the cross-sectional analysessuggest that CAJIS and FOP-PFQ are not sensitive to detect substantial progression over a 1- to 2-year period. Futureevaluation of longitudinal data will test this hypothesis. The statistically significant correlations between HO volume andthe functional endpoints, and the estimated average annual increase in total HO volume, suggest that the formation ofnew HO will be measurable over the relative short-term course of a clinical trial, and represents an endpoint that isclinically meaningful to patients.
Trial registration: This study (NCT02322255) was first posted on 23 December, 2014.
Keywords: Fibrodysplasia Ossificans Progressiva, Heterotopic ossification, Disease progression, Natural history, Clinical trialendpoints, Cross-sectional analysis
© The Author(s). 2019, corrected publication MCommons Attribution 4.0 International Licensedistribution, and reproduction in any mediumprovide a link to the Creative Commons licenDedication waiver (http://creativecommons.orunless otherwise stated.
* Correspondence: [email protected];[email protected] of Medicine, Mayo Clinic, Rochester, MN, USA10Departments of Orthopaedic Surgery & Medicine, The Center for Researchin FOP and Related Disorders, Perelman School of Medicine, University ofPennsylvania, Philadelphia, PA, USAFull list of author information is available at the end of the article
ay 2019. Open Access This article is distributed under the terms of the Creative(http://creativecommons.org/licenses/by/4.0/), which permits unrestricted use,
, provided you give appropriate credit to the original author(s) and the source,se, and indicate if changes were made. The Creative Commons Public Domaing/publicdomain/zero/1.0/) applies to the data made available in this article,
Pignolo et al. Orphanet Journal of Rare Diseases (2019) 14:98 Page 2 of 11
BackgroundFibrodysplasia Ossificans Progressiva (FOP) (OMIM#135100) is a rare, severely disabling disease character-ized by malformed big toes and progressive heterotopicossification (HO) in muscles, tendons, and ligaments,and is often associated with painful, recurrent episodesof soft tissue swelling (flare-ups). FOP is caused by arecurrent heterozygous activating mutation of activin re-ceptor A type I (ACVR1), a bone morphogenetic protein(BMP) type I receptor [1, 2]. There are approximately800 confirmed cases of FOP globally [3] with an estimatedprevalence of 0.6–1.3 per million individuals [4–6]. Noavailable therapies have been demonstrated to prevent theformation of HO. Palliative treatment to alleviate symp-toms is the current standard of care [7].A classic feature of FOP is the formation of HO, often
in the context of patient-reported flare-up symptoms ofunpredictable frequency, duration, and location. Diseaseprogression is also reported in the absence of flare-ups[8]. It is well recognized that recurrent episodes of HOformation starting in childhood lead to cumulative dis-ability and functional limitations over the disease course,as well as to a shortened life span [9]. These insightsinto the natural history of FOP are derived from pub-lished case series [9–12] and a comprehensive globalsurvey of 500 patients with FOP [8]. Unlike in earlierstudies, all participants enrolled in this natural historystudy (NHS) of FOP had prospective, protocol-specifiedassessments of their disease at pre-specified time points.This report describes the key design features of the
NHS and the analysis of baseline cross-sectional datathat describe the disease phenotype and potential end-points with which to evaluate therapeutic candidates.
MethodsThe NHS is an on-going prospective, longitudinal, glo-bal, non-interventional study of male and female sub-jects clinically diagnosed with FOP due to the ACVR1R206H mutation. The study is being conducted at seveninternational clinical sites (Buenos Aires, Argentina;Woolloongabba, Australia; Paris, France; Genoa, Italy;Stanmore, United Kingdom; Philadelphia, Pennsylvania,United States; and San Francisco, California, UnitedStates). Subjects are informed about the study throughinternational and local patient organizations, directphysician outreach, and through postings on Clinical-trials.gov and other similar websites.The enrollment period began in December 2014 and
ended in December 2016. The end of the planned36-month follow-up for all subjects is expected inDecember 2019. All study sites obtained approval fromtheir local institutional review boards and complied withall applicable national, local, ethical, and regulatoryguidelines. All subjects, or minor subjects’ parents/legal
guardians, were required to provide written informedconsent. Age-appropriate assent was also obtained per localregulations. The study is registered on Clinicaltrials.gov(NCT02322255) and is sponsored by Clementia Pharma-ceuticals Inc.
ObjectivesThere are three overall objectives in the NHS: (1) describethe baseline FOP disease characteristics in order to iden-tify clinically meaningful variables of disease progressionthat may serve as appropriate endpoints with which toassess the effectiveness of potential disease-modifyingtherapeutics; (2) measure FOP disease progression over36months of observation; and (3) systematically evaluateflare-up outcomes. This report describes the baseline datathat support the first objective. Subsequent reports willpresent the results that support the latter objectives, whenthose data become available.
Subject population and eligibilityMales and females from birth through 65 years of age,clinically diagnosed with FOP, and with verified ACVR1R206H mutation (via centralized laboratory) were eli-gible for inclusion.
Study design and timing of assessmentsAfter screening and determination of eligibility, all sub-jects underwent a thorough baseline examination, in-cluding whole body computed tomography (WBCT)imaging, to determine their current disease status. Theplanned routine assessments over the 36-month obser-vation period are shown in Table 1.
EndpointsAfter screening and determination of eligibility, key end-points were evaluated in all subjects to determine theirbaseline disease status.Demographics (age, sex) and baseline flare-up charac-
teristics (age at first flare-up, time since last flare-up,and number of flare-ups in the past 12 months) were re-ported. Blood and urine were also obtained for analysisof clinical laboratory parameters and potential biomarkeractivity (specific analytes are listed in Table 1).The total body burden of HO was assessed by low
dose WBCT, excluding the head. WBCT scout viewswere acquired in coronal and sagittal planes. WBCTscans were acquired in the cranio-caudal direction fromthe base of the skull through the feet using 3-mm axialslices with 512 × 512 matrix and pitch of one. Bone andsoft-tissue kernels were utilized and coronal and sagittalreconstructions were generated. A single independentmusculoskeletal radiologist at a central imaging labora-tory used standardized procedures to review all baselineWBCT images to determine the presence/absence of
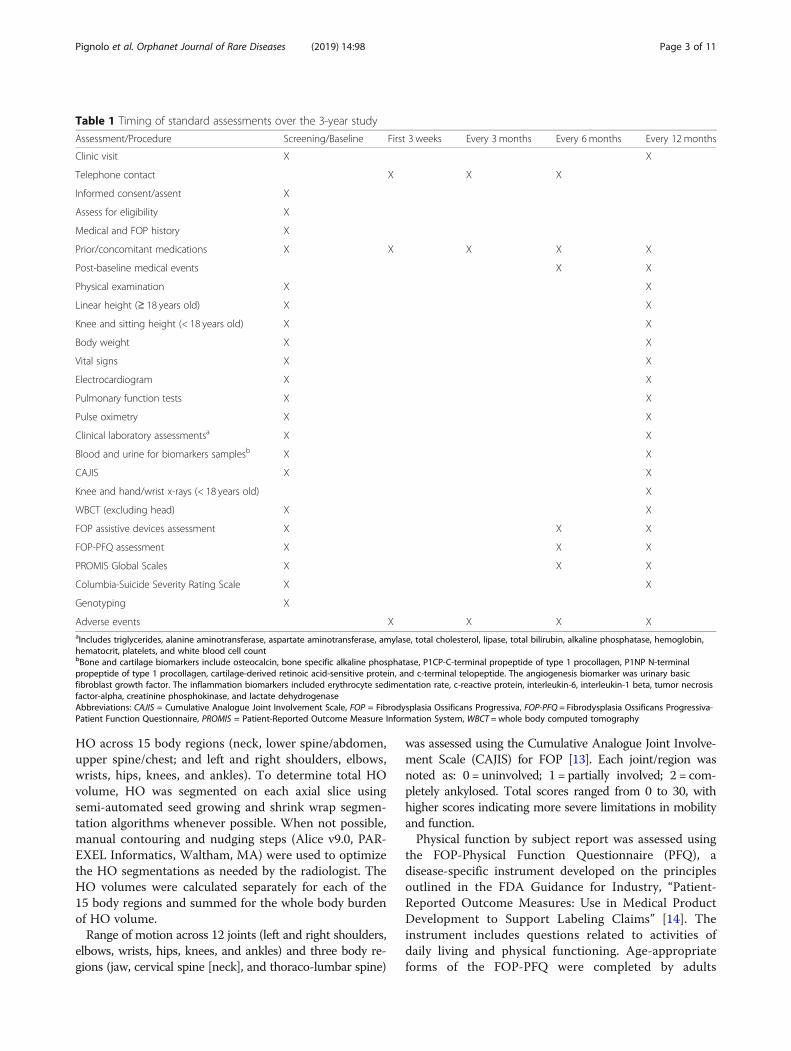
Table 1 Timing of standard assessments over the 3-year study
Assessment/Procedure Screening/Baseline First 3 weeks Every 3 months Every 6 months Every 12 months
Clinic visit X X
Telephone contact X X X
Informed consent/assent X
Assess for eligibility X
Medical and FOP history X
Prior/concomitant medications X X X X X
Post-baseline medical events X X
Physical examination X X
Linear height (≥ 18 years old) X X
Knee and sitting height (< 18 years old) X X
Body weight X X
Vital signs X X
Electrocardiogram X X
Pulmonary function tests X X
Pulse oximetry X X
Clinical laboratory assessmentsa X X
Blood and urine for biomarkers samplesb X X
CAJIS X X
Knee and hand/wrist x-rays (< 18 years old) X
WBCT (excluding head) X X
FOP assistive devices assessment X X X
FOP-PFQ assessment X X X
PROMIS Global Scales X X X
Columbia-Suicide Severity Rating Scale X X
Genotyping X
Adverse events X X X XaIncludes triglycerides, alanine aminotransferase, aspartate aminotransferase, amylase, total cholesterol, lipase, total bilirubin, alkaline phosphatase, hemoglobin,hematocrit, platelets, and white blood cell countbBone and cartilage biomarkers include osteocalcin, bone specific alkaline phosphatase, P1CP-C-terminal propeptide of type 1 procollagen, P1NP N-terminalpropeptide of type 1 procollagen, cartilage-derived retinoic acid-sensitive protein, and c-terminal telopeptide. The angiogenesis biomarker was urinary basicfibroblast growth factor. The inflammation biomarkers included erythrocyte sedimentation rate, c-reactive protein, interleukin-6, interleukin-1 beta, tumor necrosisfactor-alpha, creatinine phosphokinase, and lactate dehydrogenaseAbbreviations: CAJIS = Cumulative Analogue Joint Involvement Scale, FOP = Fibrodysplasia Ossificans Progressiva, FOP-PFQ = Fibrodysplasia Ossificans Progressiva-Patient Function Questionnaire, PROMIS = Patient-Reported Outcome Measure Information System, WBCT = whole body computed tomography
Pignolo et al. Orphanet Journal of Rare Diseases (2019) 14:98 Page 3 of 11
HO across 15 body regions (neck, lower spine/abdomen,upper spine/chest; and left and right shoulders, elbows,wrists, hips, knees, and ankles). To determine total HOvolume, HO was segmented on each axial slice usingsemi-automated seed growing and shrink wrap segmen-tation algorithms whenever possible. When not possible,manual contouring and nudging steps (Alice v9.0, PAR-EXEL Informatics, Waltham, MA) were used to optimizethe HO segmentations as needed by the radiologist. TheHO volumes were calculated separately for each of the15 body regions and summed for the whole body burdenof HO volume.Range of motion across 12 joints (left and right shoulders,
elbows, wrists, hips, knees, and ankles) and three body re-gions (jaw, cervical spine [neck], and thoraco-lumbar spine)
was assessed using the Cumulative Analogue Joint Involve-ment Scale (CAJIS) for FOP [13]. Each joint/region wasnoted as: 0 = uninvolved; 1 = partially involved; 2 = com-pletely ankylosed. Total scores ranged from 0 to 30, withhigher scores indicating more severe limitations in mobilityand function.Physical function by subject report was assessed using
the FOP-Physical Function Questionnaire (PFQ), adisease-specific instrument developed on the principlesoutlined in the FDA Guidance for Industry, “Patient-Reported Outcome Measures: Use in Medical ProductDevelopment to Support Labeling Claims” [14]. Theinstrument includes questions related to activities ofdaily living and physical functioning. Age-appropriateforms of the FOP-PFQ were completed by adults
Pignolo et al. Orphanet Journal of Rare Diseases (2019) 14:98 Page 4 of 11
(subjects 15 years of age and older) and children/proxies(subjects 14 years of age and younger). Because the totalscores vary by age across the FOP-PFQ instruments, theanalysis was performed on transformed scores expressedas a percentage of the worst possible score with lower per-centages indication worse functioning.Physical and mental health were assessed using the
Patient Reported Outcome Measure Information System(PROMIS) Global Physical and Global Mental HealthScales for subjects 15 years and older [15], and the PROMISPediatric Global Health Scale (proxy- and/or self-completed forms) for subjects 14 years of age and younger[16]. Scores were converted to T-scores such that a value of50 (with a standard deviation of 10) represents the averagefor the general population in the United States. HigherT-scores indicate better physical/mental health.
Statistical analysisSample sizeThe sample size, which was based on enrollment projec-tions throughout the global FOP community and not onstatistical justifications, was set at up to 100 subjects(noting that subjects could be replaced at the discretionof the sponsor should they withdraw for any reason),with at least 10 subjects in each of the following categor-ies: < 8 years old, 8 to < 15 years old, 15 to < 25 years old,and 25 to ≤65 years old. These age categories were chosento obtain a representative cross-section of disease sever-ity/progression.
Planned analysesThe cross-sectional analysis of baseline data from allenrolled subjects was performed after the last subject wasenrolled into the study. Data were tabulated descriptively(number and percentage of subjects for categorical param-eters, and the number, mean, standard deviation, andrange for continuous parameters) overall and by age cat-egory. The estimated cross-sectional difference over age infunctional outcomes (FOP-PFQ and CAJIS) and the totalbody burden of HO as assessed by WBCT (volume of HOand number of body regions with HO) was assessed usinglinear regression with baseline age as the only covariate.Similarly, correlations between functional outcomes andthe total body burden of HO were estimated with linearregression with measures of total body burden of HO asthe only covariate. In focusing on one time point for eachsubject, these cross-sectional analyses do not take into ac-count the episodic and variable nature of FOP progres-sion. Correction for multiple testing was not performed.
ResultsDemographics and baseline diseaseThe two sites in the United States enrolled the mostsubjects (22 [19%] in Philadelphia, PA; and 20 [18%] in
San Francisco, CA), followed by Argentina (20 [18%]subjects), United Kingdom (17 [15%] subjects), France(15 [13%] subjects), Italy (14 [12%] subjects), andAustralia (6 [5%] subjects).Of the 117 subjects screened, 114 (97%) were docu-
mented to have the ACVR1 R206H mutation (two hadvariants and one did not have FOP; these subjects werenot eligible for enrollment). The demographics and base-line disease characteristics of these 114 subjects (from24 countries) are shown in Table 2.There was similar representation across the age categor-
ies (14.9% in the < 8 years group, 31.6% in the 8 to < 15years group, 29.8% in the 15 to < 25 years group, 23.7% inthe ≥25 to ≤65 years group). The mean age of subjects was17.6 years (ranging from 4 to 56 years; median 15 years),with a slightly higher percentage of males (54.4%) thanfemales (45.6%).Retrospective report of flare-ups within the preceding
12months tended to be greater in younger than in oldersubjects: the mean number of flare-ups reported in theprevious 12months was highest in the 8 to < 15 yearsgroup (6.8/year; median of 2.0/year) and lowest in theoldest group (1.9/year; median of 1.0/year); and the aver-age time since a subject’s prior flare-up was 0.7 years(median of 0.3 years) in the youngest group comparedwith 2.3 years (median of 0.9 years) in the oldest group.In general, mean baseline clinical laboratory and bio-
marker analytes were within the normal range for eachage category.Functional limitations, as assessed by the CAJIS and
FOP-PFQ were worse in older than in younger subjects.Adult assessments of physical (PROMIS Global PhysicalHealth) and mental (PROMIS Global Mental HealthScale) health were similar between the two older age cat-egories. Children’s health as assessed by parent proxieson the PROMIS Global Health Scale was worse in olderchildren than in younger children. The results are sum-marized in Table 2.While the total body volume of HO was variable
across the age groups (ranging from 0 to 2,833,946mm3;Table 2), the median volume was lowest (21,692 mm3) inthe youngest subjects and highest (481,524 mm3) in theoldest. The mean number of body regions with HO alsoincreased with age, varying from 3.1 regions in the youn-gest age group to 8.8 regions in the oldest age group.
Functional disability progresses as subjects ageSubject age was strongly correlated with CAJIS, andmoderately correlated with the FOP-PFQ (Fig. 1), indi-cating that functional disability in FOP advances overtime. The estimated average increases per year based ona linear regression model (0.47 units [95% CI: 0.37–0.57]for CAJIS and 1.2% [95% CI: 0.6–1.7%] for the FOP-PFQ)were relatively small for both assessments.
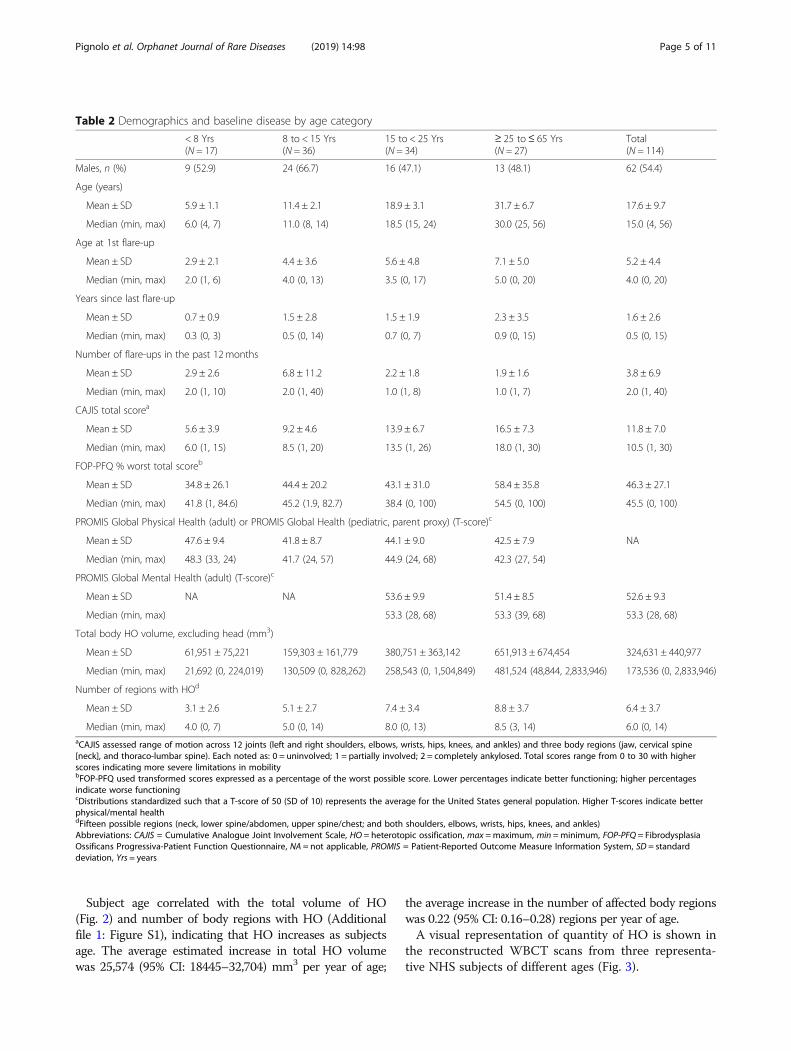
Table 2 Demographics and baseline disease by age category
< 8 Yrs(N = 17)
8 to < 15 Yrs(N = 36)
15 to < 25 Yrs(N = 34)
≥ 25 to≤ 65 Yrs(N = 27)
Total(N = 114)
Males, n (%) 9 (52.9) 24 (66.7) 16 (47.1) 13 (48.1) 62 (54.4)
Age (years)
Mean ± SD 5.9 ± 1.1 11.4 ± 2.1 18.9 ± 3.1 31.7 ± 6.7 17.6 ± 9.7
Median (min, max) 6.0 (4, 7) 11.0 (8, 14) 18.5 (15, 24) 30.0 (25, 56) 15.0 (4, 56)
Age at 1st flare-up
Mean ± SD 2.9 ± 2.1 4.4 ± 3.6 5.6 ± 4.8 7.1 ± 5.0 5.2 ± 4.4
Median (min, max) 2.0 (1, 6) 4.0 (0, 13) 3.5 (0, 17) 5.0 (0, 20) 4.0 (0, 20)
Years since last flare-up
Mean ± SD 0.7 ± 0.9 1.5 ± 2.8 1.5 ± 1.9 2.3 ± 3.5 1.6 ± 2.6
Median (min, max) 0.3 (0, 3) 0.5 (0, 14) 0.7 (0, 7) 0.9 (0, 15) 0.5 (0, 15)
Number of flare-ups in the past 12 months
Mean ± SD 2.9 ± 2.6 6.8 ± 11.2 2.2 ± 1.8 1.9 ± 1.6 3.8 ± 6.9
Median (min, max) 2.0 (1, 10) 2.0 (1, 40) 1.0 (1, 8) 1.0 (1, 7) 2.0 (1, 40)
CAJIS total scorea
Mean ± SD 5.6 ± 3.9 9.2 ± 4.6 13.9 ± 6.7 16.5 ± 7.3 11.8 ± 7.0
Median (min, max) 6.0 (1, 15) 8.5 (1, 20) 13.5 (1, 26) 18.0 (1, 30) 10.5 (1, 30)
FOP-PFQ % worst total scoreb
Mean ± SD 34.8 ± 26.1 44.4 ± 20.2 43.1 ± 31.0 58.4 ± 35.8 46.3 ± 27.1
Median (min, max) 41.8 (1, 84.6) 45.2 (1.9, 82.7) 38.4 (0, 100) 54.5 (0, 100) 45.5 (0, 100)
PROMIS Global Physical Health (adult) or PROMIS Global Health (pediatric, parent proxy) (T-score)c
Mean ± SD 47.6 ± 9.4 41.8 ± 8.7 44.1 ± 9.0 42.5 ± 7.9 NA
Median (min, max) 48.3 (33, 24) 41.7 (24, 57) 44.9 (24, 68) 42.3 (27, 54)
PROMIS Global Mental Health (adult) (T-score)c
Mean ± SD NA NA 53.6 ± 9.9 51.4 ± 8.5 52.6 ± 9.3
Median (min, max) 53.3 (28, 68) 53.3 (39, 68) 53.3 (28, 68)
Total body HO volume, excluding head (mm3)
Mean ± SD 61,951 ± 75,221 159,303 ± 161,779 380,751 ± 363,142 651,913 ± 674,454 324,631 ± 440,977
Median (min, max) 21,692 (0, 224,019) 130,509 (0, 828,262) 258,543 (0, 1,504,849) 481,524 (48,844, 2,833,946) 173,536 (0, 2,833,946)
Number of regions with HOd
Mean ± SD 3.1 ± 2.6 5.1 ± 2.7 7.4 ± 3.4 8.8 ± 3.7 6.4 ± 3.7
Median (min, max) 4.0 (0, 7) 5.0 (0, 14) 8.0 (0, 13) 8.5 (3, 14) 6.0 (0, 14)aCAJIS assessed range of motion across 12 joints (left and right shoulders, elbows, wrists, hips, knees, and ankles) and three body regions (jaw, cervical spine[neck], and thoraco-lumbar spine). Each noted as: 0 = uninvolved; 1 = partially involved; 2 = completely ankylosed. Total scores range from 0 to 30 with higherscores indicating more severe limitations in mobilitybFOP-PFQ used transformed scores expressed as a percentage of the worst possible score. Lower percentages indicate better functioning; higher percentagesindicate worse functioningcDistributions standardized such that a T-score of 50 (SD of 10) represents the average for the United States general population. Higher T-scores indicate betterphysical/mental healthdFifteen possible regions (neck, lower spine/abdomen, upper spine/chest; and both shoulders, elbows, wrists, hips, knees, and ankles)Abbreviations: CAJIS = Cumulative Analogue Joint Involvement Scale, HO = heterotopic ossification, max =maximum, min =minimum, FOP-PFQ = FibrodysplasiaOssificans Progressiva-Patient Function Questionnaire, NA = not applicable, PROMIS = Patient-Reported Outcome Measure Information System, SD = standarddeviation, Yrs = years
Pignolo et al. Orphanet Journal of Rare Diseases (2019) 14:98 Page 5 of 11
Subject age correlated with the total volume of HO(Fig. 2) and number of body regions with HO (Additionalfile 1: Figure S1), indicating that HO increases as subjectsage. The average estimated increase in total HO volumewas 25,574 (95% CI: 18445–32,704) mm3 per year of age;
the average increase in the number of affected body regionswas 0.22 (95% CI: 0.16–0.28) regions per year of age.A visual representation of quantity of HO is shown in
the reconstructed WBCT scans from three representa-tive NHS subjects of different ages (Fig. 3).
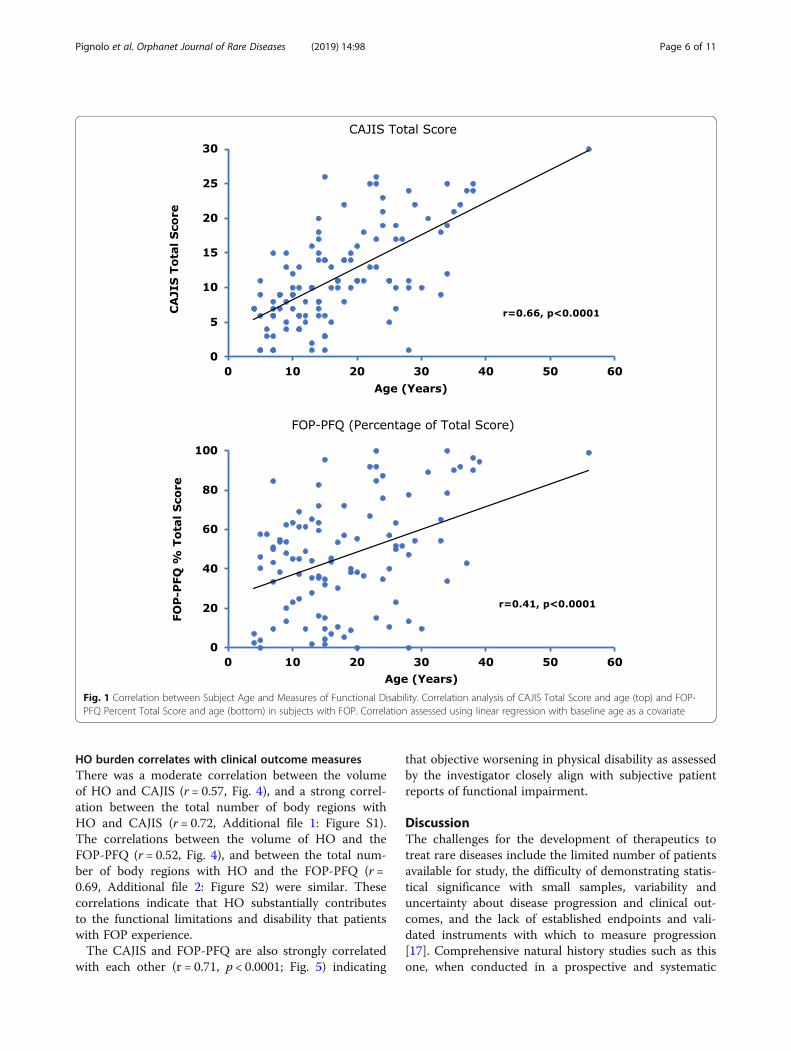
Fig. 1 Correlation between Subject Age and Measures of Functional Disability. Correlation analysis of CAJIS Total Score and age (top) and FOP-PFQ Percent Total Score and age (bottom) in subjects with FOP. Correlation assessed using linear regression with baseline age as a covariate
Pignolo et al. Orphanet Journal of Rare Diseases (2019) 14:98 Page 6 of 11
HO burden correlates with clinical outcome measuresThere was a moderate correlation between the volumeof HO and CAJIS (r = 0.57, Fig. 4), and a strong correl-ation between the total number of body regions withHO and CAJIS (r = 0.72, Additional file 1: Figure S1).The correlations between the volume of HO and theFOP-PFQ (r = 0.52, Fig. 4), and between the total num-ber of body regions with HO and the FOP-PFQ (r =0.69, Additional file 2: Figure S2) were similar. Thesecorrelations indicate that HO substantially contributesto the functional limitations and disability that patientswith FOP experience.The CAJIS and FOP-PFQ are also strongly correlated
with each other (r = 0.71, p < 0.0001; Fig. 5) indicating
that objective worsening in physical disability as assessedby the investigator closely align with subjective patientreports of functional impairment.
DiscussionThe challenges for the development of therapeutics totreat rare diseases include the limited number of patientsavailable for study, the difficulty of demonstrating statis-tical significance with small samples, variability anduncertainty about disease progression and clinical out-comes, and the lack of established endpoints and vali-dated instruments with which to measure progression[17]. Comprehensive natural history studies such as thisone, when conducted in a prospective and systematic
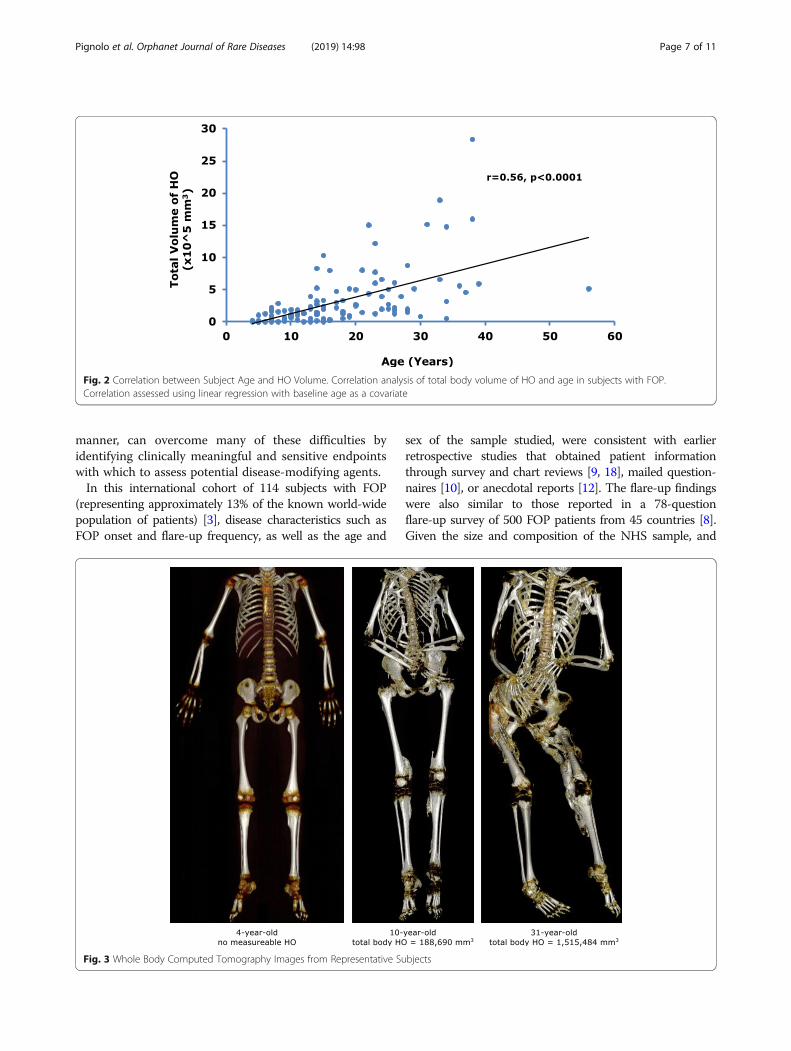
Fig. 2 Correlation between Subject Age and HO Volume. Correlation analysis of total body volume of HO and age in subjects with FOP.Correlation assessed using linear regression with baseline age as a covariate
Pignolo et al. Orphanet Journal of Rare Diseases (2019) 14:98 Page 7 of 11
manner, can overcome many of these difficulties byidentifying clinically meaningful and sensitive endpointswith which to assess potential disease-modifying agents.In this international cohort of 114 subjects with FOP
(representing approximately 13% of the known world-widepopulation of patients) [3], disease characteristics such asFOP onset and flare-up frequency, as well as the age and
Fig. 3 Whole Body Computed Tomography Images from Representative Su
sex of the sample studied, were consistent with earlierretrospective studies that obtained patient informationthrough survey and chart reviews [9, 18], mailed question-naires [10], or anecdotal reports [12]. The flare-up findingswere also similar to those reported in a 78-questionflare-up survey of 500 FOP patients from 45 countries [8].Given the size and composition of the NHS sample, and
bjects
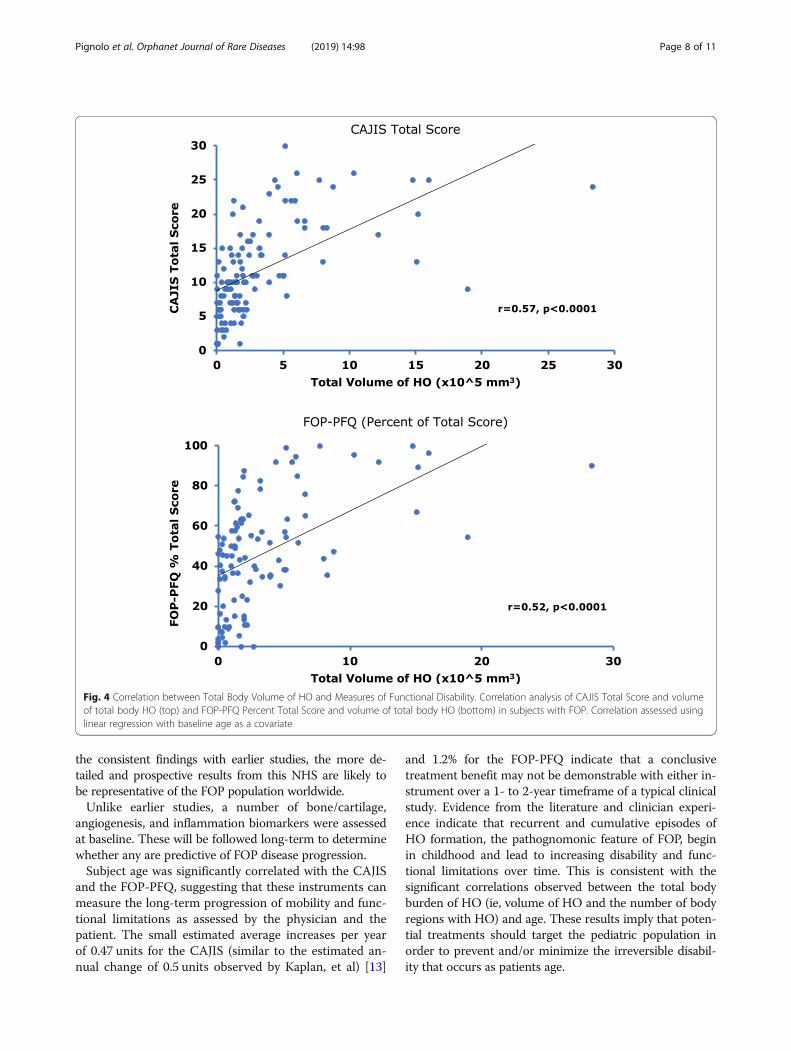
Fig. 4 Correlation between Total Body Volume of HO and Measures of Functional Disability. Correlation analysis of CAJIS Total Score and volumeof total body HO (top) and FOP-PFQ Percent Total Score and volume of total body HO (bottom) in subjects with FOP. Correlation assessed usinglinear regression with baseline age as a covariate
Pignolo et al. Orphanet Journal of Rare Diseases (2019) 14:98 Page 8 of 11
the consistent findings with earlier studies, the more de-tailed and prospective results from this NHS are likely tobe representative of the FOP population worldwide.Unlike earlier studies, a number of bone/cartilage,
angiogenesis, and inflammation biomarkers were assessedat baseline. These will be followed long-term to determinewhether any are predictive of FOP disease progression.Subject age was significantly correlated with the CAJIS
and the FOP-PFQ, suggesting that these instruments canmeasure the long-term progression of mobility and func-tional limitations as assessed by the physician and thepatient. The small estimated average increases per yearof 0.47 units for the CAJIS (similar to the estimated an-nual change of 0.5 units observed by Kaplan, et al) [13]
and 1.2% for the FOP-PFQ indicate that a conclusivetreatment benefit may not be demonstrable with either in-strument over a 1- to 2-year timeframe of a typical clinicalstudy. Evidence from the literature and clinician experi-ence indicate that recurrent and cumulative episodes ofHO formation, the pathognomonic feature of FOP, beginin childhood and lead to increasing disability and func-tional limitations over time. This is consistent with thesignificant correlations observed between the total bodyburden of HO (ie, volume of HO and the number of bodyregions with HO) and age. These results imply that poten-tial treatments should target the pediatric population inorder to prevent and/or minimize the irreversible disabil-ity that occurs as patients age.
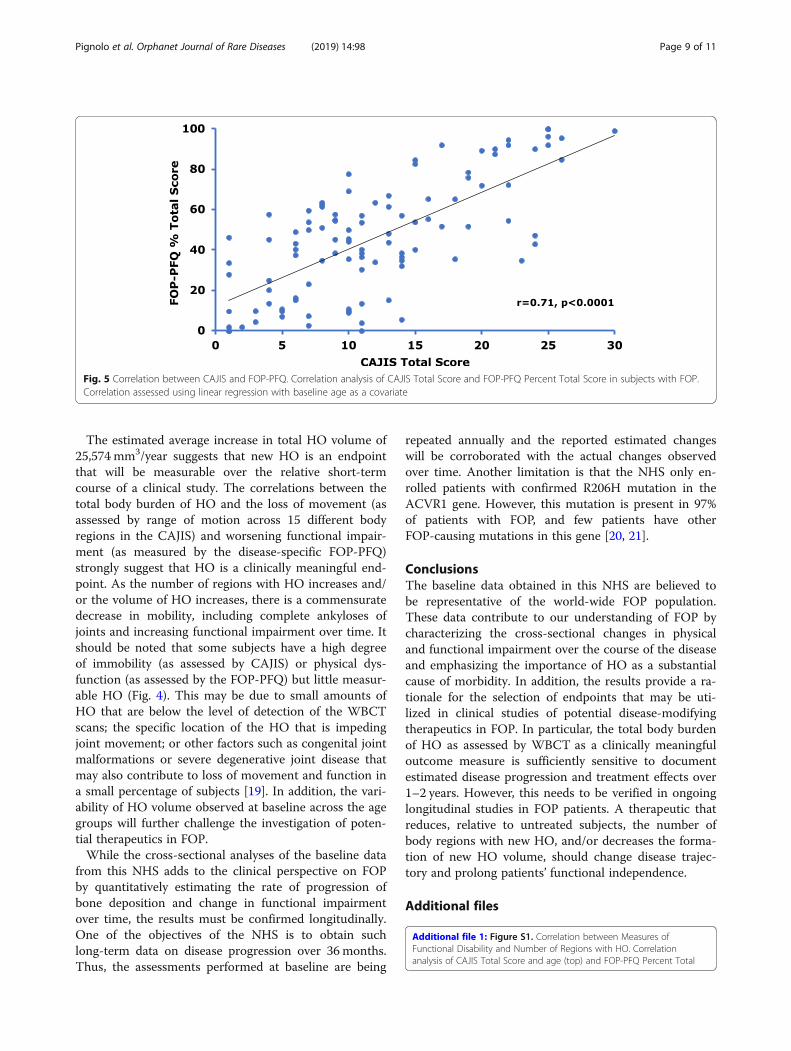
Fig. 5 Correlation between CAJIS and FOP-PFQ. Correlation analysis of CAJIS Total Score and FOP-PFQ Percent Total Score in subjects with FOP.Correlation assessed using linear regression with baseline age as a covariate
Pignolo et al. Orphanet Journal of Rare Diseases (2019) 14:98 Page 9 of 11
The estimated average increase in total HO volume of25,574 mm3/year suggests that new HO is an endpointthat will be measurable over the relative short-termcourse of a clinical study. The correlations between thetotal body burden of HO and the loss of movement (asassessed by range of motion across 15 different bodyregions in the CAJIS) and worsening functional impair-ment (as measured by the disease-specific FOP-PFQ)strongly suggest that HO is a clinically meaningful end-point. As the number of regions with HO increases and/or the volume of HO increases, there is a commensuratedecrease in mobility, including complete ankyloses ofjoints and increasing functional impairment over time. Itshould be noted that some subjects have a high degreeof immobility (as assessed by CAJIS) or physical dys-function (as assessed by the FOP-PFQ) but little measur-able HO (Fig. 4). This may be due to small amounts ofHO that are below the level of detection of the WBCTscans; the specific location of the HO that is impedingjoint movement; or other factors such as congenital jointmalformations or severe degenerative joint disease thatmay also contribute to loss of movement and function ina small percentage of subjects [19]. In addition, the vari-ability of HO volume observed at baseline across the agegroups will further challenge the investigation of poten-tial therapeutics in FOP.While the cross-sectional analyses of the baseline data
from this NHS adds to the clinical perspective on FOPby quantitatively estimating the rate of progression ofbone deposition and change in functional impairmentover time, the results must be confirmed longitudinally.One of the objectives of the NHS is to obtain suchlong-term data on disease progression over 36 months.Thus, the assessments performed at baseline are being
repeated annually and the reported estimated changeswill be corroborated with the actual changes observedover time. Another limitation is that the NHS only en-rolled patients with confirmed R206H mutation in theACVR1 gene. However, this mutation is present in 97%of patients with FOP, and few patients have otherFOP-causing mutations in this gene [20, 21].
ConclusionsThe baseline data obtained in this NHS are believed tobe representative of the world-wide FOP population.These data contribute to our understanding of FOP bycharacterizing the cross-sectional changes in physicaland functional impairment over the course of the diseaseand emphasizing the importance of HO as a substantialcause of morbidity. In addition, the results provide a ra-tionale for the selection of endpoints that may be uti-lized in clinical studies of potential disease-modifyingtherapeutics in FOP. In particular, the total body burdenof HO as assessed by WBCT as a clinically meaningfuloutcome measure is sufficiently sensitive to documentestimated disease progression and treatment effects over1–2 years. However, this needs to be verified in ongoinglongitudinal studies in FOP patients. A therapeutic thatreduces, relative to untreated subjects, the number ofbody regions with new HO, and/or decreases the forma-tion of new HO volume, should change disease trajec-tory and prolong patients’ functional independence.
Additional files
Additional file 1: Figure S1. Correlation between Measures ofFunctional Disability and Number of Regions with HO. Correlationanalysis of CAJIS Total Score and age (top) and FOP-PFQ Percent Total
Pignolo et al. Orphanet Journal of Rare Diseases (2019) 14:98 Page 10 of 11
Score and total number of body regions with HO (bottom) in subjectswith FOP. Correlation assessed using linear regression with baseline age asa covariate. (PDF 48 kb)
Additional file 2: Figure S2. Correlation between Subject Age andBody Regions with HO. Correlation analysis of number of body regionswith HO and age in subjects with FOP. Correlation assessed using linearregression with baseline age as a covariate. (PDF 46 kb)
AbbreviationsACVR1: Activin receptor type 1A; BMP: Bone morphogenetic protein;CAJIS: Cumulative Analog Joint Involvement Scale; CT: Computedtomography; FOP: Fibrodysplasia ossificans progressiva; FOP-PFQ: FOP-Physical Function Questionnaire; HO: Heterotopic ossification; NHS: Naturalhistory study; OMIM: Online Mendelian Inheritance in Man; PROMIS: PatientReported Outcome Measure Information System; WBCT: Whole bodycomputed tomography
AcknowledgementsFirst and foremost, we thank the patients and their families for theirenduring involvement in this study, and the International FibrodysplasiaOssificans Progressive Association for fostering and encouraging patientparticipation. We also thank the valuable support provided by the sub-Investigators, clinical research coordinators, and research support teams thatmade this study possible.Clementia provided overall trial management, performed the statisticalanalyses, and verified the accuracy of the data presented. Clementia wasresponsible for the study design, and provided a formal review of thepublication, but all of the authors had final authority for the datainterpretation and presentation, including choice of journal.
FundingThis research was funded by Clementia Pharmaceuticals Inc., Montreal, Canada.
Availability of data and materialsThe datasets used and/or analyzed during the current study are availablefrom the corresponding authors on reasonable request.
Authors’ contributionsAuthors RJP, FSK, DRG, and BW were responsible for the conception anddesign of the study. Authors RJP, GB, MAB, CDC, MD, ECH, RK, MAM, K-HLQS,and FSK implemented the study, were responsible for data collection, anddata interpretation. Authors DRG, BW, and AW drafted the initial and revisedversions of the manuscript. All authors critically reviewed the manuscript andapproved the final version for submission.
Ethics approval and consent to participateThe study was approved initially by The Committee on Human Research atthe University of California San Francisco (approval number: 14–13854) andsubsequently approved by the ethics committees at the six other study siteinstitutions (University of Pennsylvania Institutional Review Board; Comité deProtection des Personnes, Ile de France II; Comitado Etico Regionale SanMartino; Hospital Italiano Comité de Ética de Protocolos de Investigacion;NHS Health Research Authority, London-Stanmore Research Ethics Committee;Metro South Human Research Ethics Committee). The study was registered atclinicaltrials.gov (NCT02322255), and performed in accordance with theDeclaration of Helsinki (2008).
Consent for publicationNot applicable.
Competing interestsAW, BW, and DRG are Clementia employees. All other authors receivedfunding from Clementia to implement and conduct the study. In addition,the authors’ travel expenses were paid to attend Investigator meetings atwhich study activities and results were discussed.
Publisher’s NoteSpringer Nature remains neutral with regard to jurisdictional claims inpublished maps and institutional affiliations.
Author details1Department of Medicine, Mayo Clinic, Rochester, MN, USA. 2Departementde Genetique, Institut IMAGINE and Hôpital Necker-Enfants Malades, Paris,France. 3Institute of Health and Biomedical Innovation (IHBI), TranslationalResearch Institute, Princess Alexandra Hospital, Queensland University ofTechnology (QUT), Queensland, Australia. 4Pediatric Rheumatology Section,Department of Pediatrics, Hospital Italiano de Buenos Aires, Buenos Aires,Argentina. 5Unit of Rare Diseases, Department of Pediatrics, Giannina GasliniInstitute, Genoa, Italy. 6Division of Endocrinology and Metabolism, the UCSFMetabolic Bone Clinic, the Institute of Human Genetics, and the UCSFProgram in Craniofacial Biology, Department of Medicine, University ofCalifornia-San Francisco, San Francisco, California, USA. 7Centre for MetabolicBone Disease, Royal National Orthopaedic Hospital, Stanmore, UK.8Departments of Medicine and Orthopaedic Surgery, The Center for Researchin FOP and Related Disorders, Perelman School of Medicine, University ofPennsylvania, Philadelphia, PA, USA. 9Clementia Pharmaceuticals Inc, Newton,MA, USA. 10Departments of Orthopaedic Surgery & Medicine, The Center forResearch in FOP and Related Disorders, Perelman School of Medicine,University of Pennsylvania, Philadelphia, PA, USA.
Received: 9 November 2018 Accepted: 17 April 2019
References1. Shore EM, Xu M, Feldman GJ, Fenstermacher GJ, Cho T-J, Choi IH, et al. A
recurrent mutation in the BMP type I receptor ACVR1 causes inherited andsporadic fibrodysplasia ossificans progressiva. Nat Genet. 2006;38(5):525–7.
2. Kaplan FS, Pignolo RJ, Shore EM. The FOP metamorphogene encodes anovel type I receptor that dysregulates BMP signaling. Cytokine GrowthFactor Rev. 2009;20(5–6):399–407.
3. Lilijesthrom M, Bogard B. The global known FOP population. In: FOP DrugDevelopment Forum. Boston, MA; 2016.
4. Baujat G, Choquet R, Bouée S, Jeanbat V, Ruel A, Michot C, et al. Prevalenceof fibrodysplasia ossificans progressiva (FOP) in France: an estimate basedon a record linkage of two national databases. Orphanet J Rare Dis.2017;12(1):123.
5. Connor JM, Evans DA. Genetic aspects of fibrodysplasia ossificansprogressiva. J Med Genet. 1982;19(1):35–9.
6. Connor JM, Evans DA. Fibrodysplasia ossificans progressiva. The clinicalfeatures and natural history of 34 patients. J Bone Joint Surg Br. 1982;64(1):76–83.
7. Kaplan F, Al Mukaddam M, Baujat G, Brown M, Cali A, Cho T-J, et al. Themedical management of fibrodysplasia ossificans progressiva: currenttreatment considerations. Proc Int Clin Counc FOP. 2019;1:1–111.
8. Pignolo RJ, Bedford-Gay C, Liljesthrom M, Durbin-Johnson B, Shore EM,Rocke DM, et al. The natural history of flare-ups in Fibrodysplasia OssificansProgressiva (FOP): a comprehensive global assessment. J Bone Miner Res.2016;31(3):650–6.
9. Kaplan FS, Zasloff MA, Kitterman JA, Shore EM, Hong CC, Rocke DM. Earlymortality and cardiorespiratory failure in patients with fibrodysplasiaossificans progressiva. J Bone Joint Surg Am. 2010;92(3):686–91.
10. Cohen RB, Hahn GV, Tabas JA, Peeper J, Levitz CL, Sando A, et al. Thenatural history of heterotopic ossification in patients who havefibrodysplasia ossificans progressiva. A study of forty-four patients. J BoneJoint Surg Am. 1993;75(2):215–9.
11. Morales-Piga A, Bachiller-Corral J, Trujillo-Tiebas MJ, Villaverde-Hueso A,Alonso-Ferreira V, Vazquez-Diaz M, et al. Fibrodysplasia ossificans progressivain Spain: epidemiological, clinical, and genetic aspects. Bone. 2012;51(4):748–55.
12. Smith R, Athanasou NA, Vipond SE. Fibrodysplasia (myositis) ossificansprogressiva: clinicopathological features and natural history. QJM Mon JAssoc Physicians. 1996;89(6):445–6.
13. Kaplan FS, Al Mukaddam M, Pignolo RJ. A cumulative analogue jointinvolvement scale (CAJIS) for fibrodysplasia ossificans progressiva (FOP).Bone. 2017;101:123–8.
14. US Food and Drug Administration. Guidance for Industry Patient-Reported Outcome Measures: Use in Medical Product Development toSupport Labeling Claims. https://www.fda.gov/downloads/drugs/guidancecomplianceregulatoryinformation/guidances/ucm193282.pdf.Published December 2009. Accessed 20 Sep 2017.
Pignolo et al. Orphanet Journal of Rare Diseases (2019) 14:98 Page 11 of 11
15. Hays RD, Bjorner JB, Revicki DA, Spritzer KL, Cella D. Development ofphysical and mental health summary scores from the patient-reportedoutcomes measurement information system (PROMIS) global items. QualLife Res Int J Qual Life Asp Treat Care Rehabil. 2009;18(7):873–80.
16. Forrest CB, Bevans KB, Pratiwadi R, et al. Development of the PROMIS((R))pediatric global health (PGH-7) measure. Qual Life Res Int J Qual Life AspTreat Care Rehabil. 2014;23(4):1221–31.
17. Gavin P. The importance of natural histories for rare diseases. Expert OpinOrphan Drugs. 2015;3(8):855–7.
18. Zhang W, Zhang K, Song L, et al. The phenotype and genotype offibrodysplasia ossificans progressiva in China: a report of 72 cases. Bone.2013;57(2):386–91.
19. Kaplan FS, Al Mukaddam M, Pignolo RJ. Acute unilateral hip pain infibrodysplasia ossificans progressiva (FOP). Bone. 2018;109:115–9.
20. Pignolo RJ, Shore EM, Kaplan FS. Fibrodysplasia ossificans progressiva:clinical and genetic aspects. Orphanet J Rare Dis. 2011;6:80.
21. Kaplan FS, Xu M, Seemann P, Connor JM, Glaser DL, Carroll L, et al. Classicand atypical fibrodysplasia ossificans progressiva (FOP) phenotypes arecaused by mutations in the bone morphogenetic protein (BMP) type Ireceptor ACVR1. Hum Mutat. 2009;30(3):379–90.