natural scene statistics and perceptionthe retinal image produced by perspective projection of...
TRANSCRIPT

1
Natural Scene Statistics and Perception
W.S. Geisler

2
Some Important Visual Tasks
Identification of objects and materials
Navigation through the environment
Estimation of motion trajectories and speeds
Estimation of physical dimensions and shape
Object manipulation
Visual communication
The first point I want to make is that the human visual system is designed to perform a number of important tasks. It is designed to perform these tasks though evolution as well as though learning/development during the life span. I have listed some of these tasks in this slide. These are very complex and difficult tasks that require complex neural machinery.

3
Fundamental Premise
The human visual system is the result of evolution by natural selection, and hence its design must incorporate detailed knowledge of the physical regularities of the natural environment.
Now, everyone who studies biological vision systems knows that this statement must be true. Nonetheless, vision scientists have only begun to take this fact seriously in recent years. This premise suggests that a potentially powerful strategy for gaining insight into the human visual system is by measuring and analyzing the physical regularities of the natural environment. The power of this approach is that if we can characterize the physical regularities in the visual environment then we will gain insight into how those regularities could be exploited to perform visual tasks. Those insights in turn allow us to know what to look for in the brain and how to interpret what we find. For example, to understand how the brain can create 3D representations from 2D retinal images it is crucial to understand the regularities in the retinal image produced by perspective projection of natural scenes.
Because of the complexity of the natural environment and the loss of information due to projection onto a 2D retina, the physical regularities relevant for vision are best described in statistical terms, and the best way to understand what those statistical properties imply for vision is with statistical analysis.

4
Environment
Image
Neural response
Behavior
Absolute Statistics
( )p ω s
Bayesian Statistics
( )p ω z ( )p ω r
( )p s z ( )p s r
( )p z r
( )p ω
( )p s
( )p z
( )p r
Two Types of Natural Scene Statistics
( ) ( ) ( )( ) ( )
p pp
p p=∑w
s ω ωω s
s w w
It is useful to distinguish between two general types of natural scene statistics, which can be measured at various levels along the pathway from environment to behavior. Absolute statistics are useful for understanding coding and representation. However, they say nothing about the relationship between the different levels and hence they are not as useful for understanding the information relevant for specific tasks. In most natural tasks the goal is to use the retinal image or some neural representation of the retinal image to make inferences about properties of the physical environment. In other words, the statistics one needs to know is the probability of different states of the environment given the image. These are what I am calling Bayesian statistics.

5
Two Examples (one if I run out of time)
Contour Perception
Fixation Selection
I will describe two recent examples (from my lab) of measuring physical properties of the environment and analyzing their relationship to the design of the human visual system; one example concerns contour perception and the other gaze selection.

6
Humans have a remarkably ability to see meaningful (non-accidental) structure in images they have never seen before. Much of this structure is contained in the contours created by object, shadow, lighting and material boundaries. We have been interested in measuring the statistical properties of these contours in natural scenes and in trying to understand the relationship between those properties and human ability to see structure in images. One area of research has been to examine the 2D geometrical relationships between local edge elements extracted from natural scenes.

7
Contour Completion Task
same contourdifferent contour
= ω
?
( )distance, direction, orientation, contrast polarity= ∆s
Do contour elements intersecting an occluding surface belong to the same or different contour?
We have used these statistics to characterize the information available to support performance of certain simple tasks, such as the contour completion and contour grouping.

8
Measuring Bayesian Contour Statistics
Each red pixel in the right image is a edge element location. The orientation of each element was measured but is not shown here. Two observers then assigned edge elements to physical contours (sources); observers regarded boundary contours, lighting contours and surface marking contours as distinct. This assignment information was assumed to provide approximate ground truth.

9
Decimated edge samples with orientation shown.

10
( ) ( )( )( )
( )
~
, , ,, , , ~
p cL
p c
p d cp d c
φ θ ρφ θ ρ
==
=
=
sωs
sω
0ρ = 1ρ =
1ρ =
The geometrical and contrast-polarity relationship between two edge elements is given by 4 parameters. Once images are hand segmented it is straight forward to estimate the likelihood and prior probability distributions. In the specific task we consider next, the prior probabilities are forced to be equal, so the relevant function is the likelihood ratio distribution which is shown on the right. The reference is in the middle; distance is given by the ring, direction by the angle around the ring, orientation difference by the orientation of the plotted line segment, polarity by the particular half of the diagram, and likelihood ratio by the color of the plotted line segment.For an earlier version of this analysis (without contrast polarity) see Geisler, Perry, Super & Gallogly (2001) Vision Research, 41, 711-724.These average Bayesian pair-wise statistics make it to possible to determine optimal performance in the contour completion task.

11
In the contour completion task, a pair of edge elements is selected at random from a natural image and an occluder is placed between them. The task (the display is shown in B) is to indicate whether the pair of elements is from the same or different physical contour, where the prior probability is 0.5.
Three occluder diameters. No feedback is given for the first 600 trials, then 600 trials with feedback, then 600 trials with no feedback.

12
Comparison of human (symbols) and ideal (solid curves) performance, with (green) and without (red) contrast polarity information. Human efficiency is high and parallel to ideal. Average data for four observers (two experienced, two naïve).

13
Practice with feedback does not lead to improvements in performance. If anything performance gets worse. Unpracticed observers have excellent knowledge of the contour statistics of natural scenes. When they get feedback they may try to make trial-to-trial adjustments to their decision criteria which leads to non-optimal performance.

14
2.5o
The pair-wise natural scene statistics can also be used to generate predictions for contour integration experiments (although it is not an ideal Bayesian observer). Here is an experiment we carried out several years ago to compare with the predictions from natural scene statistics. Computer vision researchers (e.g., Parent & Zuker 1989; Sha’ashua & Ullman 1988; Jacobs 1996) proposed algorithms for solving the contour integration problem. Hayes Field, Hess & Hayes (1993) were the first to do careful psychophysical work using this kind of task, and they raised awareness of the importance of the task in the biological vision science community.

15
Made parametric measurements for all four dimensions.

16
Groups obtained using pair-wise natural image statistics.

17
A Bayesian grouping rule based on natural scene statistics predicts human contour grouping performance quite well (correlation of about 0.9, as shown in next slide).

18

19
Conclusions from First Example
It is possible to measure the statistics of edge geometry in natural scenes
The human visual system appears to have incorporated those statistics efficiently into its contour grouping mechanisms

20
Two Examples
Contour Perception
Fixation Selection
As a second example, I will briefly describe some of our measurements of natural scene statistics that may be relevant for understanding how humans pick locations to fixate. The starting point for analyzing how humans select fixation points is to understand how the spatial resolution of the eye varies across the visual field.

21
Spatial Resolution Across the Visual Field
This fall off is primarily due to spatial filtering in the retina of the eye. Show foveated-imaging demo. It is precisely because of the this fall off that humans (and many other animals) make eye movements. Why do we have a foveated visual system? It is a solution to several competing goals.

22
Competing Goals for Visual System Design
Maximize spatial resolution
Maximize field of view
Minimize neural resources

23
Examples of eye scanning records made by Yarbus (1967). 1. Free examination. 2. Estimate material circumstances of family.3. Give ages of people. 4. Surmise what the family members were doing before the visitor’s arrival. 5. Remember the clothes worn by the people. 6. Remember the positions and objects in the room. 7. Estimate how long the “unexpected visitor” had been away. Eye movements strategies are task dependent.

24
Eye Movement Strategiesfor Two Tasks
Visual search: Find a known target embedded at random location
Scene encoding: Maximize the encoded image information
Now, let’s consider the task of encoding or memorizing scenes (not searching for a particular object). Determining how one should fixate in order to maximize the total encoded image information is a daunting problem. Thus, to get started we havefirst considered the simpler task of picking fixations that maximize the gain in total contrast information, or equivalently, that minimize the total uncertainty about local contrast.

25
Effects of Foveation
The greater the eccentricity the greater the reduction in contrast
The greater the eccentricity the greater the loss of contrast information
A major effect foveation is to effectively reduce contrast. The greater the eccentricity the greater the reduction in contrast information. Presumbably, one the reasons we make eye movements is to collect this lost contrast information. We have begun trying to measure that lost contrast information, so we can better understand how the visual system selects fixation locations.

26
c = sd/mean
The idea is illustrated in this slide (explain). The image on the left has been blurred using a fairly accurate descriptive formula of the human contrast sensitivity function at different eccentricities (for brief stimulus presentations). These contrast sensitivity functions are quantitatively consistent with the increase in ganglion center sizes with eccentricity. As you can see, the greater the eccentricity the more effective blurring by the retina and hencethe greater the uncertainty about the true local contrast. The question we ask is: Where should one fixate next to maximally reduce the total uncertainty about contrast for the entire image? To answer this question we need to know how contrast uncertainty depends on eccentricity. The direct way to answer this is to measure the statistics of local contrast in natural images, so that is what we did for 300 calibrated (1024 x 1024) 12-bit gray-scale natural images.

27
Calibrated Natural Images
(van Hateren and van der Schaaf, 1998)
We measured the effects of retinal blurring on local contrast in 300 natural images. These are calibrated 12-bit gray scale images. The measurements were straight forward. We blur each image by the transfer function of the human retina at a number of different retinal eccentricities. We then sample the images at a large number of randomly chosen locations and measure the probability distribution of the original unblurred contrast conditional on eccentricity and the observed blurred contrast at that eccentricity.

28
Posterior Probability Distributions for Local Contrast
Here is a sample of these probability distributions. They are very systematic and can be summarized by three simple equations.
29
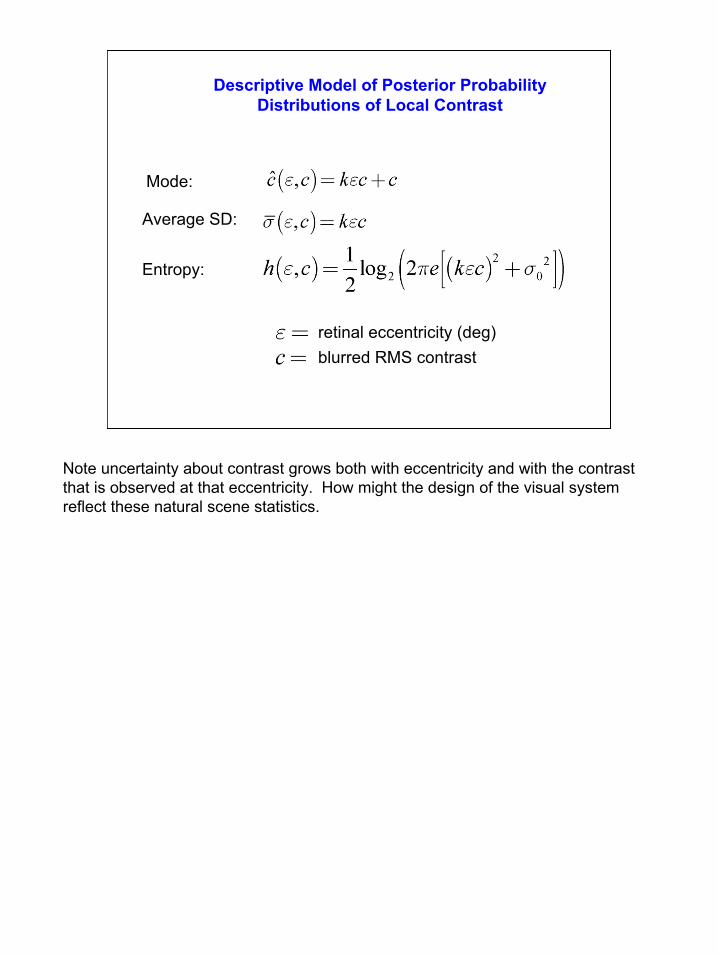
Entropy:
Mode:
Average SD:
Descriptive Model of Posterior Probability Distributions of Local Contrast
blurred RMS contrastretinal eccentricity (deg)
Note uncertainty about contrast grows both with eccentricity and with the contrast that is observed at that eccentricity. How might the design of the visual system reflect these natural scene statistics.

30
Note that updating contrast uncertainty means saving the minimum uncertainty obtained so far during the fixation sequence, and that the stopping criterion might also be to fixate until time runs out.
31
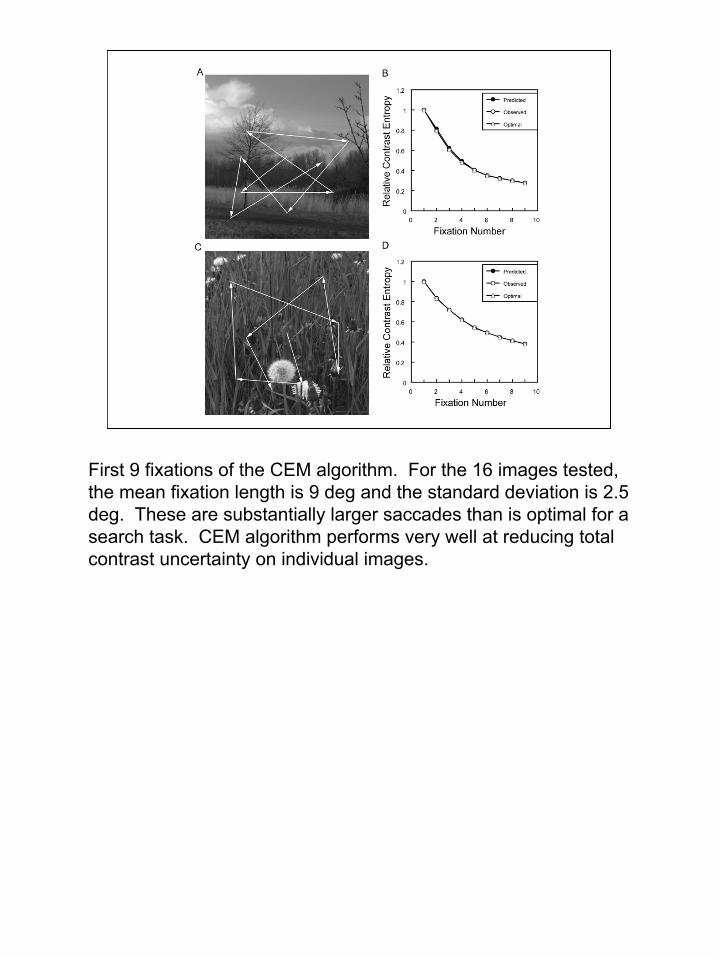
First 9 fixations of the CEM algorithm. For the 16 images tested, the mean fixation length is 9 deg and the standard deviation is 2.5 deg. These are substantially larger saccades than is optimal for a search task. CEM algorithm performs very well at reducing totalcontrast uncertainty on individual images.

32
Here are average results for all 16 test images. The CEM algorithm performs substantially better than some simple alternatives (tile and random). The CEM algorithm does quite well at reducing total uncertainty as measured by mean squared error from original image (about 90% of optimal on average).

33
Conclusions from Second Example
It is possible to measure the effects of the variable spatial resolution of the eye on the contrast statistics of natural scenes
A potentially efficient fixation selection strategy may be to pick fixations that maximally reduce total contrast uncertainty
Models based on this general approach could potentially be useful in predicting how humans use eye movements when extracting information from visual displays

34
Why Measure Natural Scene Statistics?
Characterize natural stimuli
Identify sources of stimulus information available for performing natural tasks
Determine the dynamic range, reliability and utility of the stimulus information
Generate hypotheses for visual mechanisms that might exploit thestimulus information
Design experiments to test for the hypothesized mechanisms