natural state and future production modelling of arjuno ... 38th new zealand geothermal workshop 23...
TRANSCRIPT

Proceedings 38th New Zealand Geothermal Workshop
23 - 25 November 2016 Auckland, New Zealand
NATURAL STATE AND FUTURE PRODUCTION MODELLING OF ARJUNO-WELIRANG GEOTHERMAL FIELD, INDONESIA
Ardha Wardana1, John O’Sullivan1 and Michael O’Sullivan1 1Geothermal Institute and Department of Engineering Science, University of Auckland, New Zealand
Keywords: Arjuno-Welirang geothermal field, computer modelling, natural state, future production.
ABSTRACT Arjuno-Welirang geothermal field is one of the geothermal fields in Indonesia, located in Mojokerto Regency, East Java. It is a high terrain volcanic geothermal system, with a high reservoir temperature of 260oC. The upflow zone of the system is located around the peak of Mt. Welirang, indicated by the manifestation of several fumaroles. The outflow zones are located to the west and northwest of Mt. Welirang, indicated by several hot springs in the area. A number of conceptual models of Arjuno-Welirang geothermal field have been developed based on geological, geophysical, and geochemistry data. A new conceptual model is developed as a part of the present study to synthesise and enhance the existing conceptual models. A natural state numerical model is generated using AUTOUGH2 based on the conceptual model.
Three production scenarios were simulated with the model. The first scenario aims to maximise the output. The second scenario also aims to maximise output but with some restriction on well locations set by the perimeter of the National Park area. The third scenario is the same as the second except that the total number of make-up wells is reduced.
1. INTRODUCTION Arjuno-Welirang is located in the Mojokerto Regency, East Java about 100 km southwest of Surabaya, the capital of East Java. It is one of the volcano-hosted geothermal systems in East Java, and is classified as a high temperature geothermal system, characterised by the presence of thermal features such as solfataras and fumaroles, with a large amount of sulphur deposited (Utama et al., 2012).
A number of geological studies have been made, but there has been no exploration drilling in this field. This numerical modelling study utilises some of the existing conceptual models of this area as a basis.
The objective of this study is to provide a representation of natural state conditions in order to obtain a better understanding of the reservoir behaviour and to use the calibrated natural state model to carry out some simulations of future production scenarios. Both the natural state and future production simulations use AUTOUGH2 (Yeh et al., 2012), the University of Auckland’s version of TOUGH2 (Pruess et al., 1999). TIM (Yeh et al., 2013) is used as the graphical interface.
2. REVIEW OF GEOSCIENCE DATA AND CONCEPTUAL MODELS The lithology of Arjuno-Welirang is dominated by Quaternary volcanic rock, both lava and pyroclastic.
Geological structures including faults, a caldera rim, and other circular features are present in the area.
Figure 1: Geological map and cross-sections of Arjuno-Welirang geothermal area (Adapted from Daud et al., 2010 & Hadi et al., 2010).
Numerous thermal manifestations are found in the area. The recorded data on thermal manifestations in the area, given by Hadi et al. (2010), are listed below.
a. Padusan Hot Spring. This spring is located near the Kretek River. Sample 1 site is located at coordinates UTM 671172 mE, 9149741 mS, elevation 893 m. It has clear water with some iron oxide, a temperature of 55°C and a pH of 6.3. Sample 2 site is located at coordinates UTM 670793 mE, 9150137 mS, elevation 901 m. The water has a temperature of 50°C and a pH of 5.87.
b. Coban Hot Spring. This spring is located at coordinates UTM 669198 mE, 9146104 mS. It has clear water with a temperature of 39.4°C and a pH of 6.44.
c. Cangar Hot Spring. This spring is located on a pyroclastic flow from Mt. Kembar. This spring has clear water with a thin layer of carbonaceous sinter and iron oxide (rare in the Arjuno-Welirang area). Sample 1 site is located at coordinates UTM 669200 mE, 9143910 mS, elevation 1611 m. The water has a temperature of 54°C and

Proceedings 38th New Zealand Geothermal Workshop
23 - 25 November 2016 Auckland, New Zealand
a pH of 5.9. Sample 2 site is located at coordinates UTM 669111 mE, 9143892 mS, elevation 1604 m. The water has a temperature of 48.3°C and a pH of 6.0.
d. Fumaroles. Several fumaroles are located around each summit of the Mt. Arjuno-Welirang complex. Measured temperatures are around 94.1-137.5°C, at elevations of 3050-3150 m.
e. Alterations. There are two zones of altered rocks: at Plupuh Crater and around Mt. Pundak. The alteration zone at Plupuh Crater is about 1 km2. It is dominated by Allunite, Halloysite and Kaolinite, and has a high alteration intensity and an abundance of iron oxide. Alterations around Mt. Pundak are located at Claket, with coordinates UTM 672529 mE, 9150021 mS, elevation 1000 m. The altered zone has an area of around 0.5 km2. Alterations are dominated by monmorilonite, with a low-intermediate alteration intensity.
All of the hot springs in Mt. Arjuno-Welirang are situated at lower elevations and have a lower temperature then the fumaroles. Based on a Cl-SO4-HCO3 diagram, the Padusan Hot Spring, Coban Hot Spring and Cangar Hot Spring can be classified as bicarbonate water, while from a Na-K-Mg diagram the waters can be classified as immature. This indicates that the geothermal fluid has been mixed with surface water. It also indicates that the hot springs are an outflow of the geothermal system.
Geothermometry has been used to determine the reservoir temperature of the Arjuno-Welirang geothermal system. According to SiO2 geothermometry, the calculated temperature is 176°C, while the estimated temperature from Na/K geothermometry is 313°C. According to CO2 gas geothermometry, the reservoir temperature is around 260°C. Hadi et al. (2010) identify the CO2 gas geothermometry as the most suitable for estimating the reservoir temperature.
An estimation of the size of the resource for the Arjuno-Welirang geothermal system has been made using a lumped parameter method. Using a total estimated area of 30 km2, reservoir temperature of 260°C, and an assumed reservoir thickness of 1 km, the resource potential was calculated to be 265 MWe though the authors did not specify a timeframe for production (Hadi et al., 2010).
Several investigations leading to the creation of conceptual models of Arjuno-Welirang geothermal field have been carried out. Daud et al. (2015), created a conceptual model using 3D inversion of MT data (see Fig. 2). Based on this conceptual model, the upflow zone, indicated by an updome shaped resistivity structure, is situated below the Mt Welirang volcanic complex. Outflow zones are indicated by the elongation of the conductive layer, in the vicinity of Mt Welirang and towards the west and northwest, as indicated by the occurrence of bicarbonate hot springs at Cangar and Coban in the west and at Padusan in northwest (Daud et al., 2015).
Hadi et al. (2010) created another conceptual model of Arjuno-Welirang geothermal field based on geology, and geochemistry data (see Fig. 3). The conceptual model was based on a generic conceptual model of a volcanic geothermal system, which is appropriate as Arjuno-Welirang is a strato volcano type with an age in the Quaternary and is still active.
Figure 2: Conceptual model of Arjuno-Welirang geothermal field based on 3D MT inversion (Daud et al., 2015).
The heat source is associated with the volcanic activities of Mt. Welirang. From the alteration data, the clay cap is expected to be found in the graben zone between the Kemiri Fault and Bulak-Clangket Fault at an elevation of 1400 m. The reservoir rocks are from the products of Old Arjuro-Welirang, both lava and pyroclastic.
Figure 3: Conceptual Model of Arjuno-Welirang (Hadi et al., 2010)
Utama et al. (2012), created a simpler conceptual model of Arjuno-Welirang geothermal field (see Fig. 4), based on a generic conceptual model of a volcanic geothermal system.
Figure 4: Conceptual model of Arjuno-Welirang geothermal field (Utama et al., 2012)
In this conceptual model, the upflow is located beneath Mt. Welirang, indicated by the occurrence of fumarole-solfatara around the summit of Mt. Welirang. The outflow zone is located to the west of Mt. Welirang indicated by the occurrence of the Cangar hot spring.
Proceedings 38th New Zealand Geothermal Workshop
23 - 25 November 2016 Auckland, New Zealand
Based on these various conceptual models and a review of the available data, a new conceptual model was made to synthesise and enhance the existing conceptual models. Two cross section of the conceptual model were made to show the outflow to the west and to the northwest of Mt. Welirang one of which is shown in Figure 6.
Figure 5: Conceptual model of Arjuno-Welirang geothermal field
The new conceptual model agrees with that of Daud et al. (2015), Utama et al. (2012) and Hadi et al. (2010) locating the upflow zone beneath the summit of Mt. Welirang. This is indicated by several fumalore-solfatara in the area with temperatures of 94.1-137.5°C and at elevations of 3100-3150 m.
The outflows are to the west and northwest of Mt. Welirang. The west outflow is indicated by Coban and Cangar hot springs, which have temperatures of 40-54°C, and are at an elevation of about 1600 m. This outflow is controlled by the Ledug Fault (E-W). The northwest outflow is indicated by Padusan Hot Spring which has a temperature of 50-55°C and is at an elevation of 893 m. This outflow is possibly controlled by the Padusan Fault (NW-SE).
Figure 6: Cross-section A-B through the conceptual model showing the west outflow (adapted from Daud et al., 2010; Hadi et al., 2010)
There are no outflows to the east and south of Mt. Welirang, indicated by the lack of thermal manifestations in these areas. This is possibly because there is a lava body with low permeability from Mt. Arjuno, and also due to the elevation of Mt. Arjuno which is higher than Mt. Welirang.
The clay cap and reservoir were inferred from the MT inversion data and the magnetic interpretation. The temperature profile is based on manifestation temperatures and a reservoir temperature of 260°C, estimated from gas
geothermometry calculations. There are no drilling data available to confirm the temperature profile.
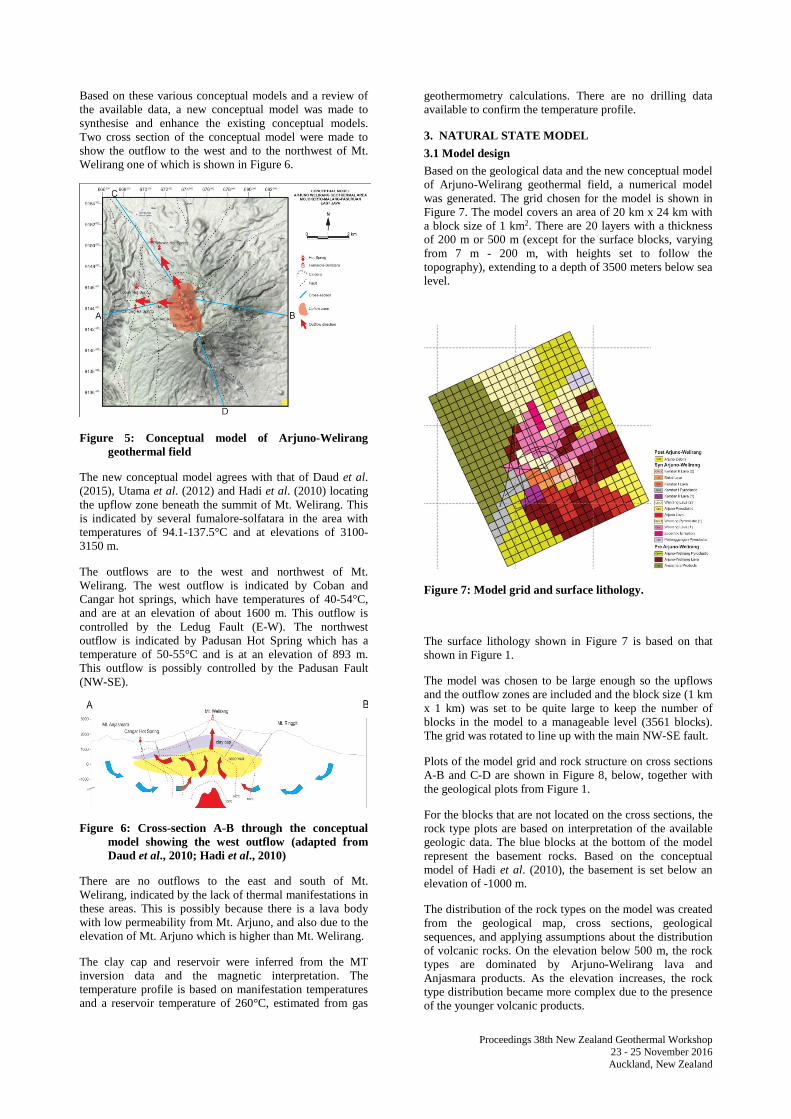
3. NATURAL STATE MODEL 3.1 Model design Based on the geological data and the new conceptual model of Arjuno-Welirang geothermal field, a numerical model was generated. The grid chosen for the model is shown in Figure 7. The model covers an area of 20 km x 24 km with a block size of 1 km2. There are 20 layers with a thickness of 200 m or 500 m (except for the surface blocks, varying from 7 m - 200 m, with heights set to follow the topography), extending to a depth of 3500 meters below sea level.
Figure 7: Model grid and surface lithology.
The surface lithology shown in Figure 7 is based on that shown in Figure 1.
The model was chosen to be large enough so the upflows and the outflow zones are included and the block size (1 km x 1 km) was set to be quite large to keep the number of blocks in the model to a manageable level (3561 blocks). The grid was rotated to line up with the main NW-SE fault.
Plots of the model grid and rock structure on cross sections A-B and C-D are shown in Figure 8, below, together with the geological plots from Figure 1.
For the blocks that are not located on the cross sections, the rock type plots are based on interpretation of the available geologic data. The blue blocks at the bottom of the model represent the basement rocks. Based on the conceptual model of Hadi et al. (2010), the basement is set below an elevation of -1000 m.
The distribution of the rock types on the model was created from the geological map, cross sections, geological sequences, and applying assumptions about the distribution of volcanic rocks. On the elevation below 500 m, the rock types are dominated by Arjuno-Welirang lava and Anjasmara products. As the elevation increases, the rock type distribution became more complex due to the presence of the younger volcanic products.

Proceedings 38th New Zealand Geothermal Workshop
23 - 25 November 2016 Auckland, New Zealand
Figure 8: Model layers and lithology on sections A-B and C-D
The location of the clay cap (dark brown) shown in Figure 8 is consistent with the temperatures shown in Figure 6.
The numerical model uses the following boundary conditions:
Top boundary: Atmospheric conditions are assigned at the top surface (pressure of 1 bar and mean annual temperature of 25°C). An annual rainfall of 2,000 mm/year (BMKG, 2010) and an infiltration rate of 10% are used. It is represented by cold water injected into the top of the model.
Side boundary: All the side boundaries are treated as no-flow boundaries; i.e. no heat or mass coming into or going out of the system. The model grid is designed so that the boundaries are far enough away from the system that boundary effects do not affect the system, and to ensure sufficient meteoric recharge is captured.
Base boundary: A background vertical temperature gradient of approximately 30°C/km (O’Sullivan et al, 2001) is assumed and therefore a conductive heat flux of 80 mW/m2 is applied at the base of the system. Deep mass inflows are included at the base of the model (layer 20), distributed over the upflow zone beneath Mt. Welirang, representing the upflow from the deep part of the convective system.
3.2 Model calibration and results The natural state conditions were simulated with AUTOUGH2 (Yeh et al., 2012). TIM (Yeh et al., 2013), a graphical interface, was used to visualise and adjust the model.
The calibration task for the natural state model of Arjuno-Welirang was simpler than usual because there is little quantitative information. The basic aim was to achieve a temperature distribution matching that shown in Figure 6
and to obtain surface outflows in the correct locations, matching the known hot springs.
The permeability structure for the faults obtained for the calibrated model is shown in Figure 9.
Figure 9: Permeability structure for the faults in the calibrated model
The first plot in Figure 9 shows the value of K1 (horizontal permeability in the direction perpendicular to fault F3). The highest value of K1 (100 mD) is on fault F4, this fault is connected to Cangar Hot Spring, one of the outflows of the system.
The second plot shows the value of K2 (horizontal permeability parallel to fault F3). Fault F3 has the highest value of K2 (10 mD), and this fault directly connects the reservoir to Padusan Hot Spring. This is the major outflow of the system. Fault F1 and caldera F8 both have low K1 and K2, these faults act as barriers, keeping heat and mass inside the system.
The third plot shows the value of K3 (vertical permeability), the highest values of K3, allowing the largest upflows of hot water, are on faults F3, F4, and F8 (5 mD). High values of K3 on F8 allow recharge water to flow into the reservoir.
Figure 10: Deep upflow in the model.
As shown in Figure 10, the deep upflow zone is concentrated on Fault F3 below the summit of Mt Welirang. An enthalpy of 1400 kJ/kg was used for the upflow which
Proceedings 38th New Zealand Geothermal Workshop
23 - 25 November 2016 Auckland, New Zealand
is equal to a water temperature of 310°C. This temperature was require to achieve a reservoir temperature of 260°C, as the upflow zone at the base of the model is approximately 2 km beneath the reservoir.
The surface temperatures in the model are shown in Figure 11. The hot zone is concentrated on Cangar, Coban and Padusan hot springs, and these are the outflows of the system. For Cangar and Coban hot springs, the mass and heat mostly flows through fault F4.
Figure 11: Surface temperatures for the model
As shown on Figure 12, for profile AB, the hot area in the middle is the upflow, and then some of the hot water flows sideways to Cangar and Coban hot springs through fault F4. Padusan hot spring is mainly affected by fault F3.
For profile CD, the hot water from the upflow below Mt. Welirang summit flows sideway to Padusan hot spring through fault F3. The cold water recharge mainly flows through caldera F8, which has low lateral permeability and high vertical permeability. Caldera F8 not only acts as a barrier to keep the heat inside the system, but also as a pathway for cold water recharge into the deep zone.
Figure 12: Temperatures on vertical slices through the
model
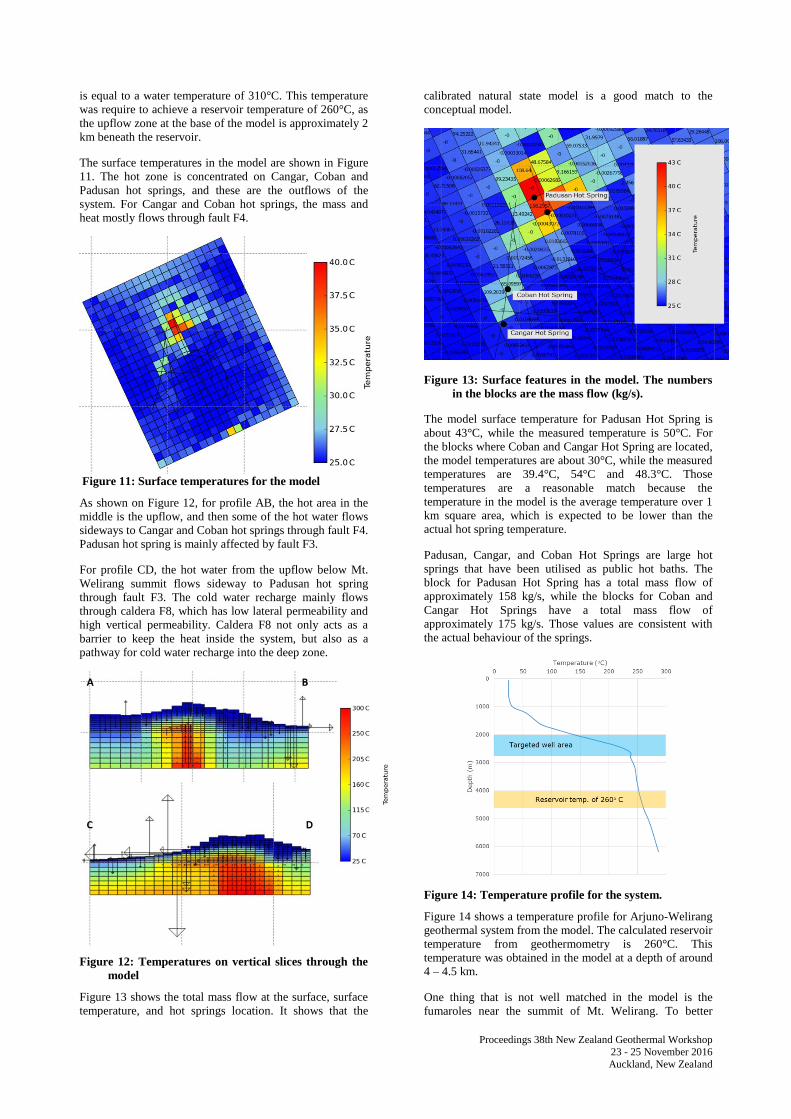
Figure 13 shows the total mass flow at the surface, surface temperature, and hot springs location. It shows that the
calibrated natural state model is a good match to the conceptual model.
Figure 13: Surface features in the model. The numbers
in the blocks are the mass flow (kg/s).
The model surface temperature for Padusan Hot Spring is about 43°C, while the measured temperature is 50°C. For the blocks where Coban and Cangar Hot Spring are located, the model temperatures are about 30°C, while the measured temperatures are 39.4°C, 54°C and 48.3°C. Those temperatures are a reasonable match because the temperature in the model is the average temperature over 1 km square area, which is expected to be lower than the actual hot spring temperature.
Padusan, Cangar, and Coban Hot Springs are large hot springs that have been utilised as public hot baths. The block for Padusan Hot Spring has a total mass flow of approximately 158 kg/s, while the blocks for Coban and Cangar Hot Springs have a total mass flow of approximately 175 kg/s. Those values are consistent with the actual behaviour of the springs.
Figure 14: Temperature profile for the system.
Figure 14 shows a temperature profile for Arjuno-Welirang geothermal system from the model. The calculated reservoir temperature from geothermometry is 260°C. This temperature was obtained in the model at a depth of around 4 – 4.5 km.
One thing that is not well matched in the model is the fumaroles near the summit of Mt. Welirang. To better

Proceedings 38th New Zealand Geothermal Workshop
23 - 25 November 2016 Auckland, New Zealand
represent the fumaroles in the model, the block in fumaroles area would have to be refined. However, for the purpose of this study, this natural state model is good enough to use for future production simulations.
4. FUTURE PRODUCTION 4.1 Description of Scenarios This section discusses the simulation of three future production scenarios. The simulations were run with AUTOUGH2 (Yeh et al., 2012), using PyTOUGH scripts (Croucher, 2011). In all cases the natural state model was used with extra wells added into the GENER module to represent production and injection wells. The natural state was used as the initial state for the future production simulations.
Many simulations were carried out to investigate the three different scenarios. The first scenario aims to maximise the steam production. The second scenario aims to maximise the steam production with some restriction set on well locations by the perimeter of the national park area. The third scenario aims to maximise steam production, with the same restriction applied on well locations as for the second scenario and with a limit on the total number of make-up wells.
All of the future scenario simulations were run for 25 years. A conversion factor of 2 kg/s of steam per MWe was used, based on a hypothetical single flash power plant similar to Wairakei (Grant & Bixley, 2013). A maximum steam flow per well of 5 kg/s was estimated from the steam/water ratio for the fluid temperatures in the target feedzones, with the mass flow capacity of a well bore assumed to be approximately 40 kg/s.
4.2 Well Targeting and Well Performance For the production scenarios, wells were targeted at blocks with high permeabilities and high temperatures. A maximum depth of 3000m was also specified. Figure 15 shows the plot of permeability and temperature in Layer 16 of the model where most of the target feedzones were located.
Figure 15: Permeability and temperature in Layer 16 (depth approx. 2000 m - 2800 m). The numbers in the blocks are the temperature (°C)
The operation of the wells was represented using a standard deliverability model (Pruess et al., 1999). The productivity index used in the deliverability model was calculated by determining the highest permeability of the three directions in the feedzone block and then multiplying by a feedzone permeability factor (FPF). Conceptually the model block permeabilities represent spatially averaged reservoir
permeabilities in the true system. Introducing the FPF reflects the fact that most feedzones in productive wells will have permeabilities higher than the reservoir average due to individual fractures and structures. The FPF also represents higher permeability-thickness coefficients that may occur as a result of larger feedzones or multiple feedzones in the same model block. Essentially it is a measure of the productivity of a well, and provides a mechanism for carrying out a sensitivity analysis of each of the scenarios for a range of well productivities, providing bounds on the steam production estimates.
4.3 Results for Scenario 1 Scenario 1 aims to maximise the output without restriction on the locations of wells. There are 12 wells for this scenario. The wells are located in 6 of the blocks with high permeability and high temperature in layer 16 (shown in Figure 15) giving 2 wells in each block. The simulation was run using a maximum steam flow per well of 5 kg/s.
A number of simulations were run using FPF values from 10 to 100 to give an estimate of the range in the steam production. The graphs in Figure 16 show the results of the simulations.
Figure 16: Total steam flow for Scenario 1. FPF 10-100.
For an FPF of 10, the system can sustain production of around 40 kg/s of steam for 25 years. For an FPF of 40, the system can produce around 100 kg/s of steam initially but this slowly decreases to approximately 55 kg/s by year 25. For an FPF of 100, the system can produce up to 100 kg/s of steam for the first 3 years, followed by a slow decrease to about 70 kg/s by year 25.
Figure 17: Estimated National Park area superimposed on the computer model (shaded region).
0
20
40
60
80
100
0 5 10 15 20 25
Stea
m fl
ow (k
g/s)
Years10 20 40 60 80 100

Proceedings 38th New Zealand Geothermal Workshop
23 - 25 November 2016 Auckland, New Zealand
4.4 Results for Scenario 2 Scenario 2 aims to maximise output, but with some restriction set on well locations by the perimeter of the National Park area. There are no data defining the National Park perimeter, and therefore it was estimated from the forest line obtained from an aerial view (not shown). The superposition of this outline on the model grid is shown in Figure 17.
With the restriction of the National Park perimeter, only three of the blocks used in Scenario 1 remained available as well targets. For Scenario 2, up to 5 wells in each of these blocks was allowed. It was assumed that the targeted blocks could be reached by using deviated well from outside the National Park perimeter. The simulation was run using a total target steam flow of 50kg/s and a maximum steam flow per well of 5 kg/s.
Figure 18 shows results of the simulations with FPFs of 10 to 100. For the FPF of 10, the system could sustain production of around 30-25 kg/s of steam for 25 years. For an FPF of 40, the system could sustain production of 50 kg/s of steam for almost 5 years followed by a slow decrease to approximately 40 kg/s by year 25. For an FPF of 100, the system can sustain the total steam target of 50 kg/s for 25 years.
Figure 18: Total steam flow for Scenario 2. FPF 10-100.
To achieve a total steam target of 50 kg/s, not all the wells are required initially. Some wells were brought online as make-up wells, in sequence, to maintain the total steam target. Figure 19 below shows the make-up well sequence required for the FPFs of 60 and 100.
Figure 19: Make-up well sequence for feedzone permeability factors of 60 and 100.
4.5 Results for Scenario 3 Scenario 3 is the same as Scenario 2 but the total number of wells allowed is reduced from 15 to 10. The simulation was run using a total target steam flow of 45kg/s and a maximum steam flow per well of 5 kg/s.
The simulation was run using an FPF of 100 to determine the maximum steam production that could be achieved while limiting the number of wells drilled to 10 and with the well pad locations outside the national park. The plots in Figure 20 show the results of the simulation for this scenario. The graph shows that the model predicts that by drilling 10 wells with an FPF of 100, the system could produce 45 kg/s of steam flow for 10 years, followed by a slow decrease to 41 kg/s by year 25. This shows that by drilling only 66% of the wells, the system could still produce 90% of the steam produced by the Scenario 2.
Figure 20: Total steam flow for Scenario 3. FPF=100.
5. CONCLUSION An improved conceptual model of Arjuno-Welirang geothermal system was developed, synthesising and enhancing the existing conceptual models. A numerical model of Arjuno-Welirang geothermal system was then set up, based on the conceptual model, to represent the natural state of the geothermal system. Three production scenarios were simulated based on the best natural state model. The results can be summarised as follows:
1. Scenario 1: a. Uses 20 wells in 5 different blocks b. Feedzone permeability factor ranges from 10 to 100. c. Steam production of 60 – 100 kg/s at the start, followed by a slow decrease to 40 – 70 kg/s by 25 years 2. Scenario 2: a. Uses 15 wells in 3 different blocks (limited by National Park boundary) b. Feedzone permeability factor ranges from 10 to 100. c. Steam production of 26 – 50 kg/s for 25 years 3. Scenario 3: a. Uses a maximum of 10 wells in 3 different blocks (limited by National Park boundary) b. Feedzone permeability factor of 100. c. Steam production of 45 kg/s for 10 years, followed by a slow decrease to 41 kg/s by years 25.
Not surprisingly the best result was obtained using the feedzone permeability factor of 100. The maximum production is obtained from the first scenario with total steam production of 100 kg/s. This result could be converted to 50 MWe, which is significantly lower than the 265 MWe estimated by Hadi et al. (2010). This is possibly due to the fact that their estimation was based on a reservoir
0
10
20
30
40
50
60
0 5 10 15 20 25
stea
m fl
ow (k
g/s)
Years
10 20 40 60 80 100
5
10
15
0 5 10 15 20 25
Num
ber o
f Wel
ls
Years
60 100
0
10
20
30
40
50
0 5 10 15 20 25
Stea
m fl
ow (k
g/s)
Years

Proceedings 38th New Zealand Geothermal Workshop
23 - 25 November 2016 Auckland, New Zealand
temperature of 260°C, while in the model, a temperature of 260°C is obtained only at 4 – 4.5 km. Using current technology, it is virtually impossible to drill wells to that depth. In the simulations wells of up to 2.8 km depth were used, and the temperature at that depth is approx. 230°C.
Results from the simulations should be helpful for predicting the reservoir behaviour and for planning future exploration and production. It is recommended that the model should be updated with future exploration data to provide a more accurate model of the actual reservoir conditions.
ACKNOWLEDGEMENTS The first author’s study at the University of Auckland was supported by a scholarship from the New Zealand Ministry of Foreign Affairs and Trade. REFERENCES Croucher, A.: PYTOUGH – A Python Scripting Library for
Automating TOUGH2 Simulations. Proc. 33rd New Zealand Geothermal Workshop, University of Auckland, Auckland, NZ (2011).
Daud, Y., Fahmi, F., Nuqramadha, W. A., Heditama, D. M., Pratama, S. A. & Suhanto, E.: 3-Dimensional Inversion of MT Data over the Arjuno-Welirang Volcanic Geothermal System, East Java (Indonesia). Proc. World Geothermal Congress 2015, Melbourne Australia (2015).
Grant, M. & Bixley, P.: Geothermal Reservoir Engineering. Elsevier (2011).
Hadi, M. N., Kusnadi, D. & Rezky, Y.: Penyelidikan Terpadu Geologi dan Geokimia Daerah Panas Bumi Arjuno - Welirang, Kabupaten Mojokerto dan Malang, Provinsi Jawa Timur. Prosiding Hasil Kegiatan Pusat Sumber Daya Geologi (2010).
Hamilton, W.: Tectonics of the Indonesian Region. USGS Professional Paper. 1078 (1979).
Hoffmann-Rothe, A., Ritter, O. & Haak, V.: Magnetotelluric and geomagnetic modeling reveals zones of very high electrical conductivity in the upper crust of Central Java. Physics of the Earth and Planetary Interiors, 124, 131–151 (2001).
Lita, F.: Identifikasi Anomali Magnetik di Daerah Prospek Panasbumi Arjuna - Welirang. Thesis. Universitas Indonesia, Indonesia (2012).
O’Sullivan, J. & O’Sullivan, M.: The Effect of Bottom Boundary Conditions on Predictions of Steam Production from Geothermal Reservoir Models. Proc. 41st Workshop on Geothermal Reservoir Engineering, Stanford, Calif., USA (2016).
O’Sullivan, M. J., Pruess, K., & Lippmann, M. J.: State of the Art of Geothermal Reservoir Simulation. Geothermics, 30(4), 395–429 (2001).
Pruess, K., Oldenburg, C. and Moridis, G.: TOUGH2 User's Guide, Version 2.0. Report LBNL-43134, Lawrence Berkeley National Laboratory, California, USA (1999).
Purnomo, B. J. & Pichler, T.: Geothermal systems on the island of Java, Indonesia. Journal of Volcanology and Geothermal Research, 285, 47–59 (2014).
Setijadji, L. D.: Segmented volcanic arc and its association with geothermal fields in Java island, Indonesia. Proc. World Geothermal Congress 2010, Bali, Indonesia (2010).
Utama, A. P., Diwanto, A., Situmorang, J., Hikmi, M. & Irsamukhti, R.: Green Field Geothermal System in Java, Indonesia. Proc. 1st ITB Geothermal Workshop, Bandung, Indonesia (2012).
Yeh, A., Croucher, A. & O’Sullivan, M.: Recent Developments in the AUTOUGH2 Simulator. Proc. TOUGH Symposium 2012, Berkeley, California, USA (2012).
Yeh, A., Croucher, A. & O’Sullivan, M.: TIM – Yet another Graphical Tool for TOUGH2. Proc. 35th New Zealand Geothermal Workshop, Rotorua, New Zealand (2013).