naval postgraduate schooldtic.mil/dtic/tr/fulltext/u2/a579764.pdf · cnp chief of naval personnel ....
TRANSCRIPT

NAVAL
POSTGRADUATE
SCHOOL
MONTEREY, CALIFORNIA
THESIS
Approved for public release; distribution is unlimited
ANALYSIS OF THE U.S. NAVY’S GOAL-BASED AWARDS SYSTEM AND ITS EFFECT ON RECRUIT
QUALITY
by
Tequila McGlocking
March 2013
Thesis Co-Advisors: Jeremy Arkes Stephen Mehay

THIS PAGE INTENTIONALLY LEFT BLANK

i
REPORT DOCUMENTATION PAGE Form Approved OMB No. 0704-0188 Public reporting burden for this collection of information is estimated to average 1 hour per response, including the time for reviewing instruction, searching existing data sources, gathering and maintaining the data needed, and completing and reviewing the collection of information. Send comments regarding this burden estimate or any other aspect of this collection of information, including suggestions for reducing this burden, to Washington headquarters Services, Directorate for Information Operations and Reports, 1215 Jefferson Davis Highway, Suite 1204, Arlington, VA 22202-4302, and to the Office of Management and Budget, Paperwork Reduction Project (0704-0188) Washington DC 20503. 1. AGENCY USE ONLY (Leave blank)
2. REPORT DATE March 2013
3. REPORT TYPE AND DATES COVERED Master’s Thesis
4. TITLE AND SUBTITLE ANALYSIS OF THE U.S. NAVY’S GOAL-BASED AWARDS SYSTEM AND ITS EFFECT ON RECRUIT QUALITY
5. FUNDING NUMBERS
6. AUTHOR(S) Tequila McGlocking 7. PERFORMING ORGANIZATION NAME(S) AND ADDRESS(ES)
Naval Postgraduate School Monterey, CA 93943-5000
8. PERFORMING ORGANIZATION REPORT NUMBER
9. SPONSORING /MONITORING AGENCY NAME(S) AND ADDRESS(ES) N/A
10. SPONSORING/MONITORING AGENCY REPORT NUMBER
11. SUPPLEMENTARY NOTES The views expressed in this thesis are those of the author and do not reflect the official policy or position of the Department of Defense or the U.S. Government. IRB Protocol number ____N/A____.
12a. DISTRIBUTION / AVAILABILITY STATEMENT Approved for public release; distribution is unlimited
12b. DISTRIBUTION CODE A
13. ABSTRACT (maximum 200 words) Commander Navy Recruiting Command (CNRC) has changed the Awards and Incentives system in recent years in an effort to increase recruiter productivity and promote recruit quality goal achievement. The latest awards and incentive system updates have placed increased emphasis on recruit quality in support of Navy Recruiting Command’s strategic plan Recruit Force 2020. This thesis provides a detailed overview of the current Navy awards and incentives system. The thesis also attempts to estimate the effect of specific awards on the quality of recruit contracts. Furthermore, this thesis estimates the effect of monthly goaling targets on the quality of recruits. The objective is to determine if the current Navy awards and incentive system has an unintended consequence of reducing recruit quality. The analysis tests whether recruiters sacrifice quality as the end of the month approaches to meet their monthly goaling deadline. Also, the analysis tests the impact of Gold Wreath award on recruiter productivity and recruit quality. The results indicate that recruit quality tends to fall as the end-of-the-month approaches, specifically during the last week of the month. However, the results did not support the hypothesis that recruiters sacrifice quality to obtain their first Gold Wreath award. 14. SUBJECT TERMS Commander Navy Recruiting Command , Awards and Incentives System Gold Wreath Award, Recruit Force 2020, Recruit Quality, Ordinary Least Squares Regression, Recruiter Goaling Process, Armed Forces Qualification Test (AFQT) Scores, and High School Diploma Graduate (HSDG)
15. NUMBER OF PAGES
75 16. PRICE CODE
17. SECURITY CLASSIFICATION OF REPORT
Unclassified
18. SECURITY CLASSIFICATION OF THIS PAGE
Unclassified
19. SECURITY CLASSIFICATION OF ABSTRACT
Unclassified
20. LIMITATION OF ABSTRACT
UU NSN 7540-01-280-5500 Standard Form 298 (Rev. 2-89) Prescribed by ANSI Std. 239-18

ii
THIS PAGE INTENTIONALLY LEFT BLANK

iii
Approved for public release; distribution is unlimited
ANALYSIS OF THE U.S. NAVY’S GOAL-BASED AWARDS SYSTEM AND ITS EFFECT ON RECRUIT QUALITY
Tequila McGlocking Lieutenant, United States Navy
B.S., Norfolk State University, 2006
Submitted in partial fulfillment of the requirements for the degree of
MASTER OF SCIENCE IN MANAGEMENT
from the
NAVAL POSTGRADUATE SCHOOL March 2013
Author: Tequila McGlocking
Approved by: Jeremy Arkes Thesis Co-Advisor
Stephen Mehay Thesis Co-Advisor
William Gates, Dean Graduate School of Business and Public Policy

iv
THIS PAGE INTENTIONALLY LEFT BLANK

v
ABSTRACT
Commander Navy Recruiting Command (CNRC) has changed the Awards and Incentives
system in recent years in an effort to increase recruiter productivity and promote recruit
quality goal achievement. The latest awards and incentive system updates have placed
increased emphasis on recruit quality in support of Navy Recruiting Command’s strategic
plan Recruit Force 2020. This thesis provides a detailed overview of the current Navy
awards and incentives system. The thesis also attempts to estimate the effect of specific
awards on the quality of recruit contracts. Furthermore, this thesis estimates the effect of
monthly goaling targets on the quality of recruits. The objective is to determine if the
current Navy awards and incentive system has an unintended consequence of reducing
recruit quality. The analysis tests whether recruiters sacrifice quality as the end of the
month approaches to meet their monthly goaling deadline. Also, the analysis tests the
impact of Gold Wreath award on recruiter productivity and recruit quality. The results
indicate that recruit quality tends to fall as the end-of-the-month approaches, specifically
during the last week of the month. However, the results did not support the hypothesis
that recruiters sacrifice quality to obtain their first Gold Wreath award.

vi
THIS PAGE INTENTIONALLY LEFT BLANK
vii
TABLE OF CONTENTS
I. INTRODUCTION........................................................................................................1 A. PURPOSE .........................................................................................................1 B. RESEARCH QUESTIONS .............................................................................1 C. BACKGROUND/DISCUSSION .....................................................................1 D. SCOPE OF THE THESIS ...............................................................................2 E. METHODOLOGY ..........................................................................................3
II CNRC AWARDS AND INCENTIVE SYSTEMS AND GOALING PROCESS .....................................................................................................................5 A. CNRC RECRUITER AWARD AND INCENTIVE SYSTEM ....................5 B. HISTORY OF CNRC AWARDS AND INCENTIVE SYSTEM ................6 C. ANNUAL AWARDS ........................................................................................9 D. CNRC GOALING PROCESS ......................................................................12 E. SUMMARY ....................................................................................................14
III. LITERATURE REVIEW .........................................................................................17 A. USMC END-OF-MONTH RECRUIT QUALITY STUDIES ...................17
1. Baczkowski (2006) ..............................................................................17 2. Bruno (2005) .......................................................................................18
B. USN ENLISTED RECRUITER GOAL SHARE AND GOAL-BASED RECRUITING STUDIES .............................................................................20 1. Hojnowski (2005) ...............................................................................20 2. Pry (1996) ............................................................................................24 3. CNA .....................................................................................................27
C. SUMMARY ....................................................................................................30
IV. DATA AND METHODOLOGY ..............................................................................31 A. DATA COLLECTION ..................................................................................31 B. SUMMARY OF SAMPLE AND VARIABLES ..........................................31
1. Dependent Variables ..........................................................................31 2. Independent (Explanatory) Variables..............................................31
C. DESCRIPTIVE STATISTICS ......................................................................34 1. Low Quality Recruit Indicators ........................................................34 2. Age .......................................................................................................35 3. Gender .................................................................................................35 4. Marital Status .....................................................................................35 5. Race .....................................................................................................35 6. State Unemployment Rate .................................................................36 7. End-of-Month Day Indicators ..........................................................36 8. Recruit Contract Date Within 1st Gold Wreath Award
Eligibility Period ................................................................................36 D. METHODOLOGY ........................................................................................36
V. MODEL ESTIMATION ...........................................................................................39

viii
A. MODELS ........................................................................................................39 B. MODEL SPECIFICATION ..........................................................................41 C. HYPOTHESIS, REFERENCE GROUP, AND EXPLANATORY
VARIABLES RELATIONSHIP/INTERPRETATION .............................42 1. Hypothesis ...........................................................................................42 2. Hypothesized Relationship of Effect of Explanatory Variables ....42
a. Age ...........................................................................................42 b. Gender .....................................................................................42 c. Marital Status ..........................................................................43 d. Race .........................................................................................43 e. Year ..........................................................................................43 f. Unemployment Rate ................................................................43 g. End-of-Month Day Indicator..................................................43 h. Recruit Contract Date in 1st Gold Wreath Award
Eligibility Time Period ............................................................44 3. Results .................................................................................................44
VI. SUMMARY, CONCLUSIONS, AND RECOMMENDATIONS ..........................51 A. SUMMARY ....................................................................................................51 B. CONCLUSIONS ............................................................................................52 C. RECOMMENDATIONS ...............................................................................52
1. Changes to the USN Recruiter Awards and Incentives System ....52
APPENDIX. ............................................................................................................................55
LIST OF REFERENCES ......................................................................................................57
INITIAL DISTRIBUTION LIST .........................................................................................59

ix
LIST OF TABLES
Table 4.1. Variable Descriptions.......................................................................................33 Table 4.2. Variables Summary Statistics ..........................................................................34 Table 5.1 Description of Low Quality Models ................................................................40 Table 5.2 OLS Regression Models of Probability of Recruit Being Low Quality ..........45 Table 5.3 OLS Regression Models of Probability of Recruits Being Low Quality .........49 Table 5.4 OLS Models Results for Indicators Representing the Effect on Low
Quality Types for Recruit Contract Dates Falling Within the Recruiter’s 1st Gold Wreath Award Eligibility Time Period .............................................50
Table A.1. RIS Point-Based Program ................................................................................56

x
THIS PAGE INTENTIONALLY LEFT BLANK

xi
LIST OF ACRONYMS AND ABBREVIATIONS
AAA Admiral’s Accelerator Award AC Active Component AFQT Armed Forces Qualification Test AFRS Air Force Recruiting Service API Asian-Pacific Islanders ASVAB Armed Services Vocational Aptitude Battery AVF All-Volunteer-Force CANREC Canvasser Recruiters CNA Center for Navy Analysis CNP Chief of Naval Personnel CNRC Commander Navy Recruiting Command CNRF Commander Navy Reserve Force CNSWC Commander Navy Special Warfare Command CO Commanding Officer DEP Delayed Entry Program DoD Department of Defense EMF Enlisted Master File ERIS Enlisted Recruiter Incentive System ESR Electronic Service Record FTS Full Time Support FY Fiscal Year GSBPP Graduate School of Business and Public Policy HSDG High School Diploma Graduate LOC Letter of Commendation MAD Mean Absolute Deviation MCRC Marine Corps Recruiting Command MCRD Marine Corps Recruiting Depot MU Musician NAM Navy and Marine Corps Achievement Medal NAT New Accession Training NAVCRUITDIST Navy Recruiting District NAVCRUITREG Navy Recruiting Regions NC Navy Commendation
xii
NCES National Center for Education Statistics NCO New Contract Objective NDAWS Navy Department Awards Web Service NHSDG Non-traditional High School Diploma Graduate NRC Navy Recruiting Command NRD Navy Recruiting District NRF Navy Reserve Force NRS Navy Recruiting Station OLS Ordinary Least Squares OMF Officer Master File ORDPRO Professional Review Board PPR Production-Per-Recruiter PQS Personnel Qualification Standards PRIDE Personalized Recruiting for Immediate and Delayed Enlistment PSD Personnel Support Department QDP Quarterly Demand Plan RC Reserve Component RCAP Recruiter Command Advancement Program RCCPDS Reserve Component Common Personnel Data System REIP Recruiter Excellence Incentive Program RF 2020 Recruiting Force 2020 Strategy RIS Recruiter Incentive System ROI Return on Investment R-OPS Recruiting Operations Officer ROY Recruiter of the Year RWSA Recruiter Work Schedule Adjustment SELRES Navy Reserve Selected Reserve Spec-ops Special Operations SWO Surface Warfare Officer TSC Test Score Category TTCU Total Test Category Upper U.S. United States USAREC U.S. Army Recruiting Command USN U.S. Navy

xiii
ACKNOWLEDGMENTS
I would like to thank God, my Savior and Jesus Christ, for all of his blessings and
gifts of strength and courage to persevere through this thesis process. He has been my
solid rock and in Him I have laid my trust. The road has been long and hard; yet, He has
been my eyes when I could not see and mine ears when I could not hear. I am so grateful
and blessed to have a personal relationship with Him and know Him for myself.
My family and friends have given me constant encouragement, support, and love
throughout this thesis process, and for that, I am truly grateful and honored. When times
seemed very tough and the stress of my work increased dramatically, they were there to
uplift my spirits and offer me inspiring words of hope.
Completing my thesis while caring for my wonderful two-year old son, Malachi,
had its share of challenges that at times seemed insurmountable; however, through
enduring love, patience, light-heartedness, and a keen focus, we were able, with God’s
constant protection, to make it through to the end. He has given me a new outlook on life
for which I could not have been so lucky.
I would be remiss if I did not thank my thesis advisors, Professor Arkes and
Professor Mehay of the Naval Postgraduate School’s Graduate School of Business and
Public Policy (GSBPP). Thank you for all of your time and effort in making my thesis the
best product that it could be. I really appreciate you all sticking with me until the end of
what seemed a very long road. I will not forget the many hours and days that you used up
in support of my thesis. With sincere gratitude, I wish you the best. I would also like to
thank the other GSBPP Professors in the Manpower Systems Analysis curriculum that
answered questions from me and supported me through my Master’s degree program.
Much thanks is due to the Commander Navy Recruiting Command staff and
recruiters who entertained my many phone conferences and questions about the Navy
recruiting awards and incentives systems and recruiter goaling process. They were patient
and willing to give me insight into their policies, procedures, and practices that allowed
for greater insight and knowledge about their world.

xiv
THIS PAGE INTENTIONALLY LEFT BLANK

1
I. INTRODUCTION
A. PURPOSE
This thesis will evaluate the U.S. Navy’s awards and incentives system and its
effects on monthly recruit contract quality. The thesis will estimate the level of recruiter
productivity, with respect to recruit quality, as determined by monthly goaling criteria.
The objective is to determine if the current Navy Recruiting Command (CNRC) awards
and incentive system has unintended consequences of causing reductions in recruit
quality. Specifically, recruiters may sacrifice on the quality of recruits as the end of the
month approaches to meet their monthly goaling deadline.
B. RESEARCH QUESTIONS
Research Question 1: Do recruiters have lower quality recruits at the end of the
month compared to the beginning of the month?
Research Question 2: Does recruit quality decrease during the three-month award
eligibility window for a recruiter’s first Gold Wreath award, and reduce even more in the
last month of that three-month award window?
C. BACKGROUND/DISCUSSION
The Department of Defense’s (DoD) keen focus on the variation in recruiter
productivity since the establishment of the All-Volunteer-Force (AVF) has driven a wide
array of research analysis and studies on how to increase recruiter productivity while
utilizing available resources effectively and efficiently. Over the last few decades, the
population of high quality military-eligible youth has increased; however, during the
same period, the propensity to serve has decreased amongst that population. The Navy
recruiters’ job is increasingly challenged by the availability of alternative civilian labor
market options and by educational options for the targeted population of eligible youth.
Recruiter awards and incentives systems have been utilized through a wide array
of programs to increase recruiter productivity throughout their recruiting tour that is
usually three years in length. While previous programs, such as the Freeman Plan, and
2
Recruiter Excellence Incentive Program (REIP), were considered successful to some
extent by some analysts (Asch, 1990), such programs often displayed some unexpected
negative effects on recruiter behavior towards the end of a production cycle, particularly
an increased number of lower quality recruit contracts. For this area of study, recruit
quality is determined by a mix of factors, such as Armed Forces Qualification Test
(AFQT) scores, and High School Diploma Graduate (HSDG) status.
The current Navy Recruiting Command Awards System gives recruiters the
opportunity to earn awards and incentives on a quarterly and annual basis throughout the
tour of recruiting duty. Recruiters are able to earn individual awards for productivity and
for meeting or exceeding monthly goals. The recruiter has the opportunity for rewards
that include, but are not limited to, immediate promotion under the Recruiter Command
Advancement Program (RCAP), Navy Commendation medals, Navy Achievement
medals, and time off during the production cycle for exceeding individual goals over a
specified period as promulgated by the Navy Recruiting District (NRD) Commanding
Officer’s (CO) monthly goaling letter. Most time-off incentives vary across NRD, which
is set by each CO dependent upon the goals of the districts and geographical areas they
cover.
When goals are not met, recruiters are assessed and training is commonly
recommended. NRD staff stated that no formal negative penalties have occurred for
individual recruiters not making their goal.
This thesis attempts to determine if recruiters sign lower quality recruits at the end
of the month compared to the beginning of the month. Also, this thesis assesses whether
the current Navy Recruiter Awards System incentivizes recruiters to sacrifice recruit
quality to earn awards, specifically at the end of the three-month award eligibility
window. Recommendations are made to assist CNRC in making informed decisions
about the effective and efficient management of recruiting resources.
D. SCOPE OF THE THESIS
The scope of the thesis includes (1) a review of the Navy recruiting command
awards and incentive system, (2) an in-depth review of the Navy recruiting command’s

3
goaling process to include fiscal year (FY)13 operational analysis and risk assessment,
(3) a statistical analysis of monthly recruit contract quality for individual recruiters, and
states, (4) an analysis of the effects of the awards system on monthly and quarterly recruit
contract quality, and (5) a set of recommendations for an effective solution to further
support NRC’s FY13 Business Plan and Recruiting Force 2020 Strategy (RF 2020)
(Commander Navy Recruiting Command, 2012a).
E. METHODOLOGY
This research is primarily quantitative and uses the following methodology.
• Conduct a literature review analyzing previous work done in the area of recruiter productivity
• Analyze Personalized Recruiting for Immediate and Delayed Enlistment (PRIDE) Data (1997–2011) provided by CNRC.
• Visit NRD San Francisco to discuss with staff how the goaling, award and incentive programs are administered. Obtain information about the tangible and intangible effects of awards/incentives on recruiter behavior with respect to increased or decreased productivity on a monthly and quarterly basis. Also, have continuing discussions with recruiters about actions concerning achievement and non-achievement of recruiter goals.
• Engage CNRC and Region West staff in conversation with respect to the recruiter goaling process.
• Develop several multivariate models to help predict recruiter productivity based on the quality of recruit contracts during specific periods at the end of a month. The models will use explanatory variables based on individual demographics, geographical area covered (state), FY97–11), and state unemployment rates.
• Make recommendations on policies to increase recruiter productivity via the awards and incentives system.

4
THIS PAGE INTENTIONALLY LEFT BLANK

5
II CNRC AWARDS AND INCENTIVE SYSTEMS AND GOALING PROCESS
A. CNRC RECRUITER AWARD AND INCENTIVE SYSTEM
The Navy enlisted recruiter awards and incentive system gives enlisted recruiters
the ability to earn individual awards and incentives based upon their monthly, quarterly,
and annual production with respect to achieving their net new contract objective (NCO)
and reserve attainment goals. The net NCO is derived from the difference between the
number of contracts written and the number of actual recruit accessions and nets out
Delayed Entry Program (DEP) attrition. The net NCOs and reserve attainment goals are
disseminated from each Navy Recruiting Region to each NRD under their cognizance via
a Monthly Goaling Letter. Recruiter award and incentive eligibility is based upon the
beginning of the month goals. Mid-month goal adjustments do not adversely affect award
and incentive eligibility; however, incentives may become more robust to help shape
recruiter behavior to meet the changing mission. Monthly goals are set for each recruiter
according to the NRD and Navy Recruiting Station (NRS) at which the recruiter is
assigned.
A recruiter may earn a variety of awards for team and individual efforts.
Individual productivity awards include the Gold Wreath award and the Six-Shooter
award. The Admiral’s Accelerator award utilizes the Recruiter Incentive System (RIS),
which is a system that assigns points to recruits based on quality. Points are also assigned
for the achievement of varying diversity goals (Black, female), special programs (Nukes,
Special Warfare, Special Operations, Reserve, Active), and Total Test Category Upper
(TTCU) (upper Mental Groups) (Commander Navy Recruiting Command, 2012a;
Commander Navy Recruiting Command, n.d.).
As stated in the Navy Recruiting Command’s “Recruiting Force 2020 Strategy”
(Commander Navy Recruiting Command, 2012b), the mission of Navy recruiting is to
“Recruit the best men and women for America’s Navy to accomplish today’s missions
and meet tomorrow’s challenges.”

6
RF2020 places increased emphasis on three overarching goals.
• Increase organizational productivity and capacity to meet all missions
• Develop a very high quality workforce grounded in commitment and workplace satisfaction
• Measure success and return on investment (ROI) to balance against future recruiting risk
B. HISTORY OF CNRC AWARDS AND INCENTIVE SYSTEM
CNRC has changed the awards and incentives system throughout the last few
decades in an effort to increase recruiter productivity and promote recruit quality goal
achievement. The latest awards and incentive system updates have placed a large
emphasis on recruit quality in support of Navy Recruiting Command’s RF 2020. A few
of the challenges that recruiters face in achieving their goals are increased standards for
military qualifications, shifting population demographics, recruiting diversity, and the
focus on “fit vs. fill.” The focus on “fit vs. fill” describes the shift to quality versus
quantity in Navy recruitment.
A recruiter may earn only one of many awards for the same achievement, act, or
period of meritorious service. The current system, as well as the previous one, allows
recruiters to earn team and individual awards. This thesis focuses primarily on the
attainment of individual awards by recruiters. In February 2012, the awards and
incentives system was changed to base eligibility criteria on TTCU1 quality contract
attainment specifications (Commander Navy Recruiting Command, 2012a). This change
signals a shift of focus to recruit quality versus recruit quantity in the recruiting world.
Under the current system, a Gold Wreath award is earned based on the net NCO
and Reserve attainment goals disseminated in the NAVCRUITDIST’s Monthly Goaling
Letter. A recruiter may earn an unlimited number of Gold Wreath awards during their
recruiting tour. The eligibility criteria for the Gold Wreath award states that enlisted
programs recruiters are eligible for a Gold Wreath when they achieve any combination of
four net new contracts/reserve gains (affiliations and/or enlistments) within a consecutive
1 Test Category Upper (TCU) now called Total Test Category Upper (TTCU) = (AFQT=>50); (TSC1-
3).

7
(non-overlapping) three month period or less, or three net TTCU new contracts in a three-
month, non-overlapping period (Commander Navy Recruiting Command, 2012a). The
time period covered for any given Gold Wreath award cannot be used for any subsequent
awards. No numerical requirement exists for recruit contracts achieved per month during
any month in the three-month eligibility period as long as the overall quantity is attained.
The Admiral’s Accelerator Award (AAA) is a quarterly program created to
provide incentives for specific production requirements in areas, such as Recruiter Active
Component (AC) or Reserve Component (RC), nuclear, and diversity to name a few.
Military performance and conduct are also taken into consideration when COs determine
candidate awardees. Under the AAA program, a RIS,2 a point-based system, assigns
points based on recruit quality type that may change from quarter-to-quarter depending
on the recruit quality needs of the Navy. The top recruiter of each Navy Recruiting
District (NAVCRUITDIST) who contracts the highest (net) number of TTCU contracts is
eligible for the AC or RC version of AAA. Additionally, any recruiter who contracts a
Prior Service Reserve or a Musician (MU) will be awarded two additional RIS points.
Eligibility for the Nuke AAA requires top recruiters have the highest number of Nuke
Female Nuclear Propulsion Officer Candidate (NUPOC) applicants (Surface Warfare
Officer (SWO), Sub, Instructor or Engineer) sent to interview during the award period.
Two of these awards are presented nationally, one for each of the two Navy Recruiting
Regions (NAVCRUITREG). The Diversity AAA is awarded to recruiters who attain the
highest total number of high quality African American and Hispanic applications ordered
to the Professional Review Board (ORDPRO) during the award period. Four awards are
presented nationally, two per NAVCRUITREG.
The RIS is the only point-based system authorized for use by the NRC. A
description of the point system is presented in Appendix. For individual recruiters, RIS
points are based primarily on the quality of the enlisted applicant during initial entry into
DEP (affiliation), or for officers, the Officer Package submission and selection. Points are
given for new contracts (NCO and Prior Service), TTCU, Special Operations (Spec-ops),
2 RIS formerly known as Enlisted Recruiter Incentive System (ERIS).

8
and Nuke to name a few. Additional RIS points are also received for accessions.
Recruiter incentive points are promulgated quarterly on the AAA’s notice dependent
upon the needs of the Navy. The points are distributed as rate-specific to achieve “FIT”
for the Navy.
Another award available for recruiters is the Commander Navy Reserve Force
(CNRF) award. The CNRF award is presented to the top recruiter, whether AC or RC, in
each NAVCRUITDIST who writes the highest number of net New Accession Training
(NAT) contracts during the annual award period issued at the end of the FY. The NAT
program was created for non-prior-service recruits to access into the Navy Reserve
Selected Reserve (SELRES) primarily to supplement manning in an effort to reduce
critical ratings shortfalls. NAT recruits would initially attend Recruit Training Command
and continue to an A-school (rate-specific) and a C-school (rate-specific specialization
training) if necessary prior to returning to their hometown. After successful completion of
all required schooling and training, NAT recruits are then under the cognizance of the
Navy Operational Support Center nearest their residence (Navy Recruiting Manual-
Enlisted 1130.8J Vol. 4).
Enlisted mission recruiters who achieve a monthly net Production Per Recruiter
(PPR) of 2.0 or greater for the FY are eligible to receive a Navy and Marine Corps
Achievement Medal (NAM). Also, enlisted mission recruiters who achieve a net PPR of
4.0 or greater for the FY are eligible to receive a Navy Commendation (NC) medal. Each
fiscal year, personnel will only receive the highest production medal (NC or NAM)
earned with the exception of the CO’s special achievement NAMs for production. The
CO’s special achievement NAMs for production include critical programs awards, such
as the CNRF Award, and the Commander Navy Special Warfare Command (CNSWC)
Award, which are not all inclusive. Time off from duty is also authorized for various
levels of production, and is used to shape recruiter behavior with respect to monthly,
quarterly, and annual recruit quality attainment goals.

9
The Six-Shooter Award, although not currently available to recruiters in the 2012
awards manual, was earned by an individual recruiter personally achieving six net new
contracts during any given month. Recruiters who earned this award were given time off
(Special Liberty), a six-shooter plaque, and recognition in the Navy Recruiting Command
Magazine.
Commander Navy Recruiting Command authorized the Admiral’s Five Star
Award beginning on January 2006. Recruiters earned this award by personally achieving
five net new contracts during any given month. After three consecutive months of earning
the award, recruiters become eligible for a Flag Letter of Commendation (LOC) that
translated into two points toward advancement exams for E-6 and below.
C. ANNUAL AWARDS
The national AC and RC enlisted recruiters of the year, national enlisted diversity
recruiter of the year,3 and National NSW/NSO recruiter of the year is eligible for a
NAVCRUITCOM NC. Strong consideration is given to recruiters whose efforts directly
contribute toward achievement of the NRC’s priority, diversity, and quality targets.
Prior to February 2012, to earn the Gold Wreath award, a recruiter was not
required to achieve every monthly quality goal within the three-month award eligibility
period as long as the recruiter obtained the required number of contracts within the three-
month award window. Also, the right quality contract was desired but not required to win
the award. Over time, the number of contracts required to earn an award has decreased
due to the downsizing and right-shaping of the U.S. Navy. District or station leadership
may prevent recruiters from writing, for example, five contracts in the third month just to
receive an award if recruiters are not meeting their monthly goals during the first two
months of that award eligibility period. The responsibility for monitoring and requiring
that the recruiters write high quality contracts is held more importantly at the district and
individual station leadership level. One of the main challenges faced by the leadership is
ensuring that recruiters are focused on achieving high quality contracts instead of just
3 For purposes of Recruiter of the Year (ROY) consideration, “Diversity” includes African-American,
Hispanic, Native American, Asian Pacific Islander, and female.

10
chasing the awards and incentives that can be achieved by writing low-quality contracts.
The recruiting challenge increases in high-volume, low-quality markets when trying to
meet monthly mission goals. The reality in the recruiting world is that more work is
required when recruiting lower quality recruits due to their increased DEP attrition risk,
probable academic shortcomings, and increased supervision requirements (Bruno, 2005).
The increased workload is evident during mid-month recruit goal shifts when increases
may occur in individual recruiters’ contract goals.
Another highly sought after incentive is the RCAP promotion, which replaced the
Recruiter Excellence Incentive Program (REIP) promotion in August 2007. The change
was propelled by the large difference in advancement opportunities afforded to active
recruiters opposed to reserve recruiters (primarily canvasser recruiters (CANRECs)).
Under RCAP (COMNAVCRUITCOM INSTRUCTION 1430.7C), eligibility
requirements to earn the promotion were simplified and the inequities between active and
reserve Full Time Support (FTS) recruiters were mostly eliminated. The RCAP program
is utilized to achieve production benchmarks, which include the Navy’s accession and
Test Category Upper (TCU) quality goals (now called Total Test Category Upper
(TTCU)). Also, RCAP provides increased meritorious promotion opportunities using a
“total person” concept to incentivize production in excess of 100% of recruiting goals.
Two types of RCAP awards may be earned, meritorious and production. The
number of RCAP awards available to each NRD is calculated using the following
formula.
• Meritorious RCAP Allowances: Meritorious advancement authorizations are based on the average annual active enlisted manning of each NRD. These advancements are equal to one per 50 enlisted personnel or fraction thereof. For example:
# of Meritorious RCAP = Average (AC) Enlisted Manning Advancements allowed 50
• Production RCAP Allowances. Additional RCAP authorizations can be earned by NRDs based on the following achievements.
(1) NRD’s achieving 100% NSW/NSO4 NCO: 1% x [NRD average annual enlisted manning] = additional RCAP Advancements.
4 Navy Special Warfare/ Navy Special Operations (NSW/NSO) recruit career options.
11
(2) NRDs that achieve two of the four following production criteria: 1% x [NRD average annual enlisted manning] = additional RCAP Advancements.
• Production criteria:
• 100% Fiscal year (AC) Test Category Upper (TCU)5
• 100% Fiscal year (RC) Test Category Upper (TCU)
• 100% Fiscal year (AC) Accession
• 100% Fiscal year (RC) Accession
For each calculated RCAP allowance/authorization, a fractional result is always
rounded up to the next number. In any case, the total overall percentage of RCAP awards
may not exceed 5% of the NRD’s average annual enlisted manning.
According to OPNAVINST 1430.4, CNRC is only allowed to submit 26 RC
candidates per RCAP cycle. An equitable distribution of the 26 RC allowances is handed
down from CNRC to the Navy regions. Career Recruiting Force recruiters (AC and RC)
are ineligible for the award. Individual recruiters compete for the RCAP awards based on
the program eligibility criteria and supervisor evaluations. To become eligible, a recruiter
must be Personnel Qualification Standards (PQS) qualified and have passed the recruiter
board. All time-in-rate advancements requirements must also be met. Any person
previously advanced under RCAP (or the previous REIP program) are ineligible for the
advancement program. Recruiters must meet current health and physical readiness
standards as set forth in the Navy’s OPNAVINST 6110.1. Another condition is that
recruiters must have passed the last advancement exam given in the FY in which they are
nominated for advancement. With all Navy advancements, evaluation reports are
considered. As shown above, the total person concept is in effect in determining which
recruiter becomes eligible to earn immediate promotion under RCAP.
CNRC Awards Division and the NRD’s only maintain recruiter-earned awards in
a database for two years. The Navy Department Awards Web Service (NDAWS)
database manager stated that community-specific awards (i.e., “Gold Wreath Recruiting
awards) are not input into NDAWS. Community-specific awards are those awards earned
5 Test Category Upper (TCU) now called Total Test Category Upper (TTCU) = (AFQT=>50).

12
while serving in specific warfare or special duty assignments, such as recruiting. The
awards are input into the service members’ electronic service record (ESR) via scanned
page 13 entry. Determining if the award was given specifically for production versus
overall performance is definitely a challenge. The community-specific awards are
processed by the individual NRDs and sent to the respective Personnel Support
Departments (PSDs) to be entered into the service member’s ESR. Also, NRDs only have
access to ESRs for members who are currently at their command. Collecting recruiting
community-specific award data for this thesis posed a challenge due to the many man-
hours and manpower required to determine which recruiter earned what award from 1997
through 2011.
D. CNRC GOALING PROCESS
Chief of Naval Personnel (CNP) distributes the CNP goaling letter (trimester
goals) to CNRC based upon the Quarterly Demand Plan (QDP). CNRC determines
overall annual and monthly recruiting goals then sent to Region East and Region West to
be appropriately apportioned out to each NRD under their cognizance. The Navy’s
goaling model is run once a year at CNRC to provide goal shares for each NRD
aggregated out to each region for new contract shipping goals by month, rate, program,
and gender. The goal distribution determination is based upon population demographics
for the areas of responsibility for each region. Another factor considered is the historical
success in recruiting and the state unemployment rates. The local unemployment rate is a
huge driving factor, particularly long term, in the Navy recruiter’s ability to recruit and
meet their mission successfully. The role of local unemployment rates are discussed more
in Chapter IV.
Currently, 26 NRDs are in existence. Thirteen are assigned to each region,
respectively. Each NRD is comprised of nine divisions (formerly called zones) consisting
of approximately four to five recruiting stations each. Currently, the recruiting stations
number 1,418; however, this number may be reduced in the near future (CNRC staff
provided current number of recruiting stations).
13
After receipt of the NRD goals, each NRD’s CO distributes a monthly goaling
letter that delineates the recruiting prospect priorities, an up-to-date status on district
production, and CO monthly incentives. A few of the categories commonly mentioned on
a goaling letter for recruiting priorities are AC, NCO, RC, prior service, New Accession
Training (NAT), nuke, and female goals. New Contract Objectives (NCO) are the recruits
who have no prior service. NAT are those active (drilling) reservists personnel who go
through recruit training, attend a service school for their rate, and are then sent back to
their drilling home state for reserve duty.
The Recruiting Operations Officer (R-OPS) begins the goaling distribution
process at the NRD level. Then, the NRD’s Chief Recruiter and Assistant Chief Recruiter
creates station, and thus, individual recruiter goals based upon the market share of youth
population. The goals are developed using recruiter electronic databases, such as
WebSTEAM, and ASAD, for up-to-date information. WebSTEAM is a database utilized
in the recruiting community to provide the following reports: Goal Matrix (goal and sub
goals by station); Leads Zip Code Report; and Market Share (zip code level and
production demographics). WebSTEAM enables recruiters to perform their jobs more
efficiently (COMNAVCRUITCOMINST 1130.8J—Volume I–CH1). The quality and
count of personnel in the DEP attribute to shaping the targeted goals.
The Navy uses a “Fit to Fill” ideology for recruit position seeking. The more
desirable recruits are those who score 50 or above on their AFQT test and are also
HSDG. Currently, CNRC requires a combined quality goal of 75% recruits who are
HSDGs and who have AFQT scores of 50 or greater. Applicants who score less than 50
but 35 or above on their AFQT are qualified but not eligible unless a call for “open
season” occurs, which is utilized to accommodate the needs of the Navy. These ineligible
recruits are “banked,” and held in suspense until “open season.” The “open season” call
by CNRC is dependent upon the Navy’s end strength profile and what is needed to make
capacity given resource constraints. The “open season” call, if given, normally coincides
with a 75% mission gate, which is normally the end of the third week of the month. In
recruiting, mission gates refer to the time of the month that particular missions (goals)
need to be met, such as the 25%, 50%, 75%, and 100% gates. These percentages are

14
associated with monthly dates, for example the end of the first, second, third, and fourth
weeks of the month, respectively. The exact dates may shift around the times of the
month during which overall recruiter productivity is affected by operational or
administrative commitments (i.e., federal holidays).
Throughout any given month or year, a possibility exists that the recruit quality
requirement may be reduced to account for an increase in the required overall number of
individual contracts. The monthly mission is always dependent upon the Navy’s demand
signal from CNRC and CNP with respect to recruit quality requirements. Month-to-
month mission changes may occur that disrupt a recruiter’s ability to recruit the right
quality person required by mission. Recruiters are always challenged to attract the right
people for the right job at the right time.
E. SUMMARY
CNRC utilizes a combination of various awards and incentives to motivate
recruiter performance. The most notable individual recruiter awards authorized are the
Gold Wreath Award, AAA, Navy achievement medals, LOC medals, Recruiter
Command Advancement Program immediate advancement, and time off from duty. Time
off from duty is authorized in conjunction with earning particular awards. However, time
off is also available monthly dependent upon each NRD’s criteria for eligibility as
described in the CO’s monthly goaling letters.
The monthly goals switch from month to month and may sometimes switch
during the month based upon demand signals from CNRC and CNP. Also, in the
recruiting community, the term “mission gates” is utilized. The mission gates are specific
times (dates) during the month when specific goals are required to be met, such as
required quality and quantity of certain contracts (i.e., male upper or female air). “Male
upper” refers to males who score 50 and above on the AFQT test. A mission gate may
require that by the 20th of the month, 100% of male upper contracts must be written.
After the mission gate, leadership may declare an “open season” period during which the
recruiters are allowed to write the lower contracts that they may have been “banking.”
The term “banking” refers to when a recruiter is not allowed to write a contract on willing

15
military-eligible applicants for one reason or another at the point of contact; however,
these eligible recruits are told that they will be called upon at the next window of
opportunity that the military is taking that type of recruit. An example of when a recruiter
would bank an eligible recruit occurs when that person is a male lower (below 50 AFQT
score) and the military has sufficient male lower inventory and requires only male uppers.
That recruit is banked until the next window of opportunity for the recruiter to enlist male
lower candidates.

16
THIS PAGE INTENTIONALLY LEFT BLANK

17
III. LITERATURE REVIEW
A. USMC END-OF-MONTH RECRUIT QUALITY STUDIES
In the recruiting world, recruiters are under extreme pressure to meet monthly
recruiting goals, particularly towards the end of a given month. If they have not obtained
a high quality recruit, during any given month, recruiters may enlist lower quality recruits
at the end of the month to meet the monthly goals established for their area of
responsibility. The theses completed by Baczkowski (2006) and Bruno (2005) analyze
and attempt to explain the effects of end of the month recruiting on the quality of new
recruits as measured by DEP attrition and attrition at the Marine Corps Recruiting Depot
(MCRD). Both studies control for observable factors that also affect attrition rates, such
as age, gender, race, AFQT scores, and education.
1. Baczkowski (2006)
In this Naval Postgraduate School thesis, Baczkowski seeks to determine if any
statistical evidence exists that Marine Corps recruits recruited at the end of any given
month have higher attrition rates compared to those recruited earlier in the month.
Baczkowski hypothesizes that attrition may be higher for those recruits enlisted at
the end of any given month, on average. Recruit DEP attrition and recruit training
attrition was analyzed to determine if a statistical relationship occurs between recruits
who sign contracts at the end of the month and their quality and attrition behavior.
Baczkowski analyzes recruit attrition and quality based on whether they sign contracts
during the last 10 days, the last week, and the last day of the month, respectively.
Baczkowski uses multivariate Logit regression models to regress attrition on
demographic variables, such as age groups (<19, <22, <28, <36), gender, race (White,
Black, Other, Declined), education level (Senior and HSDG), AFQT score (Mental
Group=Test Score Category (TSC)), Component (AC and RC), and dummy variables
representing the day of the month a recruit enlisted (last 10 days, last five days, and last
day, respectively). The estimated coefficients of the independent variables were analyzed
18
for partial effects and the odds ratios. Three separate models were estimated with the only
difference between the different models being that each contained only one indicator
variable for the time of the month that a recruit signed a contract.
Baczkowski found no statistical evidence to support any significant relationship
between MCRD basic training attrition and the day of the month a recruit enlists. For the
other explanatory variables, he found that female recruits had an attrition rate at MCRD
5.5 percentage points above that of male recruits. Black recruits were found to attrite at a
rate of .01 percentage points greater than whites and other races. Also, he found that
AFQT score is an accurate predictor of basic training success, where each one point
increase in AFQT score increased the likelihood of success by 3.5 percentage points.
2. Bruno (2005)
Another Marine Corps Naval Postgraduate School thesis, which was completed
by Bruno, analyzed Marine Corp Recruit DEP attrition rates. Bruno analyzed a multitude
of variables to determine their effect on DEP attrition rates of Marine recruits. Bruno
makes the connection of the end of the month deadline to meet the required monthly
goals with the term “hockey stick effect,” which was a phrase coined by Lee (1997). The
hockey stick effect occurs when a rush occurs to meet a “deadline-sensitive goal (Bruno,
2005).”
Bruno uses a probit model to analyze the effect of many factors on a Marine
Corps recruit’s probability of attrition while in the DEP. Bruno analyzes the day of the
month a recruit enlists for its effect on DEP attrition. The factors used to explain attrition
included HSDG status and High School Senior status. Next, Bruno’s attrition model did
not include variables for gender or race.
The explanatory variables included the time between when an individual took the
Armed Services Vocational Aptitude Battery (ASVAB) test and when he actually
enlisted (ASVABTIME), age, component (regular or reserve), AFQT score, and variables
representing the first three weeks, as well as the last week, of the month (WEEK_123,
WEEK_45) (Bruno, 2005). Bruno first tested each variable for its individual effect on
DEP attrition rates and then included many interaction effects in an effort to determine

19
which combination of variable (factors) contributed to attrition risk. Next, he created
groups of recruits with similar risk factors particularly for the timeframes during the first
three weeks of the month compared to the last week of the month. Bruno used data for
FY00/01 and FY03/04 data sets.
The grouping process enabled the author to conclude initially that each group did
not exhibit a higher DEP discharge (attrition) probability when recruited during the last
week of the month as compared to the first week of the month. Furthermore, Bruno
created three categories using the information he attained from the grouping process: (1)
enlistees who exhibited a low probability of discharge at all times, (2) enlistees who
exhibited a high probability of discharge regardless of when they were enlisted, and (3)
enlistees who exhibited a high probability of discharge only during the last week of the
month (Bruno, 2005).
Bruno’s analysis found that all the variables utilized in the regression models
were statistically significant using the FY00/01 data (Bruno, 2006). He found that the
average individual who enlisted during the first three weeks of the month exhibited a
17.3% probability of DEP attrition. A fourth week enlistee in that same model exhibited a
19.5% attrition probability, which is 2.2 percentage points higher than other enlistees.
Most importantly, the individual who enlists during the last week of the month has a
21.3% probability of attrition, which is a 4.0-percentage point difference compared to
those who enlisted during the first three weeks of the month. The results of the FY03/04
model analysis supported the findings of the FY00/01 model results. The results of the
FY03/04 model showed that individuals enlisting during weeks one through three have a
19.2% attrition probability whereas those enlisting during the last week of the month
have a 21.6% probability of discharge (2.4 percentage points higher). Most notable is that
a recruit who enlists on the last day of the month has a 22.6% probability of attrition,
which is 3.4 percentage points greater than a recruit who enlists during the first three
weeks of the month.
The results of Bruno’s analysis supported the theorized “end of the month rush”
also known as the “Hockey stick effect” when individuals enlisting during the last week
of the month have a greater likelihood of DEP attrition compared to those enlisting
20
during the first three weeks of the month. However, he noted that if enlistment criteria
could identify high-risk recruits, attrition rates could be reduced before contracts are
signed (Bruno, 2005).
B. USN ENLISTED RECRUITER GOAL SHARE AND GOAL-BASED RECRUITING STUDIES
Hojnowski’s (2005) Naval Postgraduate School thesis research explored the
enlisted goal-shares process distributed by CNRC to the Navy regional recruiting
commands. Hojnowski analyzed the factors included in the U.S. Navy’s (USN) goaling
model to determine their contribution towards the creation of goal-shares. Hojnowski
found that CNRC’s goaling forecasts were accurate in predicting actual numbers of new
contracts obtained during past time periods, but that improvement was possible by adding
new variables in the goaling model (Hojnowski, 2005).
In 1996, David Pry conducted thesis research to determine the validity of the
allegations that the U.S. military services were inefficient and ineffective in the use of
resources as stated in a prior Center for Navy Analysis (CNA) report. Pry’s research
sought to examine the goal-based recruiting process and its effect on the use of resources.
Another goal of Pry’s thesis was to attempt the explanation of the reduced (PPR and
reduced mission accomplishment of the NRDs during the early 1990’s.
CNRC requested that the CNA conduct a study on the effectiveness of recruiting
models currently utilized to determine U.S. Navy enlisted and officer recruiting goals,
and NRD goal shares. The goaling models do not consider the vast geographical coverage
of each NRD; therefore, room for improvement is possible to determine more precise
geographical allocation of recruiting resources, such as advertising and manpower
(Pinelis, Schmitz, Miller, Rebhan, & Schmitz, 2011).
1. Hojnowski (2005)
Hojnowski conducted interviews with key personnel in Navy recruiting who are
knowledgeable and integral in the goaling process. Region West personnel were
primarily called upon to discuss the goaling model and goal-share process. Most notable
about this process is that CNRC distributes the goals to each region, East and West, who
21
then distribute the goal share to each NRD under their cognizance. The Navy Recruiting
Districts Commanding Officers are under their own autonomy to ensure that the goals are
distributed equitably to the enlisted recruiters in their NRD. NCO and accession goals are
both assigned during this process.
Hojnowski also sought to evaluate the factors that affect the supply of enlisted
personnel to the Navy. The controllable factors, although not all inclusive, affecting the
Navy’s ability to meet its recruit mission are DEP size, advertising, the number of
available jobs for female recruits, desired quality mix, and bonuses. On the other hand,
the population of eligible recruits, college entrance rates, and the veteran population are
all uncontrollable factors that also affect the Navy’s ability to achieve its recruit goals
successfully. The focus on the right (desired) quality mix is prominent when HSDG and
AFQT scores equal to and greater than 50 (AFQT ≥50) are considered high quality
(Hojnowski, 2005).
The focus on enlisted recruiting, goal-share determination, and the factors
impacting the Navy’s ability to achieve its mission is analyzed for process accuracy and
validity. Due to the consistent annual replacement of approximately 10% of the Navy’s
personnel end strength, the dynamic quality versus quantity determination is of great
importance to the Navy.
The enlisted goaling and forecasting model in use only predicts the supply of net
new male contract objectives for those who have no prior military service, who have
attained a score of 50 or greater on the AFQT and achieved a high school diploma. The
aforementioned group falls into the A-cell recruit group who are highly desirable and
harder to attract than other eligible recruits. A-cell recruits statistically and historically
exhibit lower first-term attrition, higher program qualification rates, lower training costs,
and the best performance in their jobs. B-Cell recruits are the personnel who do not
possess a traditional high school diploma, but have scored at or greater than 50 on their
AFQT. These recruits have the aptitude required for service qualification; however, the
lack of a high school diploma has statistically and historically been linked to a lack of
commitment needed for service and the highest first-term attrition amongst all recruits.
22
The Cu-Cell recruits are those who are HSDCs yet only score between 35 and 49 on their
AFQT. These recruits have lower attrition rates than the B-Cell recruits, but slightly
higher attrition rates compared to A-cell recruits.
The goaling model is a tool used to determine recruiting district goals that
consider past recruiting performance and the many factors that affect the ability to
achieve the recruiting mission. For the goaling model, the dependent variable, as
previously mentioned, was net new contracts of high quality males. The independent
(explanatory) variables utilized were number of NRD production recruiters, eligible high
quality (A-cell) male youth population, advertising dollars, enlistment bonuses,
unemployment rates, military to civilian pay elasticity, eligible male HSDG TSC-IIIB
(Cu-cell) population, veteran population, DEP size, retention, DoD recruiters, historical
NCOs, and the quarterly seasonal (grouped months) effect. A fixed-effects autoregressive
estimator is utilized for estimating the model that takes into account constant unknown
differing variables across the recruiting districts, such as propensity to serve and
patriotism. The primary explanatory variables of focus were eligible male high quality
and low quality populations, number of recruiters, the unemployment rate, and relative
earnings (military/civilian wage ratio).
Hojnowski sought to determine if the econometric goaling model in use by the
Navy was valid or if room for improvement was possible. Also, this research evaluated
whether the goaling model was a good predictor of the supply of higher quality A-Cell
recruits. Last, but not least, his research compared the workforce recruit supply models
with that of the high school senior supply models (Hojnowski, 2005).
Hojnowski found that even though the PPR has decreased over the years, the
required number of contract and accession goals also has decreased (Hojnowski, 2005).
While coupling the above scenario with the decrease in the eligible youth population’s
propensity to serve, recruiters must work even harder to attract those desired eligible
personnel.
The ERIS, which is a point-based system, allowed recruiters to earn points based
upon production. Under the old ERIS program, recruiter accumulated these points over
23
an annual production cycle. Due to the 36-month tour length of recruiters who normally
check-in to their districts and station anytime during the year, the ability to compete for
three cycles of awards was not feasible. A recruiter may at best compete for two cycles.
Also noted was the ERIS programs’ possible built-in mechanism to reduce recruiters’
incentives to perform at a high level over the entire course of a production cycle. That
behavior was thought to be attributed to either “stockpiling” recruits for the next cycle or
working very little during the beginning or end of the production cycle to achieve the
required contract goal. The ERIS program creates a contract-focused recruiter instead of
one who focuses on both contracts and accessions, which contribute equally towards the
Navy’s overall mission. Nevertheless, ERIS and other award programs have been
creatively utilized in an effort to shape recruiter behavior during recruiting tours.
Hojnowski’s research found that demographic and economic factors and
recruiting resources drive the supply of new contracts for the Navy (Hojnowski, 2005).
The Navy recruiter’s estimate results from the regression of the goaling model concludes
that a Navy recruiter’s effect on the predictive accuracy for net new contracts from the
high quality male population is far more statistically significant as compared to other
DoD recruiters. Also, demographics play a large role in the recruit goaling model.
Relative military to civilian pay and unemployment rates also exhibited notably high
statistical significance in the model. The goaling model was found to be a relatively
accurate predictor of net new contracts of high quality contracts (Hojnowski, 2005).
Although the model was found to be accurate, areas of possible improvement
were emphasized. The advertising variable, although of minimal statistical significance,
would add increased value to the model if regional advertising expenditures could be
included. The relative military to civilian pay variable also left room for improvement
due to measurement error. The military pay, numerator, calculation is based on the
average pay of E-1’s and E-2’s during the first two years of military service. The flaw
introduced is the assumption that most recruits enter the service as E-1’s and E-2’s when
actually, a large number of recruits enter the service as E-2’s and E-3’s. The variable
calculation could be improved by utilizing E-1’s through E-3’s in the military pay
calculation. Also, civilian pay is based on an average pay for 18–25 year-old whereas the

24
targeted population for initial service entry is 17–21 year olds. The discrepancy in the
civilian wage for the targeted age group inflates the actual civilian pay alternative for the
targeted eligible recruits.
CNRC calculates the estimated number of high quality male recruits needed to
meet established requirements from the FY enlisted recruiting goals and policies, which
ultimately provide national accession requirements and quality mix for CNRC. Goal
share percentages are also generated for quite a few other categories of accessions and
NCO. Nevertheless, goal share percentages for Females, African-Americans, Hispanics,
Asian-Pacific Islanders (API), and prior service accessions also must be derived. This
process relies heavily on historical demographic regional production data including
projected recruiting resources. The assignment of targets for African-American,
Hispanics, and API is performed to ensure that diversity within the Navy is a reflection of
American population demographics (Hojnowski, 2005).
2. Pry (1996)
Pry’s research analyzes the effectiveness of U.S. Navy’s goal-based recruiting
system. The research includes an evaluation of the goal setting policy at that time
(1990s), and how the recruiter incentive system contributed towards goal
accomplishment. Furthermore, included in the research is a recommendation for
establishing a bonus incentive-based system that rewards recruiters equitably for
production in an effort to achieve higher recruiter productivity.
Pry discussed the structure of the NRC and NRDs that included goal planning and
the types of recruiters assigned to each entity. A description of the types of awards and
incentives authorized during the time of his study and prior years were discussed. The
Gold Wreath award, a production award that an individual recruiter earns after achieving
eight recruit contracts, was shown to be counterproductive in achieving the mission of the
Navy in some cases. Pry hypothesized that as a result of no emphasis being placed on
production in a single month for the Gold Wreath award eligibility criteria, a recruiter
may be less inclined to work hard every month within that three-month time-period (Pry,
1996). This behavior has negative impacts on goal accomplishment. That impact is

25
especially felt when the last month of that award eligibility window falls in September,
which is the last month of the FY when end strength requirements need to be met.
Pry stated that recruiters, by nature, sometimes exhibit risk-adverse behavior
when the possibility of consistently overproducing may result in the assignment of
increased future production goals (Pry, 1996). Pry utilizes a combination of interviews
and discussions with key personnel including recruiters and staff assigned to CNRC to
attain a better understanding of the goaling process. Pry seeks to analyze the hypothesis
that overproduction does increase a district’s future production goal assignment. Three
tests of the hypothesis were conducted using regression analysis on each NRD’s “goal-
per-recruiter” as the dependent variable for a specific year utilizing the NRD’s prior year
goal accomplishment success rate as one of the explanatory variables. A similar
regression was run with the exception that the prior two years goal accomplishment rate
was utilized instead of only the prior year’s rate. To acquire a better understanding of the
process, Pry then determined CNRC average yearly mission per recruiter to calculate the
variance in the total CNRC mission across FY90–95.
The first and second regression analyses of the hypothesis tests utilizing each
districts “mission-per-recruiter” for a given year as the dependent variable utilizing the
NRD’s prior year success rates and two prior years’ success rates, respectively, did not
determine any statistically significant results to support the hypothesized relationship that
increased recruiter productivity caused a future increase in assigned recruiter goals. The
third regression’s dependent variable was extrapolated by subtracting the average
CNRC’s mission (goal)-per-recruiter per year from the NRD’s mission (goal)-per-
recruiter per year. The explanatory variables, as previously stated, were the NRD’s prior
years’ mission success rate. The hypothesis that overachievement by a district in a given
year causes an increase in the assigned district’s mission for the following year was
supported by the third regression analysis results for each district (Pry, 1996).
During his research, Pry found that the goal-based system does promote skill
variety, job identity, job significance, and feedback; however, it does not provide
autonomy to the recruiter. As a result, recruiters are not given ownership of the process
(Pry, 1996). As quoted by Pry in his research, Hackman and Oldman described job

26
identity as “when workers perceive the job as a whole and recognize all the steps in the
process to produce an end product” (Pry, 1996). Hackman and Oldman also defined job
significance as “when workers feel they are part of the process and their job has an
impact on the end product” (Pry, 1996). Feedback was referred to as the closed-loop
process when an employee’s performance is critiqued and the results of that feedback are
tactfully and clearly provided to the employee (Pry, 1996). Pry did not have a formal
method for measuring whether Navy recruiters have job identity and job significance.
Nor did he have a formal method of measuring whether the recruiters (at the time of his
study) received feedback. Nevertheless, Pry made assumptions that job identity and job
significance did not exist for recruiters because “recruiters are not consulted with or
encouraged to improve the goaling process” (Pry, 1996). Also, he noted that due to goals
being dictated from higher levels of management, recruiters were only to achieve
required production goals. Production recruiters do not provide input into the goaling
process, and therefore, only perform to the set goaling mission. This process, Pry noted,
does not leave room for recruiter expansion (growth) and surely does not promote
increased mission accomplishment by the average recruiter (Pry, 1996).
As shown in the historical data, NRD mission assignment increased from one year
to the next for 77.4% of all NRDs that overproduced in previous years. The evaluation of
the goaling system during the time of the study determined that the method of mission
assignment was ineffective as stated by Pry (Pry, 1996). Sixteen percent of the districts
displayed statistically significant results with a 95% confidence interval based on a
sample of five observations per NRD in FY90–95. None of the NRDs in the sample
experienced a reduction in mission assignment following overproduction in the prior
year. Pry’s explanation of this effect of NRD overproduction is due to the pressures in the
recruiting world to produce at every level of mission assignment that then leads to
increased mission assignment. As a result, the NRDs that are historically overachievers
are expected to produce at higher level in future years (Pry, 1996).
The PRIME bonus incentive-based system was developed by the Naval
Postgraduate School to provide an equitable recruiter reward program and better
distribute recruiting resources (Pry, 1996). This system promotes recruiters’ ability to

27
provide input into the recruiting process by accurately forecasting their goals, which
therefore contribute to improved future mission assignment. Also, PRIME disincentivizes
recruiters to hold applicants for the following months and increases the recruiters’ market
potential success rate (Pry, 1996). Recruiters are increasingly rewarded with higher
productivity based on this system. Due to the dynamic nature of mission requirements,
CNRC is able to adjust the PRIME model to change recruiter behavior or productivity
focus with respect to a given type of applicant to meet the ever-changing needs of the
Navy (Pry, 1996).
3. CNA
The last review of the enlisted goaling model was conducted in the late 1990s and
did not incorporate all of the components affecting the recruiting market. CNA evaluated
the enlisted and officer AC and RC goaling models and CNRC’s incentive systems
created to promote recruiting goal (mission) accomplishment. Also, this research assesses
the perception of some recruiters that too much emphasis is placed on past production
when other recruiting market components have a much greater effect on future
production.
CNA stated that the goaling process should result in an equitable distribution of
recruiting goals; thereby giving each recruiter an opportunity to succeed (Pinelis et al.,
2011). However, due to an incomplete use of available market data and possible resource
allocation inefficiencies, the goaling models exhibit limitations that affect recruiter
productivity (Pinelis et al., 2011). The U.S. military utilizes a goal-share process to
distribute enlisted recruiter goals to the recruiters. Due to the inherent design of that
process, CNA hypothesized that the U.S. Navy experienced decreases in recruiter
productivity and mission accomplishment in the early 1990s (Pinelis et al., 2011).
CNA sought to answer three questions.
• What is the most effective goaling level or unit of analysis?
• What market, demographic, and resource factors should be included in each model?
• What method should be used to allocate recruiting goals?

28
The goaling models incorporate factors, such as historical production, recruiting
resources, economic and population factors, seasonality, and pay, among other factors
(CNA 2011). The goaling forecasting model also considers factors, such as population
demographics, state unemployment rates, and available recruiting resources to produce
goal shares disseminated to each region and allocated to each NRD based on historical
recruiting success and recruiting resources. This research highlights the primary recruit
market as high school seniors and HSDGs between the ages of 17 to 22. This group is
theoretically in their optimal training age range. Men in the 22 to 29 age group,
regardless of having a high school diploma, are considered secondary market material.
The approach that CNA took began with Recruiter of the Year (ROY) interviews
to determine what is missing from the current goaling process (Pinelis et al., 2011). The
participants of the 2011 Officer Goaling Conference were also included in discussions.
The review of Navy practices and modeling methods were conducted and compared to
other services with respect to recruiting mission allocation. The data from other services
were collected from the staff of the U.S. Army Recruiting Command (USAREC), Marine
Corps Recruiting Command (MCRC), and the Air Force Recruiting Service (AFRS).
After analyzing various databases in search of available factors that could enhance the
current enlisted goaling models, CNA constructed an enlisted AC model. The databases
utilized included the Enlisted Master File (EMF), Officer Master File (OMF), PRIDE,
Reserve Component Common Personnel Data System (RCCPDS) and various market
data resources (i.e., U.S. Census and National Center for Education Statistics (NCES)).
Also, a recommendation was made for required data to enable the creation of similar
goaling models for enlisted and officer RC and officer AC to improve the current goaling
process (Pinelis et al., 2011).
CNA used a Zero-inflated Poisson model, which is a count model using Poisson
distribution, to determine zip-code level goaling distribution for 2006 through 2010
recruiting years. Two stages were used during modeling due to the expected large number
zero contracts for many of the zip codes (Pinelis et al., 2011). The first stage’s (any-
contracts model) purpose is to determine if the zip code will produce any contracts. The
objective of the second stage (Counts model) is to determine how many contracts a zip

29
code will produce if determined to produce any contracts. The independent variables
utilized in these models differed from those currently utilized in the Enlisted Goaling
Model (Pinelis et al., 2011). Some of the variables included in the any-contracts model
were distance to nearest college or university and their size, an interaction of the prior
distance and size, and the existence of multiple colleges, as well as historically black
colleges. The Counts model included variables, such as distance to the responsible NRS,
demographic data, Navy Awareness Index, number of recruiters per zip code, crime data,
and veteran population per county and age group.
The any-contracts model’s results were consistent with the authors’ hypothesis
that the closer the distance to a college or university, the greater the number of colleges
or universities in the area, and the larger the size of the schools were predictive of a lower
probability of producing any contracts in a zip code. Demographics exhibited significant
positive correlation with enlistment, specifically for 17–19 year-old Hispanics in their
first three years of high school. Also, Navy advertising input was found to have the
largest positive correlation to enlistment (Pinelis et al., 2011).
The predictive accuracy of the counts model was accomplished by calculating the
average difference between the actual numbers of recruit contracts for each zip code (in
2010) with the model’s prediction for that year by zip code. The absolute value of the
average difference between predicted and actual contracts enabled the computation of the
mean absolute deviation (MAD) that is 0.943. The model is only off by one recruit as
represented by a MAD of one (0.943 rounded up to one) (Pinelis et al., 2011).
CNA concluded that the current goaling model’s unit of analysis is the NRD that
does not allow precise distribution of recruiting goals to maximize true market potential
and needs. The enlisted AC model created and recommended by CNA forecasts the
number of recruits goaled for each zip code that addresses the current goaling model’s
lack of geographical specificity. The use of zip codes allows the model to incorporate
demographic (gender and race/ethnicity) and geographic recruiting focuses and resource
allocation (Pinelis et al., 2011).
30
C. SUMMARY
Goal shares are generated utilizing a forecasting and econometric goaling model
that considers historical factors (population demographics, local economic conditions,
and recruiting resources) used as predictors of future recruiting success. Navy recruiters
are assigned their contract goals based upon results of the Navy’s goaling forecasting
model executed on an annual basis. Also, the U.S. Navy awards and incentives system
provides the needed method geared towards increasing recruiter productivity in support
of CNRC’s overall goaling mission, specifically for net new contract attainments for the
high quality male population. These studies exhibit the crucial link between enlisted
recruiter goaling and the quality of recruits actually obtained by these recruiters during
past time periods.
This thesis provides statistical recruit data and statistical analysis results that
increases insight as to when Navy recruiters are not performing as expected when it
comes to recruit quality, specifically for different times of the month. The results of this
thesis can be used as a tool to assist CNRC in shaping recruiter behavior by providing
feedback to recruiters and leadership alike. The results could also provide guidance for
the adjustment to CNRC’s awards and incentives system.
31
IV. DATA AND METHODOLOGY
A. DATA COLLECTION
The data utilized in this study were collected from CNRC’s PRIDE database,
which is updated on a real-time basis at CNRC. The period chosen for statistical analysis
is the April 1997 through March 2011 timeframe, which captures recruit contract activity
for all enlisted Navy recruiters. The original data files contained 768,508 observations of
new recruits who signed contracts. Over the last few decades, CNRC has undergone
restructuring from 31 to 26 NRDs. At the same time, some of the recruiting stations
under each NRD’s cognizance have shifted and been renumbered. The NRD numbers
utilized for this study consider the previously mentioned territorial shifts due to the
restructuring of CNRC. Data on state unemployment rates were taken from the U.S.
Bureau of Labor Statistics government website for all U.S. states and territories
(http://www.bls.gov/lau/#tables.htm).
B. SUMMARY OF SAMPLE AND VARIABLES
Recruits whose age at enlistment was less than 17 and greater than 35 were
dropped so that the remaining observations reflected the average age for the majority of
enlistees. The final data set used for the analysis contained 759, 087 observations.
1. Dependent Variables
Three types of binary dependent variables were created to represent low quality
recruit contracts. Each of these alternative measures of low quality contracts were used in
separate regression models. The three dependent variables captured low quality contracts
based on three different definitions of quality: 1) contracts with a low AFQT score (less
than 50%) or no traditional high school diploma, 2) contracts with only a low AFQT
score, and 3) contracts without a traditional high school diploma.
2. Independent (Explanatory) Variables
The explanatory variables utilized in the multivariate regression models
represented demographic factors, such as gender, race, marital status, and the age of

32
recruits at the time of enlistment. Enlistees were grouped into the following six race
categories: Black, White, Asian, Native American, Hispanic, and Other. Dummy
variables were created for states (excluding Wyoming), months (excluding January), and
FY98–11. These dummy variables were included in the regressions to control for state,
month, and year fixed effects. The average state-level unemployment rate for the 12
months leading up to the recruit’s enlistment date also was included in the multivariate
regression models. The primary explanatory variables measured the time of month that
the contract was written. The variables created indicated whether the contract was written
near the end of the month and included binary variables representing contracts written in
the last seven days, the last five days, the last three days, and the last day of the month.
These time-indicator variables were included separately in each of the four low quality
models to determine the effect of signing contracts near the end of the month on the
quality of the contract. Variables were also created to indicate if the recruit contract was
written within the recruiter’s first Gold Wreath award eligibility period. Furthermore,
another variable was created to indicate if the time of the contract fell within the last
month of the recruiter’s first Gold Wreath award eligibility period. Table 4.1 provides the
definitions of the explanatory variables included in the low quality regression models.

33
Table 4.1. Variable Descriptions
Variable Description Age Continuous variable, 17–35 years Female =1 if female; =0 otherwise Married =1 if married; =0 otherwise White =1 if White; =0 otherwise Black =1 if Black; =0 otherwise Asian =1 if Asian; =0 otherwise Native American =1if Native American; =0 otherwise Hispanic =1 if Hispanic; =0 otherwise Other Race =1 if not included in above ethnicities; =0 otherwise _Istate_1- _Istate_56 =1 if enlistment state; =0 otherwise Month 1–12 =1 if enlistment month (Jan.–Dec.); =0 otherwise FY97–FY11 =1 if Fiscal Year 1997–2011, respectively; =0 otherwise Unemployment rate 12 Continuous variable; average state unemployment rate 12 months prior to recruit contract date Low AFQT score or no =1 if AFQT score<50 or NHSDG; =0 otherwise High School Diploma Low AFQT score =1 if AFQT score<50; =0 otherwise No High School =1 if NHSDG; =0 otherwise Diploma Last 7 =1 if contract written in the last 7 days of month; =0 otherwise Last 5 =1 if contract written in the last 5 days of month; =0 otherwise Last 3 =1 if contract written in the last 3 days of month; =0 otherwise Last day =1 if contract written the last day of month; =0 otherwise gold =1 if within 1st Gold Wreath eligibility time-period; =0 otherwise gold3 =1 if last month of 1st Gold Wreath eligibility time-period; =0 otherwise
All variables created by Author utilizing PRIDE database *Note 1: NHSDG= Non-traditional High School Diploma Graduate

34
C. DESCRIPTIVE STATISTICS
Table 4.2 provides summary statistics for the analysis variables.
Table 4.2. Variables Summary Statistics
Variable Mean SD Age 20 3.082 Female 0.203 0.403 Male 0.796 0.403 Married 0.023 0.150 White 0.410 0.492 Black 0.094 0.292 Asian 0.021 0.142 Native American 0.028 0.164 Hispanic 0.195 0.396 Other Race 0.448 0.497 Average Unemployment Rate 12 months prior to contract date 5.469 1.783 Low AFQT score or no High School Diploma 0.320 0.466 Low AFQT score 0.299 0.458 No High School Diploma 0.021 0.144 Last 7 days 0.310 0.462 Last 5 days 0.271 0.444 Last 3 days 0.182 0.386 Last day 0.097 0.296 Contract falling within 1st Gold Wreath eligibility period 0.083 0.277 Contract falling within last month of 1st Gold Wreath eligibility period 0.035 0.183
Created by Author
1. Low Quality Recruit Indicators
Recruits who had a low AFQT score or no traditional high school diploma
represented 32% of the sample while recruits with low AFQT scores only and recruits
with no high school diploma represented approximately 30% and 2.1% of the sample,
respectively. The mean value for the low quality recruit who either has a low AFQT test

35
score only or no traditional high school diploma inclusively represents the mean values of
the remaining two low quality types in this sample. Based on prior studies, recruits who
score 50 or greater on the AFQT but do not possess a traditional high school diploma
have an increased risk of attrition during their first term of service (Bruno, 2005). While
recruit quality is a predictor of attrition rates, it seems likely that a recruit who is lower
quality would cause a recruiter to think twice before rushing to sign a contract,
particularly just to earn an award.
2. Age
The average age of recruits in the sample was 20 years old. Of those recruits, 68%
were between the ages of 17 to 19 and 32% were between the ages of 20 and 35. Due to
most recruits enlisting after high school graduation, the sample age group percentages
reflects historical demographic data.
3. Gender
Males comprised 79.6% of the sample while females represented 20.4% of the
sample. Males have been historically represented more than females in the U.S. Navy,
which accounts for the comparatively high number of male recruits.
4. Marital Status
Non-married recruits composed 97.8% of the sample while married recruits
accounted for only 2.2% of the sample. However, seemingly a good predictor of recruit
quality, marital status continues to affect recruit quality.
5. Race
Whites accounted for approximately 40% of the sample whereas Blacks, Asians,
Native Americans, Hispanics, and Others accounted for 9.4%, 2.1%, 2.7%, 20%, and
45%, respectively. The total race percentage exceeds 100% due to some recruits
associating themselves with more than one race.

36
6. State Unemployment Rate
A state’s unemployment rate has been hypothesized to be a factor in an
individual’s decision to enlist in the U.S. Navy and other military services. The state’s
unemployment rate average for the 12 months leading up to the recruit’s contract date is
5.5% for this sample.
7. End-of-Month Day Indicators
Contracts falling within the last seven days of a given month comprised 31% of
the sample recruit contracts signed within the last five days, last three days, and the last
day of the month composed approximately 27%, 18.2%, and 9.7%, respectively, of the
sample. The decreasing number of recruit contracts signed as the last day of the month
approaches reflects the push by recruiters to meet contract goals before the last day of
any given month.
8. Recruit Contract Date Within 1st Gold Wreath Award Eligibility Period
Contracts that fell within the recruiter’s first Gold Wreath award eligibility period
comprised 8.3% of the sample. Of those contracts that fell within the Gold Wreath award
period, and that also fell within the last month of the recruiter’s first Gold Wreath award
eligibility period, comprised 3.5% of the overall sample.
D. METHODOLOGY
Ordinary Least Squares (OLS) regression models were specified to estimate the
effect of end-of-the month indicators on recruit quality, controlling for FY, state, and
month fixed effects. Regression models were created for each end-of-month indicator—
the last seven days, last five days, last three days, and last day, respectively. Separate
OLS regression models were estimated to determine the effect on recruit quality by using
indicator variables representing if a recruit contract date fell within the individual
recruiters first Gold Wreath award eligibility period and, if so, if the contract date fell
within the last month of the recruiter’s 1st Gold Wreath award eligibility period. The
Gold Wreath award eligibility period is utilized in the regression models due to the

37
consistent authorization of the Gold Wreath award in the CNRC awards system over the
previous decades.
State and fiscal year dummy variables, average state-level unemployment rates
for the 12 months leading up to the enlistment, and demographic factors including age,
race (Black, Native American, Asian, Hispanic and Other Race), and female are used in
each OLS regression model.
The regression results provide estimates of the marginal effect on recruit quality
for each of the variables utilized in the regression. The estimated coefficients, if
statistically significant, represent the effect of a one-unit change in the explanatory
variable on the percentage point change in the probability that the contract will be low
quality.
Fixed effects regression models that control for recruiters’ ability over time would
have been the preferred statistical analysis method. However, due to maximum capacity
limitations of the statistical analysis database and rather large number of recruiters (over
20,000), recruiter fixed effects were not estimated.

38
THIS PAGE INTENTIONALLY LEFT BLANK

39
V. MODEL ESTIMATION
A. MODELS
In an effort to determine if recruits who enlisted at the end of the month were
lower quality than recruits who enlisted earlier in the month, the low quality binary
variables representing low quality enlistees (those recruits who have either a low AFQT
score (less than 50) or no traditional high school diploma, those who have a low AFQT
score, and those recruits not having a traditional high school diploma, respectively) were
each regressed on various factors statistically found in prior studies to predict recruit
quality. Descriptions of Low Quality multivariate models are listed in Table 5.1. Eighteen
versions of the multivariate OLS regression models based on each of the three outcomes
are specified to estimate the effect of the explanatory variables on each of the recruit
quality types. OLS models 1–4 estimate the probability of a contract being low quality
based on the recruit having either a low AFQT score or no high school diploma. OLS
models 1–4 have the same specification with the exception that the end-of-the-month day
indicators change from the last five days, the last three days, and the last day of the
month. OLS models 5–8 estimate the probability of a contract being low quality based on
having a low AFQT score only. OLS models 5–8 have the same specification for each of
the separate end-of-the-month indicators.
OLS models 9–12 estimate the probability of a contract being low quality based
on the recruit having no high school diploma. OLS models 9–12 have the same
specification with the exception of the use of the different end-of-the- month indicators.
OLS models 13–14 also estimate the probability of a contract being low quality based on
the recruit having either a low AFQT score or no high school diploma. These models
have the same specification as models 1–4 with the exception of an indicator variable
representing whether the recruit’s enlistment date falls within the recruiter’s first Gold
Wreath award eligibility period and, if so, an indicator representing if a recruit contract
date fell within the last month of the 1st Gold Wreath eligibility period, respectively. No
end-of-the-month day indicators are used in these models. OLS models 15–16 estimate
the probability of a contract being low quality based solely on a low AFQT score. These
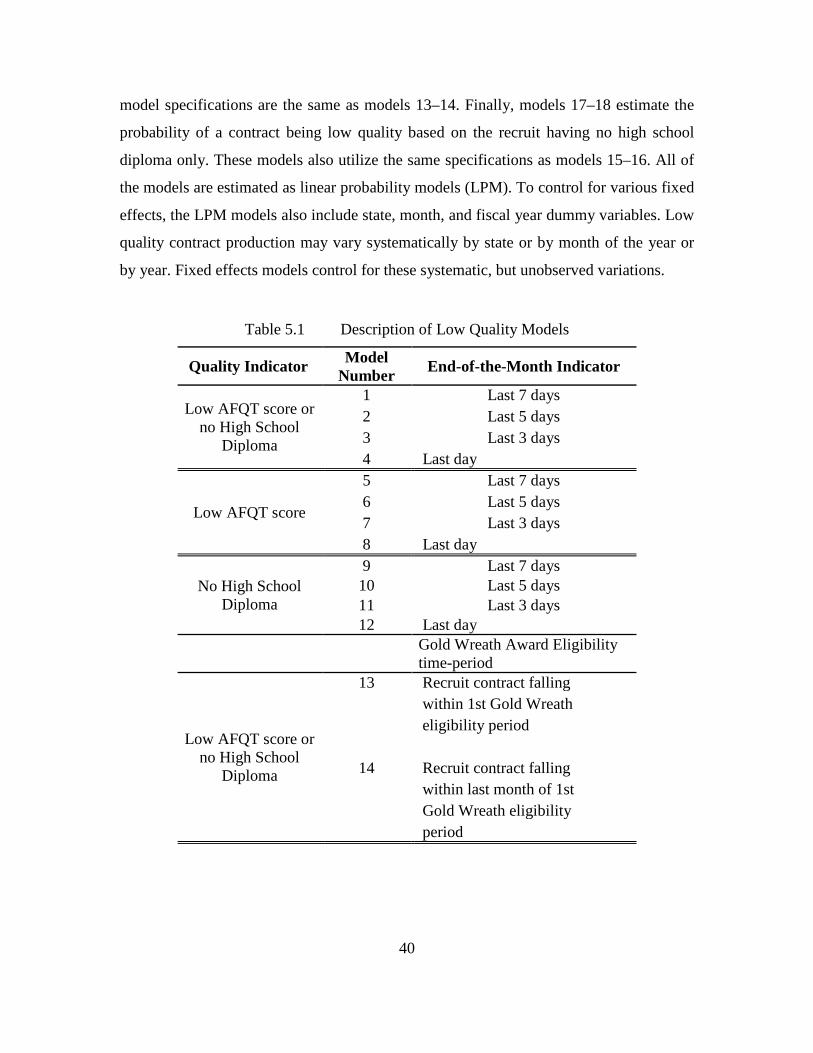
40
model specifications are the same as models 13–14. Finally, models 17–18 estimate the
probability of a contract being low quality based on the recruit having no high school
diploma only. These models also utilize the same specifications as models 15–16. All of
the models are estimated as linear probability models (LPM). To control for various fixed
effects, the LPM models also include state, month, and fiscal year dummy variables. Low
quality contract production may vary systematically by state or by month of the year or
by year. Fixed effects models control for these systematic, but unobserved variations.
Table 5.1 Description of Low Quality Models
Quality Indicator Model Number End-of-the-Month Indicator
Low AFQT score or no High School
Diploma
1 Last 7 days 2 Last 5 days 3 Last 3 days 4 Last day
Low AFQT score
5 Last 7 days 6 Last 5 days 7 Last 3 days 8 Last day
No High School Diploma
9 Last 7 days 10 Last 5 days 11 Last 3 days 12 Last day
Gold Wreath Award Eligibility time-period
Low AFQT score or no High School
Diploma
13 Recruit contract falling within 1st Gold Wreath eligibility period
14 Recruit contract falling within last month of 1st Gold Wreath eligibility period

41
Quality Indicator Model Number End-of-the-Month Indicator
Low AFQT score
15 Recruit contract falling within 1st Gold Wreath eligibility period
16 Recruit contract falling within last month of 1st Gold Wreath eligibility period
No High School Diploma
17 Recruit contract falling within 1st Gold Wreath eligibility period
18 Recruit contract falling within last month of 1st Gold Wreath eligibility period
B. MODEL SPECIFICATION
The OLS Model is the following:
Yistm = Xistmβ + URstmγ + ∑ δsSs + ∑ αtΤt + ∑ λmMm + ɛistm s t m where: –Yistm is one of the three low quality indicator types for recruit i from state s with enlistment year t and enlistment month m –Xistm represents the set of demographic factors, end-of-the-month indicators, and indicator variables representing whether the contract date fell within the recruiter’s 1st Gold Wreath award eligibility period and, if so, an indicator variable representing if a contract date fell within the last month of that three-month time-period (see Chapter IV). –URstm represents average unemployment rate 12 months prior to the enlistment date –Ss represents indicator variables for state –Τt represents indicator variables for year –Mm represents indicator variables for month – ɛistm is the error term

42
As in fixed effects models, controlling for state, year and month enabled the
estimates to represent the effects of within-state changes in end-of-the-month indicators
on the within-state changes on the quality of the recruits enlisting (Arkes & Mehay,
2013). The same outcome holds true for the effects of recruit contracts being written
during a recruiter’s 1st Gold Wreath award eligibility period and also contracts falling
within the last month of that 1st Gold Wreath award eligibility period (Arkes & Mehay,
2013).
C. HYPOTHESIS, REFERENCE GROUP, AND EXPLANATORY VARIABLES RELATIONSHIP/INTERPRETATION
1. Hypothesis
The hypothesis of this study is the following.
• H0: Recruits enlisting towards the end of the month are of the same quality as those enlisting at the beginning of the month.
• H1: Recruiters sacrifice recruit quality at the end of the month to earn the awards, which result in a statistically different effect on recruit quality. Also, if so, recruit quality is even less during the last month of the 1st Gold Wreath award eligibility time period.
2. Hypothesized Relationship of Effect of Explanatory Variables
a. Age
The average age of a recruit in this sample is 20 years old. Based on the
prior literature, the hypothesized relationship between age and recruit quality is that
recruits who are older at the time of enlistment will tend to have a higher likelihood of
being higher quality.
b. Gender
Males have historically scored higher on the AFQT tests, so it is expected
that they would comprise the least amount of low quality recruits compared to female
recruits. Females; however, historically have a higher graduation rate compared to males.

43
c. Marital Status
A recruit who is married may be more motivated to score well on the
AFQT test, which consequently places them in the high quality category, assuming they
have attained a traditional high school diploma. Thus, recruits who are married are
expected to have higher probabilities of being high quality recruits.
d. Race
White recruits have historically scored higher on the AFQT test, with
Asians following close behind. Black and Hispanic individuals lag behind on AFQT test
scores even though their scores on average have increased through the years. Black and
Hispanic recruits are expected to have a higher probability of being low quality recruits.
e. Year
The author hypothesizes that socio-economic and political issues and
events over time affect the quality and quantity of the military-eligible youth population.
Fluctuations in the youth population are reflected in the quality of new recruit contracts.
f. Unemployment Rate
The average of the unemployment rate for the 12 months leading up to an
individual’s enlistment are hypothesized to have inversely proportional effects on the
number of individuals enlisting, which leads to an increased or decreased taste towards
military service. This trend accounts for the overall increase or decrease in recruit quality.
Also, during times of low state-level unemployment rates, the recruiting force faces
increased challenges to attract the high quality recruits from the military-eligible youth
population.
g. End-of-Month Day Indicator
As hypothesized in section C 1. b., recruiters may rush to make goal at the
end of the month and may sacrifice recruit quality to meet their goal.

44
h. Recruit Contract Date in 1st Gold Wreath Award Eligibility Time Period
As previously mentioned, the sacrifice of recruit quality by recruiters may
be more apparent during the 1st Gold Wreath award eligibility time period and even
greater during that last month of that time period. Recruiters’ eligibility for the 1st Gold
Wreath award begins after an individual recruiter has been attached to a NRS for at least
90 days. Recruiters are trying to make a name for themselves at the NRDs by earning
awards, and therefore, may be more willing to take lesser quality recruits to make
monthly contract goals.
3. Results
Table 5.2 below displays the regression results for each low quality type outcome
using the last seven days end-of-month indicator variable. State dummy variables were
also included in the regressions but are not displayed in Table 5.2.

45
Table 5.2 OLS Regression Models of Probability of Recruit Being Low Quality
(Last 7) (Last 7) (Last 7)
Low AFQT score or no High School
Diploma Low AFQT
score No High School
Diploma
VARIABLES coefficient estimates
standard error
coefficient estimates
standard error
coefficient estimates
standard error
Last 7 days 0.044*** (0.001) 0.035*** (0.001) 0.009*** (0.000) Age -0.010*** (0.000) -0.010*** (0.000) 0.000** (0.000) Female -0.009*** (0.001) 0.006*** (0.001) -0.016*** (0.000) Married 0.015*** (0.004) 0.010*** (0.004) 0.004*** (0.001) Asian 0.048*** (0.004) 0.062*** (0.004) -0.014*** (0.001) Native American -0.071*** (0.003) -0.081*** (0.003) 0.010*** (0.001) Black 0.238*** (0.002) 0.255*** (0.002) -0.016*** (0.001) Hispanic 0.053*** (0.001) 0.053*** (0.001) 0.000 (0.000) Other Race -0.147*** (0.002) -0.148*** (0.002) 0.001** (0.001) February 0.008*** (0.003) 0.007*** (0.002) -0.002** (0.001) March -0.004 (0.002) -0.002 (0.002) -0.005*** (0.001) April -0.015*** (0.003) -0.011*** (0.002) -0.007*** (0.001) May -0.005** (0.003) -0.001 (0.003) -0.007*** (0.001) June -0.010*** (0.002) -0.002 (0.002) -0.011*** (0.001) July 0.001 (0.002) 0.009*** (0.002) -0.011*** (0.001) August 0.001 (0.002) 0.007*** (0.002) -0.009*** (0.001) September 0.006** (0.003) 0.007*** (0.002) -0.004*** (0.001) October -0.002 (0.003) 0.001 (0.002) -0.006*** (0.001) November -0.008*** (0.003) -0.008*** (0.003) -0.003*** (0.001) December 0.004 (0.003) 0.000 (0.003) 0.004*** (0.001) Fiscal Year 1998 0.052*** (0.004) 0.052*** (0.004) 0.007*** (0.001) Fiscal Year 1999 0.064*** (0.004) 0.040*** (0.004) 0.024*** (0.001) Fiscal Year 2000 0.065*** (0.004) 0.041*** (0.004) 0.023*** (0.001) Fiscal Year 2001 0.064*** (0.004) 0.042*** (0.004) 0.022*** (0.001) Fiscal Year 2002 0.059*** (0.004) 0.052*** (0.004) 0.006*** (0.001) Fiscal Year 2003 0.137*** (0.004) 0.130*** (0.004) 0.006*** (0.001) Fiscal Year 2004 0.163*** (0.004) 0.170*** (0.004) -0.008*** (0.001) Fiscal Year 2005 0.134*** (0.004) 0.140*** (0.004) -0.006*** (0.001) Fiscal Year 2006 0.123*** (0.004) 0.133*** (0.004) -0.011*** (0.001) Fiscal Year 2007 0.134*** (0.004) 0.135*** (0.004) -0.001 (0.001) Fiscal Year 2008 0.123*** (0.004) 0.135*** (0.004) -0.012*** (0.001) Fiscal Year 2009 0.092*** (0.004) 0.104*** (0.004) -0.013*** (0.001) Fiscal Year 2010 0.034*** (0.005) 0.042*** (0.005) -0.009*** (0.002) Fiscal Year 2011 0.021*** (0.006) 0.032*** (0.006) -0.013*** (0.002) Average Unemployment rate for 12 months prior -0.012*** (0.001) -0.010*** (0.001) -0.002*** (0.000) Constant 0.497*** (0.012) 0.471*** (0.012) 0.026*** (0.004) Observations 741,677 741,677 741,677 R-squared 0.074 0.072 0.015 Standard errors in parentheses *Note State fixed effects were also included *** p<0.01, ** p<0.05, * p<0.1

46
The results in columns 1–2 show that recruits whose contract date occurred during
the last seven days of any given month (as compared to recruits who sign during the first
23 days of the month) had a 4.4-percentage-points higher probability of being low quality
(based on having either a low AFQT score or no high school diploma). This result was
strongly statistically significant at the 1% significance level.
The results in columns 3–4 indicate that a recruit whose contract date occurred
during the last seven days of any given month had a 3.5-percentage-point higher
probability of being low quality based on having a low AFQT score only. This result was
also strongly statistically significant at the 1% significance level.
The results in columns 5–6 indicate that recruits whose contract was written
during the last seven days of the month had a 0.9-percentage-points higher probability of
being low quality based on not having a high school diploma. These recruits were less
likely to be low quality during the last seven days of the month as compared to the
recruits who were of low quality based on having a low AFQT score that enlisted during
the same time-period. That estimate is also strongly statistically significant at the 1%
significance level.
Table 5.2 also shows that a recruit who is between the ages of 17 and 21 has a 1-
percentage-point lower probability of being low quality (based on having either a low
AFQT score or no high school diploma). The same results hold true for recruits of the
17–21 age groups to be low quality based on having only a low AFQT score. The results
for the first two quality measures are strongly statistically significant at the 1%
significance level. The result of the third quality measure is moderately statistically
significant at the 5% significance level.
Females recruited during the last seven days of the month exhibit a 0.09-
percentage-point lower probability of being low quality (based on having a low AFQT
score or no high school diploma) as compared to males. The results were strongly
significant at the 1% significance level. Female recruits exhibited a 0.06-percentage point
lower probability of being low quality (based on a low AFQT score only) compared to
47
males. Most notable was the 1.6-percentage point lower probability for a female to be
low quality (based on not having a high school diploma).
Married recruits who enlisted during the last seven days of the month have a 1.5
and 1 percentage-point higher probability of being low quality (based on having either a
low AFQT score or no high school diploma and also (based on for having only a low
AFQT score). Also, these married recruits face a 0.04-percentage-point higher probability
of being low quality (based on not having a high school diploma). These results were
strongly statistically significant at the 1% significance level.
Asian recruits exhibited a 4.8 and 6.2-percentage-point lower probability of being
low quality based on the first two measures of low quality. However, based on the third
measure of low quality, Asians whose contract date fell within the last seven days of the
month experience a 1.4-percentage-point lower probability of being low quality. These
results were strongly statistically significant at the 1% significance level.
Native Americans recruits exhibit a 7.1 and 8.1-percentage-point lower
probability of being low quality when enlisting during the last seven days of the month
based on the first two measures of low quality. However, based on the third indicator of
low quality, Native American recruits enlisting during the last seven days of the month
have a 1-percentage-point higher probability of being low quality. These results were
strongly significant at the 1% significance level.
Black recruits exhibited a 23.8 and 25.5-percentage-point higher probability of
being low quality if recruited during the last seven days of the month based on the first
two measures of low quality. However, Black recruits whose contract date fell within the
last seven days of the month had only a 1.6-percentage-point lower probability of being
low quality (due to not having a high school diploma) as compared to white male recruits.
These results were also strongly statistically significant at the 1% significance level.
Hispanic recruits exhibited a 5.3-percentage-point higher probability of being low
quality if recruited during the last seven days of the month using the first two measures of
low quality. However, based on the third indicator of low quality, Hispanic recruits
whose contract dates fell within the last seven days of the month did not have a higher
48
probability of being low quality. These results were strongly statistically significant at the
1% significance level.
Recruits of other races exhibited a 1.5-percentage-point lower probability of being
low quality based on the first two measures of low quality. However, recruits of other
races had only a 0.01-percentage-point higher probability of being low quality based on
not having a high school diploma. The results for the first two measures were strongly
statistically significant at the 1% significance level. However, the result for the third
quality measure was significant only at the 5% significance level.
The results for the month indicators showed that recruits who enlisted during the
months of April, June, and July had about a 1-percentage-point lower probability of being
low quality as compared to recruits enlisting in January. These results were strongly
statistically significant at the 1% significance level. Of those three months mentioned,
April exhibited the lowest probability of being low quality for all three low quality
indicators.
Fiscal Years 1998 thru 2002 had higher probabilities of low quality recruits
enlisting compared to 1997, whereas 2003 thru 2011 exhibited a lower probability of low
quality recruits enlisting on average. These results were also strongly statistically
significant at the 1% significance level.
The state-level unemployment rate 12 months prior to enlistment decreased the
probability of a recruit being low quality. This result supports prior analysis of the
inverse effect of state unemployment rates on successful military recruiting. The estimate
showed that a 1-point increase in the average unemployment rate 12 months prior to a
recruit’s enlistment reduces the probability of being low quality (using the first measure
of quality) by 1-percentage-point. The same results held true for recruits to be low quality
based solely on a low AFQT score. A 1-point increase in the average state unemployment
rate only caused a 0.02-percentage-point decrease in the probability of a recruit being low
quality based on not having a high school diploma. Historically, the number of recruits
enlisting increases when state unemployment rates rise causing an overall greater influx
of both low and high quality recruits.
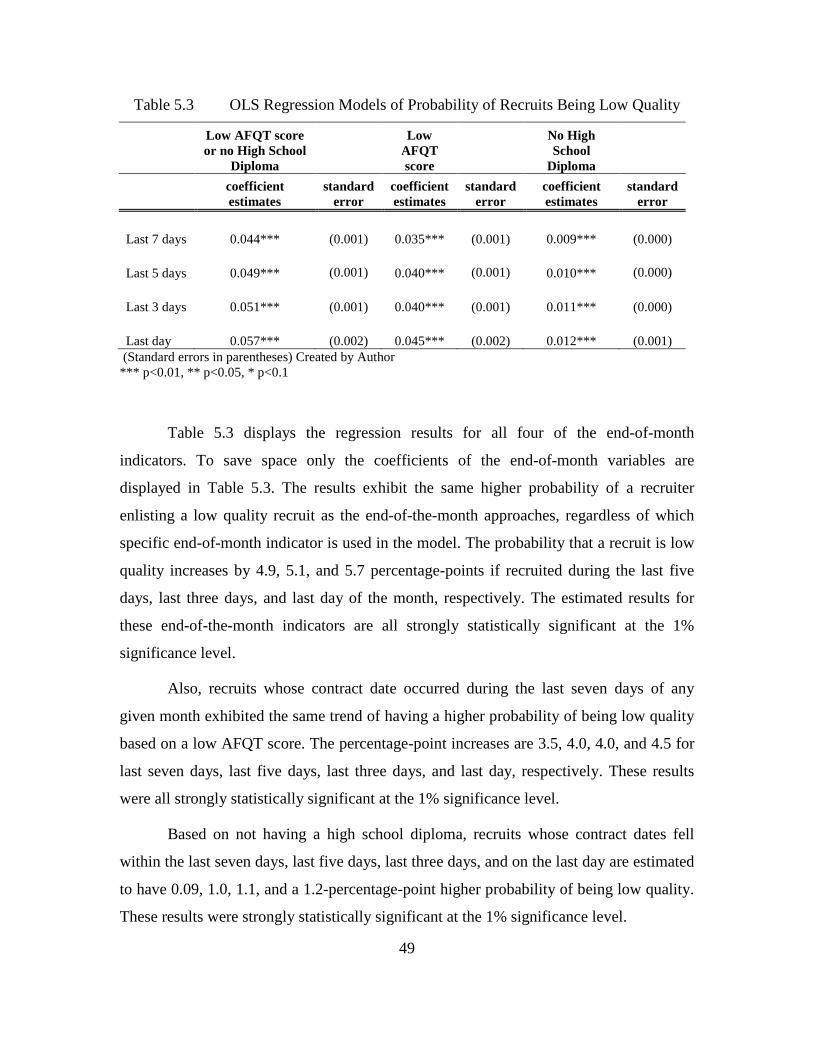
49
Table 5.3 OLS Regression Models of Probability of Recruits Being Low Quality
Low AFQT score or no High School
Diploma
Low AFQT score
No High School
Diploma
coefficient estimates
standard error
coefficient estimates
standard error
coefficient estimates
standard error
Last 7 days 0.044*** (0.001) 0.035*** (0.001) 0.009*** (0.000) Last 5 days 0.049*** (0.001) 0.040*** (0.001) 0.010*** (0.000) Last 3 days 0.051*** (0.001) 0.040*** (0.001) 0.011*** (0.000) Last day 0.057*** (0.002) 0.045*** (0.002) 0.012*** (0.001)
(Standard errors in parentheses) Created by Author *** p<0.01, ** p<0.05, * p<0.1
Table 5.3 displays the regression results for all four of the end-of-month
indicators. To save space only the coefficients of the end-of-month variables are
displayed in Table 5.3. The results exhibit the same higher probability of a recruiter
enlisting a low quality recruit as the end-of-the-month approaches, regardless of which
specific end-of-month indicator is used in the model. The probability that a recruit is low
quality increases by 4.9, 5.1, and 5.7 percentage-points if recruited during the last five
days, last three days, and last day of the month, respectively. The estimated results for
these end-of-the-month indicators are all strongly statistically significant at the 1%
significance level.
Also, recruits whose contract date occurred during the last seven days of any
given month exhibited the same trend of having a higher probability of being low quality
based on a low AFQT score. The percentage-point increases are 3.5, 4.0, 4.0, and 4.5 for
last seven days, last five days, last three days, and last day, respectively. These results
were all strongly statistically significant at the 1% significance level.
Based on not having a high school diploma, recruits whose contract dates fell
within the last seven days, last five days, last three days, and on the last day are estimated
to have 0.09, 1.0, 1.1, and a 1.2-percentage-point higher probability of being low quality.
These results were strongly statistically significant at the 1% significance level.
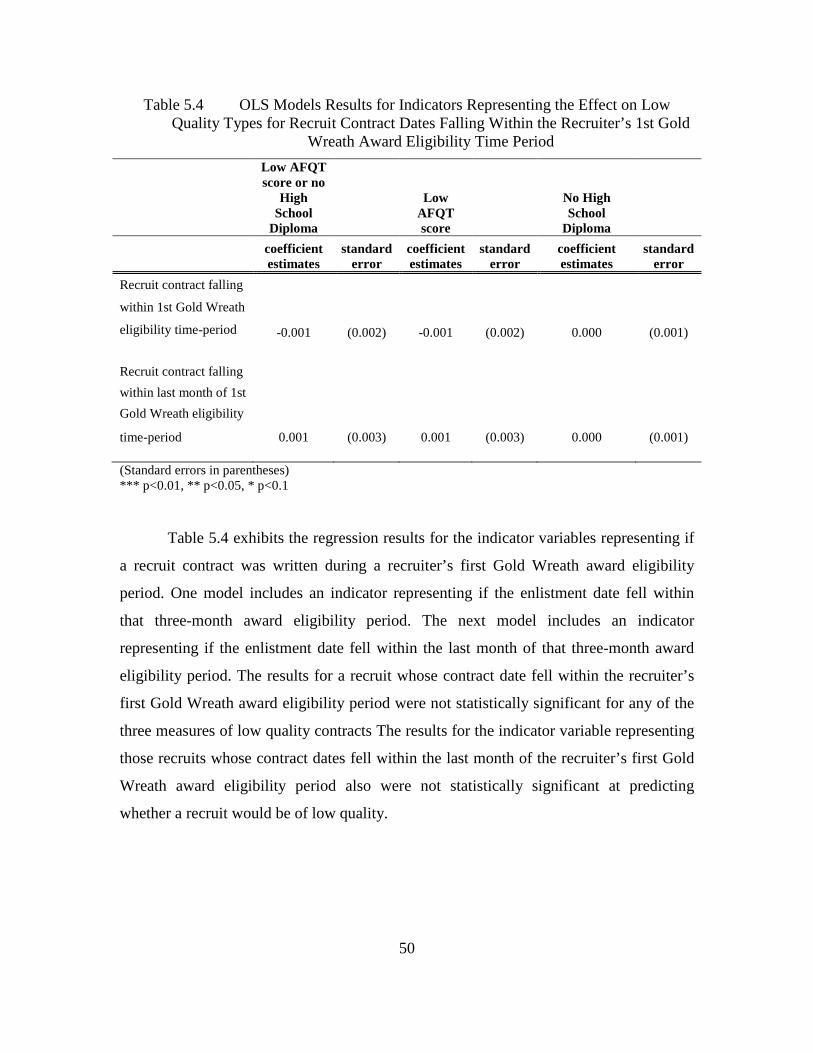
50
Table 5.4 OLS Models Results for Indicators Representing the Effect on Low Quality Types for Recruit Contract Dates Falling Within the Recruiter’s 1st Gold
Wreath Award Eligibility Time Period
Low AFQT score or no
High School
Diploma
Low AFQT score
No High School
Diploma
coefficient estimates
standard error
coefficient estimates
standard error
coefficient estimates
standard error
Recruit contract falling within 1st Gold Wreath eligibility time-period -0.001 (0.002) -0.001 (0.002) 0.000 (0.001) Recruit contract falling within last month of 1st Gold Wreath eligibility time-period 0.001 (0.003) 0.001 (0.003) 0.000 (0.001) (Standard errors in parentheses) *** p<0.01, ** p<0.05, * p<0.1
Table 5.4 exhibits the regression results for the indicator variables representing if
a recruit contract was written during a recruiter’s first Gold Wreath award eligibility
period. One model includes an indicator representing if the enlistment date fell within
that three-month award eligibility period. The next model includes an indicator
representing if the enlistment date fell within the last month of that three-month award
eligibility period. The results for a recruit whose contract date fell within the recruiter’s
first Gold Wreath award eligibility period were not statistically significant for any of the
three measures of low quality contracts The results for the indicator variable representing
those recruits whose contract dates fell within the last month of the recruiter’s first Gold
Wreath award eligibility period also were not statistically significant at predicting
whether a recruit would be of low quality.

51
VI. SUMMARY, CONCLUSIONS, AND RECOMMENDATIONS
A. SUMMARY
U.S. Navy recruiters face many challenges that affect their ability to recruit high
quality recruits and may at times sacrifice recruit quality at the end of any given month to
earn awards. The regression results in this thesis supported the hypothesis that as the end
of the month approaches, recruits have a higher probability of being low quality. The last
day of any given month showed the highest likelihood of a recruit being low quality as
compared to the earlier days in the month.
The gold and gold3 indicator variables effects were not statistically significant
which does not validate the hypothesis that recruits enlisting during a recruiter’s first
Gold Wreath eligibility time-period have a higher probability of being low quality as
compared to those same recruits enlisting after that time-period.
The three low quality type regression estimate results for Black recruits exhibited
the largest effect on recruit quality. Black recruits exhibited a 23.8 and 25.5 percentage-
point higher probability of being low quality based on the main two indicators of being
low quality (having either a low AFQT score or no high school diploma and also for only
having a low AFQT score) as compared to white male recruits.
The U.S. Navy’s goal is to recruit 75% high quality individuals at a minimum but
that percentage was decreased during tough recruiting years when state unemployment
rates were low. As Commander Navy Recruiting Command stated in the Navy Recruiting
Command’s “Recruiting Force 2020 Strategy” (Commander Navy Recruiting Command,
2012b), the mission of Navy Recruiting is to—“Recruit the best men and women for
America’s Navy to accomplish today’s missions and meet tomorrow’s challenges.” The
Navy has seen and continues to see successful recruiting years since the Great Recession;
however, if the best recruits are what the Navy desires, the policies and programs that
support the recruiting force must place an increased emphasis on recruiters attracting
those high quality individuals who can meet those challenges the U.S. Navy continues to
face.
52
B. CONCLUSIONS
The U.S. Navy Awards and Incentives System may be counter-productive in
incentivizing recruiters to meet their Net Contract Objective goals. The average Navy
recruiter is forced to make hard decisions when it comes to focusing their efforts on
prospective recruits. Due to the challenging and dynamic nature of Navy recruiting, high
quality recruits require more resources to attract. If recruiters have not made their recruit
contract goals by the last week of the month, statistical analysis in this thesis shows that
recruiters are highly likely to recruit a low quality individual because they are easier to
recruit and are probably waiting on the recruiter’s call to service. Although the current
Navy Awards and Incentive System places an increased emphasis on the requirement to
attract higher quality recruits, changes must be continually made to address the needs of
the recruiting force
Enlisting low quality recruits do not come without a price. As the U.S. Navy
becomes more fiscally prudent, the training dollars, administrative man-hours, and
available recruiter time is becoming more stringent. The downsizing of the Navy
manpower imposes a greater need to attract the higher quality military-eligible youth to
meet the future needs of this diverse organization.
C. RECOMMENDATIONS
1. Changes to the USN Recruiter Awards and Incentives System
The results in this thesis suggest that a special bonus-point category within the
Enlisted Recruiter Incentive System (ERIS) program that is only authorized to be earned
during the last week of the month should be initiated. Recruiters would earn the bonus
points for writing recruit contracts for recruits who have the lowest probability of being
low quality during the last week of any given month. Also, to earn these points, recruiters
must recruit a minimum number of high quality individuals during the month as
determined by CNRC. These bonus points may then be applied to the individual
recruiter’s recruit contract record for competition in RCAP. As previously mentioned in
Chapter II, RCAP provides selected candidates with immediate promotion. Recruiters
earning immediate advancement also earn a reputation for being the best at their jobs.
53
This new special bonus-point program within the ERIS program should be implemented
and simultaneously adopted with a change to the RCAP instruction’s eligibility criteria.
Nevertheless, most sailors, specifically recruiters, seek to achieve immediate promotion
to the next pay grade through superior job performance. Further analysis into the proper
promulgation of such a program is needed for a more informed decision for program
creation and implementation.

54
THIS PAGE INTENTIONALLY LEFT BLANK

55
APPENDIX.
Table A.1 exhibits the RIS point-based program available to recruiters based upon
the quarterly AAA Instruction Notice distributed by CNRC. The point valuation is based
upon updated recruit demographics and skills to reflect the desired recruit contract and
accession goals to include dynamic manpower mission requirements of the U.S. Navy.
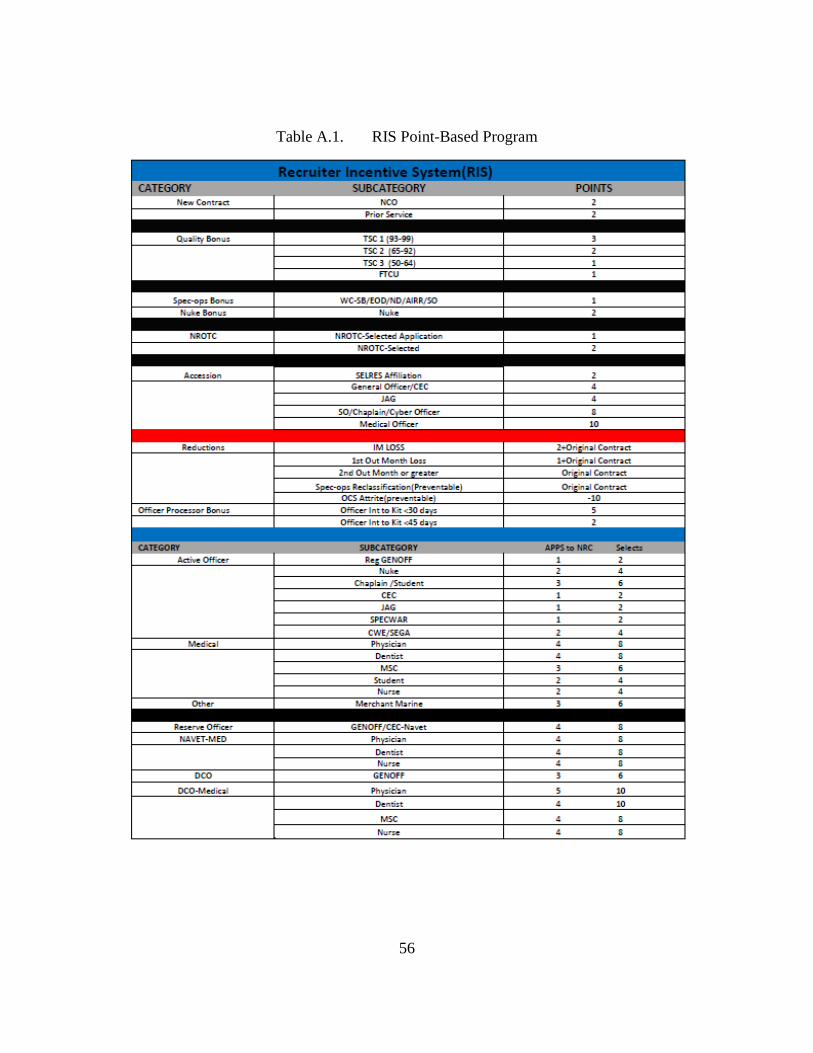
56
Table A.1. RIS Point-Based Program
57
LIST OF REFERENCES
Arkes, J., & Mehay, S. (2013). The impact of unemployment on attrition of first-term enlistees. Defence and Peace Economics. Retrieved from Naval Postgraduate School Dudley Knox website: http://dx.doi.org/10.1080/10242694.2013.752244
Asch, B. J. (1990, June). Navy recruiter productivity and the freeman plan. Santa Monica, CA: RAND Corporation. Retrieved from RAND website: http://www.rand.org/pubs/monograph_reports/R3713
Baczkowski Jr., R. E. (2006, March). The effects of end-of-month recruiting on Marine Corps recruit depot attrition. Retrieved from DTIC website: http://handle.dtic.mil/100.2/ADA445284
Barfield, L. C. (1993). An Analysis of enlisted navy recruiter productivity and incentive programs, FY1988–FY1990 (master’s thesis). Naval Postgraduate School.
Bruno, M. G. (2005). Analysis of recruit attrition from the U.S. Marine Corps delayed entry program (master’s thesis). Naval Postgraduate School, Monterey, CA.
Commander Navy Recruiting Command. (n.d.). COMNAVCRUITCOM notice 1650. Retrieved from http://www.cnrc.navy.mil/publications/NOTICES
Commander Navy Recruiting Command. (2010, June 30). Recruiting Command Advancement Program (RCAP), COMNAVCRUITCOM instruction 1430.7C. Retrieved from http://www.cnrc.navy.mil/publications/Directives/1430_7C.pdf
Commander Navy Recruiting Command. (2012a). Navy recruiting command awards manual. COMNAVCRUITCOM instruction 1650.1B with Ch.8. Retrieved from http://www.cnrc.navy.mil/publications/1650_1B.htm
Commander Navy Recruiting Command. (2012b). Recruiting Force 2020 Strategy.
Hojnowski, R. A. (2005). Analyzing the assignment of enlisted recruiting goal shares via the Navy’s enlisted goaling and forecasting model (master’s thesis). Naval Postgraduate School, Monterey, CA.
Pinelis, Y. K., Schmitz, E. J., Miller, Z. T., Rebhan, E., & Schmitz, E. J. (2011, December 1). An analysis of Navy recruiting goal allocation models. Retrieved from CNA website: http://www.cna.org/research/2011/analysis-navy-recruiting-goal-allocation-models
Pry, D. A. (1996). An analysis of the U.S. Navy goal-based recruiting system (master’s thesis). Naval Postgraduate School, Monterey, CA.

58
U. S. Bureau of Labor Statistics. (n.d). Local area unemployment statistics. Unemployment rates for states. Retrieved from http://www.bls.gov/lau/#tables.htm

59
INITIAL DISTRIBUTION LIST
1. Defense Technical Information Center Ft. Belvoir, Virginia 2. Dudley Knox Library Naval Postgraduate School Monterey, California 3. LT Tequila McGlocking Jacksonville, Florida
4. Prof. Jeremy Arkes Naval Postgraduate School Monterey, California 5. Prof. Steve Mehay Naval Postgraduate School Monterey, California
6. Commander, Navy Recruiting Command
Attn: John Noble Plans and Policy (Code 35) Millington, Tennessee