naval postgraduate · pdf filespare parts that were ... usn of the naval postgraduate school...
TRANSCRIPT

NAVAL POSTGRADUATE
SCHOOL
MONTEREY, CALIFORNIA
MBA PROFESSIONAL REPORT
Reverse Logistics at the Commander, Naval Surface Forces Real-time & Reutilization Asset Management (R-RAM) San Diego Warehouse
By: Nolasco Villanueva
Jeffery Young Dennis Estrella
December 2008
Advisors: Uday Apte Richard Nalwasky
Approved for public release; distribution is unlimited.

THIS PAGE INTENTIONALLY LEFT BLANK
i
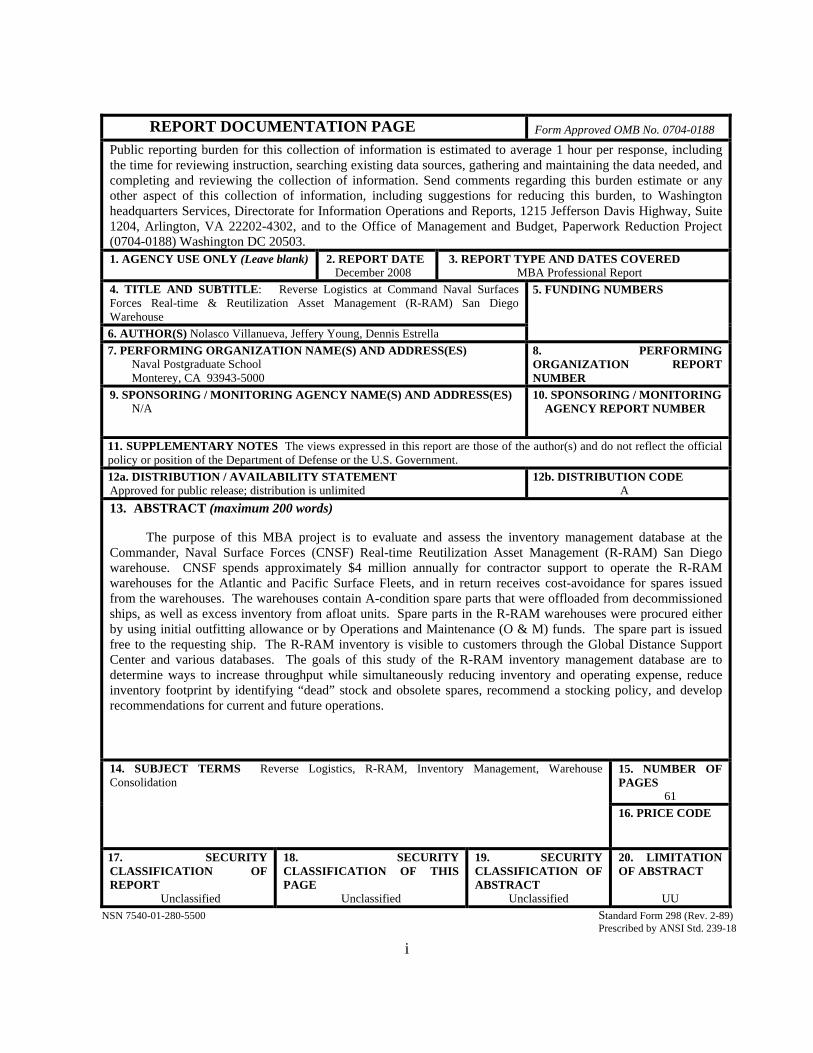
REPORT DOCUMENTATION PAGE Form Approved OMB No. 0704-0188 Public reporting burden for this collection of information is estimated to average 1 hour per response, including the time for reviewing instruction, searching existing data sources, gathering and maintaining the data needed, and completing and reviewing the collection of information. Send comments regarding this burden estimate or any other aspect of this collection of information, including suggestions for reducing this burden, to Washington headquarters Services, Directorate for Information Operations and Reports, 1215 Jefferson Davis Highway, Suite 1204, Arlington, VA 22202-4302, and to the Office of Management and Budget, Paperwork Reduction Project (0704-0188) Washington DC 20503. 1. AGENCY USE ONLY (Leave blank)
2. REPORT DATE December 2008
3. REPORT TYPE AND DATES COVERED MBA Professional Report
4. TITLE AND SUBTITLE: Reverse Logistics at Command Naval Surfaces Forces Real-time & Reutilization Asset Management (R-RAM) San Diego Warehouse 6. AUTHOR(S) Nolasco Villanueva, Jeffery Young, Dennis Estrella
5. FUNDING NUMBERS
7. PERFORMING ORGANIZATION NAME(S) AND ADDRESS(ES) Naval Postgraduate School Monterey, CA 93943-5000
8. PERFORMING ORGANIZATION REPORT NUMBER
9. SPONSORING / MONITORING AGENCY NAME(S) AND ADDRESS(ES) N/A
10. SPONSORING / MONITORING AGENCY REPORT NUMBER
11. SUPPLEMENTARY NOTES The views expressed in this report are those of the author(s) and do not reflect the official policy or position of the Department of Defense or the U.S. Government. 12a. DISTRIBUTION / AVAILABILITY STATEMENT Approved for public release; distribution is unlimited
12b. DISTRIBUTION CODE A
13. ABSTRACT (maximum 200 words)
The purpose of this MBA project is to evaluate and assess the inventory management database at the Commander, Naval Surface Forces (CNSF) Real-time Reutilization Asset Management (R-RAM) San Diego warehouse. CNSF spends approximately $4 million annually for contractor support to operate the R-RAM warehouses for the Atlantic and Pacific Surface Fleets, and in return receives cost-avoidance for spares issued from the warehouses. The warehouses contain A-condition spare parts that were offloaded from decommissioned ships, as well as excess inventory from afloat units. Spare parts in the R-RAM warehouses were procured either by using initial outfitting allowance or by Operations and Maintenance (O & M) funds. The spare part is issued free to the requesting ship. The R-RAM inventory is visible to customers through the Global Distance Support Center and various databases. The goals of this study of the R-RAM inventory management database are to determine ways to increase throughput while simultaneously reducing inventory and operating expense, reduce inventory footprint by identifying “dead” stock and obsolete spares, recommend a stocking policy, and develop recommendations for current and future operations.
15. NUMBER OF PAGES
61
14. SUBJECT TERMS Reverse Logistics, R-RAM, Inventory Management, Warehouse Consolidation
16. PRICE CODE
17. SECURITY CLASSIFICATION OF REPORT
Unclassified
18. SECURITY CLASSIFICATION OF THIS PAGE
Unclassified
19. SECURITY CLASSIFICATION OF ABSTRACT
Unclassified
20. LIMITATION OF ABSTRACT
UU NSN 7540-01-280-5500 Standard Form 298 (Rev. 2-89) Prescribed by ANSI Std. 239-18

ii
THIS PAGE INTENTIONALLY LEFT BLANK
iii
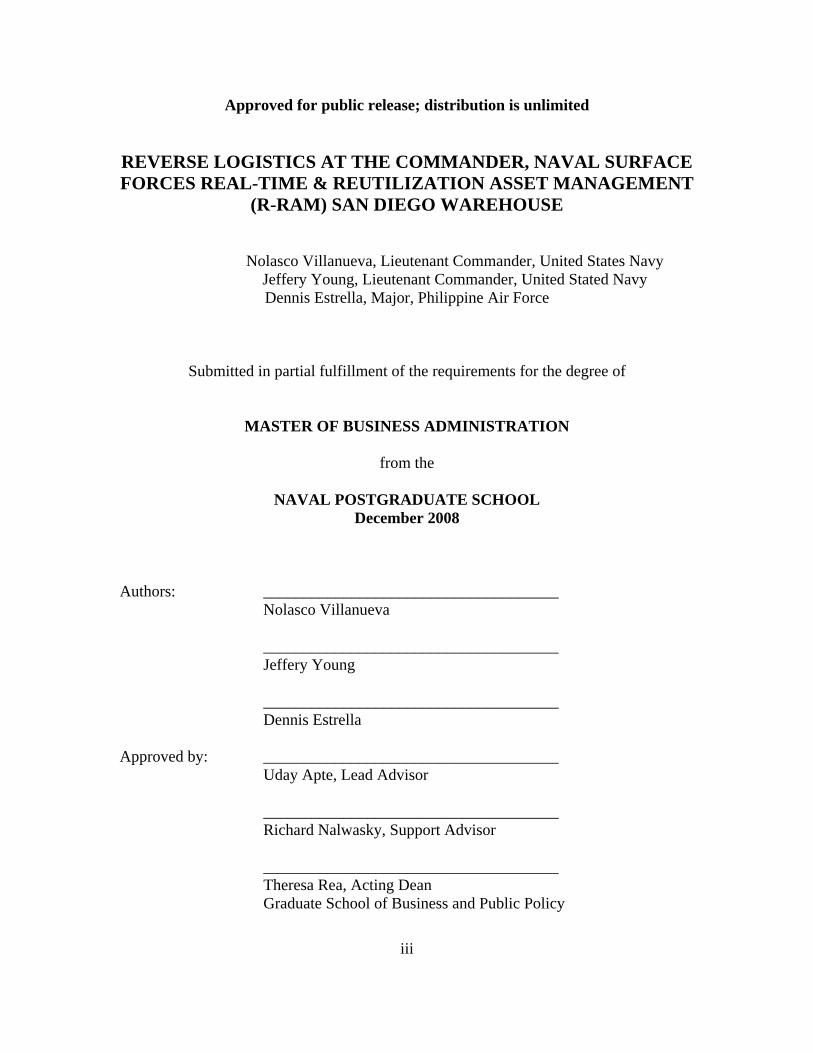
Approved for public release; distribution is unlimited
REVERSE LOGISTICS AT THE COMMANDER, NAVAL SURFACE FORCES REAL-TIME & REUTILIZATION ASSET MANAGEMENT
(R-RAM) SAN DIEGO WAREHOUSE
Nolasco Villanueva, Lieutenant Commander, United States Navy Jeffery Young, Lieutenant Commander, United Stated Navy Dennis Estrella, Major, Philippine Air Force
Submitted in partial fulfillment of the requirements for the degree of
MASTER OF BUSINESS ADMINISTRATION
from the
NAVAL POSTGRADUATE SCHOOL December 2008
Authors: _____________________________________ Nolasco Villanueva
_____________________________________
Jeffery Young _____________________________________ Dennis Estrella Approved by: _____________________________________
Uday Apte, Lead Advisor _____________________________________ Richard Nalwasky, Support Advisor _____________________________________ Theresa Rea, Acting Dean
Graduate School of Business and Public Policy

iv
THIS PAGE INTENTIONALLY LEFT BLANK

v
REVERSE LOGISTICS AT THE COMMANDER, NAVAL SURFACE FORCES REAL-TIME & REUTILIZATION ASSET MANAGEMENT
(R-RAM) SAN DIEGO WAREHOUSE
ABSTRACT
The purpose of this MBA project is to evaluate and assess the inventory
management database at the Commander, Naval Surface Forces (CNSF) Real-time
Reutilization Asset Management (R-RAM) San Diego warehouse. CNSF spends
approximately $4 million annually for contractor support to operate the R-RAM
warehouses for the Atlantic and Pacific Surface Fleets, and in return receives cost-
avoidance for spares issued from the warehouses. The warehouses contain A-condition
spare parts that were offloaded from decommissioned ships, as well as excess inventory
from afloat units. Spare parts in the R-RAM warehouses were procured either by using
initial outfitting allowance or by Operations and Maintenance (O & M) funds. The spare
part is issued free to the requesting ship. The R-RAM inventory is visible to customers
through the Global Distance Support Center and various databases. The goals of this
study of the R-RAM inventory management database are to determine ways to increase
throughput while simultaneously reducing inventory and operating expense, reduce
inventory footprint by identifying “dead” stock and obsolete spares, recommend a
stocking policy, and develop recommendations for current and future operations.

vi
THIS PAGE INTENTIONALLY LEFT BLANK

vii
TABLE OF CONTENTS
I. INTRODUCTION........................................................................................................1 A. BACKGROUND ..............................................................................................1 B. PURPOSE.........................................................................................................6 C. RESEARCH QUESTION ...............................................................................6
II. LITERATURE REVIEW ...........................................................................................9 A. OVERVIEW.....................................................................................................9 B. REVERSE LOGISTICS DEFINED.............................................................10 C. REVERSE LOGISTICS IN THE COMMERCIAL WORLD ..................11 D. REVERSE LOGISTICS IN THE DEFENSE DEPARTMENT................12 E. REVERSE LOGISTICS OPERATIONS IN THE NAVY.........................14 F. INVENTORY MANAGEMENT..................................................................14 G. INVENTORY MODELS...............................................................................17 H. INVENTORY MANAGEMENT IN CLOSEDLOOP SUPPLY
CHAINS..........................................................................................................19 I. MULTI-PERIOD, SINGLE-ECHELON MODEL IN CLOSED-
LOOP SUPPLY CHAIN ...............................................................................20
III. METHODOLOGY ....................................................................................................23 A. INTRODUCTION..........................................................................................23 B. METHOD .......................................................................................................23 C. OBJECTIVE ..................................................................................................24
IV. ANALYSIS OF R-RAM SD INVENTORY ............................................................27 A. OVERVIEW...................................................................................................27 B. BREAKDOWN OF CURRENT INVENTORY..........................................29 C. OBSOLETE NIINS........................................................................................31 D. SHIP CLASS-DESTROYERS (DD) ............................................................31 E. SHIP CLASS-FAST FRIGATE (FF) ...........................................................32 F. INVENTORY MANAGEMENT BUSINESS RULES ...............................34
V. RECOMMENDATIONS AND CONCLUSIONS...................................................37 A. INVENTORY .................................................................................................37 B. BUSINESS RULES........................................................................................38 C. WAREHOUSE MANAGEMENT................................................................38
LIST OF REFERENCES......................................................................................................41
INITIAL DISTRIBUTION LIST .........................................................................................45

viii
THIS PAGE INTENTIONALLY LEFT BLANK

ix
LIST OF FIGURES
Figure 1. Requisition Process............................................................................................6 Figure 2. R-RAM SD Spares Inventory ..........................................................................27 Figure 3. R-RAM SD Labor Cost vs. Cost Avoidance ...................................................28 Figure 4. Spares inventory received by R-RAM SD.......................................................29 Figure 5. R-RAM SD Inventory Breakdown ..................................................................30 Figure 6. Obsolete NIINs ................................................................................................31 Figure 7. NIINs Applicable to DD-class only.................................................................32 Figure 8. NIINs Applicable to FF-class only ..................................................................33 Figure 9. NIINs Applicable to DD-class and FF-class only............................................33

x
THIS PAGE INTENTIONALLY LEFT BLANK

xi
LIST OF TABLES
Table 1. An example of a PLSQL query result..............................................................30

xii
THIS PAGE INTENTIONALLY LEFT BLANK

xiii
ACKNOWLEDGMENTS
This research was supported by the Naval Postgraduate School Acquisition
Research Program. We are extremely thankful to RADM Jim Greene, USN (Ret) for his
stewardship of the program. We are also greatly thankful to Ms. Karey Shaffer and Mr.
David Wood for their outstanding administrative support. Special thanks to Ms. Vickie
Cavanaugh (NAVSEALOGCEN) for superb technical support in gathering data for this
project. Thanks to Ms. Judy Hirst (CNSF- Del Rey) for providing reports and assistance
during our site visit. Special thanks to our families for their encouragement, love, and
support. Lastly, we thank Professor Uday Apte and Commander Richard Nalwasky,
USN of the Naval Postgraduate School for their outstanding guidance as our report
advisors.

xiv
THIS PAGE INTENTIONALLY LEFT BLANK
1
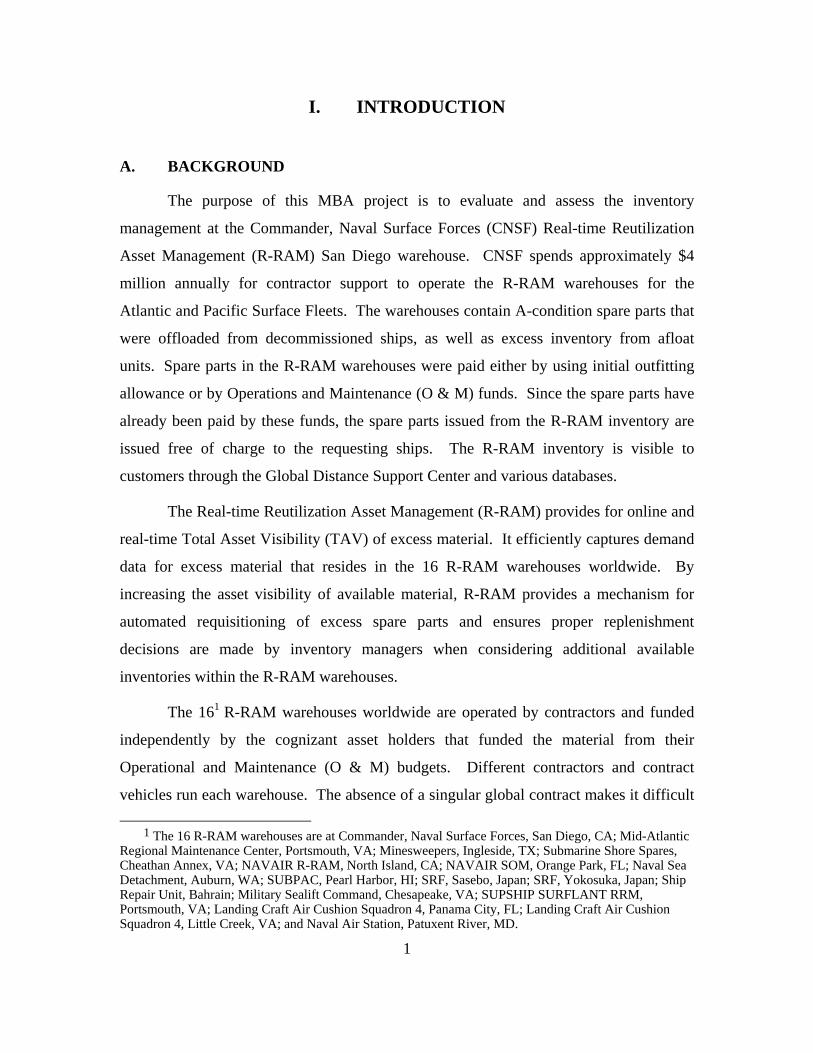
I. INTRODUCTION
A. BACKGROUND
The purpose of this MBA project is to evaluate and assess the inventory
management at the Commander, Naval Surface Forces (CNSF) Real-time Reutilization
Asset Management (R-RAM) San Diego warehouse. CNSF spends approximately $4
million annually for contractor support to operate the R-RAM warehouses for the
Atlantic and Pacific Surface Fleets. The warehouses contain A-condition spare parts that
were offloaded from decommissioned ships, as well as excess inventory from afloat
units. Spare parts in the R-RAM warehouses were paid either by using initial outfitting
allowance or by Operations and Maintenance (O & M) funds. Since the spare parts have
already been paid by these funds, the spare parts issued from the R-RAM inventory are
issued free of charge to the requesting ships. The R-RAM inventory is visible to
customers through the Global Distance Support Center and various databases.
The Real-time Reutilization Asset Management (R-RAM) provides for online and
real-time Total Asset Visibility (TAV) of excess material. It efficiently captures demand
data for excess material that resides in the 16 R-RAM warehouses worldwide. By
increasing the asset visibility of available material, R-RAM provides a mechanism for
automated requisitioning of excess spare parts and ensures proper replenishment
decisions are made by inventory managers when considering additional available
inventories within the R-RAM warehouses.
The 161 R-RAM warehouses worldwide are operated by contractors and funded
independently by the cognizant asset holders that funded the material from their
Operational and Maintenance (O & M) budgets. Different contractors and contract
vehicles run each warehouse. The absence of a singular global contract makes it difficult
1 The 16 R-RAM warehouses are at Commander, Naval Surface Forces, San Diego, CA; Mid-Atlantic Regional Maintenance Center, Portsmouth, VA; Minesweepers, Ingleside, TX; Submarine Shore Spares, Cheathan Annex, VA; NAVAIR R-RAM, North Island, CA; NAVAIR SOM, Orange Park, FL; Naval Sea Detachment, Auburn, WA; SUBPAC, Pearl Harbor, HI; SRF, Sasebo, Japan; SRF, Yokosuka, Japan; Ship Repair Unit, Bahrain; Military Sealift Command, Chesapeake, VA; SUPSHIP SURFLANT RRM, Portsmouth, VA; Landing Craft Air Cushion Squadron 4, Panama City, FL; Landing Craft Air Cushion Squadron 4, Little Creek, VA; and Naval Air Station, Patuxent River, MD.

2
to streamline warehouse operations for all sites, gain operational efficiency, pool
resources and reduce operating costs. The inventories from each warehouse are
centrally-managed at the Naval Inventory Control Point (NAVICP) using the LAWSON
inventory management database. All requisitions originating from the Fleet, as well as
Naval Shore Facilities, will be issued from the R-RAM inventory prior to being filled by
the Navy Supply System or the Defense Logistics Agency (DLA).
Before continuing with R-RAM’s current status, it is important to briefly discuss
the driving force behind R-RAM and how the program evolved. There has always been
an issue of what the Navy, as a whole, should do with excess offloaded material2. Mark
O’Brien, a NAVSUP contractor working within R-RAM, provides an insight on the
history of R-RAM and Total Asset Visibility. In the early 1990s, the various Type
Commander’s (TYCOM)3 and System Commands (SYSCOM)4 all supported their own
excess spare parts. Since the TYCOMs and SYSCOMs used their own Operational and
Maintenance (O&M) funding to procure onboard spare parts, they were reluctant to give
up their “gold piles”5 (2008, May 21). This excess material was not centrally located
ashore nor was it located in storerooms on operational units afloat. While excess material
may have been visible to units within their own TYCOM, there was limited visibility
between TYCOMs. A lack of TAV Navy-wide was considered the major problem
arising out of these “gold piles” (2008, May 21). In some cases, an artificial shortage
existed even though the parts were available. All of the “gold piles” made it difficult for
the Navy Item Managers to accurately predict demand and inventory level, which forced
them, at times, to engage in speculative demand forecasting. Inaccurate demand
forecasting resulted in an increase of Not- in-Stock (NIS) requisitions, which caused
2 Excess material is considered to be any spare part in inventory that has not been issued in a two-year
period. 3 Each Naval platform has a TYCOM. The Naval Surface Force is SURFOR. The Naval Air Force is
AIRFOR. The Naval Submarine Force is SUBFOR. The TYCOMs are responsible for staffing, training, and equipping their respective force.
4 The Naval System Commands are the Naval Sea System Command, Naval Air System Command, and Naval Supply System Command. The System Commands outfit units with new weapons systems and spare p arts support.
5 “Gold pile” also refers to spare parts because owners would hoard the spare parts like gold.

3
longer Average Customer Wait Time (ACWT)6. Not-in-stock items force item managers
into reactive forecasting, which often leads to over buying. In addition to obvious
additional inventory holding costs, these “gold piles” resulted in unnecessary
expenditures of precious and scarce O&M funds for items already purchased and in
storage at a warehouse or aboard ships.
Some of those inventories were reflected in Consolidated Residual Asset
Management Screening Information (CRAMSI)7 system, which was managed by Naval
Sea Logistics Center (NAVSEALOGCEN) (O’Brien, 2008, May 21). The CRAMSI
systems allowed users to access the available material in the excess inventory. The
problem with CRAMSI was that it was only as good as the data that was input into the
system. It was not a Real-time system (2008, May 21).
The original RAM (one "R") was created at the Ship’s Parts Control Center
(SPCC), which is now NAVICP-Mechanicsburg (2008, May 21). SPCC volunteered to
build a system to manage the TYCOMs and SYSCOMs excess material to make it visible
to and accessible by the supply system. The original RAM was instituted to appease the
auditors wondering how the TYCOMs and SYSCOMs accounted for excess spare parts
(2008, May 21). SPCC only provided the computer system. As it operates today, the
local management of the excess material was under the control of the TYCOMs and
SYSCOMs, who originally procured the material through their O & M budget (2008,
May 21).
In 1995, NAVSUP implemented the Uniformed Automated Data Processing
System (UADPS). The RAM inventory was visible in the Virtual Master Stock
Inventory Record (VMSIR), which was the same system used at the Fleet and Industrial
Supply Centers (FISC). The FISCs are the entry point for all requisitions into the Navy
6 ACWT is a CNSF metric that measures the time it takes to complete the order fulfillment process
(i.e., the time it takes between when the part is ordered to the time it is received). 7 CRAMSI is a data feed from individual units displaying what material the unit has on hand at the
time of data download.

4
Supply System. In 1998, NAVSUP introduced the Central Point of Entry Network
(CPEN). The requisitions processed through CPEN were also able to access RAM
(O’Brien, 2008, May 21).
NAVSUP and NAVICP Mechanicsburg transitioned from the original RAM to R-
RAM (Real-time Reutilization Asset Management) in December 2000 when the system
was converted from UADPS to a Commercial-of-the-Shelf (COTS) product from a
company called Lawson Insight (2008, May 21). Implementation of the web-enabled, R-
RAM Lawson TAV program was a step in the right direction in improving logistics
readiness and reducing unnecessary O&M expenditures. It has resulted in better
requirements forecasting, asset visibility, and material distribution. Furthermore, the
initiative resulted in a timely and accurate location of critical repair parts. Visibility of
materials in the warehouses and excess parts onboard ships have resulted in lower NIS
requisitions, which in turn aided the Navy inventory managers in accurately maintaining
inventory level. They have gone from speculative and reactive forecasting to a more
efficient real-time demand inventory policy.
The team in NAVICP- Mechanicsburg was transferred to NAVSISA in 2003 as
part of Navy Transformation (O’Brien, 2008, May 21). In addition to CPEN/VMSIR,
current R-RAM interfaces with NAVICP (Flashpoint and IM Toolkit), One Touch
Supply, and NAVSEALOGCENs Outfitting Requisition Control and Accounting System
(ORCAS) (2008, May 21).
The Commander, Naval Surface Forces spends approximately $4 million annually
for contractor support to operate the Real-time Reutilization Asset Management (R-
RAM) warehouses for the Atlantic and Pacific Surface Fleets. The warehouses contain
A-condition8 spare parts that, by the use of reverse logistics, were offloaded from
decommissioned ships and include excess inventory from afloat units. Upon
commissioning, Navy ships are outfitted with an initial allowance of spare parts and
receive replacement parts for those that were used throughout its lifecycle. The spare
parts are listed as onboard repair parts under a ship’s Coordinated Shipboard Allowance
8 “A” condition spare parts are in unopened and never-been-issued state. Our major assumption is that all parts in RRAM are “A” condition.

5
List (COSAL). COSALs specify the range and depth of spare parts ships are required to
carry onboard. Even with a COSAL specified inventory level, excess inventories often
occur due to inaccurate re-orders or by the periodic removal/update of weapon systems
throughout the lifecycle of the ship. If a surface ship needs a part, the requisition is
screened at the R-RAM warehouse before entering the Navy Supply System for issue. If
the part is available in the R-RAM warehouse, it is then sent to the requesting ship as a
free issue. Figure 1 describes the requisition process. When a requisition leaves the ship,
the O & M funds are obligated for that requisition. The Fleet and Industrial Supply
Center (FISC) automatically check the R-RAM database for availability. If the part is
available at the R-RAM warehouse, it is issued and a BN9 status is sent to the
requisitioning ship informing the crew of the free issue and notifying them to de-obligate
the funds for other priorities. If, on the other hand, the part is not available at the R-RAM
warehouse, the requisition proceeds through the Navy Supply System order fulfillment
process.
Del Rey System and Technology Inc., a subcontractor for Science Applications
International Corporation (SAIC), is the current contractor under contract number
N00244-07-C-0009. It provides logistic services on Pacific Fleet ships and shore stations
by providing technical support services to CNSF. Specifically, it assists in the
management of afloat inventories and related logistics support to improve the level of
fleet readiness.
9 BN. Naval Supply Systems Command Publication (1997). NAVSUP P-485 Vol II Appendix 2 Naval
Supply Procedures. A financial code that identifies a requisition as a free-issue.

6
FISC R-RAM SUPPLY SYSTEM
Requisition
RequisitionRequisition
Free Issue
Cost Is
sue
Requisition ProcessRequisition Process
On-Hand
Not
Car
ried
Figure 1. Requisition Process
B. PURPOSE
The purpose of the project is to analyze current inventory to determine ways to
increase throughput, determine ways to decrease inventory and operating expense, and
provide CNSF with recommendations.
C. RESEARCH QUESTION
The primary research questions are: (1) What percentage of the San Diego R-
RAM warehouse current inventory is dead stock? (2) What available alternatives could
increase the throughput at the San Diego R-RAM warehouse? (3) What are the costs and
benefits to CNSF operating the warehouses?
In order to answer these research questions we will perform an in-depth analysis
of the current R-RAM inventory to determine excess material, “dead” stock, and obsolete
parts. This inventory had grown to a value of $289 million at the beginning of fiscal year
2008. This was largely due to the increase in ship decommissioning and periodic
TYCOM-directed excess offloads.

7
We believe that our inventory management control recommendations can easily
be replicated at the remaining 15 R-RAM warehouses. As CNSF redefines its roles in
support of the surface warfare enterprise, it is looking into what constitutes its core
competencies. This report, along with a NPS thesis looking into activity-based costing
analysis of the warehouse operating expense (MBA report—Russo et al.), will aid CNSF
N41 in its decision-making process with respect to the idea of divesting the R-RAM
warehouses.

8
THIS PAGE INTENTIONALLY LEFT BLANK

9
II. LITERATURE REVIEW
A. OVERVIEW
Reverse Logistics is a relatively new name for an old practice in the military.
This is vividly supported by the historical writings of Henry J. Aten, who wrote History
of the 85th Regiment, Illinois Volunteer Infantry, in which he describes the retrograde
operations of General William T. Sherman’s army: “The ammunition trains were relieved
of their now useless contents, and the wagons were loaded with provisions and forage,
and by the evening of the 30th, preparations for a peaceful homeward march had been
completed” (1901, p. 308). This provides an idea of the disposal operations undertaken
by General Sherman to dispose of useless supplies that posed great burden on their return
march. Constrained by the lack of adequate means of transportation, General Sherman’s
ability to prioritize the loading of critical food supplies instead of useless ammunitions
proved critical in their successful retrograde operation. Major Johnny W. Sokolowsky in
his thesis Role of the Union Logistics in the Carolina Campaign of 1865 also discovered
that the Carolina Campaign emphasizes the importance of prioritization and integration
between the logistic and operational planner in order to negate or overcome
transportation shortfall. He further concluded that the success of the campaign is
attributed partly to Sherman’s clear understanding of the importance of logistics (p. 111).
A brilliant military logistician once said that tactics win battles but logistics wins wars.
On the other hand, the Carolina Campaign also highlighted the inability of
General Sherman to capture the remaining economic value of the disposed ammunitions.
This could be attributed to the lack of purposeful planning to save precious dollars
through the recovery of unused ammunitions. Value recovery is important because it
could be a primary source of inventory replenishment, especially for expensive supplies
(Diener, Pelz, Lackey, Blake, & Vaidyanathan, 2004, p. 1). It is on this note that the
importance of reverse logistics comes into play.

10
B. REVERSE LOGISTICS DEFINED
Despite the fact that Reverse Logistics problems existed during the Civil War
years, little research had been devoted to it. This could probably explain why there is no
generally accepted definition currently being used in the military, business and academe.
One of the earliest descriptions of Reverse Logistics was given by Lambert and Stock in
1981. They described it as “going the wrong way on a one-way street because the great
majority of product shipments flow in one direction” (Rogers &Tibben-Lembke, 2001, p.
1). A similar definition was given by Murphy in 1986 and by Murphy and Poist in 1989.
They defined Reverse Logistics as the “movement of goods from a consumer towards a
producer in a channel of distribution” (1989, p. 1). These earlier definitions have a
limited scope because they focus only on the movement of material from the customer
toward the producer.
However, the meaning of Reverse Logistics has evolved over time. In 1992, The
Council of Logistics Management (CLM) introduced Reverse Logistics as the term often
used to refer to the role of logistics in recycling, waste disposal, and management of
hazardous materials; a broader perspective includes all issues relating to logistics
activities carried out in source reduction, recycling, substitution, reuse of materials and
disposal (Stock, 1992, p. 25). In 1998, Carter and Ellram stated that Reverse Logistics is
a process whereby companies can become more environmentally efficient through
recycling, reusing, and reducing the amount of materials used. (Carter, 1998, p. 1). The
most recent definition was given by Rogers and Tibben-Lembke, who stated that:
Reverse Logistics is the process of planning, implementing, and controlling the efficient, cost-effective flow of raw materials, in-process inventory, finished goods and related information from the point of consumption to the point of origin for the purpose of recapturing value or proper disposal. (Rogers & Tibben-Lembke, 1999, p. 2)
The meaning of Reverse Logistics can also vary depending on what perspective it
is being used. From a business logistics perspective, Reverse Logistics refers to the role
of logistics in product returns, source reduction, recycling, materials substitution, reuse of
materials, waste disposal, and refurbishing, repair and remanufacturing. From an
engineering logistics perspective, it is referred to as Reverse Logistics

11
Management(RLM) and is a systematic business model that applies best logistics
engineering and management methodologies across the enterprise in order to profitably
close the loop on the supply chain (Stock, 1998, pp. 20-21).
The changing meaning of Reverse Logistics is due mainly to the developing
nature of this discipline. However, there is an obvious overlap among the presented
definition even though none of them is exactly the same. Three common aspects of
Reverse Logistics exist: (1) direction of flow of goods; (2) the goods flowing are products
of which an original use has been completed or has become impossible; and (3)
overwhelming focus on the receiving party (Fleischmann, 2001, p. 6).
C. REVERSE LOGISTICS IN THE COMMERCIAL WORLD
No documented history points to the exact birth of Reverse Logistics in U.S
business industry. However, according to Jeffrey De Vore, Reverse Logistics surfaced as
a legitimate business practice in the late 1980s (2004, p. 13). Fleischmann (2001) offered
four motives that drive businesses to engage in Reverse Logistics: economic, marketing,
legislative and asset protection (pp. 17-18).
Srivastava (2008) in his published worked entitled “Network Design for Reverse
Logistics” also shared this view. However, Srivastava made more emphasis on the
influence of environmental management orientation of supply chains (p. 535).
At present, Reverse Logistics is a multi-million dollar industry. According to
Linda S. Beltran (2002) in her paper entitled “Reverse Logistics: Current Trends and
Practices,” Reverse Logistics accounts for 4% of all logistics costs: an estimated 10.7%
of the US economy (p. 4). This makes Reverse Logistics a half percent of the total US
Gross Domestic Product. In a 1997 study made by Rogers and Tibben-Lembke (2002),
Reverse Logistics costs are estimated to be $35 billion (p. 275).
In the white paper authored by Dr. James Stock in 1998, he highlighted the
benefits achieved by companies practicing reverse logistics:
12
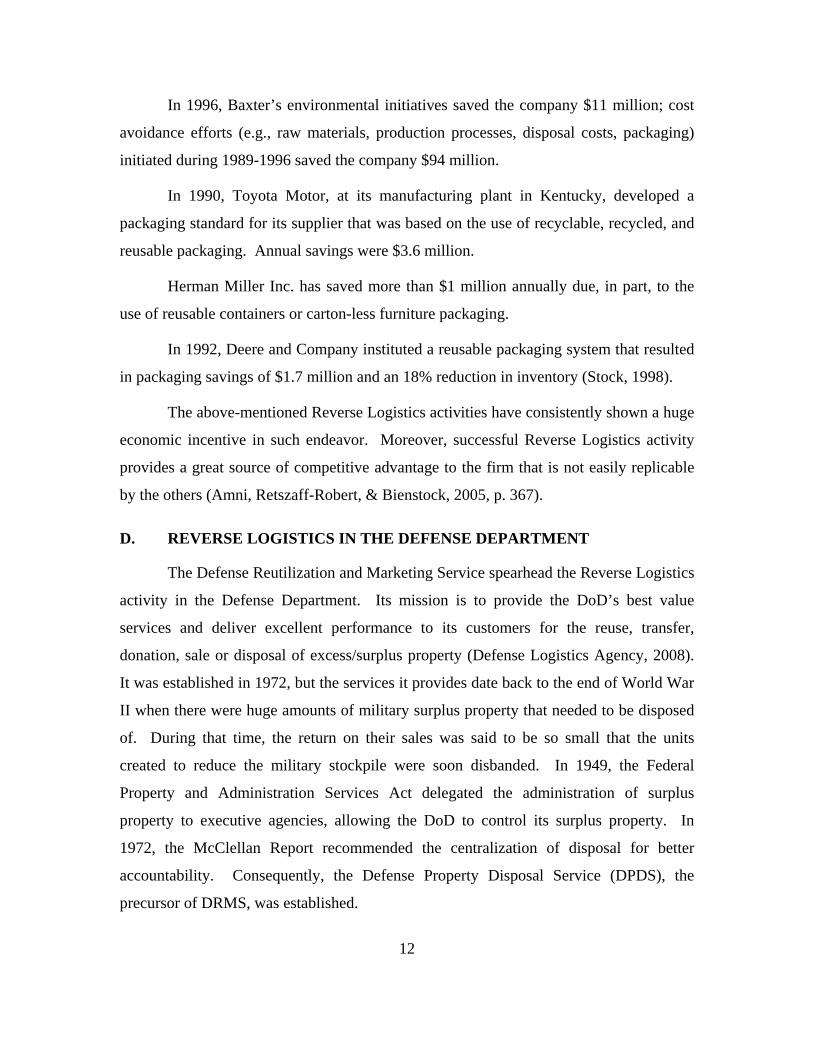
In 1996, Baxter’s environmental initiatives saved the company $11 million; cost
avoidance efforts (e.g., raw materials, production processes, disposal costs, packaging)
initiated during 1989-1996 saved the company $94 million.
In 1990, Toyota Motor, at its manufacturing plant in Kentucky, developed a
packaging standard for its supplier that was based on the use of recyclable, recycled, and
reusable packaging. Annual savings were $3.6 million.
Herman Miller Inc. has saved more than $1 million annually due, in part, to the
use of reusable containers or carton-less furniture packaging.
In 1992, Deere and Company instituted a reusable packaging system that resulted
in packaging savings of $1.7 million and an 18% reduction in inventory (Stock, 1998).
The above-mentioned Reverse Logistics activities have consistently shown a huge
economic incentive in such endeavor. Moreover, successful Reverse Logistics activity
provides a great source of competitive advantage to the firm that is not easily replicable
by the others (Amni, Retszaff-Robert, & Bienstock, 2005, p. 367).
D. REVERSE LOGISTICS IN THE DEFENSE DEPARTMENT
The Defense Reutilization and Marketing Service spearhead the Reverse Logistics
activity in the Defense Department. Its mission is to provide the DoD’s best value
services and deliver excellent performance to its customers for the reuse, transfer,
donation, sale or disposal of excess/surplus property (Defense Logistics Agency, 2008).
It was established in 1972, but the services it provides date back to the end of World War
II when there were huge amounts of military surplus property that needed to be disposed
of. During that time, the return on their sales was said to be so small that the units
created to reduce the military stockpile were soon disbanded. In 1949, the Federal
Property and Administration Services Act delegated the administration of surplus
property to executive agencies, allowing the DoD to control its surplus property. In
1972, the McClellan Report recommended the centralization of disposal for better
accountability. Consequently, the Defense Property Disposal Service (DPDS), the
precursor of DRMS, was established.

13
At present, DRMS is the lead agency that implements the DoD Resource
Recovery and Recycling Program (RRRP). In FY2006, $1.9 billion worth of property
was reutilized, which contributes to the DoD’s effort of attaining sound financial
stewardship.
Although DRMS is the lead agency in the reverse logistics activity of the DoD,
the different services have their own varying programs that fall under the sphere of
reverse logistics. Limited published documents talk about specific reverse logistics
programs in the various services. Unlike in the research made by Dr. Stock, in which he
studied a number of commercial reverse logistics practices by various firms, there is no
such authoritative paper that has studied the different military units. Among the limited
works, Major Jeffrey W. De Vore USAF, contributed a study on Reverse Logistics
operations of the Air Mobility Command of the US Air Force. His work greatly
enhanced understanding the inadequacies of the present Reverse Logistics Operations of
Air Mobility Command, more particularly in its mission to conduct retrograde operations.
Likewise, the study made by De Vore concretely describes and analyzes the major
problems that exist within AMC’s reverse channel using the Dawe’s and Stock’s
Framework. Although no effort was devoted in validating the stated recommendations in
the study, the work continues to be a very useful guide in implementing similar Reverse
Logistics activities.
A related study was made for the US Army by the group of Deiner, Pelz, Lackey,
Black, and Vaidyanathan (2004) at RAND. The research was triggered by the Army’s
need to transform into a more mobile force the simultaneously necessitates the reduction
of logistics footprint while extending its reach (p. 3). The central focus of the two reports
assesses the present retrograde operations and provides ways to improve them. Deiner, et
al., (2004) used the framework developed by Rogers and Tibben-Lembke in structuring
the existing Reverse Logistics operations and further incorporated the Define-Measure-
Improve (DMI) methodology to achieve continuous process improvement. The study
greatly contributed in the developing a quantitative approach to Reverse Logistics by
using metrics that will be valuable in conducting future related studies. The study also
supported the conclusion made by Ferguson and Browne (2002) that there is a need to
14
have an excellent information flow as the product moves in the reverse pipeline (p. 536).
Diener et al. (2004) contends that there must also be total asset visibility in Reverse
Logistics in the same manner that it is needed in the forward channel.
E. REVERSE LOGISTICS OPERATIONS IN THE NAVY
A study entitled “A Review of Reverse Logistics and Depot Level Repairable”
conducted by Stevenson, Toussaint and Edwards (2005) highlighted the importance of
using an electronic information system to attain total asset visibility. The use of the
Electronic Retrograde Management System (ERMS), a web-based program, is a key
enabler in improving the throughput in the Reverse Logistics pipeline by providing rapid
turn-in credit, reducing carcass tracking, and providing shore installation with instant in-
transit visibility (p. 19).
The different studies mentioned in this chapter clearly validates that there are
varied ways to engage and benefit from Reverse Logistics. The commercial sector can
reap considerable cost savings and customer satisfaction by promoting a closed-loop
supply chain. On the other hand, the Defense Department can achieve significant cost
avoidance by continuously improving the transportation and cycle time of product repair
or refurbishment.
F. INVENTORY MANAGEMENT
Inventory is the stock of any item or resource used in an organization. In the
service sector, it generally refers to tangible goods to be sold and the supplies necessary
to administer the service. An inventory system is the set of policies and controls that
monitor levels of inventory: what levels should be maintained, when stock should be
replenished, and how large orders should be (Apte et al., 2006, p. 135).
According to Apte et al. (2006), there are three main reasons why service firms
maintain a supply of inventory. They are as follows:

15
1. To maintain independence of operations. In order to prevent disruption of
operations due to unavailability of needed supplies, firms generally maintain a certain
level of cushion to offset the uncertainty of resupply arrival. This allows greater
flexibility to the firm in its operations.
2. To meet variation in product demand. In theory, the demand for a certain
product or supply can be computed, thus it is possible to stock the exact demand for the
product or supply. However, reality dictates that demand for the product is not
completely known, and a safety stock or buffer stock must be maintained to absorb the
variation.
3. To take advantage of economic purchase order size. Placing an order entails
ordering costs like labor, phone calls, typing, postage, etc. It is therefore more
appropriate to order in bulk to minimize frequent orders, which minimizes ordering costs.
Likewise, shipping costs tend to decrease when there is large order, due primarily to the
fact that the per-unit cost is distributed to a larger size or number of unit or item (p. 135).
In the process of maintaining inventory, several costs are incurred by the firm. It
is in managing these costs vis-à-vis that the possible stock-out cost that is central to the
effective and efficient management of inventory. Chopra and Meindl (2001) have
identified such costs:
1. Inventory Holding Cost. It is estimated as the sum of the following
major components, not all of which are applicable to every type of situation. Holding
cost is usually estimated as a percentage of the cost of a product.
Cost of Capital. This cost is frequently the most important component of
holding cost. It is the opportunity cost of capital and is correctly computed by evaluating
the weighted average cost of capital (WACC). This cost takes into account the return
demanded on the firm’s equity and the amount the firm must pay on its debt. These are
weighted by the amount of debt and equity financing the firm has. The formula for the
WACC is as follows:

16
( ) ( )tRED
DMRPRED
EWACC bf −+
+++
= 1*β
Where
• E=amount of equity
• D=amount of debt
• Rf=risk-free rate of return (which is usually in the mid-single digits)
• Β=the firm’s beta
• MRP=market risk premium (which is around the high single digits)
• Rb=rate at which the firm can borrow money (related to its debt rating)
• t=tax rate
Obsolescence (or spoilage) cost estimates the rate at which the value of the
product being stored drops either because the market value of that product drops or
because the product quality deteriorates. The drop rate of value depends on the product
being stored. Inventory of freshly baked bread that can sell for only a day has a high
obsolescence rate. On the other hand, automobile tires can be stored for a considerable
period without considerable loss to value.
Handling Cost. This cost includes the receiving and storage costs that
vary with the volume of the product received. Volume-independent costs that vary with
the number of orders should be included in the order cost. Volume-dependent costs are
generally small, and often the real cost does not change if volume varies within a range.
If the volume is within this range (e.g., the range of inventory a crew of four people can
unload per period), incremental handling cost added to the holding cost is zero.
However, if incremental handling cost is incurred, then handling cost associated with this
additional inventory should be included in the holding cost.
Occupancy Cost. It reflects the incremental change in space cost due to
changing cycle inventory. If the firm is being charge based on the actual number of units
held in storage, the direct occupancy cost results. However, firms often lease or purchase
a fixed amount of space. As long as a marginal change in cycle inventory does not
change the space requirements, the occupancy cost should be considered zero.

17
Occupancy, or space costs, often takes the form of a step function with a sudden increase
in cost when capacity is fully utilized and new space must be acquired.
Miscellaneous Cost. It is composed of other relatively small costs such as
theft, security, damage, tax, and additional insurance charges that may be incurred. It is
important to estimate the incremental change in these costs on changing cycle inventory.
2. Order Cost. It includes all incremental costs associated with placing or
receiving an extra order that are incurred regardless of the size of the order. Components
of order cost include the following:
Buyer Time. This cost is the incremental time of the buyer placing the
extra order and should be included only if the buyer is utilized fully. The incremental
cost of getting an idle buyer to place an order is zero and does not add to order cost.
Electronic ordering can significantly reduce the buyer time to place an order by making
order placement simpler and in some cases automatic.
Transportation Cost. A fixed cost is often incurred regardless of the size
of the order. For instance, the cost of delivery by a truck is the same whether it is fully-
loaded or half-full. There is also a pricing scheme for less than truckload delivery that
includes fixed component that is independent of the quantity being shipped and a variable
component that increases with the quantity being shipped. The fixed component should
be included in the order cost.
Receiving Cost. Any administration work such as purchase order
matching and any effort associated with updating inventory records is considered part of
the receiving cost. They are incurred regardless of the size of the order.
Other Costs. All costs incurred for each order regardless of the volume of
that order should be included in the order cost.
G. INVENTORY MODELS
In dealing with the control of inventory, the most important decisions to be made
are how much of the product needs to be ordered and when the order should be made
(Balakrishnan, Render, & Stair, 2006, p. 12-5). There are several inventory models that

18
provide answers to the two fundamental questions that are often posed to supply chain
managers. For a more detailed discussion of the different inventory models, refer to the
work of Balakrishnan, Render, & Stair (2006). Unfortunately, none of the traditional
inventory models capture the inventory management need of R-RAM warehouse. Take
the case of the classic Economic Order Quantity (EOQ) model that strives to determine
the specific point “R,” at which an order will be placed and the size of that order, “Q,”
based on the following assumptions:
• Demand is known and constant.
• The lead time—the time between the placement of the order and the receipt of the order—is known and constant.
• The receipt of inventory is instantaneous. In other words, the inventory from an order arrives in one batch, at one point in time.
• Quantity discounts are not possible.
• The only variable costs are the ordering cost and the cost of holding or storing inventory over time.
• If orders are placed at the right time, stockouts and shortages can be completely avoided.
The following equation represents the cost structure in EOQ model:
HQSQDDCTC
2++=
Where:
TC=Total annual cost
D=Demand (annual)
C=Cost per unit
Q=Quantity to be ordered
S=Setup cost
R=Reorder Point
L=Lead Time
H=Annual holding and storage cost per unit of average inventory

19
By using calculus, the optimal quantity can be derived and expressed as follows:
HDSQopt
2=
With constant demand and lead-time, no safety stock is needed, thus reorder point
“R” is expressed as:
LdR_
=
Where:
_
d =average daily demand (constant)
L=lead time in days (constant)
However, the R-RAM situation dictates that the lead time and demand are not
constant. This necessitates safety stock in order to offset the inherent variability brought
about by the two variables mentioned. A certain level of protection must be in place to
prevent stock outs. In essence, safety stock is defined as the amount of inventory needed
in addition to the expected demand (Apte et al., 2006, p. 135). The concept of safety
stock assumes that supplies are readily available once it was determined. However, in the
case of R-RAM, supplies arrive at the warehouse in random fashion. Again, this
situation renders the safety stock concept unusable.
H. INVENTORY MANAGEMENT IN CLOSEDLOOP SUPPLY CHAINS
Recent developments in the management of the supply chain have redrawn the
traditional picture of inventory management. It used to be a simple linear structure
wherein goods were being transferred from the manufacturer to the end-users through the
wholesalers and retailers. However, it is being replaced by a more complex structure that
incorporates the upstream flow of goods in the traditional supply chain. The integration
of the upstream flow of goods in the overall supply chain concept is now being called
“closed loop supply chains” (REVLOG, 2008).

20
Consequently, the traditional inventory management models cannot be applied in
managing the inventory in the reverse channel primarily due to the randomness of the
arrival of supplies. (Theirry Salomon, Nunen, & Van Wassenhove, 1995, p. 118).
Fleischmann and Minner (2003) acknowledged the complexity in managing the closed
loop supply chain brought about by the flowing of additional supplies coming from
overstock returns, service parts, and reusable packaging (2003, p. 116). As a result, the
inventory management of the closed loop supply chain necessitates the need to find
models that exploit the value potential of the recoverable resources that flow in the
system. Fleischmann and Minner (2003) also detail an explanation of the different
quantitative approaches to managing inventories in the closed loop supply chain (p. 116).
Although the most simplistic way to deal with this complication is to totally
ignore it until the product returns arrived, such an action runs the risk of excessive stock
levels in the case of high return volumes. Another alternative is to cancel returns against
some of the demand, which is called “netting.” This practice tends to overestimate the
resulting service level by implicitly assuming that the return coincides with the demand,
which is not the case (p. 118).
I. MULTI-PERIOD, SINGLE-ECHELON MODEL IN CLOSED-LOOP SUPPLY CHAIN
The model that is nearly applicable to our work among those presented by
Fleischmann and Minner (2003) is the multi-period, single-echelon model that involves
repeated replenishment during the sales horizon—period of operation—and which
inventory may be carried over from one period to another. A single stock point is also
involved, which results in product returns joining the serviceable inventory immediately.
This process assumes that the returns are reusable and in the same quality when they
enter the forward supply chain.
According to Zheng and Federgruen (1997), this model is similar to conventional
single-item stochastic inventory control models where an (s, S) order policy is known to
be optimal under general conditions, if any unmet demand is backordered (p. 654).
However, the addition of supplies coming from the reverse channel may complicate the

21
situation considerably because such actions can affect the inventory level at multiple
points. Thus, it is no longer accurate to model the problem as a single-dimensional
Markov chain. However, this can be addressed by the assumptions made by Fleischmann
and Kuik (2003) that show an (s, S) order policy remains average cost optimal under the
following conditions:
• Demand and returns are independent.
• The lead time of a potential recovery process does not exceed the regular replenishment lead time.
• Product returns may not be disposed (pp. 25-37).
However, R-RAM can dispose supplies subject to its changing business rules. As
a result, the model may not accurately determine the optimal inventory level of our
closed loop supply chain. Due to the uniqueness of the R-RAM closed loop supply chain
and the limited literature available on Reverse Logistics inventory management model,
the authors are basing their inventory approach on their own heuristics.

22
THIS PAGE INTENTIONALLY LEFT BLANK

23
III. METHODOLOGY
A. INTRODUCTION
A literature review of textbooks on inventory management, DoD and Navy
policies on supply chain management and procedures, Internet-based materials and other
library information were conducted to understand the concept of Reverse Logistics.
From these reviews, we formulated our primary research questions. This section will
identify the step-by-step process of the methodology that will be used to answer the
research questions.
B. METHOD
The entire line item inventory database of the San Diego R-RAM warehouse was
downloaded from the LAWSON inventory management database. A PLSQL10 package,
containing a series of PLSQL procedures and functions, was developed. The actual
process was executed in a batch mode by Ship Class. The job query was then scheduled
using the Oracle scheduler. Primary data was compiled and analyzed using the steps
discussed below.
• The NIINs were loaded into an Oracle table.
• Using these NIINs, all the APLs were obtained from the Oracle version of the Weapons Systems File (WSF). This Oracle database is referred to as the Midtier or the Tier 2. The database is owned by NAVSISA. The Midtier is updated from the WSF on a daily basis—making it very close to “real time.”
• Using the APLs obtained from the Midtier, we compared the APLs to the current ship's configuration for active ships in the 10 ship-classes. The active ships were determined from the Naval Vessel Registry. The current configuration was obtained from CDMD-OA (Configuration Data Managers Database—Open Architecture). CDMD-OA tracks the status and maintenance of naval equipment and their related logistics items (drawings, manuals, etc.) on ships and naval activities around the world. CDMD-OA is an Oracle database that is managed by Naval Sea Logistics Center.
10 PL/SQL (Procedural Language/Structured Query Language) is Oracle Corporation's proprietary
procedural extension to the SQL database language, used in the Oracle database.

24
• When an APL was found in the current configuration of one of the ship classes specified, it was matched against the list of NIINs. If there was a match, then it was considered a “hit” and annotated in the excel file with an “X.”
The 10 classes of ships we analyzed for COSAL applicability include FFG, DD,
DDG, CG, LSD, LPD, PC, MCM, LHA, and LHD. Some of these classes are no longer
in commission or are being phased out. We analyzed the results of the batch queries to
determine:
• How many parts in the R-RAM inventory have an application to a ship in the active Naval Registry?
• How many parts no longer have any application to current and former ships in the registry for disposal via the DRMO
11 program?
• How many parts have an application to ships formerly in the active roster and are now in the service of foreign navies? This will assist our analysis by providing an alternative method of disposal of the “dead” stock or obsolete parts in the R-RAM warehouse through the Foreign Military Sales (FMS) program.
12
C. OBJECTIVE
The results of the PLSQL queries will enable us to answer our primary research
questions on how to increase throughput while simultaneously minimizing inventory and
operating expense (inventory holding costs).
• If a line item in the R-RAM inventory has an application to one or more class of ship in the active US Navy fleet, it will be a candidate to remain in the inventory.
• If a line item is only common to a DD or FF, it will be a candidate to be removed as obsolete stock. The DD and FF ship-classes are no longer in service in the US Navy. Many of these two classes of ships have been sold and are now in the active service of foreign navies. These items are good candidates for disposal via the FMS program to the Allied nations.
11 Defense Reutilization and Marketing Office disposes of excess property received from the military
services. 12 The US Department of Defense's Foreign Military Sales program facilitates sales of US arms,
defense equipment, defense services, and military training to foreign governments. The purchaser does not deal directly with the defense contractor; instead, the Defense Security Cooperation Agency serves as an intermediary, usually handling procurement, logistics and delivery and often providing product support and training.

25
• If a line item has no application to any active or former naval ships due to obsolescence then it will be a candidate for disposal via DRMS.
Periodic reduction in held inventory through disposal of obsolete and excess
spares will reduce warehouse footprint, reduce holding costs, and improve inventory
management.

26
THIS PAGE INTENTIONALLY LEFT BLANK

27
IV. ANALYSIS OF R-RAM SD INVENTORY
A. OVERVIEW
An inventory is an idle resource that possesses economic value (Monks, 1977, p.
325). The beginning FY08 warehouse inventory at the San Diego warehouse is over
25,000 line items valued in excess of $289 million (Hirst, 2007). Figure 2 illustrates the
breakdown of these spares. The breakdowns include $157 million for depot level
repairable parts, $92 million for maintenance assist modules and $40 million in
consumables.
9
www.delreysys.com(858) 874-8992
On-Hand Inventory as of 2 Jan 07.Total: 23,709/$223,379,680.00.
• DLRs/MAMs: 5,879/$172,647,517.00.• Consumables: 17,830/$ 50,732,163.00.
On-Hand Inventory as of 30 Sep 07.Total: 25,139/$289,085,821.00.
• DLRs: 3,556/$157,074,759.00.• MAMs: 2,871/$ 91,788,671.00.• Consumables: 18,367/$ 40,222,389.00.
Inventory Accuracy: 94%.Total Adjustments: 483.Total Records Inventoried: 7,532.
INVENTORY
Figure 2. R-RAM SD Spares Inventory

28
This “gold pile” has resulted in huge savings for CNSF afloat units as requisitions
were filled free of charge. Changes in the order fulfillment process at FISC ensured that
R-RAM warehouses are first screened for any free-issue assets before the normal supply
chain fills any requisition. Improvements in inventory database management and
implementation of Total Asset Visibility (TAV) through the employment of the web-
enabled R-RAM system have resulted in an increase in the volume of business for the
warehouses. And with this increase in the number of requisitions filled, there is an
increase in cost avoidance for the requisitioning Afloat unit. Figure 3 shows that for the
periods FY05 to FY08, the cost avoidance was $98.9 to CNSF’s O&M budget, while
incurring a direct labor cost of $2.6 million. Even if the warehousing and inventory
holding costs are factored in, it is still a substantial return on investment, given extant
fiscal restraints.
Labor Costs vs Cost Avoidance
0
10,000,000
20,000,000
30,000,000
40,000,000
FY 05 FY 06 FY 07 FY 08
Labor Costs
Cos
t Avo
idan
ce
Direct Labor CostCost Avoidance
Figure 3. R-RAM SD Labor Cost vs. Cost Avoidance
Even with an increasing volume of requisitions ordered and filled by R-RAM SD,
the warehouse still carries a huge stockpile of assets. Ship decommissioning and CNSF-
directed offload of excess material aboard surface ships (REMOVE program) ensures
that the warehouse will continually receive spares for warehousing. In the last five fiscal
years, the inventory in the warehouse showed an increasing trend. This inventory will
continue to rise as more ships are nearing the end of their useful life, and weapons
systems are upgraded or come into obsolescence. Figure 4 shows an increasing trend for
spares received for storage at R-RAM SD.

29
Spares Receipts at R-RRAM SD
y = 40151x - 16861
020000400006000080000
100000120000140000
FY06 FY07 FY08
Fiscal Years
Units
of I
ssue
ReceiptsLinear (Receipts)
Figure 4. Spares inventory received by R-RAM SD
B. BREAKDOWN OF CURRENT INVENTORY
The goal of this report is to increase throughput, determine dead stock due to
obsolescence, and reduce inventory footprint by exploring ways to dispose of obsolete
and dead stock. We began our analysis of the results of the PLSQL data queries by using
EXCEL’s sort and “COUNTA” functions to determine the number of ship applications
per NIIN. Table 1 shows an example of a result of a PLSQL query while Figure 5 shows
the following breakdown of ship applications for each NIIN for the database as of April
11, 2008.

30
Table 1. An example of a PLSQL query result
Villanueva- Young- Estrella MBA Report
Inventory Breakdown
• Maintenance Assist Modules (MAMs) 5,814 NIINs/ Valued at $96M
• Depot Level Repairables (DLR) + 9 COG 27,498 NIINs/ Valued at $218M
NIIN Ra nge Depth CG DDG DD FF FFG PC LHA LHD LPD Obsole te MAM 5814 33983 4,162.00 3784 3830 882 2487 1 2301 2144 703 372DLR + 9 COG 27498 133196 12,157.00 13065 13032 7482 10151 997 7850 9598 9981 6469
Figure 5. R-RAM SD Inventory Breakdown
Item Description
Stock On
Hand Standard Price CG DDG DD FF FFG LHA LHD LPD Hcount
16 CHANNEL A,D-D,A 1 10,696.00 X X X 3 ADAPTER CONNECTOR 1 16.52 X X X X 4 ADAPTER CONNECTOR 1 16.52 X X X X 4 AMPLIFIER ASSEMBLY, 2 6,081.00 0 AMPLIFIER DEFLECTIO 12 3,401.00 X X X X X X 6 AMPLIFIER SUBASSEMB 1 6,569.00 X X 2 AMPLIFIER SUBASSEMBLY 1 1,336.00 X X X X X 5 AMPLIFIER SUBASSEMBLY 8 3,114.00 X X X 3 AMPLIFIER SUBASSEMBLY 4 14,721.51 X 1 AMPLIFIER SUBASSEMBLY 6 2,473.00 X X X X X X 6

31
C. OBSOLETE NIINS
Spare parts that did not register a current ship application were considered as
obsolete. Obsolescence could be due to weapons systems upgrade or that they were no
longer installed aboard a ship platform. Figure 6 shows 6,841 line items valued at $31
million that were deemed obsolete. These spares are good candidates for disposal
through the DRMS program.
Villanueva- Young- Estrella MBA Report
Obsolete NIINsNIIN RANGE
372
6469 MAMs DLR/ 9COGDollar Value
$28M
$3M
MAMs DLR/ 9COG
- $$Candidate for disposal
through DRMO
NIIN Depth945
29159
MAMsDLR/ 9COG
Figure 6. Obsolete NIINs
D. SHIP CLASS-DESTROYERS (DD)
We identified spare parts that have application only to the Destroyer class of ships
(DD). The DD-class is no longer in active service of the United States Navy. However,
a number of our allies still maintain this ship class in their naval order of battle.
Continuing to hold these parts in the R-RAM SD warehouse provides no value to CNSF
since the probability of having a demand is zero. Moreover, inventory-holding cost is
incurred without benefit in return. Figure 7 shows that there are 543 line items valued at

32
$4.6 million that can be considered as dead stock. These spares can be sold to foreign
navies subject to the rules of the Foreign Military Sales program.
Villanueva- Young- Estrella MBA Report
Applicable only on DD-class
Dollar Value
$3.5M$1.1M
MAMs DLR/ 9COG
NIIN Range 116
427 MAMs DLR/ 9 COG
$$$$Candidate for disposal
through FMS
Figure 7. NIINs Applicable to DD-class only
E. SHIP CLASS-FAST FRIGATE (FF)
We also identified spare parts that have application only to the Fast Frigate class
of ships (FF). The FF-class is no longer in active service of the United States Navy.
However, a number of our allies still maintain this ship class in their naval registry. As in
the DD inventory, continuing to hold these parts in the R-RAM SD warehouse provides
no value to CNSF due to the zero probability of demand. Figure 8 shows that there are
372 line items, valued at $2.2 million that can be considered as dead stock. These spares
can be sold to foreign navies subject to the rules of the Foreign Military Sales program.

33
Villanueva- Young- Estrella MBA Report
Applicable only on FF-class
Dollar Value $2.1M
$45KMAMs DLR/ 9 COG
NIIN Range 20
352 MAMs DLR/ 9 COG
$$$$Candidate for disposal
through FMS
Figure 8. NIINs Applicable to FF-class only
Our PLSQL query also resulted in the identification of 37 line items valued at
over $350,000 that can be considered dead stock, as shown by Figure 9. These spares
can be sold to foreign navies subject to the rules of the Foreign Military Sales program.
Villanueva- Young- Estrella MBA Report
Applicable only on both DD and FF-class
Dollar Value
$
$361K
MAMs DLR/ 9COG
NIIN Range 3
34 MAMs DLR/ 9 COG
$$$$Candidate for disposal
through FMS
Figure 9. NIINs Applicable to DD-class and FF-class only

34
F. INVENTORY MANAGEMENT BUSINESS RULES
Prior to May 2007, receipt and offload of ship excess repair parts to the
warehouse were subject to the following inventory management control criteria:
• Offload material from non-SAC 207(BP-28) decommissioning ships or ships with TYCOM authority to offload material that is no longer applicable to an APL
• The criterion for induction into R-RAM inventory is “A” condition HM&E/MAM/DLR extended money value (EMV) of less than $100
• No classified material spares
• No hazardous material/ waste
• Dollar-(value) based inventory
In addition, whenever a ship is decommissioned, all spares onboard were
offloaded to R-RAM, regardless of whether the spares are obsolete or have no demand.
These obsolete and no-demand parts increased inventory and operational expense
(holding costs), while not necessarily increasing throughput. Furthermore, these parts
have contributed to the growth of the “gold pile,” without providing any real value to
CNSF.
In its efforts to improve inventory control, CNSF N41 redefined the inventory
criteria to Demand Base vice Value Base. DRS&T, the contractor, established and
implemented these tailored business rules. The new rules went into effect June 2007.
The new criteria for receipt and offload of spares are the following:
• Material must be active Navy items
• Material will be retained in R-RAM inventory in a quantity up to four (4) times the average monthly demand (AMD) of the Navy’s Global Demand File (GDF)
• No classified material
• No hazardous material
• All Maintenance Assist Modules (MAMs) will be considered serviceable, A-condition unless cracked, bent or broken
• All Depot Level Repairables (DLRs) will be packed per the NAVSUP Publication P700

35
These changes in inventory criteria resulted in an almost 50% reduction in cost
avoidance from FY06 to FY07. However, it should be noted that FY07 cost avoidance
values include both the savings under the “old” and “new” business rules. CNSF N41
and the contractor attribute the reduction to a change in business rules, rather than a
decrease in demand. We believed that this reduction is not due to the change in business
rules, but rather, due to a decrease in demand. If anything, the effect of a demand-based
inventory system would be an increase in issues (requisitions filled) because the spares
that will be inducted into the R-RAM system have sufficient demand, thus increasing the
total cost avoidance. The effects of the changes will be in the range and depth of NIINs
that would be carried in the R-RAM inventory. The cost avoidance for FY08 showed
that the savings were more or less in line with previous fiscal years.

36
THIS PAGE INTENTIONALLY LEFT BLANK

37
V. RECOMMENDATIONS AND CONCLUSIONS
A. INVENTORY
We recommend reducing inventory footprint and inventory holding costs by
disposing dead stock due to obsolescence. One problem of inventory management is how
to balance the advantages of having inventories to satisfy demand and the inventory
holding costs. Our analysis of FY08 beginning inventory indicates that 6,841 line items
valued at $31 million can be safely eliminated from stock (27% reduction in footprint).
• We recommend the disposal of 6,841 line items valued at $31 million through the Defense Reutilization Marketing Service (DRMS). These parts are obsolete. CNSF will save overhead and carrying costs.
• We recommend the disposal of 952 line items valued at $7.1 million through the Foreign Military Sales program. Sale of these assets would be subject to DoD and DoN policies. We recommend CNSF pursue this approach and possibly receive some remuneration from sales, vice disposal through DRMS.
• We recognized that since the publication of this report the R-RAM inventory have changed. Some of the parts we have identified as obsolete and no-demand might have been turned into DRMO by now. However, our methodology still applies to current and future inventory at the San Diego warehouse and at other R-RAM sites.
• In the course of our research of the R-RAM inventory, we determined that the typical industry inventory management controls and models are not applicable. Inventory controls such as economic order quantity (EOQ) and safety stock, to name a few, cannot be applied because of very high levels of supply and demand uncertainty, military-unique parts that are no longer in production but may still have demand in the future, and cost structure of the parts (received and issued for free).
We recognized the current contractor’s proactive efforts in reducing inventory
footprint by changing stocking criteria and by regular DRMS disposal. On the question
of what is the right stock level, we recommend balancing the ideal stock level to meet
uncertain demand from ships with the inventory holding cost vis-à-vis the cost of stock-
out and the cost of producing or procuring a new item. Because regular inventory control
theories such as the economic order quantity are irrelevant in the R-RAM concept,
thedecision on the depth for any range of inventory is a quantitative and qualitative

38
decision by N41, based on an acceptable service level, demand history and trade-offs.
We recommend a study be undertaken in the future to determine the ideal stock level.
In addition, we recommend increasing the frequency of generating ZI217-BGJ
(parts turned-in to DRMO transactions). This will aid in reducing inventory footprint by
the regular disposal of dead stock and obsolete items.
While there is a tangible gain in doing FTR/FTE (FY08 credits to CNSF was $1.4
million), it should be noted that with the new demand-based inventory system, the
spares—technically—have sufficient demand. Selling it to ICP at less than the standard
price, puts the operating forces at a financial disadvantage by having to procure the part
at standard price from ICP, whereas before it would have been free from R-RAM. We
recommend selective use of FTR/FTE/MTIS turn-ins. Spares with on hand quantities in
excess of established depth are good candidates for FTR/FTE.
B. BUSINESS RULES
The results of cost avoidance for the period July to September of FY07 and FY08
under the new business rules seemed to indicate no noticeable change when compared to
results under the old business rules. A couple more years of operating under these new
rules would provide sufficient data for analysis. We believe that the change from value-
based inventory to demand-based system is the right step in inventory management. The
change will ensure that only parts with active demand will be stored at the warehouse. It
is a transformational approach to the positioning/use of maritime spares that optimizes
spares investment and maintains afloat supply readiness with acceptable risk.
C. WAREHOUSE MANAGEMENT
There is an ongoing discussion whether the warehouse is within CNSF N41’s core
competency. We believe that maintaining the warehouse fits within N41’s role of
organizing, training, and equipping operating forces. The cost avoidance and the
resulting huge savings in the O & M account, is just one value-added benefit to CNSF,
given extant fiscal restraints. Another, more important value-added is logistics readiness
and weapon system operational availability (Ao). The lead-time reduction (lower

39
ACWT) from RFI stocks at the warehouses contribute to lower maintenance down time
(MDT). The ability to quickly fill customer requisitions from local assets contributes to
high operational readiness. We recommend CNSF retain this capability.
In addition, we recommend further study on the merits of physical consolidation
of the warehouses. Consolidation will further reduce operating expenses, risks pooling,
streamline operations, and allow for negotiations for one global contract. Consolidating
physical assets into the major fleet-concentration areas where a majority of requisitions
originate from, such as San Diego and Norfolk, should be explored. However such
consolidation should be balanced with the expected increase in transportation costs, as
well as a possible reduction in service level (ACWT) in areas losing a R-RAM site.

40
THIS PAGE INTENTIONALLY LEFT BLANK

41
LIST OF REFERENCES
Amini, M. M., Retszaff-Robert, D., & Bienstock, C.C. (2005). Designing a reverse logistics operations for short cycle time repair services. International Journal of Production Economics, 96(3), 367-380.
Apte, U. M., Aquilano, N. J., Jacobs, F.R., Cohen, M.A., Chase, R. B, Schroeder, R. G.,
Fitzsimmons, J. A. & Fitzsimmons M. A.(2006). Operations management. McGraw-Hill. New York.
Aten, H. J. (1901). History of the 85th, Illinois volunteer infantry. Kansas: Hiawatha
Publishing. Balakrishnan, N., Render, B., & Stair, R. (2006). Managerial decision making with
spreadsheet. Prentice Hall. Beltran, L. S. (2002). Reverse logistics: Current trends and practices. Logistics Spectrum,
36(2), 4. Carter, C. R. (1998). Reverse logistics: A review of the literature and framework for
future investigation. Journal of Business Logistics, 19(1), 1. Chopra, S., & Meindl, P. (2001). Supply chain management: Strategy, planning and
operations. Upper Saddle River, NJ: Prentice-Hall, Inc. Defense Logistics Agency. (2008). Defense Logistics Agency. Retrieved June 16, 2008,
from www.dla.mil De Vore, J.W. (2004). Reverse logistics: Has the implementation of reverse logistics met
the objectives of air mobility command. Wright-Patterson Air Force Base, OH: Air Force Institute of Technology.
Diener, D., Pelz, E., Lackey, A., Blake, D. J., & Vaidyanathan, K. (2004). Value recovery
from the reverse logistics pipeline. Santa Monica, CA: RAND Corporation. Ferguson, N., & Browne, J. (2002). Issues in end-of-life product recovery and reverse
logistics. Production, Planning, & Control, 12(5), 536. Fleischmann, M. (2001). Quantitative models for reverse logistics. Berlin: Springer. Fleischmann, M., & Kuik, R. (2003). On optimal inventory control with independent
stochastic item returns. European Journal of Operational Research. 151(1), 25-37.
42
Fleischmann, M., & Minner, S. (2003). Inventory management in closed loop supply chain. Supply Chain Management and Reverse Logistics. Berlin: Springer.
Hirst, J. (2007, December 10). R-RAM warehouse year end report. Unpublished
PowerPoint presentation. CNSF Force Supply meeting, San Diego, CA. Mahadevan, B., Pyke, D. F. & Fleischmann, M. (2003). Periodic review, push inventory
policies for remanufacturing. European Journal of Operational Research, 151(3), 536-551.
Moinzadeh, K. (1997). Replenishment and stocking policies for inventory systems with
random deal offerings. Management Science, 43, 334-342. Monks, J. G. (1977). Operations management: Theory and problems. New York:
McGraw-Hill. Naval Supply Systems Command. (2008). Our team: Naval supply headquarters logistics
systems. Retrieved 30 May 2008, from https://www.navsup.navy.mil/navsup/ourteam/navsuphq/04/logistics_systems
O’Brien, M. (2008, May 21). [E-mail correspondence with researchers]. Naval Supply Systems Publication. (1997). NAVSUP P-485 Naval Supply Procedures
Vol II Appendix 2. REVLOG (2008): Revlog – The European Working Group on Reverse Logistics.
Retrieved June 16, 2008, from www.fbk.eur.nl/OZ/REVLOG Rogers, D. S., & Tibben-Lembke, R. S. (1999). Going Backwards: Reverse logistics
trends and practices. Reverse Logistics Executive Council, Pittsburgh, PA, p. 2. Rogers, D. S., & Tibben-Lembke, R. S. (2001). An examination of reverse logistics
practices. Journal of Business Logistics, 22(2), 1. Rogers, D. S, & Tibben-Lembke, R. S. (2002). Differences between forward and reverse
logistics in a retail environment. Supply Chain Management: An International Journal, 7(5), 275.
Sokolowsky, J. W. (1996). The role of union logistics in the Carolina Campaign of 1865.
Fort Leavenworth, Kansas. Army Command and General Staff College. Srivastava, S. K. (2008). Network design for reverse logistics. International Journal of
Management Science, 36, 535.

43
Stevenson, E., Toussaint, C. A., & Edwards, M. A. (2005). A Review of Reverse Logistics and Depot Level Repairable Tracking in the United States Navy. Monterey, CA, Naval Postgraduate School.
Stock, J. R. (1992). Reverse logistics. Oak Brook, Illinois: Council of Logistics
Management. Stock, J. R. (1998). Development and implementation of reverse logistics programs.
Council of Logistics Management. Theirry, M., Salomon, M., Nunen, J. V., & Van Wassenhove, L. (1995). Strategic issues
in product recovery management. California Management Review, 37(2), 118. Zheng, Y., & Federgruen, A. (1997). Finding optimal (s, S) policies is about as simple as
evaluating a single policy. Operations Research, 39, 654-665.

44
THIS PAGE INTENTIONALLY LEFT BLANK

45
INITIAL DISTRIBUTION LIST
1. Defense Technical Information Center Ft. Belvoir, VA 2. Dudley Knox Library Naval Postgraduate School Monterey, CA 3. Professor Keebom Kang Naval Postgraduate School Monterey, CA 4. Professor Uday Apte Naval Postgraduate School Monterey, CA 5. CDR Richard Nalwasky, SC, USN Naval Postgraduate School Monterey, CA 6. LCDR Nolasco Villanueva, SC, USN USS Boxer LHD-4 San Diego, CA 7. LCDR Jeff Young, SC, USN Colorado Springs, CO 8. MAJ Dennis Estrella, PAF Headquarters, Philippine Air Force Manila, Philippines