naval postgraduate school - defense …. performing organization name(s) and address(es) naval...
TRANSCRIPT

NAVAL
POSTGRADUATE SCHOOL
MONTEREY, CALIFORNIA
THESIS
Approved for public release; distribution is unlimited
ENHANCING THE OPERATIONAL EFFECTIVENESS OF THE GROUND-BASED OPERATIONAL SURVEILLANCE
SYSTEM (G-BOSS)
by
William D. Midgette
June 2008
Thesis Advisor: Thomas W. Lucas Co-Advisor: Doug Burton Second Reader: Sergio Posadas

THIS PAGE INTENTIONALLY LEFT BLANK

i
REPORT DOCUMENTATION PAGE Form Approved OMB No. 0704-0188 Public reporting burden for this collection of information is estimated to average 1 hour per response, including the time for reviewing instruction, searching existing data sources, gathering and maintaining the data needed, and completing and reviewing the collection of information. Send comments regarding this burden estimate or any other aspect of this collection of information, including suggestions for reducing this burden, to Washington headquarters Services, Directorate for Information Operations and Reports, 1215 Jefferson Davis Highway, Suite 1204, Arlington, VA 22202-4302, and to the Office of Management and Budget, Paperwork Reduction Project (0704-0188) Washington DC 20503. 1. AGENCY USE ONLY (Leave blank)
2. REPORT DATE June 2008
3. REPORT TYPE AND DATES COVERED Master’s Thesis
4. TITLE AND SUBTITLE Enhancing the Operational Effectiveness of the Ground-Based Operational Surveillance System (G-BOSS) 6. AUTHOR(S) William D. Midgette
5. FUNDING NUMBERS
7. PERFORMING ORGANIZATION NAME(S) AND ADDRESS(ES) Naval Postgraduate School Monterey, CA 93943-5000
8. PERFORMING ORGANIZATION REPORT NUMBER
9. SPONSORING /MONITORING AGENCY NAME(S) AND ADDRESS(ES) N/A
10. SPONSORING/MONITORING AGENCY REPORT NUMBER
11. SUPPLEMENTARY NOTES The views expressed in this thesis are those of the author and do not reflect the official policy or position of the Department of Defense or the U.S. Government. 12a. DISTRIBUTION / AVAILABILITY STATEMENT Approved for public release; distribution is unlimited
12b. DISTRIBUTION CODE A
13. ABSTRACT (maximum 200 words)
The majority of casualties in the ongoing conflicts in Iraq and Afghanistan are due to improvised explosive devices (IEDs). To counter this threat, the Marine Corps directed that a persistent surveillance capability be identified and fielded as soon as possible. As a result, the development and fielding of the Ground Based Operational Surveillance System (G-BOSS) occurred rapidly. G-BOSS consists of a tower, multiple cameras, and a combat operations center (COC). Today, scores of these systems are in use. However, minimal guidance has been provided to operators on effective techniques, tactics, and procedures (TTPs). Furthermore, the benefits of adding additional sensors to G-BOSS and networking multiple systems are not clear.
This research investigates these issues through the use of an agent-based simulation. Specifically, thousands of computational experiments, utilizing a state-of-the-art experimental design, were run on a scenario based on concurrent live developmental tests at 29 Palms by the Marine Corps Operational Test and Evaluation Activity (MCOTEA). The experiments assessed the ability of the system to correctly classify objects (e.g., snipers, IED emplacement, and mortar teams, as well as neutrals and friendly forces) over a variety of enemy actions, G-BOSS configurations, and tactical choices. The results indicate that the most critical factor in determining the level of situational awareness provided by G-BOSS is, by far, placement of the towers. Moreover, little benefit is seen in coordinating the towers and COCs unless motion detection radars are used. With use of the motion detection radar, the synchronization of multiple systems dramatically enhances the overall performance of G-BOSS.
15. NUMBER OF PAGES
70
14. SUBJECT TERMS Improvised Explosive Device (IED), Simulation, Design of Experiments (DOE), Ground Based Operational Surveillance System (G-BOSS)
16. PRICE CODE
17. SECURITY CLASSIFICATION OF REPORT
Unclassified
18. SECURITY CLASSIFICATION OF THIS PAGE
Unclassified
19. SECURITY CLASSIFICATION OF ABSTRACT
Unclassified
20. LIMITATION OF ABSTRACT
UU NSN 7540-01-280-5500 Standard Form 298 (Rev. 2-89) Prescribed by ANSI Std. 239-18

ii
THIS PAGE INTENTIONALLY LEFT BLANK

iii
Approved for public release; distribution is unlimited
ENHANCING THE OPERATIONAL EFFECTIVENESS OF THE GROUND-BASED OPERATIONAL SURVEILLANCE SYSTEM (G-BOSS)
William D. Midgette
Captain, United States Marine Corps B.S., Auburn University, 1999
Submitted in partial fulfillment of the requirements for the degree of
MASTER OF SCIENCE IN OPERATIONS RESEARCH
from the
NAVAL POSTGRADUATE SCHOOL June 2008
Author: William D. Midgette
Approved by: Thomas W. Lucas Thesis Advisor
Doug Burton Co-Advisor
Sergio Posadas Second Reader
James N. Eagle Chairman, Department of Operations Research

iv
THIS PAGE INTENTIONALLY LEFT BLANK

v
ABSTRACT
The majority of casualties in the ongoing conflicts in Iraq and Afghanistan are
due to improvised explosive devices (IEDs). To counter this threat, the Marine Corps
directed that a persistent surveillance capability be identified and fielded as soon as
possible. As a result, the development and fielding of the Ground Based Operational
Surveillance System (G-BOSS) occurred rapidly. G-BOSS consists of a tower, multiple
cameras, and a combat operations center (COC). Today, scores of these systems are in
use. However, minimal guidance has been provided to operators on effective techniques,
tactics, and procedures (TTPs). Furthermore, the benefits of adding additional sensors to
G-BOSS and networking multiple systems are not clear.
This research investigates these issues through the use of an agent-based
simulation. Specifically, thousands of computational experiments, utilizing a
state-of-the-art experimental design, were run on a scenario based on concurrent live
developmental tests at 29 Palms by the Marine Corps Operational Test and Evaluation
Activity (MCOTEA). The experiments assessed the ability of the system to correctly
classify objects (e.g., snipers, IED emplacement, and mortar teams, as well as neutrals
and friendly forces) over a variety of enemy actions, G-BOSS configurations, and tactical
choices. The results indicate that the most critical factor in determining the level of
situational awareness provided by G-BOSS is, by far, placement of the towers.
Moreover, little benefit is seen in coordinating the towers and COCs unless motion
detection radars are used. With use of the motion detection radar, the synchronization of
multiple systems dramatically enhances the overall performance of G-BOSS.

vi
THIS PAGE INTENTIONALLY LEFT BLANK

vii
THESIS DISCLAIMER
The reader is cautioned that the computer programs presented in this research may
not have been exercised for all cases of interest. While every effort has been made,
within the time available, to ensure that the programs are free of computational and
logical errors, they cannot be considered validated. Any application of these programs
without additional verification is at the risk of the user.

viii
THIS PAGE INTENTIONALLY LEFT BLANK

ix
TABLE OF CONTENTS
I. INTRODUCTION........................................................................................................1 A. MOTIVATION ................................................................................................1 B. THE PROBLEM..............................................................................................3 C. PURPOSE.........................................................................................................4 D. RESEARCH QUESTIONS.............................................................................5 E. METHODOLOGY ..........................................................................................5 F. THESIS ORGANIZATION............................................................................5
II. MODEL DEVELOPMENT ........................................................................................7 A. G-BOSS TEST OVERVIEW..........................................................................7
1. Test Location ........................................................................................8 2. Test Equipment ....................................................................................9 3. Test Architecture .................................................................................9 4. Situational Awareness (SA) Trial .....................................................10
B. THE MAP AWARE NON-UNIFORM AUTOMATA (MANA) COMBAT SIMULATION TOOL................................................................11 1. Why MANA?......................................................................................12
C. CHARACTERISTICS OF THE SIMULATION MODEL .......................12 1. Goal .....................................................................................................12 2. Scale and Terrain...............................................................................13 3. Agent Descriptions .............................................................................15
a. The Refueler Agent Class .......................................................15 4. Red Agents (Hostile Role Players)....................................................15
a. H-ShovelIED...........................................................................16 b. H-RifleScope ...........................................................................16
5. Blue Agents (Friendly Role Players) ................................................17 a. F-RifleScope............................................................................17 b. F(Friendlies) ...........................................................................17
6. Neutral Agents (Neutral Role Players) ............................................17 a. N(Neutrals)..............................................................................17
7. Towers 1 and 2 ...................................................................................17 a. Tower 1 and Tower 2 ..............................................................18
8. Towers 3 and 4 ...................................................................................18 a. Tower 3 and Tower 4 ..............................................................18
9. COC 1 and COC 2 .............................................................................19 a. COC 1 ......................................................................................19 b. COC 2 ......................................................................................19
III. EXPERIMENTAL DESIGN.....................................................................................21 A. MEASURE OF EFFECTIVENESS .............................................................21 B. EXPERIMENT FACTORS ..........................................................................21
1. G-BOSS Configuration Factors........................................................22 a. MSTAR or No MSTAR...........................................................22

x
b. Number of COC Monitors ......................................................22 c. Distance Between Pairs of Towers .........................................22
2. G-BOSS Performance Factors..........................................................23 a. Camera 1 P(Classification).....................................................23 b. Camera 1 Classification Range ..............................................23 c. Camera 2 P(Classification).....................................................23 d. Camera 2 Classification Range ..............................................23 e. Tower Slew Rate......................................................................23 f. Latency of Communication to COC .......................................23 g. Reliability of Communication to COC ...................................23
3. Battle Space Factors ..........................................................................24 a. Number of Role-players per Team .........................................24 b. Role-player Stealth..................................................................24 c. Role-player Speed....................................................................24
C. NEARLY ORTHOGONAL LATIN HYPERCUBES (NOLH).................24
IV. DATA ANALYSIS .....................................................................................................27 A. DATA SUMMARY........................................................................................27 B. SA CRITICAL FACTORS ...........................................................................28
1. Stepwise Regression...........................................................................29 2. Regression Trees ................................................................................35
C. COC COORDINATION VERSUS STAND-ALONE COMPARISONS............................................................................................37 1. Coordinated versus Stand-Alone Configurations without
MSTAR ...............................................................................................37 2. Coordinated versus Stand-alone Configurations with MSTAR....40
V. CONCLUSIONS ........................................................................................................43 A. ANALYSIS INSIGHTS.................................................................................43 B. FOLLOW-ON WORK ..................................................................................44
LIST OF REFERENCES......................................................................................................45
INITIAL DISTRIBUTION LIST .........................................................................................47

xi
LIST OF FIGURES
Figure ES-1. MANA model screen shot. ........................................................................xx Figure 1. G-BOSS operational construct.....................................................................2 Figure 2. G-BOSS components from l-r: RAID tower, T-3000, Star SAFIRE IIIFP,
RGS, MSTAR. (from MCOTEA’s G-BOSS Detailed Assessment Plan, April 2008 [Best viewed in color]) .............................................................2
Figure 3. G-BOSS test site. (from MCOTEA’s G-BOSS Detailed Assessment Plan, April 2008 [Best viewed in color]) ..............................................................8
Figure 4. MCOTEA test architecture. .........................................................................9 Figure 5. The elevation and terrain files used by MANA were derived from the
terrain in the MCOTEA scenario. [Best viewed in color] ........................14 Figure 6. The characteristics of the colors in the terrain file for the MANA model
used in this research. (from MANA 4.01.1) ..............................................15 Figure 7. MANA Model Screen Shot. [Best viewed in color] .................................16 Figure 8. NOLH Design Spreadsheet........................................................................25 Figure 9. Scatterplot matrix of experiment factors....................................................25 Figure 10. Experiment factor pairwise correlation matrix. .........................................26 Figure 11. Data summary for the Mean-Percent-Correct-Identifications MOE.........28 Figure 12. Data summary for the Mean-IED-Detected MOE. ..................................28 Figure 13. Predicted versus actual Mean-Percent-Correct-Identifications and
associated residual plot verifying the absence of pattern in the residuals. 30 Figure 14. The R-squared value and significance of the stepwise regression model..30 Figure 15. Scaled estimates of the preferred stepwise regression used in the study.
The t-ratio column explains the relationship between the factor and the MOE...........................................................................................................32
Figure 16. Sum of squares of the preferred stepwise regression used in the study. The sum of squares column explains the proportion of variance explained by each factor in the stepwise regression model.............................................33
Figure 17. Interaction plots of four critical factors that determine the level of SA. ...34 Figure 18. Contour plot of interaction between Tower Slew Rate and Role-player
Stealth, and their effect on the MOE. ........................................................35 Figure 19. Regression tree split on the raw data by Mean-Percent-Correct-
Identifications of Correct Identifications. ..................................................36 Figure 20. Wilcoxon SignedRank Test results for coordinated G-BOSS configuration
against stand-alone G-BOSS configuration for the Mean-Percent-Correct-Identification MOE. (No MSTAR)...........................................................39
Figure 21. Wilcoxon Signed Rank Test results for coordinated G-BOSS configuration against stand-alone G-BOSS configuration for the Mean-IED-Detected MOE. (No MSTAR) ................................................................................40
Figure 22. Wilcoxon Signed Rank Test results for coordinated G-BOSS configuration against stand-alone G-BOSS configuration (with MSTAR). ....................41

xii
Figure 23. Wilcoxon Signed Rank Test results for coordinated G-BOSS configuration against stand-alone G-BOSS configuration for the Mean-IED-Detected MOE. (With MSTAR) .............................................................................42

xiii
LIST OF TABLES
Table 1. Data requirements for MCOTEA’s SA value model. ..................................8 Table 2. SA test trial role-player categories.............................................................11 Table 3. Variable factors in the experimental design. G-BOSS configuration
factors are in yellow, G-BOSS performance factors are in white, and Battle space environment factors are in gray. [Best viewed in color] ......22

xiv
THIS PAGE INTENTIONALLY LEFT BLANK

xv
LIST OF SYMBOLS, ACRONYMS, AND ABBREVIATIONS
AOR Area of Responsibility CDD Capabilities Development Directorate CDIB Capabilities Development Integration Board CART Classification and Regression Tree COC Combat Operations Center C2 Command and Control C-IED Counter-Improvised Explosive Devices Technology Directorate DTA Defense Technology Agency DCRI Detection, Classification, Recognition and Identification FoS Family of Systems G-BOSS Ground Based Operational Surveillance System GCS Ground Control Station GUI Graphical User Interface IED Improvised Explosive Device IDF Indirect Fire ISR Intelligence, Surveillance and Reconnaissance JIEDDO Joint Improvised Explosive Device Defeat Organization KIA Killed in Action MSTAR Man-Portable Surveillance and Target Acquisition Radar MANA Map Aware Non-Uniform Automata MAGTF Marine Air Ground Task Force MCOTEA Marine Corps Operational Test and Evaluation Activity MCCDC Marine Corps Combat Development Command MCISR-E Marine Corps Intelligence Surveillance and Reconnaissance-
Enterprise MCSC Marine Corps Systems Command MOE Measure of Effectiveness NGA National Geospatial-Intelligence Agency NPS Naval Postgraduate School NOLH Nearly Orthogonal Latin Hypercube NZDF New Zealand Defense Force OIF Operation Iraqi Freedom RAID Rapid Aerostat Initial Deployment SEED Simulation Experiments and Efficient Design SA Situational Awareness TTP Tactics, Techniques and Procedures UAS Unmanned Aircraft Systems VOIP Voice Over Internet Protocol WIA Wounded in Action

xvi
THIS PAGE INTENTIONALLY LEFT BLANK

xvii
ACKNOWLEDGMENTS
First and foremost, I want to thank my beautiful wife Angela. The quality of my
thesis is is a direct result of your love, patience, understanding and support. Words will
not and can not express the love and gratitude I have for you.
I want to thank Professor Tom Lucas, Commander Doug Burton, LtCol Sergio
Posadas and Mary McDonald. These four incredible people kept me on track and never
let me lose focus. Had it not been for their support, this thesis would not have been
possible. I appreciate your efforts and I will never forget it. Last, but not least, I want to
thank Colonel Ed Lesnowicz, USMC (retired) for his “motivational” pep talks, and
SEMPER FIDELIS.

xviii
THIS PAGE INTENTIONALLY LEFT BLANK

xix
EXECUTIVE SUMMARY
The majority of casualties in the ongoing conflicts in Iraq and Afghanistan are
due to improvised explosive devices (IEDs). To counter this threat, coalition forces have
directed that a persistent surveillance capability be identified and fielded as soon as
possible. As a result, the Ground Based Operational Surveillance System (G-BOSS) was
developed and fielded. G-BOSS consists of a tower, multiple cameras, and combat
operations centers (COCs). Today, hundreds of these systems are in use. However,
minimal guidance has been provided to operators on effective techniques, tactics, and
procedures (TTPs). Furthermore, the services are unsure of the benefits of adding
additional sensors to G-BOSS and networking multiple systems.
This research provides Coalition forces with analytical support for initial and
further development of TTPs, modernization efforts, and operational employment for
G-BOSS. The analysis is guided by three questions from the Marine Corps Operational
Test and Evaluation Activity (MCOTEA), who is tasked with testing G-BOSS in order to
enhance the operational effectiveness of the system. The questions are:
• What critical factors determine the level of situational awareness (SA) provided by G-BOSS?
• Does coordination via the COC improve the effectiveness of G-BOSS?
• Does use of motion detection radar improve the effectiveness of G-BOSS?
This thesis uses agent-based simulation, state-of-the-art design of experiments, and
graphical and statistical analysis methods to investigate these questions.
The goal of the simulation is to measure the level of SA provided by G-BOSS.
The measures of effectiveness (MOEs) associated with this goal are the proportion of
correct classifications of friendly, hostile and neutral role players per test trial. An
additional MOE is whether or not the IED emplacers were detected. Factors of interest
include, but are not limited to: the slew rate of G-BOSS, the distance between the pairs
of Rapid Aerostat Initial Deployment (RAID) towers, the configuration of the COCs
(coordinated or stand-alone), and the presence of Man-Portable Surveillance and Target
Acquisition Radar (MSTAR) with the G-BOSS sensors.

xx
The simulated scenario in this study models a live developmental test conducted
by the Marine Corps Operational Test and Evaluation Activity (MCOTEA) on the
capabilities and limitations of G-BOSS conducted in April 2008 in 29 Palms, California.
The scenario used in this thesis is test trial #15, an IED scenario conducted at night. Trial
#15 includes an IED-emplacement team, composed of three hostile role players
simulating IED emplacement at a predetermined time and location. The remaining
neutral, friendly and hostile forces participating in the trial (also consisting of three
members each) maneuver through the test area while G-BOSS operators use the system
to determine hostile acts or intent. Figure ES-1 shows the terrain and agent depictions
used in the simulation model.
7
Red Agents are Hostile Sniper team and/or IED Team
Blue Agents are Marines on patrol
Green Agents are Neutrals
Purple Agents are COC1 / T1 / T2
Yellow Agents are COC2 / T3 / T4
Figure ES-1. MANA model screen shot.
Map Aware Non-Uniform Automata (MANA) is the modeling environment used
in this thesis. MANA represents the key temporal and spatial elements of this tactical
scenario and facilitates quickly constructing “medium-resolution” simulations that can be
broadly explored using sophisticated design of experiments and computing clusters.
Nearly Orthogonal Latin Hypercubes (NOLHs) and data farming enabled an analysis of a
large set of possibilities. The conclusions in the research are based on over twenty

xxi
thousand simulated tests with varying threats (i.e., snipers and IED emplacement teams)
neutrals and friendly forces over a variety of enemy actions, G-BOSS configurations, and
tactical choices.
The insights gained in this analysis are:
• The positioning of the towers is the most critical factor associated with enhancing the operational effectiveness of G-BOSS. A distance of 4 km between G-BOSS towers results in a proportion of correct identifications of 0.91 while a distance of 2 km results in a proportion of 0.53. When G-BOSS is employed in open terrain, more dispersion results in better performance.
• The stealth of the role-players has a significant effect on the proportion of correct identifications. This result is intuitive and helps validate the model, since snipers and IED emplacers tend to use stealth to mask their hostile acts or intent. Increased training of G-BOSS operators’ level of vigilance is a countermeasure to mitigate enemy stealth.
• Without the presence of MSTAR, the coordinated G-BOSS configuration produces a slightly larger proportion of correct identifications than the stand-alone G-BOSS configuration. The coordinated G-BOSS configuration results in an overall proportion of correct identification of 0.51, while the stand-alone G-BOSS configuration results in an overall proportion of correct identification of 0.49. The results of the comparison between the G-BOSS configurations are not practically significant. This is based on the marginal increase of approximately two percentage points between the coordinated G-BOSS configuration and the stand-alone G-BOSS configuration. Further, this finding answers the question of underutilization: Stand-alone employment of G-BOSS is nearly as effective as a coordinated employment of G-BOSS without MSTAR.
• With MSTAR, the coordinated G-BOSS configuration produces a significantly larger proportion of correct identifications than what the stand-alone configuration produces. The coordinated G-BOSS configuration results in an overall proportion of correct identifications of 0.71 and the stand-alone configuration results in an overall proportion of correct identifications of 0.47. This result is practically and statistically significant. MSTAR facilitates the detection of more agents. MSTAR coupled with data fusion at the COC affords commanders an enhanced capability.
• The emplacement of the IED was detected in 76% of all of the simulation excursions conducted (which varied 13 factors associated with G-BOSS or the role-players). This is promising since G-BOSS’s mission is to counter the threat of IEDs.

1
I. INTRODUCTION
A. MOTIVATION
The improvised explosive device (IED) has proven effective against Marines in
Operation Iraqi Freedom (OIF). As a result, the largest number of Marines killed in
action (KIA) and/or wounded in action (WIA) during OIF is attributed to the IED. In
addition to IEDs, insurgents have expanded their range of tactics, techniques, and
procedures (TTPs) against Marine forces in Iraq with sniper attacks and hit and run
indirect fire (IDF) teams. The potential to cause high-density, melodramatic attacks to
test the resolve of our nation in fighting the Global War on Terror is the central value of
the IED to insurgents.
In an attempt to mitigate further casualties by these popular tactics, the
Marine Corps Combat Development Command (MCCDC), Capabilities Development
Directorate (CDD), and Capabilities Development Integration Board (CDIB), under the
guidance of the Marine Corps’ Intelligence, Surveillance, and Reconnaissance (ISR)
strategy, directed that a persistent surveillance capability be identified and fielded
immediately. The ISR strategy is a component of the Marine Corps ISR-Enterprise
(MCISR-E), whose focus is to integrate air, ground, and space sensors into a network
capable of detecting, locating, identifying, and targeting threats.
The Ground-Based Operational Surveillance System (G-BOSS)—the focus of this
thesis—is one system within a larger Family of Systems (FoS) predicated on the concept
of the Marine Corps’ ISR strategy.

2
REAL TIME “DISPLAYED”
VIDEO
NON-REAL TIME “STORED”
VIDEO
PERSISTENT SURVEILLANCE
DISPLAYY
ASSESS
STORE RECORD
TRACK
DETECT
DENY DENY
ASSESS
CURRENT OPERATIONS FUTURE OPERATIONS
Figure 1. G-BOSS operational construct.
G-BOSS is a force protection, camera-oriented, day/night, expeditionary tool that
provides the ability to detect, track, display, record, assess, deny, and store video to
counter the threat of IEDs and disrupt insurgency activities (Marine Corps Combat
Development Command, 2007) as shown in Figure 1, the G-BOSS operational construct.
G-BOSS referred to throughout this analysis is composed of a Rapid Aerostat Initial
Deployment (RAID) 107-foot mobile tower, two cameras: a Star SAFIRE IIIFP and a
T-3000, a Man-Portable Surveillance and Target Acquisition Radar (MSTAR) sensor,
and a Ground Control Station (GCS).
Figure 2. G-BOSS components from l-r: RAID tower, T-3000, Star SAFIRE IIIFP, RGS, MSTAR. (from MCOTEA’s G-BOSS Detailed Assessment Plan, April 2008
[Best viewed in color])

3
B. THE PROBLEM
The objective for G-BOSS is to detect, identify, and track insurgent activities;
specifically those associated with the emplacement of IEDs. Since its initial employment
in late spring 2007, G-BOSS has contributed to the reduction of the loss of life among
Marine forces due to IEDs. One potential end-state is a fully networked G-BOSS capable
of integration with unmanned aircraft systems (UAS), command and control (C2) assets,
and fire support systems that will increase situational awareness (SA) and aid
commanders in conducting current and future offensive operations to disrupt
insurgent activity.
G-BOSS is currently deployed in a stand-alone configuration with minimal
centralized coordination and consolidation of sensor data. Employment of G-BOSS in a
stand-alone configuration is not due to fault, nor negligence. The immediate need for G-
BOSS, coupled with an aggressive implementation of the system in theater, did not afford
time to develop TTPs for G-BOSS. The Marine Corps has a four-phase employment plan
for G-BOSS. The Marine Corps is in phase two of its four-phase employment of G-
BOSS. The phases are:
– Phase 1
• Manual operation
• View video at base of each tower
• Radio communication to a combat operations center (COC)
– Phase 2
• Manual operation
• Video feed to COC
• COC directs camera slewing
– Phase 3
• Cameras controlled from COC
• Automatic camera slewing
– Phase 4
• Integrated network throughout province (multiple COCs)
4
The Marine Corps Systems Command (MCSC), Counter-Improvised Explosive
Devices Technology Directorate (C-IED) wants to know if the G-BOSS employment
approach in Phase 2 provides more SA than the G-BOSS employment approach in
Phase 1. This thesis addresses the question: How can Marines deployed now best
employ G-BOSS? The Marine Corps Operational Test and Evaluation Activity
(MCOTEA) conducted a developmental test of G-BOSS to evaluate the capabilities and
limitations of the system, in order to enhance its operational effectiveness for deployed
commanders. Results from this test are intended to improve the phased deployment
of G-BOSS.
C. PURPOSE
The purpose of this thesis is to develop a simulation using an agent-based model
(ABM) that represents the live developmental test conducted by MCOTEA. The goal is
to provide coalition forces with analytical support to improve G-BOSS TTPs and enhance
the operational effectiveness of the system. The simulated operational experience
provided by this analysis helps facilitate future tests of G-BOSS capabilities and can
potentially serve as an operational planning tool for commanders.
Further, this study serves as a proof of concept of the capability that the
Simulation Experiments and Efficient Design (SEED) Center for Data Farming at the
Naval Postgraduate School (NPS) can provide to support the Joint Improvised Explosive
Device Defeat Organization (JIEDDO) in the war against IEDs. The SEED Center for
Data Farming mission statement is to “advance the collaborative development and use of
simulation experiments and efficient designs to provide decision makers with timely
insights on complex systems and operations.” JIEDDO has the mission to “lead,
advocate, and coordinate all Department of Defense actions in support of Combatant
Commanders’ and their respective Joint Task Forces’ efforts to defeat improvised
explosive devices as weapons of strategic influence.” The SEED Center
(http://harvest.nps.edu) and JIEDDO (https://www.jieddo.dod.mil/) websites provide
more detail.

5
D. RESEARCH QUESTIONS
This thesis simulates MCOTEA’s live test and conducts a comparative,
quantitative analysis of G-BOSS employment TTPs to enhance the operational
effectiveness of G-BOSS. While this analysis is by no means exhaustive, the following
questions are addressed:
• What critical factors determine the level of SA provided by G-BOSS?
• Does coordination via the COC improve the effectiveness of G-BOSS?
• Does use of motion detection radar improve the effectiveness of G-BOSS?
E. METHODOLOGY
This thesis uses agent-based simulation, state-of-the-art design of experiments,
and advanced data analysis methods to analyze the critical factors associated with the
level of SA provided by G-BOSS. The process is to simulate a scenario based on a live
developmental test conducted by MCOTEA with G-BOSS. The simulated model is then
replicated and analyzed. The analysis process uses a technique called data farming,
which involves using high-performance computing to run the simulation thousands of
times, while simultaneously varying many input parameters. As a result, data farming
provides insights into complex problems through the exploration of a multitude of
possible outcomes.
This thesis uses an agent-based distillation, which is a type of computer
simulation that attempts to capture the critical factors of interest in combat without
explicitly modeling all of the physical details. The tool used is Map Aware Non-Uniform
Automata (MANA), developed by the New Zealand Defense Technology Agency (DTA).
More information about MANA can be found at https://teams.nzdf.mil.nz/sites/mana/
default.aspx.
F. THESIS ORGANIZATION
Chapter II begins with an unclassified description of the equipment and the
scenario involved with MCOTEA’s test. The chapter concludes with an overview of

6
MANA and a detailed description of the simulation model created for this thesis.
Chapter III offers a discussion on the design of experiments used for this analysis and
includes a description of the factors used in this analysis, and an explanation of
Nearly Orthogonal Latin Hypercubes (NOLHs). Chapter IV provides a description of the
analytical methods used to interpret the results of the simulated tests and concludes with
an explanation of the analytical results. Chapter V completes the thesis with a discussion
of the insights gained from the analysis and recommends topics for
follow-on research.

7
II. MODEL DEVELOPMENT
Persistent surveillance is the primary capability afforded to the commander by
G-BOSS. Under the guidance of the Marine Corps’ ISR strategy, G-BOSS will be
employed at all levels of the Marine Air Ground Task Force (MAGTF) to perform
surveillance of assigned areas of responsibility (AOR). G-BOSS is now employed in a
stand-alone configuration. MCSC wants to know if current employment techniques
underutilize G-BOSS. MCOTEA’s test of G-BOSS addresses that question.
A. G-BOSS TEST OVERVIEW
MCOTEA’s developmental test of G-BOSS evaluates its capabilities and
limitations. Their assessment included three distinct test events: SA; Detection,
Classification, Recognition, and Identification (DCRI); and Track Error. The scenario
and simulation model developed for use in this thesis depicts one night time test trial of
the SA test event. The SA test event explores whether a coordinated network approach of
G-BOSS significantly improves SA over the current uncoordinated, stand-alone
tower approach.
MCOTEA measures SA and compares the level of SA between a coordinated and
stand-alone tower approach in two steps. First, test trials that use role players in teams of
friendly, hostile and neutral personnel to maneuver at varying ranges within G-BOSS’s
field-of-regard. The G-BOSS operators use the system and determine hostile acts or
intent. The second part is to calculate an SA score based on an SA Value Model
developed by MCOTEA. Table 1 lists the data requirements necessary to calculate the
SA score. To learn more about the MCOTEA Situational Awareness Value Model,
contact MCOTEA at www.quantico.usmc.mil/activities/?Section=MCOTEA for a copy
of the report detailing the results of the developmental test for G-BOSS.

8
MCOTEA Test Data Requirements Trial Number Percent of Hostiles Identified Trial Time Percent of Neutral Identified Data Collector Percent of Friendly Identified Configuration Percent of Identification | Detection MSTAR Percent of Detections Enemy Action Percent of False Detections Lux Target Location Error Temperature Screen Clutter Humidity Current Target Location Error Wind Speed Percent of Hostiles Identified Pre-Act Pressure False Alarm Rate for Hostiles Probability of Identification | Cue Time to Respond to Cue
Table 1. Data requirements for MCOTEA’s SA value model.
1. Test Location
The test was conducted at Acorn Range, Marine Corps Air Ground Combat
Center, 29 Palms, California, from 15-28 April 2008. In Figure 3, the red colored area
depicts the zone in which teams of role players maneuvered against G-BOSS during the
SA test event.
Figure 3. G-BOSS test site. (from MCOTEA’s G-BOSS Detailed Assessment Plan, April 2008 [Best viewed in color])

9
2. Test Equipment
Due to the classified nature of the exact specifications and capabilities of
G-BOSS, only a general description is provided. Figure 2, in Chapter I, illustrates
G-BOSS undergoing test and evaluation. The Star SAFIRE IIIFP and T-3000 cameras
are mounted at the top of the RAID tower. A tactical radio for the transmission of
camera and radar data is mounted near the cameras. MSTAR is mounted on the tower,
approximately 28 feet above the tower’s base. MCOTEA assessed (4) RAID towers,
(8) cameras, (4) MSTARs, (4) GCSs, (2) RGSs, and (2) COCs.
3. Test Architecture
Figure 4 shows the test equipment configuration: four RAID 107-foot towers,
each configured with one Star SAFIRE IIIFP camera and one T-3000 camera. The
G-BOSS sensors were deployed in two distinct configurations: a coordinated network
configuration and an uncoordinated, stand-alone configuration. Each tower pair (1 and 2,
3 and 4) spans a 2-km distance. For administrative and logistical convenience, tower
pairs were located near each other. COC 1 and COC 2 are located approximately 50 km
away from their respective towers.
COC 1 COC 2
T1 T3 T2 T4
T1 – T2 = 2 km
T3 – T4 = 2 km
Figure 4. MCOTEA test architecture.
Towers 1 and 2, along with COC 1, were operated in a coordinated network
configuration. The coordinated network approach allows COC 1 to optimize the search
patterns of the four G-BOSS sensors on Towers 1 and 2. Under this configuration,

10
COC 1 is able to assist Towers 1 and 2 assess hostile acts or intent during the test trial.
COC 1 is able to assist Towers 1 and 2, since it can observe what all four G-BOSS
sensors on Towers 1 and 2 can observe.
Towers 3 and 4, along with COC 2, were operated in an uncoordinated,
stand-alone configuration. This configuration allows degraded assistance from COC 2 to
Towers 3 and 4 during the test trial to assess hostile acts or intent. COC 2 could not
observe what Towers 3 and 4 could see, but received updates via voice over internet
protocol (VOIP) phone transmission.
4. Situational Awareness (SA) Trial
An SA trial consisted of a predetermined time period wherein a mix of friendly,
neutral and hostile role players operated on foot in the field of view of the G-BOSS
towers. During this period, some of the hostile role players performed their mission. A
trial period starts at either the beginning of a test day or at the end of the previous data
collection stop. A trial period ends at a predetermined time for a data collection stop.
The two distinct tower and COC configurations operate simultaneously during the trial,
so, at a minimum, each data collection stop yields two trials.
The SA trial associated with this thesis was test trial #15, which was an IED
scenario conducted on 24 April 2008 at night. The scenario included an
IED-emplacement team, composed of three hostile role players simulating IED
emplacement at a predetermined time and location. The remaining neutral, friendly and
hostile forces participating in the trial (also consisting of three members each) moved
through the test area as directed by the test-trial script. The trial concluded upon
completion of the hostile act and after MCOTEA called for a data collection stop.
G-BOSS operators were provided a table, such as Table 2, to facilitate distinguishing
between role players.

11
Role Player Category Code Distinguishing Features N Middle Eastern Clothing
N-Shovel Middle Eastern Clothing w/Shovel Neutral
(N) N-Rifle Middle Eastern Clothing w/Rifle
F-Mortar Helmet/Flak w/Mortar Tube
F-Rifle/Scope Helmet/Flak w/Rifle/Scope F-Rifle Helmet/Flak w/Rifle
Friendly (F)
F Helmet/Flak
H-Shovel/IED Middle Eastern Clothing w/Shovel/IED H-Rifle/Scope Middle Eastern Clothing w/Rifle/Scope
Hostile (H)
H-Mortar Middle Eastern Clothing w/Mortar Tube
Table 2. SA test trial role-player categories.
B. THE MAP AWARE NON-UNIFORM AUTOMATA (MANA) COMBAT SIMULATION TOOL
MANA is the modeling environment used in this thesis. MANA is a time-step,
ABM environment developed by the New Zealand DTA in early 2000 for the
New Zealand Defense Force (NZDF) after experiencing frustration with combat models
based solely on physics. MANA intends to capture “enough physics as is necessary”
(McIntosh, Galligan, Anderson, & Lauren, 2007), to capture aspects of human behavior
and to represent a wide range of interactions among agents and their environment. In a
MANA model, the agents are:
• Map Aware—Agents have SA of the other agents and terrain that is updated by sensors and communications.
• Non-uniform—Individual agents may have different behavior parameters, capabilities, sensors, weapons, and communications.
• Automata—Agents react independently on the battlefield according to their own individual characteristics and awareness.
MANA is a straightforward application that is intuitive and easy to use with a
well-developed Graphical User Interface (GUI). More details of this model are readily
available in the MANA User’s Manual and at https://teams.nzdf.mil.nz/sites/mana/
default.aspx.

12
1. Why MANA?
Many aspects of warfare can be explained by physics, such as the trajectory of a
projectile to a point of impact or the effective casualty radius of an artillery round. Less
tangible elements, such as SA, must also be explained or measured. The nonlinear
relationships associated with SA, coupled with the numerous variables involved, make
sole dependence on physics-based models ineffective.
MANA represents the key temporal and spatial elements of the tactical scenario.
With a clear idea of this scenario and the measure in question, MANA can provide the
capability to “explore the greatest range of possible outcomes with the least set-up time”
(McIntosh, Galligan, Anderson, & Lauren, 2007).
MANA is used because SA is the primary measure to be analyzed. In the most
basic of terms, “SA is knowing what is going on around you” (Endsley & Garland, 2000).
Many factors influence the various levels of SA. MANA provides a dynamic and
stochastic environment in which many of these factors can be varied and their
interactions explored. MANA also facilitates rapid scenario generation based on
MCOTEA’s developmental test.
C. CHARACTERISTICS OF THE SIMULATION MODEL
The role players and equipment associated with the SA test trial are referred to as
agents. An agent is a “character” within the MANA modeling environment with assigned
attributes and personality characteristics similar to their actual capabilities.
Detection is defined as one agent being aware of another agent’s presence.
Classification is a step further. Classification means an agent is able to distinguish if a
detected agent is a neutral, hostile or friendly agent. In the MCOTEA test, detection
takes on the same definition as in the MANA scenario. Identification in the MCOTEA
test is the equivalent to classification in the MANA scenario.
1. Goal
The goal of the simulation is to measure the level of SA provided by G-BOSS for
test trial #15. The measures of effectiveness (MOEs) associated with this goal are the

13
proportion of correct classifications of friendly, hostile and neutral role players per test
trial. An additional MOE is whether or not the IED emplacers were detected. Factors of
interest include, but are not limited to: the slew rate of G-BOSS, the distance between
the pairs of RAID towers, the configuration of the COCs (coordinated or stand-alone),
and the presence of MSTAR with the G-BOSS sensors.
2. Scale and Terrain
The implementation of the scenario in MANA requires mapping from real time
and real space to simulated time and simulated space. In this simulation model, a time
step is equal to 5 seconds of real time. For a 1-hour scenario this equates to 720 model
time steps. The default battlefield size for a scenario in MANA is a 200 x 200 grid. The
scale of the scenario used in the simulation model is 20 meters per grid square. Thus, a
650 pixel by 500 pixel map grid represents the 13 kilometer by 10 kilometer test area
used in the MCOTEA test. Due to the few agents needed for the simulation, a 1-hour
simulated test trial completes in approximately 30 seconds of real time per execution on a
standard laptop processor. The time and distance scales were chosen to achieve “good
enough” resolution to simulate and record the result of agent activities.
The terrain in the model consists of two components: an elevation map and a
terrain map as shown in Figure 5. In the elevation map, black represents the lowest level
of elevation and white represents the highest elevation. Elevation in MANA is used to
block line-of-sight, as appropriate. To obtain the elevation map, the Falcon View
software package was used to open the appropriate DTED-2 file that was obtained from
the National Geospatial-Intelligence Agency (NGA). The image file acquired with
Falcon View was then translated into a bitmap that could be read in by MANA. Finally,
within MANA, the user manually enters the difference between high and low points in
the image (which corresponds to the black to white spectrum MANA uses to display the
elevation file).

14
MANA Elevation File
MANA Terrain File
Terrain from MCOTEA’s Test
Figure 5. The elevation and terrain files used by MANA were derived from the terrain in the MCOTEA scenario. [Best viewed in color]
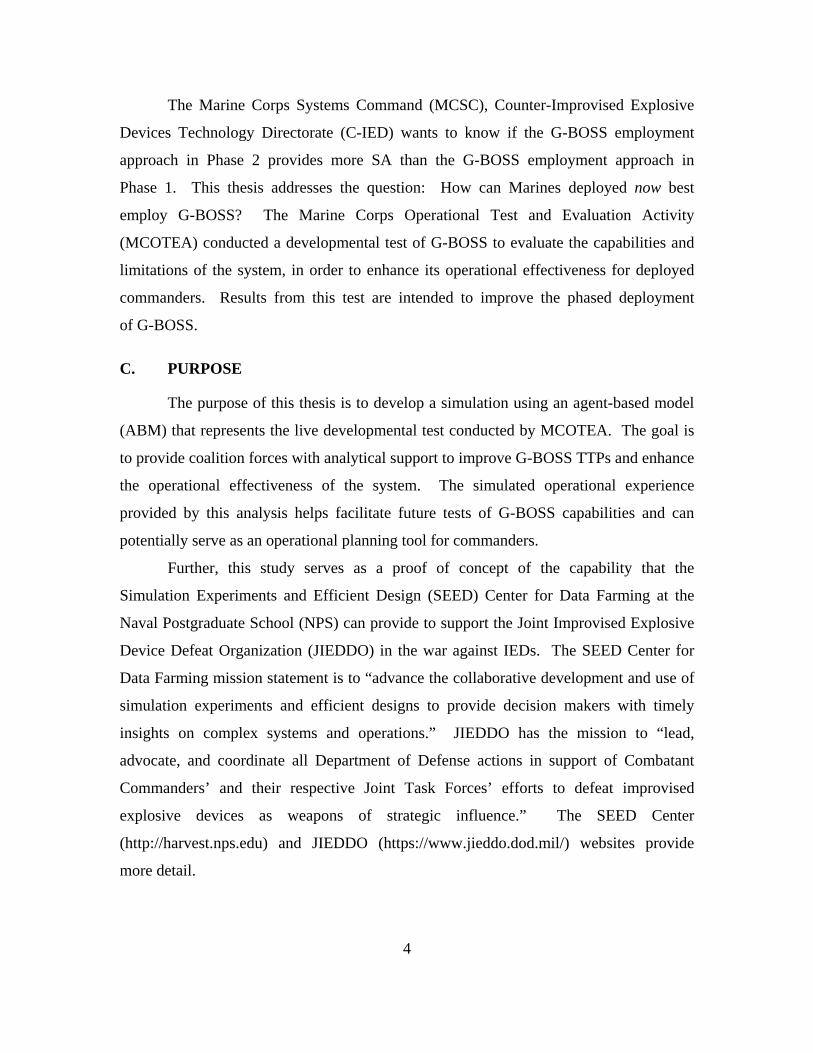
The terrain file depicts battlefield terrain in the model. Distinct colors are used to
represent terrain features within the model. Figure 6 shows how colored pixels on the
terrain map (as defined by their Red-Green-Blue settings) affect the movement speed of
the role-players. Figure 6 also shows the level of cover and concealment provided by the
terrain. For example, a terrain type created for this scenario called defilade, which is
depicted by the brown spots in the MANA terrain file, allows only 70% of the maximum
speed for a role-player, 10% protection from fire, and 60% concealment from view.
These percentages are used as multipliers in MANA’s calculations, and their use is
further described in the MANA User’s Manual.
15
Figure 6. The characteristics of the colors in the terrain file for the MANA model used in this research. (from MANA 4.01.1)
3. Agent Descriptions
a. The Refueler Agent Class
A large portion of the test trial depends upon the agent’s stealth as it
maneuvers in the test area. To facilitate stealth, an agent named “Refueler” was created
to serve the purpose of “refueling” the role-player agents in the scenario, according to its
range and probability settings. Receiving fuel from the refueler triggers the agent to
temporarily go into a stealth state where it stops moving for 12 time steps (1 minute).
The refueler agent is invisible to other agents and provides fuel every 36 time steps
(3 minutes) on average.
4. Red Agents (Hostile Role Players)
SA test trial #15 uses two types of hostile role-players: an IED emplacer and a
sniper. These agents are referred to as H-ShovelIED and H-RifleScope, respectively.

16
a. H-ShovelIED
This agent is depicted by a standing red soldier icon on the screenshot
shown in Figure 7. This agent moves slowly and stealthily, while seeking defilade
positions, until it arrives at the IED emplacement location. During its hostile act, its
appearance changes into a larger red soldier icon. The simulated hostile act takes place at
approximately time step 360 (30 minutes into the scenario, in accordance with the live
test event). The act continues for approximately 120 time steps (10 minutes). During the
simulated hostile act, the agent loses the stealth property because it is digging. When it is
refueled by the Refueler, this agent stops moving and employs stealth for 12 time steps
(1 minute).
7
Red Agents are Hostile Sniper team and/or IED Team
Blue Agents are Marines on patrol
Green Agents are Neutrals
Purple Agents are COC1 / T1 / T2
Yellow Agents are COC2 / T3 / T4
Figure 7. MANA Model Screen Shot. [Best viewed in color]
b. H-RifleScope
This agent is depicted by a red soldier icon in the prone position on the
screenshot shown in Figure 7. This agent moves slowly and stealthily seeking cover and
concealment from defilade to its final hide position. When it is refueled by the Refueler,
this agent stops moving and employs stealth for 12 time steps (1 minute).

17
5. Blue Agents (Friendly Role Players)
SA test trial #15 uses two types of friendly role-players: a Marine with a rifle and
a scope and a Marine with just a rifle. These agents are referred to as
F-RifleScope and F(Friendlies), respectively.
a. F-RifleScope
This agent is depicted by a standing blue soldier icon on the screenshot
shown in Figure 7. This agent moves slowly and stealthily seeking cover and
concealment from defilade to its final hide position. When refueled by the Refueler, this
agent stops moving and employs stealth for 12 time steps (1 minute).
b. F(Friendlies)
This agent is depicted by a standing blue soldier icon on the screenshot
shown in Figure 7. This agent moves slowly and stealthily seeking cover and
concealment from defilade to its final hide position. When refueled by the Refueler, this
agent stops moving and employs stealth for 12 time steps (1 minute).
6. Neutral Agents (Neutral Role Players)
SA test trial #15 uses one type of friendly role-player: a local member of the area.
This agent is known as N(Neutrals).
a. N(Neutrals)
This agent is depicted by a standing green soldier icon on the screenshot
shown in Figure 7. This agent maneuvers in the test area without seeking cover and
concealment. This agent does not turn yellow since there is no need for it to be stealthy.
This agent simply wanders about the test area.
7. Towers 1 and 2
SA test trial #15 uses two towers with the traits listed below. These agents are
referred to as Tower 1 and Tower 2.

18
a. Tower 1 and Tower 2
These agents are depicted by purple tower icons on the screenshot shown
in Figure 7. These agents do not move. They detect and classify other agents in the test
area with their three sensors, T-3000, StarSAFIRE IIIFP, and MSTAR. The agents
continually scan the test area to classify other agents, and once the tower classifies
another agent in the test area, the tower “shoots” a round from its perfectly lethal,
perfectly accurate weapon. In the model, shooting/killing is a surrogate for classifying.
This is done to simplify the MOE data collection. This approach is reasonable since
combat adjudication is not employed. At least three discrete time observations
(15 seconds of observation or shots) are required to classify an agent.
Towers 1 and 2 along with COC 1 represent the coordinated network
configuration described in the test architecture. To model that configuration, all
classification information is passed instantaneously and accurately to COC 1. This
approach simulates four monitors, one for each view of each tower’s cameras, in COC 1.
8. Towers 3 and 4
SA test trial #15 uses two towers with the same traits. These agents are known as
Tower 3 and Tower 4.
a. Tower 3 and Tower 4
These agents are depicted by purple tower icons on the screenshot shown
in Figure 7. These agents do not move. They detect and classify other agents in the test
area with their three sensors, T-3000, StarSAFIRE IIIFP, and MSTAR. The agents
continually scan the test area to classify other agents, and once the tower classifies
another agent in the test area, the tower “shoots” a round from its perfectly lethal,
perfectly accurate weapon. In the model, shooting/killing is a surrogate for classifying.
This is done to simplify the MOE data collection. This approach is reasonable since
combat adjudication is not employed. At least three discrete time observations (or shots)
are required to classify an agent.
Towers 3 and 4 along with COC 2 represent the stand-alone network
configuration described in the test architecture. To model that configuration, the Towers

19
attempt to pass all classification information to COC 2; however, with delays and
inaccuracies. Only one message at a time is passed. This technique simulates the
G-BOSS limitation of only monitoring one threat at a time.
9. COC 1 and COC 2
SA test trial #15 uses two COCs with different traits. These agents are called
COC 1 and COC 2.
a. COC 1
This agent is depicted by a purple crosshair icon on the screenshot shown
in Figure 7. This agent does not move and has no organic sensor associated with it.
COC 1 receives classification information from Towers 1 and 2, in a manner that
simulates two monitors associated with each tower’s cameras. COC 1 performs data
fusion on the information received from Towers 1 and 2 to assist the towers with
classification of agents. For more detail on MANA data fusion, the MANA User’s
Manual may be consulted. The data fusion capability is used as a surrogate to model the
effect of the COC operators assisting with the classification task. COC classification is
accomplished in the same manner as classification by a tower.
b. COC 2
This agent is depicted by a yellow crosshair icon on the screenshot shown
in Figure 7. COC 2 operates in a similar manner to COC 1. COC 2 receives less
information from Towers 3 and 4. Only completed classifications are passed from
Towers 3 and 4 to COC 2. COC 2 does not employ data fusion.

20
THIS PAGE INTENTIONALLY LEFT BLANK
21
III. EXPERIMENTAL DESIGN
A goal of this thesis is to provide insights that enhance the operational
effectiveness of G-BOSS. Experimental design is used to identify the critical factors
associated with the level of SA provided by G-BOSS. The experimental design includes
selection of factors and measures of effectiveness (MOEs). State-of-the-art techniques
are applied to efficiently explore the parameter space through data farming. NOLHs
facilitate this approach.
A. MEASURE OF EFFECTIVENESS
A MOE is “a measure of operational success that must be closely related to the
objective of the mission or operation being evaluated. A meaningful MOE must be
quantifiable and a measure to what degree the real objective is achieved” (The Defense
Acquisition University [DAU], 2003). SA is the intangible measure in the center of this
analysis. A simple definition of SA is “knowing what is going on around you” (Endsley
& Garland, 2000). SA also includes observing the battlespace, processing input from
those observations and developing an understanding of the environment, friendly actions
and threat activity. Two MOEs are used to quantify SA in this analysis: the percent of
correct classifications made by G-BOSS operators and whether or not an IED
emplacement is observed.
B. EXPERIMENT FACTORS
The simulation factors chosen for this thesis are based on the developmental test
conducted by MCOTEA on G-BOSS. The experiment factors are grouped into three
categories: G-BOSS configuration, G-BOSS performance, and battlespace environment.
G-BOSS configuration and G-BOSS performance factors can be controlled in the real
world by the decision maker. For example, the distance between each G-BOSS RAID
tower is dictated by the COC. Battlespace environment factors cannot be controlled in
the real world by the decision maker. Examples include the number of hostile, friendly,
or neutral personnel in a G-BOSS field-of-regard. Table 3 summarizes the simulation
parameters and their ranges used in the experiment.

22
Factor Value Range Explanation
MSTAR / No MSTAR 0 or 1 With or without motion detection radar Number of COC Monitors 0, 1, 2 Number of monitors per COC Distance Between Pairs of
Towers 2km, 4km Distance between RAID towers
Cam 1 P(Class) .01….99 Probability of classification associated with the T-3000 sensor
Cam 1 Class Range +/- 20% Probability of classification range associated with the T-3000 sensor
Cam 2 P(Class) .01….99 Probability of classification associated with the Star SAFIRE IIIFP sensor
Cam 2 Class Range +/- 20% Probability of classification range associated with the Star SAFIRE IIIFP sensor
Tower Slew Rate 1 - 3 deg/ts Surrogate for time it takes to cover the area in high-resolution mode
Latency of Comm to COC 1 min… 15 min
Delay associated with passing contact info from tower to COC
Reliability of Comm to COC .01….99 Probability that intended message from tower is received by COC
Number of Role-players per Team 2 … 6 Number of role-players per team
Role-player Stealth .01….99 Level of stealth associated with each role-player Role-player Speed .5 km/hr to
2 km/hr Maneuver speed for each role-player
Table 3. Variable factors in the experimental design. G-BOSS configuration factors are in yellow, G-BOSS performance factors are in white, and Battle space environment
factors are in gray. [Best viewed in color]
1. G-BOSS Configuration Factors
The following factors are used to analyze the level of SA provided
by G-BOSS:
a. MSTAR or No MSTAR
This is a categorical variable defined by whether the motion detection
radar is present or not.
b. Number of COC Monitors
This is the number of monitors in the COC.
c. Distance Between Pairs of Towers
This is the distance between RAID towers.

23
2. G-BOSS Performance Factors
The following factors are used to analyze the level of SA provided by
G-BOSS on a basis of performance:
a. Camera 1 P(Classification)
This is the probability of classification associated with the T-3000 sensor.
b. Camera 1 Classification Range
This is the probability of classification range associated with the
T-3000 sensor.
c. Camera 2 P(Classification)
This is the probability of classification associated with the Star SAFIRE
IIIFP sensor.
d. Camera 2 Classification Range
This is the probability of classification range associated with the Star
SAFIRE IIIFP sensor.
e. Tower Slew Rate
This is a surrogate for time it takes to cover the area in
high-resolution mode.
f. Latency of Communication to COC
This is the delay associated with passing contact information from the
tower to the COC.
g. Reliability of Communication to COC
This is the probability that messages from the tower are received by
the COC.

24
3. Battle Space Factors
The following factors were chosen to analyze the level of SA provided by G-
BOSS, based on elements of the battlefield that are uncontrollable:
a. Number of Role-players per Team
This is the number of role-players per team.
b. Role-player Stealth
This is the level of stealth associated with each role-player.
c. Role-player Speed
This is maneuver speed for each role-player.
C. NEARLY ORTHOGONAL LATIN HYPERCUBES (NOLH)
NOLHs are a space-filling experimental design technique developed by
COL Thomas Cioppa, United States Army, at the Naval Postgraduate School (NPS) in
2002. This technique allows for the exploration of a large number of input parameters in
an efficient number of runs, while maintaining nearly orthogonal design columns (Cioppa
& Lucas, 2007). A design of 13 factors at just two levels, each using a full-factorial
approach, would require nearly a quarter of a million runs (8,192 design points x 30 reps
= 245,760 total runs). Using a crossed design with a stacked NOLH for the quantitative
factors, the number of runs is reduced significantly to 23,760 (792 design points x 30 reps
= 23,760) runs and the quantitative factors are more extensively varied. Figure 8 shows
the NOLH design spreadsheet used for this analysis and Figure 9 shows the space-filling
property of the NOLH technique.

25
Figure 8. NOLH Design Spreadsheet.
110130150170
0
3000
6000
140
170
200
0
3000
6000
0
100
0
30
60
369
0
0.3
0.6
2
4
1
2
110 150 0 3000 140 190 0 3000 0 100 0 20 50 80 3 5 7 9 12 0 0.3 0.6 2 3 4 5 1 2
Scatterplot Matrix
Figure 9. Scatterplot matrix of experiment factors.

26
Another advantage of NOLH is the negligible correlation among experiment
factors, which prevents factor effects being confounded with one another. Figure 10
shows minimal multicollinearity (negligible correlation amongst the experiment factors).
Cam1ClassRngCam1PClassCam2ClassRngCam2PClassCommLatencyCommReliabilityEntitySpeedEntityStealthNumPerTmTw rSlew Rate
1.0000-0.0020-0.00320.0025
-0.0049-0.00320.0020
-0.0031-0.0044-0.0181
-0.00201.0000
-0.0018-0.0115-0.00260.0039
-0.00310.00260.0219
-0.0131
-0.0032-0.00181.00000.0015
-0.0061-0.0137-0.01130.00460.0033
-0.0482
0.0025-0.01150.00151.00000.0017
-0.0000-0.02610.00740.0111
-0.0810
-0.0049-0.0026-0.00610.00171.00000.0039
-0.0050-0.00390.0217
-0.0141
-0.00320.0039
-0.0137-0.00000.00391.00000.00050.0115
-0.0149-0.0304
0.0020-0.0031-0.0113-0.0261-0.00500.00051.0000
-0.02190.02520.1074
-0.00310.00260.00460.0074
-0.00390.0115
-0.02191.0000
-0.00630.1257
-0.00440.02190.00330.01110.0217
-0.01490.0252
-0.00631.0000
-0.0358
-0.0181-0.0131-0.0482-0.0810-0.0141-0.03040.10740.1257
-0.03581.0000
Cam1ClassRng Cam1PClass Cam2ClassRng Cam2PClass CommLatency CommReliability EntitySpeed EntityStealth NumPerTmTw rSlew Rate
650 row s not used due to missing or excluded values or frequency or w eightvariables missing, negative or less than one.
Correlations
Figure 10. Experiment factor pairwise correlation matrix.

27
IV. DATA ANALYSIS
After defining the problem, scenario, MOEs and experimental design, the
simulation is executed to generate output data. The next task is the analysis of the data
generated by data farming the simulation model. The analysis provided in this chapter is
the result of an iterative and exhaustive process of applying various statistical techniques
to the simulation output. Not every step of that exhaustive process is detailed in this
section. Models and techniques resulting in significant findings about G-BOSS
operational effectiveness are included in this chapter. JMP Statistical Discovery
Software Version 7 is the primary tool used for this analysis. Details of this data analysis
software are readily available at www.jmp.com.
The analysis evaluates three specific research questions about enhancing the
operational effectiveness of G-BOSS:
• What critical factors determine the level of SA provided by G-BOSS?
• Does coordination via the COC improve the effectiveness of G-BOSS?
• Does use of motion detection radar improve the effectiveness of G-BOSS?
Each question is addressed in this chapter, along with an explanation of the analysis
technique and results.
A. DATA SUMMARY
A summary of the MOE data is provided in Figures 10 and 11. For clarity of
presentation, the means of the 780 design points are graphed. The data summary includes
the distribution data and 95% confidence intervals for the MOEs. Based on the
distribution of the Mean-IED-Detected MOE, the IED emplacement was detected 76% of
the time. The Mean-Percent-Correct-Identifications MOE distribution data shows
G-BOSS provides an average of 72% correct identifications in SA trial #15. Neither
MOE data fits a Normal distribution. A Normal distribution of the data is not expected
or required.

28
30
40
50
60
70
80
90
100 .001 .01 .05.10 .25 .50 .75 .90.95 .99 .999
-4 -3 -2 -1 0 1 2 3 4
Normal Quantile Plot
Normal(72.9166,21.8103)
Mean(PercCorrectID(3hits))
MeanStd DevStd Err Meanupper 95% Meanlow er 95% MeanN
72.9166221.8103190.780934774.44960671.383634
780
Moments
LocationDispersion
Typeμσ
Parameter72.91662
21.810319
Estimate71.38363420.779092
Lower 95%74.44960622.950053
Upper 95%
Parameter Estimates
Shapiro-Wilk W Test
0.876874W
0.0000*Prob<W
Note: Ho = The data is from the Normal distribution. Small p-values rejectHo.
Goodness-of-Fit Test
Fitted Normal
Figure 11. Data summary for the Mean-Percent-Correct-Identifications MOE.
0.3
0.4
0.5
0.6
0.7
0.8
0.9
1 .001 .01 .05.10 .25 .50 .75 .90.95 .99 .999
-4 -3 -2 -1 0 1 2 3 4
Normal Quantile Plot
Normal(0.76692,0.1398)
Mean(DetectIED)
0.0% minimum 0.3333
MeanStd DevStd Err Meanupper 95% Meanlow er 95% MeanN
0.76692310.13979780.01226110.79118190.7426642
130
Moments
LocationDispersion
Typeμσ
Parameter0.76692310.1397978
Estimate0.74266420.1246219
Lower 95%0.79118190.1592157
Upper 95%
Parameter Estimates
Shapiro-Wilk W Test
0.962815W
0.0013*Prob<W
Note: Ho = The data is from the Normal distribution. Small p-values rejectHo.
Goodness-of-Fit Test
Fitted Normal
Figure 12. Data summary for the Mean-IED-Detected MOE.
B. SA CRITICAL FACTORS
Stepwise Regression and Classification and Regression Trees (CART) are the
primary data analysis techniques used to identify the critical factors and interactions that
determine the level of SA provided by G-BOSS in this scenario.
29
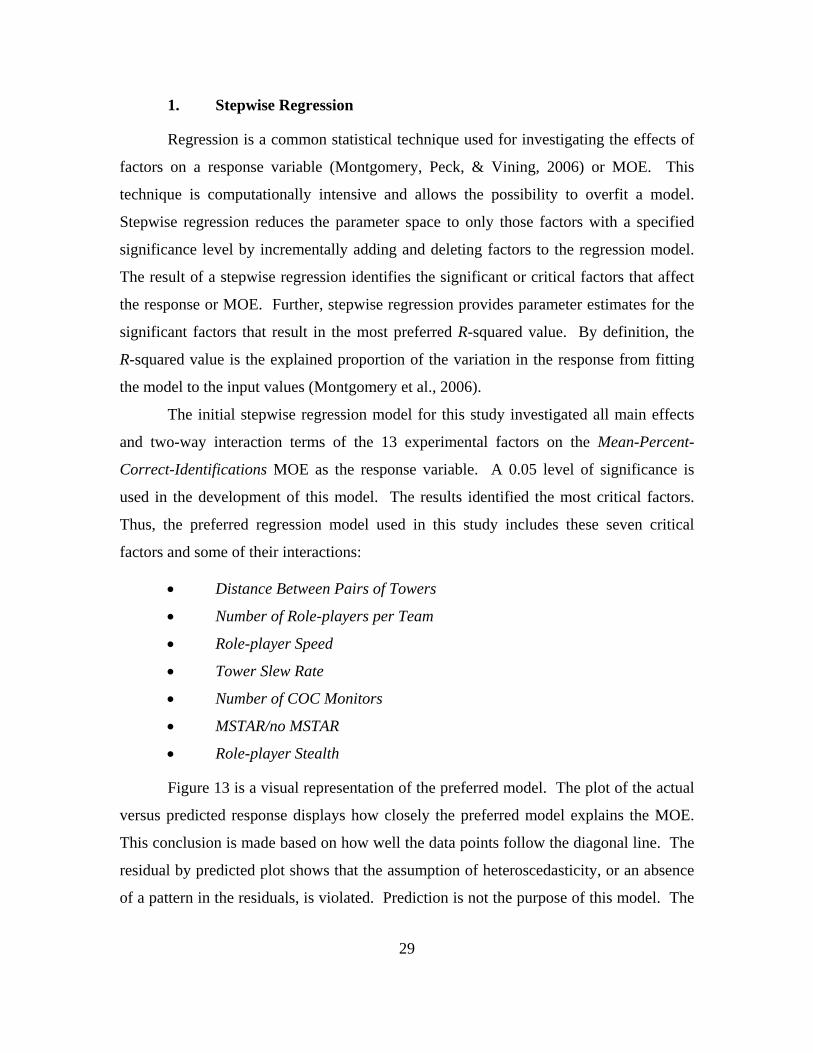
1. Stepwise Regression
Regression is a common statistical technique used for investigating the effects of
factors on a response variable (Montgomery, Peck, & Vining, 2006) or MOE. This
technique is computationally intensive and allows the possibility to overfit a model.
Stepwise regression reduces the parameter space to only those factors with a specified
significance level by incrementally adding and deleting factors to the regression model.
The result of a stepwise regression identifies the significant or critical factors that affect
the response or MOE. Further, stepwise regression provides parameter estimates for the
significant factors that result in the most preferred R-squared value. By definition, the
R-squared value is the explained proportion of the variation in the response from fitting
the model to the input values (Montgomery et al., 2006).
The initial stepwise regression model for this study investigated all main effects
and two-way interaction terms of the 13 experimental factors on the Mean-Percent-
Correct-Identifications MOE as the response variable. A 0.05 level of significance is
used in the development of this model. The results identified the most critical factors.
Thus, the preferred regression model used in this study includes these seven critical
factors and some of their interactions:
• Distance Between Pairs of Towers
• Number of Role-players per Team
• Role-player Speed
• Tower Slew Rate
• Number of COC Monitors
• MSTAR/no MSTAR
• Role-player Stealth
Figure 13 is a visual representation of the preferred model. The plot of the actual
versus predicted response displays how closely the preferred model explains the MOE.
This conclusion is made based on how well the data points follow the diagonal line. The
residual by predicted plot shows that the assumption of heteroscedasticity, or an absence
of a pattern in the residuals, is violated. Prediction is not the purpose of this model. The

30
purpose is gaining insight into the relative factor effects and their interactions. Thus, this
finding of mild nonheteroscedasticity does not diminish any insights gained from
this model.
30
40
50
60
70
80
90
100
MN
(Per
Cor
rID)
Actu
al
30 40 50 60 70 80 90 100 110MN(PerCorrID) Predicted
P<.0001 RSq=0.96 RMSE=4.6663
Actual by Predicted Plot
-20
-10
0
10
20
MN
(Per
Cor
rID)
Res
idua
l
30 40 50 60 70 80 90 100 110MN(PerCorrID) Predicted
Residual by Predicted Plot
Figure 13. Predicted versus actual Mean-Percent-Correct-Identifications and associated residual plot verifying the absence of pattern in the residuals.
The preferred model in this study yields an R-squared of 0.96: 96% of the
variability in the mean percent of correct identifications is explained by the critical
factors identified in the model. The analysis of variance section in Figure 13 shows that
the model is highly significant. This conclusion is based on the extremely low p-value
for the F statistic.
RSquareRSquare AdjRoot Mean Square ErrorMean of ResponseObservations (or Sum Wgts)
0.9568690.9542254.66634372.91662
780
Summary of Fit
ModelErrorC. Total
Source45
734779
DF354579.8615982.67
370562.53
Sum ofSquares
7879.5521.77
Mean Square361.8664
F Ratio
0.0000*Prob > F
Analysis of Variance
Response MN(PerCorrID)
Figure 14. The R-squared value and significance of the stepwise regression model.

31
The effect of each critical factor on the MOE is shown in Figure 15. The absolute
magnitude of the t-Ratio indicates the relative influence a factor has on the outcome of
the MOE. The 114.01 value for Distance Between Pairs of Towers [4] is the largest
value in the table and, thus, has the most statistical significance in explaining the MOE.
The Distance Between Pairs of Towers factor is categorical and takes on the value of
2 km or 4 km. This factor has a positively correlated relationship with the MOE. When
Distance Between Pairs of Towers is set at 4 km, the MOE value produced in the
simulation increases. This is contrasted with the second highest magnitude value of
–22.88 for the Number of Role-players per Team. This factor is a nonzero integer and is
negatively correlated with the MOE (i.e., as Number of Role-players per Team increases,
the MOE value decreases). Inspection of the remaining t-Ratio values yield an
understanding of how the factors influence the MOE. The proportion of variance
explained by each factor is shown in Figure 16. Again, the positioning of the towers is
by far the most important factor.

32
Nominal factors expanded to all levelsContinuous factors centered by mean, scaled by range/2
InterceptCOCsWithMon{0&1-2}COCsWithMon{0-1}DistBetw Tw rs[2]DistBetw Tw rs[4]MSTAR[No]MSTAR[Yes]Cam1ClassRngCam1PClassCam2ClassRngCam2PClassCommLatencyCommReliabilityEntitySpeedEntityStealthNumPerTmTw rSlew Rate(COCsWithMon{0&1-2}-0.33333)*DistBetw Tw rs[2](COCsWithMon{0&1-2}-0.33333)*DistBetw Tw rs[4]COCsWithMon{0-1}*DistBetw Tw rs[2]COCsWithMon{0-1}*DistBetw Tw rs[4](COCsWithMon{0&1-2}-0.33333)*MSTAR[No](COCsWithMon{0&1-2}-0.33333)*MSTAR[Yes]COCsWithMon{0-1}*MSTAR[No]COCsWithMon{0-1}*MSTAR[Yes]COCsWithMon{0-1}*(EntitySpeed-8.50769)(COCsWithMon{0&1-2}-0.33333)*(NumPerTm-4.06154)COCsWithMon{0-1}*(NumPerTm-4.06154)DistBetw Tw rs[2]*MSTAR[No]DistBetw Tw rs[2]*MSTAR[Yes]DistBetw Tw rs[4]*MSTAR[No]DistBetw Tw rs[4]*MSTAR[Yes]DistBetw Tw rs[2]*(Cam1ClassRng-150.031)DistBetw Tw rs[4]*(Cam1ClassRng-150.031)DistBetw Tw rs[2]*(Cam1PClass-5003.08)DistBetw Tw rs[4]*(Cam1PClass-5003.08)DistBetw Tw rs[2]*(Cam2PClass-5003.08)DistBetw Tw rs[4]*(Cam2PClass-5003.08)DistBetw Tw rs[2]*(CommLatency-64.0821)DistBetw Tw rs[4]*(CommLatency-64.0821)DistBetw Tw rs[2]*(EntitySpeed-8.50769)DistBetw Tw rs[4]*(EntitySpeed-8.50769)DistBetw Tw rs[2]*(EntityStealth-0.50031)DistBetw Tw rs[4]*(EntityStealth-0.50031)DistBetw Tw rs[2]*(NumPerTm-4.06154)DistBetw Tw rs[4]*(NumPerTm-4.06154)DistBetw Tw rs[2]*(Tw rSlew Rate-2.03077)DistBetw Tw rs[4]*(Tw rSlew Rate-2.03077)MSTAR[No]*(CommReliability-50.0308)MSTAR[Yes]*(CommReliability-50.0308)MSTAR[No]*(EntitySpeed-8.50769)MSTAR[Yes]*(EntitySpeed-8.50769)MSTAR[No]*(NumPerTm-4.06154)MSTAR[Yes]*(NumPerTm-4.06154)MSTAR[No]*(Tw rSlew Rate-2.03077)MSTAR[Yes]*(Tw rSlew Rate-2.03077)(Cam1ClassRng-150.031)*(Cam2ClassRng-190.031)(Cam1ClassRng-150.031)*(EntitySpeed-8.50769)(Cam1ClassRng-150.031)*(EntityStealth-0.50031)(Cam1PClass-5003.08)*(CommReliability-50.0308)(Cam1PClass-5003.08)*(Tw rSlew Rate-2.03077)(Cam2ClassRng-190.031)*(Cam2PClass-5003.08)(Cam2PClass-5003.08)*(CommLatency-64.0821)(CommLatency-64.0821)*(EntitySpeed-8.50769)(EntitySpeed-8.50769)*(EntityStealth-0.50031)
Term73.164831-2.527669-1.668293-19.0486219.048616-2.2722482.27224831.30943551.85912560.69138112.1100025-1.083035-0.0446815.2992629-3.037041-6.0764543.8061006-2.3461512.3461505-0.9659880.96598782.5304753-2.5304751.5296904
-1.529690.492062
1.72374151.6956608-2.1515422.15154232.1515423-2.151542-0.6183360.6183355-1.4961091.4961085-1.5142341.514234
1.2360203-1.23602
1.1528621-1.1528621.5891095
-1.58911-2.1749152.174915
1.5164155-1.516416-0.5675960.56759631.3529832-1.3529833.457763
-3.4577630.5327884-0.532788-2.359057
-1.30980.8555647-1.5700681.56081384.01882811.50869461.79994823.3704508
ScaledEstimate
0.1730260.2640890.2046330.1670820.1670820.1670820.1670820.2802080.2783350.2768190.2791890.3666530.2789410.2754640.2811870.2656120.23718
0.2638310.2638310.2046330.2046330.1772170.1772170.2046330.2046330.3345190.2808920.3240390.1670820.1670820.1670820.1670820.2795580.2795580.2780890.2780890.2790040.279004
0.3660.366
0.2749840.2749840.2804210.2804210.2650790.2650790.2355830.2355830.2781360.2781360.2747570.2747570.264810.26481
0.2328620.2328620.6554550.5744710.5096480.6319570.4134920.5733590.4401340.4321940.560603
Std Error422.86
-9.57-8.15
-114.01114.01-13.6013.604.676.682.507.56
-2.95-0.1619.24
-10.80-22.8816.05-8.898.89
-4.724.72
14.28-14.28
7.48-7.481.476.145.23
-12.8812.8812.88
-12.88-2.212.21
-5.385.38
-5.435.433.38
-3.384.19
-4.195.67
-5.67-8.208.206.44
-6.44-2.042.044.92
-4.9213.06
-13.062.29
-2.29-3.60-2.281.68
-2.483.777.013.434.166.01
t Ratio0.0000*<.0001*<.0001*0.0000*0.0000*<.0001*<.0001*<.0001*<.0001*0.0127*<.0001*0.0032*0.8728<.0001*<.0001*<.0001*<.0001*<.0001*<.0001*<.0001*<.0001*<.0001*<.0001*<.0001*<.0001*0.1417<.0001*<.0001*<.0001*<.0001*<.0001*<.0001*0.0273*0.0273*<.0001*<.0001*<.0001*<.0001*0.0008*0.0008*<.0001*<.0001*<.0001*<.0001*<.0001*<.0001*<.0001*<.0001*0.0416*0.0416*<.0001*<.0001*<.0001*<.0001*0.0224*0.0224*0.0003*0.0229*0.09360.0132*0.0002*<.0001*0.0006*<.0001*<.0001*
Prob>|t|
Scaled Estimates
Figure 15. Scaled estimates of the preferred stepwise regression used in the study. The t-ratio column explains the relationship between the factor and the MOE.

33
COCsWithMon{0&1-2}COCsWithMon{0-1}DistBetw Tw rsMSTARCam1ClassRngCam1PClassCam2ClassRngCam2PClassCommLatencyCommReliabilityEntitySpeedEntityStealthNumPerTmTw rSlew RateCOCsWithMon{0&1-2}*DistBetw Tw rsCOCsWithMon{0-1}*DistBetw Tw rsCOCsWithMon{0&1-2}*MSTARCOCsWithMon{0-1}*MSTARCOCsWithMon{0-1}*EntitySpeedCOCsWithMon{0&1-2}*NumPerTmCOCsWithMon{0-1}*NumPerTmDistBetw Tw rs*MSTARDistBetw Tw rs*Cam1ClassRngDistBetw Tw rs*Cam1PClassDistBetw Tw rs*Cam2PClassDistBetw Tw rs*CommLatencyDistBetw Tw rs*EntitySpeedDistBetw Tw rs*EntityStealthDistBetw Tw rs*NumPerTmDistBetw Tw rs*Tw rSlew RateMSTAR*CommReliabilityMSTAR*EntitySpeedMSTAR*NumPerTmMSTAR*Tw rSlew RateCam1ClassRng*Cam2ClassRngCam1ClassRng*EntitySpeedCam1ClassRng*EntityStealthCam1PClass*CommReliabilityCam1PClass*Tw rSlew RateCam2ClassRng*Cam2PClassCam2PClass*CommLatencyCommLatency*EntitySpeed
Source 1 1 1 1 1 1 1 1 1 1 1 1 1 1 1 1 1 1 1 1 1 1 1 1 1 1 1 1 1 1 1 1 1 1 1 1 1 1 1 1 1 1
Nparm111111111111111111111111111111111111111111
DF1994.781447.26
283022.824027.23475.51971.48135.83
1243.72189.99
0.568058.532540.17
11396.175607.361721.92485.23
4439.631216.78
47.11820.01596.26
3610.72106.53630.25641.38248.34382.73699.26
1465.84902.2090.68
528.013712.57113.99282.06113.2061.36
134.41310.26
1069.79255.85377.67
Sum ofSquares
91.609666.4653
12997.75184.949421.837744.61516.2380
57.11738.72520.0257
370.0861116.6568523.3660257.516479.079022.2840
203.888655.88012.1637
37.658727.3831
165.82164.8922
28.944029.455411.404817.576832.113567.318341.43314.1645
24.2487170.4988
5.234912.95365.19852.81826.1725
14.248549.129911.749917.3446
F Ratio<.0001*<.0001*0.0000*<.0001*<.0001*<.0001*0.0127*<.0001*0.0032*0.8728<.0001*<.0001*<.0001*<.0001*<.0001*<.0001*<.0001*<.0001*0.1417<.0001*<.0001*<.0001*0.0273*<.0001*<.0001*0.0008*<.0001*<.0001*<.0001*<.0001*0.0416*<.0001*<.0001*0.0224*0.0003*0.0229*0.09360.0132*0.0002*<.0001*0.0006*<.0001*
Prob > F
Effect Tests
Figure 16. Sum of squares of the preferred stepwise regression used in the study. The sum of squares column explains the proportion of variance explained by each factor in
the stepwise regression model.

34
Figure 17 shows an interaction plot of factors included in the preferred regression
model. An interaction indicates that the change in the MOE caused by varying one
parameter is dependent upon the value of another parameter. In an interaction plot, the
MOE is on the y-axis and the factors involved in the interaction are on the x-axis or
appear as separate lines as indicated in the legend. The trellis plot containing the
interactions shows the high and low levels of the factor on the row and the trend in the
MOE by changing the factor in the column. For example, Figure 17 (box all the way to
the right in the second row) shows the interaction between Role-player Stealth and Tower
Slew Rate. This graphic indicates: When Role-player Stealth is very high, the Tower
Slew Rate has only marginal effect on the MOE; however, when Stealth is low,
increasing the Tower Slew Rate improves the Mean-Percent-Correctly-Identified.
30507090
MN
(Per
Cor
rID)
30507090
MN
(Per
Cor
rID)
30507090
MN
(Per
Cor
rID)
30507090
MN
(Per
Cor
rID)
EntitySpeed
0.010.99
26
13
3 6 9 12 15
314
EntityStealth
26
13
0.1
0.3
0.6
0.9
314
0.010.99
NumPerTm
13
2 3 4 5 6
314
0.010.99
26
Tw rSlew Rate
1 2 3
EntitySpeedEntityStealth
Num
PerTmTw
rSlewR
ate
Interaction Profiles
Figure 17. Interaction plots of four critical factors that determine the level of SA.

35
Figure 18 is a contour plot that reinforces the effect of the interaction between
Tower Slew Rate and Role-player Stealth has on the MOE. In this plot, the slower
G-BOSS slews its field-of-regard, the less stealth is required to avoid detection. The
stealth level used by snipers and IED emplacers affects the MOE regardless of the
G-BOSS slew rate.
1
2
3
TwrS
lew
Rat
e
0.0 0.1 0.2 0.3 0.4 0.5 0.7 0.8 0.9 1.0
EntityStealth
Contour Plot for MN(PerCorrID)
MN(PerCorrID)
<= 60.000
<= 62.500
<= 65.000
<= 67.500
<= 70.000
<= 72.500
<= 75.000
<= 77.500
> 77.500
Figure 18. Contour plot of interaction between Tower Slew Rate and Role-player Stealth, and their effect on the MOE.
2. Regression Trees
Regression trees are another effective tool used to analyze the relationship
between factors and MOEs. A regression tree is a recursive partition of the raw data into
sets of inputs containing similar responses. Partitioning of the data occurs successively,
according to the optimal splitting value determined from all possible values of each
available variable. Figure 19 displays a recursive split of the data from 780 MANA runs
on all of the experimental factors for the Mean-Percent-Correct-Identifications MOE.

36
0.808RSquare
780N
5
Numberof Splits
All RowsCountMeanStd Dev
78072.91662
21.810319546.03322LogWorth
38.0972Difference
DistBetwTwrs(2)CountMeanStd Dev
39053.86800412.814682
DistBetwTwrs(4)CountMeanStd Dev
39091.9652367.7988301
60.053335LogWorth
16.052Difference
EntityStealth>=0.93CountMeanStd Dev
3677.3949915.2352386
EntityStealth<0.93CountMeanStd Dev
35493.4469566.3604373
31.209192LogWorth
6.8505Difference
Cam2PClass<2900CountMeanStd Dev
10888.6864388.5728871
22.85835LogWorth
18.1722Difference
Cam1ClassRng<127CountMeanStd Dev
1272.5333338.1279751
Cam1ClassRng>=127CountMeanStd Dev
9690.7055766.1684583
Cam2PClass>=2900CountMeanStd Dev
24695.5369393.437301
26.305429LogWorth
3.82769Difference
EntitySpeed<7CountMeanStd Dev
9093.1096263.9466573
EntitySpeed>=7CountMeanStd Dev
15696.9373122.082526
Partition for MN(PerCorrID)
Figure 19. Regression tree split on the raw data by Mean-Percent-Correct-Identifications of Correct Identifications.
This analysis complements the regression analysis in the previous section. The
first split is made on Distance Between Pairs of Towers. This is the single most
significant factor identified. The regression tree provides the optimal split point at 2 km
and 4 km. G-BOSS towers placed 4 km apart provide a mean percent of correctly
identified role-players nearly two times greater than G-BOSS towers placed 2 km apart.
The next most important factor is Role-player Stealth. When G-BOSS towers are
placed 4 km apart and a sniper or IED emplacer’s stealth is less than 0.93, the expected
percent of correct identifications is 93%. If Role-player Stealth is greater than or equal to
0.93, then the percent of correct identifications drops to 77%. Although the particular
value of 0.93 does not translate directly to the real world, one of the key “uncontrollable
Placement of the G-BOSS towers is the most significant factor associated with the Mean-Percent-Correct-Identified MOE.
Larger MOE values associated with Distance Between Pairs of Towers is 4 km.

37
factors” is highly significant. This is a notable result. Perhaps countermeasures to enemy
stealth can offset this effect. For example, training G-BOSS operators to a higher level of
vigilance and detailed classification of “suspicious” behavior may be suitable
countermeasures. Other significant factors identified by the regression tree include:
• Camera 2 P(Classification) o (best when greater than .29)
• Camera 1 Classification Range o (best when greater than 127 model grid squares, which is roughly
equivalent to 2.5 km)
• Role-player Speed o (best when they are moving at speeds greater than 7/100 grid
squares per time step, which is roughly equivalent to 1 km/hr)
C. COC COORDINATION VERSUS STAND-ALONE COMPARISONS
This section examines whether the simulation results of a coordinated
configuration of G-BOSS improved operational effectiveness. This analysis is based on
both MOEs. The following comparisons are conducted:
• Coordinated configuration of G-BOSS against stand-alone configuration without MSTAR (distance between towers is set at 2 km).
• Coordinated configuration of G-BOSS against stand-alone configuration with MSTAR (distance between towers is set at 2 km).
The MOE data does not fit a Normal distribution. Thus, a nonparametric statistical
technique is used. The Wilcoxon Signed Ranks Test is designed to test whether a
particular sample came from a population with a specified mean or median
(Conover, 1999).
1. Coordinated versus Stand-Alone Configurations without MSTAR
This analysis is conducted as a hypothesis test. The null hypothesis is that the
differences between two independent populations of simulation data from a coordinated
G-BOSS configuration and a stand-alone configuration have the same mean. The
alternative hypothesis is that the means are not equal. The notation used for this test is:

38
_ _ _
tan _ _ _ _
0
1
( ) ~
( ) ~
: ( ) 0: ( ) 0
Coordinated Configuration without MSTAR
S d Alone Configuration without MSTAR
Mean PercentCorrectID F
Mean PercentCorrectID G
D F GH E DH E D
= −=
≠
Figures 20 and 21 show that without the presence of MSTAR, the means between the
coordinated G-BOSS approach and the stand-alone G-BOSS configuration are not equal.
There is evidence to reject the null hypothesis at a 0.05 or 0.10 level of significance. This
conclusion is based on the p-value (0.0001). There is a statistically significant increase in
performance between the networked configuration and the stand-alone configuration.
This finding is due to an increase of approximately two percentage points between the
two configurations. The small difference between the two configurations is so small that
it should not be considered a practical significant difference. In other words, there is not
enough evidence to deem the coordinated configuration more effective than the
stand-alone configuration, based on the marginal increase in performance.

39
30
40
50
60
70
Mea
n(Pe
rcC
orre
ctID
(3hi
ts))
0 2COCsWithMon
2Mon-Mean(PercCorrectID)0Mon-MeanPercCorrectID)Mean DifferenceStd ErrorUpper95%Low er95%
50.627248.63221.995040.385352.764871.22521
t-RatioDFProb > |t|Prob > tProb < t
5.1772164
<.0001*<.0001*1.0000
Test StatisticProb > |z|Prob > zProb < z
705.500
2Mon-Mean(PercCorrectID)-0Mon-MeanPercCorrectID)
<.0001*<.0001*1.0000
Wilcoxon Sign-Rank
Figure 20. Wilcoxon SignedRank Test results for coordinated G-BOSS configuration against stand-alone G-BOSS configuration for the Mean-Percent-Correct-Identification
MOE. (No MSTAR)
The Mean-Percent-Correct-Identification MOE values for the two G-BOSS configurations differ by a very small margin. There is no practical statistical
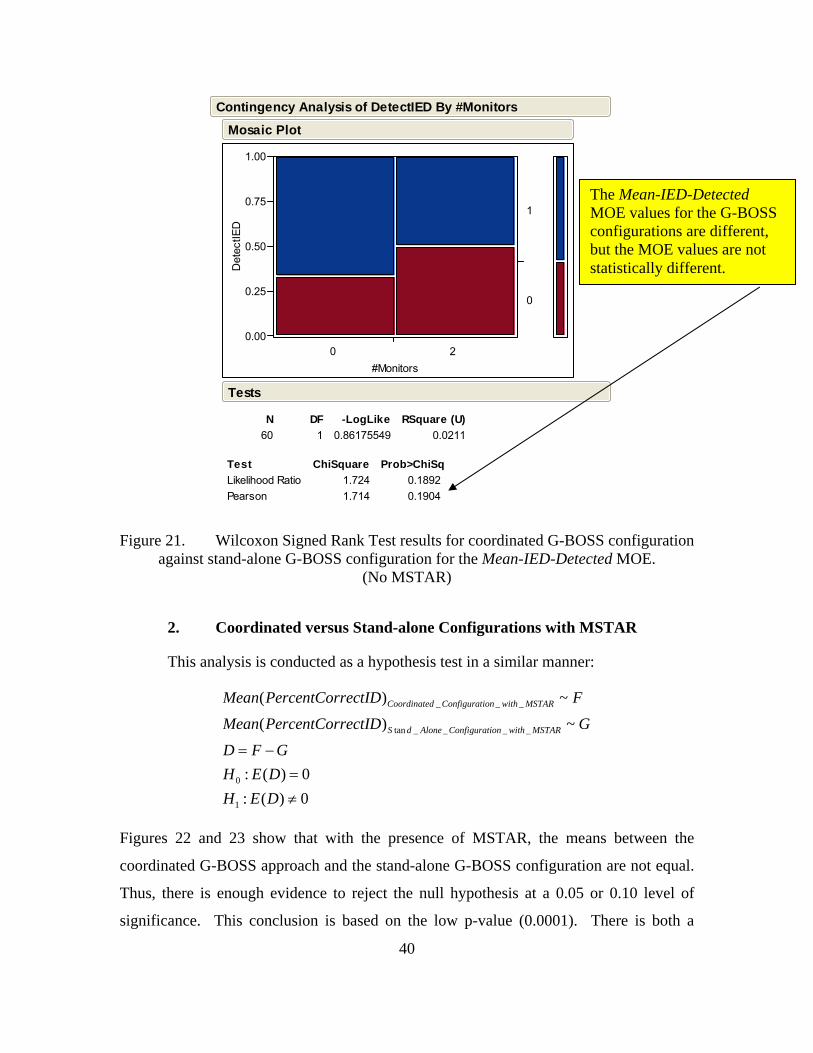
40
Det
ectIE
D
0.00
0.25
0.50
0.75
1.00
0 2#Monitors
0
1
Mosaic Plot
60N
1DF
0.86175549-LogLike
0.0211RSquare (U)
Likelihood RatioPearson
Test1.7241.714
ChiSquare0.18920.1904
Prob>ChiSq
Tests
Contingency Analysis of DetectIED By #Monitors
Figure 21. Wilcoxon Signed Rank Test results for coordinated G-BOSS configuration against stand-alone G-BOSS configuration for the Mean-IED-Detected MOE.
(No MSTAR)
2. Coordinated versus Stand-alone Configurations with MSTAR
This analysis is conducted as a hypothesis test in a similar manner:
_ _ _
tan _ _ _ _
0
1
( ) ~
( ) ~
: ( ) 0: ( ) 0
Coordinated Configuration with MSTAR
S d Alone Configuration with MSTAR
Mean PercentCorrectID F
Mean PercentCorrectID G
D F GH E DH E D
= −=≠
Figures 22 and 23 show that with the presence of MSTAR, the means between the
coordinated G-BOSS approach and the stand-alone G-BOSS configuration are not equal.
Thus, there is enough evidence to reject the null hypothesis at a 0.05 or 0.10 level of
significance. This conclusion is based on the low p-value (0.0001). There is both a
The Mean-IED-Detected MOE values for the G-BOSS configurations are different, but the MOE values are not statistically different.

41
statistically and practically significant increase in performance with the networked
configuration as compared to the stand-alone configuration. The performance with the
networked configuration increases by nearly 25% (from approximately 47% correct
classifications to about 70% correct classifications). This increase is significant enough
to deem the coordinated configuration more effective than the stand-alone configuration
based on the marginal increase in performance.
30
40
50
60
70
80
90
100M
ean(
Perc
Cor
rect
ID(3
hits
))
0 2COCsWithMon
2Mon-Mean(PercCorrectID)0Mon-Mean(PercCorrectID)Mean DifferenceStd ErrorUpper95%Low er95%NCorrelation
69.894947.442222.45271.7624925.973718.9318
650.4191
t-RatioDFProb > |t|Prob > tProb < t
12.7392164
<.0001*<.0001*1.0000
Test StatisticProb > |z|Prob > zProb < z
1069.50
2Mon-Mean(PercCorrectID)-0Mon-Mean(PercCorrectID)
<.0001*<.0001*1.0000
Wilcoxon Sign-Rank
Figure 22. Wilcoxon Signed Rank Test results for coordinated G-BOSS configuration against stand-alone G-BOSS configuration (with MSTAR).
The Mean-Percent-Correct-Identification MOE values for the two G-BOSS configurations differ by a large margin. The differences in the MOE values are statistically different.

42
Det
ectIE
D
0.00
0.25
0.50
0.75
1.00
0 2#Monitors
0
1
Mosaic Plot
60N
1DF
7.9382475-LogLike
0.2936RSquare (U)
Likelihood RatioPearson
Test15.87612.000
ChiSquare<.0001*0.0005*
Prob>ChiSq
Tests
Contingency Analysis of DetectIED By #Monitors
Figure 23. Wilcoxon Signed Rank Test results for coordinated G-BOSS configuration against stand-alone G-BOSS configuration for the Mean-IED-Detected MOE.
(With MSTAR)
The Mean-IED-Detected MOE values for the G-BOSS configurations are very different. The MOE values are statistically different.

43
V. CONCLUSIONS
This research set out to determine how Marines deployed now can best employ
G-BOSS. An operational test of G-BOSS conducted by MCOTEA is the basis for the
simulation model created in this study. This thesis produced a comparative, quantitative
analysis of G-BOSS employment TTPs and the critical factors that determine the level of
SA provided by G-BOSS. The results of this thesis provide insights to enhance
operational effectiveness of G-BOSS. Furthermore, the simulation built for this research
can serve as the foundation for many additional studies.
A. ANALYSIS INSIGHTS
The insights gained in this analysis are:
• The positioning of the towers is the most critical factor associated with enhancing the operational effectiveness of G-BOSS. A distance of 4 km between G-BOSS towers results in a proportion of correct identifications of 0.91 while a distance of 2 km results in a proportion of 0.53. When G-BOSS is employed in open terrain, more dispersion results in better performance.
• The stealth of the role-players has a significant effect on the proportion of correct identifications. This result is intuitive and helps validate the model, since snipers and IED emplacers tend to use stealth to mask their hostile acts or intent. Increased training of G-BOSS operators’ level of vigilance is a countermeasure to mitigate enemy stealth.
• The interaction between tower slew rate and stealth of the role-players is significant. A faster G-BOSS slew rate provides a greater proportion of correct identifications when role-players’ stealth is low. When role-players’ stealth is high, a low proportion of correct identifications is achieved, regardless of tower slew rate. Recall that tower slew rate is the model’s surrogate for the speed at which G-BOSS operators can observe a field-of-regard.
• Without the presence of MSTAR, the coordinated G-BOSS configuration produces a slightly larger proportion of correct identifications than the stand-alone G-BOSS configuration. The coordinated G-BOSS configuration results in an overall proportion of correct identification of 0.51, while the stand-alone G-BOSS configuration results in an overall proportion of correct identification of 0.49. The results of the comparison between the G-BOSS configurations are not practically significant. This

44
is based on the marginal increase of approximately two percentage points between the coordinated G-BOSS configuration and the stand-alone G-BOSS configuration. Further, this finding answers the question of underutilization: Stand-alone employment of G-BOSS is nearly as effective as a coordinated employment of G-BOSS without MSTAR.
• With MSTAR, the coordinated G-BOSS configuration produces a significantly larger proportion of correct identifications than what the stand-alone configuration produces. The coordinated G-BOSS configuration results in an overall proportion of correct identifications of 0.71 and the stand-alone configuration results in an overall proportion of correct identifications of 0.47. This result is practically and statistically significant. MSTAR facilitates the detection of more agents. MSTAR coupled with data fusion at the COC affords commanders an enhanced capability.
• The emplacement of the IED was detected in 76% of all of the simulation excursions conducted (which varied 13 factors associated with GBOSS or the role-players). This is promising since G-BOSS’s mission is to counter the threat of IEDs.
B. FOLLOW-ON WORK
The following is a list of follow on research of value stemming from this research:
• Additional validation and comparison of the MANA simulation results with the results of MCOTEA’s live experiment.
• Further research into the utility of using simulation to develop synthetic operational experiences in new doctrine and tactics.
• Human factors study on how the vigilance of G-BOSS operators affects the level of SA provided by G-BOSS.
• Application of the findings in this thesis on enhancing the operational effectiveness of G-BOSS in an urban environment.
• Research into the operational effectiveness provided by G-BOSS when integrated with various organic assets (UAS, C2 assets, and Fire Support Systems).

45
LIST OF REFERENCES
Cioppa, T.M., & Lucas, T.W. (2007). “Efficient Nearly Orthogonal and Space-Filling Latin Hypercubes.” Technometrics, 49 (1), p. 45.
Conover, W.J. (1999). Practical Nonparametric Statistics. 3rd Edition. New York, NY:
John Wiley & Sons, pp. 352-356. Defense Acquisition University 10th edition Glossary. Available at https://acc.dau.mil/
simplify/ev.php?ID=23461_201&ID2=DO_PRINTPAGE. Endsley, M.R., & Garland, D.J. (2000). Situation Awareness Analysis and
Measurement. Mawah, NJ: Lawrence Erlbaum Associates, p. 5. Marine Corps Combat Development Command. (2007). “G-BOSS Operational Concept,
Coordinating Draft.” Combat Development Directorate, Force Protection Integration Division, p. 2.
McIntosh, G.C., Galligan, D.P., Anderson, M.A., & Lauren, M.K. (2007). “MANA
Help File.” MANA (Map Aware Non-Uniform Automata) Version 4 User’s Manual, Defence Technology Agency, New Zealand, pp. 1-6.
Montgomery, D.C., Peck, E.A., & Vining, G.G. (2006). Introduction to Linear
Regression Analysis. 4th Edition. Hoboken, NJ: John Wiley & Sons Inc., pp. 63-75.

46
THIS PAGE INTENTIONALLY LEFT BLANK

47
INITIAL DISTRIBUTION LIST
1. Defense Technical Information Center Ft. Belvoir, Virginia
2. Dudley Knox Library Naval Postgraduate School Monterey, California
3. Joint Improvised Explosive Device Defeat Organization (JIEDDO) Crystal City, Virginia
4. Marine Corps Operational Test and Evaluation Activity (MCOTEA) Quantico, Virginia
5. Marine Corps Systems Command (MCSC) Quantico, Virginia
6. Marine Corps Combat Development Command (MCCDC) Quantico, Virginia