navarro college fact book 2016-17 · dual credit enrollment by school ... and integrated...
TRANSCRIPT
NAVARRO COLLEGE FACT BOOK 2016-17

Return to Table of Contents 2 | P a g e
NAVARRO COLLEGE FACT BO0K
Cover .............................................................................................................................................................................................................................. 1
Table of Contents ....................................................................................................................................................................................................... 2-4
Welcome ........................................................................................................................................................................................................................ 5
History of the College .................................................................................................................................................................................................... 6
Mission & Goals ............................................................................................................................................................................................................. 7
Board of Trustees .......................................................................................................................................................................................................... 8
Campus Locations .......................................................................................................................................................................................................... 9
Service Area ................................................................................................................................................................................................................. 10
Household Income & Educational Attainment within Navarro College Service Area ............................................................................................. 11
Annual Unemployment Rate .................................................................................................................................................................................... 12
Percent of Population Employed in Various Industries within Navarro College Service Area ............................................................................... 13
Fastest Growing Occupations in Texas .................................................................................................................................................................... 14
Scene from Campus Life .......................................................................................................................................................................................... 15
Navarro College District .............................................................................................................................................................................................. 16
Student Demographics ........................................................................................................................................................................................ 17-18
Students with Special Needs .................................................................................................................................................................................... 19
District-wide Annual Enrollment & Contact Hours .................................................................................................................................................. 20
District-wide Fall Enrollment & Contact Hours ....................................................................................................................................................... 21
District-wide Spring Enrollment & Contact Hours .................................................................................................................................................. 22
District-wide Summer Enrollment & Contact Hours ............................................................................................................................................... 23
District-wide Annual Enrollment & Contact Hours by Campus ............................................................................................................................... 24
Scene from Campus Life ......................................................................................................................................................................................... 25
Corsicana Campus ....................................................................................................................................................................................................... 26
Corsicana Fall Enrollment & Contact Hours ............................................................................................................................................................ 27
Corsicana Spring Enrollment & Contact Hours ....................................................................................................................................................... 28
Corsicana Summer Enrollment & Contact Hours .................................................................................................................................................... 29
Waxahachie Campus ................................................................................................................................................................................................... 30
Waxahachie Fall Enrollment & Contact Hours ........................................................................................................................................................ 31

Return to Table of Contents 3 | P a g e
NAVARRO COLLEGE FACT BO0K
Waxahachie Spring Enrollment & Contact Hours ................................................................................................................................................... 32
Waxahachie Summer Enrollment & Contact Hours ................................................................................................................................................ 33
Midlothian Campus ..................................................................................................................................................................................................... 34
Midlothian Fall Enrollment & Contact Hours .......................................................................................................................................................... 35
Midlothian Spring Enrollment & Contact Hours ..................................................................................................................................................... 36
Midlothian Summer Enrollment & Contact Hours ........................................................................................................................................................................ 37
South Campus .............................................................................................................................................................................................................. 38
South Campus Fall Enrollment & Contact Hours .................................................................................................................................................... 39 South Campus Spring Enrollment & Contact Hours ................................................................................................................................................ 40 South Campus Summer Enrollment & Contact Hours ............................................................................................................................................ 41
District-wide eLearning ............................................................................................................................................................................................... 42 District-wide eLearning Fall Enrollment & Contact Hours ...................................................................................................................................... 43 District-wide eLearning Spring Enrollment & Contact Hours .................................................................................................................................. 44
District-wide eLearning Summer Enrollment & Contact Hours .................................................................................................................................................... 45
Dual Credit ................................................................................................................................................................................................................... 46
Dual Credit Percent of Total Enrollment & Dual Credit by Campus ........................................................................................................................ 47
Dual Credit Enrollment by School District ................................................................................................................................................................ 48
District-wide Dual Credit Fall Enrollment & Contact Hours .................................................................................................................................... 49
Accountability .............................................................................................................................................................................................................. 50
First Time Full Time Persistence Fall Cohort Returning in Spring by Campus & Annual Success Points ................................................................. 51
Degrees Awarded & Certificates Awarded .............................................................................................................................................................. 52
Accountability .......................................................................................................................................................................................................... 53
Service Area High School Graduation Comparison ................................................................................................................................................. 54
Annual Licensure Report ......................................................................................................................................................................................... 55
Students Pursuing Additional Education ................................................................................................................................................................. 56
Scene from Campus Life .......................................................................................................................................................................................... 57
Employees ................................................................................................................................................................................................................... 58
Number of Employees & Status ............................................................................................................................................................................... 59
Full Time Employee by Gender & Ethnicity.............................................................................................................................................................. 60
Faculty Status & Degrees ........................................................................................................................................................................................ 61

Return to Table of Contents 4 | P a g e
NAVARRO COLLEGE FACT BO0K
Finances ....................................................................................................................................................................................................................... 62
Source of Revenues .................................................................................................................................................................................................. 63
Educational General Fund Source of Funds ............................................................................................................................................................ 63
Financial Aid Awarded ............................................................................................................................................................................................. 63

Return to Table of Contents 5 | P a g e
NAVARRO COLLEGE FACT BO0K
Welcome
Office of Enrollment Management & Institutional Effectiveness
The Office of Enrollment Management and Institutional Effectiveness is pleased to present the 2016-2017 Navarro College Fact Book. The goal of this annual
publication is to provide a detailed profile of the district, including data on students, employees, programs, and services. The Office of Enrollment Management
and Institutional Effectiveness is responsible for assembling the information and data included in the 2016-17 Fact Book. Other key resources used include the
Texas Higher Education Coordinating Board (THECB) and Integrated Postsecondary Education Data System (IPEDS).
A concerted effort is made to make this publication an increasingly more useful reference while highlighting the scope and progress of Navarro College. Special
thanks go to Debbie Pickett, Institutional Research Specialist, and Elizabeth Chivers, Director of Institutional Research, for their extensive contribution. We hope
you find the data presented in this report useful and readable. We welcome your comments and suggestions for next year’s Fact Book. Should you have any
questions about the information presented, please feel free to contact us at 903-875-7376 or [email protected].
Sina Ruiz
Vice President of Enrollment Management and Institutional Effectiveness
The Office of Enrollment Management and Institutional Effectiveness Team
From left to right: Elizabeth Chivers, Director of Institutional Research; Sina Ruiz, Vice
President of Enrollment Management and Institutional Effectiveness; Debbie Pickett,
Institutional Research Specialist & Navarro College Fact Book Editor

Return to Table of Contents 6 | P a g e
NAVARRO COLLEGE FACT BO0K
History of the College
In the spring of 1946, a group of local citizens met to form a steering committee for the purpose of establishing a junior college in Navarro County. In a general
election held July 16, 1946, voters approved the creation of Navarro Junior College and authorized a county tax to help finance the institution. In that same
election voters chose a seven member board of trustees to govern the College. The first students began classes in September, 1946. Most of the 238 members
of that first student body were returning veterans from World War II taking advantage of assistance available under the newly enacted GI Bill. The first campus
of Navarro College was the site of the Air Activities of Texas, a World War II primary flight school located six miles south of Corsicana.
In 1951 the campus was moved to its present location, a 47 acre tract west of downtown Corsicana on State Highway 31. The campus has expanded to 103 acres
with 23 buildings. In 1954 Navarro was accredited by the Southern Association of Colleges and Schools. The accreditation was reaffirmed in 1964, 1974, 1985,
1995, and again in 2006.
In 1974 the College broadened its philosophy and purpose to encompass the comprehensive community based educational concept, adding occupational
education programs and implementing new education concepts including individualized and self-paced instruction and the use of audio-tutorial instructional
media. In keeping with the new educational role, the word “junior” was dropped from the Institution’s name, and the official name Navarro College was adopted
by the Board of Trustees. In an attempt to address the growing needs of its service area, which consists of Navarro, Ellis, Freestone, Limestone, and Leon counties,
the College began offering courses in various locations in those areas in the early 1970s and eventually established two permanent centers, Navarro College
South at Mexia and the Ellis County Center at Waxahachie. In January 2006, a new campus in Midlothian opened to better serve students in the Midlothian area.
In 2014 Navarro established a campus in Fairfield with a focus primarily on vocational and technical programs to serve communities in Freestone, Limestone,
and Leon counties.
Navarro College has had six presidents: Mr. Ray Waller, the founding president served until his death in 1956; Dr. Ben W. Jones served from 1956 until 1973; Dr.
Kenneth P. Walker served from 1974 until 1988; Dr. Gerald E. Burson served from 1989 until his retirement in January 1998; Dr. Richard Sanchez served from
1998 until his retirement in 2013; Dr. Barbara Kavalier, the sixth District President, served from 2013 until her resignation in 2016.
Dr. Richard Sanchez came out of retirement to serve as Interim Chancellor through August 2016 and is currently serving as District President.

Return to Table of Contents 7 | P a g e
NAVARRO COLLEGE FACT BO0K
Mission and Goals
Mission Statement
Navarro College provides educational opportunities that empower students to achieve their personal, academic, and career goals and that promote life-long
learning for all communities.
Strategic Goals
Set the Path to Success
Goal 1: Create, maintain, and improve a pathway where students are guided through an enriched educational experience and the potential individual success
of each student is maximized.
Empower and Support Student’s Journey to Success
Goal 2: Provide students individualized support throughout the education process ensuring each student is empowered to learn and is fully informed of
choices and opportunities.
Develop and Sustain Our Resources to Deliver Optimal Educational Opportunities
Goal 3: Ensure resources are adequate for their intended purpose and are sustained and continuously upgraded as we advance the mission of the College.
Ensure Institutional Effectiveness and Transparency
Goal 4: Advance and maintain a culture of ongoing accountability and transparency to those we serve and to whom we are responsible.

Return to Table of Contents 8 | P a g e
NAVARRO COLLEGE FACT BO0K
Board of Trustees
Back Row: Loran Seely, Corsicana; Todd McGraw, Blooming Grove; A.L. Atkeisson, Kerens.
Front Row: Phil Judson, Vice Chairman, Corsicana; Lloyd Huffman, Chairman, Corsicana; Faith Holt, Corsicana; Richard Aldama, Secretary/Treasurer, Corsicana

Return to Table of Contents 9 | P a g e
NAVARRO COLLEGE FACT BO0K
Campus Locations

Return to Table of Contents 10 | P a g e
NAVARRO COLLEGE FACT BO0K
SERVICE AREA
Return to Table of Contents 11 | P a g e
NAVARRO COLLEGE FACT BO0K
Ellis CountyFreestone
CountyLeon County
Limestone
County
Navarro
County
5 County
Service AreaTexas United States
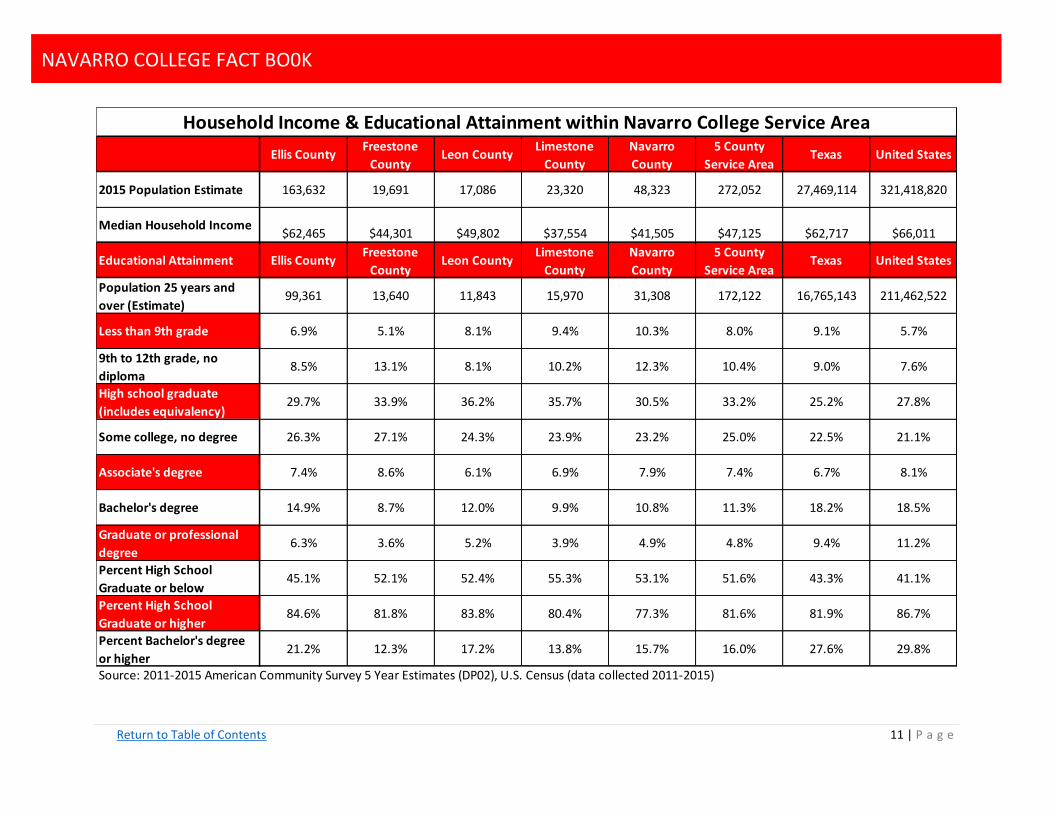
2015 Population Estimate 163,632 19,691 17,086 23,320 48,323 272,052 27,469,114 321,418,820
Median Household Income$62,465 $44,301 $49,802 $37,554 $41,505 $47,125 $62,717 $66,011
Educational Attainment Ellis CountyFreestone
CountyLeon County
Limestone
County
Navarro
County
5 County
Service AreaTexas United States
Population 25 years and
over (Estimate)99,361 13,640 11,843 15,970 31,308 172,122 16,765,143 211,462,522
Less than 9th grade 6.9% 5.1% 8.1% 9.4% 10.3% 8.0% 9.1% 5.7%
9th to 12th grade, no
diploma8.5% 13.1% 8.1% 10.2% 12.3% 10.4% 9.0% 7.6%
High school graduate
(includes equivalency)29.7% 33.9% 36.2% 35.7% 30.5% 33.2% 25.2% 27.8%
Some college, no degree 26.3% 27.1% 24.3% 23.9% 23.2% 25.0% 22.5% 21.1%
Associate's degree 7.4% 8.6% 6.1% 6.9% 7.9% 7.4% 6.7% 8.1%
Bachelor's degree 14.9% 8.7% 12.0% 9.9% 10.8% 11.3% 18.2% 18.5%
Graduate or professional
degree6.3% 3.6% 5.2% 3.9% 4.9% 4.8% 9.4% 11.2%
Percent High School
Graduate or below45.1% 52.1% 52.4% 55.3% 53.1% 51.6% 43.3% 41.1%
Percent High School
Graduate or higher84.6% 81.8% 83.8% 80.4% 77.3% 81.6% 81.9% 86.7%
Percent Bachelor's degree
or higher21.2% 12.3% 17.2% 13.8% 15.7% 16.0% 27.6% 29.8%
Source: 2011-2015 American Community Survey 5 Year Estimates (DP02), U.S. Census (data collected 2011-2015)
Household Income & Educational Attainment within Navarro College Service Area
Return to Table of Contents 12 | P a g e
NAVARRO COLLEGE FACT BO0K
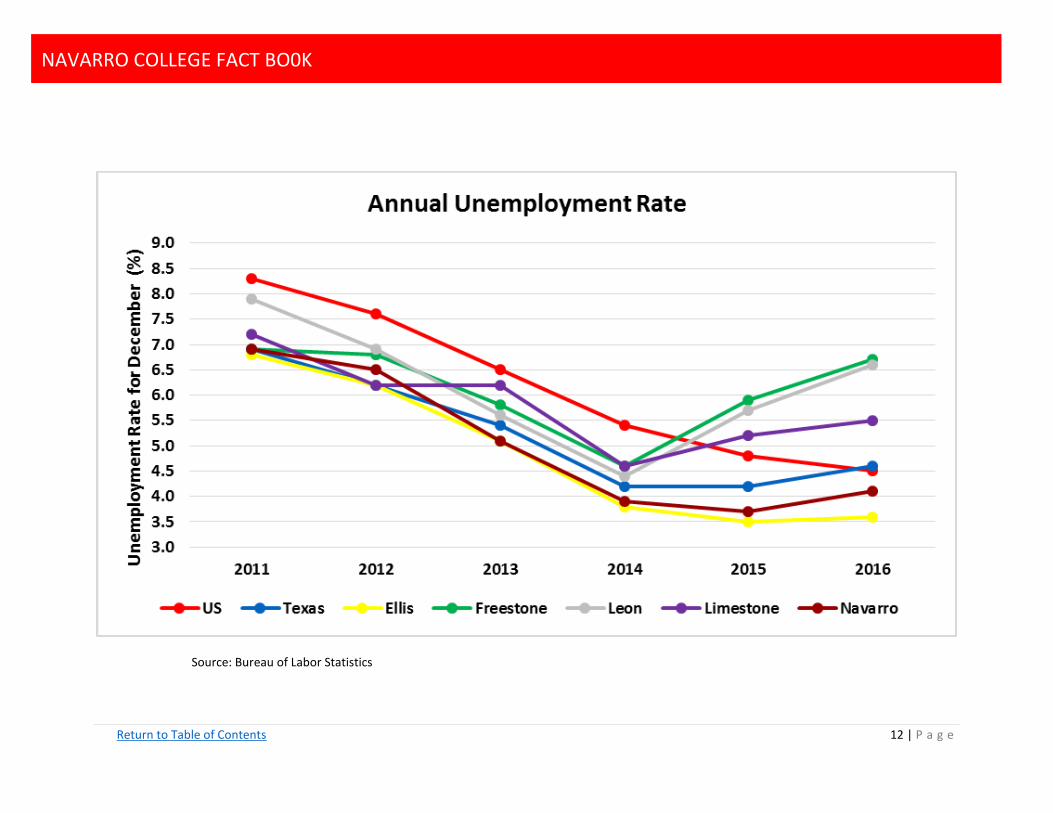
Source: Bureau of Labor Statistics
Return to Table of Contents 13 | P a g e
NAVARRO COLLEGE FACT BO0K
Industry Ellis Freestone Leon Limestone Navarro5 County
Service AreaTexas United States
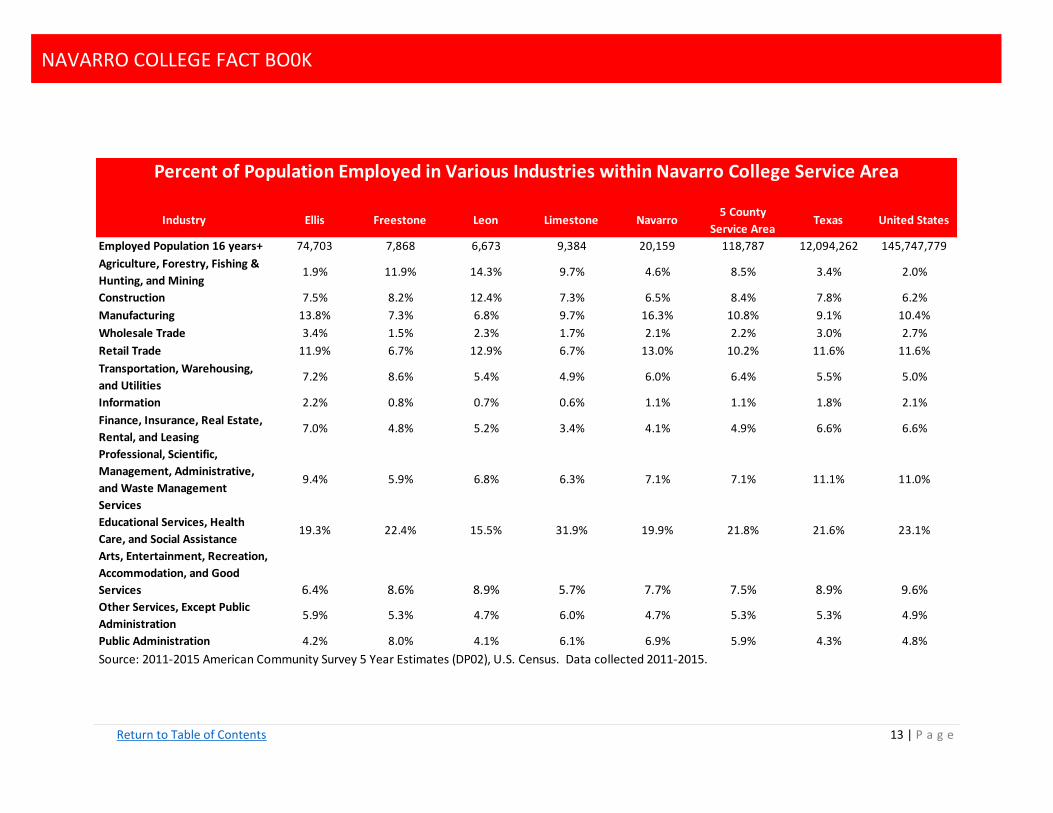
Employed Population 16 years+ 74,703 7,868 6,673 9,384 20,159 118,787 12,094,262 145,747,779
Agriculture, Forestry, Fishing &
Hunting, and Mining1.9% 11.9% 14.3% 9.7% 4.6% 8.5% 3.4% 2.0%
Construction 7.5% 8.2% 12.4% 7.3% 6.5% 8.4% 7.8% 6.2%
Manufacturing 13.8% 7.3% 6.8% 9.7% 16.3% 10.8% 9.1% 10.4%
Wholesale Trade 3.4% 1.5% 2.3% 1.7% 2.1% 2.2% 3.0% 2.7%
Retail Trade 11.9% 6.7% 12.9% 6.7% 13.0% 10.2% 11.6% 11.6%
Transportation, Warehousing,
and Utilities7.2% 8.6% 5.4% 4.9% 6.0% 6.4% 5.5% 5.0%
Information 2.2% 0.8% 0.7% 0.6% 1.1% 1.1% 1.8% 2.1%
Finance, Insurance, Real Estate,
Rental, and Leasing7.0% 4.8% 5.2% 3.4% 4.1% 4.9% 6.6% 6.6%
Professional, Scientific,
Management, Administrative,
and Waste Management
Services
9.4% 5.9% 6.8% 6.3% 7.1% 7.1% 11.1% 11.0%
Educational Services, Health
Care, and Social Assistance19.3% 22.4% 15.5% 31.9% 19.9% 21.8% 21.6% 23.1%
Arts, Entertainment, Recreation,
Accommodation, and Good
Services 6.4% 8.6% 8.9% 5.7% 7.7% 7.5% 8.9% 9.6%
Other Services, Except Public
Administration5.9% 5.3% 4.7% 6.0% 4.7% 5.3% 5.3% 4.9%
Public Administration 4.2% 8.0% 4.1% 6.1% 6.9% 5.9% 4.3% 4.8%
Source: 2011-2015 American Community Survey 5 Year Estimates (DP02), U.S. Census. Data collected 2011-2015.
Percent of Population Employed in Various Industries within Navarro College Service Area

Return to Table of Contents 14 | P a g e
NAVARRO COLLEGE FACT BO0K
Source: careerinfonet.org (sponsored by the US Department of Labor)
*Programs we offer align with these occupations

Return to Table of Contents 15 | P a g e
NAVARRO COLLEGE FACT BO0K

Return to Table of Contents 16 | P a g e
NAVARRO COLLEGE FACT BO0K
NAVARRO COLLEGE DISTRICT
Return to Table of Contents 17 | P a g e
NAVARRO COLLEGE FACT BO0K
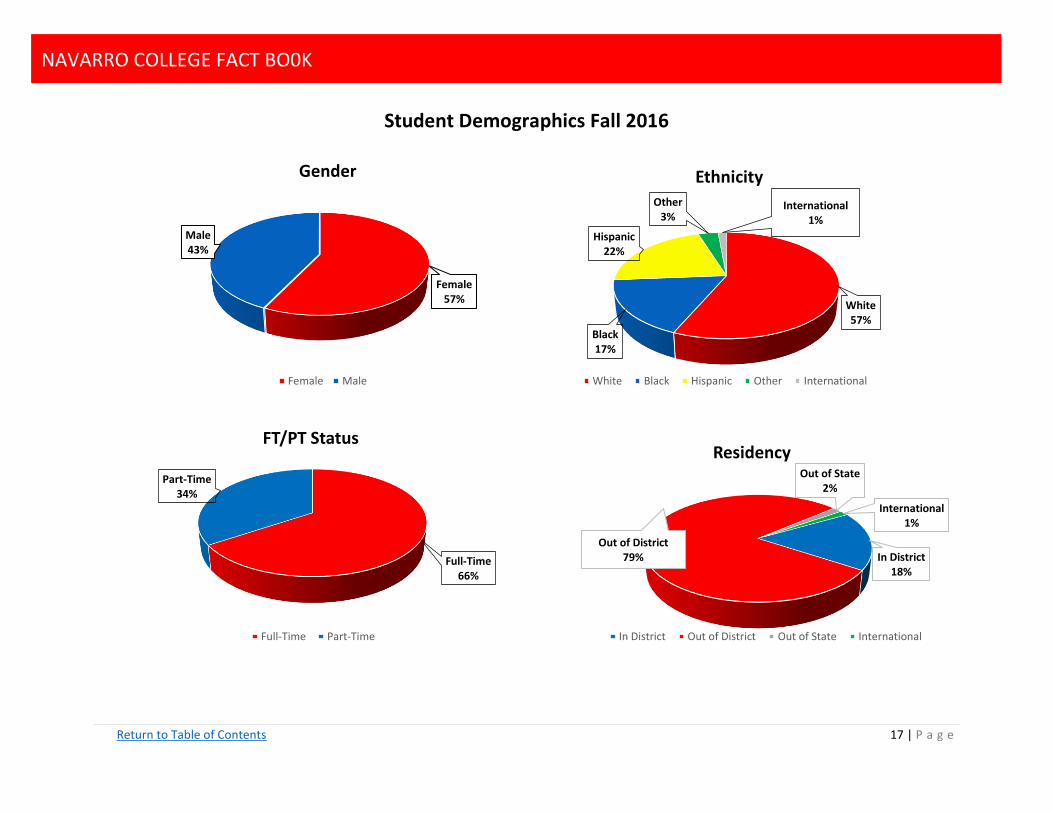
Student Demographics Fall 2016
Female57%
Male43%
Gender
Female Male
White57%
Black17%
Hispanic22%
Other3%
International 1%
Ethnicity
White Black Hispanic Other International
Full-Time66%
Part-Time34%
FT/PT Status
Full-Time Part-Time
In District18%
Out of District79%
Out of State2%
International 1%
Residency
In District Out of District Out of State International

Return to Table of Contents 18 | P a g e
NAVARRO COLLEGE FACT BO0K
Student Demographics Fall 2016
< 18 18-19 20-21 22-24 25-29 30-34 35-39 40-49 50 & >
Age Group 3,383 2,286 1,107 694 636 375 256 346 147
0
1,000
2,000
3,000
4,000
Student Age Group
Age Group
Corsicana40%
Waxahachie25%
Midlothian32%
eLearning3%
International Students
Corsicana Waxahachie
White 22%
Black 62%
Hispanic 8%
Non-Resident 4%
Other 4%
Residence Life Ethnicity
White Black Hispanic Non-Resident Other

Return to Table of Contents 19 | P a g e
NAVARRO COLLEGE FACT BO0K
Economically
Disadvantaged
Academically
Disadvantaged
First
Generation
First Time
in College Disabilities Veterans
Percentage Overall 30.6% 42.2% 9.6% 18.6% 2.0% 1.5%
Campus
Corsicana 1,157 1,226 246 800 99 40
Waxahachie 594 1,193 212 450 9 70
Midlothain 140 378 63 172 26 16
Mexia 146 456 67 92 46 11
eLearning 786 642 304 207 NA NA
Ethnicity
Two or More Races 51 54 18 28 NA 0
White 1,200 1,992 479 737 NA 98
Black 926 879 165 479 NA 14
Hispanic 600 821 220 434 NA 24
Asian 24 48 6 8 NA 0
Indian 15 29 3 8 NA 0
International 1 63 1 24 NA 0
Pacific Islander 6 10 0 3 NA 1
Students with Special Needs
Return to Table of Contents 20 | P a g e
NAVARRO COLLEGE FACT BO0K
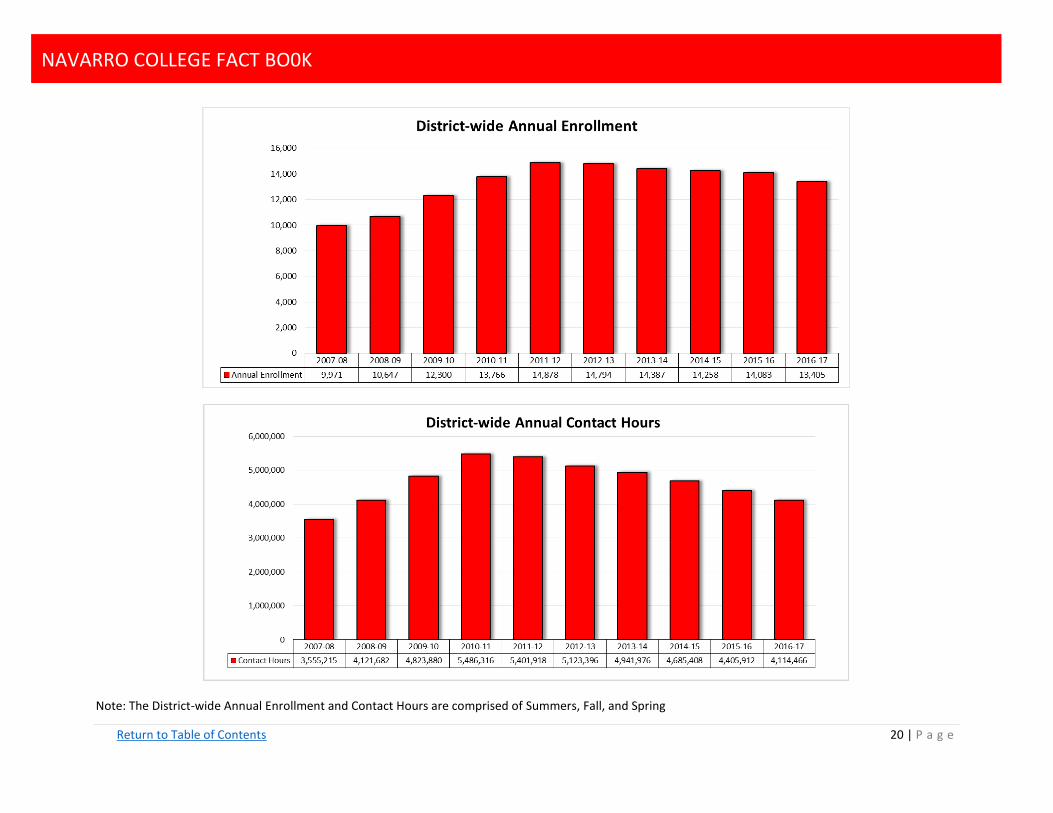
Note: The District-wide Annual Enrollment and Contact Hours are comprised of Summers, Fall, and Spring

Return to Table of Contents 21 | P a g e
NAVARRO COLLEGE FACT BO0K
2007 2008 2009 2010 2011 2012 2013 2014 2015 2016
Fall 1,537,024 1,722,452 1,963,072 2,193,180 2,225,338 2,156,992 2,120,400 2,016,736 1,875,360 1,793,612
0
500,000
1,000,000
1,500,000
2,000,000
2,500,000
District-wide Fall Contact Hours

Return to Table of Contents 22 | P a g e
NAVARRO COLLEGE FACT BO0K

Return to Table of Contents 23 | P a g e
NAVARRO COLLEGE FACT BO0K
2007 2008 2009 2010 2011 2012 2013 2014 2015 2016
Summer 1 3,129 3,393 3,590 4,368 4,989 4,157 3,962 3,634 3,952 2,751
Summer 2 1,108 1,327 1,864 2,722 2,527 2,147 1,811 1,743 1,490 2,273
0
1,000
2,000
3,000
4,000
5,000
6,000
District-wide Summer Enrollment
2007 2008 2009 2010 2011 2012 2013 2014 2015 2016
Summer 1 318,288 425,068 506,392 635,968 689,780 568,020 554,180 499,804 540,576 298,720
Summer 2 89,440 131,584 165,152 267,232 243,520 210,096 168,784 155,472 143,680 284,196
0
100,000
200,000
300,000
400,000
500,000
600,000
700,000
800,000
District-wide Summer Contact Hours

Return to Table of Contents 24 | P a g e
NAVARRO COLLEGE FACT BO0K

Return to Table of Contents 25 | P a g e
NAVARRO COLLEGE FACT BO0K

Return to Table of Contents 26 | P a g e
NAVARRO COLLEGE FACT BO0K
CORSICANA CAMPUS

Return to Table of Contents 27 | P a g e
NAVARRO COLLEGE FACT BO0K

Return to Table of Contents 28 | P a g e
NAVARRO COLLEGE FACT BO0K
Return to Table of Contents 29 | P a g e
NAVARRO COLLEGE FACT BO0K
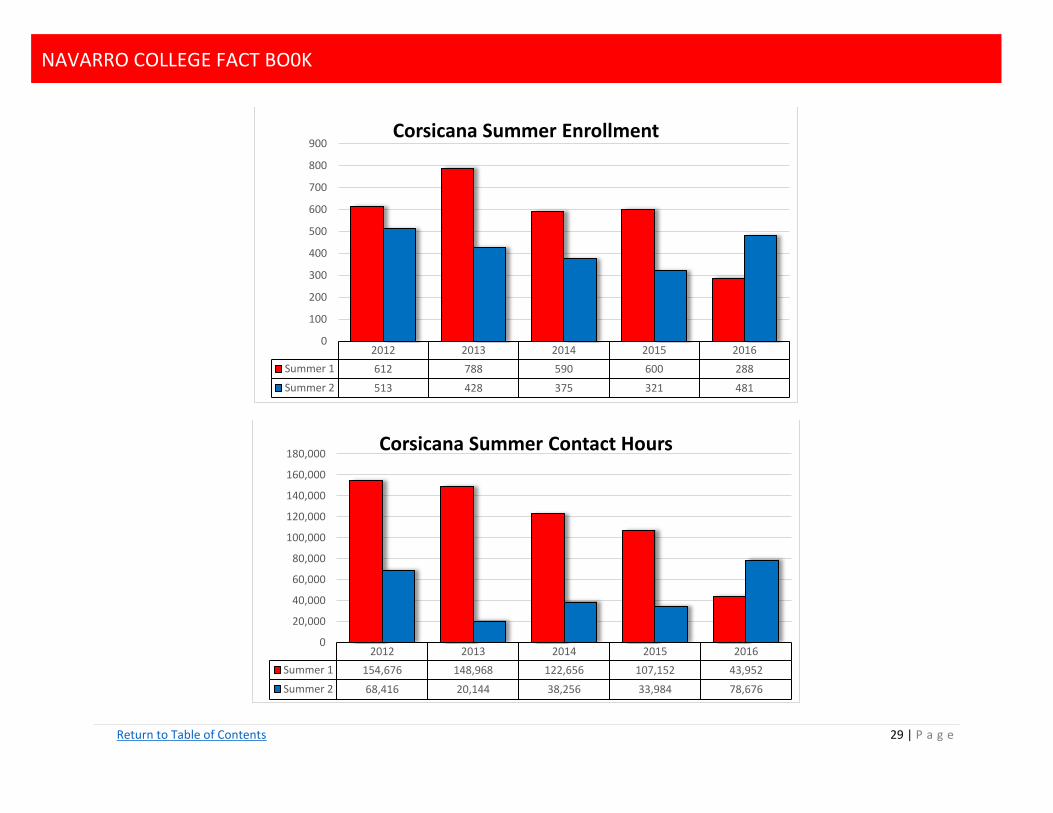
2012 2013 2014 2015 2016
Summer 1 612 788 590 600 288
Summer 2 513 428 375 321 481
0
100
200
300
400
500
600
700
800
900Corsicana Summer Enrollment
2012 2013 2014 2015 2016
Summer 1 154,676 148,968 122,656 107,152 43,952
Summer 2 68,416 20,144 38,256 33,984 78,676
0
20,000
40,000
60,000
80,000
100,000
120,000
140,000
160,000
180,000Corsicana Summer Contact Hours

Return to Table of Contents 30 | P a g e
NAVARRO COLLEGE FACT BO0K
WAXAHACHIE CAMPUS
Return to Table of Contents 31 | P a g e
NAVARRO COLLEGE FACT BO0K

Return to Table of Contents 32 | P a g e
NAVARRO COLLEGE FACT BO0K
Return to Table of Contents 33 | P a g e
NAVARRO COLLEGE FACT BO0K
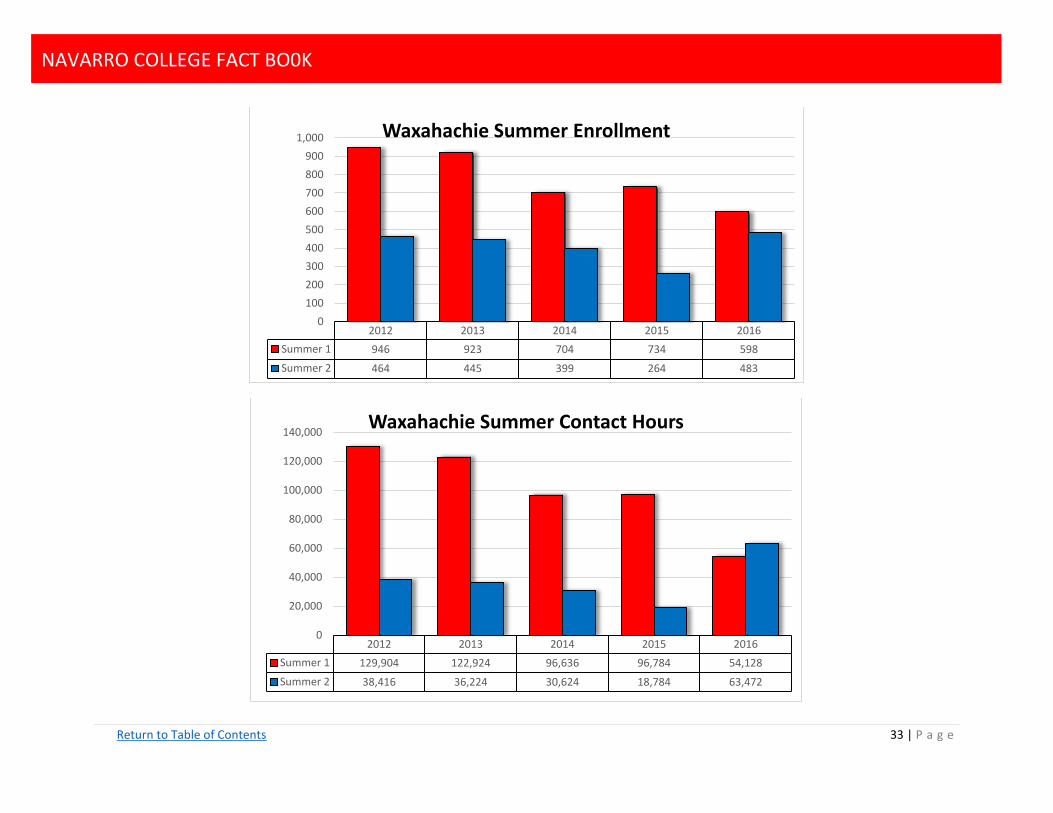
2012 2013 2014 2015 2016
Summer 1 946 923 704 734 598
Summer 2 464 445 399 264 483
0
100
200
300
400
500
600
700
800
900
1,000 Waxahachie Summer Enrollment
2012 2013 2014 2015 2016
Summer 1 129,904 122,924 96,636 96,784 54,128
Summer 2 38,416 36,224 30,624 18,784 63,472
0
20,000
40,000
60,000
80,000
100,000
120,000
140,000Waxahachie Summer Contact Hours
Return to Table of Contents 34 | P a g e
NAVARRO COLLEGE FACT BO0K
MIDLOTHIAN CAMPUS

Return to Table of Contents 35 | P a g e
NAVARRO COLLEGE FACT BO0K
Return to Table of Contents 36 | P a g e
NAVARRO COLLEGE FACT BO0K

Return to Table of Contents 37 | P a g e
NAVARRO COLLEGE FACT BO0K
2012 2013 2014 2015 2016
Summer 1 221 203 167 195 137
Summer 2 137 118 111 94 114
0
50
100
150
200
250Midlothian Summer Enrollment
2012 2013 2014 2015 2016
Summer 1 15,888 13,088 12,304 26,256 9,312
Summer 2 9,296 7,744 8,480 7,440 8,848
0
5,000
10,000
15,000
20,000
25,000
30,000
Midlothian Summer Contact Hours
Return to Table of Contents 38 | P a g e
NAVARRO COLLEGE FACT BO0K
SOUTH CAMPUS

Return to Table of Contents 39 | P a g e
NAVARRO COLLEGE FACT BO0K

Return to Table of Contents 40 | P a g e
NAVARRO COLLEGE FACT BO0K

Return to Table of Contents 41 | P a g e
NAVARRO COLLEGE FACT BO0K
2012 2013 2014 2015 2016
Summer 1 293 307 349 393 289
Summer 2 108 92 113 60 254
0
50
100
150
200
250
300
350
400
450
500South Campus Summer Enrollment
2012 2013 2014 2015 2016
Summer 1 60,304 77,264 89,120 105,552 76,208
Summer 2 27,056 11,440 22,016 23,856 39,888
0
20,000
40,000
60,000
80,000
100,000
120,000
140,000
South Campus Summer Contact Hours

Return to Table of Contents 42 | P a g e
NAVARRO COLLEGE FACT BO0K
DISTRICT-WIDE eLEARNING

Return to Table of Contents 43 | P a g e
NAVARRO COLLEGE FACT BO0K
2012 2013 2014 2015 2016
Fall 3,691 3,836 3,395 3,525 3,348
0
500
1,000
1,500
2,000
2,500
3,000
3,500
4,000
4,500District-wide eLearning Fall Enrollment
2012 2013 2014 2015 2016
Fall 434,224 430,480 388,048 379,728 348,700
0
50,000
100,000
150,000
200,000
250,000
300,000
350,000
400,000
450,000
500,000District-wide eLearning Fall Contact Hours

Return to Table of Contents 44 | P a g e
NAVARRO COLLEGE FACT BO0K

Return to Table of Contents 45 | P a g e
NAVARRO COLLEGE FACT BO0K
2012 2013 2014 2015 2016
Summer 1 2,373 2,253 2,132 2,447 1,657
Summer 2 1,011 961 868 934 1,223
0
500
1,000
1,500
2,000
2,500
3,000District-wide eLearning Summer Enrollment
2012 2013 2014 2015 2016
Summer 1 207,248 191,936 175,168 204,832 113,328
Summer 2 66,912 63,232 55,856 59,616 93,312
0
50,000
100,000
150,000
200,000
250,000District-wide eLearning Summer Contact Hours

Return to Table of Contents 46 | P a g e
NAVARRO COLLEGE FACT BO0K
DUAL CREDIT
Return to Table of Contents 47 | P a g e
NAVARRO COLLEGE FACT BO0K
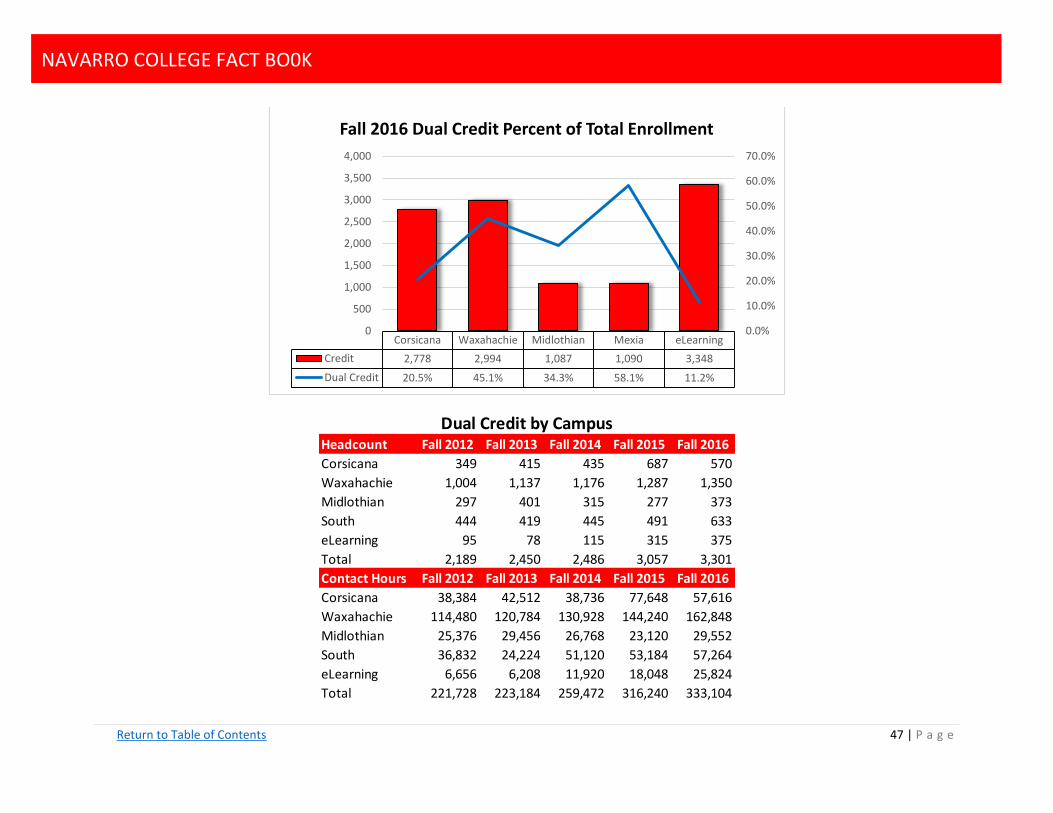
Corsicana Waxahachie Midlothian Mexia eLearning
Credit 2,778 2,994 1,087 1,090 3,348
Dual Credit 20.5% 45.1% 34.3% 58.1% 11.2%
0.0%
10.0%
20.0%
30.0%
40.0%
50.0%
60.0%
70.0%
0
500
1,000
1,500
2,000
2,500
3,000
3,500
4,000
Fall 2016 Dual Credit Percent of Total Enrollment
Headcount Fall 2012 Fall 2013 Fall 2014 Fall 2015 Fall 2016
Corsicana 349 415 435 687 570
Waxahachie 1,004 1,137 1,176 1,287 1,350
Midlothian 297 401 315 277 373
South 444 419 445 491 633
eLearning 95 78 115 315 375
Total 2,189 2,450 2,486 3,057 3,301
Contact Hours Fall 2012 Fall 2013 Fall 2014 Fall 2015 Fall 2016
Corsicana 38,384 42,512 38,736 77,648 57,616
Waxahachie 114,480 120,784 130,928 144,240 162,848
Midlothian 25,376 29,456 26,768 23,120 29,552
South 36,832 24,224 51,120 53,184 57,264
eLearning 6,656 6,208 11,920 18,048 25,824
Total 221,728 223,184 259,472 316,240 333,104
Dual Credit by Campus

Return to Table of Contents 48 | P a g e
NAVARRO COLLEGE FACT BO0K
Dual Credit Enrollment By School District Fall 2016 High School Enrollment High School Enrollment
Ellis County Freestone County
Avalon High School 34 Fairfield High School 95
Ennis High School 63 Teague High School 77
Ferris High School 84 Wortham High School 29
Italy High School 40 Leon County
Life School Red Oak 78 Buffalo High School 40
Maypearl High School 98 Centerville High School 34
Midlothian High School 352 Leon High School 47
Midlothian Heritage High School 64 Normangee High School 89
Milford High School 12 Oakwood High School 11
Palmer High School 73 Limestone County
Red Oak High School 257 Coolidge High School 12
Rice High School 42 Groesbeck High School 133
Waxahachie Global High School 419 Mexia High School 89
Waxahachie High School 304 Other
Waxahachie Preparatory Academy 7 Palestine High School 26
Navarro County Elkhart High School 4
Blooming Grove High School 62 Gainesville State School 15
Corsicana High School 350 Lone Star High School 6
Dawson High School 31 Rusk High School 3
Frost High School 24 Home Schooled 33
Kerens High School 44 Other High School in State 38
Mildred High School 70 Other 12
Total 3,301

Return to Table of Contents 49 | P a g e
NAVARRO COLLEGE FACT BO0K
2012 2013 2014 2015 2016
Fall 2,190 2,450 2,486 3,057 3,301
0
500
1,000
1,500
2,000
2,500
3,000
3,500
District-wide Dual Credit Fall Enrollment
2012 2013 2014 2015 2016
Fall 221,728 223,184 259,472 316,240 333,104
0
50,000
100,000
150,000
200,000
250,000
300,000
350,000District-wide Dual Credit Fall Contact Hours
Return to Table of Contents 50 | P a g e
NAVARRO COLLEGE FACT BO0K
ACCOUNTABILITY
Return to Table of Contents 51 | P a g e
NAVARRO COLLEGE FACT BO0K
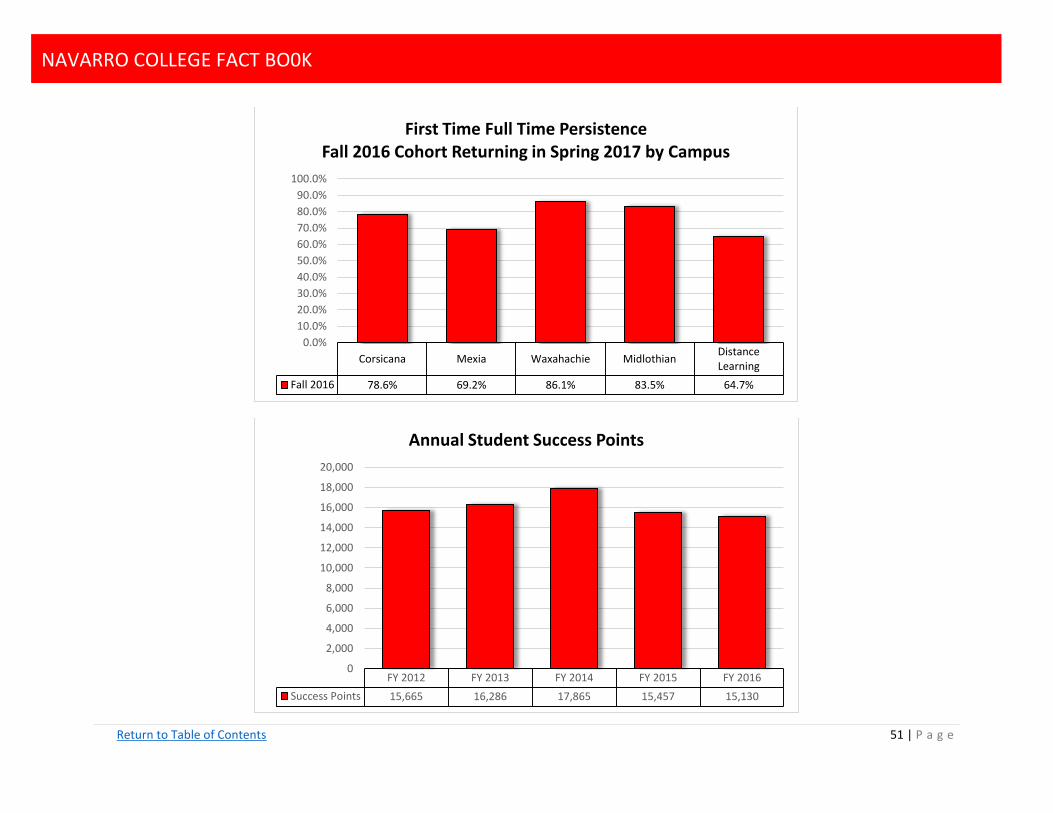
Corsicana Mexia Waxahachie MidlothianDistanceLearning
Fall 2016 78.6% 69.2% 86.1% 83.5% 64.7%
0.0%
10.0%
20.0%
30.0%
40.0%
50.0%
60.0%
70.0%
80.0%
90.0%
100.0%
First Time Full Time PersistenceFall 2016 Cohort Returning in Spring 2017 by Campus
FY 2012 FY 2013 FY 2014 FY 2015 FY 2016
Success Points 15,665 16,286 17,865 15,457 15,130
0
2,000
4,000
6,000
8,000
10,000
12,000
14,000
16,000
18,000
20,000
Annual Student Success Points
Return to Table of Contents 52 | P a g e
NAVARRO COLLEGE FACT BO0K
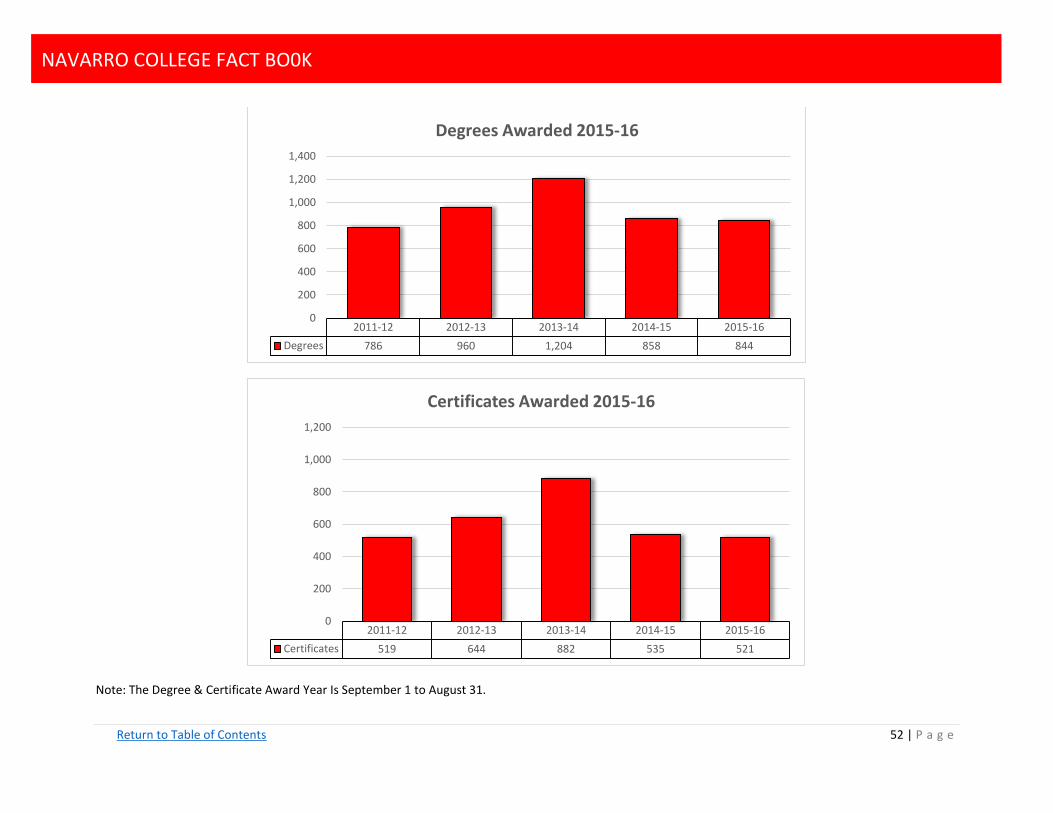
Note: The Degree & Certificate Award Year Is September 1 to August 31.
2011-12 2012-13 2013-14 2014-15 2015-16
Degrees 786 960 1,204 858 844
0
200
400
600
800
1,000
1,200
1,400
Degrees Awarded 2015-16
2011-12 2012-13 2013-14 2014-15 2015-16
Certificates 519 644 882 535 521
0
200
400
600
800
1,000
1,200
Certificates Awarded 2015-16
Return to Table of Contents 53 | P a g e
NAVARRO COLLEGE FACT BO0K
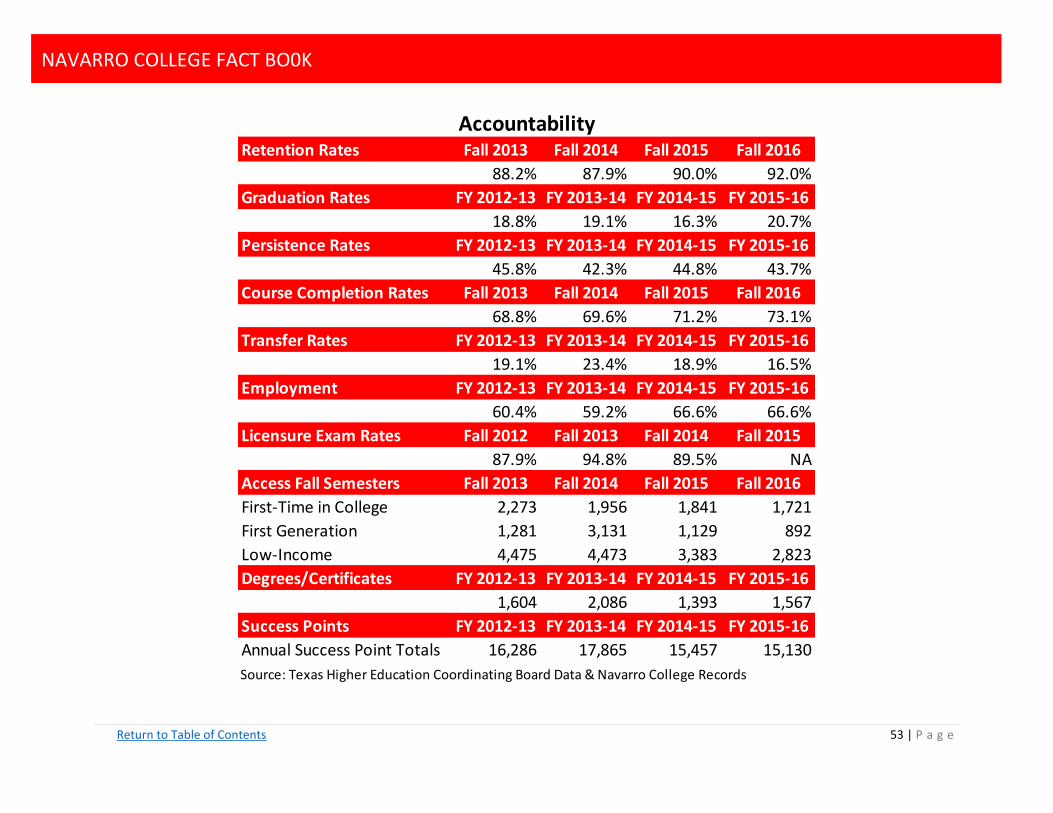
Retention Rates Fall 2013 Fall 2014 Fall 2015 Fall 2016
88.2% 87.9% 90.0% 92.0%
Graduation Rates FY 2012-13 FY 2013-14 FY 2014-15 FY 2015-16
18.8% 19.1% 16.3% 20.7%
Persistence Rates FY 2012-13 FY 2013-14 FY 2014-15 FY 2015-16
45.8% 42.3% 44.8% 43.7%
Course Completion Rates Fall 2013 Fall 2014 Fall 2015 Fall 2016
68.8% 69.6% 71.2% 73.1%
Transfer Rates FY 2012-13 FY 2013-14 FY 2014-15 FY 2015-16
19.1% 23.4% 18.9% 16.5%
Employment FY 2012-13 FY 2013-14 FY 2014-15 FY 2015-16
60.4% 59.2% 66.6% 66.6%
Licensure Exam Rates Fall 2012 Fall 2013 Fall 2014 Fall 2015
87.9% 94.8% 89.5% NA
Access Fall Semesters Fall 2013 Fall 2014 Fall 2015 Fall 2016
First-Time in College 2,273 1,956 1,841 1,721
First Generation 1,281 3,131 1,129 892
Low-Income 4,475 4,473 3,383 2,823
Degrees/Certificates FY 2012-13 FY 2013-14 FY 2014-15 FY 2015-16
1,604 2,086 1,393 1,567
Success Points FY 2012-13 FY 2013-14 FY 2014-15 FY 2015-16
Annual Success Point Totals 16,286 17,865 15,457 15,130
Accountability
Source: Texas Higher Education Coordinating Board Data & Navarro College Records

Return to Table of Contents 54 | P a g e
NAVARRO COLLEGE FACT BO0K
High School
2016 Total
Graduates
2016
Attending
College %
2016 Not
Attending
College %
2016
Attending
Navarro
College %
Increase/
Decrease
2016 to
2015
% of
College
Bound
Students
Attending
Ennis High School 351 163 46.44% 188 53.56% 103 29.34% 8.01% 63.19%
Ferris High School 159 64 40.25% 95 59.75% 25 15.72% 2.48% 39.06%
Italy High School 45 24 53.33% 21 46.67% 312 26.67% -5.69% 50.00%
Maypearl High School 79 35 44.30% 44 55.70% 15 18.99% -8.70% 42.86%
Midlothian High School 507 310 61.14% 197 38.86% 109 21.50% -1.52% 35.16%
Palmer High School 67 38 56.72% 29 43.28% 17 25.37% 3.63% 44.74%
Red Oak High School 439 243 55.35% 196 44.65% 79 18.00% 3.67% 32.51%
Waxahachie High School 538 291 54.09% 247 45.91% 112 20.82% 2.84% 38.49%
Ellis County Total 2,185 1,168 53.46% 1,017 46.54% 472 21.60% 2.16% 40.41%
Fairfield High School 111 62 55.86% 49 44.14% 11 9.91% -10.84% 17.74%
Teague High School 84 47 52.38% 40 47.62% 17 20.24% 3.16% 38.64%
Wortham High School 31 17 54.84% 14 45.16% 11 35.48% NA 64.71%
Freestone County Total 226 123 54.42% 103 45.58% 39 17.26% -1.89% 31.71%
Buffalo High School 71 36 50.70% 35 49.30% 6 8.45% -2.08% 16.67%
Centerville High School 52 33 63.46% 19 36.54% NT NT NT NT
Leon High School 55 25 45.45% 30 54.55% 5 9.09% -10.14% 20.00%
Normangee High School 43 21 48.84% 22 51.16% NT NT NT NT
Leon County Total 221 115 52.04% 106 47.96% 11 4.98% -3.10% 9.57%
Coolidge High School 27 13 14.00% 14 51.85% NT NT NT NT
Groesbeck High School 114 48 42.11% 66 57.89% 10 8.77% 0.64% 20.83%
Mexia High School 122 45 36.89% 77 63.11% 11 9.02% -8.20% 24.44%
Limestone County Total 236 93 39.41% 143 60.59% 21 8.90% -3.75% 22.58%
Blooming Grove High School 66 31 46.97% 25 53.03% 17 25.76% 1.12% 54.84%
Corsicana High School 347 180 51.87% 167 48.13% 110 31.70% -7.24% 61.11%
Dawson High School 38 16 42.11% 22 57.89% 8 21.05% -15.98% 50.00%
Frost High School 29 14 48.28% 15 51.72% 6 20.69% NA 42.86%
Kerens High School 40 25 62.50% 15 37.50% 22 55.00% 17.22% 88.00%
Mildred High School 61 32 52.46% 29 47.54% 15 24.59% 2.85% 46.88%
Rice High School 65 34 52.31% 32 49.23% 24 36.92% 6.54% 70.59%
Navarro County Total 646 332 51.39% 315 48.76% 202 31.27% -31.27% 60.84%
Service Area Total 3,514 1,831 52.11% 1,684 47.92% 745 21.20% 0.30% 40.69%
High schools with more than 25 graduates
Wortham, Coolidge, & Frost High Schools had less than 25 graduates in 2015
NA-Not Available NT-Not Trackable
Service Area High School Graduation Comparison2015-16

Return to Table of Contents 55 | P a g e
NAVARRO COLLEGE FACT BO0K
CIP Tested Passed Success Rate
51100400 6 6 100.00%
12041300 4 4 100.00%
12040100 79 77 97.47%
43010700 132 132 100.00%
51090400 107 88 82.24%
43020300 33 32 96.97%
51390100 83 78 93.98%
51350100 8 8 100.00%
51390200 67 40 59.70%
51080300 30 30 100.00%
51380100 80 67 83.75%
48050800 69 63 91.30%
698 625 89.54%The THECB has not updated this report for 2015-2016
Cosmetology, General
Criminal Justice/Police Science
EMT
Massage Therapy
Nurse's Aide
Occupational Therapy Assistant
Major
Fire Science/Firefighting
Registered Nursing
Welding Technology
Overall
Licensed Vocational Nursing
Medical Laboratory Technician
Cosmetology Instructor
Navarro College
2014 Annual Licensure Report

Return to Table of Contents 56 | P a g e
NAVARRO COLLEGE FACT BO0K
Academic Technical Tech-Prep
11 1 1
10 1 0
15 0 0
7 1 0
79 1 4
60 7 2
1 0 0
145 13 11
161 1 3
161 12 7
8 1 0
3 0 0
6 0 0
6 0 0
101 2 1
86 6 1
33 8 0
198 30 2
34 1 0
30 1 1
1 0 0
7 0 0
41 2 1
5 0 0
14 1 0
104 1 0
12 3 1
1 3 0
1,340 96 35
The THECB has not updated this report for 2015-2016
Total
Texas A&M University
University of North Texas
University of North Texas at Dallas
West Texas A&M University
Texas A&M University at Corpus Christi
Texas A&M University at Kingsville
Texas A&M University at Galveston
Texas Southern University
University of Houston
Texas Tech University
The University of Texas of the Permian Basin
Texas A&M University at Commerce
The University of Texas at San Antonio
The University of Texas at Tyler
The University of Texas at Austin
Stephen F. Austin State University
Tarleton State University
Midwestern State University
Angelo State University
Prairie View A&M University
Lamar University
Sam Houston State University
Sul Ross State University
The University of Texas at Dallas
Texas State University
Texas Women's University
The University of Texas at Arlington
The University of Texas at El Paso
Student TypeInstitution Attended
Navarro College Students Pursuing Additional Education
2014-2015 Graduates

Return to Table of Contents 57 | P a g e
NAVARRO COLLEGE FACT BO0K
Return to Table of Contents 58 | P a g e
NAVARRO COLLEGE FACT BO0K
EMPLOYEES

Return to Table of Contents 59 | P a g e
NAVARRO COLLEGE FACT BO0K

Return to Table of Contents 60 | P a g e
NAVARRO COLLEGE FACT BO0K

Return to Table of Contents 61 | P a g e
NAVARRO COLLEGE FACT BO0K

Return to Table of Contents 62 | P a g e
NAVARRO COLLEGE FACT BO0K
FINANCES

Return to Table of Contents 63 | P a g e
NAVARRO COLLEGE FACT BO0K