navigate your next€¦ · omnichannel customer experience across a five-year transformation...
TRANSCRIPT

NAVIGATE YOUR NEXT TM
Annual Report 2017-18


Infosys Annual Report 2017-18
Think back just one hundred years from 2017. It would have taken you anywhere between five and ten days to get from London to New York; and well over a month to travel from London to Australia. Today, London is only around eight hours away from New York and about a day from Australia by air. If you’d lived then, it’s likely your home wouldn’t have had a landline telephone, because only 25% of working-class families in the US did. Today, landlines sit all but forgotten in our living rooms. Nearly 80% of the population, in the US alone, has a smartphone in their pockets, while you can call for free over a WiFi network anywhere in the world. These are just two examples of the hundreds of ways in which someone, somewhere thought to try something no one else had ever dreamed of, chose to walk a path
untrodden, that then caught the imagination of several others who joined in, till the idea gathered the strength to move us all forward.
The digital disruption that engulfs us today has significantly increased our collective ability to create the next new normal. At Infosys, we see this as an exciting opportunity to make a difference. To partner with our clients to look for the new things their customers may not yet know that they want, and help them be the first to respond boldly to the calling. To create their next.
We AI-power their core to help them prioritize the execution of change that’ll take them closer to emerging opportunities. Thereon, we help them prepare to respond with Agile Digital at scale. We continuously enrich them with skills and learning
from emerging technology domains and industries outside their own, so they can get the world’s best ideas to work harder to delight their customers. Our digital framework drives outcomes for them across five areas – Experience, Insight, Innovate, Accelerate and Assure. We craft the way their customers experience digital solutions, help their businesses gain insight from data, innovate with them in the world of vertical platforms and digital-first engineering, accelerate their core digitalization, and assure means for them to establish digital trust.
This annual report celebrates the multiple facets of this journey. A journey of so many nexts. A journey that will get so much more meaningful when you navigate your next with Infosys.
NAVIGATE YOUR NEXT. WITH INFOSYS.

4 | Navigate your next Infosys Annual Report 2017-18

Likes, shares and friends will shape your customer’s next experience Infosys Annual Report 2017-18
What do customers really want? Our clients are beginning to ponder over this question more deeply, more
frequently than ever before, and with good reason. They clearly see how significantly customer experience can differentiate their business. Especially with all that’s made possible by the accelerated progression of digital technology and its rapid uptake by consumers. They understand that delivering great digital experiences means taking all those steps necessary to reimagine the business – systems, processes, people – to organize the enterprise from its very core to deliver customer delight.
Over the past 12 months, we’ve seen an increasing number of our own clients fast-tracking their digital transformation, to see the benefits of being more customer-centric : more satisfied buyers, increased loyalty, vocal advocacy, and lower cost of service, with us partnering them through the journey.
What we did recently for a technology conglomerate makes for an interesting illustration. We helped them modernize, standardize, and automate 20 of their key business processes, and thereby digitize more than a million caseloads, to eliminate over 8 million hours of wait time for their customers. Before we stepped in, something as vital as their ‘Expedite Order’ process was a sequence of 122 steps that agents had to navigate, across a series of applications, functions and procedures, before they could determine if a customer’s order could or could not be expedited. We brought in a combination of analytics, artificial intelligence (AI) and automation to intelligently
route requests to the agent best equipped to resolve the issue, now also amplified by fully-automated processes delivered through an integrated customer engagement platform. The results have been dramatic. Some customer queries that typically took 20 hours to process are now done in less than 5 minutes.
Another example is how we are future-proofing a very large global telecom company. We are modernizing the core to drive operational agility, data-rich systems, new ways of working, and flexible omnichannel customer experience across a five-year transformation roadmap. This involves the telecom’s full stack, from the foundation BSS / OSS layers in partnership with Netcracker, through to the CSS customer interaction layers, created by using Adobe, UXP and PegaSystems as both an omnichannel enabler and decisioning layer. All this will ensure end-to-end digital transformation driven by real-time, contextual customer data to deliver differentiated next best actions and next best offers.
As our clients look to us for the edge that would differentiate their digital solutions to create an impact in an increasingly uncertain, asymmetric and complex world, we are leveraging the breadth and depth of our digital expertise to deliver for them. We are also empowering our clients to transform their workplace experience by leveraging technology to connect their people – to knowledge, to processes, to each other – to move forward and do better.
This year, Infosys acquired Brilliant Basics, a London-based product design and customer experience innovator known for their world-class Design Thinking-led approach
and experience in executing global programs. Over the past year, the team has reimagined customer experience across channels, including the web, apps, ATM, kiosks, IVR, and branches, for several global banks. Many of these capabilities are now being integrated with our Finacle® suite of banking solutions to bring the benefits of new digital experiences to more of our clients.
We have also announced in April 2018 a definitive agreement to acquire WONGDOODY, a US-based full-service creative and consumer insights agency.
The addition of near-shore capabilities adds to our growing worldwide network of digital studios, which includes our expanding facilities in Bengaluru and Pune, in India. These are focused on fulfilling the needs of global clients for end-to-end digital transformation solutions required to meet the demand for next-generation customer experience. This is but one step forward in the long path we have charted to close the gap for design and human-centric skills in building highly usable technology solutions.
It fits squarely into our outside-in approach of focusing on service design and experience at one end, and renewal of legacy technologies, processes, systems, and ways of working at the other, helping our clients meet rising customer expectations, deliver personalized experiences at scale, and do it all at the speed of market.
“When it comes to customer experience, we continue to transform, learn and shape the next stages as we move along our transformation journey. The scale of change is hugely significant; we are changing not only our digital layer, but our entire back office to ensure future-proof, operationally agile, and data-rich systems.”
– Sam Lloyd, Chief Information Officer, Telenet
Scott SorokinSVP and Head, Global Services – Digital Experience
THE CLIENT DIGITAL
JOURNEY
EXPERIENCE INSIGHT
INN
OVAT
E
ACCELERATE
ASSURE

6 | Navigate your next Infosys Annual Report 2017-18

Data is the lifeblood of the enterprise that aspires to be digital. It is that strategic asset that helps
the business learn about evolving opportunities, hidden threats, changing customer expectations and the competitive landscape, in context and in time to respond meaningfully. This, in turn, helps to automate the supply chain, drive continuous innovation, and create micro-moments-based customer experience. Artificial intelligence (AI)powers the core of this data-driven enterprise and creates signals that then act on the business to bring transformational value. When this is enabled in a do-it-yourself culture, everyone, at any given time, is able to move quickly in the right direction to defend, differentiate and even reimagine the business.
We help our clients adopt this approach to ubiquitously creating value from data.
We move them away from the conventional use case or point-solution-led approach, towards the path to building industrialized capabilities to monetize data. We begin by creating an integrated blueprint of opportunities – unique to their businesses – for data-led value creation. Thereon we chart the roadmap to incrementally build the capabilities they need to deliver on the blueprint. This involves :
� Modernizing the core to prepare for the digital transformation
� Building systems that interpret data cognitively to discover new signals and connect the unconnected
� Leveraging AI to nurture a learnable and adaptable enterprise that evolves at digital speed
Modernizing entails releasing data and insights hidden in the legacy landscape and creating a flexible mesh of foundational services. This foundation can then be broken down into components that can be dynamically organized in several ways and automated to deliver against an evolving context. This also often necessitates divesting or modernizing the legacy systems that lie at the core of the enterprise. For example, recently, we worked with a retail mortgage bank, to advance their ability to generate credit scores for potential customers and process applications in real time. We re-engineered their credit acquisition decision engine and also transformed their legacy mainframe environment to improve its agility. Today, the bank generates applicant credit scores in less than 50 milliseconds.
Having released data from the core, the next task is to digitize the data supply chain and turn it into an asset that can be interpreted cognitively and leveraged for making data-led decisions across the enterprise. We do this for several of our clients in the retailing business. We work to make sense of their structured and unstructured data around consumer actions, response to promotions, SmartLabel scans, product affinities, customer propensities, along with price and promotion sensitivities. We then use machine learning models to improve the recommendation logic for their real-time product promotions.
We put to use several AI models to solve business problems in an
expert-assist, near-fully-automated mode. This allows for continuous learning and continuous improvement to be factored into both validated and new models. A case in point is how this is delivering value for our clients in the financial services business. We deploy AI techniques to detect anomalies in data values and transaction volumes that point to suspicious events and then alert decision-makers to potentially fraudulent activities. We even study these patterns to predict incidents and enable just-in-time prevention of irregularities.
With this approach, enterprises can build a fabric for data to become the new internet, connecting all the dots that matter, the driver of all enterprise decisions, and the advantage that everybody has equal access to. With that, it will not be data that differentiates the winning enterprises from the also-rans. It will be people – amplified by this data, to be able to make connections unseen before, to find problems unarticulated before, and to build solutions that solve the unsolvable, through collaborative relationships that benefit customers in ways unexplored.
“Within ABN AMRO, we believe that we can generate true value from data by delivering innovative analytics capabilities and enabling access to high-quality data. We have demonstrated the first tangible results that created such enthusiasm that we decided to overhaul our entire data management ecosystem. We are implementing modern and metadata-driven data distribution technologies and are adopting AI capabilities from public cloud providers.”
– Marcel KramerIT Lead, Data Quality & Analytics, ABN AMRO Bank
Satish H.C.EVP and Head, Global Services – Data & Analytics
THE CLIENT DIGITAL
JOURNEY
EXPERIENCE INSIGHT
INN
OVAT
E
ACCELERATE
ASSURE
AI-led insights will show your customers what to buy next Infosys Annual Report 2017-18

8 | Navigate your next Infosys Annual Report 2017-18

Your old machinery will be your next new IoT device Infosys Annual Report 2017-18
The highly competitive markets that our clients serve demand a severe crunching of cost and time
for them to remain relevant. We help them meet this challenge when they engineer their products, by digitizing the entire product lifecycle – from design and manufacture to maintenance and service.
In tandem with designing new products or production lines, our clients often have a portfolio of long-lived products and assets that must deliver to new expectations. We believe, for the enterprise that’s rich in engineering legacy and looking to find new growth, there lies a goldmine of opportunity – to deftly build richer experiences by infusing new technology into their existing products. Leveraging our deep understanding of their broader business context, we help our clients uncover ways for technology to create avenues for their products to deliver more value. The key here is to not wish away their rich legacy but revitalize it with newer technology. Like we did recently by re-engineering a hardware monolith – a Cable Modem Termination System (CMTS) – into smaller software components leveraging Software-defined networking / Network functions virtualization (SDN / NFV)technology. Our client, a cable operator, can now bring up or down the CMTS on demand and take it closer to customer homes. This will save them both capital expenditure and operational expenses.
We understand how vital it is to recognize how the product or asset is engineered – mechanically and
electronically, for us to then bring the right software to amplify it. This means knowing the product’s entire lifecycle – design, manufacturing, assembly, customer operations, and after-sales service. For example, uncovering value from IoT data is a process of knowing exactly what constitutes ‘desired’ product behavior, tracking the gap between real-world results and desired results, and communicating this to stakeholders who can investigate why it occurred and prevent its recurrence. In fact, recently, in partnership with an international engineering firm, we developed an AI-powered operational efficiency framework to help manage large plants with complex IoT-led interconnected systems. Our clients are enthused about its potential to revolutionize plant operations by enhancing overall system performance, availability and reliability, in addition to managing the risks of disrupted production.
While our aspiration is to help our clients better leverage their existing assets, our IoT services are focused on impacting both their top line and bottom line. Today, enterprises leverage our IoT capabilities to remote-monitor products and assets, prevent breakdowns, and analyze data from sample assets to optimize performance across the entire production line. Having this view into how each product or asset operates is not just key to improving their efficiency but also to ensuring security along with legal and regulatory compliance. In addition, we have also brought in IoT to help our clients explore new business models that offer products as services with usage-based pricing.
The value we have been able to bring to our clients this last year, through our IoT offerings, is indicative of how more and more enterprises are trying to transform their product engineering and take advantage of technologies like SDN, Augmented Reality / Virtual Reality, Robotics, Autonomous Technology and Additive Manufacturing. For example, we have developed a robotic arm-based test automation framework to automate the hardware and software testing of point-of-sale and mobile devices. We are also actively re-engineering critical metallic components for a leading turbo-machine maker, through Additive Manufacturing. We have a deep appreciation for the need to re-skill and upskill our own people so they can embrace and share the value of these emerging technologies. To accelerate their continuous and lifelong learning in these domains, we are investing significantly in educational interventions – including partnering with Udacity to train our people in the skills we need as a company to deepen focus on Autonomous Technology.
Our opportunity clearly lies in bringing together knowledge of the new possibilities created by emerging technologies, knowledge of how products are engineered, and knowledge of the industries they serve, to uncover avenues to amplify, with software, the value these products deliver.
“IoT solutions are developed and deployed to achieve specific business outcomes; as such, it is critical to provide the complete solution stack. Cisco is focused on engineering specific products and platforms which provide customers with complete solutions to realize business benefits. Systems integrators play an important role in customizing these IoT solutions and making sure that the expected benefits are fully realized, thus forming an important link in the IoT value chain.”
– Jayaram Beladakere Director, Product Management, Cisco
Sudip SinghSVP and Head, Global Services – Engineering, and Industry Head – Services, Utilities, Resources and Energy
THE CLIENT DIGITAL
JOURNEY
EXPERIENCE INSIGHT
INN
OVAT
E
ACCELERATE
ASSURE

10 | Navigate your next Infosys Annual Report 2017-18

Modernize the core before you make your next move Infosys Annual Report 2017-18
To thrive, even to survive, enterprises must be able to rapidly transform themselves or watch
a born-digital competitor woo their customers away. For most established companies, the toughest struggle is with their monolithic legacy that can’t pivot to support their aspirations. These often-siloed systems, built on older technology and surrounded mostly by archaic processes, have, over a period of time, become fairly complex and inextricably interlinked to support expansive operations. The fear of disrupting these operations, making large new investments, and tackling the need for new skills to manage the transformation make it hard for enterprises to shrug off their legacy.
But there is a way forward.
The journey to organizational modernization and enterprise agility can be phased, at one’s chosen pace, based on carefully chosen business priorities and executed through a combination of core renewals that create efficiency-led savings that can then be redirected to simultaneously building agile new systems of engagement. We help our clients do this by bringing together a combination of strategies for legacy landscape renewal including the following :
a) Massive simplification of core systems from monolithic and interdependent to platform-led, lightly-tied components built on open source software. For example, for an Asian bank, we are working to transform their 36-year-old mainframe system, running on proprietary technology, to a more loosely-coupled, extensible
architecture. We are already beginning to see encouraging early outcomes like a 30% reduction in their loan processing time and improved customer experience.
b) Carving out fire lanes of microservices and APIs (Application Programming Interfaces) around the core that opens it up to customer-focused digital transformation. We did this with significant success for a direct seller of personal care products. We helped them build a robust API management strategy and microservices architecture to support their new responsive website and an agile social selling platform with over 230 applications serving a market spread across 100 countries.
c) Bringing cloud-readiness to the legacy landscape so that it can be migrated to the cloud. We help our clients chart out and execute a cloud strategy to not only transition their non-differentiating workloads to the cloud, but to also transform their businesses with the cloud.
Contrary to popular perception, enterprises have huge untapped potential to exploit cloud-based technologies and in most cases, this entails choosing a hybrid approach involving hosted or private cloud and public cloud options. The journey of enterprise workloads moving to the cloud is just about starting and this would be an ideal time for most enterprises to embark on their own path to the future. There are enough proven technologies and solutions to help most of these enterprises meet their needs today, and this mitigates the perceived risks of cloud transformation.
Leveraging Infosys Enterprise Cloud Ecosystem capabilities, we advise our clients on their cloud transformation strategy across infrastructure, data,
applications and more, and then build and co-evolve their enterprise cloud. We don’t just deliver managed services, but also help our clients tap into new revenue streams. That’s exactly what happened with an airline manufacturer we serve. They wanted to ease the struggle their customers faced when trying to find the right documentation to maintain their aircraft. We build a secure public cloud platform to host their product manuals for anytime-anywhere access. While this saved them over a million dollars in customer servicing costs, they also shared this facility with other aircraft manufacturers offering documentation-hosting as a subscription-based service that generated significant new revenues for them in the very first year.
We also understand and leverage the role that DevOps and Agile play, integrated with open source advantage, to support our clients’ need for on-demand and automated IT on their path to modernization.
This, and every other modernization tactic we deploy, is part of a custom-strategy we carefully chart for every individual client to build in the changeability they need to make the necessary agile shifts through changing times – continuously digitizing the core at one end and amplifying consumer experience at the other – to stay ever-relevant.
“As enterprises like us embark on the digital journey, cloud plays a very important role. It is not just about moving workloads to cloud but about business value through agility, driving customer insights and most importantly, enhancing experience.”
– Neal JohnsonDirector of Business Technology, House of Fraser
Narsimha Rao M.EVP and Head, Global Services – Cloud, Infrastructure and Security Solutions & Independent Validation Solutions
THE CLIENT DIGITAL
JOURNEY
EXPERIENCE INSIGHT
INN
OVAT
E
ACCELERATE
ASSURE

12 | Navigate your next Infosys Annual Report 2017-18

Almost every CIO and CISO we speak to tells us how consumed they are by the demands of predicting and
preventing security incidents in an expanding threat landscape. The challenge of cyber security has long since moved beyond monitoring infrastructure, networks, firewalls and IT assets to include the protection of the entire value chain – systems, applications, user software, developer software and data.
For global enterprises seeking to build a more digital future for themselves, the transformation journey invariably extends from core modernization to customer delight. Because their core is most likely a monolithic legacy system, the road to digitization, for them, entails Application Programming Interface (API) fire-laning so their legacy landscapes can communicate with new platform-based components and open source software solutions. These APIs, while providing a window from the core into new applications, also inadvertently intensify cyber security risks. Then of course, the path to modernization also leads to the cloud. As this digitization scales, an elaborate cyber security setup becomes mission-critical, even inevitable. That’s why we offer defense-in-depth to our clients.
On the other hand, hackers continue to innovate. To that, the typical enterprise responds by bolting on more point solutions. Often, the result is a patchwork of solutions that not only don’t work well together, but are inadequate to protect against evolving threats that are now spread across an attack surface
with thousands of potential entry points, including those created by smartphones and Internet of Things (IoT) devices. Little wonder, CISOs find themselves managing ‘reactive security’ rather than driving ‘holistic resilience’.
The need of the hour is flexible and adaptive security solutions, delivered in an integrated package. When these are consumed ‘as-a-service’, enterprises will have the flexibility to prioritize not just rapid remediation, but also plan for anticipatory protection. It removes the huge operational and cost overheads required to manage a fragmented landscape with point solutions pieced together. The CIO and CISO can, instead, focus on accelerating the enterprise’s digital agenda. That’s precisely what the Infosys Cyber Security Platform enables. Built with AI-driven automation at its core, it helps the custodians of enterprise security to transition from a fragmented and reactive approach to a managed security services model guided by a customized roadmap. For example, for one of our clients – a beverage manufacturer – the platform brings together an optimized tool suite and the strong predictive capabilities needed to protect them against advanced threats – all the while providing 24x7 security monitoring services, along with identity and access management services, for their 40,000+ users and over 500 applications.
Complementing the value that our cyber security platform brings is our network of Security Operations Centers (SOCs), already operational in Bengaluru, Hyderabad and Pune in India, along with centers at our clients’ premises. These SOCs bring together best-in-class skills and a constantly updated solutions suite,
along with managed services for security operations delivered round-the-clock through a network of inter-connected, global facilities. Our clients also have access to advanced threat-hunting capabilities and the latest in technology innovations for cyber security incubated in the Infosys Security R&D Labs. This is our investment in continuously improving our core services portfolio, expanding our offerings into new areas of potential threat, and leveraging our innovation ecosystem to co-create solutions that deepen the value we deliver.
The value that technology brings to cyber security, while immense in itself, is best leveraged as a means to amplify human potential. Un-automatable tasks like imagining new avenues for breaches, finding new problems, and creating innovative solution combinations can only be performed by people. That’s why we are fully committed to nurturing and improving our engineers’ skills and expertise in these domains through strong academic partnerships like the one we have forged with Purdue University.
For us, each of these advances, in the past year, has been a step up in boosting the security posture of our clients so they can go about their business with greater confidence.
“Cyber security is foundational for enterprises such as ours as we proceed through our digital transformation. It is more than merely responding to events as they occur; it is crucial that we build solutions for predictive threat management and automated incident resolution. To achieve this requires fully-integrated security platforms that operate in ways that point solutions cannot”.
– James F. EckartChief Information Security Officer, The Coca Cola Company
Anant R. AdyaSVP and Group Practice Engagement Manager – Cloud, Infrastructure and Cyber Security
THE CLIENT DIGITAL
JOURNEY
EXPERIENCE INSIGHT
INN
OVAT
E
ACCELERATE
ASSURE
Secure your business from the next cyber attack Infosys Annual Report 2017-18

Infosys Annual Report 2017-18
CONTENTS
16 How will the next unfold?
18 Letter to the shareholder
20 Of navigators – natural and nurtured
22 Resilient financial performance
24 Being local. Globally.
25 From the frontline
26 The Infosys Board of Directors
28 The Infosys leadership team
30 Board and committees – Infosys Limited
31 Key trends
33 The year at a glance
35 Board’s report
� Results of our operations and state of affairs
� Business description
� Human resources management
� Corporate governance
� Audit reports and auditors
� Corporate social responsibility
� Acknowledgments
52 Annexures to the Board’s report
� Annexure 1 – Statement containing the salient features of the financial statements of subsidiaries / associate companies
� Annexure 2 – Particulars of contracts / arrangements made with related parties
� Annexure 3 – Particulars of employees
� Annexure 4 – Independent Auditors’ certificate on corporate governance
� Annexure 5 – Secretarial audit report for the financial year ended March 31, 2018
� Annexure 6 – Extract of annual return
� Annexure 7 – Annual report on CSR activities
� Annexure 8 – Conservation of energy, research and development, technology absorption, foreign exchange earnings and outgo
� Annexure 9 – Corporate policies

Infosys Annual Report 2017-18
83 Management’s discussion and analysis
� Industry structure and developments
� Financial condition
� Results of our operations
� Opportunities and threats
� Outlook, risks and concerns
� Internal control systems and their adequacy
102 Corporate governance report
� Our corporate governance philosophy
� Board composition
� Board meetings
� Board committees
� Management review and responsibility
� Shareholders
126 Shareholder information
134 Risk management report
138 CEO and CFO certification
139 Standalone financial statements
� Index
� Independent Auditors’ Report
� Annexure A to the Independent Auditors’ Report
� Annexure B to the Independent Auditors’ Report
� Balance Sheet
� Statement of Profit and Loss
� Statement of Changes in Equity
� Statement of Cash Flows
� Overview and notes to the financial statements
194 Consolidated financial statements
� Index
� Independent Auditors’ Report
� Annexure A to the Independent Auditors’ Report
� Consolidated Balance Sheet
� Consolidated Statement of Profit and Loss
� Consolidated Statement of Changes in Equity
� Consolidated Statement of Cash Flows
� Overview and notes to the consolidated financial statements
251 Business responsibility report

16 | How will the next unfold? Infosys Annual Report 2017-18
The digital revolution excludes no one and nothing from its embrace. We are engulfed in that time in the history of humanity when advances in technology and innovation are gathering momentum at an unprecedented pace. Now, we must be poised to tackle changes unlike any we have known before.
Businesses are facing various simultaneous and disruptive challenges. Many industries like retail, media and entertainment have to contend with powerful digital disruptors. The automotive industry is facing the triple challenge of electric cars, self-driving capabilities and mobility aggregators. The utility industry must deal with an increasing proportion of energy coming from renewables, which are intermittent, and require storage and new types of grids. The FMCG industry must learn and adapt to how brands will be bought in the future. The financial services companies are facing regulations on the one hand, and massive automation on the other. Smartphones in everyone’s hands and multiple sensors in every device
Nandan M. NilekaniChairman
and every product are upending entire businesses. Machine learning and deep learning are commoditizing domain knowledge, and the ‘winner take all’ nature of data-driven businesses is both swift and forbidding.
Yet, I believe, this can be a force for positive change. With artificial intelligence, disease onset can be accurately predicted and prevented. Healthcare providers are now able to enhance and extend care delivery beyond their facilities. Machinery and production assets can be remotely monitored to predict and prevent costly or mission-critical device failures. IoT-enabled inventory optimization and supply chain risk mitigation are a ubiquitous reality. Advanced driver assistance systems have already eased the burden of building safer vehicles. For financial institutions, the reach of smartphones is enabling them to visualize their business at population scale, and data and analytics are speeding up and improving the accuracy of their fraud detection endeavors. Across sectors,
HOW WILL THE NEXT UNFOLD?

How will the next unfold? | 17 Infosys Annual Report 2017-18
“We are ready to boldly promise our clients – Navigate your next with Infosys. What will unfold next is limited only by our imagination, our focus on customers, the execution of our strategy, and our shared ambition to remake our world and the way we live and work in it.”
the consumer’s voice is being deeply acknowledged. Enterprises are vying with each other to meet the demand for superior experience, greater productivity, increased convenience and complete transparency with new digital business models, yet building on their core strengths. In so many ways, and a great many times over, our collective ability to bring never-before benefits to business and society, catalyzed by technology and innovation, has increased.
Today, we have a deep and renewed understanding of what is happening in the market, a keen sense of how we must respond, and the action we must take to make a tangible difference. We have gone through turbulence, but the resilience of the company has shone through and we are now in a very safe and stable place. The strategy refresh we undertook in the last six months has clearly outlined the way forward for us. We have a strong executive leadership team in place to inspire and steer the company towards our goals. With Salil Parekh leading the way as our new CEO and MD,
we are all set to grow the strengths that have always differentiated us – our values, our customer orientation, our brand, our commitment to learning that drives continuous improvement, and our focus on partnering with all our stakeholders in a way that is unique to us. We are ready to boldly promise our clients – Navigate your next with Infosys. After all, we’ve done this, lived this, for over three decades, and what will unfold next is limited only by our imagination, our focus on customers, the execution of our strategy, and our shared ambition to remake our world and the way we live and work in it.

18 | Letter to the shareholder Infosys Annual Report 2017-18
Salil ParekhChief Executive Officer and Managing Director
LETTER TO THE SHAREHOLDER
Dear shareholder,
Our primary objective is to help address and solve our clients’ business and technology challenges to enable them to better serve their customers, grow, and improve their profitability. With that in mind, we have set for ourselves the goal of increasing our relevance to our clients. The more we succeed in that, the more likely we are to create increased value for our shareholders.
Today, our clients – large enterprises and government organizations – are at different points in their digital journey. We are positioning our capabilities to help them navigate their next, across the different dimensions of this journey.
Over the past few months, I’ve spent time extensively with our clients and with our employees. Each one of the 48 clients I met during the previous quarter is a strong believer in our long-standing, market-leading, service delivery strength. In fact, they are keen that we build upon our knowledge of their technology foundation and support them on their digital journey. I also learnt about the sense of tremendous pride our employees have in their work for our clients.
To increase our relevance to our clients, we have embarked on our strategy of ‘Navigate your next’. To achieve this, we have defined the following four strategic imperatives :
� Scale Agile Digital
� Energize the core
� Re-skill our employees, and
� Localize in our key markets
Scale Agile DigitalOur clients are moving rapidly on their digital journey. We have built, over the years, a formidable position in the digital space – US$ 2.79 billion of our revenue in fiscal 2018 came from these digital services. Our digital framework drives business outcomes for our clients across five areas – Experience, Insight, Innovate, Accelerate, and Assure. This reflects how we are thinking about our clients’ journey as they make progress through their digital transformation. This also guides our own aspirations and efforts to build digital capability in service of our clients’ needs.

Letter to the shareholder | 19 Infosys Annual Report 2017-18
“Today, our clients are at different points in their digital journey. We are positioning our capabilities to help them navigate their next, across the different dimensions of this journey.”
Energize the coreOur core business is the cornerstone of our company and the critical element that has helped us build enormous client trust and loyalty. With advances in artificial intelligence and automation, we have the ability to make these core services even more efficient and effective for our clients. Our Nia platform is a critical element in this landscape.
Re-skill our employeesIn working alongside our clients on their digital journey, we are actively working with our employees to enable their re-skilling. Our platform, Lex, makes learning accessible, relevant, fun, and drives outcomes that matter. Increasingly, we are taking this learning to our client organizations as well.
Localize in our key marketsWe are embarking on building more local capabilities, especially in America, Europe, and Australia, to ensure we expand our relevance to our clients. We announced our first campus for development and training in Indiana, US, and innovation hubs in other cities.
With the articulation of our strategic direction, we have launched a transformation program for the company to drive the execution of the initiatives that will help us achieve the outcomes envisaged. This is a three-year transformation program that will help position Infosys for increased client relevance.
Our fiscal 2018 results are detailed in this annual report and demonstrate the underlying strength of our business. Our revenue was US$ 10.9 billion, which grew at 5.8% in constant currency from the previous year. Our operating margin was 24.3% and profit after tax was US$ 2.5 billion. Cash provided by operating activities was US$ 2.3 billion.
Thank you to each one of our 1,200 clients! Their trust and belief in us has enabled us to be the company we are.
The dedication of our over 2,00,000 employees to drive outcomes for our clients is a testament to the results we have shown in fiscal 2018 and the continuing strength of our institution. Thank you to each one of them.
Our exceptional leadership team has helped steer the company through the past several years and also helped design our strategic framework and the transformation program. My thanks to them for their energy and commitment in helping me operationalize our strategy.
Today, as I look out of the window in my office at the lush green trees across our stunning campus in Bengaluru, I feel a sense of excitement – at the opportunities in the technology world as our clients are moving on their digital journey and the consequent opportunity for us to help them navigate their next. I feel a sense of pride at the incredible institution that has been built over the past 37 years that gives us a strong foundation for what we can create in the future.
With my warmest regards,
Bengaluru May 8, 2018
Salil ParekhChief Executive Officer and Managing Director

20 | Of navigators – natural and nurtured Infosys Annual Report 2017-18
OF NAVIGATORS – NATURAL AND NURTURED
U.B. Pravin RaoChief Operating Officer and Whole-time Director
Letting go of the familiar, to navigate to the next, is not always easy. But so often it’s inevitable. As inescapable for naturals like the Arctic terns – those ambitious navigators that chart their migratory flight from the North Pole to the South and back – as it is for enterprises that must learn to steer through the turbulence of digital disruption to find their future.
Incumbent companies – often large and successful businesses that thrived for decades before the emergence of this pervasive digitalization – can sometimes feel like they must fight the winds that seem to be propelling everybody but them forward. Yet, we believe that incumbents too can adapt, and leverage the resources they have – a strong brand, significant capital, long-standing customer relationships and decades of institutional knowledge – to find and take advantage of opportunities amidst the disruption.
We should know. We are an incumbent too.
We also know that being digital means making far-reaching changes that go beyond simply investing in the latest digital technologies. It means reimagining operating models, considering how best to refactor and invigorate talent with digital skills, and looking afresh to engage in ways
customers find valuable. Today, we are well on our way to executing our strategy to accomplish exactly that. In fact, our promise to our clients is to be their navigator as they chart their path to a more digital future. The strength of our conviction comes from the fact that each tenet of the strategy we recommend for them, is already working for us.
We are navigating, step by step, towards new digital opportunities while smartly leveraging our traditional strengths – our core services. In the past three years, we have embraced artificial intelligence-based automation techniques and software automation platforms to boost the productivity of our core service delivery. Infosys Nia®, our next-generation intelligent automation platform, and AssistEdge®, our Robotic Process Automation platform, have been key to bringing machine learning and automation together with deep knowledge of our business to industrialize our core landscape. Simultaneously, through Project Infynity, we are also transforming our delivery practices in a holistic modernization journey that will bring the agility we seek to our processes.
These productivity and efficiency gains are enabling us to make

Of navigators – natural and nurtured | 21 Infosys Annual Report 2017-18
targeted investments to accelerate our Agile Digital business. We are boosting our digital delivery capabilities and priority services, including customer experience amplification, data analytics, product engineering, cloud migration, cyber security, automation and platform-based business process management. We are applying these first to our own context. For example, today, Infosys hybrid cloud enables on-demand self-service provisioning, while doubling capacity, without increasing costs. We are beginning to manage our unstructured data with Penny-a-GB (PeG) – our peta-scale, software-defined storage. Mobile-first solutions drive all our critical business, learning and collaboration processes. Our Information System processes are simplified, reducing cumulative effort for critical processes by up to 80%. We have made significant progress in our workplace transformation journey as well, even as proactive cyber defense nurtures the digital trust we need to continue to push through to the future.
We are also incubating new offerings in areas such as blockchain, Augmented Reality / Virtual Reality and speech, vision, video and image intelligence, in collaboration with
universities, research organizations and our innovation ecosystem.
Yet, we understand that each of these separate initiatives must come together seamlessly to turn it into a balanced, integrated program of change. It’s only our people who can ‘glue’ it all together. But only when they develop a deep appreciation for the digital culture. We nurture this by driving talent re-skilling at scale for our employees in the new areas of digital services. In many ways, this comes naturally to us because teaching and learning has always been our lifeblood. Whether it’s our investments in our Global Education Center at Mysuru, India; in advanced, anytime-anywhere learning systems such as our Lex platform; or our relationships with universities around the world to curate specific curricula, in areas such as creative design skills, machine learning, autonomous technologies and blockchain, our enthusiasm for lifelong learning remains unrivalled.
We are also investing in localizing our workforce in the geographies we work in, because we believe that the benefits of digital transformation are often better realized contextually. We have announced the setting up of four delivery and innovation centers in the US. The first of these
is already active in Indianapolis, while three others – in Connecticut, Rhode Island and North Carolina – are well on the way to becoming operational. We are also recruiting locally from universities in the US. We aim to scale this effort to include our key markets in Europe and Australia as well.
These strategic initiatives – energizing our core, scaling Agile Digital, re-skilling our people and expanding our localization – are helping us find our next. So we can look forward to an opportunity-filled future.
Much like the Arctic terns do. Their migratory patterns allow them to experience two summers in one year, every year – and that’s more than most other creatures in the world can hope for!
“These strategic initiatives – energizing our core, scaling Agile Digital, re-skilling our people and expanding our localization – are helping us find our next. So we can look forward to an opportunity-filled future.”

22 | Resilient financial performance Infosys Annual Report 2017-18
M.D. RanganathChief Financial Officer
During the financial year ended March 31, 2018, the company delivered a resilient financial performance on multiple fronts, primarily driven by productivity improvements and efficient capital management.
Growth driven by digital revenue : The overall revenue growth was 7.2% in US dollar terms and 5.8% in constant currency terms. The overall revenue growth was on the back of healthy growth in digital revenues. The digital revenues exceeded 25% of the total revenues of the company.
Resilient operating margin : Our operating margin was resilient at 24.3% driven by broad-based improvements in productivity, cost-optimization initiatives and improvement in key operational parameters. Revenue per employee increased by 6.3% during the year and crossed US$ 54,500. The revenue growth during the year was faster than headcount growth due to higher utilization and productivity improvements. While revenue grew by 7.2% in US dollar terms, the headcount grew by just 1.9%. Our operating margin of 24.3% was above the midpoint of our guided range of 23%-25%.
Revenuegrowth
Group headcountgrowth
1.9%
7.2%
*$ 54,602
Revenue per employee
6.3%
YoY growth
*Based on consolidated IFRS US$
RESILIENT FINANCIAL PERFORMANCE
FCF (in US$ million)*
2017
1,68
8
2018
1,94
7
*Based on consolidated IFRS US$FCF is de�ned as net cash provided by operating
activities less capital expenditure as per the consolidated Statement of Cash Flows prepared under IFRS.
15.3%
Robust cash flow : Our Free Cash Flow (FCF) was robust at US$ 1,947 million and grew by 15.3%, which was more than double the revenue growth of 7.2%.

Resilient financial performance | 23 Infosys Annual Report 2017-18
“For the financial year ended March 31, 2018, the company delivered a resilient financial performance on multiple fronts, including robust cash flow, strong EPS growth and healthy RoE.”
Basic EPS (in US$)*
20182017
1.10
0.94
*Based on consolidated IFRS US$**Computed based on full numbers without rounding off
17.8%**
Return on equity*
20182017
24.1
%
21.4
%
*Based on consolidated IFRS US$
and the interim dividend of US$ 529 million (including dividend distribution tax), the total capital returned to shareholders works out to US$ 3,788 million. The aggregate dividend declared during the year was ` 43.50 per share (including interim dividend of ` 13.00, final dividend of ` 20.50 and special dividend of ` 10.00).
The company announced a predictable and comprehensive Capital Allocation Policy in April 2018 after taking into consideration the strategic and operational cash requirements of the company in the medium term. The key aspects of the Capital Allocation Policy are discussed in detail in the Board’s report section of this Annual Report.
Strong EPS growth and healthy RoE : EPS growth was strong at 17.8%. EPS for the year was US$ 1.10, including positive impact of 9 cents on account of an Advance Pricing Agreement (APA) with the US Internal Revenue Service (IRS).
The APA improves the predictability of the company’s tax obligations in respect of its US operations. RoE improved during the year from 21.4% to 24.1%, driven primarily by better capital management.
Successful execution of Capital Allocation Policy : The company successfully executed the Capital Allocation Policy that was announced in April 2017. As part of the policy, the company completed share buyback of ` 13,000 crore (US$ 2,035 million). After including the final dividend for fiscal 2018 of US$ 823 million, special dividend of US$ 401 million
Key milestones : The company is celebrating its 25th year of public listing in India and will be celebrating 20 years of global listing next year. The company was inducted into the prestigious Dow Jones Sustainability Indices in this financial year.
The company continues its endeavor towards building a competitive cost structure and at the same time investing to leverage growth opportunities so as to create sustainable value for its stakeholders.
24 | Being local. Globally.
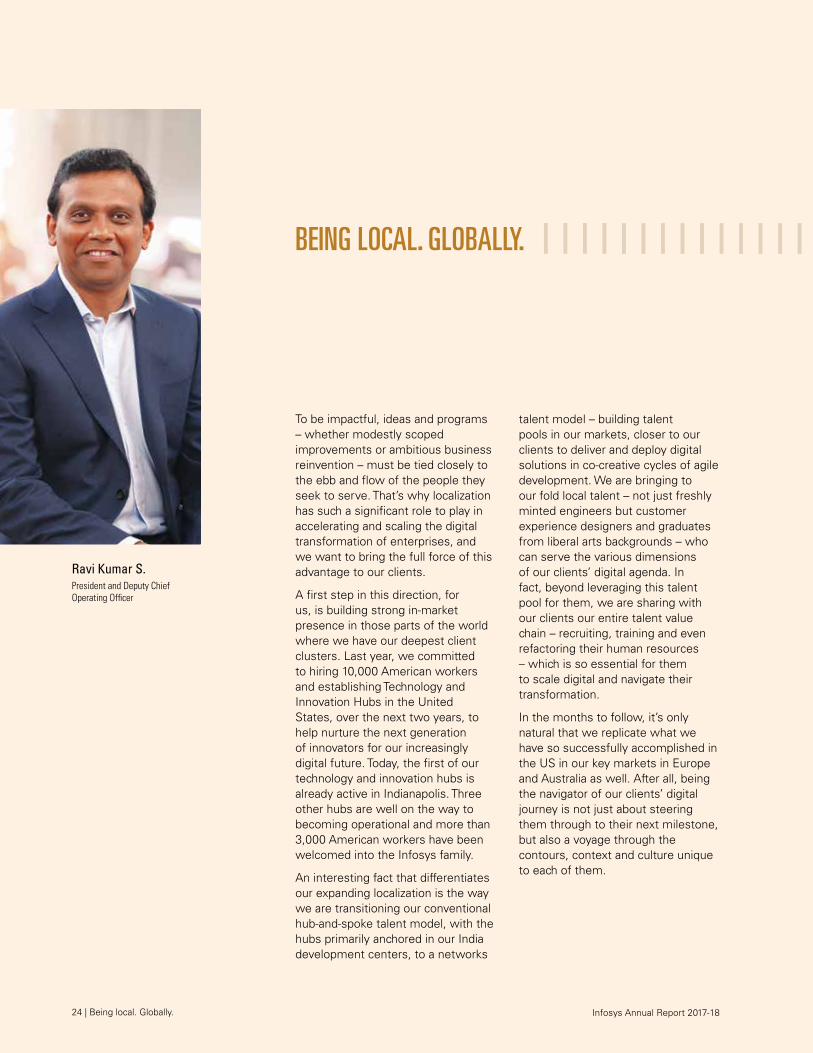
Ravi Kumar S.President and Deputy Chief Operating Officer
To be impactful, ideas and programs – whether modestly scoped improvements or ambitious business reinvention – must be tied closely to the ebb and flow of the people they seek to serve. That’s why localization has such a significant role to play in accelerating and scaling the digital transformation of enterprises, and we want to bring the full force of this advantage to our clients.
A first step in this direction, for us, is building strong in-market presence in those parts of the world where we have our deepest client clusters. Last year, we committed to hiring 10,000 American workers and establishing Technology and Innovation Hubs in the United States, over the next two years, to help nurture the next generation of innovators for our increasingly digital future. Today, the first of our technology and innovation hubs is already active in Indianapolis. Three other hubs are well on the way to becoming operational and more than 3,000 American workers have been welcomed into the Infosys family.
An interesting fact that differentiates our expanding localization is the way we are transitioning our conventional hub-and-spoke talent model, with the hubs primarily anchored in our India development centers, to a networks
talent model – building talent pools in our markets, closer to our clients to deliver and deploy digital solutions in co-creative cycles of agile development. We are bringing to our fold local talent – not just freshly minted engineers but customer experience designers and graduates from liberal arts backgrounds – who can serve the various dimensions of our clients’ digital agenda. In fact, beyond leveraging this talent pool for them, we are sharing with our clients our entire talent value chain – recruiting, training and even refactoring their human resources – which is so essential for them to scale digital and navigate their transformation.
In the months to follow, it’s only natural that we replicate what we have so successfully accomplished in the US in our key markets in Europe and Australia as well. After all, being the navigator of our clients’ digital journey is not just about steering them through to their next milestone, but also a voyage through the contours, context and culture unique to each of them.
BEING LOCAL. GLOBALLY.
Infosys Annual Report 2017-18

From the frontline | 25
Mohit JoshiPresident
It’s no longer business as usual for our clients. In a digitally disrupted world, it’s essential that businesses commit to nurturing new ways of working so that they can establish a foothold in a rapidly changing landscape. It is the technology and the mindset that together make for a winning combination. The unique opportunity before us, then, is to steer our clients through their transformation. To convincingly make the ‘navigate your next’ promise to them, and to keep it.
That’s why, this year, we accelerated investments in amplifying our brand and building perception around how we help our clients nurture new digital capabilities. We also focused on making Infosys an attractive employer brand in our key markets where we are fast-tracking hiring from in-market talent pools to serve our clients’ digital agenda.
Today, we are also widely refactoring our own talent in areas like AI-led analytics, digital experience, and cyber security. This includes creating on-demand avenues for our salesforce to participate in the learning, so they are well-prepared to reset our clients’ path to change at scale. They are now fully equipped to share the value of the industry-specific digital solution
stacks, that we’ve built, with our clients. Our design studios and innovation labs furnish them with the ‘show and tell’ aids they need to demonstrate proof-of-value.
We continue to mine for and grow business in our large accounts, by creating the right ‘flying formation’ of experts including specialists from our vibrant partner ecosystem. Conducting Design Thinking workshops, finding new ways to deal with sticky old problems, and setting up client-specific training academies are integral to this process. Large deals too are a well-oiled growth engine as we invest energies in building a robust pipeline on one end, while improving the win rate on the other. Not unlike every year, we have added significantly to the very impressive roster of clients we already have. This year, the number stands at 283 additional names. We’re also focused on expanding our footprint and are making investments in new geographies and in underpenetrated subverticals.
To us, this progress we’ve made, resonates with our aspiration to partner with our clients not merely to help them respond to the challenges of a changing reality, but to pave their way to a sustainable digital future.
FROM THE FRONTLINE
Infosys Annual Report 2017-18

Infosys Annual Report 2017-1826 | The Infosys Board of Directors
Clockwise from top left :
Nandan M. NilekaniChairman
Salil ParekhChief Executive Officer and Managing Director
U.B. Pravin RaoChief Operating Officer and Whole-time Director
Ravi VenkatesanIndependent Director
Kiran Mazumdar-Shaw Lead Independent Director(1)
THE INFOSYS BOARD OF DIRECTORS#
(1) Effective April 13, 2018
#As on April 13, 2018

Infosys Annual Report 2017-18 The Infosys Board of Directors | 27
Clockwise from top right :
D. SundaramIndependent Director
D.N. PrahladIndependent Director
Dr. Punita Kumar-SinhaIndependent Director
Roopa KudvaIndependent Director
#As on April 13, 2018

Infosys Annual Report 2017-1828 | The Infosys Leadership Team
THE INFOSYS LEADERSHIP TEAM
PRESIDENTS
M.D. RanganathChief Financial Officer
U.B. Pravin RaoChief Operating Officer and Whole-time Director
Salil ParekhChief Executive Officer and Managing Director
Mohit JoshiPresident
Ravi Kumar S.President and Deputy Chief Operating Officer

Infosys Annual Report 2017-18 The Infosys Leadership Team | 29
Deepak PadakiGroup Head – Corporate Strategy, and Chief Risk Officer
Binod R. HampapurGlobal Head – Talent & Technology Operations
Inderpreet SawhneyGroup General Counsel and Chief Compliance Officer
Koushik R.N.Group Head – Procurement & Global Immigration
Krishnamurthy ShankarGroup Head – Human Resources and Infosys Leadership Institute
Karmesh VaswaniIndustry Head – CPG, Logistics & Retail
Narsimha Rao M.Head, Global Services – Cloud, Infrastructure and Security Solutions & Independent Validation Solutions
Anantharaman RadhakrishnanChief Executive Officer & Managing Director – BPM
Ramadas Kamath U.Head - Administration, Facilities, Infrastructure and Security & Sustainability
Jayesh SanghrajkaDeputy Chief Financial Officer
EXECUTIVE VICE PRESIDENTS
Richard LoboHead, HR – Infosys Limited
Sangita SinghIndustry Head – Healthcare & Life Sciences
Satish H.C.Head, Global Services – Data & Analytics
Srikantan MoorthyHead, Global Services – Application Development & Maintenance

30 | Board and committees – Infosys Limited Infosys Annual Report 2017-18
BOARD AND COMMITTEES – INFOSYS LIMITED
The Board of DirectorsNandan M. NilekaniChairman
Salil ParekhChief Executive Officer and Managing Director
U.B. Pravin RaoChief Operating Officer and Whole-time Director
Kiran Mazumdar-ShawLead Independent Director
D.N. PrahladIndependent Director
Dr. Punita Kumar-SinhaIndependent Director
Ravi VenkatesanIndependent Director
Roopa KudvaIndependent Director
D. SundaramIndependent Director
Executive officersSalil ParekhChief Executive Officer and Managing Director
U.B. Pravin RaoChief Operating Officer and Whole-time Director
M.D. Ranganath Chief Financial Officer
Ravi Kumar S.President and Deputy Chief Operating Officer
Mohit JoshiPresident – Infosys Limited
Krishnamurthy ShankarGroup Head, Human Resources and Infosys Leadership Institute
Inderpreet SawhneyGroup General Counsel and Chief Compliance Officer
Board committees
Audit committee
D. SundaramChairperson and Financial Expert
Dr. Punita Kumar-Sinha
Ravi Venkatesan
Roopa Kudva
Corporate social responsibility committee
Kiran Mazumdar-ShawChairperson
U.B. Pravin Rao
Dr. Punita Kumar-Sinha
Roopa Kudva
Finance and investment committee(1)
Dr. Punita Kumar-SinhaChairperson
Kiran Mazumdar-Shaw
D.N. Prahlad
Roopa Kudva
Nomination and remuneration committee
Kiran Mazumdar-ShawChairperson
D.N. Prahlad
Ravi Venkatesan
D. Sundaram
Risk and strategy committee
D.N. PrahladChairperson
Kiran Mazumdar-Shaw
Ravi Venkatesan
D. Sundaram
Stakeholders relationship committee
Ravi VenkatesanChairperson
Dr. Punita Kumar-Sinha
Roopa Kudva
As on April 13, 2018(1) Dissolved effective April 13, 2018

Key trends | 31 Infosys Annual Report 2017-18
Key trends
2018
2017
2016
2015
2014
70,522
68,484
62,441
53,319
50,133
2018
2017
2016
2015
2014
16,029
14,353
13,491
12,329
10,648
2018
2017
2016
2015
2014
10,939
10,208
9,501
8,711
8,249
2018
2017
2016
2015
2014
2,486
2,140
2,052
2,013
1,751
Revenues(1)
(in ` crore)Net profit(1)(4)
(in ` crore)
Revenues(1)
(in US$ million)Net profit(1)(4)
(in US$ million)
2018
2017
2016
2015
2014
12,561
11,303
9,520
8,505
9,442
Free cash flow(1)(5)
(in ` crore)
(1) Based on IFRS consolidated financial statements(2) Based on dividend declared and including corporate dividend tax. Adjusted for bonus issue, wherever applicable(3) At the end of respective fiscal years(4) During the quarter ended December 31, 2017, on account of the conclusion of an Advance Pricing Agreement (APA) with the US Internal Revenue
Service (IRS), the Company has, in accordance with the APA, reversed income tax expense provision of US$ 225 million (` 1,432 crore) which pertains to previous periods which are no longer required. Consequently, profit for the year ended March 31, 2018 has increased, resulting in an increase in basic earnings per equity share by ` 5.88 (US$ 0.09) for the year ended March 31, 2018.
(5) Free cash flow is defined as net cash provided by operating activities less capital expenditure as per the consolidated Statement of Cash Flows prepared under IFRS.
(6) Liquid assets include deposits with banks and highly-rated financial institutions, investments in liquid mutual funds, fixed maturity plan securities, tax-free bonds, government bonds, non-convertible debentures of highly-rated companies, certificates of deposit and commercial paper.
(7) During the year, 11,30,43,478 equity shares were bought back by the Company for a total amount of ` 13,000 crore.
Dividend per share(2)
(in `)
2018
2017
2016
2015
2014
43.50
25.75
24.25
22.25
15.75
Interim dividend of ` 13.00 and �nal dividend of ` 20.50
Special dividend of ` 10.00
2018
2017
2016
2015
2014
31,765
38,773
34,468
32,585
30,251
Liquid assets(1)(3)(6)(7)
(in ` crore)
2018
2017
2016
2015
2014
2,47,198
2,34,805
2,79,837
2,54,771
1,88,510
Market capitalization(3)
(in ` crore)

32 | Key trends Infosys Annual Report 2017-18
2018
2017
2016
2015
2014
2,04,107
2,00,364
1,94,044
1,76,187
1,60,405
Number of employees(2)
2018
2017
2016
2015
2014
1,204
1,162
1,092
950
890
2018
2017
2016
2015
2014
20
19
14
15
13
Number of clients(2) Number of US$ 100 million+ clients(2)
2018
2017
2016
2015
2014
84.6%
81.7%
80.6%
80.9%
77.4%
2018
2017
2016
2015
2014
54,602
51,375
50,745
52,340
51,923
Utilization (excluding trainees) Revenue per employee(1)
(in US$)
2018
2017
2016
2015
2014
24.1%
21.4%
22.7%
24.1%
22.9%
Return on Equity (RoE)(1)(4)
(1) Based on IFRS consolidated financial statements(2) At the end of respective fiscal years(3) Adjusted for bonus issue, wherever applicable(4) During the quarter ended December 31, 2017, on account of the conclusion of an APA with the IRS, the Company has, in accordance with the APA,
reversed income tax expense provision of US$ 225 million (` 1,432 crore) which pertains to previous periods which are no longer required. Consequently, profit for the year ended March 31, 2018 has increased, resulting in an increase in basic earnings per equity share by ̀ 5.88 (US$ 0.09) for the year ended March 31, 2018.
2018
2017
2016
2015
2014
71.07
62.80
59.03
53.94
46.59
Basic earnings per share(1)(3)(4)
(in `)
2018
2017
2016
2015
2014
24.3%
24.7%
25.0%
25.9%
24.0%
Operating margin(1)

The year at a glance | 33 Infosys Annual Report 2017-18
The year at a glance
Based on Ind AS consolidated financial statementsin ` crore, except per equity share data
2018 2017 Growth (%)
Financial performance
Revenues 70,522 68,484 3.0
Gross profit 25,392 25,231 0.6
Operating profit 17,148 16,901 1.5
Profit after tax(1)(2) 16,029 14,353 11.7
Earnings per share (par value of ` 5 each) : Basic(1) 71.07 62.80 13.2
Diluted 71.00 62.77 13.1
Financial position
Cash and cash equivalents(4) 19,818 22,625 (12.4)
Current investments(4) 6,407 9,970 (35.7)
Assets held for sale(2) 2,060 – –
Net current assets(3) 34,176 39,692 (13.9)
Property, plant and equipment (including capital work-in-progress)(2) 11,722 11,116 5.5
Goodwill(2) 2,211 3,652 (39.5)
Intangible assets(2) 247 776 (68.2)
Other non-current assets 15,693 14,106 11.3
Total assets 79,890 83,355 (4.2)
Liabilities directly associated with assets held for sale(2) 324 – –
Non-current liabilities 861 360 139.2
Total equity(4) 64,924 68,982 (5.9)
Total equity and liabilities(4) 79,890 83,355 (4.2)
(1) During the quarter ended December 31, 2017, on account of the conclusion of an Advance Pricing Agreement (APA) with the US Internal Revenue Service (IRS), the Company has, in accordance with the APA, reversed income tax expense provision of US$ 225 million (` 1,432 crore), which pertains to previous periods that are no longer required. Consequently, profit for the year ended March 31, 2018 has increased, resulting in an increase in basic earnings per equity share by ` 5.88 for the year ended March 31, 2018.
(2) In the quarter ended March 2018, on conclusion of a strategic review of the portfolio businesses, the Company initiated identification and evaluation of potential buyers for its subsidiaries, Kallidus and Skava (together referred to as ‘Skava’) and Panaya (collectively referred to as ‘the disposal group’). The Company anticipates completion of the sale by March 2019 and accordingly, assets amounting to ` 2,060 crore and liabilities amounting to ` 324 crore in respect of the disposal group have been reclassified under ‘held for sale’. On reclassification, the disposal group has been measured at the lower of carrying amount and fair value less cost to sell and consequently, an impairment loss of ` 118 crore in respect of Panaya has been recognized in the consolidated Statement of Profit and Loss for the year ended March 31, 2018. The disposal group does not constitute a separate major component of the Company and therefore, has not been classified as discontinued operations.
On a standalone basis, investments amounting to ` 1,525 crore in respect of these subsidiaries have been reclassified under ‘held for sale’. On reclassification, these investments have been measured at the lower of carrying amount and fair value less cost to sell and consequently, an impairment loss of ` 589 crore in respect of Panaya has been recognized in the standalone Statement of Profit and Loss for the year ended March 31, 2018.
(3) Excludes assets held for sale and liabilities directly associated with assets held for sale(4) During the year, 11,30,43,478 equity shares were bought back by the Company for a total amount of ` 13,000 crore.

34 | The year at a glance Infosys Annual Report 2017-18
Based on IFRS US$ consolidated financial statementsin US$ million, except per equity share data
2018 2017 Growth (%)
Financial performance
Revenues 10,939 10,208 7.2
Gross profit 3,938 3,762 4.7
Operating profit 2,659 2,520 5.5
Net profit(1)(2) 2,486 2,140 16.2
Earnings per share (par value of ` 5 (US$ 0.16) each) : Basic(1) 1.10 0.94 (5) 17.8
Diluted 1.10 0.94 (5) 17.8
Financial position
Cash and cash equivalents(4) 3,041 3,489 (12.8)
Current investments(4) 982 1,538 (36.2)
Assets held for sale(2) 316 – –
Net current assets(3) 5,243 6,121 (14.3)
Property, plant and equipment(2) 1,863 1,807 3.1
Goodwill(2) 339 563 (39.8)
Intangible assets(2) 38 120 (68.3)
Other non-current assets 2,342 2,082 12.5
Total assets 12,255 12,854 (4.7)
Liabilities directly associated with assets held for sale(2) 50 – –
Non-current liabilities 131 56 133.9
Total equity(4) 9,960 10,637 (6.4)
Total equity and liabilities(4) 12,255 12,854 (4.7)
(1) During the quarter ended December 31, 2017, on account of the conclusion of an APA with the IRS, the Company has, in accordance with the APA, reversed income tax expense provision of US$ 225 million, which pertains to previous periods that are no longer required. Consequently, profit for the year ended March 31, 2018 has increased, resulting in an increase in basic earnings per equity share by US$ 0.09 for the year ended March 31, 2018.
(2) In the quarter ended March 2018, on conclusion of a strategic review of the portfolio businesses, the Company initiated identification and evaluation of potential buyers for its subsidiaries, Kallidus and Skava (together referred to as ‘Skava’) and Panaya (collectively referred to as ‘the disposal group’). The Company anticipates completion of the sale by March 2019 and accordingly, assets amounting to US$ 316 million and liabilities amounting to US$ 50 million in respect of the disposal group have been reclassified under ‘held for sale’. On reclassification, the disposal group has been measured at the lower of carrying amount and fair value less cost to sell and consequently, an impairment loss of US$ 18 million in respect of Panaya has been recognized in the consolidated Statement of Comprehensive Income for the year ended March 31, 2018. The disposal group does not constitute a separate major component of the Company and therefore, has not been classified as discontinued operations.
On a standalone basis, investments amounting to ` 1,525 crore in respect of these subsidiaries have been reclassified under ‘held for sale’. On reclassification, these investments have been measured at the lower of carrying amount and fair value less cost to sell and consequently, an impairment loss of ` 589 crore in respect of Panaya has been recognized in the standalone Statement of Profit and Loss for the year ended March 31, 2018.
(3) Excludes assets held for sale and liabilities directly associated with assets held for sale(4) During the year, 11,30,43,478 equity shares were bought back by the Company for a total amount of US$ 2,035 million.(5) Computed based on full numbers without rounding off
The year at a glance

Board’s report | 35 Infosys Annual Report 2017-18
Board’s report
Dear members,
The Board of Directors hereby submits the report of the business and operations of your Company (‘the Company’ or ‘Infosys’), along with the audited financial statements, for the financial year ended March 31, 2018. The consolidated performance of the Company and its subsidiaries has been referred to wherever required.
1. Results of our operations and state of affairsin ` crore, except per equity share data
Particulars Standalone ConsolidatedFor the year ended
March 31,For the year ended
March 31,2018 2017 2018 2017
Revenue from operations 61,941 59,289 70,522 68,484 Cost of sales 39,138 37,057 45,130 43,253 Gross profit 22,803 22,232 25,392 25,231 Operating expenses
Selling and marketing expenses 2,763 2,728 3,560 3,591 General and administration expenses 3,562 3,628 4,684 4,739
Total operating expenses 6,325 6,356 8,244 8,330 Operating profit 16,478 15,876 17,148 16,901 Impairment loss on assets held for sale(2) 589 – – – Other income, net(2)(3)(4) 4,019 3,062 3,193 3,080 Profit before non-controlling interests / share in net loss of associate 19,908 18,938 20,341 19,981 Share in net loss of associate, including impairment of associate(4) – – (71) (30)Profit before tax 19,908 18,938 20,270 19,951 Tax expense(1) 3,753 5,120 4,241 5,598 Profit after tax(1) 16,155 13,818 16,029 14,353 Non-controlling interests – – – –Profit for the year(1)(2) 16,155 13,818 16,029 14,353 Other comprehensive income
Items that will not be reclassified subsequently to profit or loss 59 (47) 62 (50)Items that will be reclassified subsequently to profit or loss (38) 29 281 (228)
Total other comprehensive income, net of tax 21 (18) 343 (278)Total comprehensive income for the year 16,176 13,800 16,372 14,075 Earnings per share (EPS)(5)
Basic(1) 71.28 60.16 71.07 62.80 Diluted 71.25 60.15 71.00 62.77
Notes : The above figures are extracted from the audited standalone and consolidated financial statements as per Indian Accounting Standards (Ind AS). 1 crore = 10 million(1) During the quarter ended December 31, 2017, on account of the conclusion of an Advance Pricing Agreement (APA) with the US Internal Revenue
Service (IRS), the Company has, in accordance with the APA, reversed income tax expense provision of US$ 225 million (` 1,432 crore) which pertains to previous periods which are no longer required. Consequently, profit for the year ended March 31, 2018 has increased, resulting in an increase in basic earnings per equity share by ` 5.88 on a consolidated basis and ` 5.85 on a standalone basis for the year ended March 31, 2018.
(2) In the quarter ended March 2018, on conclusion of a strategic review of the portfolio businesses, the Company initiated identification and evaluation of potential buyers for its subsidiaries, Kallidus and Skava (together referred to as ‘Skava’) and Panaya (collectively referred to as ‘the disposal group’). The Company anticipates completion of the sale by March 2019 and accordingly, assets amounting to ` 2,060 crore and liabilities amounting to ` 324 crore in respect of the disposal group have been reclassified under ‘held for sale’. On reclassification, the disposal group has been measured at the lower of carrying amount and fair value less cost to sell and consequently, an impairment loss of ` 118 crore in respect of Panaya has been recognized in the consolidated Statement of Profit and Loss under ‘other income’ for the year ended March 31, 2018. The disposal group does not constitute a separate major component of the Company and therefore, has not been classified as discontinued operations.
In the standalone financial statements of the Company, investments amounting to ` 1,525 crore in respect of these subsidiaries have been reclassified under ‘held for sale’. On reclassification, these investments have been measured at the lower of carrying amount and fair value less cost to sell and consequently, an impairment loss of ` 589 crore in respect of Panaya has been recognized in the standalone Statement of Profit and Loss for the year ended March 31, 2018.
(3) Other income includes ` 257 crore and ` 262 crore for the year ended March 31, 2018 in the standalone and consolidated financial statements of the Company respectively towards interest on income tax refund. Other income in the consolidated Statement of Profit and Loss for the year ended March 31, 2018, also includes impairment loss of ` 118 crore in respect of Panaya, as mentioned in the preceding note.
(4) During the year ended March 31, 2018, Infosys Nova Holdings LLC, a wholly-owned subsidiary, has written down the entire carrying value of its investment in its associate, DWA Nova LLC. Consequently, the Company has written down the entire carrying value of the investment in its subsidiary, Infosys Nova Holdings LLC, amounting to ` 94 crore in the standalone Statement of Profit or Loss of the Company under other income.
Consequent to the above, in the consolidated financials, the Company has written down the entire carrying value of the investment in its associate, DWA Nova LLC, amounting to ` 71 crore. The write-down in the carrying value of investment in associate DWA Nova LLC during the year ended March 31, 2017 was ` 18 crore.
(5) Equity shares are at par value of ` 5 per share.

36 | Board’s report Infosys Annual Report 2017-18
Financial positionin ` crore, except per equity share data
Particulars Standalone ConsolidatedAs at March
31, 2018As at March
31, 2017As at March
31, 2018As at March
31, 2017Cash and cash equivalents(3) 16,770 19,153 19,818 22,625Current investments(3) 5,906 9,643 6,407 9,970Assets held for sale(1) 1,525 – 2,060 –Net current assets(2) 30,903 35,896 34,176 39,692Property, plant and equipment(1) (including capital work-in-progress) 10,469 9,852 11,722 11,116Goodwill(1) 29 – 2,211 3,652Other intangible assets(1) 101 – 247 776Other non-current assets 21,188 22,351 15,693 14,106Total assets 75,877 79,885 79,890 83,355Liabilities directly associated with assets held for sale(1) – – 324 –Non-current liabilities 713 82 861 360
Retained earnings – opening balance 49,957 44,698 52,882 47,063 Add :
Profit for the year 16,155 13,818 16,029 14,353 Transfer from Special Economic Zone Re-investment Reserve on utilization(4) 582 953 617 953
Less : Dividends including dividend distribution tax (7,500) (6,980) (7,469) (6,952)Transfer to general reserve (1,382) (1,579) (1,382) (1,582)Transfer to Special Economic Zone Re-investment Reserve(4) (2,141) (953) (2,200) (953)
Retained earnings – closing balance 55,671 49,957 58,477 52,882 Other equity 7,831 18,060 6,446 16,100Total equity(3) 63,502 68,017 64,924 68,982Total equity and liabilities 75,877 79,885 79,890 83,355Number of equity shares(3) 218,41,14,257 229,69,44,664 217,33,12,301 228,56,55,150
(1) In the quarter ended March 2018, on conclusion of a strategic review of the portfolio businesses, the Company initiated identification and evaluation of potential buyers for its subsidiaries, Kallidus and Skava (together referred to as ‘Skava’) and Panaya (collectively referred to as ‘the disposal group’). The Company anticipates completion of the sale by March 2019 and accordingly, assets amounting to ` 2,060 crore and liabilities amounting to ` 324 crore in respect of the disposal group have been reclassified under ‘held for sale’. On reclassification, the disposal group has been measured at the lower of carrying amount and fair value less cost to sell and consequently, an impairment loss of ` 118 crore in respect of Panaya has been recognized in the consolidated Statement of Profit and Loss for the year ended March 31, 2018. The disposal group does not constitute a separate major component of the Company and therefore, has not been classified as discontinued operations.
On a standalone basis, investments amounting to ` 1,525 crore in respect of these subsidiaries have been reclassified under ‘held for sale’. On reclassification, these investments have been measured at the lower of carrying amount and fair value less cost to sell and consequently, an impairment loss of ` 589 crore in respect of Panaya has been recognized in the standalone profit and loss for the year ended March 31, 2018.
(2) Excludes assets held for sale and liabilities directly associated with assets held for sale.(3) During the year, 11,30,43,478 equity shares were bought back by the Company for a total amount of ` 13,000 crore.(4) The Special Economic Zone (SEZ) Re-investment Reserve has been created out of the profit of eligible SEZ units in terms of the provisions of Section 10AA(1)(ii) of the Income-tax Act, 1961. The reserve should be utilized by the Company for acquiring new plant and machinery for the purpose of its business in the terms of Section 10AA(2) of the Income-tax Act, 1961.
Revenues – standaloneOur revenue from operations on a standalone basis increased by 4.5% to ̀ 61,941 crore in fiscal 2018. Our software export revenues aggregated to ̀ 60,080 crore, up from ̀ 57,491 crore in the previous year. Out of the total revenue, 62.9% came from North America, 23.3% from Europe, 10.8% from the Rest of the World, and 3.0% from India.
Revenues – consolidatedOur revenue from operations on a consolidated basis increased by 3.0% to ̀ 70,522 crore in fiscal 2018. Our software export revenues aggregated to ̀ 68,291 crore, up from ̀ 66,304 crore in the previous year. Out of the total revenue, 60.4% came from North America, 23.7% from Europe, 12.7% from the Rest of the World, and 3.2% from India.
Profits – standaloneOur gross profit on a standalone basis amounted to ` 22,803 crore (36.8% of revenue), as against ` 22,232 crore (37.5% of revenue) in the previous year. Selling and marketing costs were 4.5% of our revenue for the year ended March 31, 2018, as compared to 4.6% for the year ended March 31, 2017. General and administration expenses were 5.7% of our revenue for the year ended March 31, 2018, as compared to 6.1% for the year ended March 31, 2017. The operating profit amounted to ` 16,478 crore (26.6% of revenue), as against ` 15,876 crore (26.8% of revenue), in the previous year. The profit before tax was ` 19,908 crore (32.1% of revenue), as against ` 18,938 crore (31.9% of revenue) in the previous year. Net profit was ` 16,155 crore (26.1% of revenue), as against ̀ 13,818 crore (23.3% of revenue) in the previous year.

Board’s report | 37 Infosys Annual Report 2017-18
Profits – consolidatedOur gross profit on a consolidated basis amounted to ̀ 25,392 crore (36.0% of revenue), as against ` 25,231 crore (36.8% of revenue) in the previous year. Selling and marketing costs were 5.1% of our revenue for the year ended March 31, 2018, as compared to 5.2% for the year ended March 31, 2017. General and administration expenses were 6.6% of our revenue for the year ended March, 31 2018, as compared to 6.9% for the year ended March 31, 2017. The operating profit amounted to ` 17,148 crore (24.3% of revenue), as against ` 16,901 crore (24.7% of revenue) in the previous year. The profit before tax was ` 20,270 crore (28.7% of revenue), as against ` 19,951 crore (29.1% of revenue) in the previous year. Net profit was ` 16,029 crore (22.7% of revenue), as against ̀ 14,353 crore (21.0% of revenue) in the previous year.
North America
Europe
Rest of the World
India
FS(1)
ECS(2)
RCL(3)
All other segments
HILIFE(4)
MFG(5)
Hi-Tech
Revenue distribution by geographical segments (in %) Revenue distribution by business segments (in %)
Net pro�t * (in ` crore)
16,0
29
2018
14,3
53
201717
,148
16,9
01
Operating pro�t (in ` crore)
Basic EPS * (in `)
2018
71.0
7
2017
62.8
0
Gross pro�t (in ` crore)
25,3
92
2018
25,2
31
2017
Total revenue (in ` crore)
2018
70,5
22
2017
68,4
84
Return on equity
2018
24.1
%
2017
21.4
%
FS (1) 18,638
26.410.9
23.815.8
13.1
7.22.8
60.4
3.2
23.7
12.7
20182017
Capital expenditure on tangible assets – standaloneThis year, on a standalone basis, we incurred capital expenditure of ` 1,823 crore. This comprises ` 1,422 crore in infrastructure, ` 396 crore for investment in computer equipment and ` 5 crore in vehicles.
In the previous year, we incurred capital expenditure of ` 1,817 crore. This comprised ` 1,157 crore in infrastructure, ` 654 crore for investment in computer equipment and ` 6 crore in vehicles.
Capital expenditure on tangible assets – consolidatedOn a consolidated basis, we incurred capital expenditure of ` 1,955 crore. During the current year, ` 1,479 crore
Note : Based on Ind AS consolidated financial statements.* Includes reversal of income tax provision of US$ 225 million (` 1,432 crore) pertaining to previous periods on account of conclusion of APA.
Consequently, profit for the year ended March 31, 2018 has increased, resulting in an increase in basic earnings per equity share by ` 5.88 on a consolidated basis.
(1) Financial Services (2) Energy & utilities, Communications and Services (3) Retail, Consumer Packaged Goods and Logistics(4) Life Sciences, Healthcare and Insurance (5) Manufacturing

38 | Board’s report Infosys Annual Report 2017-18
in infrastructure, ` 471 crore in computer equipment and ` 5 crore in vehicles have been invested.
In the previous year, we incurred capital expenditure of ` 2,799 crore. This comprised ` 1,991 crore in infrastructure, ` 800 crore for investment in computer equipment and ` 8 crore in vehicles.
LiquidityOur principal sources of liquidity are cash and cash equivalents and the cash flow that we generate from our operations. We continue to be debt-free and maintain sufficient cash to meet our strategic and operational requirements. We understand that liquidity in the Balance Sheet has to balance between earning adequate returns and the need to cover financial and business requirements. Liquidity enables us to be agile and ready for meeting unforeseen strategic and business needs. We believe that our working capital is sufficient to meet our current requirements.
As of March 31, 2018, we had ` 30,903 crore in working capital (working capital defined as current assets, excluding assets held for sale minus current liabilities, excluding liabilities directly associated with assets held for sale) on a standalone basis, and ` 34,176 crore on a consolidated basis. Working capital includes liquid assets of ` 27,752 crore on a standalone basis and ` 31,765 crore on a consolidated basis as at March 31, 2018, as against ` 34,561 crore on a standalone basis, and ` 38,773 crore on a consolidated basis as on March 31, 2017.
Liquid assets on both standalone and consolidated basis include deposits with banks and highly-rated financial institutions, investments in liquid mutual funds, fixed maturity plan securities, tax-free bonds, government bonds, non-convertible debentures of highly-rated companies, certificates of deposit (CDs) and commercial paper. CDs represent marketable securities of banks and eligible financial institutions for a specified time period with high credit rating given by domestic credit rating agencies. Investments made in non-convertible debentures issued by government-aided institutions and financial institutions with high credit rating. The details of these investments are disclosed under the ‘non-current and current investments’ section in the standalone and consolidated financial statements in this Annual Report.
Capital Allocation Policy The Board, at its meeting on April 13, 2018, reviewed and approved the Capital Allocation Policy of the Company after taking into consideration the strategic and operational cash requirements of the Company in the medium term.
The key aspects of the Capital Allocation Policy are as follows :
i. The Board has decided to retain the current policy of returning up to 70% of the free cash flow of the corresponding financial year in such manner as may be decided by the Board from time to time, subject to applicable laws and requisite approvals, if any. Free cash flow is defined as net cash provided by operating activities less capital expenditure as per the consolidated Statement of Cash Flows prepared under International
Financial Reporting Standards (IFRS). Dividend payout includes Dividend Distribution Tax (DDT).
ii. In addition to the above, out of the cash on the Balance Sheet, the Board has identified an amount of up to ` 13,000 crore (US$ 2 billion(1)) to be paid to shareholders in the following manner :
a. A special dividend of ` 10.00 per share (US$ 0.15 per ADR(1)) resulting in a payout of approximately ` 2,600 crore (approximately US$ 400 million(1)) in June 2018
b. An amount of up to approximately ` 10,400 crore (approximately US$ 1,600 million(1)) to be paid out to shareholders for fiscal 2019, in such manner as may be decided by the Board, subject to applicable laws and requisite approvals, if any.
(1) USD / INR exchange rate at 65.00.
Basic EPSBasic earnings per share increased by 18.5% to ` 71.28 at standalone level and by 13.2% to ` 71.07 at consolidated level. On account of the conclusion of APA with the IRS, the Company has reversed income tax expense amounting to US$ 225 million (` 1,432 crore) pertaining to previous periods resulting in an increase in profits for fiscal 2018. Consequently, earnings per share increased by ̀ 5.85 per share on a standalone basis and ` 5.88 per share on a consolidated basis for the year ended March 31, 2018.
DividendDividend per share declared is in line with the Capital Allocation Policy approved by the Board on April 13, 2017. The Company declared dividend as under :
Dividend per share (in `)
Fiscal 2017(2) Fiscal 2018(3)
Interim dividend 11.00 13.00Final dividend 14.75 (1) 20.50Special dividend – (1)10.00Total dividend 25.75 43.50Payout ratio (interim and final dividend) 49.6% 69.8%
(1) Recommended by the Board of Directors at its meeting held on April 13, 2018. The payment is subject to the approval of the shareholders at the ensuing Annual General Meeting of the Company to be held on June 23, 2018.
(2) Our dividend policy was to pay up to 50% of consolidated post-tax profits.
(3) Our dividend policy is to pay up to 70% of free cash flow. Free cash flow is defined as net cash provided by operating activities less capital expenditure as per the consolidated Statement of Cash Flows prepared under IFRS.
The Register of Members and Share Transfer Books will remain closed on June 16, 2018 for the purpose of payment of the final dividend for the financial year ended March 31, 2018, payment of the special dividend, and the AGM. The AGM is scheduled to be held on June 23, 2018.

Board’s report | 39 Infosys Annual Report 2017-18
Share buybackIn line with the Capital Allocation Policy, the Board, at its meeting on August 19, 2017, approved a proposal for the Company to buy back its fully-paid-up equity shares of face value ` 5 each from the eligible equity shareholders of the Company for an amount not exceeding ` 13,000 crore. The shareholders approved the proposal of buyback of equity shares through the postal ballot that concluded on October 7, 2017. The buyback offer comprised a purchase of 11,30,43,478 equity shares aggregating 4.92% of the paid-up equity share capital of the Company at a price of ` 1,150 per equity share. The buyback was offered to all eligible equity shareholders (including those who became equity shareholders as on the record date by cancelling American Depositary Shares (ADSs) and withdrawing underlying equity shares) of the Company as on the record date (i.e. November 1, 2017) on a proportionate basis through the ‘Tender offer’ route. The Company concluded the buyback procedures on December 27, 2017 and 11,30,43,478 equity shares were extinguished. The Company has utilized securities premium and general reserve for the buyback of its shares. In accordance with Section 69 of the Companies Act, 2013, the Company has created a Capital Redemption Reserve of ` 56 crore equal to the nominal value of the shares bought back as an appropriation from the general reserve.
Advance Pricing Agreement (APA) with the US Internal Revenue Service (IRS) During the quarter ended December 31, 2017, the Company concluded an APA with the IRS. Under the APA, the Company and the IRS have agreed on the methodology to allocate revenues and compute the taxable income of the Company’s US branch operations. This agreement covers fiscal 2011 to fiscal 2021. The Company expects the APA to enhance the predictability of the Company’s tax obligation in respect of its US operations. In accordance with the APA, the Company has reversed income tax expense provision of US$ 225 million (` 1,432 crore) which pertains to previous periods that are no longer required. Consequently, profit for the year ended March 31, 2018 has increased resulting in an increase in basic earnings per share by ` 5.85 on a standalone basis and ` 5.88 on a consolidated basis for the year ended March 31, 2018.
Particulars of loans, guarantees or investmentsLoans, guarantees and investments covered under Section 186 of the Companies Act, 2013 form part of the Notes to the financial statements provided in this Annual Report.
Transfer to reservesWe propose to transfer ̀ 1,615 crore to the general reserve on account of declaration of dividend on both standalone and consolidated levels.
Fixed depositsWe have not accepted any fixed deposits including from the public and, as such, no amount of principal or interest was outstanding as of the Balance Sheet date.
Particulars of contracts or arrangements made with related parties Particulars of contracts or arrangements with related parties referred to in Section 188(1) of the Companies Act, 2013, in the prescribed Form AOC-2, is appended as Annexure 2 to the Board’s report.
Management’s discussion and analysisIn terms of the provisions of Regulation 34 of the Listing Regulations, the Management’s discussion and analysis is set out in this Annual Report.
Risk management reportIn terms of the provisions of Section 134 of the Companies Act, 2013, a Risk management report is set out in this Annual Report.
Board policiesThe details of the policies approved and adopted by the Board are provided in Annexure 9 to the Board’s report.
Material changes and commitments affecting financial position between the end of the financial year and date of the report• Lead Independent Director : The Board, at its meeting
held on April 13, 2018, appointed Kiran Mazumdar-Shaw, Independent Director, as the Lead Independent Director of the Board.
• Acquisition : The Board, at its meeting held on April 13, 2018, approved the Company to enter into a definitive agreement to acquire WongDoody Holding Company Inc, a US-based creative and consumer insights agency, for a total consideration of up to US$ 75 million (approximately ` 489 crore), including contingent consideration and retention payouts, subject to regulatory approvals and fulfillment of closing conditions.
• Capital Allocation Policy : The Board, at its meeting held on April 13, 2018, reviewed and approved the Capital Allocation Policy of the Company after taking into consideration the strategic and operational cash requirements of the Company in the medium term. Key aspects of the Capital Allocation Policy have been discussed earlier in the Board’s report.
2. Business description
StrategyOur strategic objective is to build a sustainable organization that remains relevant to the agenda of our clients, while creating growth opportunities for our employees and generating profitable returns for our investors.
Our clients and prospective clients are faced with transformative business opportunities due to advances in software and computing technology. These organizations are dealing with the challenge of having to reinvent their core offerings, processes and systems rapidly and position themselves as ‘digitally enabled’. The journey to the digital future requires not just an understanding of new technologies and new ways of working, but a deep appreciation of existing technology landscapes, business processes and practices.

40 | Board’s report Infosys Annual Report 2017-18
Our strategy is to be a navigator for our clients as they ideate, plan and execute their journey to a digital future, to help them ‘navigate your next’.
We have embraced a four-pronged strategy to strengthen our relevance to clients and drive accelerated value creation. Towards implementing the strategy, we will :
• Scale Agile Digital • Re-skill our people• Energize the core • Expand localization
Invest in digital capabilities& priority services
Infuse AI and automation,leveraging Nia
Re-skill talent at scalefor us and our clients
Hire locally in markets,local delivery & training
Scale Agile Digital
Energize the Core
Re-skill our People
Expand Localization
Scale Agile DigitalWe will continue to make targeted investments to rapidly accelerate our Agile Digital business. We define ‘digital’ as a set of use cases that drive business outcomes for our clients across five areas :
THE CLIENT DIGITAL
JOURNEY
EXPERIENCE INSIGHT
INN
OVAT
E
ACCELERATEASSURE
• Experience : Well-designed systems for digital marketing, omnichannel interaction, personalization and content management that can enhance customer experience
• Insight : AI-based systems for advanced analytics, leveraging Big Data
• Innovate : Engineering new and digital-first products and offerings leveraging Internet of Things and advanced industry Software-as-a-Service platforms
• Accelerate : The digitization of core systems by migrating to cloud technologies, abstracting APIs, modernizing legacy systems and infrastructure, integrating applications and leveraging Robotic Process Automation (RPA)
• Assure : Implementing advanced cyber-security systems and specialized validation of software systems.
In addition to these, we will also invest in sales and consulting capabilities to engage with clients both in their technology divisions and their business organizations.
We will continue to leverage alliances that complement our core competencies. We will continue to partner with leading technology software and hardware providers in creating, deploying, integrating and operating business solutions for our clients.
We will continue to invest in research and development (R&D) to stay abreast of new technologies and to incubate new offerings in areas such as blockchain, AR / VR and speech, vision, video and image intelligence. We will expand the scope of our collaborations to encompass universities, research organizations and the startup innovation ecosystem.
We will continue to deploy our capital in making selective business acquisitions that augment our Agile Digital expertise, to complement our presence in certain market segments.
Energize the coreWe will continue to embrace automation and artificial intelligence (AI)-based techniques and software automation platforms to boost productivity of our clients’ core processes and systems.
We will continue to leverage these, along with lean processes, Agile development and our Global Delivery Model (GDM) to deliver solutions and services to our clients in the most cost-effective manner, while at the same time optimizing our cost structure to remain competitive.
We will continue to invest in our flagship RPA platform AssistEdge®, our AI platform, Infosys Nia®, and in core business applications such as Finacle®, McCamish and others to bring differentiated and market-leading features and capabilities to our projects with clients.
Re-skill our peopleAn exponential adoption of new technologies is leading to a wide digital talent gap. As technology shifts gain rapid acceleration, we will drive talent re-skilling at scale for our own employees and for our clients’ organizations in the new areas of digital services.
Teaching and learning are central to Infosys culture. Our investments in our Global Education Center and in creating various learning opportunities for our employees help our employees stay abreast of new developments in software technologies, spur innovation and help them build a lifelong career with the Company.
We will continue to invest in advanced, anytime-anywhere learning systems such as our Lex platform and in creating and harnessing up-to-date content from internal and external sources. Further, we are expanding our relationships with universities around the world to curate specific curricula for our employees in areas such as creative design skills, machine learning, autonomous technologies, blockchain etc.
Expand localizationWe believe that client proximity lends several benefits while delivering Agile Digital transformations, and we will invest in localizing our workforce in various geographies. We have announced the setting up of four delivery and innovation centers in the US. The first of these is already active in Indianapolis, while three others – in Connecticut, Rhode Island and North Carolina – are well on the way to becoming
Board’s report | 41 Infosys Annual Report 2017-18
operational. We are recruiting locally from universities in the US. We aim to become an employer of choice from US universities and will set up dedicated leadership and support teams in the US, Europe and Australia. Our strategy to localize will also reduce our dependence on immigration policies.
OrganizationOur go-to-market business units are organized as :• Financial Services • Life Sciences, Healthcare and Insurance• Manufacturing• Retail, Consumer Packaged Goods and Logistics• Hi-tech• Communications• Services, Utilities, Resources and Energy• China• Japan• India• Infosys Public Services
Our service delivery is organized as horizontal service lines :• Global Delivery
– Experience – Insight – Innovate – Accelerate – Assure
• Infosys Global Consulting• Infosys Center for Emerging Technology Solutions • Products and Platforms
– Finacle®
– Edge suite – Infosys Nia®
– Infosys McCamish – Panaya®
– Skava®
• Business Process Management – Infosys BPM
Client baseOur client-centric approach continues to bring us high levels of client satisfaction. We derived 98.5% of our consolidated revenues from repeat business this fiscal. We, along with our subsidiaries, added 283 new clients, including a substantial number of large global corporations. Our total client base at the end of the year stood at 1,204. The client segmentation, based on the last 12 months’ revenue for the current and previous years, on a consolidated basis, is as follows :
Clients 2018 2017100 million dollar + 20 1975 million dollar + 35 3150 million dollar + 57 561 million dollar + 634 598
InfrastructureWe added 2.04 million sq. ft. of physical infrastructure space during the year. The total available space as on March 31, 2018 stands at 46.57 million sq. ft. We have a total of 126 development centers in 27 countries, 82 sales offices in 35 countries. We have a presence in 45 countries as on March 31, 2018.
Infosys Innovation FundOur investment and acquisition strategy is designed to strengthen our competitive positioning and bring technology innovation to our clients. We have a multi-pronged strategy in identifying, investing in, and evangelizing next-generation technologies. We believe we will achieve this through organic investments in R&D, as well as by making investments in external innovation ecosystems and in particular, technology startup companies.
The Infosys Innovation Fund identifies early-stage startup companies developing innovative, next-generation solutions and technologies in the areas of AI and machine learning, Big Data and analytics, convergence of physical and digital processes, technology infrastructure management, cloud systems and cyber security. The Fund partners with startups by providing early-stage capital and in helping bring their innovations to market, attaining scale, product validation and customer introductions.
The Fund has invested US$ 53 million to date in the form of minority holdings in early-stage companies. As of March 31, 2018, the Fund has an additional US$ 12 million in uncalled / pending capital commitments. The carrying value of such investments as on March 31, 2018 was US$ 31 million on account of write-down of investment in DWA Nova amounting to US$ 11 million (` 71 crore) and on account of changes in fair value.
Subsidiaries and associatesWe, along with our subsidiaries, provide consulting, technology, outsourcing and next-generation services. At the beginning of the year, we had 17 direct subsidiaries, 26 step-down subsidiaries and one associate. As on March 31, 2018, we have 20 direct subsidiaries and 26 step-down subsidiaries.
Name change of Infosys BPO Limited : During the year, Infosys BPO Limited, an Indian subsidiary of the Company, received the approval of the Ministry of Corporate Affairs, Government of India, to change the name of the Company to Infosys BPM Limited. The new name is a reflection of the paradigm shift in the nature of services that the Company now offers through its holistic approach of end-to-end transformative BPM (Business Process Management).
Assets held for sale : In the quarter ended March 2018, on conclusion of a strategic review of the portfolio businesses, the Company initiated identification and evaluation of potential buyers for its subsidiaries, Kallidus and Skava (together referred to as ‘Skava’) and Panaya (collectively referred to as ‘the disposal group’). The Company anticipates completion of the sale by March 2019 and accordingly, assets amounting to ̀ 2,060 crore and liabilities amounting to ̀ 324 crore in respect of the disposal group have been reclassified under ‘held for sale’. On reclassification, the disposal group has been measured at the lower of carrying amount and fair value less cost to sell and consequently, an impairment loss of ` 118 crore in respect of Panaya has been recognized in the consolidated Statement of Profit and Loss under other income for the year ended March 31, 2018. An impairment loss of ` 589 crore in respect of Panaya has been recognized
42 | Board’s report Infosys Annual Report 2017-18
in the standalone Statement of Profit and Loss for the year ended March 31, 2018.
During the year, the Board of Directors reviewed the affairs of the subsidiaries. In accordance with Section 129(3) of the Companies Act, 2013, we have prepared the consolidated financial statements of the Company, which form part of this Annual Report. Further, a statement containing the salient features of the financial statement of our subsidiaries in the prescribed format AOC-1 is appended as Annexure 1 to the Board’s report. The statement also provides details of the performance and financial position of each of the subsidiaries.
In accordance with Section 136 of the Companies Act, 2013, the audited financial statements, including the consolidated financial statements and related information of the Company and audited accounts of each of its subsidiaries, are available on our website, www.infosys.com. These documents will also be available for inspection till the date of the AGM during business hours at our registered office in Bengaluru, India.
QualityThe Quality function at Infosys has been at the forefront of enabling delivery and support functions in differentiation, optimization and de-risking. While we continue to comply with international management standards, such as ISO 9001, ISO 22301, ISO 20000, ISO 27001, AS EN 9100, ISO 13485, OHSAS 18001 and ISO 14001, we have transitioned to ISO 14001: 2015 and AS 9100 Rev D newer versions of the standards in applicable business segments in fiscal 2018. These standards are ahead of the curve and we continue to be early adopters in the industry. Infosys acquired Level 5 rating in CMMi DEV + CMMi SVC at the enterprise level covering all service lines and geographies. Infosys Limited as an enterprise is assessed for ISAE 3402 / SSAE 18 SOC 1 type II and has received an independent auditors’ assurance compliance report. Infosys BPM Limited received the Certificate of Compliance for PCI-DSS v3.2 and EdgeVerve Systems Limited has been certified for ISO 22301 : 2012, Business continuity management system.
Our Quality department drove large change initiatives for productivity improvements using Automation and Lean. A focused Automation Group in Quality has worked with service line COEs to create automation solutions which helped improve project productivity across the organization. Implementation of Lean and Six Sigma brought about significant improvement in projects. This year, the Quality function also created Agile-driven, differentiated methodologies for new services launched – which helped deliver superior outcomes in projects.
BrandingThe Infosys brand is a key intangible asset of the Company. It positions Infosys as a next-generation digital services company that helps enterprises navigate their digital transformation. Brand Infosys is built around the premise that our three decades of experience in managing the systems and workings of global enterprises uniquely positions us to be navigators for our clients. We do it by enabling the enterprise with an AI-powered core that helps prioritize the execution of change. We also empower the business with Agile Digital at scale to deliver unprecedented levels of performance
and customer delight. Our Always-on Learning foundation drives their continuous improvement through building and transferring digital skills, expertise and ideas from our innovation ecosystem.
Our marketing reach extends globally through advertisements, public relations and digital marketing initiatives. We participate in premier business and industry events around the world. We also organize signature events and roundtables across geographies. ‘Confluence’, our flagship client event, is consistently well-attended and rated highly by our clients and industry partners.
Awards and recognitionIn fiscal 2018, we won multiple awards and recognition, both international and national. The significant ones among them are as follows :
Business and management• Ranked in the Leadership category in a corporate
governance study conducted jointly by BSE Limited, International Finance Corporation and Institutional Investors Advisory Services
• Won the Platinum Award at the Asset Corporate Awards, the longest running Environment, Social, and Governance awards in Asia. This award is based on an evaluation of financial performance, management, corporate governance, social and environmental responsibility and investor relations
• Declared Model Employer by the Ministry of Labour and Employment, Government of India, for managing labor law compliance
• Infosys tax team won the coveted ‘Asia’s Best In-House Tax Team of the Year’ award for 2017 from Euromoney, a leading publisher in the field of business and finance
• Received awards for Best CEO, Best CFO, and Best Investor Relations at the 2017 All-Asia Executive Team Rankings by the Institutional Investor magazine in the Technology / IT Services and Software sector
Banking (for Finacle®)• India Post, powered by Finacle®, was a winner in the
‘world’s largest core banking transformation’ category at the prestigious Banking Technology magazine awards
• Won the ‘Best Digital Banking Technology’ award at the Banker Middle East awards 2017
ERP services• Won three prestigious Oracle Excellence Awards for
Specialized Partner Cloud Services
• Positioned as a Leader in The Forrester Wave™: Applications Management and Digital Operations Services, Q4 2017
Technology innovation• Positioned as a Leader in Everest Group’s Digital Services
in Consumer Banking PEAK Matrix 2017
• Awarded the ‘Microsoft Platform Modernization’ award and the ‘Microsoft World Wide Consulting & System Integrator Intelligent Cloud Alliance Partner’ award at Microsoft Inspire 2017

Board’s report | 43 Infosys Annual Report 2017-18
Sustainability • Inducted into the prestigious Dow Jones Sustainability
Indices (DJSI) and is now part of the DJSI World and DJSI Emerging Markets Indices
• Infosys Pune became the largest campus in the world to earn the LEED Platinum certification from the US Green Building Council
Human resources• Placed fifth in Business Today’s Best Companies to Work
For list for 2018• Infosys Europe certified by the Top Employers Institute
for its exceptional employee conditions and awarded the exclusive Top Employers Europe 2018 certification
• Won the Golden Peacock HR Excellence Award for 2017.
For the complete list of awards and recognition, refer to https://www.infosys.com/about/awards.
3. Human resources managementThe Human Resources (HR) department at Infosys is driven by the mission :
• To help Infoscions realize their potential – to develop, grow and achieve their purpose
• To build the right culture and capabilities to enable us to delight our customers
• To make Infosys the best place to work for passionate, innovative people who want to make a difference
HR management at Infosys goes beyond the set boundaries of compensation, performance reviews and development. We look at the employee’s entire work-life cycle, to ensure timely interventions that help build a long-lasting and fruitful career. With this in mind, we initiated several positive changes in our HR practice this year.
We have set up a scalable recruitment and HR management process. Over the last year, on a standalone basis, we received 15,40,498 applications from prospective employees. The Infosys Group added 3,743 (net) and 44,110 (gross) employees this year, taking the total strength to 2,04,107 from 2,00,364 at the end of the previous year.
On a standalone basis, the annualized attrition rate for fiscal 2018 stands at 16.4%, as compared to 15.0% for the previous year.
Here are some of the initiatives we have pioneered this year, along with recognition received for the same :• Zero Distance (ZD), the movement to bring innovation
to every project at Infosys, continued into its third year. The total number of ZD plans increased to over 16,000, many of which were discussed with clients, as the focus this year was on the monetization of ZD plans. In addition, we rewarded employees throughout the year for their innovative work through various awards at the unit and organization levels.
• We moved from an annual employee engagement survey model to a more continuous and customized survey format for feedback. This new approach has seen good traction over the year, with insights gathered from various sections of employees throughout the annual period. These insights have led to the creation of tracks for actionizing. To help
trickle the information back into the teams, all managers have access to a dashboard containing feedback from their respective teams.
• In response to the technology disruptions that are transforming our business, we have continued to empower employees by letting them take charge of their careers and learning journeys. With a focus on preparing employees for tomorrow, we have enabled them to create and charter career and learning paths on Compass, our internal digital career platform. Through Compass, we provide our employees a world of opportunities – be it internal career movements, mentoring, learning, internships and more. Employees can also make use of experiences like ‘Power Programmers’ (to build capability in emerging and high-end technologies). In addition, for our Managers, we have created MaQ, an innovative analytics-based tool that equips them to stay abreast of technology and also makes them future-ready. Through these initiatives we continue to ensure that our employees are exposed to compelling career opportunities and have access to learning anytime, anywhere.
• We continued to focus on employee safety as an important aspect of providing a great place to work. We revamped many of our processes and tech offerings, and launched the Infosys Emergency App for employees to get quick help during an emergency. We revised our workplace guidelines and security infrastructure to make them more robust. We continuously communicated with employees on available safety measures to increase awareness, benchmarked our work in this space against the best that is on offer, and sought regular feedback from employees to ensure their involvement in making Infosys even more safe and secure.
• The Next Gen Talent Management Model was taken one step further this year with the launch of a dashboard and system that captures all employee data for easy, data-driven decision-making. The system was launched to business leaders to give them deeper analytical insights into their teams.
• To ensure that employees are at their productive best, we continued to work on simplifying internal processes through a collaborative effort with various teams. Rewards and recognition, in terms of the annual awards for excellence, quarterly promotions, and unit awards, continued.
• The stock incentives program was leveraged for rewarding and retaining our high-potential employees and senior leadership.
• We were ranked second among 250+ companies which participated in the AVTAR Best Companies for Women Score Card on Safety in India
To foster a positive workplace environment, free from harassment of any nature, we have institutionalized the Anti-Sexual Harassment Initiative (ASHI) framework, through which we address complaints of sexual harassment at the workplace. Our global policy assures discretion and guarantees non-retaliation to complainants. We follow a gender-neutral approach in handling complaints of sexual harassment and we are compliant with the law of the land wherever we operate. We have also constituted an Internal

44 | Board’s report Infosys Annual Report 2017-18
Complaints Committee (ICC) in all locations across India to consider and address sexual harassment complaints in accordance with the Sexual Harassment of Women at Workplace (Prevention, Prohibition and Redressal) Act, 2013.
The details of the issues raised and resolved regarding sexual harassment at the workplace are available in the Business Responsibility Report which is part of this Annual Report.
Education, training and assessmentInfosys believes in lifelong learning for its employees, and competency development continues to be a key area of strategic focus for us. Our Education, Training and Assessment (ETA) department is at the forefront of creating a culture of learning in the organization. In the age of disruption, whether it is Digital, AI, Machine Learning (ML) or other emerging technologies, we created more than 75 new courses for our employees to embrace new and emerging technologies and be future-ready. We now have about 250 internally created self-learning programs focusing on the key foundations and real-life examples (including flight simulators), making them market-relevant effectively. These are in addition to the 1,500+ courses and 3,600 micro-learning videos already available. We recently built a new learning platform called Lex. Lex is a highly scalable and modular learning platform that allows our employees to access learning content from anywhere, from any device, at any time, and learn at a time convenient for them. Employees can even download the content and access it later when they are offline as well. With this, we are able to achieve our goal of enabling ‘Learning on the Go’ for our employees.
To ensure that we have systemic intervention in place to re-skill our existing employees in new and emerging technologies, we created a recommendation engine to suggest appropriate learning paths based on the adjacency skills they possess currently, and created learning stacks to provide an end-to-end view of technology and industry best practices. This helps us bring our re-skilling programs in line with our growth projections and address our employees’ aspirations. Building up on our extensive experience in India, we started enabling fresh hires in the US at various places like Raleigh, Indianapolis, Plano etc., and making them project-ready. We have collaborated with local universities and MOOC providers in the US for various educational offerings. For example, we are working with Rhode Island School of Design to train our employees on digital and design skills, and working with Udacity to train some of our fresh hires in the US, to offer their Nanodegree programs to our fresh hires in India, and ‘Self Driving Car Engineer’ Nanodegree program to our experienced employees. Similarly we are working with Coursera to enable our employees on Google Cloud Platform.
Campus Connect, our industry-academia partnership program, made progress with the launch of electives to help engineering colleges run new programs within their curricula. In fiscal 2018, we engaged with 1,052 faculty members who in turn trained 40,139 students. With this, the total number of beneficiaries covered has reached 15,219 faculty members and 4,56,324 students from 286 engineering institutions.
Infosys Leadership InstituteInfosys Leadership Institute (ILI) embraces a customized approach to host initiatives aligned to specific development needs of the senior leadership team. Our business leaders, along with HR business partners, identify needs for their respective talent pool through formal talent review discussions. These themes help us to evolve our learning calendar of open programs called Leadership Labs. We had over 200 leaders nominated across functions, subsidiaries and technologies, resulting in a diverse mix across locations, focused on leadership facets like executive presence, storytelling etc. To provide deep dive into specific skills, we launched four Leadership Tracks for 45 leaders, spanning a period of 3-6 months. In partnership with Stanford Graduate School of Business, we had two cohorts comprising 38 and 65 leaders who completed their graduation during the year.
Infosys Sales Academy provides learning curricula and interventions for our sales leaders. ILI also supports development of women leaders through mentoring and women’s leadership experience workshops. Leaders nurturing future leaders is a key component of our approach to learning.
Particulars of employeesThe ratio of the remuneration of each whole-time director and key managerial personnel (KMP) to the median of employees’ remuneration as per Section 197(12) of the Companies Act, 2013, read with Rule 5(1) of the Companies (Appointment and Remuneration of Managerial Personnel) Rules, 2014 forms part of the Board’s report (Annexure 3). Refer to tables 3(a) and 3(b) in Annexure 3.
Additionally, the following details form part of Annexure 3 to the Board’s report :
• Remuneration to non-executive / independent directors (Refer to table 3(c))
• Statement containing the names of top 10 employees in terms of remuneration drawn (Refer to table 3(d))
• Details of employees posted in India throughout the fiscal and in receipt of a remuneration of ` 1.02 crore or more per annum (Refer to table 3(e)(i))

Board’s report | 45 Infosys Annual Report 2017-18
• Details of employees posted in India for part of the yearand in receipt of ` 8.5 lakh or more a month (Refer totable 3(e)(ii))
• The details of employees posted outside India and inreceipt of a remuneration of ` 60 lakh or more per annumor ` 5 lakh or more a month can be made availableon request.
Employee stock options / Restricted stock units (RSU)The Company, under the 2015 Stock Incentive Compensation Plan (‘the 2015 Plan’), approved by the shareholders vide a postal ballot concluded on March 31, 2016, grants share- based benefits to eligible employees with a view to attracting and retaining the best talent, encouraging employees to align individual performances with Company objectives, and promoting increased participation by them in the growth of the Company.
The total number of equity shares and American Depositary Receipts (ADRs) to be allotted pursuant to the exercise of the stock incentives under the 2015 Plan to the employees of the Company and its subsidiaries shall not cumulatively exceed 2,40,38,883 equity shares (approximately 1% of the issued capital). The 2015 Plan is in compliance with SEBI (Share-based Employee Benefits) Regulations, 2014, and there has been no material changes to the plan during the fiscal. The details of the 2015 Plan, including terms of reference, and the requirement specified under Regulation 14 of the SEBI (Share-based Employee Benefits) Regulations, 2014, are available on the Company’s website, at https://www.infosys.com/investors/reports-filings/Documents/disclosures-pursuant-SEBI-regulations2018.pdf.
The details of the employee stock options / RSU plan form part of the Notes to accounts of the financial statements in this Annual Report.
The details of stock incentives granted during the year ended March 31, 2018 are as follows :
Approval date Grantees Date of grant Stock incentives approved by the Board / nomination and remuneration committee
RSUs Stock optionsApr 13, 2017 U.B. Pravin Rao May 2, 2017 27,250 43,000Apr 13, 2017 Dr. Vishal Sikka May 2, 2017 2,70,224 3,30,525Apr 13, 2017 Eligible employees other than KMP May 2, 2017 37,100 73,600Jul 13, 2017 Inderpreet Sawhney August 1, 2017 (1) 58,150 44,450Jul 13, 2017 Eligible employee other than KMP August 1, 2017 7,450 –Feb 27, 2018 Salil Parekh February 27, 2018 (2) 1,13,024 –Feb 27, 2018 M.D. Ranganath February 27, 2018 66,850 –Feb 27, 2018 Ravi Kumar S. February 27, 2018 66,850 –Feb 27, 2018 Mohit Joshi February 27, 2018 66,850 –Feb 27, 2018 Krishnamurthy Shankar February 27, 2018 12,400 –Feb 27, 2018 A.G.S. Manikantha February 27, 2018 2,000 –Feb 27, 2018 Eligible employees other than KMP February 27, 2018 16,02,510 –
Note : Includes cash-settled stock incentives(1) Includes time-based grant of 19,450 RSUs and a one-time, time-based grant of 38,700 RSUs on joining(2) Pursuant to the approval of the shareholders through a postal ballot on February 20, 2018, Salil Parekh (CEO & MD) is eligible to receive, under the
2015 Plan, an annual grant of RSUs of fair value ` 3.25 crore, which will vest over time in three equal annual installments upon completion of each year of service from the respective grant date, a one-time grant of RSUs of fair value ` 9.75 crore, which will vest over time in two equal annual installments upon completion of each year of service from the grant date, and an annual grant of performance-based RSUs of fair value ` 13 crore, which will vestafter completion of three years, the first of which concludes on March 31, 2021, subject to the achievement of performance targets set by the Board orits committee.The Board, based on the recommendations of the nomination and remuneration committee, approved, on February 27, 2018, an annual time-basedgrant for fiscal 2018 of 28,256 RSUs and a one-time, time-based grant of 84,768 RSUs. The grants were made effective February 27, 2018.
Grants exercised during the year : During fiscal 2018, exercise of grants by eligible employees were as follows :
Name RSUs OptionsExercised and
allotted in fiscal 2018Outstanding as on
March 31, 2018Exercised and
allotted in fiscal 2018Outstanding as on
March 31, 2018Salil Parekh(1) – 1,13,024 – –U.B. Pravin Rao – 27,250 – 43,000M.D. Ranganath 7,662 89,838 – 48,400Ravi Kumar S. 13,087 1,06,113 28,187 84,563Mohit Joshi 13,087 1,06,113 – 1,12,750Krishnamurthy Shankar 3,012 21,438 – 19,000Inderpreet Sawhney(2) – 58,150 – 44,450

46 | Board’s report Infosys Annual Report 2017-18
Name RSUs OptionsExercised and
allotted in fiscal 2018Outstanding as on
March 31, 2018Exercised and
allotted in fiscal 2018Outstanding as on
March 31, 2018A.G.S. Manikantha 250 2,750 – –Dr. Vishal Sikka(3) 70,772 – – –Rajesh K. Murthy(4) 11,250 – 24,225 –Eligible employees other than KMP 5,49,775 33,31,740 – 6,20,500
Note : Includes cash-settled stock incentives(1) The Board, based on the recommendations of the nomination and remuneration committee, approved an annual time-based grant for fiscal 2018 of
28,256 RSUs, which will vest over time in three equal annual installments upon completion of each year of service and a one-time, time-based grant of 84,768 RSUs, which will vest over time in two equal annual installments upon completion of each year of service from the grant date.
(2) Includes time-based grant of 19,450 RSUs and a one-time, time-based grant of 38,700 RSUs on joining (3) During fiscal 2018, Dr. Vishal Sikka exercised 70,772 RSUs. Consequent to his resignation from the Company on August 24, 2017, the unvested stock
incentives (time-based and performance-based awards) granted to him were forfeited.(4) Resigned effective January 31, 2018, and the unvested stock incentives granted to him were forfeited.
4. Corporate governance
Our corporate governance philosophyOur corporate governance practices are a reflection of our value system encompassing our culture, policies, and relationships with our stakeholders. Integrity and transparency are key to our corporate governance practices to ensure that we gain and retain the trust of our stakeholders at all times. Corporate governance is about maximizing shareholder value legally, ethically and sustainably. At Infosys, our Board exercises its fiduciary responsibilities in the widest sense of the term. Our disclosures seek to attain the best practices in international corporate governance. We also endeavor to enhance long-term shareholder value and respect minority rights in all our business decisions.
Our Corporate governance report for fiscal 2018 forms part of this Annual Report.
Board diversityThe Company recognizes and embraces the importance of a diverse board in its success. We believe that a truly diverse board will leverage differences in thought, perspective, knowledge, skill, regional and industry experience, cultural and geographical background, age, ethnicity, race and gender, that will help us retain our competitive advantage. The Board Diversity Policy adopted by the Board sets out its approach to diversity. The policy is available on our website, at https://www.infosys.com/investors/corporate-governance/documents/board-diversity-policy.pdf.
Additional details on Board diversity are available in the Corporate governance report that forms part of this Annual Report.
Number of meetings of the BoardThe Board met 11 times during the financial year. The meeting details are provided in the Corporate governance report that forms part of this Annual Report. The maximum interval between any two meetings did not exceed 120 days, as prescribed in the Companies Act, 2013.
Policy on directors’ appointment and remunerationThe current policy is to have an appropriate mix of executive, non-executive and independent directors to maintain the independence of the Board, and separate its functions of governance and management. As of March 31, 2018, the Board had nine members, two of whom were executive or whole-time directors, one a non-executive and non-independent member and six independent directors. Three of the independent directors of the Board are women.
The policy of the Company on directors’ appointment and remuneration, including the criteria for determining qualifications, positive attributes, independence of a director and other matters, as required under sub-section (3) of Section 178 of the Companies Act, 2013, is available on our website, at https://www.infosys.com/investors/corporate-governance/documents/nomination-remuneration-policy.pdf.
There has been no change in the policy since last fiscal. We affirm that the remuneration paid to the directors is as per the terms laid out in the Nomination and Remuneration Policy of the Company.
Declaration by independent directorsThe Company has received necessary declaration from each independent director under Section 149(7) of the Companies Act, 2013, that he / she meets the criteria of independence laid down in Section 149(6) of the Companies Act, 2013 and Regulation 25 of the Listing Regulations.
Board evaluation The nomination and remuneration committee engaged Egon Zehnder, external consultants, to conduct Board evaluation for the year. The evaluation of all the directors, committees, Chairman of the Board, and the Board as a whole was conducted based on the criteria and framework adopted by the Board. The evaluation parameters and the process have been explained in the Corporate governance report. The outcome of the Board evaluation for fiscal 2018 was discussed by the nomination and remuneration committee and the Board at the meeting held on April 13, 2018.

Board’s report | 47 Infosys Annual Report 2017-18
Familiarization program for independent directorsAll new independent directors inducted into the Board attend an orientation program. The details of the training and familiarization program are provided in the Corporate governance report. Further, at the time of the appointment of an independent director, the Company issues a formal letter of appointment outlining his / her role, function, duties and responsibilities. The format of the letter of appointment is available on our website, at https://www.infosys.com/investors/corporate-governance/Documents/appointment-independent-director.pdf.
Directors and key managerial personnel
InductionsThe following appointments were made during the year :
• Nandan M. Nilekani as non-executive non-independent director and Chairman of the Board effective August 24, 2017, approved by shareholders vide a postal ballot concluded on October 7, 2017.
• D. Sundaram as independent director of the Board effective July 14, 2017, approved by shareholders vide a postal ballot concluded on October 7, 2017.
• Salil Parekh as the Chief Executive Officer and Managing Director (CEO & MD) effective January 2, 2018, approved by shareholders vide a postal ballot concluded on February 20, 2018.
• Inderpreet Sawhney as Group General Counsel and Chief Compliance Officer effective July 3, 2017, and as key managerial personnel (KMP), as defined under Ind AS 24, Related Party Disclosures, effective July 14, 2017.
ReappointmentsAs per the provisions of the Companies Act, 2013, U.B. Pravin Rao, who has been longest in the office, retires by rotation at the ensuing AGM and, being eligible, seeks reappointment. The Board recommends his reappointment.
Retirements and resignationsR. Seshasayee resigned as non-executive Chairman and member of the Board effective August 24, 2017.
Dr. Vishal Sikka was appointed as Executive Vice Chairman subsequent to his resignation as CEO and MD at the Board meeting held on August 18, 2017 and resigned as a Director and Executive Vice Chairman effective August 24, 2017.
Prof. John W. Etchemendy and Prof. Jeffrey S. Lehman, independent directors, resigned as members of the Board effective August 24, 2017.
Gopi Krishnan Radhakrishnan resigned as Acting General Counsel and KMP effective June 24, 2017.
Sandeep Dadlani, President and Segment Head – Manufacturing, Retail, CPG and Logistics, resigned as KMP effective July 14, 2017.
Rajesh K. Murthy, President and Segment Head – Energy, Resources, Utilities and Communications and Services, resigned as KMP effective January 31, 2018.
Change in designationThe Board, at its meeting held on April 13, 2018, appointed Kiran Mazumdar-Shaw as the Lead Independent Director.
Ravi Venkatesan resigned as Co-Chairman of the Board and continued to be a member of the Board effective August 24, 2017.
The Board, upon the resignation of Dr. Vishal Sikka, appointed U.B. Pravin Rao, Chief Operating Officer and Whole-time Director, as Interim Chief Executive Officer and Managing Director at its meeting held on August 18, 2017. The Board, at its meeting held on December 2, 2017, appointed Salil Parekh as Chief Executive Officer and Managing Director effective January 2, 2018 and accordingly re-designated U.B. Pravin Rao as Chief Operating Officer and Whole-time Director with effect from January 2, 2018. The shareholders approved these vide a postal ballot concluded on February 20, 2018.
Committees of the BoardAs on March 31, 2018, the Board had six committees : the audit committee, the nomination and remuneration committee, the corporate social responsibility committee, the stakeholders relationship committee, the risk and strategy committee, and the finance and investment committee. The committee of directors was dissolved with effect from January 12, 2018. The finance and investment committee was dissolved effective April 13, 2018. The roles and responsibilities of the finance and investment committee were delegated to the audit committee with effect from April 13, 2018. All committees, except the corporate social responsibility committee, consist entirely of independent directors.
A detailed note on the composition of the Board and its committees is provided in the Corporate governance report.
Internal financial control and its adequacyThe Board has adopted policies and procedures for ensuring the orderly and efficient conduct of its business, including adherence to the Company’s policies, safeguarding of its assets, prevention and detection of fraud, error reporting mechanisms, accuracy and completeness of the accounting records, and timely preparation of reliable financial disclosures.
Significant and material ordersThere are no significant and material orders passed by the regulators or courts or tribunals impacting the going concern status and the Company’s operations in future.
The Company has submitted a settlement application on December 5, 2017 with the Securities and Exchange Board of India (SEBI). The settlement application pertains to matters relating to the severance agreement entered into with Rajiv Bansal, the Company’s former CFO, in October 2015. Through the settlement process, the Company wants to resolve allegations relating to the Company not seeking prior and separate approval of the nomination and remuneration committee and the audit committee in relation to the severance agreement entered into with Rajiv Bansal; and in relation to disclosures pertaining to the said severance agreement, cessation of payments and initiation of arbitration under the severance agreement. The settlement application

48 | Board’s report Infosys Annual Report 2017-18
process is based on an undertaking that the Company will neither admit nor deny the finding of fact or conclusion of law. The Company will provide an update upon the conclusion of the settlement process.
Reporting of frauds by auditorsDuring the year under review, neither the statutory auditors nor the secretarial auditor has reported to the audit committee, under Section 143 (12) of the Companies Act, 2013, any instances of fraud committed against the Company by its officers or employees, the details of which would need to be mentioned in the Board’s report.
Annual returnIn accordance with Section 134(3)(a) of the Companies Act, 2013, an extract of the annual return in the prescribed format is appended as Annexure 6 to the Board’s report.
Secretarial standardsThe Company complies with all applicable secretarial standards.
Listing on stock exchangesThe Company’s shares are listed on BSE Limited and National Stock Exchange of India Limited, and ADSs are listed on New York Stock Exchange (NYSE), Euronext Paris and Euronext London. Infosys was inducted into the Dow Jones Sustainability Indices in fiscal 2018.
BSE Limited : The Company’s shares were listed on BSE in June, 1993 and will be completing 25 years of public listing in India.
New York Stock Exchange : The Company listed its ADSs on the NYSE on December 12, 2012. The Company celebrated its fifth anniversary of being listed on NYSE on December 20, 2017 by ringing the ‘opening bell’.
Infosys leaders ringing the NYSE opening bell to mark five years of listing
on the NYSE
Proposed delisting of ADSs on Euronext Paris and Euronext LondonIn March 2018, the Company announced its intention to voluntarily delist its ADSs from the Euronext Paris and Euronext London exchanges. The primary reason for seeking the proposed delisting is the low average daily trading volume of Infosys ADSs on these exchanges, which is not commensurate with the related administrative requirements. During the five-year period of the Company’s listing on Euronext Paris and Euronext London, the average daily
trading volume of the Company’s ADSs was significantly lower than its average daily trading volume on the NYSE. The proposed delisting is subject to approval from Euronext Paris S.A. and Euronext London Limited. There will be no change in the Infosys share / ADS count, capital structure and float as a result of the proposed delisting from the above exchanges. Infosys ADSs will continue to be listed on the NYSE under the symbol ‘INFY’ and investors can continue to trade their ADSs on the NYSE as before.
Subject to the approval of the proposed delisting by Euronext Paris S.A. and Euronext London Limited, a sale facility will be provided by the Company to the holders of ADSs trading on the Euronext Paris and Euronext London exchanges. ADS holders who opt for it will be able to sell their ADSs on the NYSE in accordance with Euronext Paris and Euronext London rules. ADS holders who do not opt for it can continue to retain their ADSs and will be able to trade their ADSs on the NYSE. Further, until the date of completion of the proposed delisting, the ADS holders can continue to trade their ADSs on the Euronext Paris and Euronext London exchanges.
Investor Education and Protection Fund (IEPF)Pursuant to the applicable provisions of the Companies Act, 2013, read with the IEPF Authority (Accounting, Audit, Transfer and Refund) Rules, 2016 (‘the Rules’), all unpaid or unclaimed dividends are required to be transferred by the Company to the IEPF established by the Government of India, after the completion of seven years. Further, according to the Rules, the shares on which dividend has not been paid or claimed by the shareholders for seven consecutive years or more shall also be transferred to the demat account of the IEPF Authority. Accordingly, the Company has transferred the unclaimed and unpaid dividends of ` 2,04,47,770. Further, 1,05,234 corresponding shares were transferred as per the requirements of the IEPF rules. The details are provided in the Shareholder information section of this Annual Report and are also available on our website, at www.infosys.com/IEPF.
Directors’ responsibility statementThe financial statements are prepared in accordance with Indian Accounting Standards (Ind AS) under the historical cost convention on accrual basis except for certain financial instruments, which are measured at fair values, the provisions of the Act (to the extent notified) and guidelines issued by SEBI. The Ind AS are prescribed under Section 133 of the Companies Act, 2013 (‘the Act’), read with Rule 3 of the Companies (Indian Accounting Standards) Rules, 2015 and Companies (Indian Accounting Standards) Amendment Rules, 2016. Effective April 1, 2016, the Company has adopted all the Ind AS standards and the adoption was carried out in accordance with applicable transition guidance. Accounting policies have been consistently applied except where a newly-issued accounting standard is initially adopted or a revision to an existing accounting standard requires a change in the accounting policy hitherto in use.
The directors confirm that :
• In preparation of the annual accounts for the financial year ended March 31, 2018, the applicable accounting standards have been followed and there are no material departures.

Board’s report | 49 Infosys Annual Report 2017-18
• They have selected such accounting policies and applied them consistently and made judgments and estimates that are reasonable and prudent so as to give a true and fair view of the state of affairs of the Company at the end of the financial year and of the profit and loss of the Company for that period.
• They have taken proper and sufficient care towards the maintenance of adequate accounting records in accordance with the provisions of the Companies Act, 2013 for safeguarding the assets of the Company and for preventing and detecting fraud and other irregularities.
• They have prepared the annual accounts on a going concern basis.
• They have laid down internal financial controls, which are adequate and are operating effectively.
• They have devised proper systems to ensure compliance with the provisions of all applicable laws and such systems are adequate and operating effectively.
5. Audit reports and auditors
Audit reports • The Auditors’ Report for fiscal 2018 does not contain any
qualification, reservation or adverse remark. The Auditors’ Report is enclosed with the financial statements in this Annual Report.
• The Secretarial Auditors’ Report for fiscal 2018 does not contain any qualification, reservation or adverse remark. The Secretarial Auditors’ Report is enclosed as Annexure 5 to the Board’s report in this Annual Report.
• As required by the Listing Regulations, the auditors’ certificate on corporate governance is enclosed as Annexure 4 to the Board’s report. The auditors’ certificate for fiscal 2018 does not contain any qualification, reservation or adverse remark.
• In addition, the Company has also voluntarily engaged a Practicing Company Secretary to audit on corporate governance. The report does not contain any qualification, reservation or adverse remarks.
Auditors
Statutory auditorsUnder Section 139 of the Companies Act, 2013 and the Rules made thereunder, it is mandatory to rotate the statutory auditors on completion of the maximum term permitted under the said section. In line with the requirements of the Companies Act, 2013, Deloitte Haskins & Sells LLP, Chartered Accountants (Firm registration number 117366 W/W 100018) (‘Deloitte’) was appointed as the statutory auditors of the Company to hold office for a period of five consecutive years from the conclusion of the 36th Annual General Meeting of the Company held on June 24, 2017, till the conclusion of the 41st Annual General Meeting to be held in the year 2022, subject to ratification by shareholders at the general meeting or as may necessitated by the Act from time to time. The first year of audit was of the financial statements for the year ending March 31, 2018, which included the audit
of the quarterly financial statements for the year. Accordingly, the appointment of Deloitte Haskins & Sells LLP is being placed before the shareholders for ratification.
Secretarial auditorAs required under Section 204 of the Companies Act, 2013 and Rules thereunder, the Board has appointed Parameshwar G. Hegde of Hegde & Hegde, Practicing Company Secretaries, as secretarial auditor of the Company for fiscal 2019.
6. Corporate social responsibility (CSR)Infosys has been an early adopter of CSR initiatives. The Company works primarily through its CSR trust, the Infosys Foundation, towards supporting projects in eradication of hunger and malnutrition, promoting education, art and culture, healthcare, destitute care and rehabilitation, environmental sustainability, disaster relief and rural development projects. Details of the CSR policy are available on our website, at https://www.infosys.com/investors/corporate-governance/Documents/corporate-social-responsibility-policy.pdf. The annual report on our CSR activities is appended as Annexure 7 to the Board’s report.
Infosys FoundationInfosys Foundation was established in 1996 for social welfare activities. Since its inception, the Foundation, through its grant-making and partnerships with individuals, government bodies and competent non-governmental bodies, has fostered a sustainable culture of development in the areas of healthcare, promotion of education, eradication of hunger, rural development, art and culture, and destitute care across India.
This year, the Foundation’s activities have extended from Jammu & Kashmir to Tamil Nadu, and from Gujarat to Arunachal Pradesh, with an emphasis on expanding our reach while ensuring focus on key areas of development. The highlights of the Foundation’s work included the building of a dharmashala at PGIMER, Chandigarh, gravity-fed water supply systems around Visakhapatnam, renovation of Capital Hospital at Bhubaneswar, a hi-tech kitchen at Kandi, Telangana in partnership with the Akshaya Patra Foundation and continued Swachh Bharat efforts in Tamil Nadu, Karnataka, Maharashtra and Telangana. For more details on the Foundation’s activities, visit https://www.infosys.com/infosys-foundation.
Akshaya Patra’s mega kitchen in Kandi, Telangana, funded by the Foundation, will be able to prepare meals for 1,00,000 people at a time

50 | Board’s report Infosys Annual Report 2017-18
Infosys Foundation USAIn fiscal 2018, Infosys Foundation USA advanced its mission to increase access to Computer Science (CS) and Maker education, with an emphasis on under-represented students. The Foundation has impacted teachers, students and schools across US states, through initiatives such as :• CS Teacher Support• CS Student Support• Maker Initiatives
For more details, visit http://www.infosys.org/infosys-foundation-usa/.
Infosys Science Foundation
Guest of honor Prof. Kip Thorne addressing the audience at the Infosys Prize ceremony on Jan 10, 2018
The Infosys Science Foundation (ISF) was set up by Infosys and some members of its management in 2009 to encourage the pursuit and practice of the sciences and research. The Infosys Prize, governed by the ISF, recognizes some of the finest research connected to India. The prize winners are awarded a purse of ` 65 lakh (tax-free in India) and a citation by a jury of global renown across six fields. The winners of the Infosys Prize 2017 were Prof. Sanghamitra Bandyopadhyay (Director, Indian Statistical Institute (ISI), Kolkata) in Engineering and Computer Science, Prof. Ananya Jahanara Kabir (Professor of English Literature, King’s College, London, UK) in Humanities, Prof. Upinder S. Bhalla (Professor, National Centre for Biological Sciences, Tata Institute of Fundamental Research (TIFR), Bengaluru) in Life Sciences, Prof. Ritabrata Munshi (Professor, School of Mathematics, TIFR, Mumbai, and Statistics and Mathematics Unit, ISI, Kolkata) in Mathematical Sciences, Prof. Yamuna Krishnan (Professor, Department of Chemistry, University of Chicago, US) in Physical Sciences, and Prof. Lawrence Liang (Professor, School of Law, Governance and Citizenship, Ambedkar University, Delhi) in Social Sciences. The chief guest, Prof. Kip Thorne, Nobel laureate in Physics for 2017, along with the jury chairs and trustees, gave away the prizes to the winners at a ceremony in Bengaluru on January 10, 2018.
For more details on the ISF’s activities, visit www.infosys-science-foundation.com.
Sustainability initiativesOur sustainability charter is driven by our core values and ethics. Our sustainability actions encompass economic, social and environmental dimensions. Through Campus Connect, we share some of our best practices with engineering colleges, thus aligning the needs of institutions, faculty and students with those of the IT industry. SPARK and Rural Reach programs focus on raising aspirations and building awareness about computers and the power of IT among students in rural India. For more information about our industry-academia partnerships, visit our website, https://www.infosys.com/sustainability.
We have been persistent in our efforts to ensure reuse, recycling and responsible disposal of waste to minimize the amount of waste going to landfills. In our efforts to achieve our goal of sourcing 100% of our electricity requirements from renewables, we have continued to invest in solar energy across our campuses. In fiscal 2018, we installed a solar farm of 30MW capacity in Karnataka. Details of our environmental sustainability actions are available in Annexure 8 to the Board’s report.
Dow Jones Sustainability Indices : Infosys has been inducted into the prestigious Dow Jones Sustainability Indices (DJSI) on September 7, 2017 and is now part of the DJSI World and DJSI Emerging Markets Indices. This recognition is testimony to Infosys’ corporate sustainability leadership in the IT services and Internet Software and Services industry.
Conservation of energy, research and development, technology absorption, foreign exchange earnings and outgoThe particulars, as prescribed under sub-section (3)(m) of Section 134 of the Companies Act, 2013, read with the Companies (Accounts) Rules, 2014, are enclosed as Annexure 8 to the Board’s report.
Business Responsibility Report (BRR)The Listing Regulations mandate the inclusion of the BRR as part of the Annual Report for top 100 listed entities based on market capitalization. In compliance with the Listing Regulations, we have integrated BRR disclosures into our Annual Report.
We also publish the Sustainability Report annually. This is a comprehensive report that covers all aspects of our sustainability activities. The report is independently assured by DNV GL, in accordance with the Global Reporting Initiative’s framework. For more details, visit https://www.infosys.com/sustainability/.
Green initiativesElectronic copies of the Annual Report 2017-18 and the Notice of the 37th Annual General Meeting are sent to all members whose email addresses are registered with the Company / depository participant(s). For members who have not registered their email addresses, physical copies are sent in the permitted mode.

Board’s report | 51 Infosys Annual Report 2017-18
AcknowledgmentsWe thank our customers, vendors, investors, bankers, employee volunteers and trustees of Infosys Foundation, Infosys Foundation USA and Infosys Science Foundation for their continued support during the year. We place on record our appreciation of the contribution made by our employees at all levels. Our consistent growth was made possible by their hard work, solidarity, cooperation and support.
We thank the governments of various countries where we have our operations. We thank the Government of India, particularly the Ministry of Labour and Employment, the Ministry of Communications, the Ministry of Electronics and Information Technology, the Ministry of Commerce and Industry, the Ministry of Finance, the Ministry of Corporate Affairs, the Central Board of Direct Taxes, the Central Board of Indirect Taxes and Customs, the Reserve Bank of India, Securities and Exchange Board of India (SEBI), various departments under the state governments and union territories, the Software Technology Parks (STPs) / Special Economic Zones (SEZs) – Bengaluru, Bhubaneswar, Chandigarh, Chennai, Gurugram, Hubballi, Hyderabad, Indore, Jaipur, Kolkata, Mangaluru, Mysuru, Nagpur, Noida, Pune, Mumbai, Kochi and Thiruvananthapuram – and other government agencies for their support, and look forward to their continued support in the future. We also thank the US federal government, the Securities and Exchange Commission, the Internal Revenue Service, and various state governments, especially those of Indiana, Rhode Island, Connecticut, Texas and North Carolina.
for and on behalf of the Board of Directors
Bengaluru April 13, 2018
Nandan M. NilekaniChairman
Salil ParekhChief Executive Officer and Managing Director

52 | Annexures to the B
oard’s reportInfosys A
nnual Report 2017-18
Annexures to the Board’s report
Annexure 1 – Statement containing the salient features of the financial statements of subsidiaries / associate companies[Pursuant to first proviso to sub-section (3) of Section 129 of the Companies Act, 2013, read with Rule 5 of the Companies (Accounts) Rules, 2014 – AOC-1]
List of subsidiariesin ` crore, except % of shareholding and exchange rate
Sl. No.
Name of the subsidiary
Financial period ended
Date of acquisition
Exchange rate / Reporting currency
Share capital
Reserves and surplus
Total assets
Total liabilities (excluding share
capital and reserves and surplus)
Investments (1) Turnover (includes
inter-company transactions)
(1) Profit / (Loss) before
taxation
(1) Provision for taxation
(1) Profit / (Loss) after
taxation
% of shareholding
1 Infosys BPM Limited(formerly Infosys BPO Limited) Mar 31, 2018 NA INR 34 3,407
3,980 539 857 3,061 642 173 469 99.98
2 EdgeVerve Systems Limited Mar 31, 2018 NA INR 1,312 (2,709) 880 2,277 43 2,439 454 142 312 100.00
3 Infosys Public Services, Inc. Mar 31, 2018 NA 1 USD = ` 65.18 98 365 650 187 – 952 127 54 73 100.00
4 Infosys Technologies (China) Co. Limited Dec 31, 2017 NA 1 RMB = ` 9.82 331 (181) 438 288 – 919 (76) – (76) 100.00
5 Infosys McCamish Systems LLC(4) Mar 31, 2018
Dec 4, 2009 1 USD = ` 65.18 175 (6) 627 458 – 820 67 25 42 99.98
6 Infy Consulting Company Limited(2) Dec 31, 2017 NA 1 GBP = ` 86.28 – 22 221 199 – 791 20 4 16 100.00
7 Infosys Consulting GmbH(2) Dec 31, 2017 NA 1 EUR = ` 76.53 1 (20) 219 238 – 654 (6) (2) (4) 100.00
8 Infosys Poland Sp. z o.o.(4) Mar 31, 2018
Oct 1, 2007 1 PLN = ` 19.15 4 576 703 123 71 519 84 16 68 99.98
9 Infosys Consulting AG(2) Dec 31, 2017 NA 1 CHF = ` 65.50 1 71 183 111 – 450 17 5 12 100.00
10 Infosys Technologies (Shanghai) Company Limited Dec 31, 2017 NA 1 RMB = ` 9.82 895 (95)
1,097 297 – 278 (96) – (96) 100.00
11 Infosys Tecnologia do Brasil Ltda. Dec 31, 2017 NA 1 BRL = ` 19.32 146 (26) 204 84 – 270 32 9 23 100.00
12 Infosys Technologies S. de R. L. de C. V. Dec 31, 2017 NA 1 MXN = ` 3.25 65 81 185 39 – 261 57 17 40 100.00
13 Panaya Ltd.(6) Dec 31, 2017 NA 1 USD = ` 63.88 256 (651) 235 630 – 235 (144) 14 (158) 100.00 14 Kallidus Inc.
Dec 31, 2017Jun 2, 2015 1 USD = ` 63.88 15 66 175 94 – 193 (92) (26) (66) 100.00
15 Infosys Management Consulting Pty. Limited(2) Dec 31, 2017 NA 1 AUD = ` 49.95 17 (7) 30 20 – 138 9 (4) 13 100.00
16 Infosys Consulting Ltda.(3) Dec 31, 2017 NA 1 BRL = ` 19.32 137 (194) 81 138 – 133 (71) 1 (72) 99.99

Annexures to the B
oard’s report | 53 Infosys A
nnual Report 2017-18
Sl. No.
Name of the subsidiary
Financial period ended
Date of acquisition
Exchange rate / Reporting currency
Share capital
Reserves and surplus
Total assets
Total liabilities (excluding share
capital and reserves and surplus)
Investments (1) Turnover (includes
inter-company transactions)
(1) Profit / (Loss) before
taxation
(1) Provision for taxation
(1) Profit / (Loss) after
taxation
% of shareholding
17 Lodestone Management Consultants Co., Ltd.(2) Dec 31, 2017 NA 1 RMB = ` 9.82 43 (153) 42 152 – 117 (68) (1) (67) 100.00
18 Infosys Consulting Sp. Z o.o.(2) Dec 31, 2017 NA 1 PLN = ` 18.29 2 7 40 31 – 108 11 3 8 100.00
19 Panaya Inc.Dec 31, 2017
Mar 5, 2015 1 USD = ` 63.88 – 402 553 151 – 105 4 2 2 100.00
20 Infosys Technologies (Sweden) AB Dec 31, 2017 NA 1 SEK = ` 7.78 2 23 42 17 – 100 4 – 4 100.00
21 Portland Group Pty. Limited(4) Mar 31, 2018
Jan 4, 2012 1 AUD = ` 50.05 18 91 128 19 – 89 3 1 2 99.98
22 Infosys (Czech Republic) Limited s.r.o(4) Mar 31, 2018 NA 1 CZK = ` 3.16 3 72 96 21 21 78 1 – 1 99.98
23 Infosys Consulting Pte Ltd.(9) Dec 31, 2017 NA 1 SGD = ` 47.81 52 (52) 22 22 – 68 1 – 1 100.00
24 Infy Consulting B.V.(2) Dec 31, 2017 NA 1 EUR = ` 76.53 1 29 48 18 – 65 2 (1) 3 100.00 25 Skava Systems
Pvt. Ltd. Mar 31, 2018Jun 2, 2015 INR – 38 44 6 5 57 10 (5) 15 100.00
26 Brilliant Basics Limited(7) Mar 31, 2018 NA 1 GBP = ` 92.28 – (5) 17 22 – 54 (5) – (5) 100.00
27 Panaya GmbH(6) Dec 31, 2017 NA 1 EUR = ` 76.53 – (2) 62 64 – 30 1 – 1 100.00 28 Infosys Consulting
SAS(2) Dec 31, 2017 NA 1 EUR = ` 76.53 29 (23) 13 7 – 26 6 (2) 8 100.00 29 Infosys Consulting
S.R.L.(2) Dec 31, 2017 NA 1 ARS = ` 3.34 7 (7) 11 11 – 23 1 2 (1) 100.00 30 Infosys Consulting
(Belgium) NV(3) Dec 31, 2017 NA 1 EUR = ` 76.53 3 (27) 10 34 – 22 1 (1) 2 99.90 31 S.C. Infosys
Consulting S.R.L.(2) Dec 31, 2017 NA 1 RON = ` 16.42 1 7 10 2 – 18 2 – 2 100.00 32 Lodestone
Management Consultants Portugal, Unipessoal, Lda(2) Dec 31, 2017 NA 1 EUR = ` 76.53 11 (8) 10 7 – 11 1 – 1 100.00
33 Lodestone Management Consultants Inc.(2)(5) Dec 31, 2017 NA 1 USD = ` 63.88 1 24 25 – – 9 2 3 (1) 100.00
34 Panaya Japan Co. Ltd.(5)(6) Dec 31, 2017 NA 1 JPY = ` 0.5677 – (1) 15 16 – 4 – – – 100.00
35 Infosys Consulting s.r.o.(2) Dec 31, 2017 NA 1 CZK = ` 2.99 – 5 6 1 – 4 – – – 100.00
36 Brilliant Basics (MENA) DMCC(7) Dec 31, 2017 NA 1 AED = ` 17.39 – – 1 1 – 2 6 – 6 100.00
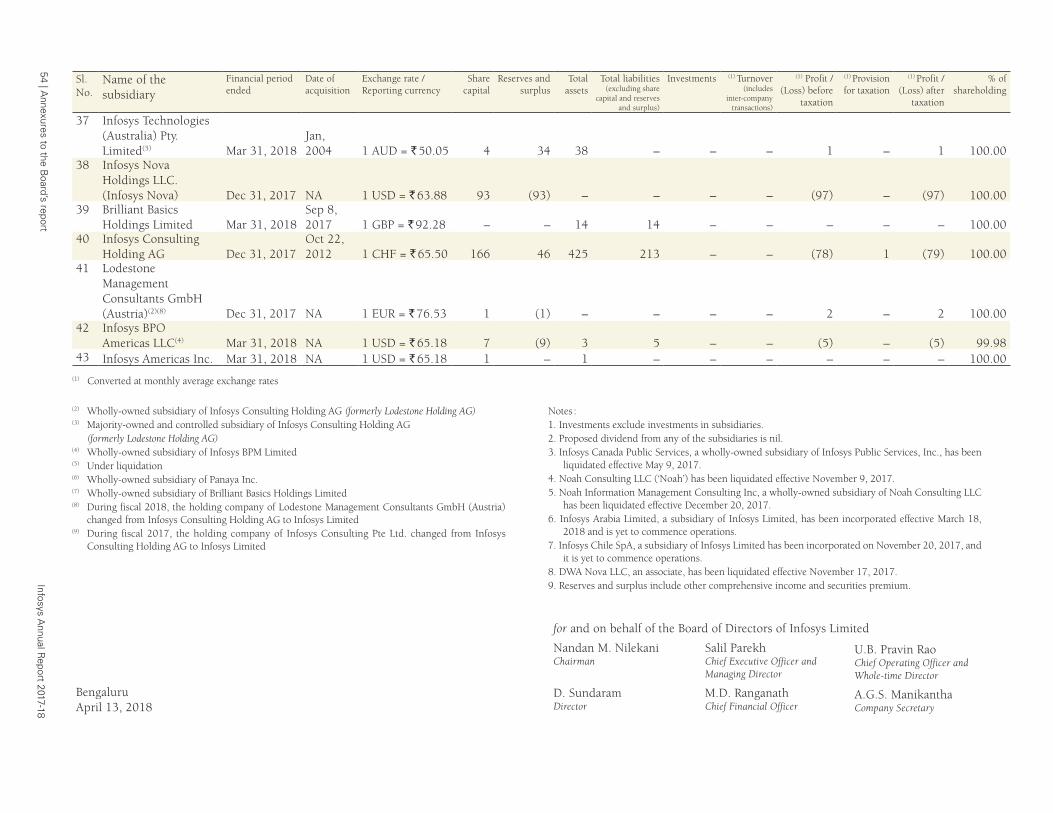
54 | Annexures to the B
oard’s reportInfosys A
nnual Report 2017-18
(2) Wholly-owned subsidiary of Infosys Consulting Holding AG (formerly Lodestone Holding AG)(3) Majority-owned and controlled subsidiary of Infosys Consulting Holding AG (formerly Lodestone Holding AG)(4) Wholly-owned subsidiary of Infosys BPM Limited(5) Under liquidation(6) Wholly-owned subsidiary of Panaya Inc.(7) Wholly-owned subsidiary of Brilliant Basics Holdings Limited(8) During fiscal 2018, the holding company of Lodestone Management Consultants GmbH (Austria)
changed from Infosys Consulting Holding AG to Infosys Limited(9) During fiscal 2017, the holding company of Infosys Consulting Pte Ltd. changed from Infosys
Consulting Holding AG to Infosys Limited
for and on behalf of the Board of Directors of Infosys Limited
Nandan M. NilekaniChairman
Salil ParekhChief Executive Officer and Managing Director
U.B. Pravin RaoChief Operating Officer and Whole-time Director
BengaluruApril 13, 2018
D. SundaramDirector
M.D. RanganathChief Financial Officer
A.G.S. ManikanthaCompany Secretary
Notes :1. Investments exclude investments in subsidiaries.2. Proposed dividend from any of the subsidiaries is nil.3. Infosys Canada Public Services, a wholly-owned subsidiary of Infosys Public Services, Inc., has been
liquidated effective May 9, 2017.4. Noah Consulting LLC (‘Noah’) has been liquidated effective November 9, 2017.5. Noah Information Management Consulting Inc, a wholly-owned subsidiary of Noah Consulting LLC
has been liquidated effective December 20, 2017.6. Infosys Arabia Limited, a subsidiary of Infosys Limited, has been incorporated effective March 18,
2018 and is yet to commence operations.7. Infosys Chile SpA, a subsidiary of Infosys Limited has been incorporated on November 20, 2017, and
it is yet to commence operations.8. DWA Nova LLC, an associate, has been liquidated effective November 17, 2017.9. Reserves and surplus include other comprehensive income and securities premium.
Sl. No.
Name of the subsidiary
Financial period ended
Date of acquisition
Exchange rate / Reporting currency
Share capital
Reserves and surplus
Total assets
Total liabilities (excluding share
capital and reserves and surplus)
Investments (1) Turnover (includes
inter-company transactions)
(1) Profit / (Loss) before
taxation
(1) Provision for taxation
(1) Profit / (Loss) after
taxation
% of shareholding
37 Infosys Technologies (Australia) Pty. Limited(5) Mar 31, 2018
Jan, 2004 1 AUD = ` 50.05 4 34 38 – – – 1 – 1 100.00
38 Infosys Nova Holdings LLC. (Infosys Nova) Dec 31, 2017 NA 1 USD = ` 63.88 93 (93) – – – – (97) – (97) 100.00
39 Brilliant Basics Holdings Limited Mar 31, 2018
Sep 8, 2017 1 GBP = ` 92.28 – – 14 14 – – – – – 100.00
40 Infosys Consulting Holding AG Dec 31, 2017
Oct 22, 2012 1 CHF = ` 65.50 166 46 425 213 – – (78) 1 (79) 100.00
41 Lodestone Management Consultants GmbH (Austria)(2)(8) Dec 31, 2017 NA 1 EUR = ` 76.53 1 (1) – – – – 2 – 2 100.00
42 Infosys BPO Americas LLC(4) Mar 31, 2018 NA 1 USD = ` 65.18 7 (9) 3 5 – – (5) – (5) 99.98
43 Infosys Americas Inc. Mar 31, 2018 NA 1 USD = ` 65.18 1 – 1 – – – – – – 100.00
(1) Converted at monthly average exchange rates

Annexures to the Board’s report | 55 Infosys Annual Report 2017-18
Annexure 2 – Particulars of contracts / arrangements made with related parties[Pursuant to Clause (h) of sub-section (3) of Section 134 of the Companies Act, 2013, and Rule 8(2) of the Companies (Accounts) Rules, 2014 – AOC-2]
This Form pertains to the disclosure of particulars of contracts / arrangements entered into by the Company with related parties referred to in sub-section (1) of Section 188 of the Companies Act, 2013, including certain arm’s length transactions under third proviso thereto.
As per Section 188 of the Companies Act 2013, whenever a company avails or renders any service directly or through agents amounting to 10% or more of the turnover of the company or ̀ 50 crore, whichever is lower, prior approval of the shareholders is required. However, shareholders’ approval for such transactions need not be sought if the transactions are between the holding company and its wholly-owned subsidiaries whose accounts are consolidated with the holding company and placed for shareholders’ approval.
Details of contracts or arrangements or transactions not at arm’s length basisThere were no contracts or arrangements or transactions entered into during the year ended March 31, 2018, which were not at arm’s length basis.
Details of material contracts or arrangement or transactions at arm’s length basisThe details of material contracts or arrangement or transactions at arm’s length basis for the year ended March 31, 2018 are as follows :
Name of related party Nature of relationship
Duration of contract
Salient terms(1) Amount (in ` crore)
Nature of contractInvestment in equity instruments
Infosys Technologies (China) Co. Limited Subsidiary Not applicable Not applicable 97Infosys Technologies (Shanghai) Company Limited
Subsidiary Not applicableNot applicable 74
Panaya Inc. Subsidiary Not applicable Not applicable 38Brilliant Basics Holdings Limited Subsidiary Not applicable Not applicable 29
238Purchase of services
Infy Consulting Company Limited Subsidiary Nov 1, 2012 – ongoing Based on transfer pricing guidelines 729
Infosys BPM Limited (formerly Infosys BPO Limited)
Subsidiary Apr 1, 2012 – ongoing Based on transfer pricing guidelines 502
Infosys Management Consulting Pty. Limited Subsidiary Jan 1, 2013 – ongoing Based on transfer pricing guidelines 99
Noah Consulting LLC(2) Subsidiary Not Applicable Based on transfer pricing guidelines 91
Infosys Technologies (China) Co. Limited Subsidiary Apr 1, 2011 – ongoing Based on transfer pricing guidelines 88
Panaya Ltd. Subsidiary Apr 1, 2015 – ongoing Based on transfer pricing guidelines 84
Infosys Technologies (Shanghai) Company Limited
Subsidiary May 1, 2017 – ongoing Based on transfer pricing guidelines 65
Infosys Technologies (Sweden) AB Subsidiary Apr 23, 2009 – ongoing Based on transfer pricing guidelines 56
Infosys Technologies S. de R. L. de C. V. Subsidiary Apr 1, 2011 – ongoing Based on transfer pricing guidelines 27
Infosys Public Services, Inc. Subsidiary Apr 1, 2014 – ongoing Based on transfer pricing guidelines 22
Infosys McCamish Systems LLC Subsidiary Apr 1, 2012 – ongoing Based on transfer pricing guidelines 3
1,766Purchase of shared services including facilities and personnel
Infosys BPM Limited (formerly Infosys BPO Limited)
Subsidiary Apr 1, 2014 – ongoing Based on transfer pricing guidelines 21
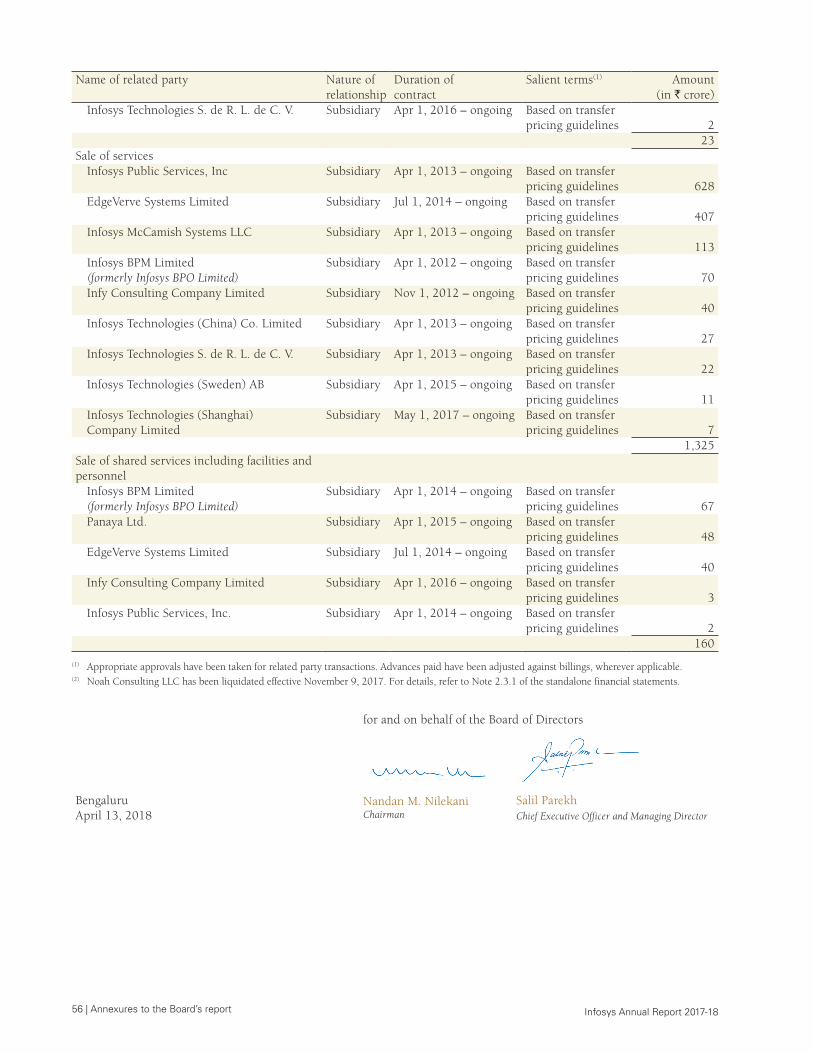
56 | Annexures to the Board’s report Infosys Annual Report 2017-18
Name of related party Nature of relationship
Duration of contract
Salient terms(1) Amount (in ` crore)
Infosys Technologies S. de R. L. de C. V. Subsidiary Apr 1, 2016 – ongoing Based on transfer pricing guidelines 2
23Sale of services
Infosys Public Services, Inc Subsidiary Apr 1, 2013 – ongoing Based on transfer pricing guidelines 628
EdgeVerve Systems Limited Subsidiary Jul 1, 2014 – ongoing Based on transfer pricing guidelines 407
Infosys McCamish Systems LLC Subsidiary Apr 1, 2013 – ongoing Based on transfer pricing guidelines 113
Infosys BPM Limited (formerly Infosys BPO Limited)
Subsidiary Apr 1, 2012 – ongoing Based on transfer pricing guidelines 70
Infy Consulting Company Limited Subsidiary Nov 1, 2012 – ongoing Based on transfer pricing guidelines 40
Infosys Technologies (China) Co. Limited Subsidiary Apr 1, 2013 – ongoing Based on transfer pricing guidelines 27
Infosys Technologies S. de R. L. de C. V. Subsidiary Apr 1, 2013 – ongoing Based on transfer pricing guidelines 22
Infosys Technologies (Sweden) AB Subsidiary Apr 1, 2015 – ongoing Based on transfer pricing guidelines 11
Infosys Technologies (Shanghai) Company Limited
Subsidiary May 1, 2017 – ongoing Based on transfer pricing guidelines 7
1,325Sale of shared services including facilities and personnel
Infosys BPM Limited (formerly Infosys BPO Limited)
Subsidiary Apr 1, 2014 – ongoing Based on transfer pricing guidelines 67
Panaya Ltd. Subsidiary Apr 1, 2015 – ongoing Based on transfer pricing guidelines 48
EdgeVerve Systems Limited Subsidiary Jul 1, 2014 – ongoing Based on transfer pricing guidelines 40
Infy Consulting Company Limited Subsidiary Apr 1, 2016 – ongoing Based on transfer pricing guidelines 3
Infosys Public Services, Inc. Subsidiary Apr 1, 2014 – ongoing Based on transfer pricing guidelines 2
160
(1) Appropriate approvals have been taken for related party transactions. Advances paid have been adjusted against billings, wherever applicable.(2) Noah Consulting LLC has been liquidated effective November 9, 2017. For details, refer to Note 2.3.1 of the standalone financial statements.
for and on behalf of the Board of Directors
Bengaluru April 13, 2018
Nandan M. NilekaniChairman
Salil ParekhChief Executive Officer and Managing Director

Annexures to the B
oard’s report | 57 Infosys A
nnual Report 2017-18
Annexure 3 – Particulars of employeesWe are a leading provider of consulting, technology, outsourcing and next-generation digital services. We enable clients in more than 45 countries to outperform their competition and stay ahead of the innovation curve. The remuneration and perquisites provided to our employees, including that of the Management, are on par with industry benchmarks. The nomination and remuneration committee continuously reviews the compensation of our CEO, COO and other KMP to align both the short-term and long-term business objectives of the Company and to link compensation with the achievement of goals.
The details of remuneration to KMP including CEO and COO in the tables, 3(a) and 3(b), are in compliance with Chapter XIII, Companies (Appointment and Remuneration of Managerial Personnel) Rules, 2014. In accordance with the requirements, tables 3(a) and 3(b) include the perquisite value of stock incentives at the time of their exercise and do not include the value of the stock incentives at the time of grant.
Information as per Rule 5(1) of Chapter XIII, Companies (Appointment and Remuneration of Managerial Personnel) Rules, 2014
3(a) Remuneration to whole-time directors (WTD)Name of the director Director
Identification Number (DIN)
Title Remuneration in fiscal 2018
(in ` crore)#
Remuneration in fiscal 2017
(in ` crore)#
% increase of remuneration in fiscal 2018 as compared to
fiscal 2017#
Ratio of remuneration to MRE
excluding WTDs#
Ratio of remuneration to MRE
including WTDs#
Salil Parekh(1)(2) 01876159 CEO & MD 3.98 NA NA 273 273U.B. Pravin Rao(3) 06782450 COO & WTD 8.22 (4)7.80 5 138 137Dr. Vishal Sikka(5)(8) 06897177 CEO & MD (6)12.92 (7)16.01 NA NA NA
Notes : The details in the above table are on accrual basis. For the purpose of comparison, remuneration for both fiscal 2018 and fiscal 2017 are given for the full year, except where specifically stated otherwise. Accordingly, the percentage increase and ratio of remuneration
are computed on an annualized basis wherever applicable. # Includes fixed pay, variable pay, retiral benefits and the perquisite value of stock incentives exercised during the period, determined in accordance with the provisions of the Income-tax Act, 1961. Accordingly,
the value of stock incentives granted during the period is not included. The number of stock incentives granted in fiscal 2018 is mentioned in the notes below. (1) Appointed as Chief Executive Officer and Managing Director effective January 2, 2018. The appointment is for a term of five years with effect from January 2, 2018 to January 1, 2023 and the remuneration is
approved by shareholders vide a postal ballot concluded on February 20, 2018. (2) Pursuant to the approval of the shareholders through a postal ballot on February 20, 2018, Salil Parekh is eligible to receive the following under the 2015 Plan, a) an annual grant of RSUs of fair value ` 3.25 crore, which will vest over time in three equal annual installments upon completion of each year of service from the respective grant date b) a one-time grant of RSUs of fair value ` 9.75 crore, which will vest over time in two equal annual installments upon completion of each year of service from the grant date and c) an annual grant of performance-based RSUs of fair value ̀ 13 crore, which will vest after completion of three years, the first of which concludes on March 31, 2021, subject to the achievement of
performance targets set by the Board or its committee. The Board, based on the recommendations of the nomination and remuneration committee, approved on February 27, 2018, the annual time-based grant for fiscal 2018 of 28,256 RSUs and a one-time,
time-based grant of 84,768 RSUs. The grants were made effective February 27, 2018. (3) Appointed as Interim Chief Executive Officer and Managing Director effective August 18, 2017. Subsequently, on January 2, 2018, re-designated as Chief Operating Officer and Whole-time Director. The salary
remains unchanged on the appointment and redesignation. (4) On March 31, 2017, the shareholders vide a postal ballot approved a revision in the salary of U.B. Pravin Rao, COO and Whole-time Director, effective November 1, 2016. Based on fiscal 2016 performance, the
nomination and remuneration committee, at its meeting held on October 14, 2016, recommended a grant of 27,250 RSUs and 43,000 ESOPs, amounting to ` 4 crore to U.B. Pravin Rao, under the 2015 Plan and the same was approved by the shareholders through a postal ballot on March 31, 2017. These RSUs and ESOPs were granted effective May 2, 2017.
(5) Resigned as Chief Executive Officer and Managing Director effective August 18, 2017 and as Executive Vice Chairman effective August 24, 2017 (6) Includes US$ 0.25 million (approximately `1.60 crore) and US$ 0.21 million (approximately `1.34 crore) as part of 90 days base pay in lieu of notice and variable pay, respectively, for fiscal 2018 on account of
resignation. Additionally, remuneration for fiscal 2018 includes ` 6.78 crore on account of exercise of 70,772 RSUs during fiscal 2018. (7) Includes US$ 0.82 million (approximately ̀ 5.33 crore) as variable pay for fiscal 2017 as approved by the nomination and remuneration committee on April 13, 2017. Additionally, includes ̀ 3.69 crore on account
of exercise of 34,062 RSUs during fiscal 2017.

58 | Annexures to the B
oard’s reportInfosys A
nnual Report 2017-18
(8) For fiscal 2017, 1,20,700 time-based RSUs amounting to US$ 2 million (approximately ` 13.42 crore) were granted on August 1, 2016. Additionally, based on fiscal 2017 performance evaluation, the Board, on the recommendations of the nomination and remuneration committee, approved on April 13, 2017, performance-based equity and stock options for fiscal 2017 comprising 1,32,483 RSUs amounting to US$ 1.9 million (approximately ` 12.91 crore) and 3,30,525 ESOPs amounting to US$ 0.96 million (approximately ` 6.46 crore). These RSUs and ESOPs were granted effective May 2, 2017. Further, the Board, based on the recommendations of the nomination and remuneration committee, approved on April 13, 2017 the annual time-based vesting grant for fiscal 2018 comprising 1,37,741 RSUs amounting to US$ 2 million (approximately ` 12.97 crore). These RSUs were granted effective May 2, 2017. Except for 70,772 RSUs which were exercised in fiscal 2018, all the other unvested outstanding RSUs and ESOPs were forfeited as on the date of separation.
3(b) Remuneration of other key managerial personnel (KMP)Name of the KMP Title Remuneration
in fiscal 2018 (in ` crore)#
Remuneration in fiscal 2017
(in ` crore)#
% increase of remuneration in fiscal 2018 as compared to
fiscal 2017#
Ratio of remuneration to MRE excluding
WTDs#*
Ratio of remuneration to MRE including
WTDs#*
No. of RSUs granted in fiscal
2018 (1)
No of ESOPs granted in fiscal
2018(1)
David D. Kennedy General Counsel and Chief Compliance Officer – (7) 7.75 NA NA NA – –
Gopi Krishnan Radhakrishnan(6) Acting General Counsel 0.16 1.16 NA NA NA – –Inderpreet Sawhney (4)(5)
Group General Counsel and Chief Compliance Officer 4.84 – NA 108 108 (4) 58,150 (4) 44,450
Krishnamurthy Shankar
Group Head – Human Resources and Infosys Leadership Institute 4.20 3.73 13 70 70 12,400 –
A.G.S. Manikantha Company Secretary 0.60 0.44 36 10 10 2,000 –Mohit Joshi President 10.31 6.79 52 172 172 66,850 –Ravi Kumar S. President and Deputy Chief
Operating Officer 9.54 7.03 36 160 160 66,850 –Rajesh K. Murthy(3) President 9.58 7.56 NA NA NA – –M.D. Ranganath Chief Financial Officer 7.98 4.75 68 133 133 66,850 –Sandeep Dadlani(2) President 1.34 7.13 NA NA NA – –
Notes : The details in the above table are on accrual basis. For the purpose of comparison, remuneration for both fiscal 2018 and fiscal 2017 are given for the full year, except where specifically stated otherwise. Accordingly, the percentage increase and ratio of remuneration
are computed on an annualized basis wherever applicable # Includes fixed pay, variable pay, retiral benefits and the perquisite value of stock incentives exercised during the period, determined in accordance with the provisions of the Income-tax Act, 1961.
Accordingly, the value of stock incentives granted during the period is not included. The number of stock incentives granted in fiscal 2018 is included in the table above. (1) All the grants (except for the grants made to Inderpreet Sawhney) have been made with an effective date of February 27, 2018 and these RSUs and stock options would vest generally over a period of four years. (2) Resigned effective July 14, 2017; hence, remuneration for fiscal 2018 is from April 1, 2017 to July 14, 2017. (3) Resigned effective January 31, 2018; hence, remuneration for fiscal 2018 is from April 1, 2017 to January 31, 2018. (4) Appointed as Group General Counsel and Chief Compliance Officer effective July 3, 2017 and was named as key managerial personnel under Ind AS 24, Related Party Disclosures effective July 14, 2017. The
nomination and remuneration committee, at its meeting on July 13, 2017, recommended a grant of 19,450 RSUs and 44,450 ESOPs effective August 1, 2017 under the 2015 Plan. These RSUs and ESOPs will vest over a period of four years from the date of grant. Additionally, the nomination and remuneration committee further recommended a one-time grant of 38,700 RSUs effective August 1, 2017. These RSUs will vest over a period of two years from the date of grant in the ratio 60:40.
(5) Includes a one-time joining bonus of US$ 25,000 (approximately ` 0.16 crore) (6) Appointed as Acting General Counsel effective January 1, 2017. He resigned effective June 24, 2017; hence, remuneration for fiscal 2018 is from April 1, 2017 to June 24, 2017. (7) Includes ` 6 crore payable under severance agreement to David D. Kennedy, who ceased to be the General Counsel and Chief Compliance Officer of the Company effective December 31, 2016.
The Median Remuneration of Employees (MRE) excluding whole-time directors (WTDs) was ` 5,97,810 and ` 5,65,585 in fiscal 2018 and fiscal 2017, respectively. The increase in MRE (excluding WTDs) in fiscal 2018, as compared to fiscal 2017, is 6%.
The MRE including WTDs was ` 5,97,854 and ` 5,65,586 in fiscal 2018 and fiscal 2017, respectively. The increase in MRE (including WTDs) in fiscal 2018, as compared to fiscal 2017, is 6%.

Annexures to the B
oard’s report | 59 Infosys A
nnual Report 2017-18
3(c) Remuneration to non-executive / independent directorsName of the director Director Identification
Number (DIN)Remuneration in fiscal 2018
(in ` crore)Remuneration in fiscal 2017
(in ` crore)% increase of remuneration in fiscal
2018 over fiscal 2017 (5) Nandan M. Nilekani(1) 00041245 – – NARavi Venkatesan 00621398 1.43 1.04 38Kiran Mazumdar-Shaw 00347229 1.00 0.89 12Roopa Kudva 00001766 0.97 1.00 (3)Dr. Punita Kumar-Sinha 05229262 1.33 1.22 9D.N. Prahlad(2) 00504146 0.95 0.36 22D. Sundaram(3) 00016304 0.70 – NAR. Seshasayee(4) 00047985 0.84 1.95 NAProf. Jeffrey S. Lehman(4) 00092981 0.89 1.37 NAProf. John W. Etchemendy(4) 07029756 0.60 1.10 NA
Notes : The details in the above table are on accrual basis.
(1) Appointed as Chairman effective August 24, 2017. He voluntarily chose not to receive any remuneration for his services rendered to the Company.(2) For the period October 14, 2016 to March 31, 2017, for fiscal 2017 (4) Resigned effective August 24, 2017(3) Appointed effective July 14, 2017 (5) Based on annualized commission
3(d) Information as per Rule 5(2) of Chapter XIII, the Companies (Appointment and Remuneration of Managerial Personnel) Rules, 2014
Top 10 employees in terms of remuneration drawn during the yearEmployee name Designation Educational
qualificationExperience (in years)
Remuneration in fiscal 2018 (in `)#
No. of RSUs granted in
fiscal 2018
No. of ESOPs granted in
fiscal 2018
Previous employment and designation
Dr. Vishal Sikka(1) CEO & MD B.S., Ph.D. on CS
22 12,92,05,500 (1) 2,70,224 (1) 3,30,525 SAP SE, Member of the Executive Board of SAP SE
Mohit Joshi President BA, MBA 21 10,30,71,671 66,850 – ABN AMRO Bank, ManagerRajesh K. Murthy(2) President BE 26 9,58,03,800 – – Viswakarma Institute of Technology,
TeachingRavi Kumar S. President and Deputy Chief
Operating OfficerBE, PGD 24 9,54,27,589 66,850 – Sapient Corporation, Director
U.B. Pravin Rao COO & WTD BE 33 8,22,28,872 27,250 43,000 IISC, TraineeM.D. Ranganath Chief Financial Officer BE, PGDM,
M.Tech29 7,97,80,202 66,850 – Surya Software Systems Private
Limited, DirectorScott Sorokin Head, Global Services –
Digital ExperienceB.Sc 32 6,45,65,459 17,900 – Razorfish Global, Chief Strategy
OfficerSangita Singh Industry Head – Healthcare
& Life SciencesBE 26 5,58,62,057 16,950 – Wipro, Chief Executive Healthcare
Life Sciences
Eric Laffargue Country Head – France and Mauritius
MBM, PGD 29 5,13,25,920 – – Accenture, Executive Partner
Inderpreet Sawhney Group General Counsel and Chief Compliance Officer
BA LLB, LLM 27 4,83,93,451 58,150 44,450 Wipro, Senior Vice President and General Counsel
Notes : The details in the above table are on accrual basis for better comparability with the KMP remuneration disclosures included in other sections of this Annual Report.

60 | Annexures to the B
oard’s reportInfosys A
nnual Report 2017-18
For employees based overseas, the average exchange rates have been used for conversion to INR. # Includes fixed pay, variable pay, retiral benefits and the perquisite value of stock incentives exercised during the period, determined in accordance with the provisions of the Income-tax Act, 1961. Accordingly,
the value of stock incentives granted during the period is not included. The number of stock incentives granted in fiscal 2018 is included in the table above. (1) Resigned as Chief Executive Officer and Managing Director effective August 18, 2017 and as Executive Vice Chairman effective August 24, 2017, and all the unvested outstanding RSUs and ESOPs were forfeited
as on the date of separation. (2) Since resigned and all the unvested outstanding RSUs and ESOPs were forfeited as on the date of separation.
3(e)(i) Employees drawing a remuneration of ` 1.02 crore or above per annum and posted in IndiaEmployee name Designation Educational
qualificationAge Experience
(in years)Date of joining Gross
remuneration paid (`)#
Previous employment and designation
Balakrishna D.R. SVP & Service Offering Head, ADM BE 46 24 Feb 7, 1994 1,25,52,089 HCL-HP, Customer Engineer – Trainee
Binod Rangadore Hampapur
EVP & Global Head – Talent & Technology Operations
BE 55 32 Jul 1, 2013 3,95,83,255 Infosys Limited, SVP – Corporate Relations
Charles Henry Hawkes SVP & Head – Facilities B.Sc, PGCBM 58 33 Nov 15, 1996 1,29,93,747 Trans Oceanic Travel, ManagerDeepak Bhalla SVP & Global Head - Business
Finance and Operations PlanningB.Com, ACA 44 22 Jul 19, 2016 1,27,29,825 Infosys BPO, Chief Financial Officer
Deepak Padaki EVP & Group Head – Corporate Strategy and Chief Risk Officer
BE 47 26 Aug 10, 1992 1,81,31,768 –
Dheeshjith V.G.(1) SVP & Chief Information Officer B.Sc, ME 54 31 Sept 14, 1987 2,07,26,214 –Dinesh R. SVP & Head Global Services, EAS BE 49 28 Oct 1, 1990 2,37,44,365 –Gopikrishnan Konnanath SVP & Service Offering Head, EAS BE 47 24 Nov 7, 1994 1,11,76,460 BPL Systems & Projects Limited,
Trainee EngineerIndranil Mukherjee SVP & Service Offering Head, EAS AMIETE 47 24 Dec 4, 1995 1,04,75,406 Chipsoft Technologies, Customer
Support EngineerJayesh Sanghrajka EVP & Deputy Chief Financial
OfficerB.Com, CA, ICWA
44 20 Dec 24, 2012 1,85,81,873 Mu Sigma, VP – Finance
Koushik R.N. EVP & Group Head – Procurement & Global Immigration
B.Sc 49 28 May 2, 1991 1,48,25,572 Frazer Techno Circuits Limited, Marketing Executive
Muthuvel Gajapathi VP & Delivery Head, DNA B.Sc, MCA 49 27 Aug 27, 1992 1,11,30,495 PSI Bull Limited, Systems ExecutiveNabarun Roy SVP & Group Head – Quality B.Tech 46 24 Aug 29, 1994 1,11,83,393 –Narsimha Rao Mannepalli EVP & Head Global Services,
IVSU, CISBE, PGDBM 50 28 Jan 29, 2001 1,98,53,706 Ramco Systems, Project Director –
e-Commerce SolutionsRaghupathi N. Cavale SVP & Strategic Business Practice
Head, INDIABE, MS 56 33 Dec 13, 1999 1,15,82,861 PricewaterhouseCoopers Limited,
Principal ConsultantRajeev Ranjan SVP & Service Offering Head, ADM B.Tech, MBA 45 22 Aug 16, 1999 1,10,18,133 Nexgen Information Solutions,
Associate ConsultantRamadas Kamath U. EVP & Head – Administration,
Facilities, Infrastructure & Security and Sustainability
BBM, FCA 57 33 Jul 1, 1994 3,57,63,249 Manipal Printers and Publishers Limited, Accountant
Renganathan V.R. VP & Delivery Head, INDIA BE 48 28 Jun 18, 1990 1,08,40,646 –
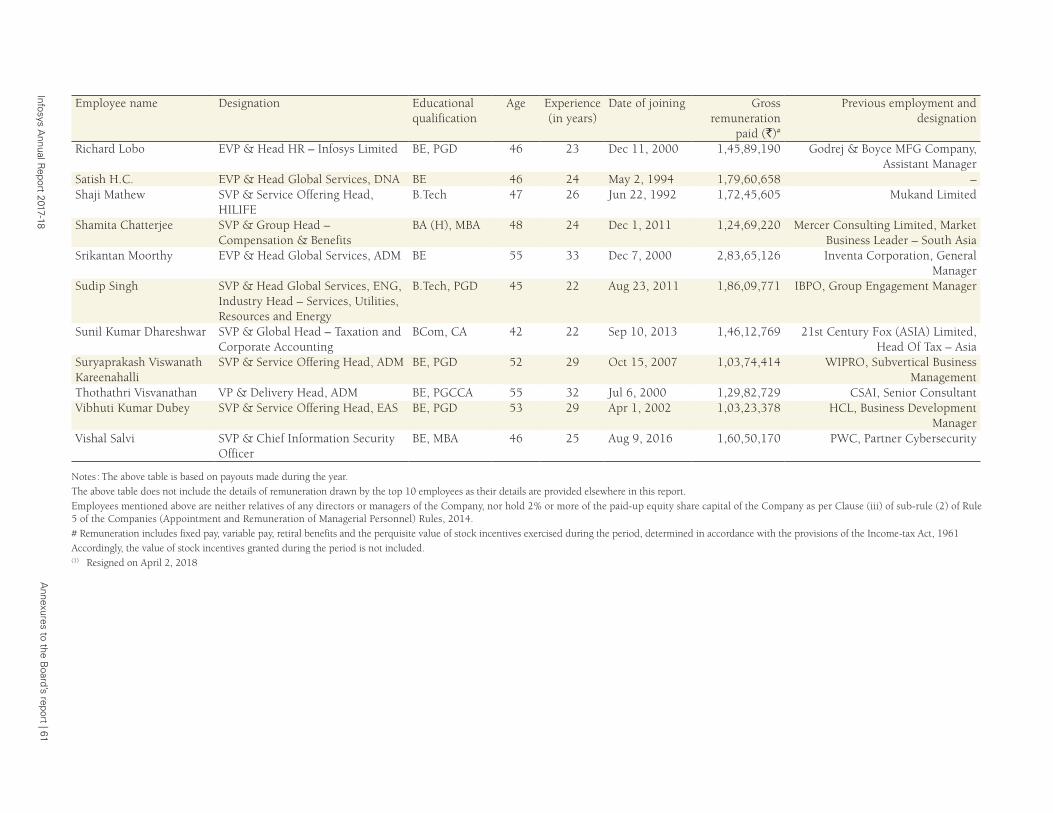
Annexures to the B
oard’s report | 61 Infosys A
nnual Report 2017-18
Employee name Designation Educational qualification
Age Experience (in years)
Date of joining Gross remuneration
paid (`)#
Previous employment and designation
Richard Lobo EVP & Head HR – Infosys Limited BE, PGD 46 23 Dec 11, 2000 1,45,89,190 Godrej & Boyce MFG Company, Assistant Manager
Satish H.C. EVP & Head Global Services, DNA BE 46 24 May 2, 1994 1,79,60,658 –Shaji Mathew SVP & Service Offering Head,
HILIFEB.Tech 47 26 Jun 22, 1992 1,72,45,605 Mukand Limited
Shamita Chatterjee SVP & Group Head – Compensation & Benefits
BA (H), MBA 48 24 Dec 1, 2011 1,24,69,220 Mercer Consulting Limited, Market Business Leader – South Asia
Srikantan Moorthy EVP & Head Global Services, ADM BE 55 33 Dec 7, 2000 2,83,65,126 Inventa Corporation, General Manager
Sudip Singh SVP & Head Global Services, ENG, Industry Head – Services, Utilities, Resources and Energy
B.Tech, PGD 45 22 Aug 23, 2011 1,86,09,771 IBPO, Group Engagement Manager
Sunil Kumar Dhareshwar SVP & Global Head – Taxation and Corporate Accounting
BCom, CA 42 22 Sep 10, 2013 1,46,12,769 21st Century Fox (ASIA) Limited, Head Of Tax – Asia
Suryaprakash Viswanath Kareenahalli
SVP & Service Offering Head, ADM BE, PGD 52 29 Oct 15, 2007 1,03,74,414 WIPRO, Subvertical Business Management
Thothathri Visvanathan VP & Delivery Head, ADM BE, PGCCA 55 32 Jul 6, 2000 1,29,82,729 CSAI, Senior ConsultantVibhuti Kumar Dubey SVP & Service Offering Head, EAS BE, PGD 53 29 Apr 1, 2002 1,03,23,378 HCL, Business Development
ManagerVishal Salvi SVP & Chief Information Security
OfficerBE, MBA 46 25 Aug 9, 2016 1,60,50,170 PWC, Partner Cybersecurity
Notes : The above table is based on payouts made during the year.The above table does not include the details of remuneration drawn by the top 10 employees as their details are provided elsewhere in this report. Employees mentioned above are neither relatives of any directors or managers of the Company, nor hold 2% or more of the paid-up equity share capital of the Company as per Clause (iii) of sub-rule (2) of Rule 5 of the Companies (Appointment and Remuneration of Managerial Personnel) Rules, 2014.# Remuneration includes fixed pay, variable pay, retiral benefits and the perquisite value of stock incentives exercised during the period, determined in accordance with the provisions of the Income-tax Act, 1961Accordingly, the value of stock incentives granted during the period is not included.(1) Resigned on April 2, 2018

62 | Annexures to the B
oard’s reportInfosys A
nnual Report 2017-18
3(e)(ii) Employed for part of the year with an average salary above ` 8.5 lakh per month posted in IndiaEmployee name Designation Educational
qualificationAge Experience
(in years)Date of joining
Date of leaving
Gross remuneration
paid (`)#
Previous employment and designation
Jitendra Sangharajka D. VP & Senior Delivery Manager, InfosysIT
BE, DFM 50 28 Sept 1, 1999 Apr 21, 2017 16,80,939 L&T Limited, Executive
Sai Kumar Shamanna VP & Head Human Resource Development – Units
BE, MBA 48 25 Aug 21, 2000 Apr 4, 2017 11,09,619 DENSO Haryana Private Limited., Manager-
Planning and ProcurementSaju Sankaran Kutty VP & Delivery Head, CIS B.Tech 44 20 Jul 28, 2003 Apr 28, 2017 12,14,450 Digital Global Soft, Senior
Systems EngineerSiva Kumar Srinivasa Venkata Nandiwada
VP & Delivery Head, ADM BSC, PGD, MSC
45 19 Jan 2, 2001 Apr 27, 2017 13,66,847 I.T.Solutions, Project Leader
Yogesh Goel VP & Group Head – Ethics and Compliance, Legal
BCOM (H), ACS
45 20 Jan 4, 2018 NA 30,33,846 SAP India Pvt Limited, Director LCIO
Notes : The above table is based on payouts made during the year. # Remuneration includes fixed pay, variable pay, retiral benefits and the perquisite value of stock incentives exercised during the period, determined in accordance with the provisions of the Income-tax
Act, 1961. Accordingly, the value of stock incentives granted during the period is not included.
LegendDesignations at InfosysEVP Executive Vice PresidentSVP Senior Vice PresidentVP Vice President
Units at InfosysADM Application Development and MaintenanceCIS Cloud and Infrastructure ServicesDNA Data and AnalyticsEAS Enterprise Application Package ServicesENG Engineering ServicesHILIFE Healthcare, Insurance and Life SciencesINDIA India UnitInfosysIT Infosys IT - Information Systems and Computers and
Communication DivisionIVSU Independent Validation Solutions

Annexures to the Board’s report | 63 Infosys Annual Report 2017-18
Annexure 4 – Independent Auditors’ certificate on corporate governance
To
The Members of Infosys Limited
1. We, Deloitte Haskins & Sells LLP, Chartered Accountants, the Statutory Auditors of Infosys Limited (‘the Company’), have examined the compliance of conditions of Corporate Governance by the Company, for the year ended on 31 March 2018, as stipulated in regulations 17 to 27 and clauses (b) to (i) of regulation 46(2) and para C and D of Schedule V of the SEBI (Listing Obligations and Disclosure Requirements) Regulations, 2015 (‘SEBI Listing Regulations’).
Managements’ Responsibility 2. The compliance of conditions of Corporate Governance is the responsibility of the Management. This responsibility
includes the design, implementation and maintenance of internal control and procedures to ensure the compliance with the conditions of the Corporate Governance stipulated in the SEBI Listing Regulations.
Auditor’s Responsibility 3. Our responsibility is limited to examining the procedures and implementation thereof, adopted by the Company for
ensuring compliance with the conditions of the Corporate Governance. It is neither an audit nor an expression of opinion on the financial statements of the Company.
4. We have examined the books of account and other relevant records and documents maintained by the Company for the purposes of providing reasonable assurance on the compliance with Corporate Governance requirements by the Company.
5. We have carried out an examination of the relevant records of the Company in accordance with the Guidance Note on Certification of Corporate Governance issued by the Institute of the Chartered Accountants of India (the ICAI), the Standards on Auditing specified under Section 143(10) of the Companies Act 2013, in so far as applicable for the purpose of this certificate and as per the Guidance Note on Reports or Certificates for Special Purposes issued by the ICAI which requires that we comply with the ethical requirements of the Code of Ethics issued by the ICAI.
6. We have complied with the relevant applicable requirements of the Standard on Quality Control (SQC) 1, Quality Control for Firms that Perform Audits and Reviews of Historical Financial Information, and Other Assurance and Related Services Engagements.
Opinion 7. Based on our examination of the relevant records and according to the information and explanations provided to us and the
representations provided by the Management, we certify that the Company has complied with the conditions of Corporate Governance as stipulated in regulations 17 to 27 and clauses (b) to (i) of regulation 46(2) and para C and D of Schedule V of the SEBI Listing Regulations during the year ended March 31, 2018.
8. We state that such compliance is neither an assurance as to the future viability of the Company nor the efficiency or effectiveness with which the Management has conducted the affairs of the Company.
For DELOITTE HASKINS & SELLS LLPChartered Accountants
Firm's registration number : 117366W/W-100018
BengaluruMay 11, 2018
Sd/-
P. R. Ramesh Partner
Membership number : 70928

64 | Annexures to the Board’s report Infosys Annual Report 2017-18
Annexure 5 – Secretarial audit report for the financial year ended March 31, 2018[Pursuant to Section 204 (1) of the Companies Act, 2013 and Rule No. 9 of the Companies (Appointment and Remuneration of Managerial Personnel) Rules, 2014]
To,The Members,Infosys Limited,Electronics City, Hosur RoadBengaluru 560100Karnataka, India
I have conducted the secretarial audit of the compliance of applicable statutory provisions and the adherence to good corporate practices by INFOSYS LIMITED (hereinafter called ‘the Company’). Secretarial Audit was conducted in a manner that provided me a reasonable basis for evaluating the corporate conducts/statutory compliances and expressing my opinion thereon.
Based on my verification of the Company’s books, papers, minute books, forms and returns filed and other records maintained by the Company and also the information provided by the Company, its officers, agents and authorized representatives during the conduct of secretarial audit, I hereby report that in my opinion, the Company has, during the audit period covering the financial year ended on March 31, 2018 complied with the statutory provisions listed hereunder and also that the Company has proper Board-processes and compliance-mechanism in place to the extent, in the manner and subject to the reporting made hereinafter :
I have examined the books, papers, minute books, forms and returns filed and other records maintained by the Company for the financial year ended on March 31, 2018 and made available to me, according to the provisions of :
i. The Companies Act, 2013 (the Act) and the rules made thereunder;ii. The Securities Contracts (Regulation) Act, 1956 (‘SCRA’) and the rules made thereunder;iii. The Depositories Act, 1996 and the Regulations and bye-laws framed thereunder;iv. Foreign Exchange Management Act, 1999 and the rules and regulations made thereunder to the extent of Foreign Direct
Investment and Overseas Direct Investment;v. The following Regulations and Guidelines prescribed under the Securities and Exchange Board of India Act, 1992 (‘SEBI Act’) :
a) The Securities and Exchange Board of India (Substantial Acquisition of Shares and Takeovers) Regulations, 2011;
b) The Securities and Exchange Board of India (Prohibition of Insider Trading) Regulations, 2015;
c) The Securities and Exchange Board of India (Share Based Employee Benefits) Regulations, 2014;
d) The Securities and Exchange Board of India (Registrars to an Issue and Share Transfer Agents) Regulations, 1993 regarding the Companies Act and dealing with client;
e) The Securities and Exchange Board of India (Listing Obligations and Disclosure Requirements) Regulations, 2015
f) The Securities and Exchange Board of India (Buyback of Securities) Regulations, 1998.vi. Other laws applicable specifically to the Company namely :
a) The Information Technology Act, 2000 and the rules made thereunder;
b) The Special Economic Zones Act, 2005 and the rules made thereunder;
c) Software Technology Parks of India rules and regulations, 2004;
d) The Indian Copyright Act, 1957;
e) The Patents Act, 1970;
f) The Trade Marks Act, 1999
I have also examined compliance with the applicable clauses of the Secretarial Standards issued by The Institute of Company Secretaries of India.
I report that, during the year under review, the Company has complied with the provisions of the Acts, Rules, Regulations, Guidelines and Standards mentioned above.
I further report that, during the year under review, the Company has made settlement application to the Securities Exchange Board Of India (SEBI) pursuant to Regulation 3 read with Schedule II (1)(12) of the SEBI (Settlement of Administrative and Civil Proceedings) Regulations 2014, in response to the Notice of Settlement for Approved Enforcement Action issued by the SEBI, vide its letter No. EFD/DRA/-111/MC/AA 28543/1/2017 dated November 17, 2017 in respect of certain alleged non compliances/violations by the Company of provisions of Securities Laws (namely, SEBI Act 1992, Securities Contract (Regulation) Act 1956, SEBI (Listing Obligations and Disclosure Requirements) Regulations, 2015 and Listing Agreement)

Annexures to the Board’s report | 65 Infosys Annual Report 2017-18
pertaining to matters relating to the severance agreement entered into with the former Chief Financial Officer, Mr. Rajiv Bansal, during 2015 and the application is pending disposal by the SEBI.
I further report that, there were no events / actions in pursuance of :
a) The Securities and Exchange Board of India (Issue of Capital and Disclosure Requirements) Regulations, 2009; b) The Securities and Exchange Board of India (Issue and Listing of Debt Securities) Regulations, 2008; andc) The Securities and Exchange Board of India (Delisting of Equity Shares) Regulations, 2009, and requiring compliance
thereof by the Company during the audit period.
I further report that, the compliance by the Company of applicable financial laws such as direct and indirect tax laws and maintenance of financial records and books of accounts has not been reviewed in this Audit since the same have been subject to review by statutory financial audit and other designated professionals.
I further report that, the Board of Directors of the Company is duly constituted with proper balance of Executive Directors, Non-Executive Directors and Independent Directors. The changes in the composition of the Board of Directors that took place during the period under review were carried out in compliance with the provisions of the Act.
Adequate notice is given to all directors to schedule the Board Meetings, agenda and detailed notes on agenda were sent at least seven days in advance, and a system exists for seeking and obtaining further information and clarifications on the agenda items before the meeting and for meaningful participation at the meeting.
As per the minutes of the meetings duly recorded and signed by the Chairman, the decisions of the Board were unanimous and no dissenting views have been recorded.
I further report that, based on the information provided and the representation made by the Company and also on the review of the compliance reports of Company Secretary / Chief Executive Officer taken on record by the Board of Directors of the Company, in my opinion there are adequate systems and processes in the Company commensurate with the size and operations of the Company to monitor and ensure compliance with applicable laws, rules, regulations and guidelines.
I report further that, during the audit period :
The Company has bought back and extinguished 11,30,43,478 equity shares of ` 5 each at a price of ` 1,150 per equity share aggregating to ` 13,000 crore (approx) and the buyback was completed on December 22, 2017;
and there were no other specific events / actions in pursuance of the above referred laws, rules, regulations, guidelines, etc. having a major bearing on the Company’s affairs.
Bengaluru
April 13, 2018 FCS :1325 / C.P.No : 640
P. G. Hegde
Hegde & HegdeCompany Secretaries

66 | Annexures to the Board’s report Infosys Annual Report 2017-18
Annexure 6 – Extract of annual return
Form No. MGT-9[Pursuant to Section 92(3) of the Companies Act, 2013 and Rule 12(1) of the Companies (Management and Administration) Rules, 2014]
I. Registration and other detailsCorporate Identity Number (CIN) of the company L 8 5 1 1 0 K A 1 9 8 1 P L C 0 1 3 1 1 5
Registration date July 02, 1981
Name of the company Infosys Limited
Category / sub-category of the company Company limited by shares
Public non-government company
Address of the registered office and contact details Electronics City, Hosur Road, Bengaluru 560 100, Karnataka, IndiaTel : 91 80 2852 0261 Fax : 91 80 2852 0362Email : [email protected] website : www.infosys.com
Listed company (Yes / No) Yes
Name, address and contact details of Registrar and transfer agent
Karvy Computershare Private LimitedUnit : Infosys Limited, Karvy Selenium Tower BPlot 31-32, Gachibowli, Financial DistrictNanakramguda, Hyderabad – 500 032
Contact personShobha AnandDeputy General ManagerTel : 91 40 6716 1559Email : [email protected]
II. Principal business activities of the Company
Name and description of main products / services NIC code of the product / service
% to total turnover of the Company
Computer programming, consultancy and related activities 620 100

Annexures to the Board’s report | 67 Infosys Annual Report 2017-18
III. Particulars of holding, subsidiary and associate companiesName of the parties Country CIN / GLN Holding /
Subsidiary / Associate
% holding as at
March 31, 2018
Brilliant Basics (MENA) DMCC Dubai Subsidiary 100Brilliant Basics Holdings Limited UK Subsidiary 100Brilliant Basics Limited UK Subsidiary 100EdgeVerve Systems Limited India U72200KA2014PLC073660 Subsidiary 100Infosys (Czech Republic) Limited s.r.o Czech Republic Subsidiary 99.98Infosys Americas Inc. US Subsidiary 100Infosys Arabia limited Saudi Arabia Subsidiary 70Infosys BPM Limited (formerly Infosys BPO Limited) India U72200KA2002PLC030310 Subsidiary 99.98Infosys BPO Americas LLC US Subsidiary 99.98Infosys Chile SpA Chile Subsidiary 100Infosys Consulting (Belgium) NV Belgium Subsidiary 99.90Infosys Consulting AG Switzerland Subsidiary 100Infosys Consulting GmbH Germany Subsidiary 100Infosys Consulting Holding AG Switzerland Subsidiary 100Infosys Consulting Ltda. Brazil Subsidiary 99.99Infosys Consulting Pte Ltd Singapore Subsidiary 100Infosys Consulting S.R.L. Argentina Subsidiary 100Infosys Consulting s.r.o. Czech Republic Subsidiary 100Infosys Consulting SAS France Subsidiary 100Infosys Consulting Sp. z o.o. Poland Subsidiary 100Infosys Management Consulting Pty. Limited Australia Subsidiary 100Infosys McCamish Systems LLC US Subsidiary 99.98Infosys Middle East FZ LLC Dubai Subsidiary 100Infosys Nova Holdings LLC US Subsidiary 100Infosys Poland Sp. z.o.o. Poland Subsidiary 99.98Infosys Public Services, Inc. US Subsidiary 100Infosys Technologies (Australia) Pty. Limited Australia Subsidiary 100Infosys Technologies (China) Co. Limited China Subsidiary 100Infosys Technologies (Shanghai) Company Limited China Subsidiary 100Infosys Technologies (Sweden) AB Sweden Subsidiary 100Infosys Technologies S. de R. L. de C.V. Mexico Subsidiary 100Infosys Tecnologia do Brasil Ltda. Brazil Subsidiary 100Infy Consulting B.V. The Netherlands Subsidiary 100Infy Consulting Company Limited UK Subsidiary 100Kallidus Inc. US Subsidiary 100Lodestone Management Consultants Co., Ltd. China Subsidiary 100Lodestone Management Consultants GmbH Austria Subsidiary 100Lodestone Management Consultants Inc. US Subsidiary 100Lodestone Management Consultants Portugal, Unipessoal, Lda Portugal Subsidiary 100Panaya GmbH Germany Subsidiary 100Panaya Inc. US Subsidiary 100Panaya Japan Co. Ltd. Japan Subsidiary 100Panaya Ltd. Israel Subsidiary 100Portland Group Pty. Limited Australia Subsidiary 99.98S.C. Infosys Consulting S.R.L. Romania Subsidiary 100Skava Systems Pvt. Ltd. India U72200TZ2003PTC010618 Subsidiary 100
Notes : 1. All the above parties are as per Section 2(87). 2. Infosys Canada Public Services, a wholly-owned subsidiary of Infosys Public Services, Inc., has been liquidated effective May 9, 2017. 3. Noah Consulting LLC (‘Noah’) has been liquidated effective November 9, 2017. 4. Noah Information Management Consulting Inc, a wholly-owned subsidiary of Noah Consulting LLC has been liquidated effective December
20, 2017. 5. Infosys Arabia Limited, a subsidiary of Infosys Limited, has been incorporated effective March 18, 2018 and is yet to commence operations. 6. Infosys Chile SpA, a subsidiary of Infosys Limited has been incorporated on November 20, 2017, and it is yet to commence operations. 7. DWA Nova LLC, an associate, has been liquidated effective November 17, 2017.

68 | Annexures to the B
oard’s reportInfosys A
nnual Report 2017-18
IV. Shareholding pattern (Equity share capital break-up as a percentage of total equity)
(i) Category-wise shareholdingCategory code
Category of shareholder No. of shares held at the beginning of the year No. of shares held at the end of the year % change during
the yearDemat Physical Total % of total
sharesDemat Physical Total % of total
shares (I) (II) (III) (IV) (V) (VI) (VII) (VIII) (IX) (X) (XI)(A) Promoter and promoter group(1) Indian – – – – – – – – –
(a) Individual / HUF 29,28,06,199 – 29,28,06,199 12.75 28,17,02,889 – 28,17,02,889 12.90 0.15 (b) Central government – – – – – – – – –(c) State government(s) – – – – – – – – –(d) Bodies corporate – – – – – – – – – (e) Banks / Financial institutions – – – – – – – – – (f) Any other – – – – – – – – – Subtotal A(1) 29,28,06,199 – 29,28,06,199 12.75 28,17,02,889 – 28,17,02,889 12.90 0.15
(2) ForeignSubtotal A(2) – – – – – – – – –
Total shareholding of promoters A=A(1)+A(2) 29,28,06,199 – 29,28,06,199 12.75 28,17,02,889 – 28,17,02,889 12.90 0.15 (B) Public shareholding(1) Institutions
(a) Mutual funds 19,12,67,683 – 19,12,67,683 8.33 23,14,84,277 – 23,14,84,277 10.60 2.27 (b) Banks / Financial institutions 39,81,083 – 39,81,083 0.17 20,81,097 – 20,81,097 0.10 (0.07)(c) Central government – – – – – – – – –(d) State government(s) – – – – – – – – –(e) Venture capital funds – – – – – – – – – (f) Insurance companies 27,10,45,069 – 27,10,45,069 11.80 23,38,29,498 – 23,38,29,498 10.71 (1.09)(g) Foreign institutional investors /
Foreign portfolio investors 87,99,00,889 12,800 87,99,13,689 38.31 76,97,47,301 12,800 76,97,60,101 35.24 (3.07)(h) Foreign venture capital funds – – – – – – – – – (i) Any other
(i) Alternative Investment Fund 2,58,871 – 2,58,871 0.01 31,79,915 – 31,79,915 0.15 0.14 Subtotal B(1) 134,64,53,595 12,800 134,64,66,395 58.62 124,03,22,088 12,800 124,03,34,888 56.80 (1.82)
(2) Non-institutions(a) Bodies corporate / overseas
corporate bodies 1,42,12,304 51,200 1,42,63,504 0.62 4,27,41,828 48,000 4,27,89,828 1.96 1.34 (b) Individuals
(i) Individuals holding nominal share capital up to ` 1 lakh 11,75,33,027 6,99,182 11,82,32,209 5.15 11,08,30,333 7,06,992 11,15,37,325 5.11 (0.04)(ii) Individuals holding nominal share capital in excess of ` 1 lakh 10,56,41,694 35,11,696 10,91,53,390 4.75 8,99,42,449 31,82,345 9,31,24,794 4.26 (0.49)
(c) Any other(i) Foreign bodies – DR 1,15,185 – 1,15,185 – 1,03,381 – 1,03,381 – –(ii) Non-banking financial companies 61,761 – 61,761 – 49,566 – 49,566 – –(iii) NRI 1,17,04,654 6,410 1,17,11,064 0.51 1,21,36,631 6,410 1,21,43,041 0.56 0.05(iv) Trusts(1) 2,08,17,020 – 2,08,17,020 0.91 2,23,17,452 – 2,23,17,452 1.02 0.11 (v) IEPF 1,05,234 1,05,234 – –
Subtotal B(2) 27,00,85,645 42,68,488 27,43,54,133 11.94 27,82,26,874 39,43,747 28,21,70,621 12.91 0.97

Annexures to the B
oard’s report | 69 Infosys A
nnual Report 2017-18
Category code
Category of shareholder No. of shares held at the beginning of the year No. of shares held at the end of the year % change during
the yearDemat Physical Total % of total
sharesDemat Physical Total % of total
shares (I) (II) (III) (IV) (V) (VI) (VII) (VIII) (IX) (X) (XI)Total public shareholding total B=B(1)+B(2) 161,65,39,240 42,81,288 162,08,20,528 70.56 151,85,48,962 39,56,547 152,25,05,509 69.71 (0.85)Total (A+B) 190,93,45,439 42,81,288 191,36,26,727 83.31 180,02,51,851 39,56,547 180,42,08,398 82.61 (0.70)(C) Shares held by custodians for ADRs 38,33,17,937 – 38,33,17,937 16.69 37,99,05,859 – 37,99,05,859 17.39 0.70 Grand total (A+B+C) 229,26,63,376 42,81,288 229,69,44,664 100.00 218,01,57,710 39,56,547 218,41,14,257 100.00 –
(1) Includes 1,11,89,514 shares as of March 31, 2017 and 1,07,01,956 shares as of March 31, 2018, held by Infosys Employee Benefit Trust as per SEBI (Share-based Employee Benefits) Regulations, 2014 and 1,00,000 shares each as of March 31, 2017 and March 31, 2018, held by Infosys Limited Employees’ Welfare Trust for welfare activities of employees. This is a non-promoter, non-public shareholding.
(ii)(a) Shareholding of promotersShareholder’s name Shareholding at the beginning of the year Shareholding at the end of the year % change in
shareholding during the year
No. of shares % of total shares of the Company
% of shares pledged / encumbered to total
shares
No. of shares % of total shares of the Company
% of shares pledged / encumbered to total
sharesSudha Gopalakrishnan 4,91,78,500 2.14 – 4,76,78,500 2.18 – 0.04Rohan Murty 3,17,99,128 1.38 – 3,04,06,446 1.39 – 0.01S. Gopalakrishnan 2,16,26,904 0.94 – 2,09,26,904 0.96 – 0.02 Nandan M. Nilekani 2,13,83,480 0.93 – 2,03,91,581 0.93 – –Akshata Murty 2,04,25,648 0.89 – 1,94,78,548 0.89 – –Asha Dinesh 2,01,89,928 0.88 – 1,92,89,652 0.88 – –Sudha N. Murty 1,80,58,640 0.79 – 1,72,75,313 0.79 – –Rohini Nilekani 1,80,04,696 0.78 – 1,71,67,546 0.79 – 0.01Dinesh Krishnaswamy 1,69,86,148 0.74 – 1,62,39,795 0.74 – –Shreyas Shibulal 1,46,79,855 0.64 – 1,40,24,675 0.64 – –Shruti Shibulal 1,36,87,696 0.60 – 13,68,769 0.06 – (0.54)S.D. Shibulal 88,28,844 0.38 – 8,82,884 0.04 – (0.34)N.R. Narayana Murthy 87,18,688 0.38 – 83,22,819 0.38 – –Nihar Nilekani 66,63,240 0.29 – 63,38,876 0.29 – –Janhavi Nilekani 66,63,164 0.29 – 63,32,581 0.29 – –Kumari Shibulal 54,94,176 0.24 – 52,48,965 0.24 – –Divya Dinesh 40,00,000 0.17 – 38,23,342 0.18 – 0.01Deeksha Dinesh 40,00,000 0.17 – 38,23,342 0.18 – 0.01Meghana Gopalakrishnan 24,17,464 0.11 – 24,17,464 0.11 – –
(ii)(b) Shareholding of Promoter groupShareholder’s name(1) Shareholding at the beginning of the year Shareholding at the end of the year % change in
shareholding during the year
No. of shares % of total shares of the Company
% of shares pledged / encumbered to total
shares
No. of shares % of total shares of the Company
% of shares pledged / encumbered to total
sharesGaurav Manchanda – – – 85,73,973 0.39 – 0.39Milan Shibulal Manchanda – – – 77,17,934 0.35 – 0.35Bhairavi Madhusudhan – – – 39,72,980 0.18 – 0.18
(1) During the year, shares were transferred by S.D. Shibulal and Shruti Shibulal to their immediate family members, Gaurav Manchanda, Milan Shibulal Manchanda and Bhairavi Madhusudhan, who were classified as promoter group.

70 | Annexures to the Board’s report Infosys Annual Report 2017-18
(iii) Change in promoters’ shareholdingName of the shareholder Shareholding at the
beginning of the yearCumulative shareholding
during the yearNo. of shares % of total shares
of the Company(1)
No. of shares % of total shares of the Company(2)
Sudha GopalakrishnanAt the beginning of the year 4,91,78,500 2.14(-) Buyback (15,00,000) 4,76,78,500 2.18At the end of the year 4,76,78,500 2.18
Rohan MurtyAt the beginning of the year 3,17,99,128 1.38(-) Buyback (13,92,682) 3,04,06,446 1.39At the end of the year 3,04,06,446 1.39
S. GopalakrishnanAt the beginning of the year 2,16,26,904 0.94(-) Buyback (7,00,000) 2,09,26,904 0.96At the end of the year 2,09,26,904 0.96
Nandan M. NilekaniAt the beginning of the year 2,13,83,480 0.93(-) Buyback (9,91,899) 2,03,91,581 0.93At the end of the year 2,03,91,581 0.93
Akshata MurtyAt the beginning of the year 2,04,25,648 0.89(-) Buyback (9,47,100) 1,94,78,548 0.89At the end of the year 1,94,78,548 0.89
Asha DineshAt the beginning of the year 2,01,89,928 0.88(-) Buyback (9,00,276) 1,92,89,652 0.88At the end of the year 1,92,89,652 0.88
Sudha N. MurtyAt the beginning of the year 1,80,58,640 0.79(-) Buyback (7,83,327) 1,72,75,313 0.79At the end of the year 1,72,75,313 0.79
Rohini NilekaniAt the beginning of the year 1,80,04,696 0.78(-) Buyback (8,37,150) 1,71,67,546 0.79At the end of the year 1,71,67,546 0.79
Dinesh KrishnaswamyAt the beginning of the year 1,69,86,148 0.74(-) Buyback (7,46,353) 1,62,39,795 0.74At the end of the year 1,62,39,795 0.74
Shreyas ShibulalAt the beginning of the year 1,46,79,855 0.64(-) Buyback (6,55,180) 1,40,24,675 0.64At the end of the year 1,40,24,675 0.64
Shruti ShibulalAt the beginning of the year 1,36,87,696 0.60(-) Internal promoter group transfer (1,23,18,927) 13,68,769 0.06(-) Buyback 0 13,68,769 0.06At the end of the year 13,68,769 0.06
S.D. ShibulalAt the beginning of the year 88,28,844 0.38(-) Internal promoter group transfer (79,45,960) 8,82,884 0.04(-) Buyback 0 8,82,884 0.04At the end of the year 8,82,884 0.04
N.R. Narayana MurthyAt the beginning of the year 87,18,688 0.38(-) Buyback (3,95,869) 83,22,819 0.38At the end of the year 83,22,819 0.38
Nihar NilekaniAt the beginning of the year 66,63,240 0.29(-) Buyback (3,24,364) 63,38,876 0.29At the end of the year 63,38,876 0.29

Annexures to the Board’s report | 71 Infosys Annual Report 2017-18
Name of the shareholder Shareholding at the beginning of the year
Cumulative shareholding during the year
No. of shares % of total shares of the Company(1)
No. of shares % of total shares of the Company(2)
Janhavi NilekaniAt the beginning of the year 66,63,164 0.29(-) Buyback (3,30,583) 63,32,581 0.29At the end of the year 63,32,581 0.29
Kumari ShibulalAt the beginning of the year 54,94,176 0.24(-) Buyback (2,45,211) 52,48,965 0.24At the end of the year 52,48,965 0.24
Divya DineshAt the beginning of the year 40,00,000 0.17(-) Buyback (176658) 38,23,342 0.18At the end of the year 38,23,342 0.18
Deeksha DineshAt the beginning of the year 40,00,000 0.17(-) Buyback (1,76,658) 38,23,342 0.18At the end of the year 38,23,342 0.18
Meghana GopalakrishnanAt the beginning of the year 24,17,464 0.11(-) Buyback – 24,17,464 0.11At the end of the year 24,17,464 0.11
(1) Percentage calculated on the paid-up share capital (229,69,44,664 shares) as at the beginning of the year(2) Percentage calculated on the paid-up share capital (218,41,14,257 shares) as at the end of the year
(iv) Change in promoter groups’ shareholdingName of the shareholder(1) Shareholding at the
beginning of the yearCumulative shareholding
during the yearNo. of shares % of total shares
of the CompanyNo. of shares % of total shares
of the Company(2)
Gaurav ManchandaAt the beginning of the year –(+) Internal promoter group transfer 85,73,973 0.39 85,73,973 0.39(-) Buyback – 85,73,973 0.39At the end of the year 85,73,973 0.39
Milan Shibulal ManchandaAt the beginning of the year – (+) Internal promoter group transfer 77,17,934 0.35 77,17,934 0.35(-) Buyback – 77,17,934 0.35At the end of the year 77,17,934 0.35
Bhairavi MadhusudhanAt the beginning of the year – (+) Internal promoter group transfer 39,72,980 0.18 39,72,980 0.18(-) Buyback – 39,72,980 0.18At the end of the year 39,72,980 0.18
(1) During the year, shares were transferred internally by S.D. Shibulal and Shruti Shibulal to Gaurav Manchanda, Milan Shibulal Manchanda, Bhairavi Madhusudhan, who were classified as promoter group.
(2) Percentage calculated on the paid-up share capital (218,41,14,257 shares) as at the end of the year.
(v) Shareholding of directors and key managerial personnel (KMP)Name of the director / KMP Shareholding at the
beginning of the yearCumulative shareholding
during the yearNo. of shares % of total shares
of the Company (1)
No. of shares % of total shares of the Company (2)
Nandan M. Nilekani – Chairman At the beginning of the year 2,13,83,480 0.93(-) Buyback (9,91,899) – 2,03,91,581 0.93At the end of the year 2,03,91,581 0.93

72 | Annexures to the Board’s report Infosys Annual Report 2017-18
Name of the director / KMP Shareholding at the beginning of the year
Cumulative shareholding during the year
No. of shares % of total shares of the Company (1)
No. of shares % of total shares of the Company (2)
U.B. Pravin Rao – Whole-time Director(4)
At the beginning of the year 5,55,520 0.02(-) Buyback (25,484) – 5,30,036 0.02At the end of the year 5,30,036 0.02
Kiran Mazumdar-Shaw – DirectorAt the beginning of the year 800 –At the end of the year – – 800 –
D.N. Prahlad – DirectorAt the beginning of the year 11,51,720 0.05(-) Buyback (55,625) – 10,96,095 0.05At the end of the year 10,96,095 0.05
M.D. Ranganath – KMP(4)
At the beginning of the year 9,256 –(+) ESOPs / RSUs exercised during the year 7,662 – 16,918 –At the end of the year – 16,918 –
Krishnamurthy Shankar – KMP(3)
At the beginning of the year – – – –(+) ESOPs / RSUs exercised during the year 3,012 3,012At the end of the year 3,012 –
A.G.S. Manikantha – KMP(4)
At the beginning of the year 80 –(+) ESOPs / RSUs exercised during the year 250 330At the end of the year – 330 –
Dr. Vishal Sikka – CEO & MD(4)(5)(6)
At the beginning of the year 44,886 (+) ESOPs / RSUs exercised during the year 70,772 – 1,15,658 –(-) Sale(s) during the year – – 1,15,658 –At the end of the year 1,15,658 –
R. Seshasayee – Director(6)
At the beginning of the year 248At the end of the year – 248 –
Mohit Joshi – KMP(3)
At the beginning of the year – (+) ESOPs / RSUs exercised during the year 13,087 – 13,087 –(-) Sale(s) during the year (13,087) – – –At the end of the year – –
Ravi Kumar S. – KMP(3)
At the beginning of the year – (+) ESOPs / RSUs exercised during the year 41,274 – 41,274 –(-) Sale(s) during the year (41,274) – – –At the end of the year – –
Rajesh K. Murthy(3)(7)
At the beginning of the year – (+) ESOPs / RSUs exercised during the year 35,475 – 35,475 –(-) Sale(s) during the year (35,475) – – –At the end of the year – –
(1) Percentage calculated on the paid-up share capital (229,69,44,664 shares) as at the beginning of the year(2) Percentage calculated on the paid-up share capital (218,41,14,257 shares) as at the end of the year(3) KMP as defined under Ind AS 24, Related Party Disclosures, appointed by the Board at its meeting held on January 13, 2017(4) KMP as defined under Section 2(51) of the Companies Act, 2013(5) Resigned as CEO & MD effective August 18, 2017(6) Resigned as Director effective August 24, 2017(7) Resigned as KMP effective January 31, 2018

Annexures to the Board’s report | 73 Infosys Annual Report 2017-18
The following directors did not hold any shares during fiscal 2018 :
• Salil Parekh – CEO & MD • Dr. Punita Kumar-Sinha – Director• Ravi Venkatesan – Director • D. Sundaram – Director• Roopa Kudva – Director • Prof. John W. Etchemendy – Director(1)
• Prof. Jeffrey S. Lehman – Director(1)
The following executives were named as KMP as defined under Ind AS 24, Related Party Disclosures, and did not hold any shares during fiscal 2018 :
• Sandeep Dadlani(1) • Inderpreet Sawhney• Gopikrishnan Radhakrishnan(1)
(1) Resigned during the year
(vi) Shareholding pattern of top 10 shareholders as of March 31, 2018(Other than directors, promoters and holders of ADRs)
Name of the shareholder(1) Shareholding at the beginning of the year
Cumulative shareholding during the year
No. of shares % of total shares of the Company(2)
No. of shares % of total shares of the Company(3)
Life Insurance Corporation of IndiaAt the beginning of the year 16,14,36,123 7.03Purchase(s) prior to buyback 74,14,867 0.32 16,88,50,990 7.35 Sale(s) prior to buyback (6,66,350) (0.03) 16,81,84,640 7.32 Buyback (72,51,074) 16,09,33,566 7.37 Purchase(s) post buyback – – 16,09,33,566 7.37 Sale(s) post buyback (1,14,19,549) (0.52) 14,95,14,017 6.85
At the end of the year 14,95,14,017 6.85 HDFC Mutual Fund
At the beginning of the year 3,82,58,488 1.67 Purchase(s) prior to buyback 2,92,80,864 1.27 6,75,39,352 2.94 Sale(s) prior to buyback (3,88,525) (0.02) 6,71,50,827 2.92 Buyback (40,83,978) 6,30,66,849 2.89 Purchase(s) post buyback 6,34,232 0.03 6,37,01,081 2.92 Sale(s) post buyback (29,68,027) (0.14) 6,07,33,054 2.78
At the end of the year 6,07,33,054 2.78 ICICI Prudential Mutual Fund
At the beginning of the year 3,32,62,193 1.45 Purchase(s) prior to buyback 2,01,91,341 0.88 5,34,53,534 2.33 Sale(s) prior to buyback (1,26,09,783) (0.55) 4,08,43,751 1.78 Buyback (31,92,504) 3,76,51,247 1.72 Purchase(s) post buyback 68,05,424 0.31 4,44,56,671 2.04 Sale(s) post buyback (41,43,268) (0.19) 4,03,13,403 1.85
At the end of the year 4,03,13,403 1.85 SBI Mutual Fund
At the beginning of the year 2,61,14,623 1.14 Purchase(s) prior to buyback 1,15,99,430 0.50 3,77,14,053 1.64 Sale(s) prior to buyback (1,41,03,510) (0.61) 2,36,10,543 1.03 Buyback (2,54,958) 2,33,55,585 1.07 Purchase(s) post buyback 99,97,988 0.46 3,33,53,573 1.53 Sale(s) post buyback (26,04,254) (0.12) 3,07,49,319 1.41
At the end of the year 3,07,49,319 1.41 Vanguard Emerging Markets Stock Index Fund, A Series of Vanguard International Equity Index Fund
At the beginning of the year 3,00,56,272 1.31 Purchase(s) prior to buyback 30,42,354 0.13 3,30,98,626 1.44 Sale(s) prior to buyback (2,83,198) (0.01) 3,28,15,428 1.43 Buyback (15,25,847) 3,12,89,581 1.43 Purchase(s) post buyback 3,05,34,927 1.40 6,18,24,508 2.83 Sale(s) post buyback (3,20,89,348) (1.47) 2,97,35,160 1.36
At the end of the year 2,97,35,160 1.36
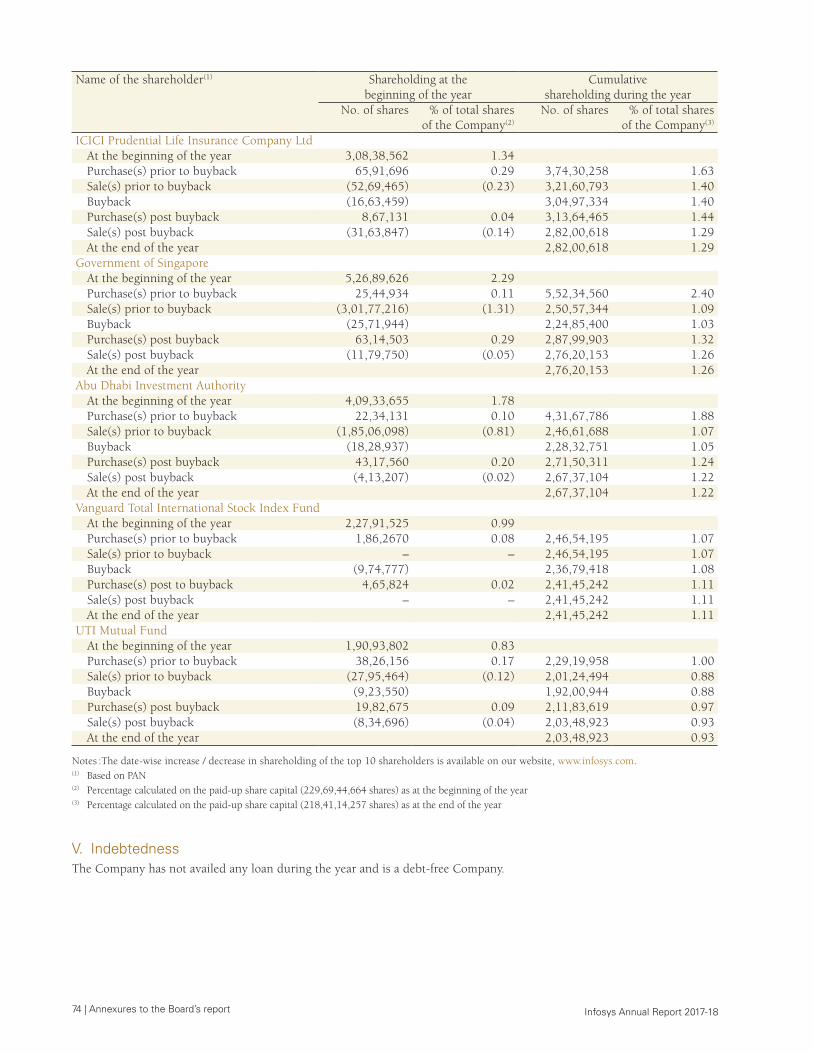
74 | Annexures to the Board’s report Infosys Annual Report 2017-18
Name of the shareholder(1) Shareholding at the beginning of the year
Cumulative shareholding during the year
No. of shares % of total shares of the Company(2)
No. of shares % of total shares of the Company(3)
ICICI Prudential Life Insurance Company LtdAt the beginning of the year 3,08,38,562 1.34 Purchase(s) prior to buyback 65,91,696 0.29 3,74,30,258 1.63 Sale(s) prior to buyback (52,69,465) (0.23) 3,21,60,793 1.40 Buyback (16,63,459) 3,04,97,334 1.40 Purchase(s) post buyback 8,67,131 0.04 3,13,64,465 1.44 Sale(s) post buyback (31,63,847) (0.14) 2,82,00,618 1.29
At the end of the year 2,82,00,618 1.29 Government of Singapore
At the beginning of the year 5,26,89,626 2.29 Purchase(s) prior to buyback 25,44,934 0.11 5,52,34,560 2.40 Sale(s) prior to buyback (3,01,77,216) (1.31) 2,50,57,344 1.09 Buyback (25,71,944) 2,24,85,400 1.03 Purchase(s) post buyback 63,14,503 0.29 2,87,99,903 1.32 Sale(s) post buyback (11,79,750) (0.05) 2,76,20,153 1.26
At the end of the year 2,76,20,153 1.26 Abu Dhabi Investment Authority
At the beginning of the year 4,09,33,655 1.78 Purchase(s) prior to buyback 22,34,131 0.10 4,31,67,786 1.88 Sale(s) prior to buyback (1,85,06,098) (0.81) 2,46,61,688 1.07 Buyback (18,28,937) 2,28,32,751 1.05 Purchase(s) post buyback 43,17,560 0.20 2,71,50,311 1.24 Sale(s) post buyback (4,13,207) (0.02) 2,67,37,104 1.22
At the end of the year 2,67,37,104 1.22 Vanguard Total International Stock Index Fund
At the beginning of the year 2,27,91,525 0.99 Purchase(s) prior to buyback 1,86,2670 0.08 2,46,54,195 1.07 Sale(s) prior to buyback – – 2,46,54,195 1.07 Buyback (9,74,777) 2,36,79,418 1.08 Purchase(s) post to buyback 4,65,824 0.02 2,41,45,242 1.11 Sale(s) post buyback – – 2,41,45,242 1.11
At the end of the year 2,41,45,242 1.11 UTI Mutual Fund
At the beginning of the year 1,90,93,802 0.83 Purchase(s) prior to buyback 38,26,156 0.17 2,29,19,958 1.00 Sale(s) prior to buyback (27,95,464) (0.12) 2,01,24,494 0.88 Buyback (9,23,550) 1,92,00,944 0.88 Purchase(s) post buyback 19,82,675 0.09 2,11,83,619 0.97 Sale(s) post buyback (8,34,696) (0.04) 2,03,48,923 0.93
At the end of the year 2,03,48,923 0.93
Notes :The date-wise increase / decrease in shareholding of the top 10 shareholders is available on our website, www.infosys.com.(1) Based on PAN (2) Percentage calculated on the paid-up share capital (229,69,44,664 shares) as at the beginning of the year(3) Percentage calculated on the paid-up share capital (218,41,14,257 shares) as at the end of the year
V. Indebtedness The Company has not availed any loan during the year and is a debt-free Company.

Annexures to the Board’s report | 75 Infosys Annual Report 2017-18
VI.(a) Remuneration of Managing Director (MD), whole-time directors (WTD) and / or manager in ` crore
Particulars of remuneration Name of MD / WTD / Manager Total amountSalil Parekh(1) Dr. Vishal Sikka(4) U.B. Pravin
Rao(7)
Gross salary Salary as per provisions contained in Section 17(1) of the Income-tax Act, 1961 3.89 (5) 5.96 8.04 17.89Value of perquisites u/s 17(2) Income-tax Act, 1961 – – – –Profits in lieu of salary under Section 17(3) Income-tax Act, 1961 – – – –
Stock option(2) (3) – (6) 6.78 (8)– 6.78Sweat equity – – – –Commission as % of profit – – – –Others(9) 0.09 0.18 0.18 0.45Total 3.98 12.92 8.22 25.12Ceiling as per the Act 2,291
Notes : The details in the above table are on accrual basis. (1) Appointed as Chief Executive Officer and Managing Director effective January 2, 2018. The appointment is for a term of five years effective
January 2, 2018 to January 1, 2023 and the remuneration is approved by shareholders vide a postal ballot concluded on February 20, 2018. (2) In accordance with the definition of perquisites under the Income-tax Act, 1961, the remuneration includes the value of stock incentives only on
those shares that have been exercised during the period. Accordingly, the value of stock incentives granted during the period is not included. The number of stock incentives granted in fiscal 2018 is mentioned in the notes below.
(3) Pursuant to the approval of the shareholders through a postal ballot on February 20, 2018, Salil Parekh is eligible to receive the following under the 2015 Plan,
a) an annual grant of RSUs of fair value ` 3.25 crore, which will vest over time in three equal annual installments upon completion of each year of service from the respective grant date
b) a one-time grant of RSUs of fair value ` 9.75 crore, which will vest over time in two equal annual installments upon completion of each year of service from the grant date, and
c) an annual grant of performance-based RSUs of fair value ` 13 crore, which will vest after completion of three years, the first of which concludes on March 31, 2021, subject to the achievement of performance targets set by the Board or its committee. The Board, based on the recommendations of the nomination and remuneration committee, approved on February 27, 2018, the annual time-
based grant for fiscal 2018 of 28,256 RSUs and a one-time, time-based grant of 84,768 RSUs. The grants were made effective February 27, 2018. (4) Resigned as Chief Executive Officer and Managing Director effective August 18, 2017 and as Director effective August 24, 2017. (5) Includes US$ 0.25 million (approximately ̀ 1.60 crore) and US$ 0.21 million (approximately ̀ 1.34 crore) as part of 90 days base pay in lieu of notice
and variable pay, respectively, for fiscal 2018 on account of resignation. (6) Perquisite value of stock incentives on account of exercise of 70,772 RSUs. Consequent to his resignation from the Company on August 24, 2017,
the unvested stock incentives (time-based and performance-based awards) granted to him were forfeited. (7) Appointed as Interim Chief Executive Officer and Managing Director effective August 18, 2017. Subsequently, on January 2, 2018, re-designated as
Chief Operating Officer and Whole-time Director. The salary remains unchanged on the appointment and redesignation. (8) On March 31, 2017, the shareholders vide a postal ballot approved a revision in the salary of U.B. Pravin Rao, COO and Whole-time Director,
effective November 1, 2016. Based on fiscal 2016 performance, the nomination and remuneration committee, at its meeting held on October 14, 2016, recommended a grant of 27,250 RSUs and 43,000 ESOPs, amounting to ` 4 crore to U.B. Pravin Rao, under the 2015 Plan and the same was approved by the shareholders through a postal ballot on March 31, 2017. These RSUs and ESOPs were granted effective May 2, 2017.
(9) Includes retirals
VI.(b) Remuneration to key managerial personnel other than MD / Manager / WTD in ` crore
Particulars of remuneration Key managerial personnel Others(1) TotalCFO Company
SecretaryGross salary
Salary as per provisions contained in Section 17(1) of the Income-tax Act, 1961 7.03 0.55 30.79 38.37Value of perquisites u/s 17(2) Income-tax Act, 1961 – – – –Profits in lieu of salary under Section 17(3) of the Income-tax Act, 1961 – – – –
Stock options(2)(3) 0.71 0.02 5.60 6.33Sweat equity – – – –Commission as % of profit – – –Others(4) 0.24 0.03 3.58 3.85Total 7.98 0.60 39.97 48.55

76 | Annexures to the B
oard’s reportInfosys A
nnual Report 2017-18
Notes : The details in the above table are on accrual basis (1) The following executives were named as KMP as defined under Ind AS 24, Related Party Disclosures. Hence, the remuneration for these KMP for fiscal 2018 has been collectively disclosed under others. The
remuneration included in the above table is for the complete fiscal 2018, except where specifically stated otherwise. For details of remuneration on an individual basis, refer to Annexure 3 of the Board’s report included in this Annual Report.
• Ravi Kumar S. • Gopi Krishnan Radhakrishnan(c)
• Sandeep Dadlani(a) • Rajesh K. Murthy(d)
• Mohit Joshi • Krishnamurthy Shankar• Inderpreet Sawhney(b)
(a) Resigned effective July 14, 2017; hence, remuneration for fiscal 2018 is from April 1, 2017 to July 14, 2017. (b) Appointed as Group General Counsel and Chief Compliance Officer effective July 3, 2017 and was named as KMP under Ind AS 24, Related Party Disclosures effective July 14, 2017. (c) Appointed as Acting General Counsel effective January 1, 2017 and resigned effective June 24, 2017; hence, remuneration for fiscal 2018 is from April 1, 2017 to June 24, 2017. (d) Resigned effective January 31, 2018; hence, remuneration for fiscal 2018 is from April 1, 2017 to January 31, 2018. (2) In accordance with the definition of perquisites under the Income-tax Act, 1961, the remuneration includes the value of stock incentives only on those shares that have been exercised during the period. Accordingly,
the value of stock incentives granted during the period is not included. The number of stock incentives granted in fiscal 2018 is mentioned in the notes below. (3) During fiscal 2018, 2,73,100 RSUs and 44,450 stock options were granted under the 2015 Plan, to KMP, excluding CEO and COO. (4) Includes retirals
VI.(c) Remuneration to other directorsin ` crore
Particulars of remuneration Name of director Total amountKiran
Mazumdar-Shaw
Ravi Venkatesan
Roopa Kudva Dr. Punita Kumar-Sinha
D.N. Prahlad D. Sundaram (1)
R. Seshasayee (2)
Prof. Jeffrey S. Lehman (2)
Prof. John W.
Etchemendy (2)
Independent directorsFee for attending Board / committee meetings – – – – – – – – – –Commission 1.00 1.43 0.97 1.33 0.95 0.70 0.84 0.89 0.60 8.71Others, please specify – – – – – – – – – –Total (1) 1.00 1.43 0.97 1.33 0.95 0.70 0.84 0.89 0.60 8.71Other non-executive directorsFee for attending Board / committee meetings – – – – – – – – – –Commission – – – – – – – – – –Others, please specify – – – – – – – – – –Total (2) – – – – – – – – – –Total (1+2) 1.00 1.43 0.97 1.33 0.95 0.70 0.84 0.89 0.60 8.71Total managerial remuneration 1.00 1.43 0.97 1.33 0.95 0.70 0.84 0.89 0.60 8.71Overall ceiling as per the Act 208
Notes : The details in the above table are on accrual basis Additionally, independent directors are also reimbursed for expenses incurred in performance of official duties. (1) For the period, July 14, 2017 to March 31, 2018 (2) For the period April 1, 2017 to August 24, 2017
Penalties / Punishment / Compounding of offencesThe Company, its directors or other officers were not subject to penalties / punishment / compounding of offences during fiscal 2018.

Annexures to the Board’s report | 77 Infosys Annual Report 2017-18
Annexure 7 – Annual report on CSR activities[Pursuant to Section 135 of the Companies Act, 2013]
Corporate Social Responsibility (CSR) is a large part of our overall sustainability policy, encompassing social, economic and environmental actions. Along with philanthropy, we help build institutions, and use technology to safeguard natural resources against climate change risks.
Infosys Foundation (‘the Foundation’), our CSR trust, was established in 1996 with a vision to boosting our CSR initiatives. This was long before the Companies Act, 2013 mandated that a company should function through a registered trust or society for any CSR activities to be undertaken by it. The Foundation publishes a report of its yearly activities, which along with other details of the Foundation’s activities, is available on https://www.infosys.com/infosys-foundation.
CSR committeeThe CSR committee of the Board is responsible for overseeing the execution of the Company’s CSR policy. The CSR committee comprises three independent directors and the COO and Whole-time Director. The members of the CSR committee are :• Kiran Mazumdar-Shaw, Chairperson• U.B. Pravin Rao• Roopa Kudva• Dr. Punita Kumar-Sinha
Our objectivesOur broad objectives, as stated in our CSR policy, include :
• Making a positive impact on society through economic development and reduction of our resource footprint.
• Taking responsibility for the actions of the Company while also encouraging a positive impact through supporting causes concerning the environment, communities and our stakeholders.
For more details on our CSR policy, visit https://www.infosys.com/investors/corporate-governance/Documents/corporate-social-responsibility-policy.pdf.
Focus areasThe Foundation’s focus areas are :
• Healthcare • Destitute care• Eradication of hunger
and promotion of education
• Rural development, rehabilitation and disaster relief
• Art and culture • Environmental sustainability
Financial detailsSection 135 of the Companies Act, 2013 and Rules made under it prescribe that every company having a net worth of ` 500 crore or more, or turnover of ` 1,000 crore or more, or a net profit of ` 5 crore or more during any financial year shall ensure that it spends, in every financial year, at least 2% of the average net profits made during the three immediately preceding financial years, in pursuance of its CSR Policy. The provisions pertaining to CSR as prescribed under the Companies Act, 2013 are applicable to Infosys Limited.
The financial details as sought by the Companies Act, 2013 for fiscal 2018 are as follows :in ` crore
Particulars AmountAverage net profit of the Company for the last three financial years 15,513 Prescribed CSR expenditure (2% of the average net profit as computed above)Total amount to be spent for the financial year 310.25
Amount spent 312.60 Amount unspent –
The Infosys Foundation primarily works with non-governmental organizations as the nodal agency for implementing projects. The major projects and heads under which the outlay amount was spent in fiscal 2018 are as follows :
in ` crore
Theme-based CSR project / activity / beneficiary Location of the project / program
Amount outlay
(budget)
Amount spent on the
projects or programs in fiscal 2018
Cumulative expenditure up to the reporting
period
(i) Expenditure on projects / programs through Infosys FoundationRural development
Road construction Mudipu 17.81 13.70 17.81 Visakha Jilla Nava Nirmana Samithi Narsipatnam 4.25 4.25 4.25 Re-construction of government schools Mulbagal 4.09 4.09 4.09 Swachh Bharat Hyderabad,
Bengaluru 5.71 5.71 5.71
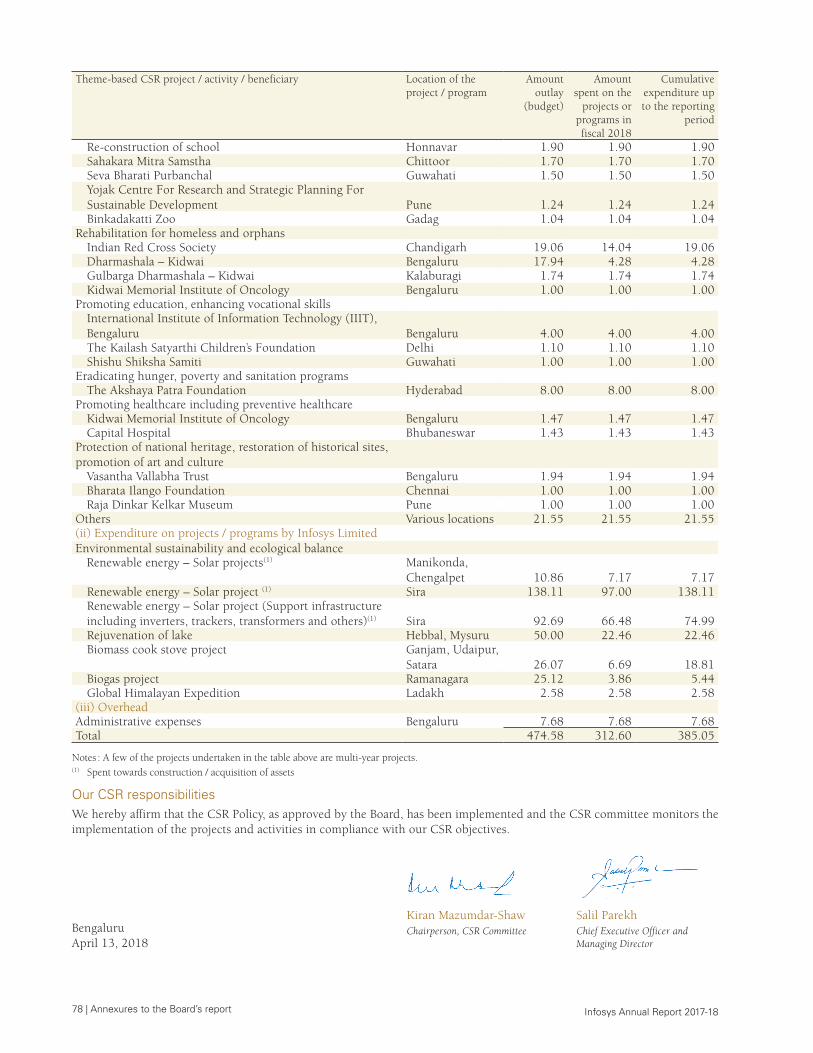
78 | Annexures to the Board’s report Infosys Annual Report 2017-18
Theme-based CSR project / activity / beneficiary Location of the project / program
Amount outlay
(budget)
Amount spent on the
projects or programs in fiscal 2018
Cumulative expenditure up to the reporting
period
Re-construction of school Honnavar 1.90 1.90 1.90 Sahakara Mitra Samstha Chittoor 1.70 1.70 1.70 Seva Bharati Purbanchal Guwahati 1.50 1.50 1.50 Yojak Centre For Research and Strategic Planning For Sustainable Development Pune 1.24 1.24 1.24 Binkadakatti Zoo Gadag 1.04 1.04 1.04
Rehabilitation for homeless and orphansIndian Red Cross Society Chandigarh 19.06 14.04 19.06 Dharmashala – Kidwai Bengaluru 17.94 4.28 4.28 Gulbarga Dharmashala – Kidwai Kalaburagi 1.74 1.74 1.74 Kidwai Memorial Institute of Oncology Bengaluru 1.00 1.00 1.00
Promoting education, enhancing vocational skillsInternational Institute of Information Technology (IIIT), Bengaluru Bengaluru 4.00 4.00 4.00 The Kailash Satyarthi Children’s Foundation Delhi 1.10 1.10 1.10 Shishu Shiksha Samiti Guwahati 1.00 1.00 1.00
Eradicating hunger, poverty and sanitation programsThe Akshaya Patra Foundation Hyderabad 8.00 8.00 8.00
Promoting healthcare including preventive healthcareKidwai Memorial Institute of Oncology Bengaluru 1.47 1.47 1.47 Capital Hospital Bhubaneswar 1.43 1.43 1.43
Protection of national heritage, restoration of historical sites, promotion of art and culture
Vasantha Vallabha Trust Bengaluru 1.94 1.94 1.94 Bharata Ilango Foundation Chennai 1.00 1.00 1.00 Raja Dinkar Kelkar Museum Pune 1.00 1.00 1.00
Others Various locations 21.55 21.55 21.55 (ii) Expenditure on projects / programs by Infosys LimitedEnvironmental sustainability and ecological balance
Renewable energy – Solar projects(1) Manikonda, Chengalpet 10.86 7.17 7.17
Renewable energy – Solar project (1) Sira 138.11 97.00 138.11 Renewable energy – Solar project (Support infrastructure including inverters, trackers, transformers and others)(1) Sira 92.69 66.48 74.99 Rejuvenation of lake Hebbal, Mysuru 50.00 22.46 22.46 Biomass cook stove project Ganjam, Udaipur,
Satara 26.07 6.69 18.81 Biogas project Ramanagara 25.12 3.86 5.44 Global Himalayan Expedition Ladakh 2.58 2.58 2.58
(iii) OverheadAdministrative expenses Bengaluru 7.68 7.68 7.68 Total 474.58 312.60 385.05
Notes : A few of the projects undertaken in the table above are multi-year projects.(1) Spent towards construction / acquisition of assets
Our CSR responsibilitiesWe hereby affirm that the CSR Policy, as approved by the Board, has been implemented and the CSR committee monitors the implementation of the projects and activities in compliance with our CSR objectives.
Bengaluru April 13, 2018
Kiran Mazumdar-ShawChairperson, CSR Committee
Salil ParekhChief Executive Officer and Managing Director

Annexures to the Board’s report | 79 Infosys Annual Report 2017-18
Annexure 8 – Conservation of energy, research and development, technology absorption, foreign exchange earnings and outgo[Particulars pursuant to the Companies (Accounts) Rules, 2014]
Conservation of resourcesWe continued our efforts on smart building automation, highly-efficient designs, deep green retrofits and renewable energy, which have helped us conserve resources, while efficient waste management has minimized waste to landfills.
Renewable energy : During the year, we augmented the capacity of our solar installations. Currently, we have a total installed capacity of around 46.2 MW across our campuses, including on-the-roof and ground-mount solar installations. The total percentage of renewables in electricity consumption is around 43% for fiscal 2018. We also achieved around 3% reduction in per capita electricity consumption.
Green buildings : With LEED new construction, GRIHA and existing building certifications, we now have 11.7 million sq. ft. of highest rated green buildings across campuses. In fiscal 2018, two of our buildings – Software Development Building (SDB) 1 in Jaipur, and SDB A/B in Bhubaneswar – were awarded the US Green Building Council LEED Platinum rating and the LEED India Platinum rating respectively. We now have 19 LEED Platinum-rated buildings and four GRIHA 5-star rated buildings.
Retrofits : The deep green retrofits in air conditioning, UPS systems, lighting and other systems have helped us reduce 32 MW in connected load in the last seven years. This initiative helped us investigate and address new opportunities like indoor air quality and thermal comfort in our infrastructure.
Carbon neutrality : In line with our commitment to becoming carbon-neutral and focusing on social development alongside carbon emission reduction, we have implemented six community-based carbon offset projects. As of fiscal 2018, our project portfolio includes a household biogas project, four high-efficiency biomass cook stove projects and one rural electrification project. During fiscal 2018, we carried out a third-party verification of the carbon offset generated by these projects since the beginning of their implementation. The third-party verifications were carried out by UN-approved verifying agencies. The current portfolio of offset projects has generated about 1,53,309 tCO2e as of March 31, 2018. At the same time, our projects have positively impacted the lives of over 1,00,000 families (5,00,000 individuals) across five states in India.
Water management : During the year, we achieved a per capita reduction in the consumption of fresh water of around 19% using efficient fixtures, wastewater treatment technologies, reuse of treated wastewater, rainwater harvesting and smart meters that help us monitor our consumption in real time to eliminate water wastage.
Waste management : We strive to reuse, recycle and responsibly dispose of waste. Our nine biogas plants and eight composting plants have a cumulative capacity to treat 4.1 million kg of waste per annum. To treat sewage sludge from wastewater treatment plants, we collaborated with
Leibniz University, Germany and implemented a first-of-its-kind, fully-automated and solar heat-assisted greenhouse dryer in India with a cumulative treating capacity of 1.2 million kg of sludge annually. Mysuru and Bengaluru were the first campuses to have such plants – of 3.5 TPD and 1 TPD respectively. This technology is labor-independent and derives more than 90% of its drying energy requirement from the sun.
Biodiversity : We strive to conserve and promote biodiversity at all our owned facilities. We planted over 28,000 saplings this year.
Health, safety and environment We have integrated climate change actions into our Company strategy. Our Health, Safety and Environmental Management System (HSEMS), called Ozone, seeks to provide a safe and healthy workplace to our employees, visitors and contract workers and achieve high standards of environmental protection. It also strives to keep interested parties well-informed, trained and committed to our HSE process. We are certified to ISO14001:2015 and OHSAS 18001:2007 at most of our campuses in India.
Technology absorptionSmart IT at Infosys : InfosysIT undertook a program – ‘Windmill of InfosysIT’ – encompassing revenue enablement, innovation, and cost optimization as strategic pillars, to empower more than 2,00,000 employees around the world. We aspire to provide ‘consumer-grade application experience with industry-grade security’ to our employees.
We have adopted intelligent systems as a focus area to make our IT more predictive, proactive and real-time, and to enhance user experience. To provide meaningful insights to our business functions, we are implementing What-If analysis, decision models and visualization techniques that help in discovery, interpretation and communication of relevant data to appropriate stakeholders. Our services and applications are being enabled to perform periodic health checks leveraging machine learning algorithms to implement preventive and self-healing capabilities.
InfosysIT Enterprise Mobile App was launched for Android and iOS users. The app enables frequently-used transactions on the go and is presently being used by more than 30,000 users, within just three months of rollout.
Infosys Nia®, our knowledge-based AI platform, has been implemented to bring in self-healing capabilities in our applications. A distributed storage system using commodity hardware with self-healing capability has been deployed.
To enhance employee safety, we have rolled out an Emergency Mobile App for employees and a Building Occupancy Dashboard for the HR and Security teams. These IT solutions help the organization with a near-real-time view of an employee’s location for prompt response to emergency alerts.

80 | Annexures to the Board’s report Infosys Annual Report 2017-18
We have implemented advanced security controls and threat analytics to protect Infosys assets from cyber threats and insider attacks.
Under the automation initiative, 16% of service requests raised with the IT support team were serviced without manual intervention. We deployed 50+ Ansible playbooks to automate end-to-end platform provisioning and enabled self-service access for the application delivery team for deployments. Platform as a Service (PaaS), based on Openstack, has been deployed to reduce provisioning time and on the fly scale-out of resources. Software Defined Networking solution has been implemented to achieve integration with the cloud management platform for network configuration automation and provides granular network security with micro-segmentation.
Energy-efficient IT infrastructureWe have adopted a multi-pronged strategy to make our IT infrastructure energy-efficient and green. Some of the measures implemented are :
Public cloud adoption : Cloud computing is a model for enabling convenient, on-demand network access to a shared pool of configurable computing resources. Currently, 53% of our internal compute workload has been migrated to public cloud. Also, 1,30,000 mailboxes have been migrated to Exchange Online.
Server Virtualization : Virtualization was leveraged across the stack to solve business challenges of scale on demand, availability, time to provision, reliability, performance, disaster recovery, manageability, compliance, with benefits of greener and cleaner environment and lower total cost of ownership for the organization. Around 95% of our servers used for enterprise applications have been virtualized.
Server power management : Our automated power management tool continuously monitors the workload on each virtual machine (VM) on premises and on public cloud, and manages the shutdown based on threshold. This has
yielded power savings of around 25% per VM. Terminator is an in-house application that ensures shutdown of desktops after business hours if the user has left for the day without shutting down their desktop. Terminator has resulted in 20% electricity savings across locations.
Research and development (R&D) expenditureOn a standalone basis, the total R&D expenditure for fiscals 2018 and 2017 is as follows :
in ` crore
Standalone2018 2017
Revenue expenditure 374 351Capital expenditure – –Total 374 351R&D expenditure / revenue (%) 0.6 0.6
Future plan of action We will continue to collaborate with leading national and international universities, product vendors and technology startup companies. We are creating an ecosystem to co-create business solutions on client-specific business themes.
Foreign exchange earnings and outgoWe have established a substantial direct marketing network around the world, including North America, Europe and Asia Pacific. These offices are staffed with sales and marketing specialists who sell our services to large international clients.
Activity in foreign currency – standalonein ` crore
2018 2017Earnings 60,329 57,734 Expenditure 31,358 29,088 Net foreign exchange earnings (NFE) 28,971 28,646NFE / earnings (%) 48.0% 49.6%
for and on behalf of the Board of Directors
Bengaluru April 13, 2018
Nandan M. NilekaniChairman
Salil ParekhChief Executive Officer and Managing Director

Annexures to the B
oard’s report | 81 Infosys A
nnual Report 2017-18
Annexure 9 – Corporate policiesWe seek to promote and follow the highest level of ethical standards in all our business transactions guided by our value system. The SEBI (Listing Obligations and Disclosure Requirements) Regulations, 2015 mandated the formulation of certain policies for all listed companies. All our corporate governance policies are available on our website, at https://www.infosys.com/investors/corporate-governance/Pages/policies.aspx/. The policies are reviewed periodically by the Board and updated based on need and new compliance requirements. During the year, the Board revised and adopted some of its policies.
Key policies that have been adopted are as follows :
Name of the policy Brief description Web link Summary of key changes
Whistleblower Policy (Policy on vigil mechanism)
The Company has adopted a whistleblower mechanism for directors and employees to report concerns about unethical behavior, actual or suspected fraud, or violation of the Company’s code of conduct and ethics. The policy was revised and adopted on January 13, 2017.
https://www.infosys.com/investors/corporate-governance/Documents/whistleblower-policy.pdf
There has been no change to the policy during fiscal 2018.
Code of Conduct and Ethics
The Company has adopted the Code of Conduct and Ethics which forms the foundation of its ethics and compliance program. The policy was revised and adopted on October 24, 2017 and January 12, 2018.
https://www.infosys.com/investors/corporate-governance/Documents/CodeofConduct.pdf
The Code of Conduct and Ethics was amended to incorporate the new CEO and Managing Director’s message to the Company’s stakeholders.
Dividend Distribution Policy
The Company adopted the Dividend Distribution Policy on April 13, 2017.
https://www.infosys.com/investors/corporate-governance/Documents/dividend-distribution.pdf
There has been no change to the policy during fiscal 2018.
Insider Trading Policy The policy provides the framework in dealing with securities of the Company. The policy was revised and adopted on January 13, 2017.
https://www.infosys.com/investors/corporate-governance/Documents/insider-trading-policy.pdf
There has been no change to the policy during fiscal 2018.
Corporate Policy Statement on Investor Relations
The policy is aimed at providing clear guidelines and procedures for disclosing material information outside the Company in order to provide accurate and timely communications to our shareholders and the financial markets. The policy was revised and adopted on January 13, 2017.
https://www.infosys.com/investors/corporate-governance/Documents/corporate-policy-statement-investor-relations.pdf
There has been no change to the policy during fiscal 2018.
Policy for Determining Materiality for Disclosures
This policy applies to disclosures of material events affecting Infosys and its subsidiaries. This policy is in addition to the Corporate Policy Statement on Investor Relations, which deals with the dissemination of unpublished, price-sensitive information. The policy was revised and adopted on January 13, 2017.
https://www.infosys.com/investors/corporate-governance/Documents/policy-determining-materiality-disclosures.pdf
There has been no change to the policy during fiscal 2018.

82 | Annexures to the B
oard’s reportInfosys A
nnual Report 2017-18
Name of the policy Brief description Web link Summary of key changes
Recoupment Policy The policy deals with the provisions if the Company restates its financial statements. It allows the Company to recover any incentive-based compensation received by an executive officer that is in excess of what would have been payable based on the restated and corrected financial statements. The policy was adopted effective January 14, 2016.
https://www.infosys.com/investors/corporate-governance/Documents/recoupment-policy.pdf
There has been no change to the policy during fiscal 2018.
Nomination and Remuneration Policy
This policy formulates the criteria for determining qualifications, competencies, positive attributes and independence for the appointment of a director (executive / non-executive) and also the criteria for determining the remuneration of the directors, key managerial personnel and other employees. The policy was adopted effective March 25, 2015.
https://www.infosys.com/investors/corporate-governance/Documents/nomination-remuneration-policy.pdf
There has been no change to the policy during fiscal 2018.
Corporate Social Responsibility Policy
The policy outlines the Company’s strategy to bring about a positive impact on society through programs relating to hunger, poverty, education, healthcare, environment and lowering its resource footprint. The policy was adopted effective April 1, 2014.
https://www.infosys.com/investors/corporate-governance/Documents/corporate-social-responsibility-policy.pdf
There has been no change to the policy during fiscal 2018.
Policy on Material Subsidiaries
The policy is used to determine the material subsidiaries and material non-listed Indian subsidiaries of the Company and to provide the governance framework for them. The policy was adopted effective March 31, 2015.
https://www.infosys.com/investors/corporate-governance/Documents/material-subsidiaries-policy.pdf
There has been no change to the policy during fiscal 2018.
Related Party Transaction Policy
The policy regulates all transactions between the Company and its related parties. The policy was adopted effective March 31, 2015.
https://www.infosys.com/investors/corporate-governance/Documents/related-party-transaction-policy.pdf
There has been no change to the policy during fiscal 2018.
Document Retention and Archival Policy
The policy deals with the retention and archival of corporate records of Infosys Limited and all its subsidiaries. The policy was adopted effective December 1, 2015.
https://www.infosys.com/investors/corporate-governance/Documents/document-retention-archival-policy.pdf
There has been no change to the policy during fiscal 2018.

Management’s discussion and analysis | 83 Infosys Annual Report 2017-18
Management’s discussion and analysis
OverviewInfosys is a leading provider of consulting, technology, outsourcing and next-generation digital services, enabling clients in over 45 countries to create and execute strategies for their digital transformation.
Our vision is to build a globally-respected organization delivering the best-of-breed business solutions, leveraging technology, delivered by the best-in-class people. We are guided by our value system which motivates our attitudes and actions. Our core values are Client Value, Leadership by Example, Integrity and Transparency, Fairness and Excellence (C-LIFE).
Our strategic objective is to build a sustainable organization that remains relevant to the agenda of our clients, while creating growth opportunities for our employees and generating profitable returns for our investors.
Our clients and prospective clients are faced with transformative business opportunities due to the advances in software and computing technology. The journey to the digital future requires not just an understanding of new technologies and new ways of working, but a deep appreciation of existing technology landscapes, business processes and practices. Our strategy is to be a navigator for our clients as they ideate, plan and execute their journey to a digital future, to help them ‘navigate your next’.
We have embraced a four-pronged strategy to strengthen our relevance with clients and drive accelerated value creation :
• Scale Agile Digital
• Energize the core
• Re-skill our people
• Expand localization
We have organized our sales and marketing departments into teams that focus on specific geographies and industries, enabling us to customize our service offerings to our clients’ needs better. Our primary geographic markets are North America, Europe, Rest of the World, and India, which generated 60.4%, 23.7%, 12.7% and 3.2%, respectively, of our consolidated revenues in the year ended March 31, 2018. We serve clients in financial services; manufacturing; energy and utilities, communications and services; retail, consumer packaged goods and logistics; life sciences, healthcare and insurance; and hi-tech.
These financial statements are prepared in accordance with Indian Accounting Standards (Ind AS) under the historical cost convention on the accrual basis except for certain financial instruments which are measured at fair values, the provisions of the Companies Act, 2013 (‘the Act’) (to the extent notified) and guidelines issued by the Securities and Exchange Board of India (SEBI). The Ind AS are prescribed under Section 133 of the Act, read with Rule 3 of the Companies (Indian Accounting Standards) Rules, 2015, and relevant amendment rules issued thereafter.
Effective April 1, 2016, the Company has adopted all the Ind AS standards, and the adoption was carried out in
accordance with Ind AS 101, First-time adoption of Indian Accounting Standards, with April 1, 2015 as the transition date. The transition was carried out from the Indian Accounting Principles generally accepted in India as prescribed under Section 133 of the Act, read with Rule 7 of the Companies (Accounts) Rules, 2014 (IGAAP), which was the previous GAAP.
I. Industry structure and developmentsSoftware and computing technology is transforming businesses in every industry around the world in a profound and fundamental way. The continued reduction in the unit cost of hardware, the explosion of network bandwidth, advanced software technologies and technology-enabled-services are fueling the rapid digitization of business processes and information. The digital revolution is cascading across industries, redefining customer expectations, enabling disruptive market offerings and automating core processes. Traditional business models are being disrupted with digital and software-based business models. This disruption is characterized by personalized user experiences, innovative products and services, extreme cost performance and a disintermediation of the supply chain. Incumbent companies, to win amid this disruption, need to reinvent their business from the core to activate strong efficiency and productivity levers, reimagine the end consumer experience and create impact at scale.
Leveraging technologies and models of the digital era to both extend the value of existing investments and, in parallel, transform and future-proof businesses, is increasingly becoming a top strategic imperative for business leaders. From an IT perspective, the renewal translates to harnessing the efficiency of distributed cloud computing, enabling legacy systems for mobile and sensor access, extracting value out of digitized data, keeping systems relevant and optimizing the costs of building and running technology systems. As businesses look to new areas and new economics, new and intelligent systems are required to be built with next-generation technologies and with exponentially superior cost-benefit performance.
The fast pace of technology change and the need for technology professionals who are highly skilled in both traditional and digital technology areas are driving businesses to rely on third parties to realize their business transformation. Several technology solution and service providers have emerged over the years, offering different models for clients to consume their solution and service offerings :
• Niche technology consulting companies – who take on time-bound and limited-scope projects for their clients
• Global technology outsourcing companies – who leverage global talent pools to enable business transformation and systematically optimize the IT operations of clients
• Business process management firms – who leverage global talent pools to manage outsourced core business processes of their clients

84 | Management’s discussion and analysis Infosys Annual Report 2017-18
• Software firms – who provide licensed software that enable the automation of business processes
• Specialty platform and Software-as-a-Service companies – who provide utility-based models for clients to consume software features
• Data analytics companies – who specialize in designing, analyzing and reporting insights from the vast amount of data that corporations are collecting about their customers, operations and markets
• Internal IT departments of the companies themselves, which are usually a cost center for the corporation.
II. Financial condition
Sources of funds
1. Equity share capitalWe have one class of shares – equity shares of par value ` 5 each. Our authorized share capital is ` 1,200 crore, divided into 240 crore equity shares of ̀ 5 each. The issued, subscribed and paid-up capital is ̀ 1,092 crore as at March 31, 2018 and ` 1,148 crore as at March 31, 2017. The movement in share capital is on account of buyback of shares and shares issued during the year on exercise of stock options.
Share buybackThe Board, at its meeting on August 19, 2017, approved a proposal for the Company to buy back its fully paid-up equity shares of face value of ` 5 each from the eligible equity shareholders of the Company for an amount not exceeding ` 13,000 crore. The shareholders approved the said proposal of buyback of equity shares through the postal ballot that concluded on October 7, 2017. The buyback offer comprised a purchase of 11,30,43,478 equity shares aggregating 4.92% of the paid-up equity share capital of the Company at a price of ` 1,150 per equity share. The buyback was offered to all eligible equity shareholders (including those who became equity shareholders as on the record date by cancelling American Depositary Shares (ADSs) and withdrawing underlying equity shares) of the Company as on the record date (i.e. November 1, 2017) on a proportionate basis through the ‘tender offer’ route. The Company concluded the buyback procedures on December 27, 2017 and 11,30,43,478 equity shares were extinguished. The Company has utilized securities premium and general reserve for the buyback of its shares. In accordance with Section 69 of the Companies Act, 2013, the Company has created a Capital Redemption Reserve of ` 56 crore equal to the nominal value of the shares bought back as an appropriation from the general reserve.
2015 Stock Incentive Compensation PlanOn March 31, 2016, pursuant to the approval by the shareholders through postal ballot, the Board has been authorized to introduce, offer, issue and allot share-based incentives to eligible employees of the Company and its subsidiaries under the 2015 Stock Incentive Compensation Plan (‘the 2015 Plan’). The maximum number of shares under the 2015 Plan shall not exceed 2,40,38,883 equity shares. Out of this, 1,70,38,883 equity shares will be issued as RSUs at par value and 70,00,000 equity shares will be issued as
stock options at market price on the date of the grant. These instruments will generally vest over a period of four years and the Company expects to grant the instruments under the 2015 Plan over the period of four to seven years.
A controlled trust holds 1,08,01,956 and 1,12,89,514 shares, as of March 31, 2018 and March 31, 2017, respectively under the 2015 Plan, out of which 1,00,000 equity shares have been earmarked for welfare activities of the employees.
The following is the summary of grants made during fiscals 2018 and 2017 under the 2015 Plan :
Particulars Fiscal 2018 Fiscal 2017RSU Salil Parekh, CEO & MD - (Refer to Note 1) 1,13,024 –U.B. Pravin Rao, COO 27,250 –Dr. Vishal Sikka(a) 2,70,224 1,20,700Other KMP(b) 2,73,100 2,47,250Employees other than KMP 15,97,010 25,06,740 22,80,608 28,74,690ESOP U.B. Pravin Rao, COO 43,000 –Dr. Vishal Sikka(a) 3,30,525 –Other KMP(b) 44,450 5,02,550Employees other than KMP 73,600 7,03,300 4,91,575 12,05,850Incentive units – cash-settled Other employees 50,040 1,12,210 50,040 1,12,210Total grants 28,22,223 41,92,750
(a) Upon Dr. Vishal Sikka’s resignation from the roles of the Company, the unvested RSUs and ESOPs have been forfeited.
(b) Refer to Note 2.23, Related party transactions in both the standalone and consolidated financial statements for details on resignation of certain KMP.
Notes :1. Pursuant to the approval of the shareholders through a postal ballot on
February 20, 2018, Salil Parekh (CEO & MD) is eligible to receive the following under the 2015 Plan,a) an annual grant of RSUs of fair value ` 3.25 crore which will vest
over time in three equal annual installments upon completion of each year of service from the respective grant date
b) a one-time grant of RSUs of fair value ` 9.75 crore which will vest over time in two equal annual installments upon completion of each year of service from the grant date, and
c) an annual grant of performance-based RSUs of fair value ` 13 crore which will vest after completion of three years, the first of which concludes on March 31, 2021, subject to the achievement of performance targets set by the Board or its committee.
The Board, based on the recommendations of the nomination and remuneration committee, approved on February 27, 2018, the annual time-based grant for fiscal 2018 of 28,256 RSUs and a one-time, time-based grant of 84,768 RSUs. The grants were made effective February 27, 2018. Though the annual time-based grants for the remaining employment term have not been granted as of March 31, 2018, in accordance with Ind AS 102, Share-based payments, the Company has recorded employment stock compensation expense.
2. The RSUs and stock options would vest generally over a period of four years and shall be exercisable within the period as approved by the committee. The exercise price of the RSUs will be equal to the par value of the shares and the exercise price of the stock options would be the market price as on the date of grant.

Management’s discussion and analysis | 85 Infosys Annual Report 2017-18
3. During the years ended March 31, 2018 and March 31, 2017, the Company recorded an aggregate employee stock compensation expense of ` 72 crore and ` 107 crore, respectively on a standalone basis and ` 84 crore and ` 117 crore, respectively on a consolidated basis, in the Statement of Profit and Loss. This comprises expense pertaining to CEO, COO, other KMP and other employees. This includes a reversal of stock compensation cost of ` 35 crore towards forfeiture of stock incentives granted to Dr. Vishal Sikka upon his resignation.
For additional information of the Company’s stock incentive compensation plans, refer to Notes 2.10 and 2.11, Employees’ Stock Options Plans of the standalone and consolidated financial statements, respectively in this Annual Report.
2. Other equity
A. Reserves and surplus
Securities premium reserveOn a standalone basis, the balance as at March 31, 2018 and March 31, 2017 amounted to ` 28 crore and ` 2,208 crore, respectively. On a consolidated basis, the balance was ` 36 crore and ` 2,216 crore as at March 31, 2018 and March 31, 2017, respectively. Decrease in securities premium on both standalone and consolidated basis is on account of ` 2,206 crore utilized for buyback of shares and ` 46 crore for transaction costs related to buyback, which is offset by an increase of ` 67 crore on account of transfer from stock options outstanding account upon exercise and `5 crore pertaining to amounts received on exercise of ESOPs.
Retained earningsOn a standalone basis, the balance retained earnings as at March 31, 2018 was ` 55,671 crore after providing ` 7,500 crore for final dividend for fiscal 2017 and interim dividend for fiscal 2018, including dividend tax thereon. Further, Special Economic Zone (SEZ) Re-investment Reserve of ` 1,559 crore (net) was transferred to SEZ Re-investment Reserve net of utilization out of retained earnings during the year. The balance in retained earnings as at March 31, 2017 was ` 49,957 crore after providing ` 6,980 crore for final dividend for fiscal 2016 and interim dividend for fiscal 2017, including dividend tax thereon.
On a consolidated basis, the balance retained in the surplus as at March 31, 2018 was ` 58,477 crore, as compared to ` 52,882 crore in the previous year.
General reserveDuring the year, an amount of ` 1,382 crore was transferred to the general reserve from retained earnings on account of dividend appropriation, as compared to ` 1,579 crore in the previous year. Further, an amount of ` 10,738 crore was utilized for buyback of shares and ` 56 crore was transferred to Capital Redemption Reserve upon buyback in accordance with Section 69 of the Companies Act, 2013.
On a standalone basis, the balance in general reserve as at March 31, 2018 amounted to ` 1,677 crore (previous year ` 11,087 crore). On a consolidated basis, the balance as at March 31, 2018 amounted to ` 2,725 crore (previous year ` 12,135 crore).
Share options outstanding accountOn standalone and consolidated basis, the share options outstanding account amounted to ` 130 crore as at
March 31, 2018, as compared to ` 120 crore as at March 31, 2017. The movement is mainly on account of expense related to share-based payment of employees offset by the exercise of stock options during the year.
Special Economic Zone Re-investment ReserveDuring the year, a net amount of ` 1,559 crore and ` 1,583 crore of SEZ Re-investment Reserve was created for standalone and consolidated basis, respectively. This reserve has been created out of the profits of eligible SEZ units in terms of the provisions of Section 10AA(1)(ii) of the Income-tax Act, 1961. This reserve should be utilized by the Company for acquiring new plant and machinery for the purpose of its business in the terms of Section 10AA(2) of the Income-tax Act, 1961.
Capital reserveOn a standalone and consolidated basis, the balance as at March 31, 2018 amounted to ` 54 crore, which is the same as the previous year.
Business transfer adjustment reserveProfit on transfer of business between entities under common control is taken to business transfer adjustment reserve. On a standalone basis, the balance as at March 31, 2018 and March 31, 2017 is ` 3,219 crore and ` 3,448 crore, respectively. The movement of ` 229 crore during the year is on account of the business transfer agreement entered into with Noah Consulting LLC whereby net assets of ` 37 crore were taken over upon transfer of a business for a consideration of ` 266 crore. Refer to Note 2.3.1 of the standalone financial statements for further details.
Capital Redemption ReserveDuring the year ended March 31, 2018, an amount of ` 56 crore was transferred both on standalone and consolidated basis to Capital Redemption Reserve upon buyback of shares, in accordance with Section 69 of the Companies Act, 2013.
B. Other comprehensive income
Equity instruments through other comprehensive incomeOn a standalone and consolidated basis, as of March 31, 2018, there was an accumulated gain of ̀ 2 crore and as of March 31, 2017, accumulated loss of ̀ 5 crore in the equity instruments through other comprehensive income. This was on account of fair valuation of equity investments for which the Company has made an irrevocable election to present the subsequent changes in fair value in other comprehensive income.
Effective portion of cash flow hedgesThe Company designates certain foreign exchange forward and options contracts as cash flow hedges to mitigate the risk of foreign exchange exposure on highly probable forecast cash transactions.
When a derivative is designated as a cash flow hedging instrument, the effective portion of changes in the fair value of the derivative is recognized in other comprehensive income and accumulated in the cash flow hedging reserve, and is transferred to the Statement of Profit and Loss upon the occurrence of the related forecasted transaction.

86 | Management’s discussion and analysis Infosys Annual Report 2017-18
On a standalone and consolidated basis, the balance as at March 31, 2018 is less than ` 1 crore as compared to ` 39 crore, net of tax in the previous year.
Exchange differences on translating the financial statements of a foreign operationOn a consolidated basis, the balance as at March 31, 2018 amounted to ̀ 779 crore, whereas the balance as at March 31, 2017 was ` 458 crore.
Other items of other comprehensive incomeOther items of other comprehensive income consists of re-measurement gains / losses on our defined benefit plans and fair value changes on investments, net of taxes.
On a standalone basis, there was an actuarial gain, net of taxes, of ` 52 crore during the current year, as compared to an actuarial loss, net of taxes of ` 42 crore during the previous year. On a consolidated basis, there was an actuarial gain, net of taxes, of ` 55 crore during the current year, as compared to an actuarial loss, net of taxes, of ` 45 crore during the previous year.
Total equity attributable to equity holders of the CompanyOn a standalone basis, the total equity attributable to equity holders of the Company has reduced to ` 63,502 crore as at March 31, 2018 compared to ` 68,017 crore as at March 31, 2017.
On a consolidated basis, the total equity attributable to equity holders of the Company has reduced to ` 64,923 crore as at March 31, 2018 from ̀ 68,982 crore as at March 31, 2017. The reduction was mainly on account of buyback and dividend. Consequently, the book value per share decreased to ` 297 as at March 31, 2018 compared to ` 300 as at March 31, 2017, on a consolidated basis.
Application of funds
3. Property, plant and equipment
Additions to gross block – standaloneDuring the year, we incurred capital expenditure of ` 1,823 crore to our gross block, comprising ` 1,422 crore on infrastructure, ` 396 crore in computer equipment and ` 5 crore on vehicles. Our infrastructure investments comprised ` 789 crore on buildings, ̀ 250 crore on plant and machinery, ` 136 crore to acquire 270.9 acres of land in Kolkata, Tumakuru, Mysuru, Chennai, Hiriyur and Bengaluru, ` 121 crore on furniture and fixtures,` 78 crore on office equipment, and ` 48 crore on leasehold improvements.
During the previous year, we incurred capital expenditure of ` 1,817 crore to our gross block, comprising ` 1,157 crore on infrastructure, ` 654 crore in computer equipment, and ` 6 crore on vehicles. Our infrastructure investments comprised ` 310 crore on buildings, ̀ 308 crore on plant and machinery, ` 169 crore on furniture and fixtures, ` 144 crore to acquire 13.3 acres of land in Chennai, Gurugram, Hyderabad and Bengaluru, ` 122 crore on office equipment and ` 104 crore on leasehold improvements.
Additions to gross block – consolidatedDuring the year, we incurred capital expenditure of ` 1,955 crore to our gross block, comprising ` 1,479 crore on infrastructure, ` 471 crore in computer equipment and ` 5 crore on vehicles. Our infrastructure investments comprised ` 789 crore on buildings, ̀ 264 crore on plant and equipment, ` 136 crore to acquire 270.9 acres of land in Kolkata, Tumakuru, Mysuru, Chennai, Hiriyur and Bengaluru, ` 130 crore on furniture and fixtures, ̀ 86 crore on office equipment and ` 74 crore on leasehold improvements.
During the previous year, we incurred capital expenditure of ` 2,799 crore to our gross block, comprising ` 1,991 crore on infrastructure, ` 800 crore in computer equipment and ` 8 crore on vehicles. Our infrastructure investments comprised ` 981 crore on buildings, ̀ 313 crore on plant and equipment, ` 224 crore on leasehold improvements, ` 191 crore on furniture and fixtures, ` 144 crore to acquire 13.3 acres of land in Chennai, Gurugram, Hyderabad and Bengaluru and ` 138 crore on office equipment.
Deductions to gross block – standaloneDuring the year, we deducted ` 84 crore from the gross block on the disposal of various assets as against ` 316 crore in the previous year.
Deductions to gross block – consolidatedDuring the year, we deducted ` 153 crore from the gross block on the disposal of various assets as against ` 490 crore in the previous year.
Further, we have reclassified various assets with a gross block of ` 68 crore under assets held for sale. Refer to Note 2.25 of the consolidated financial statements for further details.
Capital expenditure commitmentsOn a standalone basis, we have a capital expenditure commitment of ` 1,405 crore as at March 31, 2018, as compared to ` 1,094 crore as at March 31, 2017. On a consolidated basis, we have a capital expenditure commitment of ` 1,452 crore as at March 31, 2018, as compared to ` 1,149 crore as at March 31, 2017.
4. Goodwill and other intangible assetsOn a consolidated basis, carrying value of goodwill as on March 31, 2018 is ` 2,211 crore, which includes additions to goodwill amounting to ̀ 35 crore on account of acquisition of Brilliant Basics Holdings Limited, reduction of ` 1,609 crore on account of goodwill reclassified under assets held for sale and increase of ` 133 crore on account of translation. During the previous year, carrying value of goodwill was ̀ 3,652 crore.
On a consolidated basis, carrying value of intangible assets as on March 31, 2018 is ` 247 crore whereas on March 31, 2017, it was ̀ 776 crore. These primarily consist of intangible assets acquired through business combinations, stated at cost less accumulated amortization. Intangible assets amounting to ` 323 crore (net) has been reclassified under assets held for sale. Refer to Note 2.25 of the consolidated financial statements for further details.

Management’s discussion and analysis | 87 Infosys Annual Report 2017-18
5. Financial assets
A. Investments
Subsidiaries and associateDuring the year, we have invested additionally in our subsidiaries, for the purpose of operations and expansion.
Subsidiary In foreign currency In ` croreInfosys China USD 15.0 million 97 Infosys Shanghai USD 11.6 million 74 Brilliant Basics Holdings Limited GBP 3.4 million 29 Panaya Inc. USD 6.0 million 38 Infosys Arabia Limited SAR 1.2 million 2
Investment in equity instruments of subsidiaries are carried at cost as per Ind AS 27, Separate Financial Statements.
A business transfer agreement was entered into with Noah Consulting LLC, a wholly-owned subsidiary to transfer the business of Noah to the Company for a consideration of US$ 41 million (`266 crore) and the transfer was effective October 25, 2017. The transaction was between a holding company and a wholly-owned subsidiary and therefore, was accounted for at carrying values and it didn’t have any impact on consolidated financial statements.
During the current year, Infosys Nova Holdings LLC, a wholly-owned subsidiary of Infosys Limited has written down the entire carrying value of its investment in its associate DWA Nova LLC. Consequently, Infosys has written down the entire carrying value of the investment in its subsidiary Infosys Nova Holdings LLC, amounting to ` 94 crore on a standalone basis.
During the year ended March 31, 2018, EdgeVerve repaid debentures amounting to ` 349 crore.
On April 13, 2018, the Company entered into a definitive agreement to acquire WongDoody Holding Company Inc., a US-based creative and consumer insights agency for a total consideration of up to US$75 million (approximately `489 crore) including contingent consideration and retention payouts, subject to regulatory approvals and fulfillment of closing conditions.
Refer to Annexure 1 to the Board’s report for the statement pursuant to Section 129(3) of the Companies Act, 2013 for the summary of the financial performance of our subsidiaries. The audited financial statements and related information of subsidiaries will be available on our website, www.infosys.com.
Other investmentsWe have an innovation fund with an outlay of US$ 500 million to support the creation of a global ecosystem of strategic partners. Out of the total outlay, US$ 53 million has been invested as of March 31, 2018 and we have an uncalled capital commitment of US$ 12 million. The carrying value of such investments as on March 31, 2018 was US$ 31 million on account of write-down of investment in DWA Nova amounting to US$ 11 million (` 71 crore) and on account of changes in fair value.
As per Ind AS 109, Financial Instruments, all financial assets and liabilities are recognized at fair value on initial recognition,
except for trade receivables which are initially measured at transaction price. Financial assets are subsequently measured at amortized cost, fair value through profit or loss or fair value through other comprehensive income as the case may be.
For additional disclosures on financial assets including fair value hierarchy and financial risk management, refer to Note 2.3 of the standalone financial statements and Note 2.4 of the consolidated financial statements.
Our investments comprise mutual funds, fixed maturity plan securities, tax-free bonds, non-convertible debentures, certificates of deposit and commercial paper. Certificates of deposit represent marketable securities of banks and eligible financial institutions for a specified time period with high credit rating by domestic credit rating agencies. Investments made in non-convertible debentures represent debt instruments issued by government-aided institutions.
B. Trade receivables and unbilled revenuesOn a standalone basis, trade receivables amounted to ` 12,151 crore and ` 10,960 crore as of March 31, 2018 and March 31, 2017, respectively, and unbilled revenues amounted to ` 3,573 crore and ` 3,200 crore as of March 31, 2018 and March 31, 2017, respectively.
On a consolidated basis, trade receivables amounted to ` 13,142 crore and ` 12,322 crore as of March 31, 2018 and March 31, 2017, respectively, and unbilled revenues amounted to ` 4,261 crore and ` 3,648 crore as of March 31, 2018 and March 31, 2017, respectively.
Trade receivables and unbilled revenue are typically unsecured and are derived from revenue earned from customers. On a consolidated basis, Days Sales Outstanding was 67 days for the year ended March 31, 2018, compared to 68 days in the previous year.
As per Ind AS 109, the Group uses Expected Credit Loss (ECL) model to assess the impairment loss or gain. The Group uses a provision matrix to compute the expected credit loss allowance for trade receivables and unbilled revenues. The provision matrix takes into account available external and internal credit risk factors, such as credit default swap quotes, credit ratings from international credit rating agencies and the Group’s historical experience for customers.
The movement in ECL during fiscals 2018 and 2017 is as follows :
in ` crore
Particulars Standalone Consolidated2018 2017 2018 2017
Opening balance 379 249 411 289Impairment loss recognized 18 135 34 132Amount written off (3) (1) (5) (1)Reclassified under held for sale – – (1) –Translation difference 7 (4) 10 (9)Closing balance 401 379 449 411

88 | Management’s discussion and analysis Infosys Annual Report 2017-18
C. Cash and cash equivalentsOn a standalone basis, balance in current and deposit accounts stood at ` 10,789 crore as at March 31, 2018, as compared to ` 12,222 crore as at March 31, 2017. Deposits with financial institutions stood at ` 5,981 crore as at March 31, 2018, as compared to ` 6,931 crore as at March 31, 2017.
On a consolidated basis, balance in current and deposit accounts stood at ` 13,168 crore as at March 31, 2018, as compared to ` 14,889 crore as at March 31, 2017. Deposits with financial institutions stood at ` 6,650 crore as at March 31, 2018, as compared to ` 7,736 crore as at March 31, 2017. Cash and cash equivalents of ` 53 crore is included under assets held for sale as at March 31, 2018. Refer to Note 2.25 of the consolidated financial statements for further details.
Our cash and cash equivalents comprise deposits with banks and financial institutions with high credit-ratings assigned by international and domestic credit-rating agencies which can be withdrawn at any point of time without prior notice or penalty on principal. These cash and cash equivalents include a restricted cash balance. On a standalone basis, we have a restricted cash balance of ` 375 crore as at March 31, 2018, as compared to ` 411 crore as at March 31, 2017 and on a consolidated basis, the same was ` 533 crore as at March 31, 2018, as compared to ` 572 crore as at March 31, 2017. These restrictions are primarily on account of balances held in unpaid dividend bank accounts, bank balances held as margin money deposit and cash balances held by irrevocable trusts controlled by us. The bank balances in India include both rupee accounts and foreign currency accounts. The bank balances in overseas accounts are maintained to meet the expenditure of the overseas operations and regulatory requirements.
D. LoansThe details of loans are as follows :
in ` crore
Particulars Standalone Consolidated2018 2017 2018 2017
Non-currentLoans to employees 19 5 36 29CurrentLoans to subsidiaries 185 69 – –Loans to employees 208 241 239 272Total 412 315 275 301
We provide personal loans and salary advances to employees, who are not executive officers or directors. Of the total loans and advances of `275 crore given to employees on a consolidated basis, ` 239 crore is recoverable in 12 months and ` 36 crore is recoverable in 12-24 months from March 31, 2018. The annual rate of interest for these loans vary from 0% to 10%.
Loans to subsidiaries as at March 31, 2018, includes ` 104 crore to Infosys Consulting Holding AG, ̀ 73 crore to Infosys China and ̀ 8 crore given to Brilliant Basics Holdings Limited. As at March 31, 2017, ` 69 crore was given to Infosys China.
E. Other financial assetsThe details of other financial assets are as follows :
in ` crore
Particulars Standalone Consolidated2018 2017 2018 2017
Non-currentSecurity deposits 48 81 53 86 Rental deposits 129 135 171 175 Restricted deposits – – 60 48 CurrentSecurity deposits 2 2 9 10 Rental deposits 6 2 13 9 Restricted deposits 1,415 1,309 1,535 1,416 Unbilled revenues 3,573 3,200 4,261 3,648 Interest accrued but not due 739 514 766 576 Foreign currency forward and options contracts 16 268 16 284 Others 155 108 84 37 Total 6,083 5,619 6,968 6,289
Restricted deposits represent amounts deposited with financial institutions to settle employee-related obligations as and when they arise during the normal course of business.
Unbilled revenues comprise costs and earnings in excess of billings.
Interest accrued but not due has increased on account of increase in tenure of fixed deposits as compared to previous year partially offset by reduction due to softening of interest rates in India and reduction in investible base as a result of the Capital Allocation Policy of the Company.
5. Other assetsin ` crore
Particulars Standalone Consolidated2018 2017 2018 2017
Non-currentCapital advances 420 562 421 600Prepaid gratuity 23 56 43 79Deferred contract cost 262 283 262 284Prepaid expenses 49 95 111 96Withholding taxes and others 1,407 – 1,428 –CurrentPayment to vendors for supply of goods 103 87 119 131Deferred contract cost 44 74 44 78Prepaid expenses 449 387 472 441Withholding taxes and others 843 1,665 1,032 1,886Total 3,600 3,209 3,932 3,595
Capital advances represent the amount paid in advance on capital expenditure.

Management’s discussion and analysis | 89 Infosys Annual Report 2017-18
Withholding and other tax receivables represent transaction taxes paid in various domestic and overseas jurisdictions which are recoverable.
Deferred contract costs are upfront costs incurred for the contract and amortized over the term of the contract.
6. Deferred tax assets / liabilitiesin ` crore
Particulars Standalone Consolidated2018 2017 2018 2017
Deferred tax assets, net 1,128 346 1,282 540Deferred tax liabilities, net 505 – 541 207
Deferred tax assets primarily comprise deferred taxes on property, plant and equipment, compensated absences, trade receivables, credits related to branch profit taxes, post-sales client support and others. Deferred tax liability primarily comprises branch profit taxes, deferred tax on intangible assets and others.
Net deferred tax comprising of deferred tax assets less deferred tax liabilities has increased primarily on creation of credit pertaining to deferred tax liability on branch profits arising out of US tax reforms of `155 crore and on account of deferred tax liability of `53 crore being reclassified under asset held for sale.
7. Income tax assets / liabilitiesin ` crore
Particulars Standalone Consolidated2018 2017 2018 2017
Income tax assets (net) 5,710 5,454 6,070 5,716Income tax liabilities (net) 1,976 3,762 2,043 3,885
Our net profit earned from providing software development and other services outside India is subject to tax in the country where we perform the work. Most of our taxes paid in countries other than India can be claimed as a credit against our tax liabilities in India.
On account of the conclusion of Advance Pricing Agreement (APA) with the US Internal Revenue Service (IRS) income tax provision pertaining to prior periods has been reversed resulting in a reduction in income tax liabilities.
8. Financial liabilitiesThe details of trade payables and other financial liabilities are as follows :
in ` crore
Particulars Standalone Consolidated2018 2017 2018 2017
Non-currentAccrued compensation to employees – – – 30Compensated absences 42 – 48 –
Particulars Standalone Consolidated2018 2017 2018 2017
Payable for acquisition of business – Contingent consideration 13 40 13 40CurrentTrade payables 738 269 694 367Unpaid dividends 22 17 22 17Accrued compensation to employees 2,048 1,404 2,509 1,881Accrued expenses 1,776 2,013 2,452 2,585Retention monies 63 153 132 220Payable for acquisition of business – Contingent consideration 41 45 41 45Capital creditors 148 36 155 48Compensated absences 1,218 1,142 1,421 1,359Other payables 184 244 33 47Foreign currency forward and options contracts 40 2 42 2Payable by controlled trusts – – 139 145Total 6,333 5,365 7,701 6,786
Liabilities for accrued compensation to employees include the provision for bonus, incentives and retention bonus payable to the staff. Liabilities for accrued compensation to employees have increased due to increase in compensation and higher variable payouts.
Payable for acquisition of business represents contingent consideration payable to the sellers of Kallidus and Brilliant Basics depending on the achievement of certain financial targets. During the year ended March 31, 2018, a contingent consideration of ̀ 45 crore was paid to the sellers of Kallidus.
Accrued expenses represent amounts accrued for other operational expenses. Retention monies represent monies withheld on contractor payments, pending final acceptance of their work.
Compensated absences are towards our liability for leave encashment.
Unpaid dividends represent dividends paid, but not claimed by shareholders, and are represented by a bank balance of an equivalent amount.
9. Other liabilitiesin ` crore
Particulars Standalone Consolidated2018 2017 2018 2017
Non-currentDeferred income – government grant on land use rights – – 44 41

90 | Management’s discussion and analysis Infosys Annual Report 2017-18
Particulars Standalone Consolidated2018 2017 2018 2017
Deferred rent 117 – 151 –Accrued gratuity – – 28 –Deferred income 36 42 36 42Current Unearned revenue 1,887 1,320 2,295 1,777Client deposits 32 – 38 –Withholding taxes and others 1,029 1,027 1,240 1,226Deferred income – government grant on land use rights – – 1 1Accrued gratuity – – – 1Deferred rent 24 2 32 2Total 3,125 2,391 3,865 3,090
Unearned revenue primarily comprises advance client billings in excess of costs and earnings are classified as unearned revenue.
Withholding and other taxes payable represent local taxes payable in various countries in which we operate.
Deferred rent represents liability on account of straight-lining of operating lease payments over the lease term.
10. ProvisionsProvision for post-sales client support is towards likely cost for providing client support to fixed-price and fixed-timeframe contracts. On a standalone basis, these provisions
III. Results of our operationsThe function-wise classification of the standalone Statement of Profit and Loss is as follows :
in ` crore
Particulars Year ended March 31, 2018 % 2017 %
Revenue from operations 61,941 100.0 59,289 100.0Cost of sales 39,138 63.2 37,057 62.5Gross profit 22,803 36.8 22,232 37.5Operating expenses Selling and marketing expenses 2,763 4.5 2,728 4.6General and administration expenses 3,562 5.7 3,628 6.1Total operating expenses 6,325 10.2 6,356 10.7Operating profit 16,478 26.6 15,876 26.8Impairment loss on assets held for sale 589 1.0 – –Other income, net 4,019 6.5 3,062 5.1Profit before tax 19,908 32.1 18,938 31.9Tax expense 3,753 6.0 5,120 8.6Profit for the year 16,155 26.1 13,818 23.3
The function-wise classification of the consolidated Statement of Profit and Loss is as follows :in ` crore
Particulars Year ended March 31,2018 % 2017 %
Revenue from operations 70,522 100.0 68,484 100.0Cost of sales 45,130 64.0 43,253 63.2Gross profit 25,392 36.0 25,231 36.8Operating expenses Selling and marketing expenses 3,560 5.1 3,591 5.2
amounted to ` 436 crore as at March 31, 2018, as compared to ` 350 crore as at March 31, 2017. On a consolidated basis, provision for post-sales client support amounted to ` 492 crore as at March 31, 2018, as compared to ` 405 crore as at March 31, 2017.
11. Assets held for saleDuring the quarter ended March 31, 2018, on conclusion of a strategic review of its portfolio of businesses, the Company initiated identification and evaluation of potential buyers for its subsidiaries, Kallidus and Skava (together referred to as ‘Skava’) and Panaya (collectively referred to as ‘the disposal group’). The Company anticipates completion of the sale by March 2019 and accordingly, assets amounting to ` 2,060 crore and liabilities amounting to ` 324 crore in respect of the disposal group have been reclassified and presented under ‘held for sale’, in the consolidated financial statements. The disposal group does not constitute a separate major component of the Company and therefore, has not been classified as ‘discontinued operations’.
In the standalone financial statements of the Company, investments amounting to ` 1,525 crore in respect of these subsidiaries have been reclassified under ‘held for sale’. On reclassification, these investments have been measured at the lower of carrying amount and fair value less cost to sell and consequently, an impairment loss of ` 589 crore in respect of Panaya has been recognized in the standalone Statement of Profit and Loss for the year ended March 31, 2018. Refer to Note 2.25 of the consolidated financial statements and Note 2.26 of the standalone financial statements.

Management’s discussion and analysis | 91 Infosys Annual Report 2017-18
Particulars Year ended March 31,2018 % 2017 %
General and administration expenses 4,684 6.6 4,739 6.9Total operating expenses 8,244 11.7 8,330 12.2Operating profit 17,148 24.3 16,901 24.7Other income, net 3,193 4.5 3,080 4.4Profit before non-controlling interests / share in net loss of associate 20,341 28.8 19,981 29.1Share in net loss of associate including impairment (71) (0.1) (30) 0.0Profit before tax 20,270 28.7 19,951 29.1Tax expense 4,241 6.0 5,598 8.1Profit after tax 16,029 22.7 14,353 21.0Non-controlling interests – – – –Profit for the year 16,029 22.7 14,353 21.0
1. RevenueThe growth in our revenues in fiscal 2018 from fiscal 2017 is as follows :
in ` crore
Particulars Standalone Consolidated2018 2017 % change 2018 2017 % change
Revenue 61,941 59,289 4.5 70,522 68,484 3.0
Revenue growth was attributable to a number of factors, including an increase in the volume, as well as an expansion in the solutions that we provide to our clients. We added 283 new customers (gross) during fiscal 2018 as compared to 321 new customers (gross) during fiscal 2017. For fiscals 2018 and 2017, 98.5% and 97.3%, respectively, of our revenues came from repeat business, which we define as revenues from a client that also contributed to our revenues during the prior fiscal year.
Of the total revenues for the year ended March 31, 2018, on a standalone basis, approximately 97.0% were export revenues whereas 3.0% were domestic revenues, which is the same as the previous year. On a consolidated basis, approximately 96.8% were export revenues whereas 3.2% were domestic revenues, which is the same as the previous year.
Effective fiscal 2018, the Company defined ‘digital revenue’ (refer to ‘Strategy’ section of Board’s report for further details). Digital revenue during fiscal 2018 amounted to ̀ 17,992 crore (US$ 2,791 million) 25.5% of the total revenues.
Our revenues are generated primarily from services provided either on fixed-price or on fixed-timeframe or on time-and-material basis. Revenues from software services on fixed-price and fixed-timeframe contracts are recognized as per the percentage-of-completion method. On time-and-material contracts, revenue is recognized as related services that are rendered. Revenue from the sale of user licenses for software applications is recognized on transfer of the title in the user license, except in multiple arrangement contracts, which require significant implementation services, where revenue is recognized as per the percentage-of-completion method.
Our revenues are segmented into onsite and offshore revenues. Onsite revenues are for those services which are performed at client locations or at our development centers outside India, while offshore revenues are for services which are performed at our global development centers in India.
The percentage of our revenues by location from billable IT services professionals for fiscals 2018 and 2017 is as follows :
in %
Particulars Standalone Consolidated2018 2017 2018 2017
Onsite revenue 53.1 54.4 55.4 56.8Offshore revenue 46.9 45.6 44.6 43.2Total 100.0 100.0 100.0 100.0
The proportion of work performed at our facilities and at client sites varies from period to period. The services performed onsite typically generate higher revenues per capita, but at lower gross margins in percentage as compared to the services performed at our own facilities in India. Therefore, any increase in the onsite effort impacts our margins.
The details of billable hours expended for onsite and offshore on our IT services professionals for fiscals 2018 and 2017 are as follows :
in %
Particulars Standalone Consolidated2018 2017 2018 2017
Onsite effort 27.5 27.5 29.3 29.8Offshore effort 72.5 72.5 70.7 70.2Total 100.0 100.0 100.0 100.0
The utilization rates of billable IT services professionals are as follows :
in %
Particulars Standalone Consolidated2018 2017 2018 2017
Including trainees 81.8 77.8 81.2 77.6Excluding trainees 85.2 82.1 84.6 81.7
IT services, wherever mentioned above, represent services excluding business process management services and products and platforms business.

92 | Management’s discussion and analysis Infosys Annual Report 2017-18
The break-up of revenues from software services and products is as follows :
in ` crore
Particulars Standalone Consolidated2018 2017 2018 2017
Software services 61,910 59,257 68,460 66,383Software products 31 32 2,062 2,101Total revenue from operations 61,941 59,289 70,522 68,484
Refer to the ‘Segmental profitability’ section in this report for more details on the analysis of segment revenues.
Revenues and gross profits are also affected by employee utilization rates. We define employee utilization as the proportion of total billed person months to total available person months, excluding sales, administrative and support personnel.
Revenue per employee has increased from US$ 51,375 in fiscal 2017 to US$ 54,602 in fiscal 2018 on a consolidated basis.
2. Expenditure
Cost of sales – standalonein ` crore
Particulars 2018 % 2017 % Growth %Revenues 61,941 100.0 59,289 100.0 4.5Cost of sales
Salaries and bonus 29,266 47.2 27,818 46.9 5.2Cost of technical sub-contractors 5,494 8.9 4,809 8.1 14.2Travelling cost 1,100 1.8 1,234 2.1 (10.9)Cost of software packages for own use 772 1.2 728 1.2 6.0Third-party items bought for service delivery to clients 495 0.8 506 0.9 (2.0)Communication cost 114 0.2 139 0.2 (18.0)Operating lease payments 171 0.3 147 0.3 16.3Provisions for post-sales client support 127 0.2 84 0.1 51.2Consultancy and professional charges 5 0.0 – – – Depreciation and amortization expenses 1,408 2.3 1,331 2.3 5.8Repairs and maintenance 238 0.4 261 0.4 (8.8)Others (52) (0.1) – – –
Total cost of sales 39,138 63.2 37,057 62.5 5.6
Cost of sales – consolidatedin ` crore
Particulars 2018 % 2017 % Growth %Revenues 70,522 100.0 68,484 100.0 3.0Cost of sales
Salaries and bonus 34,670 49.2 33,471 48.9 3.6 Cost of technical sub-contractors 4,296 6.1 3,833 5.6 12.1 Travelling cost 1,451 2.1 1,649 2.4 (12.0)Cost of software packages for own use 876 1.2 793 1.2 10.5 Third-party items bought for service delivery to clients 983 1.4 802 1.2 22.6 Consultancy and professional charges 50 0.1 28 0.1 78.6 Communication cost 225 0.3 260 0.4 (13.5)Operating lease payments 319 0.5 307 0.4 3.9 Provisions for post-sales client support 142 0.2 80 0.1 77.5 Depreciation and amortization expenses 1,863 2.6 1,703 2.5 9.4 Repairs and maintenance 300 0.4 305 0.4 (1.6)Others (45) (0.1) 22 – –
Total cost of sales 45,130 64.0 43,253 63.2 4.3
On a standalone basis, cost of sales was 63.2% of revenues, compared to 62.5% during the previous year. On a consolidated basis, cost of sales was 64.0% of revenues, compared to 63.2% during the previous year. The cost of efforts, comprising employee cost and cost of technical sub-contractors, has increased as a percentage of revenue from 55.0% in fiscal 2017 to 56.1% in fiscal 2018 on a standalone basis and from 54.5% in fiscal 2017 to 55.3% in fiscal 2018 on a consolidated basis, due to increase in compensation, higher variable payouts and to meet primarily the requirement of niche skill sets in certain onsite projects.
The cost of sales for fiscal 2018 was impacted by rupee appreciation, increase in compensation and higher variable pay which was partially offset by benefits from cross-currency movements and improved operational parameters like utilization, onsite mix, reduced travel cost and other cost optimization initiatives.

Management’s discussion and analysis | 93 Infosys Annual Report 2017-18
On a standalone basis, the cost of technical sub-contractors included ` 1,938 crore towards the purchase of services from subsidiaries for the year ended March 31, 2018, as against ` 1,795 crore in the previous year. The details of such related party transactions are available in Note 2.23 to the standalone financial statements in the Annual Report.
On a standalone basis, the travelling cost representing the cost of travel included in cost of sales constituted approximately 1.8% and 2.1% of total revenue for the years ended March 31, 2018 and March 31, 2017, respectively. On a consolidated basis, travelling cost for cost of sales constituted approximately 2.1% and 2.4% of total revenue for the years ended March 31, 2018 and March 31, 2017, respectively.
Cost of software packages primarily represents the cost of software packages and tools procured for our internal use. These packages and tools enhance the quality of our services. On both standalone and consolidated basis, the cost of software packages was 1.2% of the revenues which is the same as previous year.
Third-party items bought for service delivery to clients include software and hardware items. The increase in third-party items bought for service delivery to clients has been primarily in infrastructure services.
A major part of our revenues is generated from software development centers in India. We use high-end communication tools to establish real-time connections with our clients. On a standalone basis, the communication costs represent approximately 0.2% of the revenues for the years ending March 31, 2018 which is the same as the previous year. On a consolidated basis, the communication costs represent approximately 0.3% and 0.4% of revenues for the years ended March 31, 2018 and March 31, 2017, respectively.
On a standalone basis, the operating lease payments represent 0.3% of revenues for each of the years ended March 31, 2018 and March 31, 2017. On a consolidated basis, the operating lease payments represent approximately 0.5% and 0.4% of revenues for the years ended March 31, 2018 and March 31, 2017, respectively.
On a standalone basis, the provision for post-sales client support is ` 127 crore and ` 84 crore for the years ended March 31, 2018 and March 31, 2017, respectively. On a consolidated basis, the provision for post-sales client support was ` 142 crore and ` 80 crore for the years ended March 31, 2018 and March 31, 2017, respectively.
On a standalone basis, we provided ` 1,408 crore and ̀ 1,331 crore towards depreciation and amortization, representing 2.3% of total revenues each for the years ended March 31, 2018 and March 31, 2017.
On a consolidated basis, we provided ` 1,863 crore and ` 1,703 crore towards depreciation and amortization, representing 2.6% and 2.5% of total revenues, for the years ended March 31, 2018 and March 31, 2017, respectively.
On a standalone and consolidated basis, repairs and maintenance represent approximately 0.4% of the revenues which is the same as the previous year.
Gross profitOn a standalone basis, the gross profit during the year was ` 22,803 crore, representing 36.8% of revenues,
compared to ` 22,232 crore, representing 37.5% of revenues in the previous year.
On a consolidated basis, the gross profit during the year was ` 25,392 crore, representing 36.0% of revenues, compared to ` 25,231 crore, representing 36.8% of revenues in the previous year.
Selling and marketing expensesSelling and marketing expenses primarily comprise employee costs. On a standalone basis, we incurred selling and marketing expenses at 4.5% of our total revenues in the year ended March 31, 2018, compared to 4.6% of our total revenues in the year ended March 31, 2017. Selling and marketing expenses primarily comprise employee costs, travelling costs and branding and marketing costs. All other expenses, excluding employee costs, amounted to 1.0% of revenues during the year, which is the same as the previous year.
On a consolidated basis, we incurred selling and marketing expenses at 5.1% of our total revenues in the year ended March 31, 2018, as compared to 5.2% in the year ended March 31, 2017. All other expenses, excluding employee costs, amounted to 1.2% and 1.3% of our total revenues in the years ended March 31, 2018 and March 31, 2017, respectively.
Sales and marketing expenses as a percentage of revenue has marginally declined in fiscal 2018 as compared to fiscal 2017.
General and administration expensesOn a standalone basis, our general and administration expenses amounted to 5.7% of our total revenues in the current year and 6.1% in previous year. All other expenses, excluding employee costs, were 4.1% of revenues during the year, as compared to 4.4% in the previous year.
On a consolidated basis, our general and administration expenses amounted to 6.6% of our total revenues in the current year and 6.9% in the previous year. All other expenses, excluding employee costs, were 4.5% of revenues during the year, as compared to 4.8% during the previous year.
General and administration expenses as a percentage of revenues has marginally reduced in fiscal 2018 as compared to fiscal 2017.
The increase in consultancy and professional charges was partially offset by reduction in repairs cost and reduction in impairment losses recognized on financial assets. The decrease in repairs and maintenance cost was primarily on account of cost optimization initiatives taken by the Company. The increase in consultancy and professional charges is due to appointment of professional agencies for legal matters, hiring in the US, fees for strategic initiatives, including buyback. The employee benefit costs as a percentage of revenue has remained constant in fiscal 2018 and fiscal 2017.
Corporate social responsibilityAs per Section 135 of the Companies Act, 2013, a company, meeting the applicability threshold, needs to spend at least 2% of its average net profit for the immediately preceding three financial years on Corporate Social Responsibility (CSR) activities. The areas for CSR activities are eradication of hunger and malnutrition, promoting education, art and culture, healthcare, destitute care and rehabilitation, environment sustainability, disaster relief and rural development projects.

94 | Management’s discussion and analysis Infosys Annual Report 2017-18
A CSR committee has been formed by the Company as per the Act. The funds were primarily allocated to a corpus and utilized through the year on these activities which are specified in Schedule VII of the Companies Act, 2013.
a. Gross amount required to be spent by the Company during the year is ` 310 crore.
b. Amount spent during the year on :in ` crore
Particulars In cash Yet to be paid in cash
Total
1. Construction / acquisition of any asset 171 – 171 2. On purposes other than (1) above 142 – 142
3. Operating profitsDuring the year, on a standalone basis, we earned an operating profit of ̀ 16,478 crore, representing 26.6% of total revenues, compared to ` 15,876 crore, representing 26.8% of total revenues, during the previous year.
During the year, on a consolidated basis, we earned an operating profit of ̀ 17,148 crore, representing 24.3% of total revenues, compared to ̀ 16,901 crore, representing 24.7% of total revenues, during the previous year.
The decrease in operating profit as a percentage of revenue for the current year as compared to the previous year was attributable to a decrease in gross profit as a percentage of revenue during the same period partially offset by a decrease in selling and marketing expenses, and general and administration expenses.
4. Other income, netThe following table sets forth our other income for fiscals 2018 and 2017 :
in ` crore
Particulars Standalone Consolidated2018 2017 % change 2018 2017 % change
Other income 4,019 3,062 31.3 3,193 3,080 3.7
On a standalone basis, other income for fiscal 2018 primarily includes income from investments of ` 2,550 crore and a foreign exchange loss of ` 12 crore on forward and options contracts and foreign exchange gain of ` 265 crore on translation of other assets and liabilities.
Other income includes ̀ 257 crore and ̀ 262 crore for the year ended March 31, 2018 in the standalone and consolidated financial statements of the Company, respectively, towards interest on income tax refund.
During the year ended March 31, 2018, the Company received ` 846 crore as dividend from Infosys BPM, its majority-owned subsidiary. Dividend distribution tax paid by the subsidiary on such dividend has been reduced as credit against dividend distribution tax payable by Infosys.
During the current year, Infosys Nova Holdings LLC, a wholly-owned subsidiary of Infosys Limited has written down the entire carrying value of its investment in its associate DWA Nova LLC. Consequently, Infosys has written down the entire carrying value of the investment in its subsidiary Infosys Nova Holdings LLC, amounting to ` 94 crore on a standalone basis.
Other income for fiscal 2017 primarily includes income from investments of ` 2,664 crore and a foreign exchange gain of ` 551 crore on forward and options contracts and a foreign exchange loss of ` 324 crore on translation of other assets and liabilities.
On a consolidated basis, other income for fiscal 2018 primarily includes income from investments of ` 2,613 crore and a foreign exchange gain of ` 1 crore on forward and options contracts and foreign exchange gain of ` 233 crore on translation of other assets and liabilities.
Other income for fiscal 2017 primarily includes income from investments of ` 2,699 crore and a foreign exchange gain of ` 591 crore on forward and options contracts and a
foreign exchange loss of ` 359 crore on translation of other assets and liabilities.
Interest income in fiscal 2018 has declined as compared to fiscal 2017 primarily due to the softening of interest rates in India and decrease in investable base on account of Capital Allocation Policy of the Company.
We use foreign exchange forward and options contracts to hedge our exposure to movements in foreign exchange rates.
The composition of currency-wise revenues for the years ended March 31, 2018 and March 31, 2017 was as follows :
in %
Currency Standalone Consolidated2018 2017 2018 2017
US Dollar (USD) 69.7 71.9 67.7 69.6UK Pound Sterling (GBP) 5.5 6.1 5.3 5.8Euro (EUR) 10.6 9.0 11.3 9.6Australian Dollar (AUD) 8.1 7.7 7.8 7.3Others 6.1 5.3 7.9 7.7Total 100.0 100.0 100.0 100.0
5. Assets held for sale In the quarter ended March 2018, on conclusion of a strategic review of the portfolio businesses, the Company initiated identification and evaluation of potential buyers for its subsidiaries, Kallidus and Skava (together referred to as ‘Skava’) and Panaya (collectively referred to as the ‘disposal group’). The Company anticipates completion of the sale by March 2019 and accordingly, assets amounting to ` 2,060 crore and liabilities amounting to ` 324 crore in respect of the disposal group have been reclassified under ‘held for sale’. On reclassification, the disposal group has been measured at the lower of carrying amount and fair value less cost to

Management’s discussion and analysis | 95 Infosys Annual Report 2017-18
sell and consequently, an impairment loss of ` 118 crore in respect of Panaya has been recognized in the consolidated Statement of Profit and Loss under other income for the year ended March 31, 2018.
In the standalone financial statements of the Company, investments amounting to ` 1,525 crore in respect of these subsidiaries have been reclassified under ‘held for sale’. On reclassification, these investments have been measured at the lower of carrying amount and fair value less cost to sell and consequently, an impairment loss of ` 589 crore in respect of Panaya has been recognized in the standalone Statement of Profit and Loss for the year ended March 31, 2018.
6. Sensitivity to rupee movementOn a standalone basis, for each of the years ended March 31, 2018 and March 31, 2017, every percentage point depreciation / appreciation in the exchange rate between the Indian rupee and US dollar, had an impact on the Company’s incremental operating margins by approximately 0.52%. On a consolidated basis, it had an impact of 0.50% in each of the current and previous years.
7. Share in profit / loss of associate including impairment
On a consolidated basis, share in net loss of associate including impairment for the current year includes an impairment loss of ` 71 crore on investment in DWA Nova LLC. During the current year, Infosys Nova Holdings LLC has written down the entire carrying value of its investment in its associate DWA Nova LLC. DWA Nova LLC has been since liquidated.
During the previous year, the share in net loss of associate was ` 12 crore and impairment loss was ` 18 crore on investment in DWA Nova LLC.
8. Provision for taxWe have provided for our tax liability both in India and overseas. The applicable Indian corporate statutory tax rate for both the years ended March 31, 2018 and March 31, 2017 is 34.61%.
In India, we have benefitted from certain tax incentives that the Company has provided for the export of software from units registered under Software Technology Park (STP) Scheme and we continue to benefit from certain tax incentives for the units registered under the SEZ Act, 2005. However, the income tax incentives provided by the Government of India for STP units have expired, and the income from all of our STP units are now taxable. SEZ units, which began providing services on or after April 1, 2005, are eligible for a deduction of 100% of profits or gains derived from the export of services for the first five years from the financial year in which the unit has commenced the provision of services and 50% of such profits or gains for further five years. Up to 50% of such profits or gains for further five years thereafter is subject to the creation of a Special Economic Zone Re-investment Reserve out of the profit of the eligible SEZ units and utilization of such reserve by the Company for acquiring new plant and machinery for the purpose of its business as per the provisions of the Income-tax Act, 1961.
As a result of these tax incentives, a portion of pre-tax income has not been subject to income tax. These tax incentives resulted in a decrease in income tax expense by ` 2,008 crore on a standalone basis and ` 2,068 crore on a consolidated basis for the year ended March 31, 2018, and ` 1,915 crore on a standalone basis and ` 1,982 crore on a consolidated basis for the year ended March 31, 2017.
Particulars Standalone Consolidated2018 2017 2018 2017
Income tax expense (in ` crore) 3,753 5,120 4,241 5,598Effective tax rate (in %) 18.9 27.0 20.9 28.0
On a standalone basis, the effective tax rate (based on profit before tax) decreased to 18.9% in fiscal 2018, as compared to 27.0% in fiscal 2017. On a consolidated basis, the effective tax rate for fiscal 2018 and fiscal 2017 was 20.9% and 28.0%, respectively. Effective tax rate is generally influenced by various factors including non-deductible expenses, exempt non-operating income, overseas taxes, benefits from SEZ units, tax reversals and other tax deductions. The decrease in effective tax rate from fiscal 2018 to fiscal 2017 was mainly due to reversal of income tax expense on account of APA, decrease in taxes on account of changes in US federal tax reforms, increase in other tax reversals (net), partially offset by increase in tax expense on account of dividend distribution tax pertaining to subsidiaries.
The Company has concluded an APA with the IRS for the US branch covering the years ending March 2011 to March 2021. Under the APA, the Company and the IRS have agreed on the methodology to allocate revenues and compute the taxable income of the Company’s US branch operations. The Company expects the APA will enhance predictability of the Company’s tax obligation in respect of its US operations. Accordingly the Company has reversed income tax expense provision of ` 1,432 crore (US$ 225 million) which pertains to previous periods. Consequently, profits for fiscal 2018 have increased and therefore, led to an increase in basic earnings per share of ` 5.85 per share and ` 5.88 per share on a standalone and consolidated basis, respectively, for the year ended March 31, 2018. In line with the APA, the Company has to pay an amount of approximately ̀ 1,488 crore (US$ 233 million) due to the difference between the taxes payable for prior periods as per the APA and the actual taxes paid for such periods. The Company has paid ` 479 crore (US$ 74 million) during the three months ended March 31, 2018, and the balance amount is expected to be paid over the next few quarters.
The Tax Cuts and Jobs Act (H.R. 1) was signed into law on December 22, 2017 (‘US tax reforms’). The US tax reforms have reduced federal tax rates from 35% to 21% effective January 1, 2018, among other measures. During the year ended March 31, 2018, the US tax reforms have resulted in a positive impact of ` 155 crore (US$ 24 million) on account of credits pertaining to deferred tax liabilities on branch profit. The impact of US tax reforms is expected to be not significant for future periods.

96 | Management’s discussion and analysis Infosys Annual Report 2017-18
During the current year, on a consolidated basis, the tax expense includes reversal of provisions of ` 296 crore made in earlier periods, which is primarily offset by an additional tax provision of ` 5 crore pertaining to prior periods. For the previous year, the tax reversals comprise a reversal of provisions of ` 354 crore made in earlier periods, partially offset by an additional tax provision of ` 202 crore pertaining to prior periods.
During the current year, on a standalone basis, the tax expense includes reversal of provisions of ` 241 crore made in earlier periods, which is partially offset by an additional tax provision of ̀ 1 crore pertaining to prior periods. For the previous year, the tax reversals comprise a reversal of provisions of ` 353 crore made in earlier periods, partially offset by an additional tax provision of ` 135 crore pertaining to prior periods.
These reversals / additional provision are primarily due to the completion of audits and assessments in certain jurisdictions.
During the year, we have received dividend of ` 846 crore from our majority-owned subsidiary. Dividend distribution tax paid by the subsidiary on such dividend has been reduced as credit against dividend distribution tax payable by us. Accordingly, on a consolidated basis, we have recorded a charge of ` 172 crore as income tax expense during the year ended March 31, 2018.
Refer to Note 2.22, Contingent liabilities and commitments in consolidated and standalone financial statements in the Annual Report for disclosures on claims against the Company not acknowledged as debts.
9. Net profit after tax On a standalone basis, our net profit increased by 16.9% to ` 16,155 crore for the year ended March 31, 2018 from ` 13,818 crore in the previous year. This represents 26.1% and 23.3% of total revenue for the years ended March 31, 2018 and March 31, 2017, respectively.
On a consolidated basis, our net profit increased by 11.7% to ` 16,029 crore for the year ended March 31, 2018 from ` 14,353 crore in the previous year. This represents 22.7% and 21.0% of total revenue for the years ended March 31, 2018 and March 31, 2017, respectively.
The increase in net profit as a percentage of revenue for fiscal 2018 as compared to fiscal 2017 was primarily attributable to a reduction of 24.2% in tax expense and increase in other income of 3.7% partially offset by a decrease in operating profit as a percentage of revenue.
During the quarter ended December 31, 2017, on account of the conclusion of an APA with the US IRS, the Company has, in accordance with the APA, reversed income tax expense provision of US$ 225 million (` 1,432 crore) which pertains to previous periods which are no longer required.
10. Earnings per share (EPS) The details of change in EPS on standalone and consolidated basis are as follows :
Particulars Standalone Consolidated2018 (`) 2017 (`) % increase 2018 (`) 2017 (`) % increase
Basic 71.28 60.16 18.5 71.07 62.80 13.2Diluted 71.25 60.15 18.5 71.00 62.77 13.1
Weighted average equity shares used in computing earnings per equity share are as follows :
Particulars Standalone Consolidated2018 2017 2018 2017
Basic 226,63,43,802 229,69,44,664 225,53,32,322 228,56,39,447Diluted 226,73,92,621 229,71,59,670 225,75,73,870 228,63,96,745
During the quarter ended December 31, 2017, on account of the conclusion of an APA with the US IRS, the Company has, in accordance with the APA, reversed income tax expense provision of US$ 225 million (` 1,432 crore) which pertains to previous periods which are no longer required. Consequently, profit for the year ended March 31, 2018 has increased, resulting in an increase in basic earnings per equity share by ` 5.88 per share on a consolidated basis and ` 5.85 per share on a standalone basis for the year ended March 31, 2018.
11. Segmental profitabilityThe Group’s operations predominantly relate to providing end-to-end business solutions to enable clients to enhance business performance. Based on the ‘management approach’ as defined in Ind AS 108, the Chief Operating Decision Maker (CODM) evaluates the Group’s performance and allocates
resources based on an analysis of various performance indicators by business segments and geographic segments. Accordingly, information has been presented along both business segments and geographic segments. Business segments of the Group are primarily enterprises in Financial Services (FS), Manufacturing (MFG), Retail, Consumer packaged goods and Logistics (RCL), Energy & utilities, Communications and Services (ECS), Hi-tech (Hi-Tech), Life Sciences, Healthcare and Insurance (HILIFE) and all other segments. Geographic segmentation is based on business sourced from that geographic region and delivered from both onsite and offshore locations. North America comprises the United States of America, Canada and Mexico, Europe includes continental Europe (both the east and the west), Ireland and the United Kingdom, and the Rest of the World comprising all other places except those mentioned above and India.

Management’s discussion and analysis | 97 Infosys Annual Report 2017-18
Business segments – standalonein ` crore
Particulars FS MFG ECS RCL HILIFE Hi-Tech All other segments
Total
Segmental revenues 2018 15,860 6,485 15,457 10,247 7,825 4,782 1,285 61,9412017 15,735 6,086 13,999 10,280 7,065 4,901 1,223 59,289
Growth % 0.8 6.6 10.4 (0.3) 10.8 (2.4) 5.1 4.5Segmental operating income
2018 4,268 1,741 4,591 3,200 2,405 1,299 384 17,8882017 4,291 1,770 4,355 3,159 2,089 1,354 199 17,217
Growth % (0.5) (1.6) 5.4 1.3 15.2 (4.1) 93.4 3.9Segmental operating income (%)
2018 26.9 26.9 29.7 31.2 30.8 27.2 29.9 28.92017 27.3 29.1 31.1 30.7 29.6 27.6 16.2 29.0
Geographical segments – standalonein ` crore
Particulars North America Europe India Rest of the World TotalSegmental revenues
2018 38,984 14,426 1,861 6,670 61,9412017 38,578 13,019 1,798 5,894 59,289
Growth % 1.1 10.8 3.5 13.1 4.5Segmental operating income
2018 10,884 4,011 864 2,129 17,8882017 10,762 3,832 667 1,956 17,217
Growth % 1.1 4.7 29.6 8.8 3.9Segmental operating income (%)
2018 27.9 27.8 46.4 31.9 28.92017 27.9 29.4 37.1 33.2 29.0
Business segments – consolidatedin ` crore
Particulars FS MFG ECS RCL HILIFE Hi-Tech All other segments
Total
Segmental revenues 2018 18,638 7,699 16,757 11,104 9,271 5,047 2,006 70,5222017 18,555 7,507 15,430 11,225 8,437 5,122 2,208 68,484
Growth % 0.4 2.6 8.6 (1.1) 9.9 (1.4) (9.2) 3.0Segmental operating income
2018 5,207 1,819 4,550 3,249 2,575 1,224 389 19,0132017 5,209 1,848 4,431 3,249 2,308 1,277 292 18,614
Growth % 0.0 (1.6) 2.7 0.0 11.5 (4.1) 33.1 2.1Segmental operating income (%)
2018 27.9 23.6 27.1 29.3 27.8 24.3 19.4 27.02017 28.1 24.6 28.7 28.9 27.4 24.9 13.2 27.2
Geographical segments – consolidatedin ` crore
Particulars North America Europe India Rest of the World TotalSegmental revenues
2018 42,575 16,738 2,231 8,978 70,5222017 42,408 15,392 2,180 8,504 68,484
Growth % 0.4 8.7 2.4 5.6 3.0Segmental operating income
2018 10,846 4,425 899 2,843 19,0132017 10,991 4,150 736 2,737 18,614
Growth % (1.3) 6.6 22.0 3.9 2.1

98 | Management’s discussion and analysis Infosys Annual Report 2017-18
Particulars North America Europe India Rest of the World TotalSegmental operating income (%)
2018 25.5 26.4 40.3 31.7 27.02017 25.9 27.0 33.8 32.2 27.2
Overall segment profitability has marginally declined primarily on account of :
• Adverse currency impact of rupee appreciation, compensation increases and higher variable payouts
• Partially offset by cross-currency benefit, improved operational parameters – higher utilization, benefits on account of automation, lower onsite mix and optimization of general and administration costs etc.
12. LiquidityOur principal source of liquidity are cash and cash equivalents and cash flow that we generate from operations. We have no outstanding borrowings. We believe our working capital is sufficient for our requirements.
Our growth has been financed largely through cash generated from operations.
On a standalone basis, the net cash generated from our operations was ̀ 12,475 crore and ̀ 10,478 crore for the years ended March 31, 2018 and March 31, 2017, respectively. Net cash flow from investing activities was ` 5,684 crore for the year ended March 31, 2018, while net cash used in investing activities was ` 13,494 crore for the year ended March 31, 2017. Net cash used in financing activities was ` 20,536 crore and ` 6,968 crore for the years ended March 31, 2018 and March 31, 2017, respectively.
On a consolidated basis, the net cash generated from our operations was ̀ 13,218 crore and ̀ 11,531 crore for the years ended March 31, 2018 and March 31, 2017, respectively. Net cash flow from investing activities was ` 4,452 crore for the year ended March 31, 2018, while net cash used in investing activities was ` 14,542 crore for the year ended March 31, 2017. Net cash used in financing activities was ` 20,505 crore and ` 6,939 crore for the years ended March 31, 2018 and March 31, 2017, respectively.
Our cash flows are robust and our operating cash flows have increased from ` 11,531 crore in fiscal 2017 to ` 13,218 crore in fiscal 2018.
Capital Allocation Policy The Board, at its meeting on April 13, 2018, reviewed and approved the Capital Allocation Policy of the Company after taking into consideration the strategic and operational cash requirements of the Company in the medium term. The key aspects of the Capital Allocation Policy are :
i. The Board has decided to retain the current policy of returning up to 70% of the free cash flow of the corresponding fiscal in such manner, as may be decided by the Board from time-to-time, subject to applicable laws and requisite approvals, if any. Free cash flow is defined as net cash provided by operating activities less capital expenditure as per the consolidated Statement of Cash Flows prepared under IFRS. Dividend payout includes Dividend Distribution Tax (DDT).
ii. In addition to the above, out of the cash on the Balance Sheet, the Board has identified an amount of up to
` 13,000 crore (US$ 2 billion(1)) to be paid to shareholders in the following manner : – A special dividend of ` 10 per share ($0.15 per ADR(1))
resulting in a payout of approximately ` 2,600 crore (approximately US$ 400 million(1)) in June 2018
– Identified an amount of up to approximately ` 10,400 crore (approximately US$ 1,600 million(1)) to be paid out to shareholders for the fiscal 2019, in such a manner, to be decided by the Board, subject to applicable laws and requisite approvals, if any.
(1) USD / INR exchange rate at 65.00
13. Related party transactionsThese have been discussed in detail in Note 2.23 to the standalone financial statements in this Annual Report.
14. Events occurring after Balance Sheet dateThere were no significant events that occurred after the Balance Sheet date. Refer to ‘Material changes and commitments affecting financial position between the end of the fiscal and date of the report’ in Board’s report for the Capital Allocation Policy, appointment of lead independent director and proposed acquisition of WongDoody.
IV. Opportunities and threats
Our strengthsOver the years, we have invested in building differentiated capabilities such as :
• Specific industry domain and technology expertise, and in methodologies such as Design Thinking and agile software development
• End-to-end service offering capabilities in consulting, software application development, integration, maintenance, validation, enterprise system implementation, product engineering, infrastructure management and business process management
• Intellectual property in software platforms and products such as Infosys Nia®, our flagship artificial intelligence platform, the Edge suite of products, Finacle® and McCamish that either amplify our own services or provide differentiated solutions for our clients’ business processes
• Our Global Delivery Model for large-scale outsourcing of technology projects fueled by automation, intelligence and collaboration technologies. Our Global Delivery Model divides projects into components that can be executed simultaneously at client sites and at our development centers in India and globally.

Management’s discussion and analysis | 99 Infosys Annual Report 2017-18
• Sophisticated service delivery and quality control processes, standards and frameworks
• Internal research and development teams that identify, develop and deploy new offerings leveraging next-generation technologies
• Ecosystem alliances with enterprise software companies and innovative startup companies
• Sales and client engagement teams that have resulted in deep, enduring and expansive relationships with our customers around the world
• High-quality global talent and leadership; and the infrastructure and systems to enable learning and education across the enterprise at scale.
With over three decades of experience in managing the systems and workings of global enterprises, we believe we are uniquely positioned to help them steer through their digital transformation with :
Agile Digital at scale : Build new enterprise-wide capability that delivers new levels of business performance at one end and customer delight at the other
AI-powered core : A foundation of fully-automated processes and systems along with the vital insights to prioritize execution of change
Always-on learning : Drive continuous improvement by building and transferring digital skills and expertise along with ideas from a cross-section of industries and innovation ecosystems.
Our strategyOur strategic objective is to build a sustainable organization that remains relevant to the agenda of our clients, while creating growth opportunities for our employees and generating profitable returns for our investors.
We have embraced a four-pronged strategy to strengthen our relevance with clients and drive accelerated value creation :
• Scale Agile Digital
• Energize the core
• Re-skill our people
• Expand localization
For more details on our strategy, refer to the Board’s report.
Our competitionWe experience intense competition in traditional services and see a rapidly-changing marketplace with new competitors arising in new technologies who are focused on agility, flexibility and innovation.
We typically compete with other technology service providers in response to requests for proposals. Clients often cite our industry expertise, comprehensive end-to end solutions, ability to scale, superior quality and process execution, Global Delivery Model, experienced management team, talented professionals and track record as reasons for awarding us contracts.
In future, we expect intensified competition. In particular, we expect increased competition from firms that strengthen their offshore presence in India or other low-cost locations, firms that offer technology-based solutions to business problems
and from firms incumbent in market segments that we have recently entered.
We believe that the principal competitive factors in our business are :
• The ability to keep pace with ever-changing technology and how they apply to customer requirements
• The ability to increase the scale and breadth of service offerings to provide one-stop solutions for customer needs
• The ability to articulate and demonstrate long-term value to existing and potential customers
• The ability to attract and retain high-quality management, technology professionals, and sales personnel
• The ability to effectively integrate global execution capabilities to deliver high-quality, seamless, scalable, cost effective services
• A strong and well-recognized brand
• A proven track record of performance excellence and customer satisfaction
• The financial strength to be able to invest in personnel and infrastructure to support the evolving demands of customers
• High ethical and corporate governance standards to ensure honest and professional business practices and protect the reputation of the Company and its customers.
V. Outlook, risks and concernsThis section lists forward-looking statements that involve risks and uncertainties. Our actual results could differ materially from those anticipated in these statements as a result of certain factors. Our outlook, risks and concerns are as follows :
• Spending on technology products and services by our clients and prospective clients is subject to fluctuations depending on many factors, including both the economic and regulatory environment in the markets in which they operate.
• Economic slowdown or other factors may affect the economic health of the US, UK, EU, Australia or those industries where our revenues are concentrated.
• A large part of our revenues are dependent on our top clients, and the loss of any one of our major clients could significantly impact our business.
• We may not be able to provide end-to-end business solutions for our clients, which could lead to clients discontinuing their work with us, which in turn could harm our business.
• Intense competition in the market for technology services could affect our win rates and pricing, which could reduce our share of business from clients and decrease our revenues and / or our profits.
• Our engagements with customers are typically singular in nature and do not necessarily provide for subsequent engagements.
• Our business will suffer if we fail to anticipate and develop new services and enhance existing services in order to keep pace with rapid changes in technology and in the industries on which we focus.

100 | Management’s discussion and analysis Infosys Annual Report 2017-18
• We may be unable to recoup investment costs incurred in developing our software products and platforms.
• We may engage in acquisitions, strategic investments, strategic partnerships or alliances or other ventures that may or may not be successful.
• Goodwill that we carry on our Balance Sheet could give rise to significant impairment charges in the future.
• Our expenses are difficult to predict and can vary significantly from period to period, which could cause our share price to decline.
• Any inability to manage our growth could disrupt our business, reduce our profitability and adversely impact our ability to implement our growth strategy.
• Wage pressures in India and the hiring of employees outside India may prevent us from sustaining some of our competitive advantage and may reduce our profit margins.
• We are investing substantial cash assets in new facilities and physical infrastructure, and our profitability could be reduced if our business does not grow proportionately.
• Currency fluctuations and declining interest rates may affect the results of our operations.
• Our success depends largely upon our highly-skilled technology professionals and our ability to hire, attract, motivate, retain and train these personnel.
• Our success depends in large part upon our management team and key personnel and our ability to attract and retain them.
• Our failure to complete fixed-price and fixed-timeframe contracts, or transaction-based pricing contracts, within budget and on time, may negatively affect our profitability.
• Our client contracts can typically be terminated without cause and with little or no notice or penalty, which could negatively impact our revenues and profitability.
• Our client contracts are often conditioned upon our performance, which, if unsatisfactory, could result in lower revenues than previously anticipated.
• Some of our long-term client contracts contain benchmarking provisions which, if triggered, could result in lower future revenues and profitability under the contract.
• Our work with governmental agencies may expose us to additional risks.
• Our reputation could be at risk and we may be liable to our clients or to regulators for damages caused by inadvertent disclosure of confidential information and sensitive data.
• Our reputation could be at risk and we may be liable to our clients for damages caused by cyber security incidents.
• We may be the subject of litigation which, if adversely determined, could harm our business and operating results.
• Our insurance coverage may not be adequate to protect us against all potential losses to which we may be subject, and this may have a material adverse effect on our business.
• The markets in which we operate are subject to the risk of earthquakes, floods, tsunamis, storms and other natural and manmade disasters.
• The safety of our employees, assets and infrastructure may be affected by untoward incidents beyond our control, impacting business continuity or reputation.
• Terrorist attacks or a war could adversely affect our business, results of operations and financial condition.
• Negative media coverage and public scrutiny may divert the time and attention of our board and management and adversely affect our reputation and the prices of our equity shares and ADSs.
• An increase in anti-outsourcing sentiments in certain countries in which we operate, including the US, UK, European Union and Australia, has led and may in the future lead to the enactment of restrictive legislations that could limit companies in those countries from outsourcing work to us, or could inhibit our ability to staff client projects in a timely manner thereby impacting our revenue and profitability.
• Given that a large number of our employees in the US, UK, European Union and other jurisdictions are working on visas, any restrictions on immigration may affect our ability to compete for and provide services to clients in these jurisdictions, which could hamper our growth or cause our revenues to decline and impact profitability.
• New and changing corporate governance and public disclosure requirements add uncertainty to our compliance policies and increase our costs of compliance.
• The intellectual property laws of India do not give sufficient protection to software to the same extent as those in the US. We may or may not be successful in protecting our intellectual property rights. We may also be subject to third-party claims of intellectual property infringement.
• Our net income would decrease if the Government of India reduces or withdraws tax benefits and other incentives it provides to us or when our tax holidays expire, reduce or terminate.
• In the event that the Government of India or the government of another country changes its tax policies in a manner that is adverse to us, our tax expense may materially increase, reducing our profitability.
• We operate in jurisdictions that impose transfer pricing and other tax-related regulations on us, and any failure to comply could materially and adversely affect our profitability.
• Changes in the policies of the Government of India or political instability may adversely affect economic conditions in India generally, which could impact our business and prospects.
• Attempts to fully address concerns of activist shareholders may divert the time and attention of our Management and Board of Directors and may impact the prices of our equity shares and ADSs.
• Our international expansion plans subject us to risks inherent in doing business internationally.
• Our ability to acquire companies organized outside India depends on the approval of the RBI and / or the Government of India and failure to obtain this approval could negatively impact our business.

Management’s discussion and analysis | 101 Infosys Annual Report 2017-18
• Indian laws limit our ability to raise capital outside India and may limit the ability of others to acquire us, which could prevent us from operating our business or entering into a transaction that is in the best interests of our shareholders.
• Historically, our ADSs have traded at a significant premium to the trading prices of our underlying equity shares. Currently, they do not do so and they may not continue to do so in the future.
• Sales of our equity shares may adversely affect the prices of our equity shares and ADSs.
• The price of our ADSs and the US dollar value of any dividends we declare may be negatively affected by fluctuations in the US dollar to Indian rupee exchange rate.
• Indian law imposes certain restrictions that limit a holder’s ability to transfer the equity shares obtained upon conversion of ADSs and repatriate the proceeds of such transfer which may cause our ADSs to trade at a premium or discount to the market price of our equity shares.
• An investor in our ADSs may not be able to exercise pre-emptive rights for additional shares and may thereby suffer dilution of such investor’s equity interest in us.
• ADS holders may be restricted in their ability to exercise voting rights.
• ADS holders may be restricted in their ability to participate in a buy-back of shares offered by us.
• It may be difficult for holders of our ADSs to enforce any judgment obtained in the US against us or our affiliates.
• Holders of ADSs are subject to the Securities and Exchange Board of India’s Takeover Code with respect to their acquisitions of ADSs or the underlying equity shares, and this may impose requirements on such holders with respect to disclosure and offers to purchase additional ADSs or equity shares.
• If the Government of India modifies dividend distribution tax rates or introduces new forms of taxes on distribution of profits or changes the basis of application of these taxes, the same could materially affect the returns to our shareholders.
VI. Internal control systems and their adequacy
The CEO and CFO certification provided in the CEO and CFO Certification section of the Annual Report discusses the adequacy of our internal control systems and procedures.
VII. Material developments in human resources / industrial relations, including number of people employed
Our culture and reputation as a leader in consulting, technology, outsourcing and next-generation services enable us to attract and retain some of the best talent.
Human capitalOur employees are our most important assets. We believe that the quality and level of service that our professionals
deliver are among the highest in the global technology services industry. We are committed to remaining among the industry’s leading employers.
As at March 31, 2018, the Group employed 2,04,107 employees, of which 1,92,179 were professionals involved in service delivery to the clients, including trainees. During fiscal 2018, we added 3,743 new hires, net of attrition. The key aspects of our HR practice include recruitment, training and development, and compensation.
RecruitmentWe have built our global talent pool by recruiting new students from premier universities, colleges and institutes in India, and through the need-based hiring of project leaders and middle management across the globe. We recruit students who have consistently shown high levels of achievement from campuses in India. We also recruit students from campuses in the US, UK, Australia and China. We rely on a rigorous selection process involving aptitude tests and interviews to identify the best applicants. This selection process is continually assessed and refined based on the performance tracking of past recruits.
During fiscal 2018, we received 15,40,498 employment applications, interviewed 1,43,872 applicants and extended offers of employment to 52,943 applicants. These statistics do not include our subsidiaries.
Training and developmentThe competency development of our employees continues to be a key area of strategic focus for us. We launched new programs for our employees in keeping with the changes in the use of technology in education. We enhanced our technology-led training efforts in multiple areas.
As part of our Foundation Program, we enhanced some of the existing courses and introduced new courses on Infosys Learning Platform (ILP). ILP was launched in the previous year, and we started reaping benefits in the form of enhanced learning among our fresh hires.
Our continuous education programs emphasize enhancing the relevance and effectiveness of learning. This year, we have enhanced hands-on-based assessments, and many courses have been launched on ILP for our existing employees, which resulted in enhanced reach of our enablement programs across the organization. We also enhanced Digital Tutor which enables sharing of experiential knowledge in video format. All these changes were incorporated to create a unique experience for learners at Infosys.
CompensationOur technology professionals receive competitive salaries and benefits. We have also adopted a variable compensation program which links compensation to the Company and individual performance. In order to attract, retain and motivate talented and critical employees and to encourage employees to align individual performance with the Company objectives and reward employee performance with ownership, the Company granted share-based benefits to high-performing executives and mid-level managers.

102 | Corporate governance report Infosys Annual Report 2017-18
Corporate governance report
Our corporate governance philosophyOur corporate governance is a reflection of our value system encompassing our culture, policies, and relationships with our stakeholders. Integrity and transparency are key to our corporate governance practices to ensure that we gain and retain the trust of our stakeholders at all times.
Corporate governance frameworkOur corporate governance framework is guided by our core values – Client Value, Leadership by Example, Integrity and Transparency, Fairness and Excellence (C-LIFE) – and is based on the following principles :
CORPORATEGOVERNANCEAT INFOSYS
governance structure
Integrity and transparency
Legal comp
liance
stake
hold
ers
Relations
hip
with
Fairness and excellence
Effective corporate
Res
po
nsi
ble
lead
ersh
ip
The Board as trustee
Ensure transparencyand maintain a
high level of integrity
Satisfy both the spiritand the letter of the law
in all our actionsand disclosures
Communicate frequentlywith stakeholders, including
clients, investors,shareholders and
stock marketsBe objective and ethical,
and deliver the bestto earn trust and respect
from our stakeholders
Build simple andtransparent processes
driven by business needsof all stakeholders
Lead by example by ensuring independence
of the Board andeffectiveness of the
Management
Safeguard theshareholder’s capital
as trustee, andnot as its owner
We believe that an active, well-informed and independent board is necessary to ensure the highest standards of corporate governance. At Infosys, the Board is at the core of our corporate governance practice. The Board oversees the Management’s functions and protects the long-term interests of our stakeholders.
As on March 31, 2018, the Board comprised nine members, of which six members are independent directors and one member is a non-executive, non-independent director. The non-executive, non-independent director is the Chairman of the Board. An independent director is the chairperson of each of the Board committees, namely audit, nomination and remuneration, stakeholders relationship, risk and strategy, finance and investment and corporate social responsibility (CSR) committees.
Our corporate governance framework ensures that we make timely disclosures and share accurate information regarding our financials and performance, as well as disclosures related to the leadership and governance of the Company.
Compliance with global guidelines and standardsInfosys has been a front-runner in complying with global best practices in corporate governance. Starting with the landmark Cadbury Report in the UK in 1992, the enactment of the Sarbanes-Oxley Act, 2002, and the Consumer Protection Act, we have been following and complying with the best practices of corporate governance over the years.

Corporate governance report | 103 Infosys Annual Report 2017-18
SEBI has notified the Listing Regulations on September 2, 2015. The Listing Regulations have incorporated the principles for corporate governance in line with the Organisation for Economic Co-operation and Development (OECD) principles. The Listing Regulations also provide broad principles for periodic disclosures by listed entities in line with the International Organization of Securities Commissions (IOSCO) principles. We are in compliance with all the applicable requirements of the Listing Regulations.
SEBI had constituted a committee on June 2, 2017, under the Chairmanship of Uday Kotak, to address corporate governance gaps and to enhance long-term standards necessary to shape a strong and resilient governance apparatus for listed companies in India. SEBI, at its board meeting held on March 28, 2018, accepted several recommendations of the Kotak Committee with and without modifications along with timelines for implementation. We substantially comply with the recommendations of the Kotak Committee accepted by SEBI.
During the year, the Company was rated in the leadership category in a corporate governance study conducted jointly by BSE Limited (BSE) and the International Finance Corp (IFC), a member of the World Bank Group, and Institutional
Investors Advisory Services (IiAS), based on G20 / OECD principles which are globally accepted benchmarks for corporate governance.
We substantially comply with the Euroshareholders Corporate Governance Guidelines, 2000 and the recommendations of the Conference Board Commission on Public Trusts and Private Enterprises in the US. We also adhere to the United Nations Global Compact (UNGC) and the OECD principles.
Corporate governance guidelinesThe Board has defined a set of corporate governance best practices and guidelines to help fulfill our corporate responsibility towards our stakeholders. These guidelines ensure that the Board will have the necessary authority and processes to review and evaluate our operations as and when required. Further, these guidelines allow the Board to make decisions that are independent of the Management. The Board may change these guidelines regularly to achieve our stated objectives. The guidelines can be accessed from our website, at https://www.infosys.com/investors/corporate-governance/Documents/corporate-governance-guidelines.pdf
A. Board composition
Size and composition of the BoardWe believe that our Board needs to have an appropriate mix of executive, non-executive and independent directors to maintain its independence, and separate its functions of governance and management. Listing Regulations mandate that for a company with a non-executive chairman, who is a promoter, at least half of the Board should be independent directors. As on March 31, 2018, our Board comprised nine members, consisting of one non-executive, non-independent Chairman, two executive directors, and six independent directors. Independent directors constitute 67% of the Board’s strength – more than the requirements of the Companies Act, 2013 and the Listing Regulations. Three out of nine members are women, making up 33% of the Board’s strength. The Board periodically evaluates the need for change in its size and composition.
Size and composition of the Board
67%
33%
67% 33%
IndianForeign national
Non-executive and non-independent ChairmanExecutive and whole-time directorsIndependent directors
WomenMen
89%
11%
The average tenure of members on our Board is 2.6 years as of March 31, 2018. The average tenure of executive directors (whole-time directors) is 2.2 years, independent directors is 3.1 years and that of the non-executive, non-independent director is 0.6 years.

104 | Corporate governance report Infosys Annual Report 2017-18
The average tenure of Board members in years as on March 31, 2018 was as follows :
Name of director Original date of appointment
Non-executive and non-independent chairman
Nandan M. Nilekani Aug 24, 2017 0.6
Jan 01, 2023
Aug 17, 2022
Yes
Yes
NA Yes
Tenure(in years) as on
Mar 31, 2018
Termending date
Subject to retirement by rotation
Tenure on Board
Independent director
Kiran Mazumdar-Shaw
Ravi Venkatesan (2)
Roopa Kudva
Dr. Punita Kumar-Sinha
D.N. Prahlad
D. Sundaram
Average tenure
Jan 10, 2014
Apr 15, 2011
Feb 04, 2015
Jan 14, 2016
Oct 14, 2016
Jul 14, 2017
4.2
7.0
3.2
2.2
1.5
0.7
3.1
Mar 31, 2019
Mar 31, 2019
Feb 03, 2020
Jan 13, 2021
Oct 13, 2021
Jul 13, 2022
–
–
–
–
–
–
Executive / whole-time director
Salil Parekh
U.B. Pravin Rao (1)
Jan 02, 2018
Jan 10, 2014
0.2
4.2
2.2
Average tenure (in years)
0.6
3.1
2.2
2.6
Non-executive, non-independent
chairman
Executive / Whole-timedirectors
Independent directors
The Board
Average tenure
(1) Reappointed on August 18, 2017 (2) Reappointed on April 15, 2014
Chairman of the BoardNandan M. Nilekani is the Chairman effective August 24, 2017.
R. Seshasayee resigned as Chairman effective August 24, 2017.
Ravi Venkatesan was the Co-chairman between April 13, 2017 and August 24, 2017.
Responsibilities of the Chairman, and the Chief Executive Officer and Managing DirectorThe Board, upon the recommendation of the nomination and remuneration committee, unanimously appointed Nandan M. Nilekani as the Chairman of the Board with effect from August 24, 2017 and Salil Parekh as the Chief Executive Officer and Managing Director (CEO & MD) with effect from January 2, 2018.
The responsibilities and authority of these officials are as follows :The Chairman is the leader of the Board. As Chairman, he is responsible for fostering and promoting the integrity of the Board while nurturing a culture where the Board works harmoniously for the long-term benefit of the Company and all its stakeholders. The Chairman is primarily responsible for ensuring that the Board provides effective governance to the Company. In doing so, the Chairman will preside over meetings of the Board and of the shareholders of the Company.The Chairman will take a lead role in managing the Board and facilitate effective communication among directors. He is responsible for matters pertaining to governance, including the organization, composition and effectiveness of the Board and its committees, and the performance of individual directors in fulfilling their responsibilities. The Chairman will provide independent leadership to the Board, identify guidelines for the conduct and performance of directors, and oversee the management of the Board’s
administrative activities, such as meetings, schedules, agenda, communication and documentation.
The Chairman will actively work with the nomination and remuneration committee to plan the composition of the Board and Board committees, induct directors to the Board, plan for director succession, participate in the Board effectiveness evaluation process and meet with individual directors to provide constructive feedback and advice.
The CEO & MD is responsible for corporate strategy, brand equity, planning, external contacts and all matters related to the management of the Company. He is also responsible for achieving annual and long-term business targets, maintaining awareness of both the external and the internal competitive landscape, opportunities for expansion, customers, markets, new industry developments and standards, and acquisitions for enhancing shareholder value and implementing the organization’s vision, mission, and overall direction.
The CEO & MD acts as a link between the Board and the Management and is also responsible for leading and evaluating the work of other executive leaders including Chief Operating Officer (COO), presidents and executive vice presidents as per the organization structure.
Lead Independent DirectorThe Board, at its meeting held on April 13, 2018, appointed Kiran Mazumdar-Shaw, chairperson of the nomination and remuneration committee and the CSR committee, as the Lead Independent Director. The role of the lead independent director is to provide leadership to the independent directors, liaise on behalf of the independent directors and ensure the Board’s effectiveness to maintain high-quality governance of the organization and the effective functioning of the Board.

Corporate governance report | 105 Infosys Annual Report 2017-18
Role of the Board of DirectorsThe primary role of the Board is that of trusteeship to protect and enhance shareholder value through strategic direction to the Company. As trustees, the Board has fiduciary responsibility to ensure that the Company has clear goals aligned to shareholder value and its growth. The Board exercises its duties with care, skill and diligence, and exercises independent judgment. It sets strategic goals and seeks accountability for their fulfillment. It also directs and exercises appropriate control to ensure that the Company is managed in a manner that fulfills stakeholders’ aspirations and societal expectations.
Definition of independent directorsThe Companies Act, 2013 and the Listing Regulations define an ‘independent director’ as a person who is not a promoter or employee or one of the key managerial personnel of the company or its subsidiaries. They also state that the person should not have a material pecuniary relationship or transactions with the company or its subsidiaries, apart from receiving remuneration as an independent director.
We abide by these definitions of independent director in addition to the definitions of an independent director as laid down in the New York Stock Exchange (NYSE) listed company manual and the Sarbanes-Oxley Act, and US securities laws by virtue of our listing on the NYSE in the US.
Key Board qualifications, expertise and attributes The Infosys Board comprises qualified members who bring in the required skills, competence and expertise that allow them to make effective contribution to the Board and its committees. The Board members are committed to ensuring that the Infosys Board is in compliance with the highest standards of corporate governance.
The table below summarizes the key qualifications, skills, and attributes which are taken into consideration while nominating candidates to serve on the Board.
Definitions of director qualifications
Financial Leadership of a financial firm or management of the finance function of an enterprise, resulting in proficiency in complex financial management, capital allocation, and financial reporting processes, or experience in actively supervising a principal financial officer, principal accounting officer, controller, public accountant, auditor or person performing similar functions
Gender, ethnic, national, or other diversity
Representation of gender, ethnic, geographic, cultural, or other perspectives that expand the Board’s understanding of the needs and viewpoints of our customers, partners, employees, governments, and other stakeholders worldwide
Global business Experience in driving business success in markets around the world, with an understanding of diverse business environments, economic conditions, cultures, and regulatory frameworks, and a broad perspective on global market opportunities
Leadership Extended leadership experience for a significant enterprise, resulting in a practical understanding of organizations, processes, strategic planning, and risk management. Demonstrated strengths in developing talent, planning succession, and driving change and long-term growth
Technology A significant background in technology, resulting in knowledge of how to anticipate technological trends, generate disruptive innovation, and extend or create new business models
Mergers and acquisitions A history of leading growth through acquisitions and other business combinations, with the ability to assess ‘build or buy’ decisions, analyze the fit of a target with the Company’s strategy and culture, accurately value transactions, and evaluate operational integration plans
Board service and governance
Service on a public company board to develop insights about maintaining board and management accountability, protecting shareholder interests, and observing appropriate governance practices
Sales and marketing Experience in developing strategies to grow sales and market share, build brand awareness and equity, and enhance enterprise reputation
Board membership criteriaThe nomination and remuneration committee works with the entire Board to determine the appropriate characteristics, skills and experience required for the Board as a whole and for individual members. Members are expected to possess the required qualifications, integrity, expertise and experience for the position. They should also possess deep expertise and insights in sectors / areas relevant to the Company, and ability to contribute to the Company’s growth.
The age limit for a managing director / executive director is 60 years, while the age limit for an independent / non-executive director is 70 years. A director’s term may be extended at the discretion of the committee beyond the age of 60 or 70 years with shareholders’ approval by passing a special resolution, based on the explanatory statement annexed to the Notice for such motion indicating the justification for the extension of appointment beyond 60 or 70 years as the case may be.
Based on the disclosures received from all the independent directors and also in the opinion of the Board, the independent directors fulfill the conditions specified in Companies Act, 2013, NYSE listing manual and Listing Regulations and are independent of the Management.
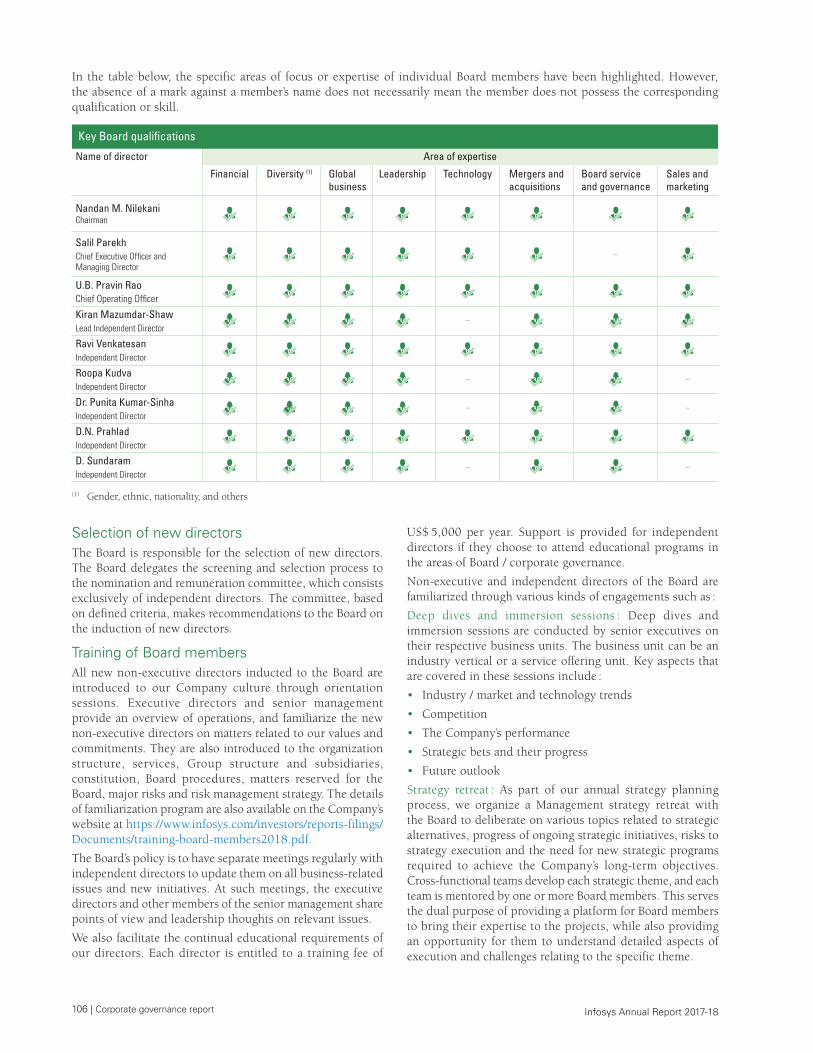
106 | Corporate governance report Infosys Annual Report 2017-18
In the table below, the specific areas of focus or expertise of individual Board members have been highlighted. However, the absence of a mark against a member’s name does not necessarily mean the member does not possess the corresponding qualification or skill.
Name of director
Financial Diversity (1) Globalbusiness
Leadership Technology Mergers andacquisitions
Board serviceand governance
Sales andmarketing
Salil ParekhChief Executive Of�cer andManaging Director
Key Board quali�cations
Area of expertise
Nandan M. NilekaniChairman
U.B. Pravin RaoChief Operating Of�cer
Kiran Mazumdar-ShawLead Independent Director
Ravi VenkatesanIndependent Director
Roopa KudvaIndependent Director
Dr. Punita Kumar-SinhaIndependent Director
D.N. PrahladIndependent Director
D. SundaramIndependent Director
(1) Gender, ethnic, nationality, and others
Selection of new directorsThe Board is responsible for the selection of new directors. The Board delegates the screening and selection process to the nomination and remuneration committee, which consists exclusively of independent directors. The committee, based on defined criteria, makes recommendations to the Board on the induction of new directors.
Training of Board membersAll new non-executive directors inducted to the Board are introduced to our Company culture through orientation sessions. Executive directors and senior management provide an overview of operations, and familiarize the new non-executive directors on matters related to our values and commitments. They are also introduced to the organization structure, services, Group structure and subsidiaries, constitution, Board procedures, matters reserved for the Board, major risks and risk management strategy. The details of familiarization program are also available on the Company’s website at https://www.infosys.com/investors/reports-filings/Documents/training-board-members2018.pdf.
The Board’s policy is to have separate meetings regularly with independent directors to update them on all business-related issues and new initiatives. At such meetings, the executive directors and other members of the senior management share points of view and leadership thoughts on relevant issues.
We also facilitate the continual educational requirements of our directors. Each director is entitled to a training fee of
US$ 5,000 per year. Support is provided for independent directors if they choose to attend educational programs in the areas of Board / corporate governance.
Non-executive and independent directors of the Board are familiarized through various kinds of engagements such as :
Deep dives and immersion sessions : Deep dives and immersion sessions are conducted by senior executives on their respective business units. The business unit can be an industry vertical or a service offering unit. Key aspects that are covered in these sessions include :
• Industry / market and technology trends
• Competition
• The Company’s performance
• Strategic bets and their progress
• Future outlook
Strategy retreat : As part of our annual strategy planning process, we organize a Management strategy retreat with the Board to deliberate on various topics related to strategic alternatives, progress of ongoing strategic initiatives, risks to strategy execution and the need for new strategic programs required to achieve the Company’s long-term objectives. Cross-functional teams develop each strategic theme, and each team is mentored by one or more Board members. This serves the dual purpose of providing a platform for Board members to bring their expertise to the projects, while also providing an opportunity for them to understand detailed aspects of execution and challenges relating to the specific theme.

Corporate governance report | 107 Infosys Annual Report 2017-18
The above are specific mechanisms through which members of the Board are familiarized with the Company culture and operations. Apart from these, there could be additional meetings or sessions on demand on specific topics. All directors attend the familiarization programs as these are scheduled to coincide with the Board meeting calendar to give them an opportunity to attend.
The details of the training programs attended by Board members other than executive directors in fiscal 2018 are as follows :
Name of director No. of training hours attended
during fiscal 2018Nandan M. Nilekani 11Kiran Mazumdar-Shaw 12Ravi Venkatesan 15Roopa Kudva 15Dr. Punita Kumar-Sinha 14D.N. Prahlad 12D. Sundaram 11R. Seshasayee 3Prof. Jeffrey S. Lehman 3Prof. John W. Etchemendy 3Total hours 99
Note : The training program for fiscal 2018 includes deep dive and immersion sessions on various topics such as cyber security, market trends on products and services, overview on regulations and disclosures, and strategy retreat.
Membership termThe Board constantly evaluates the contribution of members and periodically shares updates with the shareholders about reappointments consistent with applicable statutes. The current law in India mandates that two-third of the non-independent directors be liable to retire by rotation every year, and one-third of them mandatorily retire by rotation, and qualifies the retiring members for reappointment. Executive directors are appointed by the shareholders for a maximum period of five years, but are eligible for reappointment upon completion of their term. An independent director shall hold office for a term of up to five consecutive years on the Board of the Company and will be eligible for reappointment on the passing of a special resolution by the shareholders.
Board member evaluationOne of the key functions of the Board is to monitor and review the Board evaluation framework. The Board works with the nomination and remuneration committee to lay down the evaluation criteria for the performance of the Chairman, the Board, Board committees, and executive / non-executive / independent directors through a peer evaluation, excluding the director being evaluated.
Independent directors have three key roles – governance, control and guidance. Some of the performance indicators, based on which the independent directors, are evaluated include :• The ability to contribute to and monitor our corporate
governance practices
• The ability to contribute by introducing international best practices to address business challenges and risks
• Active participation in long-term strategic planning• Commitment to the fulfillment of a director’s obligations
and fiduciary responsibilities; these include participation in Board and committee meetings.
To improve the effectiveness of the Board and its committees, as well as that of each individual director, a formal and rigorous Board review is internally undertaken on an annual basis.
The Board had engaged Egon Zehnder, a leadership advisory firm on board matters, to conduct Board evaluation for fiscal 2018. The evaluation process focused on Board dynamics and softer aspects. The process involved independent discussions with all Board members.
The Board evaluation was completed for fiscal 2018, and the summary of findings and recommendations was discussed on April 12 and 13, 2018.
Succession planningThe nomination and remuneration committee works with the Board on the leadership succession plan to ensure orderly succession in appointments to the Board and in the senior management. The Company strives to maintain an appropriate balance of skills and experience within the organization and the Board in an endeavor to introduce new perspectives while maintaining experience and continuity.
By integrating workforce planning with strategic business planning, the Company puts the necessary financial and human resources in place so that its objectives can be met.
Our Board includes nine directors with broad and diverse skills and viewpoints to aid the Company in advancing its strategy. In addition, promoting senior management within the organization fuels the ambitions of the talent force to earn future leadership roles.
Board and executive leadership compensation policyIn order to adapt to the changing business context and the highly competitive environment that we operate in, our executive compensation philosophy has evolved to reward long-term sustainable performance. Our Executive Compensation Policy moves away from a predominantly cash-based compensation structure to a total rewards structure where a significant portion of the rewards is in the form of stock incentives.
The nomination and remuneration committee determines and recommends to the Board the compensation payable to directors. All Board-level compensation is approved by the shareholders and disclosed separately in the financial statements. Remuneration for the executive directors comprises a fixed component and a variable component, including stock incentives. The committee makes a periodic appraisal of the performance of the executive directors based on a detailed performance matrix. The annual compensation of the executive directors is approved by the committee and placed before the shareholders at the shareholders’ meeting / postal ballot.

108 | Corporate governance report Infosys Annual Report 2017-18
The executive directors of the Company are entitled to an annual / half-yearly variable pay, including stock incentives, which is subject to the achievement of certain periodic milestones by the Company, as determined by the Board. The Board may reserve the authority to set such milestones on a GAAP or non-GAAP basis.
The compensation payable to the independent directors is limited to a fixed amount per year as determined and approved by the Board, the sum of which does not exceed 1% of net profits for the year, calculated as per the provisions of the Companies Act, 2013. The Board reviews the performance of independent directors on an annual basis.
Remuneration to directors in fiscal 2018in ` crore
Name of director Fixed salary Bonus / incentives / variable
pay
Perquisites on account of stock options
exercised(1)
Commission TotalBase
salary (A)
Retiral benefits
(B)
Total fixed
salary (A+B)
Non-executive, non-independent directorNandan M. Nilekani(2) – – – – – – –
Executive directorsSalil Parekh(3)(4) 1.41 0.09 1.50 (5) 2.48 – – 3.98U.B. Pravin Rao(6) 4.23 0.18 4.41 3.81 (7) – – 8.22Dr. Vishal Sikka(8)(9) 4.62 0.18 4.80 1.34 (10) 6.78 – 12.92
Independent directorsKiran Mazumdar-Shaw – – – – – 1.00 1.00Ravi Venkatesan – – – – – 1.43 1.43Roopa Kudva – – – – – 0.97 0.97Dr. Punita Kumar-Sinha – – – – – 1.33 1.33D.N. Prahlad – – – – – 0.95 0.95D. Sundaram(11) – – – – – 0.70 0.70R. Seshasayee(12) – – – – – 0.84 0.84Prof. Jeffrey S. Lehman(12) – – – – – 0.89 0.89Prof. John W. Etchemendy(12) – – – – – 0.60 0.60
Notes : The details in the above table are on accrual basis. For details on the number of equity shares held by the directors, refer to Annexure 6 to the Board’s report.
(1) In accordance with the definition of perquisites under the Income-tax Act, 1961, the remuneration includes the value of stock incentives only on those shares that have been exercised during the period. Accordingly, the value of stock incentives granted during the period is not included. The number of stock incentives granted in fiscal 2018 is mentioned in the notes below.
(2) Appointed as Chairman effective August 24, 2017. He voluntarily chose not to receive any remuneration for his services rendered to the Company.
(3) Appointed as Chief Executive Officer and Managing Director effective January 2, 2018. The appointment is for a term of five years with effect from January 2, 2018 to January 1, 2023 and the remuneration is approved by shareholders vide a postal ballot concluded on February 20, 2018.
(4) Pursuant to the approval of the shareholders through a postal ballot on February 20, 2018, Salil Parekh is eligible to receive the following under the 2015 Plan,
a) an annual grant of RSUs of fair value ̀ 3.25 crore which will vest over time in three equal annual installments upon completion of each year of service from the respective grant date
b) a one-time grant of RSUs of fair value `9.75 crore which will vest over time in two equal annual installments upon completion of each year of service from the grant date, and
c) an annual grant of performance-based RSUs of fair value `13 crore which will vest after completion of three years, the first of which concludes on March 31, 2021, subject to achievement of performance targets set by the Board or its committee. The Board, based on the recommendations of the nomination and remuneration committee, approved on February 27, 2018, the annual time-
based grant for fiscal 2018 of 28,256 RSUs and a one-time, time-based grant of 84,768 RSUs. The grants were made effective February 27, 2018. (5) Includes variable pay for the period from January 2, 2018 to March 31, 2018 is paid at an amount equal to 100% of target variable pay. (6) Appointed as Interim Chief Executive Officer and Managing Director effective August 18, 2017. Subsequently, on January 2, 2018, re-designated
as Chief Operating Officer and Whole-time Director. The salary remains unchanged on the appointment and redesignation.
In accordance with the Listing Regulations, no employee of the Company, including key managerial personnel or promoter, may enter into an agreement for himself, or on behalf of any other person, with any shareholder or any other third party with regard to compensation or profit-sharing in connection with dealings in the securities of the Company, unless it has been approved by a majority of the shareholders by way of an ordinary resolution. In such general meeting, those persons who are affected by such resolutions shall abstain from voting.

Corporate governance report | 109 Infosys Annual Report 2017-18
(7) On March 31, 2017, the shareholders vide a postal ballot approved a revision in the salary of U.B. Pravin Rao, COO and Whole-time Director, effective November 1, 2016. Based on fiscal 2016 performance, the nomination and remuneration committee, at its meeting held on October 14, 2016, recommended a grant of 27,250 RSUs and 43,000 ESOPs, amounting to ` 4 crore to U.B. Pravin Rao, under the 2015 Plan and the same was approved by the shareholders through a postal ballot on March 31, 2017. These RSUs and ESOPs were granted effective May 2, 2017.
(8) Resigned as Chief Executive Officer and Managing Director effective August 18, 2017 and as Executive Vice Chairman effective August 24, 2017. (9) Includes US$ 0.25 million (approximately `1.60 crore) and US$ 0.21 million (approximately `1.34 crore) as part of 90 days base pay in lieu of
notice and variable pay, respectively, for fiscal 2018 on account of resignation. (10) Perquisite value of stock incentives on account of exercise of 70,772 RSUs. Consequent to his resignation from the Company on August 24, 2017,
the unvested stock incentives (time-based and performance-based awards) granted to him were forfeited. (11) Appointed effective July 14, 2017. (12) Resigned effective August 24, 2017
Non-executive / independent directors’ remuneration (commission)Shareholders, at the 34th Annual General Meeting (AGM) held on June 22, 2015, approved a sum not exceeding 1% of the net profits of the Company per annum calculated in accordance with the provisions of Section 198 of the Act, to be paid and distributed among some or all of the directors of the Company (other than the Managing Director and whole-time directors) in a manner decided by the Board. This payment will be made with respect to the profits of the Company for each year.
We have paid ` 8.71 crore to our independent directors for the year ended March 31, 2018. Nandan M. Nilekani, Chairman, voluntarily chose not to receive any remuneration for his services rendered to the Company. Additionally, independent directors are also reimbursed for expenses incurred in performance of official duties. The aggregate amount was arrived at using the following criteria :
Particulars in ` crore in US$Fixed Board fee 0.49 75,000Board / committee attendance fee (1) 0.16 25,000Non-executive chairman fee 0.98 1,50,000Chairperson – audit committee 0.20 30,000Members – audit committee 0.13 20,000Chairperson – other committees 0.13 20,000Members – other committees 0.07 10,000Travel fee (per meeting) (2) 0.07 10,000Incidental fees (per meeting) (3) 0.01 1,000
Notes :1 US$ = ` 65.18 as on March 31, 2018 (1) The Company normally has five regular Board meetings in a year.
Independent directors are expected to attend the four quarterly Board meetings and the AGM.
(2) For directors based overseas, the travel fee shown is per Board meeting. This is based on the fact that additional travel time of two days will have to be accommodated for independent directors to attend Board meetings in India.
(3) For directors based overseas, incidental fees shown is per Board meeting. This fee is paid to non-executive directors for expenses incurred during their travel to attend Board meetings in India.
The Board believes that the above compensation structure is commensurate with global best practices in terms of remunerating non-executive / independent directors of a company of similar size, and adequately compensates for the time and contribution made by our non-executive / independent directors.
Employment agreements with executive directors
Salil Parekh, Chief Executive Officer and Managing DirectorThe Company entered into an executive employment agreement with Salil Parekh effective January 2, 2018. The agreement is available on our website, at https://www.infosys.com/investors/reports-filings/Documents/CEO-executive-employment-agreement2018.pdf. The shareholders approved the appointment and key terms of the agreement with Salil Parekh as CEO & MD, vide a postal ballot concluded on February 20, 2018. The postal ballot notice is available on our website, at https://www.infosys.com/investors/Documents/postal-ballot-jan2018.pdf
U.B. Pravin Rao, Chief Operating Officer and Whole-time DirectorThe Company entered into an executive employment agreement with U.B. Pravin Rao effective November 1, 2016. The agreement is available on our website, at https://www.infosys.com/investors/reports-filings/Documents/COO-executive-employment-agreement2018.pdf. The shareholders approved the revised terms of agreement with U.B. Pravin Rao vide a postal ballot concluded on March 31, 2017. The postal ballot notice is available on our website, at https://www.infosys.com/investors/Documents/postal-ballot-notice-feb2017.pdf.
Further, upon the resignation of Dr. Vishal Sikka, the Board appointed U.B. Pravin Rao, as Interim Chief Executive Officer and Managing Director at its meeting held on August 18, 2017. However, there was no change in the remuneration and terms of the employment agreement. With the appointment of Salil Parekh as Chief Executive Officer and Managing Director, the Board, at its meeting held on December 2, 2017, re-designated U.B. Pravin Rao as Chief Operating Officer and Whole-time Director with effect from January 2, 2018. His re-designation was also approved by the shareholders through a postal ballot concluded on February 20, 2018. The postal ballot notice is available on our website, at https://www.infosys.com/investors/Documents/postal-ballot-jan2018.pdf
Indemnification and mutual release agreementsWe have also entered into agreements to indemnify our directors and officers for claims brought against them to the fullest extent permitted under applicable law. These agreements, among other things, indemnify our directors and officers for certain expenses, judgments, fines and settlement amounts

110 | Corporate governance report Infosys Annual Report 2017-18
incurred by any such person in any action or proceeding, including any action by or in the right of Infosys Limited, arising out of such persons’ services as our director or officer, expenses in relation to public relation consultation if required. The agreements for mutual release of claims were entered by the Company with R. Seshasayee, Prof. Jeffrey Lehman and Prof. John Etchemendy at the time of their resignations from the Board. A separation agreement was entered with Dr. Vishal Sikka at the time of his resignation which includes mutual release and non-disparagement obligation.
Memberships in other boardsAn executive director may, with the prior consent of the Chairman of the Board, serve on the Board of two other
business entities, provided that such business entities are not in direct competition with our operations. Executive directors are also allowed to serve on the boards of corporate or government bodies whose interests are germane to the future of the IT and software business or the key economic institutions of the nation, or whose prime objective is to benefit society.
Independent directors are not expected to serve on the boards of competing companies. There are no other limitations except those imposed by law and good corporate governance practices.
The composition of the Board, and directorships held, as on March 31, 2018 are as follows :
Name of the director Designation Age India-listed companies(1)
All companies around the
world(2)
Committee memberships(3)
Chairperson of committees
(3)
Non-executive, non-independent directorNandan M. Nilekani 62 1 5 – –
Whole-time directors Salil Parekh Chief Executive Officer
and Managing Director 53 1 1 – –U.B. Pravin Rao Chief Operating Officer
and Whole-time Director 56 1 2 – –Independent directors
Kiran Mazumdar-Shaw(4) Lead Independent Director 65 6 16 3 –
Ravi Venkatesan Independent Director 55 2 2 1 1Roopa Kudva Independent Director 54 1 3 3 –Dr. Punita Kumar-Sinha Independent Director 55 6 10 6 2D.N. Prahlad Independent Director 62 1 7 – 1D. Sundaram Independent Director 65 4 8 3 4
Notes : There are no inter-se relationships between our Board members. (1) Including directorship in Infosys Limited (2) Directorship in companies around the world (listed, unlisted and private limited companies), including Infosys Limited and its subsidiaries (3) As required by Regulation 26 of the SEBI (Listing Obligations and Disclosure Requirements) Regulations, 2015, the disclosure includes membership /
chairpersonship of the audit committee and stakeholders relationship committee in Indian public companies (listed and unlisted). (4) Appointed as Lead Independent Director effective April 13, 2018
B. Board meetings
Scheduling and selection of agenda items for Board meetingsThe dates of Board meetings for the next fiscal are decided in advance and published in the Annual Report as part of Shareholder information. The non-executive Chairman of the Board and the Company Secretary draft the agenda for each meeting, along with explanatory notes, in consultation with the CEO & MD, and distribute these in advance to the directors. Every Board member can suggest the inclusion of additional items in the agenda. The Board meets at least once a quarter to review the quarterly results and other items on the agenda, and also on the occasion of the AGM. Additional meetings are held when necessary. Independent directors are expected to attend at least four Board meetings in a year.
However, with the Board being represented by independent directors from various parts of the world, it may not be possible for each one of them to be physically present at all meetings. Hence, we provide video / teleconferencing facilities to enable their participation. Committees of the Board usually meet the day before the Board meeting, or whenever the need arises for transacting business. The Board members are expected to rigorously prepare for, attend and participate in Board and applicable committee meetings. Each member is expected to ensure their other current and planned future commitments do not materially interfere with their responsibilities with us. During the year ended March 31, 2018, 11 Board meetings were held. These were held on April 12-13, 2017; June 24, 2017; July 13-14, 2017; August 3, 2017; August 18, 2017; August 19, 2017; August 24, 2017; August 25, 2017; October 23-24, 2017; December 2, 2017; January 11-12, 2018.

Corporate governance report | 111 Infosys Annual Report 2017-18
Attendance of directors during fiscal 2018
Board meeting and AGM attendance of directors during 2017-18
Name of director AGMJune 24,
2017
Board meeting number
Nandan M. Nilekani (1)
Salil Parekh (2)
U.B. Pravin Rao (3)
Kiran Mazumdar-Shaw (5)
Ravi Venkatesan (4)
Roopa Kudva
Dr. Punita Kumar-Sinha
D.N. Prahlad
D. Sundaram (6)
R. Seshasayee (7)
Dr. Vishal Sikka (8)
Prof. Jeffrey S. Lehman (9)
Prof. John W. Etchemendy (9)
Attended in person / through video conference Leave of absence
1 2 3 4 5 6 7 8 9
Attended through audio conference (not counted for quorum and for calculating % of attendance)
Held duringtenure (A)
Attended(B)
% of attendance(B / A)
5
1
11
11
11
11
11
11
9
7
7
7
7
100
100
91
82
91
82
91
100
100
86
71
57
86
5
1
10
9
10
9
10
11
9
6
5
4
6
10 11
(1) Appointed as non-executive, non-independent director and Chairman of the Board effective August 24, 2017(2) Appointed as CEO & MD effective January 2, 2018(3) Appointed as Interim CEO & MD effective August 18, 2017 and re-designated as COO and Whole-time Director effective January 2, 2018(4) Appointed as Co-Chairman of the Board effective April 13, 2017 and resigned as Co-Chairman of the Board effective August 24, 2017(5) Appointed as Lead Independent Director effective April 13, 2018(6) Appointed as independent director effective July 14, 2017(7) Resigned as Chairman and independent director effective August 24, 017(8) Resigned as CEO & MD effective August 18, 2017 and as director and executive vice chairman effective August 24, 2017(9) Resigned as independent directors effective August 24, 2017
Availability of information to Board membersThe Board has unrestricted access to all Company-related information, including that of our employees. At Board meetings, managers and representatives who can provide additional insights into the items being discussed are invited. Information is provided to the Board members on a continuous basis for their review, inputs and approval periodically. Strategic and operating plans are presented to the Board in addition to the quarterly and annual financial statements. Specific cases of acquisitions, important managerial decisions, material positive / negative developments and statutory matters are presented to the committees of the Board and later, with the recommendation of the committees, to the Board for its approval. As a process, information to directors is submitted along with the agenda well in advance of Board meetings. Inputs and feedback of Board members are taken and considered while preparing the agenda and documents for the Board meetings. Deep dive and immersion sessions are conducted by senior executives in their respective business units. At these meetings, directors can provide their inputs and suggestions on various strategic and operational matters.
Meeting of independent directorsSchedule IV of the Companies Act, 2013 and the Rules thereunder mandate that the independent directors of the Company hold at least one meeting in a year, without the attendance of non-independent directors and members of the Management.
Even before the Companies Act, 2013 came into effect, our Board’s policy mandated quarterly meetings attended exclusively by the independent directors. At such meetings, the independent directors discuss, among other matters, the performance of the Company and risks faced by it, the flow of information to the Board, competition, strategy, leadership strengths and weaknesses, governance, compliance, Board movements, human resource matters and performance of the executive members of the Board, including the Chairman.
Materially significant related party transactionsThere have been no materially significant related party transactions, monetary transactions or relationships between the Company and its directors, the Management, subsidiaries or relatives, except for those disclosed in the Board’s report. Detailed information on materially significant related party transactions is enclosed as Annexure 2 to the Board’s report.

112 | Corporate governance report Infosys Annual Report 2017-18
C. Board committeesThe Board, as on March 31, 2018, had six committees : audit committee, corporate social responsibility (CSR) committee, nomination and remuneration committee, risk and strategy committee, stakeholders relationship committee and finance and investment committee. All committees except the CSR committee consist entirely of independent directors.
Name of director Board
Nandan M. Nilekani
Salil Parekh
U.B. Pravin Rao
Kiran Mazumdar-Shaw
Ravi Venkatesan
Roopa Kudva
Dr. Punita Kumar-Sinha
D.N. Prahlad
D. Sundaram
Total no. of members 9
Board and committee composition
Chairperson Member
Risk andstrategy
committee
4
Stakeholdersrelationshipcommittee
3
Auditcommittee
4
Nomination andremuneration
committee
4
Corporate socialresponsibility
committee
4
Finance and investmentcommittee(1)
4
(1) Dissolved effective April 13, 2018.Note : The committee of directors, constituted on April 13, 2017, was dissolved effective January 12, 2018.
The Board, in order to execute the buyback procedures, had on August 19, 2017 formed the buyback committee comprising three directors, CFO, Deputy CFO, Group General Counsel and Company Secretary as members of the committee.
The Board, in consultation with the nomination and remuneration committee, is responsible for assigning and fixing terms of service for committee members. It delegates these powers to the nomination and remuneration committee.
The non-executive chairman of the Board, in consultation with the Company Secretary and the committee chairperson, determines the frequency and duration of the committee meetings. Normally, all the committees meet four times a year. The recommendations of the committees are submitted to the Board for approval. During the year, all recommendations of the committees were approved by the Board.
The quorum for meetings is the higher of two members or one-third of the total number of members of the committee.
1. Audit committeeOur audit committee comprised four independent directors as on March 31, 2018 :• D. Sundaram, Chairperson and Financial Expert• Roopa Kudva • Ravi Venkatesan• Dr. Punita Kumar-Sinha
D. Sundaram was appointed as member of the committee effective July 14, 2017 and Chairperson of the committee effective October 24, 2017.
Dr. Punita Kumar-Sinha was appointed as a member of the committee effective July 14, 2017.
Roopa Kudva ceased to be Chairperson of the committee effective October 24, 2017 but continued as a member of the committee.
Ravi Venkatesan ceased to be a member of the committee effective July 14, 2017 and was re-appointed as a member of the committee effective October 24, 2017.
Prof. Jeffrey S. Lehman. and R. Seshasayee ceased to be members of the committee effective August 24, 2017.
The Company Secretary acts as the secretary to the audit committee.
The primary objective of the audit committee is to monitor and provide an effective supervision of the Management’s financial reporting process, to ensure accurate and timely disclosures, with the highest levels of transparency, integrity and quality of financial reporting. The committee oversees the work carried out in the financial reporting process by the Management, the internal auditors and the independent auditors, and notes the processes and safeguards employed by each of them. The audit committee is responsible to select, evaluate and, where appropriate, replace the independent auditors in accordance with the law. All possible measures are taken by the committee to ensure the objectivity and independence of the independent auditors.
In India, we are listed on the BSE Limited (BSE) and the National Stock Exchange of India Limited (NSE). We are also listed on the NYSE, Euronext Paris and Euronext London. In India, Regulation 18 of the Listing Regulations and in the US, the Blue Ribbon Committee set up by the U.S. Securities and Exchange Commission (SEC) mandate that listed companies adopt an appropriate audit committee

Corporate governance report | 113 Infosys Annual Report 2017-18
charter. The audit committee charter containing exhaustive terms of reference was amended on April 13, 2018 and is available on our website, at https://www.infosys.com/investors/
corporate-governance/Documents/audit-committee-charter.pdf. The Board accepted all recommendations made by the audit committee during the year.
Audit committee attendanceThe audit committee held seven meetings during the year ended March 31, 2018. These were held on April 12, 2017, July 12 & 13, 2017, August 18, 2017, August 24, 2017, October 23 & 24, 2017, January 11 & 12, 2018 and March 16, 2018. The attendance details of the audit committee meetings are as follows :
Audit committee meeting
D. Sundaram
Roopa Kudva
Ravi Venkatesan
Dr. Punita Kumar-Sinha
Prof. Jeffrey S. Lehman
R. Seshasayee
Attended in person / through video conference Leave of absence
1 2 3 4 5 6 7
Attended through audio conference (not counted for quorum and for calculating % of attendance)
5
7
4
5
4
4
100
86
100
100
75
100
5
6
4
5
3
4
Name of director Committee meeting number Held duringtenure (A)
Attended(B)
% of attendance(B / A)
Audit committee report for the year ended March 31, 2018The audit committee is guided by the charter adopted by the Board, available on the Company’s website, at https://www.infosys.com/investors/corporate-governance/Documents/audit-committee-charter.pdf. The charter is reviewed annually and was last amended on April 13, 2018 to keep it relevant to the current composition and functions of the committee.
The audit committee helps the Board monitor the Management’s financial reporting process, and ensure that the disclosures are not only accurate and timely, but follow the highest levels of transparency, integrity and quality of financial reporting. The committee also oversees the work of the internal and the independent auditors, and reviews the processes and safeguards employed by them. The audit committee is responsible for recommending selection, evaluation and, where appropriate, replacement of the independent auditors in accordance with the law. It recommends to the Board the remuneration and terms of appointment of the internal, secretarial and independent auditors. All possible measures are taken by the committee to ensure the objectivity and independence of the independent auditors. In addition, the committee reviews the policies, processes and controls relating to the valuation of undertakings or assets of the Company that are carried out as and when required.
The committee is comprised solely of independent directors and fulfills the requirements of audit committee charter, as well as Section 149 of the Companies Act, 2013, Regulation 18 of the SEBI (Listing Obligations and Disclosure Requirements) Regulations and NYSE guidelines. The committee complies with the SEBI Listing Regulations, NYSE Euronext London and Euronext Paris exchange rules relating to its composition, independence of its members, disclosures relating to non-independent members, financial expertise of members and the audit committee charter. To carry out its responsibilities
efficiently and transparently, the committee relies on the Management’s financial expertise, and that of the internal and the independent auditors. The Management is responsible for the Company’s internal control over financial reporting and the financial reporting process. The independent auditors are responsible for performing an independent audit of the Company’s financial statements in accordance with the Generally Accepted Auditing Principles and for issuing a report based on the audit.
The audit committee met seven times and also held several meetings throughout the year over telephone calls for timely resolution of issues during fiscal 2018. The Management shared the Company’s financial statements, prepared in accordance with the Indian Accounting Standards (Ind AS) as specified under the Companies Act, 2013, read with the relevant rules thereunder and International Financial Reporting Standards (IFRS) as issued by the International Accounting Standards Board, with the committee. The committee held discussions with the auditors (whenever necessary, without any member of the Management being present) regarding the Company’s audited financial statements and sought the auditors’ judgment about the quality and applicability of the accounting principles, the reasonableness of significant judgment and the adequacy of disclosures in the financial statements. The Committee also reviewed with independent auditors the nature and scope of audit coverage, to ascertain adequacy and appropriateness. They also reviewed the management discussion and analysis of financial condition and results of operations.
The committee also discussed with the auditors the matters required by Public Company Accounting Oversight Board (PCAOB) Auditing Standard 1301, as adopted by the PCAOB in Rule 3200. Besides discussing the overall scope and plan for the internal audit, and requirements of SEC, SEBI and other regulatory bodies, the committee also reviewed

114 | Corporate governance report Infosys Annual Report 2017-18
the adequacy and effectiveness of the Company’s legal, regulatory and ethical compliance programs. As part of continuous improvements, a revision to the Code of Conduct and Ethics was recommended to the Board and was duly approved. The Committee also reviewed the other financial policies including the Treasury Policy, covering instruments and foreign currency hedges. The committee, on a periodic basis, reviewed the process adopted by the Management on impairment of assets including financial assets and goodwill.
The committee granted omnibus approval for the related party transactions proposed to be entered into by the Company during fiscal 2018. On a periodic basis, the committee reviewed and approved transactions of the Company with related parties and recommended the Board for approval as and when necessary.
During the year, the Committee reviewed and approved the Capital Allocation policy and recommended to the Board for adoption.
The committee monitored and reviewed investigations of the whistleblower complaints received during the year.
During the year, the committee also recommended the Board to submit a settlement application with SEBI for matters pertaining to severance agreement with the Company’s former CFO.
The committee also recommended the Board to delist the Company’s American Depositary Receipts from Euronext London and Paris.
The Board dissolved the Finance and Investment Committee and deliberated that the roles and responsibilities of the Finance and Investment Committee will be overseen by the audit committee, effective April 13, 2018.
Based on its discussion with the Management and the auditors, and a review of the representations of the Management and the report of the auditors, the committee has recommended the following to the Board :
• The audited financial statements of Infosys Limited prepared in accordance with Ind AS for the year ended March 31, 2018 be accepted by the Board as a true and fair statement of the financial status of the Company.
• The audited consolidated financial statements of Infosys Limited and its subsidiaries prepared in accordance with Ind AS for the year ended March 31, 2018 be accepted by the Board as a true and fair statement of the financial status of the Group.
• The audited consolidated financial statements of Infosys Limited and its subsidiaries prepared in Indian rupee in accordance with IFRS for the quarter and year ended March 31, 2018 be accepted by the Board as a true and fair statement of the financial status of the Group.
• The audited consolidated financial statements of Infosys Limited and its subsidiaries prepared in US dollar in accordance with IFRS for the year ended March 31, 2018, upon adoption by this committee, be accepted by the Board as a true and fair statement of the financial status of the Group and included in the Company’s Annual Report on Form 20-F, to be filed with the US Securities and Exchange Commission (SEC).
• Deloitte Haskins & Sells LLP, Chartered Accountants (Firm registration number 117366 W/W 100018) (‘Deloitte’) was appointed as the statutory auditors of the Company to hold office for a period of five consecutive years from the conclusion of the 36th AGM held on June 24, 2017, till the conclusion of the 41st AGM to be held in 2022, subject to ratification by shareholders at the general meeting or as may be necessitated by the Act from time to time. The first year of audit was of the financial statements for the year ending March 31, 2018, which included the audit of the quarterly financial statements for the year. Accordingly, the committee recommended the appointment of Deloitte to be placed before the shareholders for ratification.
• The appointment of Ernst & Young LLP as the internal auditors of the Company for the year ended March 31, 2019, to review various operations of the Company.
• The committee will be issuing a letter in line with Recommendation No. 9 of the Blue Ribbon Committee on audit committee effectiveness, to be provided in the financial statements prepared in accordance with IFRS in the Annual Report on Form 20-F.
• The appointment of Parameshwar G. Hegde of Hegde & Hegde, Company Secretaries, as secretarial auditor for the year ending March 31, 2019 to conduct the secretarial audit as prescribed under Section 204 and other applicable sections of the Companies Act, 2013.
Relying on its review and the discussions with the Management and the independent auditors, the committee believes that the Company’s financial statements are fairly presented in conformity with Ind AS and IFRS, and that there is no significant deficiency or material weakness in the Company’s internal control over financial reporting.
In conclusion, the committee is sufficiently satisfied that it has complied with its responsibilities as outlined in the audit committee charter.
Sd/-
Bengaluru April 13, 2018
D. SundaramChairperson

Corporate governance report | 115 Infosys Annual Report 2017-18
2. Corporate social responsibility (CSR) committee
Our CSR committee comprises three independent directors and the COO and Whole-time Director as members as on March 31, 2018 :
• Kiran Mazumdar-Shaw, Chairperson
• U.B. Pravin Rao
• Roopa Kudva
• Dr. Punita Kumar-Sinha
Kiran Mazumdar-Shaw was appointed as Chairperson of the committee effective August 26, 2017.
U.B. Pravin Rao and Roopa Kudva were appointed as members of the committee effective August 26, 2017.
Dr. Punita Kumar-Sinha was appointed as a member of the committee effective October 24, 2017.
R. Seshasayee ceased to be Chairperson of the committee effective August 24, 2017.
Dr. Vishal Sikka ceased to be a member effective August 24, 2017.
Prof. John W. Etchemendy was appointed as a member of the committee effective July 14, 2017 and ceased to be a member effective August 24, 2017.
While aiming to generate maximum profit for our shareholders through the year, we also focus on our social and environmental responsibilities to fulfill the needs and expectations of the communities around us. Our CSR is not limited to philanthropy, but encompasses holistic community development, institution-building and sustainability-related initiatives.
The CSR committee was set up to formulate and monitor the CSR policy of the Company. The CSR committee adopted a policy that outlines the Company’s objective of catalyzing economic development that positively improves the quality of life for the society, and aims to be a responsible corporate citizen and create positive impact through its activities on the environment, communities and stakeholders.
The CSR committee is also responsible for overseeing the activities / functioning of the Infosys Foundation and Infosys Foundation USA in identifying the areas of CSR activities, programs and execution of initiatives as per pre-defined guidelines. The Foundations, in turn, guide the CSR committee in reporting the progress of deployed initiatives, and making appropriate disclosures (internal / external) on a periodic basis.
The CSR committee charter and the CSR policy of the Company are available on our website, at http://www.infosys.com/investors/corporate-governance/Pages/policies.aspx.
CSR committee attendanceThe committee held four meetings during the year ended March 31, 2018. These were held on April 12, 2017, July 13, 2017, October 19, 2017 and January 3, 2018. The attendance details of the committee meetings are as follows :
CSR committee meeting
Name of director Committee meeting number
Kiran Mazumdar-Shaw
U.B. Pravin Rao
Roopa Kudva
Dr. Punita Kumar-Sinha
R. Seshasayee
Dr. Vishal Sikka
1 2 3 4
Held duringtenure (A)
Attended(B)
% of attendance(B / A)
4
2
2
1
2
2
100
100
50
100
100
100
4
2
1
1
2
2
Attended in person / through video conference Attended through audio conference (not counted for quorum and for calculating % of attendance)
CSR committee report for the year ended March 31, 2018The CSR report, as required under the Companies Act, 2013 for the year ended March 31, 2018 is attached as Annexure 7 to the Board’s report.
The committee on a periodic basis reviewed and approved the budget and disbursement for Infosys Foundation and Infosys Foundation USA.
3. Nomination and remuneration committeeOur nomination and remuneration committee comprised four independent directors as on March 31, 2018 :
• Kiran Mazumdar-Shaw, Chairperson
• D.N. Prahlad
• Ravi Venkatesan
• D. Sundaram
Kiran Mazumdar-Shaw was appointed as Chairperson, while Ravi Venkatesan and D. Sundaram were appointed as members of the committee effective July 14, 2017.
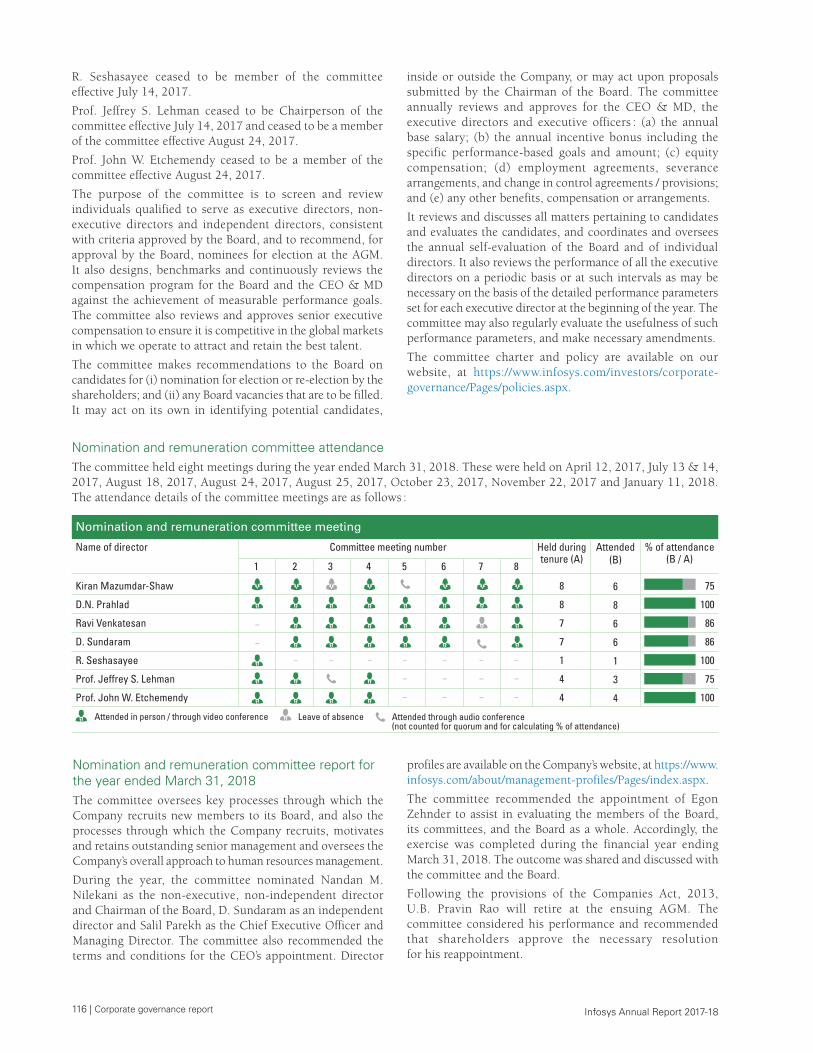
116 | Corporate governance report Infosys Annual Report 2017-18
R. Seshasayee ceased to be member of the committee effective July 14, 2017.
Prof. Jeffrey S. Lehman ceased to be Chairperson of the committee effective July 14, 2017 and ceased to be a member of the committee effective August 24, 2017.
Prof. John W. Etchemendy ceased to be a member of the committee effective August 24, 2017.
The purpose of the committee is to screen and review individuals qualified to serve as executive directors, non- executive directors and independent directors, consistent with criteria approved by the Board, and to recommend, for approval by the Board, nominees for election at the AGM. It also designs, benchmarks and continuously reviews the compensation program for the Board and the CEO & MD against the achievement of measurable performance goals. The committee also reviews and approves senior executive compensation to ensure it is competitive in the global markets in which we operate to attract and retain the best talent.
The committee makes recommendations to the Board on candidates for (i) nomination for election or re-election by the shareholders; and (ii) any Board vacancies that are to be filled. It may act on its own in identifying potential candidates,
Nomination and remuneration committee report for the year ended March 31, 2018The committee oversees key processes through which the Company recruits new members to its Board, and also the processes through which the Company recruits, motivates and retains outstanding senior management and oversees the Company’s overall approach to human resources management.
During the year, the committee nominated Nandan M. Nilekani as the non-executive, non-independent director and Chairman of the Board, D. Sundaram as an independent director and Salil Parekh as the Chief Executive Officer and Managing Director. The committee also recommended the terms and conditions for the CEO’s appointment. Director
inside or outside the Company, or may act upon proposals submitted by the Chairman of the Board. The committee annually reviews and approves for the CEO & MD, the executive directors and executive officers : (a) the annual base salary; (b) the annual incentive bonus including the specific performance-based goals and amount; (c) equity compensation; (d) employment agreements, severance arrangements, and change in control agreements / provisions; and (e) any other benefits, compensation or arrangements.
It reviews and discusses all matters pertaining to candidates and evaluates the candidates, and coordinates and oversees the annual self-evaluation of the Board and of individual directors. It also reviews the performance of all the executive directors on a periodic basis or at such intervals as may be necessary on the basis of the detailed performance parameters set for each executive director at the beginning of the year. The committee may also regularly evaluate the usefulness of such performance parameters, and make necessary amendments.
The committee charter and policy are available on our website, at https://www.infosys.com/investors/corporate-governance/Pages/policies.aspx.
Nomination and remuneration committee attendanceThe committee held eight meetings during the year ended March 31, 2018. These were held on April 12, 2017, July 13 & 14, 2017, August 18, 2017, August 24, 2017, August 25, 2017, October 23, 2017, November 22, 2017 and January 11, 2018. The attendance details of the committee meetings are as follows :
Nomination and remuneration committee meeting
Kiran Mazumdar-Shaw
D.N. Prahlad
Ravi Venkatesan
D. Sundaram
R. Seshasayee
Prof. Jeffrey S. Lehman
Prof. John W. Etchemendy
1 2 3 4 5 6 7 8
Leave of absence
8
8
7
7
1
4
4
75
100
86
86
100
75
100
6
8
6
6
1
3
4
Name of director Committee meeting number Held duringtenure (A)
Attended(B)
% of attendance(B / A)
Attended in person / through video conference Attended through audio conference (not counted for quorum and for calculating % of attendance)
profiles are available on the Company’s website, at https://www.infosys.com/about/management-profiles/Pages/index.aspx.
The committee recommended the appointment of Egon Zehnder to assist in evaluating the members of the Board, its committees, and the Board as a whole. Accordingly, the exercise was completed during the financial year ending March 31, 2018. The outcome was shared and discussed with the committee and the Board.
Following the provisions of the Companies Act, 2013, U.B. Pravin Rao will retire at the ensuing AGM. The committee considered his performance and recommended that shareholders approve the necessary resolution for his reappointment.

Corporate governance report | 117 Infosys Annual Report 2017-18
As part of the ongoing process, the committee reviewed the composition and structure of Board committees. It suggested certain changes to the composition of the committees from time to time. Further, the committee recommended the dissolution of the committee of directors with effect from January 12, 2018, and the dissolution of the finance and investment committee with effect from April 13, 2018. The roles and responsibilities of the finance and investment committee will be included as part of the audit committee charter.
The committee designated Inderpreet Sawhney, Group General Counsel as an executive officer and key managerial personnel under Ind AS 24 for the purpose of reporting under SEC rules.
The committee also reviewed the existing tenure of all its directors and criteria for the appointment of directors, undertook a review of the succession plans for key leadership positions, and helped to shape and monitor the development plans of key leadership personnel. Substantial focus was placed on improving the overall diversity of the workforce and enhancing employee engagement through real-time feedback from employees.
Stock incentives were approved and granted to eligible employees of the Company and subsidiaries during the year with a view to attracting and retaining the best talent, encouraging employees to align individual performance with the Company objectives, promoting increased participation by them in the growth of the Company, and aligning with shareholder value creation.
The committee reviewed various initiatives undertaken by the Company to ensure the safety, security and wellbeing of employees, as well as their overall development through learning programs and on-the-job training. The committee also gave broad directions to guide the overall leadership development plans of the Company.
The committee identified ongoing training and education programs to ensure that the non-executive directors are
Risk and strategy committee attendanceThe risk and strategy committee held four meetings during the year ended March 31, 2018. These were held on April 12, 2017, July 13, 2017, October 23, 2017, and January 11, 2018. The attendance details of the risk and strategy committee meetings are as follows :
Risk and strategy committee meeting
D.N. Prahlad
D. Sundaram
Kiran Mazumdar-Shaw
Ravi Venkatesan
Roopa Kudva
Dr. Punita Kumar-Sinha
Prof. John W. Etchemendy
1 2 3 4
4
2
4
4
2
2
2
100
100
100
100
100
100
100
4
2
4
4
2
2
2
Name of director Committee meeting number Held duringtenure (A)
Attended(B)
% of attendance(B / A)
Attended in person / through video conference
provided with adequate information regarding the business, the industry, and their legal responsibilities and duties.
Sd/-
Bengaluru April 12, 2018
Kiran Mazumdar-ShawChairperson
4. Risk and strategy committeeOur risk and strategy committee comprised four independent directors as on March 31, 2018 :• D.N. Prahlad, Chairperson• D. Sundaram• Kiran Mazumdar-Shaw• Ravi Venkatesan
D.N. Prahlad was appointed as Chairperson of the committee effective July 14, 2017 and consequently, Ravi Venkatesan ceased to be the Chairperson but continued as a member.
D. Sundaram was appointed as a member of the committee effective July 14, 2017.
Dr. Punita Kumar-Sinha and Roopa Kudva ceased to be members of the committee effective July 14, 2017.
Prof. John W. Etchemendy ceased to be a member effective August 24, 2017.
The purpose of the risk and strategy committee is to assist the Board in fulfilling its responsibilities with regard to the identification, evaluation and mitigation of operational, strategic and environmental risks. The risk and strategy committee has the overall responsibility of monitoring and approving the risk policies and associated practices of the Company. It is also responsible for reviewing and approving risk disclosure statements in public documents or disclosures.
The risk and strategy committee charter is available on our website, at https://www.infosys.com/investors/corporate-governance/Documents/risk-management-committee-charter.pdf. Further, the risk and strategy framework of the Company is part of the Risk Management Report section of the Annual Report.

118 | Corporate governance report Infosys Annual Report 2017-18
Risk and strategy committee report for the year ended March 31, 2018The risk and strategy committee reviewed the Company’s progress on strategy execution, its risk management practices and activities on a quarterly basis. This included a review of strategic programs for the achievement of short and long-term business objectives covering growth, profitability, business model, talent, leadership and operational excellence of various business units. The committee reviewed the top strategic, operational and compliance risks associated with achieving these business objectives, and the actions taken to address these risks. The committee performed these reviews using the Company’s enterprise risk management framework, the corporate strategy execution scorecard and trend lines of top risks.
In accordance with the scheduled annual calendar, the committee reviewed strategy and risk management in the areas of momentum of new services, software, automation, US talent localization, cyber security, employee engagement, critical project risks including GSTN project, insourcing trends, leadership development, shareholder concerns, service delivery risks, cost optimization, and immigration regulation risk. The members of the committee conducted deep dive exercises in the above areas through the year.
Further, the committee reviewed the Company’s enterprise risk management framework, processes used to identify top strategic, operational and compliance-related risks, trend lines of top risks in terms of impact, likelihood of occurrence, potential exposure and progress of mitigation actions. The committee prioritized the critical risk areas and refreshed its approach towards risk mitigation.
The committee shared regular updates with the Board regarding all aspects of strategy and risk management. While acknowledging the competitive and dynamic nature of the business environment, and based on the information made available to it, the committee believes that the Infosys risk framework, along with risk assessment, monitoring,
mitigation and reporting practices, is adequate to effectively manage the foreseeable material risks.
In conclusion, the committee is sufficiently satisfied that it has complied with its responsibilities as outlined in the risk and strategy committee charter.
Sd/-
Bengaluru April 12, 2018
D.N. PrahladChairperson
5. Stakeholders relationship committeeThe stakeholders relationship committee has the mandate to review and redress stakeholder grievances.
Our stakeholders relationship committee comprised three independent directors as on March 31, 2018 :
• Ravi Venkatesan, Chairperson
• Roopa Kudva
• Dr. Punita Kumar-Sinha
Ravi Venkatesan was appointed as Chairperson of the committee effective July 14, 2017.
Roopa Kudva and Dr. Punita Kumar-Sinha were appointed as members of the committee effective July 14, 2017.
Kiran Mazumdar-Shaw was appointed as a member of the committee effective July 14, 2017 and ceased to be a member effective October 24, 2017.
D.N. Prahlad ceased to be a member of the committee effective July 14, 2017.
Prof. John W. Etchemendy ceased to be a member of the committee effective July 14, 2017.
Prof. Jeffrey S. Lehman ceased to be Chairperson of the committee effective July 14, 2017.
The Board has appointed A.G.S. Manikantha, Company Secretary, as the Compliance Officer, as required under the Listing Regulations, with effect from December 1, 2015 and the Nodal Officer for the purpose of IEPF Regulations.
Stakeholders relationship committee attendanceThe stakeholders relationship committee held four meetings during the year ended March 31, 2018. These were held on April 13, 2017, July 14, 2017, October 23, 2017 and January 11, 2018. The attendance details of the stakeholders relationship committee meetings are as follows :
Stakeholders relationship committee meeting
Ravi Venkatesan
Roopa Kudva
Dr. Punita Kumar-Sinha
Kiran Mazumdar-Shaw
Prof. John W. Etchemendy
D.N. Prahlad
Prof. Jeffrey S. Lehman
1 2 3 4
4
3
3
2
1
1
2
100
67
100
100
100
0
100
4
2
3
2
1
0
2
Name of director Committee meeting number Held duringtenure (A)
Attended(B)
% of attendance(B / A)
Leave of absenceAttended in person / through video conference

Corporate governance report | 119 Infosys Annual Report 2017-18
Stakeholders relationship committee report for the year ended March 31, 2018The committee assists the Board and the Company in maintaining healthy relationships with all stakeholders. The committee oversees the mechanisms for redressing grievances and complaints from stakeholders including shareholders, debenture holders, other security holders, vendors, customers, employees and others.
During the year, the committee reviewed reports on environment, health and safety. They also took note of the vendor partner satisfaction survey conducted by a third-party consultant and took note of updates on the various sustainability initiatives undertaken by the Company.
During the year, the Company initiated a shareholder consultation process. The specific focus of the consultation was to obtain feedback on the Company’s corporate governance practices, in relation to Board composition, executive compensation structure and Capital Allocation Policy. The process involved interaction with a cross section of investors, which included direct interactions with certain institutional investors and telephonic interviews with others. The outcome of the consultation was presented by the committee and was taken on record by the Board on January 11, 2018. The committee considers the views expressed by the investors as crucial feedback for the Board, for effective corporate governance and to continue aligning itself with global best practices.
During the year, the committee also took note of the unclaimed equity shares transferred to the Investor Education and Protection Fund (IEPF) pursuant to the IEPF Rules.
The charter of the committee as adopted by the Board is available on the Company’s website, at https://www.infosys.com/investors/corporate-governance/Documents/stakeholders-relationship-committee.pdf.
The committee expresses satisfaction with the Company’s performance in dealing with investor grievances and its share transfer system.
The committee is sufficiently satisfied that it has complied with its responsibilities as outlined in the committee charter. The details of the complaints resolved during the year ended March 31, 2018 are as follows :
Nature of complaints Received Resolved PendingDividend / Annual Report related 1,286 1,286 NilBuyback queries 12,349 12,349 Nil
It has also been noted that the shareholding in dematerialized mode as on March 31, 2018 was 99.82% (99.81% as of March 31, 2017).
Sd/-
Bengaluru April 12, 2018
Ravi VenkatesanChairperson
6. Finance and investment committeeThe Board had constituted the finance and investment committee to assist it in overseeing acquisitions and investments made by the Company and provide oversight on key investment policies of the Company.
The finance and investment committee comprised four independent directors as on March 31, 2018 :• Dr. Punita Kumar-Sinha, Chairperson• Kiran Mazumdar-Shaw• Roopa Kudva• D.N. Prahlad
D.N. Prahlad was appointed as a member of the committee effective July 14, 2017.
Ravi Venkatesan ceased to be a member of the committee effective July 14, 2017.
Prof. John W. Etchemendy ceased to be a member effective August 24, 2017.
The Board dissolved the finance and investment committee effective April 13, 2018 and delegated its roles and responsibilities to the audit committee.
Finance and investment committee attendanceThe finance and investment committee held four meetings during the fiscal ended March 31, 2018. The meetings were held on April 12, 2017, July 13, 2017, October 23, 2017 and January 11, 2018. The attendance details of the finance and investment committee meetings are as follows :
Finance and investment committee meeting
Dr. Punita Kumar-Sinha
Kiran Mazumdar-Shaw
Roopa Kudva
D.N. Prahlad
Ravi Venkatesan
Prof. John W. Etchemendy
1 2 3 4
4
4
4
2
2
2
100
100
75
100
100
100
4
4
3
2
2
2
Name of director Committee meeting number Held duringtenure (A)
Attended(B)
% of attendance(B / A)
Leave of absenceAttended in person / through video conference

120 | Corporate governance report Infosys Annual Report 2017-18
Finance and investment committee report for the year ended March 31, 2018During the year, the finance and investment committee discussed, reviewed and approved the overall acquisition and investment strategy of the Company in terms of business objectives, capital allocation and focus areas for investments and acquisitions. The committee was updated on the acquisitions that were in the pipeline, the evaluation framework for mergers and acquisitions, post-merger integration, risk mitigation, strategic benefits and financial returns. The committee reviewed and approved the objectives of the Infosys Innovation Fund. The committee was updated on the status of engagement with investee companies and the returns of the fund.
The committee also considered and approved the proposals for acquisitions and investments up to a certain threshold as approved by the Board.
Furthermore, the treasury policy of the Company was also discussed and approved by the committee.
The committee took stock of its overall effectiveness and updated the Board on the deliberations and decisions made during the year.
The committee periodically approved the purchase and sale of investments as well as fair-value changes in the value of investments.
The committee had direct access and open communications with the senior leaders of the Company.
Sd/-
Bengaluru
April 12, 2018Dr. Punita Kumar-Sinha
Chairperson
Committee of directorsThe committee of directors was constituted effective April 13, 2017 to periodically review the execution of strategies, and to support the Management with inputs in navigating the Company’s transformational journey.
The committee comprised R. Seshasayee as chairperson, and Ravi Venkatesan and D.N. Prahlad as members. Consequent to the resignation of R. Seshasayee, Ravi Venkatesan was appointed as the chairperson effective August 26, 2017.
The committee held periodic meetings during the year to review execution of strategy and key initiatives.
The committee was formed to support and advise the Management in executing the Company’s strategy. With the appointment of Salil Parekh as the CEO & MD, the Board, at its meeting held on January 12, 2018, dissolved the committee.
D. Management review and responsibility
Formal evaluation of officersThe nomination and remuneration committee of the Board approves the compensation and benefits for all executive Board members. A committee headed by our CEO & MD reviews, evaluates and decides the annual compensation of senior executives.
Board interaction with clients, employees, institutional investors, the government and the mediaThe Chairman, the CEO & MD, the COO, the CFO, the Presidents, the Deputy CFO, and investors relations team represent the Company in interactions with investors, the media and various governments. In addition, the CEO & MD, the COO, the CFO and the Presidents manage interactions with clients and employees. The other authorized media spokespersons for business specific matters include the Presidents and Heads of HR.
E. Shareholders
Disclosures regarding the appointment or reappointment of directorsAs per the provisions of the Companies Act, 2013, U.B. Pravin Rao will retire at the ensuing AGM and being eligible, seek reappointment. The Board, based on its evaluation, has recommended his reappointment.
The Companies Act, 2013 provides for the appointment of independent directors. Sub-section (10) of Section 149 of the Companies Act, 2013 (effective April 1, 2014) provides that independent directors shall hold office for a term of up to five consecutive years on the board of a company, and shall be eligible for reappointment on the passing of a special resolution by the shareholders of the Company. Accordingly, all independent directors were appointed by the shareholders either at the general meeting or through a postal ballot as required under Section 149(10).
Further, Section 149(11) states that no independent director shall be eligible to serve on the Board for more than two consecutive terms of five years. Section 149(13) states that the provisions of retirement by rotation, as defined in sub sections (6) and (7) of Section 152 of the Act, shall not apply to such independent directors. None of the independent directors will retire at the ensuing AGM.
Communication to the shareholdersThe quarterly report, along with additional information and official news releases, are posted on our website, at https://www.infosys.com/investors/reports-filings/. The reports contain select financial data extracted from the audited consolidated financial statements under the IFRS (INR), and unaudited condensed consolidated financial statements under the IFRS (USD). Moreover, the quarterly / annual results and official news releases are generally published in The Economic Times, The Times of India, Business Standard, Business Line, Financial Express and Prajavani (a regional daily published from Bengaluru). Quarterly and annual financial statements, along with segmental information, are also posted on our website, at https://www.infosys.com/investors/reports-filings/. Earnings calls with analysts and investors are broadcast live on our website and their transcripts are also published on the website. The proceedings of the AGM are webcast live for shareholders across the world. The AGM presentations, transcripts and video archives are available on our website, at https://www.infosys.com/investors/reports-filings/.

Corporate governance report | 121 Infosys Annual Report 2017-18
Further, Form 20-F, to be filed with the SEC, also contains detailed disclosures and is available on our website, at https://www.infosys.com/investors/reports-filings/annual-report/Pages/index.aspx.
The shareholders can access the details of corporate governance policies, Board committee charters, Memorandum and Articles of Association, financial information, shareholding information, details of unclaimed dividend and shares transferred / liable to transfer to IEPF, etc on the Company’s website. The shareholders can also visit www.sec.gov where the investors can view statutory filings of the Company with the Securities and Exchange Commission, USA.
Other information such as press releases, stock exchange disclosures and presentations made to investors and analysts etc. are regularly updated on the Company’s website.
Investor grievance and share transfer systemWe have a Board-level stakeholders relationship committee to examine and redress complaints by shareholders and investors. The status of complaints and share transfers is reported to the entire Board. The details of shares transferred and the nature of complaints are provided in the Shareholder information section of the Annual Report. For shares transferred in physical form, the Company provides adequate notice to the seller before registering the transfer of shares. The stakeholders relationship committee will meet as often as required to approve share transfers. For matters regarding shares transferred in physical form, share certificates, dividends, and change of address, shareholders should communicate with Karvy Computershare Private Limited, our registrar and share transfer agent. Their address is published in the Shareholder information section of the Annual Report.
Share transactions are simpler and faster in electronic form. After a confirmation of a sale / purchase transaction from the broker, shareholders should approach the depository participant with a request to debit or credit the account for the transaction. The depository participant will immediately arrange to complete the transaction by updating the account. There is no need for a separate communication to the Company to register the transfer.
Details of non-complianceNo penalty has been imposed by any stock exchange, SEBI or SEC, nor has there been any instance of non-compliance with any legal requirements, or on matters relating to the capital market over the last three years.
SEBI settlement applicationThe Company has submitted a settlement application on December 5, 2017 with SEBI. The settlement application pertains to matters relating to the severance agreement entered into with Rajiv Bansal, the Company’s former CFO, in October 2015. Through the settlement process, the Company wants to resolve allegations relating to the Company not seeking prior and separate approval of the nomination and remuneration committee and the audit committee in relation to the severance agreement entered into with Rajiv Bansal; and in relation to disclosures pertaining to the said severance agreement, cessation of payments and initiation of arbitration
under the severance agreement. The settlement application process is based on an undertaking that the Company will neither admit nor deny the finding of fact or conclusion of law. The Company will provide an update upon the conclusion of the settlement process.
Auditors’ certificate on corporate governanceAs required by Schedule V of the Listing Regulations, the Auditors’ certificate on corporate governance is enclosed as Annexure 4 to the Board’s report.
In addition to getting certified by the auditors, we have also voluntarily engaged a Practicing Company Secretary to audit us on corporate governance and issue a report.
CEO and CFO certificationAs required by the Listing Regulations, the CEO and CFO certification is provided in this Annual Report.
Code of conductIn compliance with Regulation 26(3) of the Listing Regulations and the Companies Act, 2013, the Company has framed and adopted a Code of Conduct and Ethics (‘the Code’). In January 2018, the Company amended the Code. The Code is applicable to the members of the Board, the executive officers and all employees of the Company and its subsidiaries. The amended Code is available on our website, at https://www.infosys.com/investors/corporate-governance/Documents/CodeofConduct.pdf.
All members of the Board, the executive officers and senior officers have affirmed compliance to the Code as on March 31, 2018.
A declaration to this effect, signed by the CEO & MD and the CFO, forms part of the CEO and CFO certification.
Establishment of vigil / whistleblower mechanismThe Company has established a mechanism for directors and employees to report concerns about unethical behavior, actual or suspected fraud, or violation of our Code of Conduct and Ethics. It also provides for adequate safeguards against the victimization of employees who avail of the mechanism, and allows direct access to the chairperson of the audit committee in exceptional cases.
Prevention of insider tradingThe Company has adopted an insider trading policy to regulate, monitor and report trading by insiders under the SEBI (Prohibition of Insider Trading) Regulations, 2015. This policy also includes practices and procedures for fair disclosure of unpublished price-sensitive information, initial and continual disclosure. The Company has automated the declarations and disclosures to identified designated employees, and the Board reviews the policy on a need basis. The policy is available on our website, at https://www.infosys.com/investors/corporate-governance/Documents/insider-trading-policy.pdf.

122 | Corporate governance report Infosys Annual Report 2017-18
General body meetings / postal ballotsThe details of the last three Annual and / or Extraordinary General Meetings are as follows :
Year ended Date and time Venue Special resolution passed Web link for webcast / transcriptsMarch 31, 2017
June 24, 2017 at 3 p.m. IST
Christ University Auditorium, Hosur Road, Bengaluru, India
None https://www.infosys.com/investors/news-events/annual-general-meeting/2017/
March 31, 2016
June 18, 2016 at 3 p.m. IST
Christ University Auditorium, Hosur Road, Bengaluru, India
None https://www.infosys.com/investors/news-events/annual-general-meeting/2016/
March 31, 2015
June 22, 2015 at 3 p.m. IST
Christ University Auditorium, Hosur Road, Bengaluru, India
Purchase of the healthcare business from Infosys Public Services, Inc.
https://www.infosys.com/investors/news-events/annual-general-meeting/2015/
Postal ballotDuring the previous three years, the Company approached the shareholders through postal ballot. The details of the postal ballot for the last three years are as follows :
Date of Postal Ballot Notice : January 3, 2018 Voting period : January 22, 2018 to February 20, 2018Date of declaration of result : February 22, 2018 Date of approval : February 20, 2018
Name of the resolution Type of resolution
No. of votes polled
Votes cast in favor Votes cast againstNo. of votes % No. of votes %
Appointment of Salil Parekh as Chief Executive Officer and Managing Director Ordinary 157,94,08,811 154,71,96,182 98 3,22,12,629 2Re-designation of U.B. Pravin Rao as Chief Operating Officer and Whole-time Director Ordinary 157,93,63,514 157,90,81,990 100 2,81,524 0
Date of Postal Ballot Notice : August 25, 2017 Voting period : September 8, 2017 to October 7, 2017Date of declaration of result : October 9, 2017 Date of approval : October 7, 2017
Name of the resolution Type of resolution
No. of votes polled
Votes cast in favor Votes cast againstNo. of votes % No. of votes %
Approval for the buyback of equity shares of the Company Special 166,28,01,719 162,35,47,944 98 3,92,53,775 2Appointment of D. Sundaram as an independent director Ordinary 165,96,78,918 165,26,03,591 100 70,75,327 0Appointment of Nandan M. Nilekani as non-executive, non-independent director Ordinary 166,02,56,590 165,20,13,861 100 82,42,729 0Appointment of U.B. Pravin Rao as Managing Director Ordinary 163,09,23,718 162,45,34,518 100 63,89,200 0

Corporate governance report | 123 Infosys Annual Report 2017-18
Date of Postal Ballot Notice : February 23, 2017 Voting period : March 2, 2017 to March 31, 2017Date of declaration of result : April 1, 2017 Date of approval : March 31, 2017
Name of the resolution Type of resolution
No. of votes polled
Votes cast in favor Votes cast againstNo. of votes % No. of votes %
Revision in compensation of U.B. Pravin Rao, COO & Whole-time Director Ordinary 137,12,24,745 92,49,13,910 67 44,62,63,134 33Appointment of D.N. Prahlad as an independent director Ordinary 167,43,63,518 158,72,74,761 95 8,70,41,236 05To adopt new Articles of Association of the Company in conformity with the Companies Act, 2013 Special 169,34,41,703 163,60,28,571 97 5,73,64,390 03
Date of Postal Ballot Notice : February 24, 2016 Voting period : March 2, 2016 to March 31, 2016Date of declaration of result : April 1, 2016 Date of approval : March 31, 2016
Name of the resolution Type of resolution
No. of votes polled
Votes cast in favor Votes cast againstNo. of votes % No. of votes %
Approval of the 2015 Stock Incentive Compensation Plan and grant of stock incentives to eligible employees of the Company under the plan Special 165,29,05,091 128,68,89,953 78 36,60,15,138 22Approval of the 2015 Stock Incentive Compensation Plan and grant of stock incentives to eligible employees of the Company’s subsidiaries under the plan Special 168,34,47,465 128,51,57,246 76 39,82,90,219 24Reappointment of Prof. Jeffrey S. Lehman, as an independent director Special 167,99,54,463 142,84,20,139 85 25,15,34,324 15Appointment of Dr. Punita Kumar-Sinha as an independent director Ordinary 142,83,80,842 131,12,96,516 92 11,70,84,326 8Reappointment of Dr. Vishal Sikka as CEO & MD Ordinary 143,07,68,573 141,25,89,586 99 1,81,78,987 1
Date of Postal Ballot Notice : April 24, 2015 Voting period : May 5, 2015 to June 3, 2015Date of declaration of result : June 4, 2015 Date of approval : June 4, 2015
Name of the resolution Type of resolution
No. of votes polled
Votes cast in favor Votes cast againstNo. of votes % No. of votes %
Increase in authorized share capital Ordinary 80,43,28,358 72,40,12,049 90.01 17,59,832 0.22Alteration of the Capital Clause of the Memorandum of Association Special 80,43,04,819 72,39,56,209 90.01 17,65,073 0.22Approval for the issue of bonus shares Special 80,43,53,942 72,59,81,795 90.26 39,327 –Transfer of business of Finacle to the Company’s subsidiary, EdgeVerve Systems Limited Special 80,12,64,425 71,91,16,849 89.75 38,09,305 0.48Transfer of business of Edge Services to the Company’s subsidiary, EdgeVerve Systems Limited Special 80,43,30,233 72,28,20,643 89.87 31,70,965 0.39
Parameshwar G. Hegde of Hegde & Hegde, Company Secretaries, was appointed as the scrutinizer for carrying out the postal ballot process in a fair and transparent manner.

124 | Corporate governance report Infosys Annual Report 2017-18
Procedure for postal ballotIn compliance with Sections 108 and 110 and other applicable provisions of the Companies Act, 2013, read with the related Rules, the Company provides electronic voting (e-voting) facility, in addition to physical ballot, to all its members. For this purpose, the Company has engaged the services of NSDL.
Postal ballot notices and forms are dispatched, along with postage-prepaid business reply envelopes to registered members / beneficiaries. The same notice is sent by email to members who have opted for receiving communication through the electronic mode. The Company also publishes a notice in the newspaper declaring the details and requirements as mandated by the Act and applicable rules.
Voting rights are reckoned on the paid-up value of the shares registered in the names of the members as on the cut-off date. Members who want to exercise their votes by physical postal ballot are requested to return the forms, duly completed and signed, to the scrutinizer on or before the close of the voting period. Those using the e-voting option are requested to vote before the close of business hours on the last date of e-voting.
The scrutinizer completes his scrutiny and submits his report to the Chairman, and the consolidated results of the voting are announced by the Chairman / authorized officer. The results are also displayed on the Company website, www.infosys.com, besides being communicated to the stock exchanges, depository and registrar and share transfer agent. The last date for the receipt of postal ballot forms or e-voting shall be the date on which the resolution would be deemed to have been passed, if approved by the requisite majority.
Remote e-voting and ballot voting at the AGMTo allow the shareholders to vote on the resolutions proposed at the AGM, the Company has arranged for a remote e-voting facility. The Company has engaged NSDL to provide e-voting facility to all the members. Members whose names appear on the register of members as on June 16, 2018 shall be eligible to participate in the e-voting.
The facility for voting through ballot will also be made available at the AGM, and the members who have not already cast their vote by remote e-voting can exercise their vote at the AGM.
F. Compliance with the corporate governance codes
We have always believed in maximum fiscal transparency, and benchmarked our disclosures against a host of national and international guidelines and regulations. Some of the notable ones among them are as follows :
SEBI Listing Regulations : The SEBI (Listing Obligations and Disclosure Requirements) Regulations, 2015 (‘the Listing Regulations’) prescribe various corporate governance recommendations in line with the corporate governance committee constituted by SEBI under the chairmanship of N.R. Narayana Murthy, which had issued two sets of mandatory and non-mandatory recommendations. These recommendations were eventually incorporated in Clause 49 of the Listing Agreement, and the revised Clause 49 was made effective October 1, 2014. Further, the Listing Regulations,
which came into effect in September 2015, has incorporated these recommendations. We comply with the corporate governance requirements under the Listing Regulations.
Compliance with discretionary requirementsThe Company has also ensured the implementation of non-mandatory items such as :• Separate posts of Chairman, and CEO & MD, with
the provision for reimbursement of expenses in the performance of official duties. The Company has provided a separate office within the Company premises to non-executive Chairperson.
• Unmodified audit opinions / reporting• The internal auditor reporting directly to the audit
committee.• The Listing Regulation mandate the appointment of at least
one independent director of the listed parent company on the boards of unlisted material subsidiary companies in India. Infosys has voluntarily appointed one independent director in most of its non-material subsidiary companies.
Corporate Governance Voluntary Guidelines, 2009 : The Corporate Governance Voluntary Guidelines, 2009, of the Ministry of Corporate Affairs (MCA), Government of India encourage the use of better practices through voluntary adoption. These guidelines broadly focus on areas such as the Board and its responsibilities, functions, roles and responsibilities of the audit committee, appointment of auditors, compliance with secretarial standards, and a mechanism for whistleblower support. We comply with the Corporate Governance Voluntary Guidelines.
Naresh Chandra Committee : Following instances of irregularities involving auditors in the US and India, the Government of India constituted a high-level committee under the chairmanship of Naresh Chandra in 2002 to examine the auditor-company relationship and to regulate the role of auditors. Chapters 2, 3 and 4 of the Naresh Chandra Committee report are relevant to us. We comply with these recommendations.
Kumar Mangalam Birla Committee : SEBI appointed a committee under the chairmanship of Kumar Mangalam Birla in 1999 to promote and raise the standards of corporate governance. The recommendations of the committee were adopted in 2000. We comply with these recommendations.
Euroshareholders Corporate Governance Guidelines 2000 : The guidelines issued by Euroshareholders, the confederation of European shareholders associations, are based on the general principles of corporate governance issued by the Organization for Economic Cooperation and Development (OECD) in 1999, but are more specific and detailed. Subject to the statutory regulations in force in India, we comply with these recommendations.
Conference Board Commission on Public Trust and Private Enterprises in the US : We substantially comply with the findings and recommendations of the commission, which primarily addressed three key areas – executive compensation, corporate governance, and audit and accounting issues.

Corporate governance report | 125 Infosys Annual Report 2017-18
OECD Principles of Corporate Governance : The OECD principles on corporate governance were first released in 1999 and revised in 2014, and continue to be periodically reviewed. We comply with the recommendations of the OECD.
United Nations Global Compact : The United Nations Global Compact (UNGC) is a strategic policy initiative for businesses that are committed to aligning their operations and strategies with its 10 principles which cover human rights, labor, environment and corruption. We have been a signatory to the UNGC since 2001 and have consistently adopted these principles in our corporate governance framework. The UNGC incorporates a transparency and accountability policy known as the Communication on Progress (COP). As a signatory to the UNGC, we report our progress to UNGC’s COP every year. UNGC also recommends standard tools for reporting
organizations on the COP such as the Global Reporting Initiative (GRI) and the Carbon Disclosure Project (CDP) frameworks. We follow the GRI G4 reporting guidelines for our sustainability reporting and are a signatory to the CDP.
Kotak Committee : SEBI had constituted a committee on June 2, 2017, under the Chairmanship of Uday Kotak, to address corporate governance gaps and to enhance long-term standards necessary to shape a strong and resilient governance apparatus for listed companies in India. SEBI, in its board meeting held on March 28, 2018, accepted several recommendations of the Kotak Committee with and without modifications along with timelines for implementation. We substantially comply with the recommendations of the Kotak Committee accepted by SEBI.

126 | Shareholder information Infosys Annual Report 2017-18
Shareholder information
CorporateInfosys was incorporated in Pune, in 1981, as Infosys Consultants Private Limited, a private limited company under the Companies Act, 1956. In 1983, the corporate headquarters were relocated to Bengaluru. The name of the Company was changed to Infosys Technologies Private Limited in April 1992 and to Infosys Technologies Limited in June 1992, when the Company became a public limited company. We made an initial public offering in February 1993 and were listed on stock exchanges in India in June 1993. Trading opened at ` 145 per share, compared to the IPO price of ` 95 per share. In October 1994, we made a private placement of 5,50,000 shares at ` 450 each to Foreign Institutional Investors (FIIs), Financial Institutions (FIs) and body corporates.
In March 1999, we issued 20,70,000 American Depositary Shares (ADSs) (equivalent to 10,35,000 equity shares of par value ` 10 each) at US$ 34 per ADS under the ADS Program, and these ADSs were listed on the NASDAQ National Market.
The above data is unadjusted for stock split and bonus shares. In July 2003, June 2005 and November 2006, we issued secondary-sponsored American Depositary Receipts (ADRs) of US$ 294 million, US$ 1.1 billion and US$ 1.6 billion respectively.
During fiscal 2012, the name of the Company was changed from Infosys Technologies Limited to Infosys Limited to mark the transition from being a technology services provider to a business transformation partner to our clients.
During fiscal 2013, we delisted our ADSs from NASDAQ, and listed them in the New York Stock Exchange (NYSE), Euronext London and Euronext Paris. In March 2018, the Company announced its intention to voluntarily delist its ADSs (ISIN US4567881085) from the Euronext Paris and Euronext London exchanges. The primary reason for seeking the proposed delisting is the low average daily trading volume of Infosys ADSs on these exchanges, which is not commensurate with the related administrative requirements. During the five-year period of the Company’s listing on Euronext Paris and Euronext London, the average daily trading volume of the Company’s ADSs was significantly lower than its average daily trading volume on the NYSE. The proposed delisting is subject to approval from Euronext Paris S.A. and Euronext London Limited. There will be no change in the Infosys share / ADS count, capital structure and float as a result of the proposed delisting from the above exchanges. Infosys ADSs will continue to be listed on the NYSE under the symbol ‘INFY’ and investors can continue to trade their ADSs on the NYSE as before.
Subject to the approval of the proposed delisting by Euronext Paris S.A. and Euronext London Limited, a sale facility will be provided by the Company to the holders of ADSs trading on the Euronext Paris and Euronext London exchanges. ADS holders who opt for it will be able to sell their ADSs on the NYSE in accordance with Euronext Paris and Euronext London rules. ADS holders who do not opt for it can continue to retain their ADSs and will be able to trade their ADSs on the NYSE. Further, until the date of completion of the proposed delisting, the ADS holders can continue to trade their ADSs on the Euronext Paris and Euronext London exchanges.
Bonus issues and stock splitFiscal 1986 1989 1991 1992 1994 1997 1999 2005 2007 2015 2016 Bonus 1:1 1:1 1:1 1:1 1:1 1:1 1:1 3:1 1:1 1:1 1:1
Notes : In addition to issuing the above bonus shares, the Company split the stock in the ratio of 2:1 in fiscal 2000.
Financial YearThe Company’s financial year begins on April 1 and ends on March 31 every year. The address of our registered office is Electronics City, Hosur Road, Bengaluru 560100, Karnataka, India.
Buyback, Capital Allocation Policy and Dividend Distribution PolicyShareholders are requested to refer to ‘Share buyback’ and ‘Capital Allocation Policy’ in Board’s report in this Annual Report.
Unclaimed dividendSection 124 of the Companies Act, 2013, read with Investor Education and Protection Fund Authority (Accounting, Audit, Transfer and Refund) Rules, 2016 (‘the Rules’), mandates that companies transfer dividend that has remained unclaimed for a period of seven years from the unpaid dividend account to the Investor Education and Protection Fund (IEPF). Further, the Rules mandate that the shares on which dividend has not been paid or claimed for seven consecutive years or more be transferred to the IEPF.
The following table provides a list of years for which unclaimed dividends and their corresponding shares would become eligible to be transferred to the IEPF on the dates mentioned below :
Year Type of dividend Dividend per share (`) Date of declaration Due date for transfer Amount (`) (1)
2010-11 Final 20.00 June 11, 2011 July 16, 2018 69,90,3202011-12 Interim 15.00 October 12, 2011 November 17, 2018 69,32,5202011-12 Final(2) 32.00 June 09, 2012 July 14, 2019 1,29,54,4642012-13 Interim 15.00 October 12, 2012 November 17, 2019 70,49,310
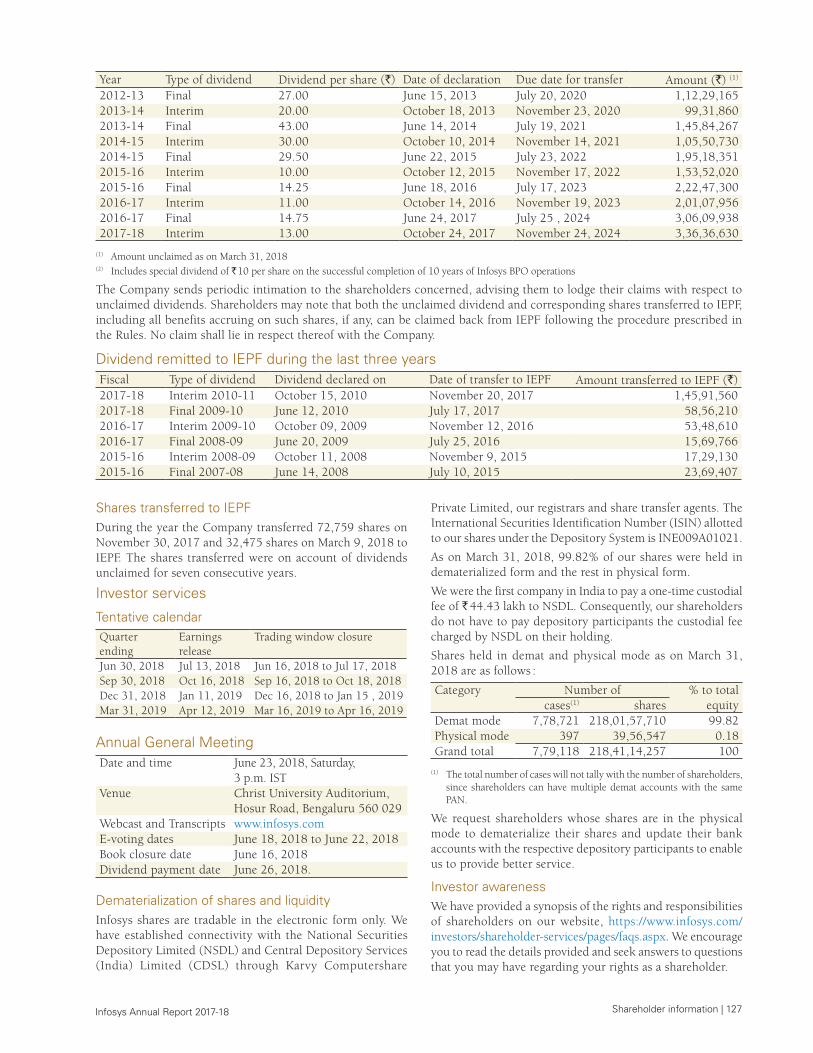
Shareholder information | 127 Infosys Annual Report 2017-18
Year Type of dividend Dividend per share (`) Date of declaration Due date for transfer Amount (`) (1)
2012-13 Final 27.00 June 15, 2013 July 20, 2020 1,12,29,1652013-14 Interim 20.00 October 18, 2013 November 23, 2020 99,31,8602013-14 Final 43.00 June 14, 2014 July 19, 2021 1,45,84,2672014-15 Interim 30.00 October 10, 2014 November 14, 2021 1,05,50,7302014-15 Final 29.50 June 22, 2015 July 23, 2022 1,95,18,3512015-16 Interim 10.00 October 12, 2015 November 17, 2022 1,53,52,0202015-16 Final 14.25 June 18, 2016 July 17, 2023 2,22,47,3002016-17 Interim 11.00 October 14, 2016 November 19, 2023 2,01,07,9562016-17 Final 14.75 June 24, 2017 July 25 , 2024 3,06,09,9382017-18 Interim 13.00 October 24, 2017 November 24, 2024 3,36,36,630
(1) Amount unclaimed as on March 31, 2018(2) Includes special dividend of ` 10 per share on the successful completion of 10 years of Infosys BPO operations
The Company sends periodic intimation to the shareholders concerned, advising them to lodge their claims with respect to unclaimed dividends. Shareholders may note that both the unclaimed dividend and corresponding shares transferred to IEPF, including all benefits accruing on such shares, if any, can be claimed back from IEPF following the procedure prescribed in the Rules. No claim shall lie in respect thereof with the Company.
Dividend remitted to IEPF during the last three yearsFiscal Type of dividend Dividend declared on Date of transfer to IEPF Amount transferred to IEPF (`)2017-18 Interim 2010-11 October 15, 2010 November 20, 2017 1,45,91,5602017-18 Final 2009-10 June 12, 2010 July 17, 2017 58,56,2102016-17 Interim 2009-10 October 09, 2009 November 12, 2016 53,48,6102016-17 Final 2008-09 June 20, 2009 July 25, 2016 15,69,7662015-16 Interim 2008-09 October 11, 2008 November 9, 2015 17,29,1302015-16 Final 2007-08 June 14, 2008 July 10, 2015 23,69,407
Shares transferred to IEPFDuring the year the Company transferred 72,759 shares on November 30, 2017 and 32,475 shares on March 9, 2018 to IEPF. The shares transferred were on account of dividends unclaimed for seven consecutive years.
Investor services
Tentative calendarQuarter ending
Earnings release
Trading window closure
Jun 30, 2018 Jul 13, 2018 Jun 16, 2018 to Jul 17, 2018Sep 30, 2018 Oct 16, 2018 Sep 16, 2018 to Oct 18, 2018Dec 31, 2018 Jan 11, 2019 Dec 16, 2018 to Jan 15 , 2019Mar 31, 2019 Apr 12, 2019 Mar 16, 2019 to Apr 16, 2019
Annual General MeetingDate and time June 23, 2018, Saturday,
3 p.m. ISTVenue Christ University Auditorium,
Hosur Road, Bengaluru 560 029Webcast and Transcripts www.infosys.comE-voting dates June 18, 2018 to June 22, 2018Book closure date June 16, 2018Dividend payment date June 26, 2018.
Dematerialization of shares and liquidityInfosys shares are tradable in the electronic form only. We have established connectivity with the National Securities Depository Limited (NSDL) and Central Depository Services (India) Limited (CDSL) through Karvy Computershare
Private Limited, our registrars and share transfer agents. The International Securities Identification Number (ISIN) allotted to our shares under the Depository System is INE009A01021.
As on March 31, 2018, 99.82% of our shares were held in dematerialized form and the rest in physical form.
We were the first company in India to pay a one-time custodial fee of ` 44.43 lakh to NSDL. Consequently, our shareholders do not have to pay depository participants the custodial fee charged by NSDL on their holding.
Shares held in demat and physical mode as on March 31, 2018 are as follows :
Category Number of % to total equitycases(1) shares
Demat mode 7,78,721 218,01,57,710 99.82Physical mode 397 39,56,547 0.18Grand total 7,79,118 218,41,14,257 100
(1) The total number of cases will not tally with the number of shareholders, since shareholders can have multiple demat accounts with the same PAN.
We request shareholders whose shares are in the physical mode to dematerialize their shares and update their bank accounts with the respective depository participants to enable us to provide better service.
Investor awarenessWe have provided a synopsis of the rights and responsibilities of shareholders on our website, https://www.infosys.com/investors/shareholder-services/pages/faqs.aspx. We encourage you to read the details provided and seek answers to questions that you may have regarding your rights as a shareholder.

128 | Shareholder information Infosys Annual Report 2017-18
The Company is committed towards promoting effective and open communication with all the stakeholders, ensuring consistency and clarity of disclosure at all times. We aim to communicate with investors throughout the year by providing frequent interaction through a variety of forums including meetings, earning calls, investor conferences and management presentations. We strive to be accessible to both institutional and other investors, and proactively encourage all shareholders to participate at Annual General Meeting (AGM). Every quarter, the Company holds results briefings for investors. The Company also participates in investor conferences held both in India and overseas, in an ongoing effort to communicate directly with investors.
In order to educate the shareholders and with an intent to protect their rights, the Company also sends persistent reminders to the shareholders to claim the unclaimed dividend / shares before it is transferred to Investor Education and Protection Fund.
During the year, the Company engaged a third-party consultant to gather investor feedback towards the Company’s objectives of enhancing its corporate governance standards.
Secretarial auditPursuant to Section 204 of the Companies Act, 2013 and rules thereunder, the Board of Directors of the Company appointed Parameshwar G. Hegde, Practicing Company Secretary, to conduct Secretarial Audit of the records and documents of the Company. The Secretarial Audit Report confirms that the Company has complied with all applicable provisions of the Companies Act, 2013, Depositories Act, 1996, and all the Regulations and Guidelines of the Securities and Exchange Board of India (SEBI), as applicable to the Company. The audit also covers the reconciliation on a quarterly basis, the total admitted capital with NSDL and CDSL, and the total issued and listed capital. The audit has confirmed that the total issued / paid-up capital is in agreement with the aggregate total number of shares in physical form and the total number of dematerialized shares held with NSDL and
CDSL. Further, the Company complies with the applicable Secretarial Standards issued by the Institute of Company Secretaries of India.
Investor complaintsNature of complaints
Received Attended2018 2017 2018 2017
Dividend / Annual Report related 1,286 576 1,286 576Buyback queries 12,349 NA 12,349 NA
We attended to most of the investors’ grievances and postal / electronic communications within a period of 10 days from the date of receipt of such grievances. The exceptions have been for cases constrained by disputes or legal impediments.
Shareholders may note that the share transfers, dividend payments and all other investor-related activities are attended to and processed at the office of Registrar and Transfer Agents (RTA).
For lodgment of transfer deeds, or for any grievances / complaints, shareholders may contact the RTA, Karvy Computershare Private Limited. For any escalations, the shareholders may write to the Company at [email protected]. The contact details of RTA and the Company are available in ‘Investor contacts’ of this section.
Legal proceedingsThere are certain pending cases related to disputes over title to shares in which we had been made a party. However, these cases are not material in nature.
Share transfers in physical formShares sent for physical transfer are effected after giving a 15-day notice to the seller for confirmation of the sale. The total number of shares transferred in physical form during the year was 51,432 as against nil in the previous year.
Paid-up capital
Shareholding patternDuring the year, the total shareholding of the organization changed due to ESOP allotment and buyback of shares. The total shareholding as on March 31, 2018 is 218,41,14,257.
Movement in shareholding during fiscal 2018 :
Date Transaction details Allotment Extinguishment No. of equity sharesApr 1, 2017 Opening balance 229,69,44,664Aug 14, 2017 ESOP allotment 22,308 229,69,66,972Aug 18, 2017 ESOP allotment 1,294 229,69,68,266Sep 18, 2017 ESOP allotment 3,562 229,69,71,828Sep 25, 2017 ESOP allotment 16,624 229,69,88,452Oct 3, 2017 ESOP allotment 4,815 229,69,93,267Dec 27, 2017 Buyback of shares 11,30,43,478 218,39,49,789Jan 30, 2018 ESOP allotment 1,42,309 218,40,92,098Feb 14, 2018 ESOP allotment 20,963 218,41,13,061Mar 5, 2018 ESOP allotment 1,196 218,41,14,257
The detailed report on the shareholding pattern of the Company as on March 31, 2018 is presented in MGT-9 enclosed to the Board’s report as Annexure 6.

Shareholder information | 129 Infosys Annual Report 2017-18
Shareholders holding more than 1% of the sharesThe details of shareholders (non-founders and non-ADR-holders) holding more than 1% of the equity as on March 31, 2018 are as follows :
Name of the shareholder No. of shares % Life Insurance Corporation of India(1) 14,95,14,017 6.85HDFC Mutual Fund(2) 6,07,33,054 2.78ICICI Prudential Mutual Fund(2) 4,03,13,403 1.85SBI Mutual Fund(2) 3,07,49,319 1.41Vanguard Emerging Markets Stock Index Fund, A Series of Vanguard International Equity Index Fund(3) 2,97,35,160 1.36ICICI Prudential Life Insurance Company Ltd(1) 2,82,00,618 1.29Government of Singapore(3) 2,76,20,153 1.26Abu Dhabi Investment Authority(3) 2,67,37,104 1.22Vanguard Total International Stock Index Fund(3) 2,41,45,242 1.11
(1) Insurance company (2) Indian mutual fund (3) Foreign portfolio investor / Foreign institutional investors
Distribution of shareholding as on March 31, 2018No. of shares held
No. of holders
% to holders
No. of shares % to equity
1 18,749 2.49 18,749 0.002-10 1,69,285 22.48 11,34,090 0.0511-50 3,06,125 40.65 87,59,100 0.4051-100 1,21,143 16.09 95,42,967 0.44101-200 59,354 7.88 89,19,740 0.41201-500 44,082 5.85 1,44,00,317 0.66501-1,000 15,121 2.01 1,09,94,683 0.501,001-5,000 12,929 1.72 2,81,03,994 1.295,001-10,000 2,118 0.28 1,53,38,702 0.7010,001 and above 4,119 0.55 208,69,01,915 95.55Total 7,53,025 100.00 218,41,14,257 100.00
Listing on stock exchangesCodes India Global
NSE BSE NYSE Euronext Paris
Exchange INFY 500209 INFY INFYReuters INFY.NS INFY.BO INFY.K INFY.PABloomberg INFO IS INFO IB INFY UN INFY FP
The listing fees for fiscal 2018 have been paid for all of the above stock exchanges in India and overseas.
ISIN Code for ADS : US4567881085
Stock market data relating to shares listed in India and NYSEOur market capitalization is included in the computation of the BSE 30 Sensitive Index (Sensex), the BSE Dollex, the S&P CNX NIFTY Index, Dow Jones Global Titans 50 and NYSE.
Stock market data – exchanges in India The monthly high and low quotations, as well as the volume of shares traded at the BSE, the NSE, and NYSE for the current year are provided as follows :
2017-18 BSE NSE VolumeMonths High (`) Low (`) Volume A
(No.) High (`) Low (`) Volume B (No.) (A+B) (No.)
April 1,031 910 49,31,308 1,032 910 7,08,07,792 7,57,39,100May 1,000 916 63,47,010 1,000 915 6,12,93,292 6,76,40,302June 989 921 58,61,354 989 921 7,86,67,556 8,45,28,910July 1,021 934 67,15,573 1,029 933 8,44,83,188 9,11,98,761August 1,029 862 2,31,80,232 1,029 860 29,11,86,932 31,43,67,164September 926 874 62,97,736 926 874 10,62,12,215 11,25,09,951October 957 897 61,21,593 958 897 9,18,49,551 9,79,71,144November 1,019 918 52,67,206 1,019 917 8,50,49,444 9,03,16,650December 1,046 956 63,31,701 1,049 957 8,06,23,477 8,69,55,178January 1,220 1,006 94,77,170 1,221 1,006 13,23,41,747 14,18,18,917February 1,189 1,092 52,64,507 1,190 1,090 9,07,08,757 9,59,73,264March 1,196 1,129 45,34,736 1,197 1,126 7,53,42,629 7,98,77,365Total 9,03,30,126 124,85,66,580 133,88,96,706

130 | Shareholder information Infosys Annual Report 2017-18
The volume traded / average outstanding shares (%) in the last three fiscals is as follows :
Fiscal Volume (BSE) Volume (NSE) Volume (BSE +NSE)2017-18 5 66 712016-17 4 47 512015-16 3 49 52
Note : The number of shares outstanding was 180,42,08,398 as of March 31, 2018. ADSs have been excluded for the purpose of this calculation.
Stock market data – NYSE2017-18 High ($) Low ($) High (`) Low (`) Volume (No.)MonthsApril 15.76 14.30 1,013 919 12,30,10,759May 15.69 14.49 1,012 934 12,89,33,891June 15.62 14.54 1,008 939 12,84,02,545July 15.93 14.84 1,023 953 12,17,34,551August 16.15 13.88 1,032 887 19,89,07,968September 15.07 14.22 984 928 10,31,80,382October 15.09 14.16 977 917 12,24,83,331November 15.71 14.57 1,013 939 7,81,92,471December 16.37 14.98 1,046 957 8,26,70,748January 18.71 16.02 1,190 1,019 16,78,78,616February 18.09 16.88 1,179 1,100 10,91,13,027March 18.54 17.37 1,208 1,132 9,84,07,685Total 146,29,15,974
Note :1 ADS = 1 equity share. The US dollar has been converted into the Indian rupee at the monthly closing rates. The number of ADSs outstanding as on March 31, 2018 was 37,99,05,859. The percentage of volume traded for the year at NYSE, to the total float was 388%.
ADS premium compared to price quoted on NSE
April May Jun Jul Aug Sep Oct Nov Dec Jan Feb Mar
200
0
400
600
800
1,000
1,200
1,400
ADS (`) 1,013 1,012 1,008 1,023 1,032 984 977 1,013 1,046 1,190 1,179 1,208
Equity (`) 1,032 1,000 989 1,029 1,029 926 958 1,019 1,049 1,221 1,190 1,197
Premium /(Discount)
(1.9%) 1.2% 2.0% (0.6%) 0.3% 6.3% 2.0% (0.6%) (0.3%) (2.6%) (0.9%) 1.0%
(3.0)
(1.5)
0.0
1.5
3.0
4.5
6.0
7.5
(`) (%)
Outstanding ADSsOur ADSs, as evidenced by ADRs, are traded in the US on the NYSE at New York, Euronext London and Euronext Paris under the ticker symbol ‘INFY’. The currency of trade of ADS in the US is USD and at London and Paris is Euro (EUR). Each equity share is represented by one ADS. The ADRs evidencing ADSs began trading on the NYSE, New York, from December 12, 2012, and Euronext London and Paris from February 20, 2013, when they were listed pursuant to the Listing Agreement entered with the NYSE. As on March 31, 2018, there were 65,537 record holders of ADRs evidencing 37,99,05,859 ADSs (1 ADS = 1 equity share).

Shareholder information | 131 Infosys Annual Report 2017-18
Infosys share price versus the NSE Nifty 50
80
100
110
90
130
120
Apr-17 May-17 Jun-17 Jul-17 Aug-17 Sep-17 Oct-17 Nov-17 Dec-17 Jan-18 Feb-18 Mar-18
Infosys Nifty 50
Note : Base 100 – Infosys share price on April 3, 2017 and Nifty 50 index value on April 3, 2017 have been baselined to 100.
Infosys share price versus the BSE Sensex
80
100
110
90
130
120
Apr-17 May-17 Jun-17 Jul-17 Aug-17 Sep-17 Oct-17 Nov-17 Dec-17 Jan-18 Feb-18 Mar-18
Infosys BSE Sensex
Note : Base 100 – Infosys share price on April 3, 2017 and BSE Sensex index value on April 3, 2017 have been baselined to 100.
Global locationsInfosys is a leading provider of technology services and consulting and has operations spread over 45 countries. We do not have any manufacturing plants, but have development centers and offices in India and overseas. Visit https://www.infosys.com/investors/reports-filings/Documents/global-presence2018.pdf for details related to our global locations.

132 | Shareholder information Infosys Annual Report 2017-18
Investor contacts
For queries relating to financial statements
Jayesh SanghrajkaDeputy Chief Financial Officer & EVP
Tel : 91 80 2852 1705 Fax : 91 80 2852 0754Email : [email protected]
Investor correspondence
Sandeep MahindrooVP, Financial Controller and Head – Investor Relations
Tel : 91 80 3980 1018 Fax : 91 80 2852 0754Email : [email protected]
For queries relating to shares / dividend / compliance
A.G.S. ManikanthaCompany Secretary
Tel : 91 80 4116 7775 Fax : 91 80 2852 0754Email : [email protected]
For queries relating to business responsibility report
Aruna C. NewtonAVP and Head – Diversity and Inclusion
Tel : 91 80 2852 0261Email : [email protected]
Registrar and share transfer agents
Karvy Computershare Private LimitedPlot 31-32, Gachibowli, Financial DistrictNanakramguda, Hyderabad – 500 032
Contact person
Shobha AnandDeputy General Manager, Karvy Computershare Private Limited
Tel : 91 40 6716 1559Email : [email protected]
Depositary bank (ADS)
United States
Deutsche Bank Trust Company AmericasDeutsche Bank, 60 Wall Street, 16th FloorGlobal Transaction BankingDepositary ReceiptsNew York 10005, NY, U.S.Tel : 1 212 250 2500 Fax : 1 732 544 6346
India
Deutsche Bank AG, Filiale MumbaiGlobal Transaction Banking – Depositary ReceiptsThe Capital, C-70, G BlockBandra Kurla Complex, Mumbai 400 051, IndiaTel : 91 22 7180 4444 Fax : 91 22 7180 3794
Custodian in India (ADS)
ICICI Bank LimitedSecurities Market Services1st Floor, Empire Complex, 414, Senapati Bapat Marg,Lower Parel, Mumbai 400 013,Maharashtra, India. Tel : 91 22 6667 2005 / 4343 4116 / 4343 4121 Fax : 91 22 6667 2779
Sponsor Bank for ADS in Europe
BNP Paribas Securities ServicesCTS Services Aux EmetteursLes Grands Moulins De Pantin9 Rue du Débarcadère 93761 Pantin Cedex, France

Shareholder information | 133 Infosys Annual Report 2017-18
Depository for equity shares in India
National Securities Depository LimitedTrade World, ‘A’ Wing, 4th FloorKamala Mills Compound Senapati Bapat Marg, Lower Parel, Mumbai 400 013, IndiaTel : 91 22 2499 4200 Fax : 91 22 2497 6351
Central Depository Services (India) LimitedPhiroze Jeejeebhoy Towers, 17th FloorDalal Street, Fort, Mumbai 400 001, IndiaTel : 91 22 2302 3333 Fax : 91 22 2272 3199
Addresses of regulatory authority / stock exchanges
In India
Securities and Exchange Board of IndiaPlot No. C4-A, G Block, Bandra Kurla ComplexBandra (East), Mumbai 400 051, IndiaTel : 91 22 2644 9000, 91 22 4045 9000Fax : 91 22 2644 9019-22, 91 22 4045 9019-22
National Stock Exchange of India Ltd.Exchange Plaza, Plot No. C / 1, G BlockBandra Kurla ComplexBandra (East), Mumbai 400 051, IndiaTel : 91 22 2659 8100 Fax : 91 22 2659 8120
BSE Ltd.Phiroze Jeejeebhoy TowersDalal Street, Kala Ghoda, Mumbai 400 001, IndiaTel : 91 22 2272 1233 Fax : 91 22 2272 1919
Outside India
New York Stock Exchange11 Wall Street, New York, NY 10005, USTel : 1 212 656 3000 Fax : 1 212 656 5549
Euronext, London10th Floor, 110 Cannon Street,London, EC4N 6EU, UKTel : 44 20 7076 0900
Euronext, Paris14, place des Reflets92054 Paris La Défense CedexTel : 33 1 70 48 24 00
Shareholder votingShareholders are requested to cast their votes on the resolutions mentioned in Notice of the 37th Annual General Meeting of the Company by using any of the following option :
Vote inadvance ofthe meeting
Vote inperson atthe meeting
Remote e-voting at https://www.evoting.nsdl.com/
Voting through proxy : Sign, date, and return the proxy form on or before June 21, 2018, 3:00 p.m. IST.
Please refer to the Notes section in the Notice for details on admission requirements to attend the Annual General Meeting.
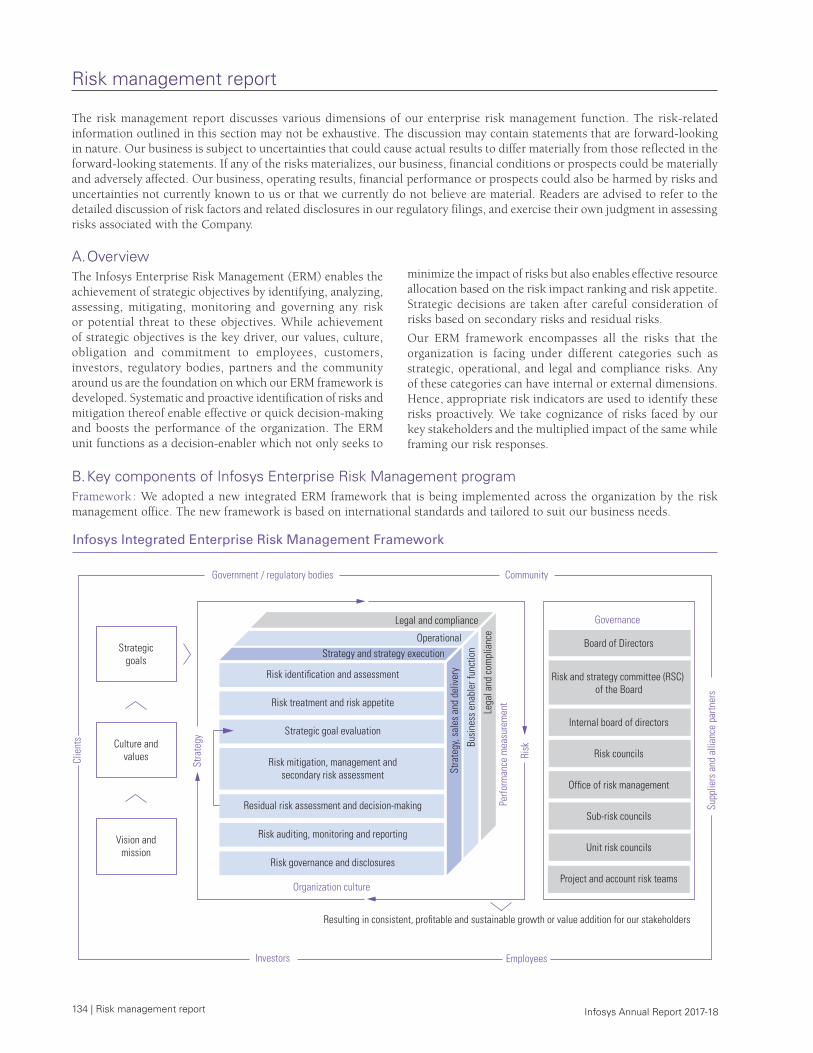
134 | Risk management report Infosys Annual Report 2017-18
Risk management report
The risk management report discusses various dimensions of our enterprise risk management function. The risk-related information outlined in this section may not be exhaustive. The discussion may contain statements that are forward-looking in nature. Our business is subject to uncertainties that could cause actual results to differ materially from those reflected in the forward-looking statements. If any of the risks materializes, our business, financial conditions or prospects could be materially and adversely affected. Our business, operating results, financial performance or prospects could also be harmed by risks and uncertainties not currently known to us or that we currently do not believe are material. Readers are advised to refer to the detailed discussion of risk factors and related disclosures in our regulatory filings, and exercise their own judgment in assessing risks associated with the Company.
A. OverviewThe Infosys Enterprise Risk Management (ERM) enables the achievement of strategic objectives by identifying, analyzing, assessing, mitigating, monitoring and governing any risk or potential threat to these objectives. While achievement of strategic objectives is the key driver, our values, culture, obligation and commitment to employees, customers, investors, regulatory bodies, partners and the community around us are the foundation on which our ERM framework is developed. Systematic and proactive identification of risks and mitigation thereof enable effective or quick decision-making and boosts the performance of the organization. The ERM unit functions as a decision-enabler which not only seeks to
minimize the impact of risks but also enables effective resource allocation based on the risk impact ranking and risk appetite. Strategic decisions are taken after careful consideration of risks based on secondary risks and residual risks.
Our ERM framework encompasses all the risks that the organization is facing under different categories such as strategic, operational, and legal and compliance risks. Any of these categories can have internal or external dimensions. Hence, appropriate risk indicators are used to identify these risks proactively. We take cognizance of risks faced by our key stakeholders and the multiplied impact of the same while framing our risk responses.
B. Key components of Infosys Enterprise Risk Management programFramework : We adopted a new integrated ERM framework that is being implemented across the organization by the risk management office. The new framework is based on international standards and tailored to suit our business needs.
Infosys Integrated Enterprise Risk Management Framework
Resulting in consistent, pro�table and sustainable growth or value addition for our stakeholders
Supp
liers
and
alli
ance
par
tner
s
Investors
Clie
nts
Employees
CommunityGovernment / regulatory bodies
Board of Directors
Risk and strategy committee (RSC) of the Board
Internal board of directors
Risk councils
Of�ce of risk management
Sub-risk councils
Unit risk councils
Project and account risk teams
Governance
Strategicgoals
Culture andvalues
Vision andmission
Stra
tegy
Risk
Perfo
rman
ce m
easu
rem
ent
Organization culture
Operational
Legal and compliance
Risk identi�cation and assessment
Risk treatment and risk appetite
Strategic goal evaluation
Risk mitigation, management andsecondary risk assessment St
rate
gy, s
ales
and
del
iver
y
Busi
ness
ena
bler
func
tion
Lega
l and
com
plia
nce
Residual risk assessment and decision-making
Risk auditing, monitoring and reporting
Risk governance and disclosures
Strategy and strategy execution

Risk management report | 135 Infosys Annual Report 2017-18
Risk categories : Our industry and Company are in significant transformation, and this has naturally resulted in the heightening of risks related to strategic choices and strategy execution along with traditional operational and compliance-related risks.
Strategy and strategy execution : Risks arising out of the choices we have made in defining our strategy and the risks to the successful execution of these strategies are covered in this category – for example, risks inherent to our industry and competitiveness are analyzed and mitigated through strategic choices of target markets, the Company’s market offerings, business models and talent base. Details of the Company’s strategy are described in other sections of this document.
Operational : Risks arising out of internal and external factors affecting policies, procedures, people and systems in our support functions, thereby impacting service delivery /operations, compromising our core values or not in accordance
with generally accepted business practices are covered in this category – for example : risks of business activity disruptions due to natural calamities, terrorist attacks or war or regional conflicts, or disruptions in telecommunications, system failures, virus attacks or breach of cyber security.
Legal and compliance : Risks arising out of threats posed to our financial, organizational, or reputational standing resulting from potential litigations, violations or non-conformance with laws, regulations, codes of conduct or organizational prescribed practices or contractual compliances are covered in this category along with potential risks arising out of major regulatory / geopolitical changes or risks arising out of strategic or business or operational decisions.
Risk management processes : The Infosys ERM framework defines risks and the steps to identify, assess and mitigate risks. Secondary risks and residual risks are used as key inputs for deciding the mitigation strategies.
Infosys Integrated Enterprise Risk Management Framework
• Inside view – bottom-up and top-down risk assessment across the organization
• Outside-in view
• Key internal and external risk indicators and Incidents
• Qualitative and quantitative risk appetite for various goals / impacts
• Risk that inhibits us from implementing mitigation strategies and controls identi�ed
• Key risk / performance indicators
• Internal and external audits
• Periodic risk management reports
• Corporate goals
• Business units plan
• Vision, mission and core values
• Corporate strategy
Inputs
Strategic goal-setting
Derived goal-setting
Secondary risk anddecision-making
Monitor current riskmovement and mitigation
plans progress
Risk audit, monitoringand reporting
Risk / opportunity identi�cation
Risk assessment
Risk treatment
Risk mitigation / strategyrealignment / opportunity exploration
Risk governance
ERM steps
• Quantitative and qualitative goals
• Direct and derived goals for business units
• Risk management is the primary responsibility of business
• Risk of�ce is the custodian and enabler / facilitator in the process
• In additional to Likelihood and Impact, Detectability is used as criteria to rate the risk
• Risk treatment – Avoid, Share, Reduce, Accept and Escalate
• Risk mitigation – Identify possible mitigation strategies and controls
• Strategy realignment if mitigation actions are not suf�cient
• Risk-enabled decision-making
• Appropriate mitigation strategy (decision-making) to be selected considering risk appetite, cost of mitigation vs. impact of risk and expected residual risk
• Cross-functional teams participation facilitated by risk of�ce
• Regular cadence with senior leadership to monitor progress of mitigation plan
• Track effectiveness of mitigation plan through current risk rating
• Risk-enabled control / process effectiveness and ef�ciency evaluation
• Mitigation strategy evaluation and progress reporting
• 8-layered governance based on risk category, risk rating and organization level
Salient features

136 | Risk management report Infosys Annual Report 2017-18
Risk governance structure : Risks identified by risk management functions or roles at different levels in the organization are presented at appropriate councils in the governance structure. Critical risks or cross functional risks at each level are escalated to the next level in the governance structure. Critical risks under different categories of risks at
Risk governance structure
Board of Directors
Risk and strategy committee of the Board
Sub-risk councils
Of�ce of risk management
Unit risk councils
Project or account risk team
Risk councils
Internal board of directors
• Ensure proactive identi�cation and management of risks / opportunities in their respective units
• Ensure effectiveness of risk mitigation actions in their units and report to appropriate sub risk council
• Headed by unit risk anchors
• Comprises business unit heads, unit planning and assurance head and unit HR
• Formulate and deploy risk management policies and procedures
• Facilitate the execution of risk management practices
• Provide periodic updates to the risk council and quarterly updates to the RSC on risks to key business objectives and their mitigation
• Work closely with mitigation action owners in deploying mitigation measures and monitoring their effectiveness
• Headed by the Chief Risk Of�cer
• Comprises the core ERM team and a network of risk managers from business units along with specialist groups
Responsible for identifying and mitigating the risks for their respective function / group.
• Headed by the respective function risk anchor
• Comprises representatives from services and segments or enabler function risk anchors
• Cadence or oversight on risk management process
• Review adequacy of mitigation actions, progress of mitigation actions and effectiveness of mitigation actions
Comprises the Chief Executive Of�cer, Chief Operating Of�cer, Chief Financial Of�cer, Chief Risk Of�cer and General Counsel
Responsible for providing internal governance and oversight, and ensuring smooth functioning of various risk councils
Comprises two directors:
• Salil Parekh
• U.B. Pravin Rao
Comprises four independent directors :
• D.N. Prahlad, Chairperson
• Kiran Mazumdar-Shaw
• Ravi Venkatesan
• D. Sundaram
• Corporate governance oversight with regard to the risk management process
• Monitor and review the risk management framework and associated practices of the Company
• Understand the most signi�cant risks and response strategies
• Review risk-related disclosures
• Evaluate the strategy, and risks inherent in the strategy
• De�ne the role of the Board and the risk committee in risk management
• Assess the risk-taking abilities of the Management and performance vis-à-vis short-term and long-term objectives of the Company
Comprises members of the Board of Directors
• Adherence to risk management policies and procedures
• Proactively identify risks in the project execution or in accounts, and report to concerned risk managers in a timely manner
• Implement prescribed risk mitigation actions
Comprises project compliance anchors, project risk managers, project and delivery manager or master customer owner
the group level are reviewed by the Chief Executive Officer, Chief Operating Officer, Chief Financial Officer, Chief Risk Officer and General Counsel in various councils. Critical risks from these councils are presented to the Internal Board of Directors and then to the risk and strategy committee of the Board on a quarterly basis.

Risk management report | 137 Infosys Annual Report 2017-18
C. RISC360 integrated risk and auditing platformRISC360 is a common Governance, Risk management and Compliance (GRC) platform that combines three lines of defense under one umbrella to enable risk-based decision-making and auditing. The iGRC platform gives a consolidated risk and strategic goal view to the leadership to enable quick and effective decision-making across enterprise risk, internal audit, Sarbanes-Oxley Act (SOX) compliance and corporate audit. Integration of these functions using one common platform ensures that audits are based on risks tied to the overall ERM framework and the organization gets the benefits of synergies amongst different lines of defense.
D. Risk management highlights for the yearDuring the year, our focus was on extending adoption of the new integrated ERM framework across the organization and strengthening the risk management program.
As part of monitoring key risks, the risk management office :
• Assessed our business momentum relative to competition and competitive position in key market segments comprising geographies, industries and service lines
• Regularly assessed the progress of the execution of strategic programs, specifically, progress on US localization, the growth of new software-enabled services, impact of automation, performance of subsidiary businesses, enhancement of traditional offerings, leadership
succession planning, operating cost optimization and Capital Allocation Policy.
• Regularly assessed the business environment, including trend line of key external indicators and internal business indicators such as client concentration, client technology spend, growth of top clients and revenue bookings from large outsourcing engagements.
• Reviewed information security risks (cyber-attacks and threat intelligence) and continue to monitor the progress of mitigation actions.
• Reviewed key operational risks and actions based on inputs from the internal risk register, external assessments, internal audit findings and incidents.
• Reviewed operational risk areas including client service delivery, retention and engagement of employees, re-skilling of employees, brand attractiveness, women’s safety, physical security, capital expenditures on infrastructure, and business continuity management.
• Monitored key developments in the regulatory environment, especially key geographies such as the United Kingdom, continental Europe, Australia and the United States of America, relating to immigration laws, minimum wages and impact to businesses of our clients.
• Monitored the availability of natural resources, such as water and power, and its impact on our operations.

138 | CEO and CFO certification Infosys Annual Report 2017-18
CEO and CFO certification
The Board of DirectorsInfosys Limited, Bengaluru
Dear members of the Board,
We, Salil Parekh, Chief Executive Officer and Managing Director, and M.D. Ranganath, Chief Financial Officer of Infosys Limited, to the best of our knowledge and belief, certify that :
1. We have reviewed the Balance Sheet as at March 31, 2018, Statement of Profit and Loss, the Statement of Changes in Equity and the Statement of Cash Flows for the year then ended and a summary of the significant accounting policies and other explanatory information of the Company and the Board’s report for the year ended March 31, 2018.
2. These statements do not contain any materially untrue statement or omit to state a material fact necessary to make the statements made, in light of the circumstances under which such statements were made, not misleading with respect to the period covered by this report.
3. The financial statements, and other financial information included in this report, present in all material respects a true and fair view of the Company’s affairs, the financial condition, results of operations and cash flows of the Company as at and for the periods presented in this report, and are in compliance with the existing accounting standards and / or applicable laws and regulations.
4. There are no transactions entered into by the Company during the year that are fraudulent, illegal or violate the Company’s Code of Conduct and Ethics, except as disclosed to the Company’s auditors and the Company’s audit committee of the Board of Directors.
5. We are responsible for establishing and maintaining disclosure controls and procedures and internal controls over financial reporting for the Company, and we have :
a. Designed such disclosure controls and procedures or caused such disclosure controls and procedures to be designed under our supervision to ensure that material information relating to the Company, including its consolidated subsidiaries, is made known to us by others within those entities, particularly during the period in which this report is being prepared.
b. Designed such internal control over financial reporting, or caused such internal control over financial reporting to be designed under our supervision, to provide reasonable assurance regarding the reliability of financial reporting and the preparation of financial statements for external purposes in accordance with Indian Accounting Standards (Ind AS).
c. Evaluated the effectiveness of the Company’s disclosure, controls and procedures.
d. Disclosed in this report, changes, if any, in the Company’s internal control over financial reporting that occurred during the Company’s most recent fiscal year that has materially affected, or is reasonably likely to materially affect, the Company’s internal control over financial reporting.
6. We have disclosed, based on our most recent evaluation of the Company’s internal control over financial reporting, wherever applicable, to the Company’s auditors and the audit committee of the Company’s Board (and persons performing the equivalent functions) :
a. Any deficiencies in the design or operation of internal controls, that could adversely affect the Company’s ability to record, process, summarize and report financial data, and have confirmed that there have been no material weaknesses in internal controls over financial reporting including any corrective actions with regard to deficiencies.
b. Any significant changes in internal controls during the year covered by this report.
c. All significant changes in accounting policies during the year, if any, and the same have been disclosed in the notes to the financial statements.
d. Any instances of significant fraud of which we are aware, that involve the Management or other employees who have a significant role in the Company’s internal control system.
7. We affirm that we have not denied any personnel, access to the audit committee of the Company (in respect of matters involving alleged misconduct) and we have provided protection to whistleblowers from unfair termination and other unfair or prejudicial employment practices.
8. We further declare that all Board members and senior management personnel have affirmed compliance with the Code of Conduct and Ethics for the year covered by this report.
Bengaluru April 13, 2018
Salil ParekhChief Executive Officer and Managing Director
M.D. RanganathChief Financial Officer

Standalone financial statements | 139 Infosys Annual Report 2017-18
Standalone Financial Statements under Indian Accounting Standards (Ind AS) for the year ended March 31, 2018
IndexA. Independent Auditors’ Report .............................................................................................. 140B. Balance Sheet ...................................................................................................................... 145C. Statement of Profit and Loss .............................................................................................. 147D. Statement of Changes in Equity .......................................................................................... 148E. Statement of Cash Flows .................................................................................................... 151F. Overview and notes to the financial statements1. Overview 1.1 Company overview .................................................................................................... 153 1.2 Basis of preparation of financial statements .............................................................. 153 1.3 Use of estimates and judgments................................................................................ 153 1.4 Critical accounting estimates ..................................................................................... 153 1.5 Recent accounting pronouncements ......................................................................... 1542. Notes to the financial statements 2.1 Property, plant and equipment ................................................................................... 154 2.2 Goodwill and other intangible assets .......................................................................... 156 2.3 Investments ............................................................................................................... 157 2.4 Loans .......................................................................................................................... 164 2.5 Other financial assets ................................................................................................. 164 2.6 Trade receivables ........................................................................................................ 164 2.7 Cash and cash equivalents ......................................................................................... 164 2.8 Other assets .............................................................................................................. 165 2.9 Financial instruments ................................................................................................. 166 2.10 Equity ......................................................................................................................... 173 2.11 Other financial liabilities.............................................................................................. 177 2.12 Trade payables ............................................................................................................ 177 2.13 Other liabilities ........................................................................................................... 177 2.14 Provisions ................................................................................................................... 177 2.15 Income taxes .............................................................................................................. 178 2.16 Revenue from operations ........................................................................................... 180 2.17 Other income, net ...................................................................................................... 181 2.18 Expenses ................................................................................................................... 182 2.19 Leases ........................................................................................................................ 182 2.20 Employee benefits...................................................................................................... 183 2.21 Reconciliation of basic and diluted shares used in computing earning per share ....... 185 2.22 Contingent liabilities and commitments ..................................................................... 185 2.23 Related party transactions .......................................................................................... 186 2.24 Corporate social responsibility .................................................................................... 190 2.25 Segment reporting ..................................................................................................... 190 2.26 Assets held for sale .................................................................................................... 192 2.27 Function-wise classification of Statement of Profit and Loss ..................................... 193

140 | Standalone financial statements Infosys Annual Report 2017-18
Independent Auditors’ Report
To the Members of Infosys Limited
Report on the Standalone Financial Statements We have audited the accompanying standalone financial statements of Infosys Limited (‘the Company’), which comprise the Balance Sheet as at March 31, 2018, the Statement of Profit and Loss (including other comprehensive income), the Statement of Changes in Equity and the Statement of Cash Flows for the year then ended and a summary of the significant accounting policies and other explanatory information.
Management’s Responsibility for the Standalone Financial StatementsThe Company’s Board of Directors is responsible for the matters stated in Section 134(5) of the Companies Act, 2013 (‘the Act’) with respect to the preparation of these standalone financial statements that give a true and fair view of the financial position, financial performance including other comprehensive income, cash flows and changes in equity of the Company in accordance with the Indian Accounting Standards (Ind AS) prescribed under Section 133 of the Act read with the Companies (Indian Accounting Standards) Rules, 2015, as amended, and other accounting principles generally accepted in India.
This responsibility also includes maintenance of adequate accounting records in accordance with the provisions of the Act for safeguarding the assets of the Company and for preventing and detecting frauds and other irregularities; selection and application of appropriate accounting policies; making judgments and estimates that are reasonable and prudent; and design, implementation and maintenance of adequate internal financial controls, that were operating effectively for ensuring the accuracy and completeness of the accounting records, relevant to the preparation and presentation of the standalone financial statements that give a true and fair view and are free from material misstatement, whether due to fraud or error.
Auditors’ ResponsibilityOur responsibility is to express an opinion on these standalone financial statements based on our audit.
In conducting our audit, we have taken into account the provisions of the Act, the accounting and auditing standards and matters which are required to be included in the audit report under the provisions of the Act and the Rules made thereunder and the Order issued under Section 143(11) of the Act.
We conducted our audit of the standalone financial statements in accordance with the Standards on Auditing specified under Section 143(10) of the Act. Those Standards require that we comply with ethical requirements and plan and perform the audit to obtain reasonable assurance about whether the standalone financial statements are free from material misstatement.
An audit involves performing procedures to obtain audit evidence about the amounts and the disclosures in the standalone financial statements. The procedures selected depend on the auditor’s judgment, including the assessment of the risks of material misstatement of the standalone financial statements, whether due to fraud or error. In making those risk assessments, the auditor considers internal financial control relevant to the Company’s preparation of the standalone financial statements that give a true and fair view in order to design audit procedures that are appropriate in the circumstances. An audit also includes evaluating the appropriateness of the accounting policies used and the reasonableness of the accounting estimates made by the Company’s Directors, as well as evaluating the overall presentation of the standalone financial statements.
We believe that the audit evidence obtained by us is sufficient and appropriate to provide a basis for our audit opinion on the standalone financial statements.
OpinionIn our opinion and to the best of our information and according to the explanations given to us, the aforesaid standalone financial statements give the information required by the Act in the manner so required and give a true and fair view in conformity with the accounting principles generally accepted in India, of the state of affairs of the Company as at March 31, 2018, and its profit, total comprehensive income, the changes in equity and its cash flows for the year ended on that date.
Report on Other Legal and Regulatory Requirements1. As required by Section 143(3) of the Act, based on our audit, we report that :
a. we have sought and obtained all the information and explanations which to the best of our knowledge and belief were necessary for the purposes of our audit.
b. in our opinion, proper books of account as required by law have been kept by the Company so far as it appears from our examination of those books.
c. the Balance Sheet, the Statement of Profit and Loss including other comprehensive income, Statement of Changes in Equity and the Statement of Cash Flows dealt with by this Report are in agreement with the books of account.
d. in our opinion, the aforesaid standalone financial statements comply with the Indian Accounting Standards prescribed under Section 133 of the Act.
Independent Auditors’ Report
Standalone financial statements | 141 Infosys Annual Report 2017-18
e. on the basis of the written representations received from the directors of the Company as on March 31, 2018 taken on record by the Board of Directors, none of the directors is disqualified as on March 31, 2018 from being appointed as a director in terms of Section 164(2) of the Act.
f. with respect to the adequacy of the internal financial controls over financial reporting of the Company and the operating effectiveness of such controls, refer to our separate report in ‘Annexure A’. Our report expresses an unmodified opinion on the adequacy and operating effectiveness of the Company’s internal financial controls over financial reporting.
g. with respect to the other matters to be included in the Auditor’s Report in accordance with Rule 11 of the Companies (Audit and Auditors) Rules, 2014, as amended, in our opinion and to the best of our information and according to the explanations given to us :
i. The Company has disclosed the impact of pending litigations on its financial position in its standalone financial statements.
ii. The Company has made provision, as required under the applicable law or accounting standards, for material foreseeable losses, if any, on long-term contracts including derivative contracts.
iii. There has been no delay in transferring amounts, required to be transferred, to the Investor Education and Protection Fund by the Company.
2. As required by the Companies (Auditor’s Report) Order, 2016 (‘the Order’) issued by the Central Government in terms of Section 143(11) of the Act, we give in ‘Annexure B’ a statement on the matters specified in paragraphs 3 and 4 of the Order.
For DELOITTE HASKINS & SELLS LLPChartered Accountants
Firm’s registration number : 117366W/W-100018
Bengaluru
April 13, 2018
Sd/-
P.R. Ramesh Partner
Membership number : 70928
Annexure A to the Independent Auditors’ Report
(Referred to in paragraph 1(f) under ‘Report on Other Legal and Regulatory Requirements’ section of our report to the members of Infosys Limited of even date)
Report on the Internal Financial Controls Over Financial Reporting under Clause (i) of sub-section 3 of Section 143 of the Companies Act, 2013 (‘the Act’)
We have audited the internal financial controls over financial reporting of INFOSYS LIMITED (‘the Company’) as of March 31, 2018 in conjunction with our audit of the standalone financial statements of the Company for the year ended on that date.
Management’s Responsibility for Internal Financial ControlsThe Board of Directors of the Company is responsible for establishing and maintaining internal financial controls based on the internal control over financial reporting criteria established by the Company considering the essential components of internal control stated in the Guidance Note on Audit of Internal Financial Controls Over Financial Reporting issued by the Institute of Chartered Accountants of India. These responsibilities include the design, implementation and maintenance of adequate internal financial controls that were operating effectively for ensuring the orderly and efficient conduct of its business, the safeguarding of its assets, the prevention and detection of frauds and errors, the accuracy and completeness of the accounting records, and the timely preparation of reliable financial information, as required under the Companies Act, 2013.
Auditor’s ResponsibilityOur responsibility is to express an opinion on the internal financial controls over financial reporting of the Company based on our audit. We conducted our audit in accordance with the Guidance Note on Audit of Internal Financial Controls Over Financial Reporting (the ‘Guidance Note’) issued by the Institute of Chartered Accountants of India and the Standards on Auditing prescribed under Section 143(10) of the Companies Act, 2013, to the extent applicable to an audit of internal financial controls. Those Standards and the Guidance Note require that we comply with ethical requirements and plan and perform the audit to obtain reasonable assurance about whether adequate internal financial controls over financial reporting was established and maintained and if such controls operated effectively in all material respects.
Our audit involves performing procedures to obtain audit evidence about the adequacy of the internal financial controls system over financial reporting and their operating effectiveness. Our audit of internal financial controls over financial reporting included obtaining an understanding of internal financial controls over financial reporting, assessing the risk that a material weakness exists, and testing and evaluating the design and operating effectiveness of internal control based on the assessed risk.

142 | Standalone financial statements Infosys Annual Report 2017-18
The procedures selected depend on the auditor’s judgement, including the assessment of the risks of material misstatement of the financial statements, whether due to fraud or error.
We believe that the audit evidence we have obtained, is sufficient and appropriate to provide a basis for our audit opinion on the Company’s internal financial controls system over financial reporting.
Meaning of Internal Financial Controls over Financial ReportingA company’s internal financial control over financial reporting is a process designed to provide reasonable assurance regarding the reliability of financial reporting and the preparation of financial statements for external purposes in accordance with generally accepted accounting principles. A company’s internal financial control over financial reporting includes those policies and procedures that (1) pertain to the maintenance of records that, in reasonable detail, accurately and fairly reflect the transactions and dispositions of the assets of the company; (2) provide reasonable assurance that transactions are recorded as necessary to permit preparation of financial statements in accordance with generally accepted accounting principles, and that receipts and expenditures of the company are being made only in accordance with authorizations of the management and directors of the company; and (3) provide reasonable assurance regarding prevention or timely detection of unauthorized acquisition, use, or disposition of the company’s assets that could have a material effect on the financial statements.
Limitations of Internal Financial Controls over Financial ReportingBecause of the inherent limitations of internal financial controls over financial reporting, including the possibility of collusion or improper management override of controls, material misstatements due to error or fraud may occur and not be detected. Also, projections of any evaluation of the internal financial controls over financial reporting to future periods are subject to the risk that the internal financial control over financial reporting may become inadequate because of changes in conditions, or that the degree of compliance with the policies or procedures may deteriorate.
OpinionIn our opinion, to the best of our information and according to the explanations given to us, the Company has, in all material respects, an adequate internal financial controls system over financial reporting and such internal financial controls over financial reporting were operating effectively as at March 31, 2018, based on the internal control over financial reporting criteria established by the Company considering the essential components of internal control stated in the Guidance Note on Audit of Internal Financial Controls Over Financial Reporting issued by the Institute of Chartered Accountants of India.
For DELOITTE HASKINS & SELLS LLPChartered Accountants
Firm’s registration number : 117366W/W-100018
Bengaluru
April 13, 2018
Sd/-
P.R. Ramesh Partner
Membership number : 70928
Standalone financial statements | 143 Infosys Annual Report 2017-18
Annexure B to the Independent Auditors’ Report
(Referred to in paragraph 2 under ‘Report on Other Legal and Regulatory Requirements’ section of our report to the members of Infosys Limited of even date)
i. In respect of the Company’s fixed assets :
a. The Company has maintained proper records showing full particulars, including quantitative details and situation of fixed assets.
b. The Company has a program of verification to cover all the items of fixed assets in a phased manner which, in our opinion, is reasonable having regard to the size of the Company and the nature of its assets. Pursuant to the program, certain fixed assets were physically verified by the Management during the year. According to the information and explanations given to us, no material discrepancies were noticed on such verification.
c. According to the information and explanations given to us, the records examined by us and based on the examination of the conveyance deeds provided to us, we report that, the title deeds, comprising all the immovable properties of land and buildings which are freehold, are held in the name of the Company as at the Balance Sheet date. In respect of immovable properties of land and building that have been taken on lease and disclosed as fixed assets in the standalone financial statements, the lease agreements are in the name of the Company.
ii. The Company is in the business of providing software services and does not have any physical inventories. Accordingly, reporting under Clause 3 (ii) of the Order is not applicable to the Company.
iii. According to the information and explanations given to us, the Company has granted unsecured loans to three bodies corporate, covered in the register maintained under Section 189 of the Companies Act, 2013, in respect of which :
a. The terms and conditions of the grant of such loans are, in our opinion, prima facie, not prejudicial to the Company’s interest.
b. The schedule of repayment of principal and payment of interest has been stipulated and repayments or receipts of principal amounts and interest have been regular as per stipulations.
c. There is no overdue amount remaining outstanding as at the year-end.
iv. In our opinion and according to the information and explanations given to us, the Company has complied with the provisions of Sections 185 and 186 of the Act in respect of grant of loans, making investments and providing guarantees and securities, as applicable.
v. The Company has not accepted deposits during the year and does not have any unclaimed deposits as at March 31, 2018 and therefore, the provisions of the clause 3 (v) of the Order are not applicable to the Company.
vi. The maintenance of cost records has not been specified by the Central Government under Section 148(1) of the Companies Act, 2013 for the business activities carried out by the Company. Thus reporting under Clause 3(vi) of the order is not applicable to the Company.
vii. According to the information and explanations given to us, in respect of statutory dues :
a. The Company has generally been regular in depositing undisputed statutory dues, including Provident Fund, Employees’ State Insurance, Income Tax, Sales Tax, Service Tax, Goods and Service Tax, Value Added Tax, Customs Duty, Excise Duty, Cess and other material statutory dues applicable to it with the appropriate authorities.
b. There were no undisputed amounts payable in respect of Provident Fund, Employees’ State Insurance, Income Tax, Sales Tax, Service Tax, Value Added Tax, Goods and Service Tax, Customs Duty, Excise Duty, Cess and other material statutory dues in arrears as at March 31, 2018 for a period of more than six months from the date they became payable.

144 | Standalone financial statements Infosys Annual Report 2017-18
c. Details of dues of Income Tax, Sales Tax, Service Tax, Excise Duty and Value Added Tax which have not been deposited as at March 31, 2018 on account of dispute are given below :
Nature of the statute
Nature of dues Forum where dispute is pending
Period to which the amount relates
Amount in ` crore
The Income Tax Act, 1961
Income Tax Appellate Tribunal A.Y. 2010-11 to A.Y. 2013-14 and AY 2016-17
1,391
Income Tax Appellate Authority upto Commissioner’s level
A.Y. 2008-09 to A.Y. 2018-19
2,192
Finance Act, 1994 Service Tax Appellate Tribunal F.Y 2004-05 to F.Y 2014-15 60Central Excise Act, 1944
Excise Duty Appellate Tribunal F.Y 2005-06 to F.Y 2015-16 68
Sales Tax Act and VAT Laws
Sales Tax and Interest
High Court F.Y. 2007-08 (1) –
Appellate Authority upto Commissioner’s level
F.Y. 2006-07 to F.Y. 2010-11, F.Y 2012-13 and F.Y 2014-15 to F.Y 2016-17 22
Specified Officer of SEZ F.Y 2008-09 to F.Y 2011-12 5(1) Less than ` 1 crore
viii. The Company has not taken any loans or borrowings from financial institutions, banks and government or has not issued any debentures. Hence reporting under Clause 3 (viii) of the Order is not applicable to the Company.
ix. The Company has not raised moneys by way of initial public offer or further public offer (including debt instruments) or term loans and hence reporting under Clause 3 (ix) of the Order is not applicable to the Company.
x. To the best of our knowledge and according to the information and explanations given to us, no fraud by the Company or no material fraud on the Company by its officers or employees has been noticed or reported during the year.
xi. In our opinion and according to the information and explanations given to us, the Company has paid/provided managerial remuneration in accordance with the requisite approvals mandated by the provisions of Section 197 read with Schedule V to the Act.
xii. The Company is not a nidhi company and hence, reporting under Clause 3 (xii) of the Order is not applicable to the Company.xiii. In our opinion and according to the information and explanations given to us, the Company is in compliance with Section
177 and 188 of the Companies Act, 2013 where applicable, for all transactions with the related parties and the details of related party transactions have been disclosed in the standalone financial statements as required by the applicable accounting standards.
xiv. During the year, the Company has not made any preferential allotment or private placement of shares or fully or partly paid convertible debentures and hence, reporting under Clause 3 (xiv) of the Order is not applicable to the Company.
xv. In our opinion and according to the information and explanations given to us, during the year the Company has not entered into any non-cash transactions with its directors or persons connected to its directors and hence provisions of Section 192 of the Companies Act, 2013 are not applicable to the Company.
xvi. The Company is not required to be registered under Section 45-IA of the Reserve Bank of India Act, 1934.
For DELOITTE HASKINS & SELLS LLPChartered Accountants
Firm’s registration number : 117366W/W-100018
Bengaluru
April 13, 2018
Sd/-
P.R. Ramesh Partner
Membership number : 70928

Standalone financial statements | 145 Infosys Annual Report 2017-18
Balance Sheet
in ` crore
Particulars Note no. As at March 31, 2018 2017
ASSETSNON-CURRENT ASSETS
Property, plant and equipment 2.1 9,027 8,605 Capital work-in-progress 1,442 1,247 Goodwill 2.2.1 29 – Other intangible assets 2.2.2 101 – Financial assets
Investments 2.3 11,993 15,334 Loans 2.4 19 5 Other financial assets 2.5 177 216
Deferred tax assets (net) 2.15 1,128 346 Income tax assets (net) 2.15 5,710 5,454 Other non-current assets 2.8 2,161 996
TOTAL NON-CURRENT ASSETS 31,787 32,203 CURRENT ASSETS
Financial assets Investments 2.3 5,906 9,643 Trade receivables 2.6 12,151 10,960 Cash and cash equivalents 2.7 16,770 19,153 Loans 2.4 393 310 Other financial assets 2.5 5,906 5,403
Other current assets 2.8 1,439 2,213 42,565 47,682
Assets held for sale 2.26 1,525 – TOTAL CURRENT ASSETS 44,090 47,682
TOTAL ASSETS 75,877 79,885 EQUITY AND LIABILITIES
EQUITY Equity share capital 2.10 1,092 1,148 Other equity 62,410 66,869
TOTAL EQUITY 63,502 68,017
Balance Sheet

146 | Standalone financial statements Infosys Annual Report 2017-18
Balance Sheet (contd.)in ` crore
Particulars Note no. As at March 31, 2018 2017
LIABILITIES NON-CURRENT LIABILITIES
Financial liabilitiesOther financial liabilities 2.11 55 40
Deferred tax liabilities (net) 2.15 505 – Other non-current liabilities 2.13 153 42
TOTAL NON-CURRENT LIABILITIES 713 82 CURRENT LIABILITIES
Financial liabilitiesTrade payables 2.12 738 269 Other financial liabilities 2.11 5,540 5,056
Other current liabilities 2.13 2,972 2,349 Provisions 2.14 436 350 Income tax liabilities (net) 2.15 1,976 3,762
TOTAL CURRENT LIABILITIES 11,662 11,786 TOTAL EQUITY AND LIABILITIES 75,877 79,885
The accompanying notes form an integral part of the standalone financial statements.As per our report of even date attached
for Deloitte Haskins & Sells LLPChartered Accountants
Firm’s registration number : 117366W/W-100018
for and on behalf of the Board of Directors of Infosys Limited
P.R. RameshPartner
Membership number : 70928
Nandan M. NilekaniChairman
Salil ParekhChief Executive Officer and Managing Director
U.B. Pravin RaoChief Operating Officer and Whole‑time Director
BengaluruApril 13, 2018
D. SundaramDirector
M.D. RanganathChief Financial Officer
A.G.S. ManikanthaCompany Secretary

Standalone financial statements | 147 Infosys Annual Report 2017-18
Statement of Profit and Loss in ` crore, except equity share and per equity share data
Particulars Note no. Year ended March 31,2018 2017
Revenue from operations 2.16 61,941 59,289 Other income, net 2.17 4,019 3,062 TOTAL INCOME 65,960 62,351 EXPENSES
Employee benefit expenses 2.18 32,472 30,944 Cost of technical sub-contractors 5,494 4,809 Travel expenses 1,479 1,638 Cost of software packages and others 2.18 1,270 1,235 Communication expenses 330 372 Consultancy and professional charges 826 538 Depreciation and amortization expense 2.1 & 2.2.2 1,408 1,331 Other expenses 2.18 2,184 2,546 Impairment loss on assets held for sale 2.26 589 –
TOTAL EXPENSES 46,052 43,413 Profit before tax 19,908 18,938 Tax expense
Current tax 2.15 4,003 5,068 Deferred tax 2.15 (250) 52
PROFIT FOR THE YEAR 16,155 13,818 Other comprehensive income Items that will not be reclassified subsequently to profit or loss
Remeasurement of the net defined benefit liability / asset, net 2.20 & 2.15 52 (42)Equity instruments through other comprehensive income, net 2.3 & 2.15 7 (5)
Items that will be reclassified subsequently to profit or lossFair value changes on derivatives designated as cash flow hedge, net 2.9 & 2.15 (39) 39 Fair value changes on investments, net 2.3 & 2.15 1 (10)
Total other comprehensive income / (loss), net of tax 21 (18)
TOTAL COMPREHENSIVE INCOME FOR THE YEAR 16,176 13,800 Earnings per equity share Equity shares of par value ` 5 each
Basic (`) 71.28 60.16Diluted (`) 71.25 60.15
Weighted average equity shares used in computing earnings per equity share
Basic 2.21 226,63,43,802 229,69,44,664 Diluted 2.21 226,73,92,621 229,71,59,670
The accompanying notes form an integral part of the standalone financial statements.As per our report of even date attached
for Deloitte Haskins & Sells LLPChartered Accountants
Firm’s registration number : 117366W/W-100018
for and on behalf of the Board of Directors of Infosys Limited
P.R. RameshPartner
Membership number : 70928
Nandan M. NilekaniChairman
Salil ParekhChief Executive Officer and Managing Director
U.B. Pravin RaoChief Operating Officer and Whole‑time Director
BengaluruApril 13, 2018
D. SundaramDirector
M.D. RanganathChief Financial Officer
A.G.S. ManikanthaCompany Secretary
Statement of Profit and Loss

148 | Standalone financial statem
entsInfosys A
nnual Report 2017-18
Statement of Changes in Equity in ` crore
Particulars Equity share
capital
Other equity Total equity attributable
to equity holders
of the Company
Reserves and surplus Other comprehensive incomeSecurities premium
reserve
Retained earnings
General reserve
Share options
outstanding account
Special Economic Zone Re-
investment Reserve(1)
Capital reserve Capital redemption
reserve
Equity instruments
through other comprehensive
income
Effective portion of cash
flow hedges
Other items of other
comprehensive income
Capital reserve
Business transfer
adjustment reserve(2)
Balance as at April 1, 2016 1,148 2,204 44,698 9,508 9 – 54 3,448 – – – 13 61,082Changes in equity for the year ended March 31, 2017Transfer to general reserve – – (1,579) 1,579 – – – – – – – – – Transferred to Special Economic Zone Re-investment Reserve – – (953) – – 953 – – – – – – – Transferred from Special Economic Zone Re-investment Reserve on utilization – – 953 – – (953) – – – – – – – Exercise of stock options (Refer to Note 2.10) – 3 – – (3) – – – – – – – – Income tax benefit arising on exercise of stock options – 1 – – – – – – – – – – 1 Share-based payment to employees of the group (Refer to Note 2.10) – – – – 114 – – – – – – – 114 Remeasurement of the net defined benefit liability/asset(3) – – – – – – – – – – – (42) (42)Fair value changes on derivatives designated as cash flow hedge(3) (Refer to Note 2.9) – – – – – – – – – – 39 – 39 Fair value changes on investments, net(3) (Refer to Note 2.3) – – – – – – – – – – – (10) (10)Equity instruments through other comprehensive income(3) (Refer to Note 2.3) – – – – – – – – – (5) – – (5)Dividends (including dividend distribution tax) – –
(6,980) – – – – – – – – – (6,980)
Profit for the year – – 13,818 – – – – – – – – – 13,818 Balance as at March 31, 2017 1,148 2,208 49,957 11,087 120 – 54 3,448 – (5) 39 (39) 68,017
Statement of Changes in Equity

Standalone financial statem
ents | 149 Infosys A
nnual Report 2017-18
Statement of Changes in Equity (contd.)in ` crore
Particulars Equity share
capital
Other equity Total equity attributable
to equity holders
of the Company
Reserves and surplus Other comprehensive incomeSecurities premium
reserve
Retained earnings
General reserve
Share options
outstanding account
Special Economic Zone Re-
investment Reserve(1)
Capital reserve Capital redemption
reserve
Equity instruments
through other comprehensive
income
Effective portion of cash
flow hedges
Other items of other
comprehensive income
Capital reserve
Business transfer
adjustment reserve(2)
Balance as at April 1, 2017 1,148 2,208 49,957 11,087 120 – 54 3,448 – (5) 39 (39) 68,017 Changes in equity for the year ended March 31, 2018Transfer to general reserve – – (1,382) 1,382 – – – – – – – – –Transferred to Special Economic Zone Re-investment Reserve – –
(2,141) – – 2,141 – – – – – – –
Transferred from Special Economic Zone Re-investment Reserve on utilization – – 582 – – (582) – – – – – – – Exercise of stock options (Refer to Note 2.10) – 67 – 2 (69) – – – – – – – – Shares issued on exercise of employee stock options – 5 – – – – – – – – – – 5 Share-based payment to employees of the group (Refer to Note 2.10) – – – – 79 – – – – – – – 79 Amount paid upon buyback (Refer to Note 2.10) (56)
(2,206) – (10,738) – – – – – – – – (13,000)
Transaction costs related to buyback (Refer to Note 2.10)(3) – (46) – – – – – – – – – – (46)Amount transferred to capital redemption reserve upon buyback (Refer to Note 2.10) – – – (56) – – – – 56 – – – – Loss recorded upon business transfer (Refer to Note 2.3) – – – – – – – (229) – – – – (229)Remeasurement of the net defined benefit liability/asset(3) – – – – – – – – – – – 52 52 Equity instruments through other comprehensive income(3) (Refer to Note 2.3) – – – – – – – – – 7 – – 7

150 | Standalone financial statem
entsInfosys A
nnual Report 2017-18
Particulars Equity share
capital
Other equity Total equity attributable
to equity holders
of the Company
Reserves and surplus Other comprehensive incomeSecurities premium
reserve
Retained earnings
General reserve
Share options
outstanding account
Special Economic Zone Re-
investment Reserve(1)
Capital reserve Capital redemption
reserve
Equity instruments
through other comprehensive
income
Effective portion of cash
flow hedges
Other items of other
comprehensive income
Capital reserve
Business transfer
adjustment reserve(2)
Fair value changes on derivatives designated as cash flow hedge(3) (Refer to Note 2.9) – – – – – – – – – – (39) – (39)Fair value changes on investments, net(3) (Refer to Note 2.3) – – – – – – – – – – – 1 1 Dividends (including dividend distribution tax) – –
(7,500) – – – – – – – – – (7,500)
Profit for the year – – 16,155 – – – – – – – – – 16,155 Balance as at March 31, 2018 1,092 28 55,671 1,677 130 1,559 54 3,219 56 2 – 14 63,502
(1) The Special Economic Zone Re-investment Reserve has been created out of the profit of eligible SEZ units in terms of the provisions of Section 10AA(1)(ii) of the Income tax Act,1961. The reserve should be utilized by the Company for acquiring new plant and machinery for the purpose of its business in the terms of the Section 10AA(2) of the Income tax Act, 1961.(2) Profit on transfer of business between entities under common control taken to reserve.(3) Net of tax
The accompanying notes form an integral part of the standalone financial statements.As per our report of even date attached
for Deloitte Haskins & Sells LLPChartered Accountants
Firm’s registration number : 117366W/W-100018
for and on behalf of the Board of Directors of Infosys Limited
P.R. RameshPartner
Membership number : 70928
Nandan M. NilekaniChairman
Salil ParekhChief Executive Officer and Managing Director
U.B. Pravin RaoChief Operating Officer and Whole‑time Director
BengaluruApril 13, 2018
D. SundaramDirector
M.D. RanganathChief Financial Officer
A.G.S. ManikanthaCompany Secretary
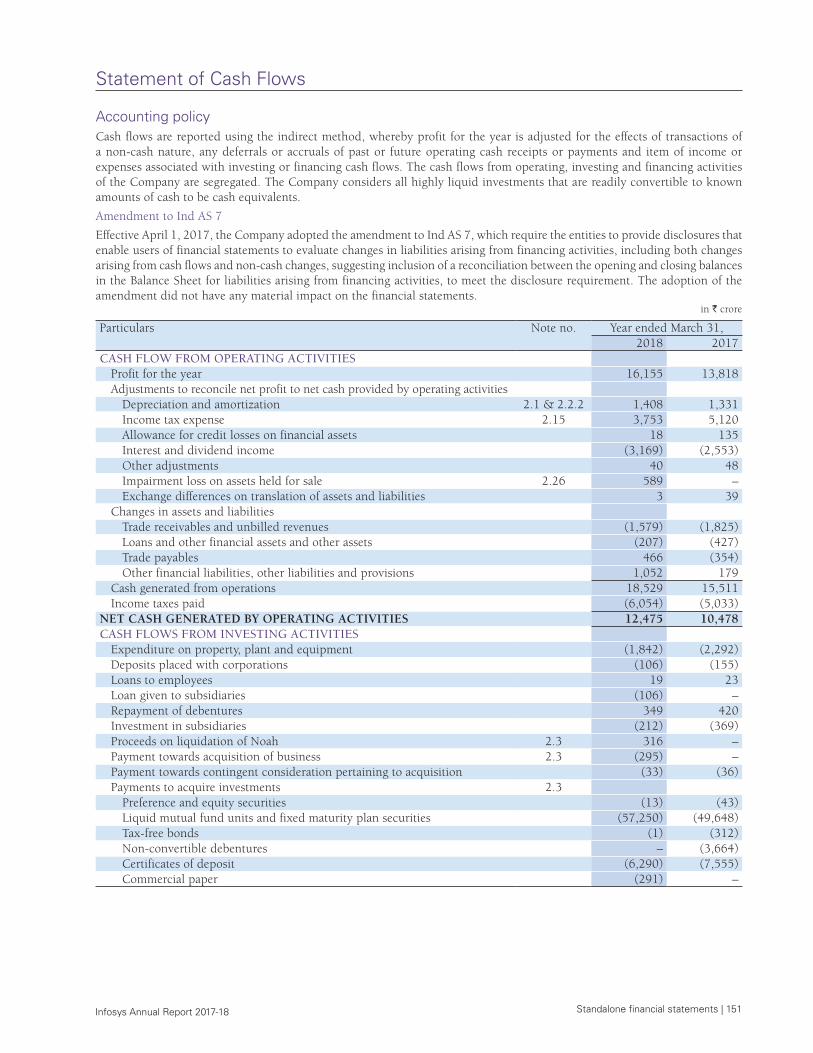
Standalone financial statements | 151 Infosys Annual Report 2017-18
Statement of Cash Flows
Accounting policyCash flows are reported using the indirect method, whereby profit for the year is adjusted for the effects of transactions of a non-cash nature, any deferrals or accruals of past or future operating cash receipts or payments and item of income or expenses associated with investing or financing cash flows. The cash flows from operating, investing and financing activities of the Company are segregated. The Company considers all highly liquid investments that are readily convertible to known amounts of cash to be cash equivalents.
Amendment to Ind AS 7
Effective April 1, 2017, the Company adopted the amendment to Ind AS 7, which require the entities to provide disclosures that enable users of financial statements to evaluate changes in liabilities arising from financing activities, including both changes arising from cash flows and non-cash changes, suggesting inclusion of a reconciliation between the opening and closing balances in the Balance Sheet for liabilities arising from financing activities, to meet the disclosure requirement. The adoption of the amendment did not have any material impact on the financial statements.
in ` crore
Particulars Note no. Year ended March 31,2018 2017
CASH FLOW FROM OPERATING ACTIVITIESProfit for the year 16,155 13,818 Adjustments to reconcile net profit to net cash provided by operating activities
Depreciation and amortization 2.1 & 2.2.2 1,408 1,331 Income tax expense 2.15 3,753 5,120 Allowance for credit losses on financial assets 18 135 Interest and dividend income (3,169) (2,553)Other adjustments 40 48 Impairment loss on assets held for sale 2.26 589 – Exchange differences on translation of assets and liabilities 3 39
Changes in assets and liabilitiesTrade receivables and unbilled revenues (1,579) (1,825)Loans and other financial assets and other assets (207) (427)Trade payables 466 (354)Other financial liabilities, other liabilities and provisions 1,052 179
Cash generated from operations 18,529 15,511 Income taxes paid (6,054) (5,033)
NET CASH GENERATED BY OPERATING ACTIVITIES 12,475 10,478 CASH FLOWS FROM INVESTING ACTIVITIES
Expenditure on property, plant and equipment (1,842) (2,292)Deposits placed with corporations (106) (155)Loans to employees 19 23 Loan given to subsidiaries (106) – Repayment of debentures 349 420 Investment in subsidiaries (212) (369)Proceeds on liquidation of Noah 2.3 316 – Payment towards acquisition of business 2.3 (295) – Payment towards contingent consideration pertaining to acquisition (33) (36)Payments to acquire investments 2.3
Preference and equity securities (13) (43)Liquid mutual fund units and fixed maturity plan securities (57,250) (49,648)Tax-free bonds (1) (312)Non-convertible debentures – (3,664)Certificates of deposit (6,290) (7,555)Commercial paper (291) –
Statement of Cash Flows

152 | Standalone financial statements Infosys Annual Report 2017-18
Particulars Note no. Year ended March 31,2018 2017
Proceeds on sale of investments 2.3Preference and equity securities 10 – Liquid mutual fund units and fixed maturity plan securities 59,364 47,495 Tax-free bonds – 2 Non-convertible debentures 100 – Certificates of deposit 9,411 –
Dividend received from subsidiaries 846 – Interest and dividend received 1,708 2,640
NET CASH FROM / (USED IN) INVESTING ACTIVITIES 5,684 (13,494)CASH FLOW FROM FINANCING ACTIVITIES
Shares issued on exercise of employee stock options 5 – Buyback including transaction cost 2.10 (13,046) – Payment of dividends (including dividend distribution tax) (7,495) (6,968)
NET CASH USED IN FINANCING ACTIVITIES (20,536) (6,968)Effect of exchange differences on translation of foreign currency cash and cash equivalents (6) (39)Net decrease in cash and cash equivalents (2,377) (9,984)Cash and cash equivalents at the beginning of the year 2.7 19,153 29,176 CASH AND CASH EQUIVALENTS AT THE END OF THE YEAR 2.7 16,770 19,153 Supplementary information
Restricted cash balance 2.7 375 411
The accompanying notes form an integral part of the standalone financial statements.As per our report of even date attached
for Deloitte Haskins & Sells LLPChartered Accountants
Firm’s registration number : 117366W/W-100018
for and on behalf of the Board of Directors of Infosys Limited
P.R. RameshPartner
Membership number : 70928
Nandan M. NilekaniChairman
Salil ParekhChief Executive Officer and Managing Director
U.B. Pravin RaoChief Operating Officer and Whole‑time Director
BengaluruApril 13, 2018
D. SundaramDirector
M.D. RanganathChief Financial Officer
A.G.S. ManikanthaCompany Secretary

Standalone financial statements | 153 Infosys Annual Report 2017-18
Overview and notes to the financial statements
1. Overview
1.1 Company overview Infosys Limited (‘the Company’ or Infosys) is a leading provider of consulting, technology, outsourcing, next-generation services and software. Along with its subsidiaries, Infosys provides business IT services (comprising application development and maintenance, independent validation, infrastructure management, engineering services comprising product engineering and life-cycle solutions and business process management); consulting and systems integration services (comprising consulting, enterprise solutions, systems integration and advanced technologies); products, business platforms and solutions to accelerate intellectual property-led innovation. Its new offerings span areas like digital, big data and analytics, cloud, data and mainframe modernization, cyber security, IoT engineering services and API and micro services.
The Company is a public limited company incorporated and domiciled in India and has its registered office in Bengaluru, Karnataka, India. The Company has its primary listings on the BSE Limited and National Stock Exchange of India Limited, in India. The Company’s American Depositary Shares (ADSs) representing equity shares are also listed on the New York Stock Exchange (NYSE), Euronext London and Euronext Paris.
The Company has proposed to voluntarily delist its ADSs from the Euronext Paris and Euronext London exchanges due to low average daily trading volume of Infosys ADSs on these exchanges. The proposed delisting is subject to approval from the said stock exchanges.
The financial statements are approved for issue by the Company’s Board of Directors on April 13, 2018.
1.2 Basis of preparation of financial statements These financial statements are prepared in accordance with Indian Accounting Standards (Ind AS), under the historical cost convention on the accrual basis except for certain financial instruments which are measured at fair values, the provisions of the Companies Act , 2013 (‘the Act’) (to the extent notified) and guidelines issued by the Securities and Exchange Board of India (SEBI). The Ind AS are prescribed under Section 133 of the Act read with Rule 3 of the Companies (Indian Accounting Standards) Rules, 2015 and the relevant amendment rules issued thereafter.
Effective April 1, 2016, the Company has adopted all the Ind AS standards and the adoption was carried out in accordance with Ind AS 101, First‑time Adoption of Indian Accounting Standards, with April 1, 2015 as the transition date. The transition was carried out from Indian Accounting Principles generally accepted in India as prescribed under Section 133 of the Act, read with Rule 7 of the Companies (Accounts) Rules, 2014 (IGAAP), which was the previous GAAP.
Accounting policies have been consistently applied except where a newly-issued accounting standard is initially adopted or a revision to an existing accounting standard requires a change in the accounting policy hitherto in use.
Amounts for the year ended March 31, 2017 and as at March 31, 2017 were audited by previous auditors – B S R & Co LLP.
As the year-end figures are taken from the source and rounded to the nearest digits, the figures reported for the previous quarters might not always add up to the year-end figures reported in this statement.
1.3 Use of estimates and judgmentsThe preparation of the financial statements in conformity with Ind AS requires the Management to make estimates, judgments and assumptions. These estimates, judgments and assumptions affect the application of accounting policies and the reported amounts of assets and liabilities, the disclosures of contingent assets and liabilities at the date of the financial statements and reported amounts of revenues and expenses during the period. The application of accounting policies that require critical accounting estimates involving complex and subjective judgments and the use of assumptions in these financial statements have been disclosed in Note 1.4. Accounting estimates could change from period to period. Actual results could differ from those estimates. Appropriate changes in estimates are made as the Management becomes aware of changes in circumstances surrounding the estimates. Changes in estimates are reflected in the financial statements in the period in which changes are made and, if material, their effects are disclosed in the notes to the financial statements.
1.4 Critical accounting estimates
a. Revenue recognition The Company uses the percentage-of-completion method in accounting for its fixed-price contracts. Use of the percentage-of-completion method requires the Company to estimate the efforts or costs expended to date as a proportion of the total efforts or costs to be expended. Efforts or costs expended have been used to measure progress towards completion as there is a direct relationship between input and productivity. Provisions for estimated losses, if any, on uncompleted contracts are recorded in the period in which such losses become probable based on the expected contract estimates at the reporting date.
b. Income taxes The Company’s two major tax jurisdictions are India and the US, though the Company also files tax returns in other overseas jurisdictions. Significant judgments are involved in determining the provision for income taxes, including amount expected to be paid/recovered for uncertain tax positions. Also, refer to Notes 2.15 and 2.22.
c. Property, plant and equipment Property, plant and equipment represent a significant proportion of the asset base of the Company. The charge in respect of periodic depreciation is derived after determining an estimate of an asset’s expected useful life and the expected residual value at the end of its life. The useful lives and residual values of Company’s assets are determined by the Management at the time the asset is acquired and reviewed
Notes to the Financial Statements

154 | Standalone financial statements Infosys Annual Report 2017-18
periodically, including at each financial year end. The lives are based on historical experience with similar assets as well as anticipation of future events, which may impact their life, such as changes in technology.
d. Non-current assets held for saleAssets held for sale are measured at the lower of carrying amount or fair value less costs to sell. The determination of fair value less costs to sell includes use of management estimates and assumptions. The fair value of the asset held for sale has been estimated using valuation techniques (mainly income and market approach), which include unobservable inputs.
1.5 Recent accounting pronouncements Appendix B to Ind AS 21, Foreign currency transactions and advance consideration : On March 28, 2018, the Ministry of Corporate Affairs (‘the MCA’) notified the Companies (Indian Accounting Standards) Amendment Rules, 2018 containing Appendix B to Ind AS 21, Foreign currency transactions and advance consideration which clarifies the date of the transaction for the purpose of determining the exchange rate to use on initial recognition of the related asset, expense or income, when an entity has received or paid advance consideration in a foreign currency.
The amendment will come into force from April 1, 2018. The Company has evaluated the effect of this on the financial statements and the impact is not material.
Ind AS 115, Revenue from Contract with Customers : On March 28, 2018, the MCA notified the Ind AS 115. The core principle of the new standard is that an entity should recognize revenue to depict the transfer of promised goods or services to customers in an amount that reflects the consideration to which the entity expects to be entitled in exchange for those goods or services. Further, the new standard requires enhanced disclosures about the nature, amount, timing and uncertainty of revenue and cash flows arising from the entity’s contracts with customers.
The standard permits two possible methods of transition :
• Retrospective approach - Under this approach the standard will be applied retrospectively to each prior reporting period presented in accordance with Ind AS 8, Accounting Policies, Changes in Accounting Estimates and Errors.
• Retrospectively with cumulative effect of initially applying the standard recognized at the date of initial application (Cumulative catch - up approach)
The effective date for adoption of Ind AS 115 is financial period beginning on or after April 1, 2018.
The Company will adopt the standard on April 1, 2018 by using the cumulative catch-up transition method and accordingly, comparatives for the year ending or ended March 31, 2018 will not be retrospectively adjusted. The effect on adoption of Ind AS 115 is expected to be insignificant.
2.1 Property, plant and equipment
Accounting policyProperty, plant and equipment are stated at cost, less accumulated depreciation and impairment, if any. Costs directly attributable to acquisition are capitalized until the
property, plant and equipment are ready for use, as intended by the Management. The Company depreciates property, plant and equipment over their estimated useful lives using the straight-line method. The estimated useful lives of assets are as follows :
Building(1) 22-25 yearsPlant and machinery(1) 5 yearsOffice equipment 5 yearsComputer equipment(1) 3-5 yearsFurniture and fixtures(1) 5 yearsVehicles(1) 5 yearsLeasehold improvements Over lease term
(1) Based on technical evaluation, the Management believes that the useful lives as given above best represent the period over which the Management expects to use these assets. Hence, the useful lives for these assets are different from the useful lives as prescribed under Part C of Schedule II of the Companies Act 2013.
Depreciation methods, useful lives and residual values are reviewed periodically, including at each financial year end.
Advances paid towards the acquisition of property, plant and equipment outstanding at each Balance Sheet date is classified as capital advances under other non-current assets and the cost of assets not ready to use before such date are disclosed under ‘Capital work-in-progress’. Subsequent expenditures relating to property, plant and equipment are capitalized only when it is probable that future economic benefits associated with these will flow to the Company and the cost of the item can be measured reliably. Repairs and maintenance costs are recognized in the Statement of Profit and Loss when incurred. The cost and related accumulated depreciation are eliminated from the financial statements upon sale or retirement of the asset and the resultant gains or losses are recognized in the Statement of Profit and Loss.
ImpairmentProperty, plant and equipment are evaluated for recoverability whenever events or changes in circumstances indicate that their carrying amounts may not be recoverable. For the purpose of impairment testing, the recoverable amount (i.e. the higher of the fair value less cost to sell and the value-in-use) is determined on an individual asset basis unless the asset does not generate cash flows that are largely independent of those from other assets. In such cases, the recoverable amount is determined for the Cash Generating Unit (CGU) to which the asset belongs.
If such assets are considered to be impaired, the impairment to be recognized in the Statement of Profit and Loss is measured by the amount by which the carrying value of the assets exceeds the estimated recoverable amount of the asset. An impairment loss is reversed in the Statement of Profit and Loss if there has been a change in the estimates used to determine the recoverable amount. The carrying amount of the asset is increased to its revised recoverable amount, provided that this amount does not exceed the carrying amount that would have been determined (net of any accumulated depreciation) had no impairment loss been recognized for the asset in prior years.

Standalone financial statements | 155 Infosys Annual Report 2017-18
The changes in the carrying value of property, plant and equipment for the year ended March 31, 2018 are as follows : in ` crore
Particulars Land – Freehold
Land – Leasehold
Buildings(1)
(2)
Plant and machinery(2)
(3)
Office equipment(2)
Computer equipment(2)
Furniture and
fixtures(2)
Leasehold improvements
Vehicles Total
Gross carrying value as at April 1, 2017 1,093 659 6,483 1,966 769 3,886 1,132 198 24
16,210
Additions 134 2 789 250 78 396 121 48 5 1,823 Deletions – – (1) (7) (6) (53) (6) (11) – (84)Gross carrying value as at March 31, 2018 1,227 661 7,271 2,209 841 4,229 1,247 235 29
17,949
Accumulated depreciation as at April 1, 2017 – (26) (2,377) (1,274) (472) (2,603) (757) (82) (14)
(7,605)
Depreciation – (4) (244) (258) (115) (592) (145) (36) (3) (1,397)Accumulated depreciation on deletions – – – 6 5 52 6 11 – 80 Accumulated depreciation as at March 31, 2018 – (30) (2,621) (1,526) (582) (3,143) (896) (107) (17)
(8,922)
Carrying value as at April 1, 2017 1,093 633 4,106 692 297 1,283 375 116 10 8,605 Carrying value as at March 31, 2018 1,227 631 4,650 683 259 1,086 351 128 12 9,027
The changes in the carrying value of property, plant and equipment for the year ended March 31, 2017 were as follows : in ` crore
Particulars Land – Freehold
Land – Leasehold
Buildings(1)
(2)
Plant and machinery(2)
(3)
Office equipment(2)
Computer equipment(2)
Furniture and
fixtures(2)
Leasehold improvements
Vehicles Total
Gross carrying value as at April 1, 2016 970 638 6,173 1,662 679 3,481 991 96 19 14,709 Additions 123 21 310 308 122 654 169 104 6 1,817 Deletions – – – (4) (32) (249) (28) (2) (1) (316)Gross carrying value as at March 31, 2017 1,093 659 6,483 1,966 769 3,886 1,132 198 24 16,210 Accumulated depreciation as at April 1, 2016 – (21) (2,150) (1,033) (369) (2,195) (619) (63) (11)
(6,461)
Depreciation – (5) (227) (245) (111) (572) (146) (21) (4) (1,331)Accumulated depreciation on deletions – – – 4 8 164 8 2 1 187 Accumulated depreciation as at March 31, 2017 – (26) (2,377) (1,274) (472) (2,603) (757) (82) (14)
(7,605)
Carrying value as at April 1, 2016 970 617 4,023 629 310 1,286 372 33 8 8,248 Carrying value as at March 31, 2017 1,093 633 4,106 692 297 1,283 375 116 10 8,605
(1) Buildings include ` 250 being the value of five shares of ` 50 each in Mittal Towers Premises Co-operative Society Limited.(2) Includes certain assets provided on cancellable operating lease to subsidiaries.(3) Includes ` 168 crore and ` 25 crore spent on CSR activities for the years ended March 31, 2018 and March 31, 2017, respectively.
Gross carrying value of leasehold land represents amounts paid under certain lease-cum-sale agreements to acquire land including agreements where the Company has an option to purchase or renew the properties on expiry of the lease period.
The aggregate depreciation has been included under depreciation and amortization expense in the Statement of Profit and Loss.

156 | Standalone financial statements Infosys Annual Report 2017-18
Tangible assets provided on operating lease to subsidiaries as at March 31, 2018 and March 31, 2017 are as follows :
in ` crore
Particulars Cost Accumulated depreciation
Net book value
Buildings 190 82 108 197 82 115
Plant and machinery 33 25 8 33 19 14
Furniture and fixtures 25 20 5 25 16 9
Computer equipment 3 2 1 3 2 1
Office equipment 18 13 5 18 10 8
in ` crore
Particulars Year ended March 31,2018 2017
Aggregate depreciation charged on above assets 20 19Rental income from subsidiaries 67 65
2.2 Goodwill and other intangible assets2.2.1 GoodwillA summary of changes in the carrying amount of goodwill is as follows :
in ` crore
Particulars
As at March 31,2018 2017
Carrying value at the beginning – – Goodwill on business transfer of Noah (Refer to Note 2.3.1) 29 – Carrying value at the end 29 –
The goodwill which was transferred as part of the business transfer has been allocated to the Company’s CGU which is represented by the Energy & Utilities, Communication and Services segment.
2.2.2 Other intangible assets
Accounting policyIntangible assets are stated at cost less accumulated amortization and impairment. Intangible assets are amortized over their respective individual estimated useful lives on a straight-line basis, from the date that they are available for use. The estimated useful life of an identifiable intangible asset is based on a number of factors including the effects of obsolescence, demand, competition, and other economic factors (such as the stability of the industry, and known technological advances). Amortization methods and useful lives are reviewed periodically including at each financial year end.
Research costs are expensed as incurred. Software product development costs are expensed as incurred unless technical and commercial feasibility of the project is demonstrated, future economic benefits are probable, the Company has an intention and ability to complete and use or sell the software and the costs can be measured reliably. The costs which can be capitalized include the cost of material, direct labor and overhead costs that are directly attributable to preparing the asset for its intended use.
The changes in the carrying value of acquired intangible assets for the year ended March 31, 2018 are as follows : in ` crore
Particulars Customer- related
Sub-contracting
rights-related
Trade name- related
Others Total
Gross carrying value as at April 1, 2017 – 21 – 9 30 Transfer of assets (Refer to Note 2.3.1) 113 – 26 26 165 Deletions / retirals during the period – (21) – (9) (30)Gross carrying value as at March 31, 2018 113 – 26 26 165 Accumulated amortization as at April 1, 2017 – (21) – (9) (30)Transfer of assets (Refer to Note 2.3.1) (33) – (10) (10) (53)Amortization expense (7) – (2) (2) (11)Accumulated amortization on deletions – 21 – 9 30 Accumulated amortization as at March 31, 2018 (40) – (12) (12) (64)Carrying value as at April 1, 2017 – – – – – Carrying value as at March 31, 2018 73 – 14 14 101 Estimated useful life (in years) 2-10 – 5 5 – Estimated remaining useful life (in years) 5 – 3 3 –

Standalone financial statements | 157 Infosys Annual Report 2017-18
The changes in the carrying value of acquired intangible assets for the year ended March 31, 2017 were as follows : in ` crore
Particulars Sub-contracting
rights related
Others Total
Gross carrying value as at April 1, 2016 21 9 30 Additions – – – Deletions – – – Gross carrying value as at March 31, 2017 21 9 30 Accumulated depreciation as at April 1, 2016 (21) (9) (30)Depreciation – – – Accumulated depreciation on deletions – – – Accumulated depreciation as at March 31, 2017 (21) (9) (30)Carrying value as at April 1, 2016 – – – Carrying value as at March 31, 2017 – – – Estimated useful life (in years) – – – Estimated remaining useful life (in years) – – –
Research and development expense recognized in the Statement of Profit and Loss for the years ended March 31, 2018 and March 31, 2017 is ` 374 crore and ` 351 crore, respectively.
2.3 Investmentsin ` crore
Particulars As at March 31,2018 2017
NON-CURRENT INVESTMENTSEquity instruments of subsidiaries 5,013 7,305 Debentures of subsidiary 1,780 2,129 Preference securities and equity instruments 117 132 Others 7 3 Tax-free bonds 1,831 1,833 Fixed maturity plans securities 376 357 Non-convertible debentures 2,869 3,575
TOTAL NON-CURRENT INVESTMENTS 11,993 15,334 CURRENT INVESTMENTS
Liquid mutual fund units – 1,755 Fixed maturity plans securities – 151 Certificates of deposit 4,901 7,635 Government bonds 1 – Non-convertible debentures 711 102 Commercial paper 293 –
TOTAL CURRENT INVESTMENTS 5,906 9,643 TOTAL CARRYING VALUE 17,899 24,977
in ` crore, except as otherwise stated
Particulars As at March 31,2018 2017
NON-CURRENT INVESTMENTSUNQUOTEDInvestment carried at cost
Investments in equity instruments of subsidiariesInfosys BPM Limited (formerly Infosys BPO Limited) 659 659 3,38,22,319 (3,38,22,319) equity shares of ` 10 each, fully paidInfosys Technologies (China) Co. Limited 333 236 Infosys Technologies (Australia) Pty Limited(1) 38 66 1,01,08,869 (1,01,08,869) equity shares of AUD 0.11 par value, fully paidInfosys Technologies, S. de R.L. de C.V., Mexico 65 65 17,49,99,990 (17,49,99,990) equity shares of MXN 1 par value, fully paid upInfosys Technologies (Sweden) AB 76 76 1,000 (1,000) equity shares of SEK 100 par value, fully paid

158 | Standalone financial statements Infosys Annual Report 2017-18
Particulars As at March 31,2018 2017
Infosys Technologia do Brasil Ltda 149 149 5,91,24,348 (5,91,24,348) shares of BRL 1.00 par value, fully paidInfosys Technologies (Shanghai) Company Limited 900 826 Infosys Public Services, Inc. 99 99 3,50,00,000 (3,50,00,000) shares of USD 0.50 par value, fully paidInfosys Consulting Holding AG (formerly Lodestone Holding AG) 1,323 1,323 23,350 (23,350) - Class A shares of CHF 1,000 each and 29,400 (29,400) - Class B Shares of CHF 100 each, fully paid upInfosys Americas Inc. 1 1 10,000 (10,000) shares of USD 10 per share, fully paid upEdgeVerve Systems Limited 1,312 1,312 1,31,18,40,000 (1,31,18,40,000) equity shares of ` 10 each, fully paidInfosys Nova Holdings LLC(1)(2) – 94 Noah Consulting LLC (Refer to Note 2.3.1) – 313 Infosys Consulting Pte Ltd (formerly Lodestone Management Consultants) 10 10 Pte Ltd) 1,09,90,000 (1,09,90,000) shares of SGD 1.00 par value, fully paidBrilliant Basics Holdings Limited (Refer to Note 2.3.2) 46 – 1,170 (Nil) shares of GBP 0.005 each, fully paid upInfosys Arabia Limited 2 – 70 (Nil) shares Kallidus Inc. – 619 10,21,35,416 (10,21,35,416) shares (Refer to Note 2.26)Skava Systems Private Limited – 59 25,000 (25,000) shares of ` 10 per share, fully paid up (Refer to Note 2.26)Panaya Inc. – 1,398 2 (2) shares of USD 0.01 per share, fully paid up (Refer to Note 2.26)(3)
5,013 7,305 Investment carried at amortized cost
Investment in debentures of subsidiaryEdgeVerve Systems Limited 1,780 2,129 17,80,00,000 (21,29,00,000) Unsecured redeemable, non-convertible debentures of ` 100 each fully paid up
1,780 2,129 Investments carried at fair value through profit or loss
Others (Refer to Note 2.3.3) 7 3 7 3
Investment carried at fair value through other comprehensive income (FVOCI) Preference securities (Refer to Note 2.3.3) 116 131 Equity instruments (Refer to Note 2.3.3) 1 1
117 132 QUOTEDInvestments carried at amortized cost
Tax-free bonds (Refer to Note 2.3.4) 1,831 1,833 1,831 1,833
Investments carried at fair value through profit or lossFixed maturity plans securities (Refer to Note 2.3.5) 376 357
376 357 Investments carried at fair value through other comprehensive income
Non-convertible debentures (Refer to Note 2.3.6) 2,869 3,575 2,869 3,575
TOTAL NON-CURRENT INVESTMENTS 11,993 15,334 CURRENT INVESTMENTS UNQUOTEDInvestments carried at fair value through profit or loss
Liquid mutual fund units (Refer to Note 2.3.5) – 1,755 – 1,755

Standalone financial statements | 159 Infosys Annual Report 2017-18
Particulars As at March 31,2018 2017
Investments carried at fair value through other comprehensive incomeCommercial paper (Refer to Note 2.3.6) 293 – Certificates of deposit (Refer to Note 2.3.6) 4,901 7,635
5,194 7,635 QUOTEDInvestments carried at amortized cost
Government bonds (Refer to Note 2.3.4) 1 – 1 –
Investments carried at fair value through profit or lossFixed maturity plans securities (Refer to Note 2.3.5) – 151
– 151 Investments carried at fair value through other comprehensive income
Non-convertible debentures (Refer to Note 2.3.6) 711 102 711 102
TOTAL CURRENT INVESTMENTS 5,906 9,643 TOTAL INVESTMENTS 17,899 24,977 Aggregate amount of quoted investments 5,788 6,018 Market value of quoted investments (including interest accrued) 6,045 6,327 Aggregate amount of unquoted investments 12,111 18,959 (1) Aggregate amount of impairment in value of investments 122 – Aggregate amount of impairment in value of investments held for sale (Refer to Note 2.26) 589 – Investments carried at cost 5,013 7,305 Investments carried at amortized cost 3,612 3,962 Investments carried at fair value through other comprehensive income 8,891 11,444 Investments carried at fair value through profit or loss 383 2,266
(2) During the three months ended June 30, 2017, Infosys Nova Holdings LLC, a wholly-owned subsidiary, has written down the entire carrying value of its investment in its associate DWA Nova LLC. Consequently, the Company has written down the entire carrying value of the investment in Infosys Nova Holdings LLC, amounting to ` 94 crore.
(3) During the year ended March 31, 2018, there was an additional capital infusion of ` 38 crore in Panaya Inc.
Refer to Note 2.9 for accounting policies on financial instruments.
The details of amounts recorded in other comprehensive income are as follows :in ` crore
Particulars Year ended March 31, 2018 Year ended March 31, 2017Gross Tax Net Gross Tax Net
Net gain / (loss) onNon-convertible debentures (11) 2 (9) (7) – (7)Certificates of deposit 15 (5) 10 (5) 2 (3)Equity and preference securities 4 3 7 (2) (3) (5)
Method of fair valuationin ` crore
Class of investment Method Fair value as at March 31,2018 2017
Liquid mutual funds Quoted price – 1,755 Fixed maturity plan securities Market observable inputs 376 508 Tax-free bonds and government bonds Quoted price and market observable inputs 2,079 2,142 Non-convertible debentures Quoted price and market observable inputs 3,580 3,677 Commercial paper Market observable inputs 293 – Certificates of deposit Market observable inputs 4,901 7,635 Unquoted equity and preference securities Discounted cash flows method, market
multiples method, option pricing model 117 132 Others Discounted cash flows method, market
multiples method, option pricing model 7 3
Note : Certain quoted investments are classified as Level 2 in the absence of active market for such investments.

160 | Standalone financial statements Infosys Annual Report 2017-18
2.3.1 Business transfer – Noah Consulting LLCOn July 14, 2017, the Board of Directors of Infosys authorized the Company to execute a Business Transfer Agreement and related documents with Noah Consulting LLC, a wholly-owned subsidiary, to transfer the business of Noah Consulting LLC to Infosys Limited, subject to securing the requisite regulatory approvals for a consideration based on an independent valuation. Subsequently on October 17, 2017, the Company entered into a business transfer agreement to transfer the business for a consideration of US$ 41 million (` 266 crore) and the transfer was with effect from October 25, 2017.
The transaction was between a holding company and a wholly-owned subsidiary, the resultant impact on account of business transfer was recorded in ‘Business Transfer Adjustment Reserve’ during the year ended March 31, 2018. The details of assets and liabilities taken over upon business transfer are as follows :
in ` crore
Particulars AmountGoodwill 29 Trade name 16 Customer contracts 80 Other intangibles 16 Deferred tax assets 13 Net assets / (liabilities), others (117)Total 37 Less : Consideration paid 266 Business transfer reserve (229)
Subsequently, in November 2017, Noah Consulting LLC has been liquidated and the Company received ` 316 crore as proceeds on liquidation.
2.3.2 Brilliant Basics Holdings LimitedOn September 8, 2017, Infosys acquired 100% of the voting interests in Brilliant Basics Holdings Limited, UK, (Brilliant Basics) a product design and customer experience innovator with experience in executing global programs. The business acquisition was conducted by entering into a share purchase agreement for a cash consideration of ` 29 crore, a contingent consideration of up to ̀ 20 crore and an additional consideration of up to ` 13 crore, referred to as retention bonus, payable to the employees of Brilliant Basics at each anniversary year over the next two years, subject to their continuous employment with the group at each anniversary. The fair value of contingent consideration on the date of acquisition is ` 17 crore.
Proposed investmentOn April 13, 2018, the Company entered into a definitive agreement to acquire WongDoody Holding Company Inc., a US-based creative and consumer insights agency for a total consideration of up to US$ 75 million (approximately ` 489 crore) including contingent consideration and retention payouts, subject to regulatory approvals and fulfillment of closing conditions.
2.3.3 Details of investments in preference securities, equity instruments and othersThe details of non-current other investments in preference securities, equity instruments and others as at March 31, 2018 and March 31, 2017 are as follows :
in ` crore
Particulars
As at March 31,2018 2017
PREFERENCE SECURITIESAirviz Inc. 6 9 2,82,279 (2,82,279) Series A Preferred Stock, fully paid up, par value USD 0.001 each ANSR Consulting – 10 Nil (52,631) Series A Preferred Stock, fully paid up, par value USD 0.001 eachWhoop Inc 20 15 16,48,352 (16,48,352) Series B Preferred Stock, fully paid up, par value USD 0.0001 eachCloudEndure Ltd. 26 37 25,59,290 (25,59,290) Preferred Series B Shares, fully paid up, par value ILS 0.01 eachNivetti Systems Private Limited 10 10 2,28,501 (2,28,501) Preferred Stock, fully paid up, par value ` 1 eachWaterline Data Science, Inc 23 24 39,33,910 (39,33,910) Preferred Series B Shares, fully paid up, par value USD 0.00001 eachTrifacta Inc. 21 26 11,80,358 (11,80,358) Preferred StockIdeaforge 10 – 5,402 (Nil) Series A compulsorily convertible cumulative Preference shares of ` 10 each, fully paid up.TOTAL INVESTMENT IN PREFERENCE SECURITIES 116 131EQUITY INSTRUMENTSOnMobile Systems Inc., USA – – Nil (21,54,100) common stock at USD 0.4348 each, fully paid up, par value USD 0.001 each

Standalone financial statements | 161 Infosys Annual Report 2017-18
Particulars
As at March 31,2018 2017
Merasport Technologies Private Limited – – 2,420 (2,420) equity shares at ` 8,052 each, fully paid up, par value ` 10 eachGlobal Innovation and Technology Alliance 1 1 15,000 (15,000) equity shares at ` 1,000 each, fully paid up, par value ` 1,000 eachIdeaforge – – 100 (Nil) equity shares at ` 10, fully paid upTOTAL INVESTMENT IN EQUITY INSTRUMENTS 1 1OTHERSStellaris Venture Partners India 7 3 TOTAL INVESTMENT IN OTHERS 7 3TOTAL 124 135
2.3.4 Details of investments in tax-free bonds and government bondsThe balances held in tax-free bonds as at March 31, 2018 and March 31, 2017 are as follows :
in ` crore, except as otherwise stated
Particulars Face value ` As at March 31, 2018 As at March 31, 2017 Units Amount Units Amount
7.04% Indian Railway Finance Corporation Limited Bonds 03MAR2026 10,00,000 470 50 470 50 7.16% Power Finance Corporation Ltd. Bonds 17JUL2025 10,00,000 1,000 106 1,000 107 7.18% Indian Railway Finance Corporation Limited Bonds 19FEB2023 1,000 20,00,000 201 20,00,000 201 7.28% Indian Railway Finance Corporation Limited Bonds 21DEC2030 1,000 4,22,800 42 4,22,800 42 7.28% National Highways Authority of India Bonds 18SEP2030 10,00,000 3,300 343 3,300 343 7.34% Indian Railway Finance Corporation Limited Bonds 19FEB2028 1,000 21,00,000 211 21,00,000 211 7.35% National Highways Authority of India Bonds 11JAN2031 1,000 5,71,396 57 5,71,396 57 7.93% Rural Electrification Corporation Limited Bonds 27MAR2022 1,000 2,00,000 21 2,00,000 21 8.10% Indian Railway Finance Corporation Limited Bonds 23FEB2027 1,000 5,00,000 52 5,00,000 53 8.26% India Infrastructure Finance Company Limited Bonds 23AUG2028 10,00,000 1,000 100 1,000 100 8.30% National Highways Authority of India Bonds 25JAN2027 1,000 5,00,000 53 5,00,000 53 8.35% National Highways Authority of India Bonds 22NOV2023 10,00,000 1,500 150 1,500 150 8.46% India Infrastructure Finance Company Limited Bonds 30AUG2028 10,00,000 2,000 200 2,000 200 8.46% Power Finance Corporation Limited Bonds 30AUG2028 10,00,000 1,500 150 1,500 150 8.48% India Infrastructure Finance Company Limited Bonds 05SEP2028 10,00,000 450 45 450 45 8.54% Power Finance Corporation Limited Bonds 16NOV2028 1,000 5,00,000 50 5,00,000 50 TOTAL INVESTMENTS IN TAX-FREE BONDS 68,05,416 1,831 68,05,416 1,833

162 | Standalone financial statements Infosys Annual Report 2017-18
The balances held in government bonds as at March 31, 2018 and March 31, 2017 are as follows : in ` crore, except as otherwise stated
Particulars
Face value PHP
As at March 31, 2018 As at March 31, 2017 Units Amount Units Amount
Treasury Notes Philippines Govt. 09MAY2018 100 1,00,000 1 – – TOTAL INVESTMENTS IN GOVERNMENT BONDS 1,00,000 1 – –
2.3.5 Details of investments in liquid mutual fund units and fixed maturity plan securitiesThe balances held in liquid mutual funds as at March 31, 2018 and March 31, 2017 are as follows :
in ` crore, except as otherwise stated
Particulars As at March 31, 2018 As at March 31, 2017 Units Amount Units Amount
Aditya Birla Sun Life Cash Plus – Growth – Direct Plan – – 1,33,97,873 350 ICICI Prudential Liquid – Direct Plan – Growth – – 1,03,88,743 250 IDFC Cash Fund – Direct Plan- Growth – – 12,65,679 250 Kotak Low Duration Fund – Direct Plan – Growth (Ultra Short-Term) – – 15,02,564 305 L&T Liquid Fund – Direct Plan – Growth – – 6,72,806 150 Reliance Liquid Fund – Treasury Plan – Direct Growth Plan- Growth Option – – 8,82,465 350 SBI Premier Liquid Fund- Direct Plan – Growth – – 3,91,909 100 TOTAL INVESTMENTS IN LIQUID MUTUAL FUND UNITS – – 2,85,02,039 1,755
The balances held in fixed maturity plan securities as at March 31, 2018 and March 31, 2017 are as follows :in ` crore, except as otherwise stated
Particulars As at March 31, 2018 As at March 31, 2017 Units Amount Units Amount
Aditya Birla Sun Life Fixed Term Plan- Series OD 1145 Days – GR Direct 5,00,00,000 54 5,00,00,000 51 Aditya Birla Sun Life Fixed Term Plan – Series OE 1153 days – GR Direct 2,50,00,000 27 2,50,00,000 25 HDFC FMP 1155D Feb 2017 – Direct Growth – Series 37 2,80,00,000 30 2,80,00,000 28 HDFC FMP 1169D Feb 2017 – Direct – Quarterly Dividend – Series 37 4,50,00,000 45 4,50,00,000 45 ICICI FMP Series 80 – 1194 D Plan F Div 4,00,00,000 43 4,00,00,000 40 ICICI Prudential Fixed Maturity Plan Series 80 – 1187 Days Plan G Direct Plan 4,20,00,000 45 4,20,00,000 42 ICICI Prudential Fixed Maturity Plan Series 80 – 1253 Days Plan J Direct Plan 3,00,00,000 32 3,00,00,000 30 IDFC Fixed Term Plan Series 129 Direct Plan – Growth 1147 Days 1,00,00,000 11 1,00,00,000 10 IDFC Fixed Term Plan Series 131 Direct Plan – Growth 1139 Days 1,50,00,000 16 1,50,00,000 15 Kotak FMP Series 199 Direct – Growth 3,50,00,000 37 3,50,00,000 36 Reliance Fixed Horizon Fund – XXXII Series 8 – Dividend Plan 3,50,00,000 36 3,50,00,000 35 Reliance Yearly Interval Fund Series 1 – Direct Plan- Growth Plan – – 10,69,06,898 151 TOTAL INVESTMENTS IN FIXED MATURITY PLAN SECURITIES 35,50,00,000 376 46,19,06,898 508
2.3.6 Details of investments in non-convertible debentures, certificates of deposit and commercial paperThe balances held in non-convertible debenture units as at March 31, 2018 and March 31, 2017 are as follows :
in ` crore, except as otherwise stated
Particulars Face value ` As at March 31, 2018 As at March 31, 2017 Units Amount Units Amount
7.48% Housing Development Finance Corporation Ltd 18NOV2019 1,00,00,000 50 51 50 52 7.58% LIC Housing Finance Ltd 28FEB2020 10,00,000 1,000 101 1,000 100 7.58% LIC Housing Finance Ltd 11JUN2020 10,00,000 500 52 500 51 7.59% LIC Housing Finance Ltd 14OCT2021 10,00,000 3,000 306 3,000 309 7.75% LIC Housing Finance Ltd 27AUG2021 10,00,000 1,250 129 1,250 129 7.79% LIC Housing Finance Ltd 19JUN2020 10,00,000 500 53 500 52

Standalone financial statements | 163 Infosys Annual Report 2017-18
Particulars Face value ` As at March 31, 2018 As at March 31, 2017 Units Amount Units Amount
7.80% Housing Development Finance Corporation Ltd 11NOV2019 1,00,00,000 150 153 150 155 7.81% LIC Housing Finance Ltd 27APR2020 10,00,000 2,000 214 2,000 208 7.95% Housing Development Finance Corporation Ltd 23SEP2019 1,00,00,000 50 53 50 53 8.02% LIC Housing Finance Ltd 18FEB2020 10,00,000 500 50 500 51 8.26% Housing Development Finance Corporation Ltd 12AUG2019 1,00,00,000 100 105 100 106 8.34% Housing Development Finance Corporation Ltd 06MAR2019 1,00,00,000 200 215 200 217 8.37% LIC Housing Finance Ltd 03OCT2019 10,00,000 2,000 216 2,000 218 8.37% LIC Housing Finance Ltd 10MAY2021 10,00,000 500 54 500 55 8.43% IDFC Bank Ltd 30JAN2018 10,00,000 – – 1,000 102 8.46% Housing Development Finance Corporation Ltd 11MAR2019 1,00,00,000 50 54 50 54 8.47% LIC Housing Finance Ltd 21JAN2020 10,00,000 500 51 500 52 8.50% Housing Development Finance Corporation Ltd 31AUG2020 1,00,00,000 50 54 50 54 8.54% IDFC Bank Ltd 30MAY2018 10,00,000 1,500 194 1,500 182 8.59% Housing Development Finance Corporation Ltd 14JUN2019 1,00,00,000 50 51 50 51 8.60% LIC Housing Finance Ltd 29JUL2020 10,00,000 1,400 151 1,400 152 8.61% LIC Housing Finance Ltd 11DEC2019 10,00,000 1,000 104 1,000 104 8.66% IDFC Bank Ltd 25JUN2018 10,00,000 1,520 196 1,520 184 8.72% Housing Development Finance Corporation Ltd 15APR2019 1,00,00,000 75 76 75 77 8.75% Housing Development Finance Corporation Ltd 13JAN2020 500,000 5,000 256 5,000 260 8.75% LIC Housing Finance Ltd 14JAN2020 10,00,000 1,070 112 1,070 112 8.75% LIC Housing Finance Ltd 21DEC2020 10,00,000 1,000 102 1,000 104 8.97% LIC Housing Finance Ltd 29OCT2019 10,00,000 500 52 500 53 9.45% Housing Development Finance Corporation Ltd 21AUG2019 10,00,000 3,000 323 3,000 327 9.65% Housing Development Finance Corporation Ltd 19JAN2019 10,00,000 500 52 500 53 TOTAL INVESTMENTS IN NON-CONVERTIBLE DEBENTURES 29,015 3,580 30,015 3,677
The balances held in certificates of deposit as at March 31, 2018 and March 31, 2017 are as follows : in ` crore, except as otherwise stated
Particulars
Face value ` As at March 31, 2018 As at March 31, 2017 Units Amount Units Amount
Andhra Bank 1,00,000 – – 35,000 344 Axis Bank 1,00,000 1,85,000 1,767 2,93,600 2,800 Corporation Bank 1,00,000 – – 33,500 327 DBS Bank 1,00,000 – – 5,000 49 HDFC Bank 1,00,000 15,000 147 – – ICICI Bank 1,00,000 1,10,000 1,035 42,500 413 IDFC Bank 1,00,000 – – 1,35,000 1,281 IndusInd Bank 1,00,000 1,35,000 1,272 1,06,400 1,011 Kotak Bank 1,00,000 70,000 680 74,000 704 Vijaya Bank 1,00,000 – – 14,000 137 Yes Bank 1,00,000 – – 60,000 569 TOTAL INVESTMENTS IN CERTIFICATES OF DEPOSIT 5,15,000 4,901 7,99,000 7,635

164 | Standalone financial statements Infosys Annual Report 2017-18
2.4 Loansin ` crore
Particulars As at March 31,2018 2017
NON-CURRENTUnsecured, considered good
Other loansLoans to employees 19 5
19 5 Unsecured, considered doubtful
Loans to employees 12 17 31 22
Less : Allowance for doubtful loans to employees 12 17TOTAL NON-CURRENT LOANS 19 5 CURRENTUnsecured, considered good
Loans to subsidiaries (Refer to Note 2.23) 185 69Other loans
Loans to employees 208 241TOTAL CURRENT LOANS 393 310 TOTAL LOANS 412 315
2.5 Other financial assetsin ` crore
Particulars As at March 31, 2018 2017
NON-CURRENTSecurity deposits(1) 48 81 Rental deposits(1) 129 135
TOTAL NON-CURRENT OTHER FINANCIAL ASSETS 177 216 CURRENT
Security deposits(1) 2 2 Rental deposits(1) 6 2 Restricted deposits(1) 1,415 1,309 Unbilled revenues(1)(4) 3,573 3,200 Interest accrued but not due(1) 739 514 Foreign currency forward and options contracts(2)(3) 16 268 Others(1)(5) 155 108
TOTAL CURRENT OTHER FINANCIAL ASSETS 5,906 5,403 TOTAL OTHER FINANCIAL ASSETS 6,083 5,619 (1) Financial assets carried at amortized cost 6,067 5,351 (2) Financial assets carried at fair value
through other comprehensive income 12 52
Particulars As at March 31, 2018 2017
(3) Financial assets carried at fair value through profit or loss 4 216
(4) Includes dues from subsidiaries (Refer to Note 2.23) 32 47
(5) Includes dues from subsidiaries (Refer to Note 2.23) 40 18
Restricted deposits represent deposits with financial institutions to settle employee-related obligations as and when they arise during the normal course of business.
2.6 Trade receivables(1)
in ` crore
Particulars As at March 31,2018 2017
CURRENTUnsecured
Considered good(2) 12,151 10,960 Considered doubtful 315 289
12,466 11,249 Less : Allowances for credit losses 315 289 TOTAL TRADE RECEIVABLES 12,151 10,960 (1) Includes dues from companies where
directors are interested – 1 (2) Includes dues from subsidiaries
(Refer to Note 2.23) 335 235
2.7 Cash and cash equivalents in ` crore
Particulars As at March 31,2018 2017
Balances with banksIn current and deposit accounts 10,789 12,222
Cash on hand – – Others
Deposits with financial institution 5,981 6,931
TOTAL CASH AND CASH EQUIVALENTS 16,770 19,153 Balances with banks in unpaid dividend accounts 22 17 Deposits with more than 12 months maturity 6,187 6,765 Balances with banks held as margin money deposits against guarantees 353 394
The balances held in commercial paper as at March 31, 2018 and March 31, 2017 are as follows :in ` crore, except as otherwise stated
Particulars
Face value ` As at March 31, 2018 As at March 31, 2017 Units Amount Units Amount
Life Insurance Corporation of India 5,00,000 6,000 293 – – TOTAL INVESTMENTS IN COMMERCIAL PAPER 6,000 293 – –

Standalone financial statements | 165 Infosys Annual Report 2017-18
Cash and cash equivalents as at March 31, 2018 and March 31, 2017 include restricted cash and bank balances of ` 375 crore and ` 411 crore, respectively. The restrictions are primarily on account of bank balances held as margin money deposits against guarantees and balances held in unpaid dividend bank accounts.
The deposits maintained by the Company with banks and financial institutions comprise time deposits, which can be withdrawn by the Company at any point without prior notice or penalty on the principal.
The details of balances with banks as on Balance Sheet dates are as follows :
in ` crore
Particulars As at March 31,2018 2017
In current accountsANZ Bank, Taiwan 9 3 Bank of America, USA 814 769 Bank of Baroda, Mauritius 1 – BNP Paribas Bank, Norway 88 7 Citibank N.A., Australia 184 8 Citibank N.A., Dubai 5 1 Citibank N.A., EEFC (US Dollar account) 4 1 Citibank N.A., Hungary 6 3 Citibank N.A., India 3 2 Citibank N.A., Japan 18 12 Citibank N.A., New Zealand 8 6 Citibank N.A., South Africa 33 9 Citibank N.A., South Korea 2 1 Deutsche Bank, Belgium 27 10 Deutsche Bank, EEFC (Australian Dollar account) 2 38 Deutsche Bank, EEFC (Euro account) 14 11 Deutsche Bank, EEFC (Swiss Franc account) 2 2 Deutsche Bank, EEFC (US Dollar account) 27 73 Deutsche Bank, EEFC (United Kingdom Pound Sterling account) 8 8 Deutsche Bank, France 19 8 Deutsche Bank, Germany 70 48 Deutsche Bank, India 40 9 Deutsche Bank, Malaysia 5 7 Deutsche Bank, Netherlands 8 2 Deutsche Bank, Philippines 14 4 Deutsche Bank, Russia 3 3 Deutsche Bank, Russia (US Dollar account) 5 1 Deutsche Bank, Singapore 17 6 Deutsche Bank, Spain 1 – Deutsche Bank, Switzerland 18 5 Deutsche Bank, Switzerland (US Dollar account) – 1 Deutsche Bank, United Kingdom 74 25 HSBC Bank, Hong Kong 2 1 ICICI Bank, EEFC (US Dollar account) 5 3
Particulars As at March 31,2018 2017
ICICI Bank, India 33 40 Nordbanken, Sweden 26 22 Punjab National Bank, India 12 6 Royal Bank of Canada, Canada 9 5 Splitska Banka D.D., Société Générale Group, Croatia 8 – State Bank of India – 6
1,624 1,166 In deposit accountsAxis Bank – 945 Barclays Bank 200 825 HDFC Bank 2,423 349 HSBC Bank – 500 ICICI Bank 3,467 4,351 IDBI Bank – 1,750 IDFC Bank 1,500 – IndusInd Bank 1,000 191 Kotak Mahindra Bank – 500 South Indian Bank 200 200 Standard Chartered Bank – 500 Syndicate Bank – 49 Yes Bank – 485
8,790 10,645 In unpaid dividend accountsAxis Bank, unpaid dividend account 1 2 HDFC Bank, unpaid dividend account 1 2 ICICI Bank, unpaid dividend account 20 13
22 17 In margin money deposits against guaranteesCanara Bank 151 177 ICICI Bank 202 217
353 394 Deposits with financial institutionHDFC Limited 4,781 6,231 LIC Housing Finance Limited 1,200 700
5,981 6,931 TOTAL CASH AND CASH EQUIVALENTS 16,770 19,153
2.8 Other assets in ` crore
Particulars As at March 31,2018 2017
NON-CURRENTCapital advances 420 562Advances other than capital advance
Prepaid gratuity (Refer to Note 2.20) 23 56
OthersPrepaid expenses 49 95Deferred contract cost 262 283Withholding taxes and others 1,407 –
TOTAL NON-CURRENT OTHER ASSETS 2,161 996

166 | Standalone financial statements Infosys Annual Report 2017-18
Particulars As at March 31,2018 2017
CURRENTAdvances other than capital advance
Payment to vendors for supply of goods 103 87
OthersPrepaid expenses(1) 449 387 Deferred contract cost 44 74 Withholding taxes and others 843 1,665
TOTAL CURRENT OTHER ASSETS 1,439 2,213 TOTAL OTHER ASSETS 3,600 3,209 (1) Includes dues from subsidiaries (Refer to Note 2.23) 115 56
Deferred contract costs are upfront costs incurred for the contract and are amortized over the term of the contract. Withholding taxes and others primarily consist of input tax credits.
2.9 Financial instruments
Accounting policy
2.9.1 Initial recognitionThe Company recognizes financial assets and financial liabilities when it becomes a party to the contractual provisions of the instrument. All financial assets and liabilities are recognized at fair value on initial recognition, except for trade receivables which are initially measured at transaction price. Transaction costs that are directly attributable to the acquisition or issue of financial assets and financial liabilities, which are not at fair value through profit or loss, are added to the fair value on initial recognition. Regular way purchase and sale of financial assets are accounted for at trade date.
2.9.2 Subsequent measurement
a. Non-derivative financial instruments
(i) Financial assets carried at amortized cost
A financial asset is subsequently measured at amortized cost if it is held within a business model whose objective is to hold the asset in order to collect contractual cash flows and the contractual terms of the financial asset give rise on specified dates to cash flows that are solely payments of principal and interest on the principal amount outstanding.
(ii) Financial assets at fair value through other comprehensive income
A financial asset is subsequently measured at fair value through other comprehensive income if it is held within a business model whose objective is achieved by both collecting contractual cash flows and selling financial assets and the contractual terms of the financial asset give rise on specified dates to cash flows that are solely payments of principal and interest on the principal amount outstanding. The Company has made an irrevocable election for its investments which are classified as equity instruments to present the subsequent changes in fair value in other comprehensive income based on its business model.
(iii) Financial assets at fair value through profit or loss
A financial asset, which is not classified in any of the above categories, is subsequently fair valued through profit or loss.
(iv) Financial liabilities
Financial liabilities are subsequently carried at amortized cost using the effective interest method, except for contingent consideration recognized in a business combination, which is subsequently measured at fair value through profit or loss. For trade and other payables maturing within one year from the Balance Sheet date, the carrying amounts approximate fair value due to the short maturity of these instruments.
(v) Investment in subsidiaries
Investment in subsidiaries is carried at cost in the separate financial statements.
b. Derivative financial instruments
The Company holds derivative financial instruments such as foreign exchange forward and options contracts to mitigate the risk of changes in exchange rates on foreign currency exposures. The counterparty for these contracts is generally a bank.
(i) Financial assets or financial liabilities, at fair value through profit or loss.
This category includes derivative financial assets or liabilities which are not designated as hedges.
Although the Company believes that these derivatives constitute hedges from an economic perspective, they may not qualify for hedge accounting under Ind AS 109, Financial Instruments. Any derivative that is either not designated as hedge, or is so designated but is ineffective as per Ind AS 109, is categorized as a financial asset or financial liability, at fair value through profit or loss.
Derivatives not designated as hedges are recognized initially at fair value and attributable transaction costs are recognized in net profit in the Statement of Profit and Loss when incurred. Subsequent to initial recognition, these derivatives are measured at fair value through profit or loss and the resulting exchange gains or losses are included in other income. Assets/ liabilities in this category are presented as current assets/current liabilities if they are either held for trading or are expected to be realized within 12 months after the Balance Sheet date.
(ii) Cash flow hedge
The Company designates certain foreign exchange forward and options contracts as cash flow hedges to mitigate the risk of foreign exchange exposure on highly probable forecast cash transactions.
When a derivative is designated as a cash flow hedging instrument, the effective portion of changes in the fair value of the derivative is recognized in other comprehensive income and accumulated in the cash flow hedging reserve. Any ineffective portion of changes in the fair value of the derivative is recognized immediately in the net profit in the Statement of Profit and Loss. If the hedging instrument no longer meets the criteria for hedge accounting, then hedge accounting is discontinued prospectively. If the hedging instrument expires or is sold, terminated or exercised, the cumulative gain or loss

Standalone financial statements | 167 Infosys Annual Report 2017-18
on the hedging instrument recognized in cash flow hedging reserve till the period the hedge was effective, remains in cash flow hedging reserve until the forecasted transaction occurs. The cumulative gain or loss previously recognized in the cash flow hedging reserve is transferred to the net profit in the Statement of Profit and Loss upon the occurrence of the related forecasted transaction.
If the forecasted transaction is no longer expected to occur, then the amount accumulated in cash flow hedging reserve is reclassified to net profit in the Statement of Profit and Loss.
c. Share capital
Ordinary shares
Ordinary shares are classified as equity. Incremental costs directly attributable to the issuance of new ordinary shares and share options and buy back of ordinary shares are recognized as a deduction from equity, net of any tax effects.
2.9.3 Derecognition of financial instrumentsThe Company derecognizes a financial asset when the contractual rights to the cash flows from the financial asset expire or it transfers the financial asset and the transfer qualifies for derecognition under Ind AS 109. A financial liability (or a part of a financial liability) is derecognized from the Company’s Balance Sheet when the obligation specified in the contract is discharged or cancelled or expires.
2.9.4 Fair value of financial instrumentsIn determining the fair value of its financial instruments, the Company uses a variety of methods and assumptions that are based on market conditions and risks existing at each reporting date. The methods used to determine fair value include discounted cash flow analysis, available quoted market prices and dealer quotes. All methods of assessing fair value result in general approximation of value, and such value may never actually be realized.
Refer to ‘Financial instruments by category’ for the disclosure on carrying value and fair value of financial assets and liabilities. For financial assets and liabilities maturing within one year from the Balance Sheet date and which are not carried at fair value, the carrying amounts approximate fair value due to the short maturity of these instruments.
2.9.5 Impairment The Company recognizes loss allowances using the expected credit loss (ECL) model for the financial assets which are not fair valued through profit or loss. Loss allowance for trade receivables with no significant financing component is measured at an amount equal to lifetime ECL. For all other financial assets, expected credit losses are measured at an amount equal to the 12-month ECL, unless there has been a significant increase in credit risk from initial recognition in which case those are measured at lifetime ECL. The amount of expected credit losses (or reversal) that is required to adjust the loss allowance at the reporting date to the amount that is required to be recognized, is recognized as an impairment gain or loss in the statement of profit or loss.
Financial instruments by category The carrying value and fair value of financial instruments by categories as at March 31, 2018 are as follows :
in ` crore
Particulars
Amortized cost
Financial assets / liabilities at fair value through profit or loss
Financial assets / liabilities at fair value through OCI
Total carrying
value
Total fair
valueDesignated
upon initial recognition
Mandatory Equity instruments
designated upon initial recognition
Mandatory
ASSETS Cash and cash equivalents (Refer to Note 2.7) 16,770 – – – – 16,770 16,770 Investments (Refer to Note 2.3)
Preference securities, equity instruments and others – – 7 117 – 124 124 Tax-free bonds and government bonds 1,832 – – – – 1,832 (2) 2,079Redeemable, non-convertible debentures(1) 1,780 – – – – 1,780 1,780 Fixed maturity plan securities – – 376 – – 376 376 Certificates of deposit – – – – 4,901 4,901 4,901 Non-convertible debentures – – – – 3,580 3,580 3,580 Commercial paper – – – – 293 293 293
Trade receivables (Refer to Note 2.6) 12,151 – – – – 12,151 12,151 Loans (Refer to Note 2.4) 412 – – – – 412 412

168 | Standalone financial statements Infosys Annual Report 2017-18
Particulars
Amortized cost
Financial assets / liabilities at fair value through profit or loss
Financial assets / liabilities at fair value through OCI
Total carrying
value
Total fair
valueDesignated
upon initial recognition
Mandatory Equity instruments
designated upon initial recognition
Mandatory
Other financial assets (Refer to Note 2.5) 6,067 – 4 – 12 6,083 (3) 6,001TOTAL 39,012 – 387 117 8,786 48,302 48,467 LIABILITIES Trade payables (Refer to Note 2.12) 738 – – – – 738 738 Other financial liabilities (Refer to Note 2.11) 4,241 – 91 – 3 4,335 4,335 TOTAL 4,979 – 91 – 3 5,073 5,073
(1) The carrying value of debentures approximates fair value as the instruments are at prevailing market rates.(2) On account of fair value changes including interest accrued(3) Excludes interest accrued on tax-free bonds
The carrying value and fair value of financial instruments by categories as at March 31, 2017 were as follows : in ` crore
Particulars
Amortized cost
Financial assets / liabilities at fair value through profit or loss
Financial assets / liabilities at fair value
through OCI
Total carrying
value
Total fair value
Designated upon initial recognition
Mandatory Equity instruments designated
upon initial recognition
Mandatory
ASSETSCash and cash equivalents (Refer to Note 2.7) 19,153 – – – – 19,153 19,153 Investments (Refer to Note 2.3)
Preference securities, equity instruments and others – – 3 132 – 135 135 Tax-free bonds and government bonds 1,833 – – – – 1,833 (2) 2,142Liquid mutual fund units – – 1,755 – – 1,755 1,755 Redeemable, non-convertible debentures(1) 2,129 – – – – 2,129 2,129 Fixed maturity plans – – 508 – – 508 508 Certificates of deposit – – – – 7,635 7,635 7,635 Non-convertible debentures – – – – 3,677 3,677 3,677
Trade receivables (Refer to Note 2.6) 10,960 – – – – 10,960 10,960 Loans (Refer to Note 2.4) 315 – – – – 315 315 Other financial assets (Refer to Note 2.5) 5,351 – 216 – 52 5,619 (3) 5,537TOTAL 39,741 – 2,482 132 11,364 53,719 53,946 LIABILITIES Trade payables (Refer to Note 2.12) 269 – – – – 269 269 Other financial liabilities (Refer to Note 2.11) 3,867 – 87 – – 3,954 3,954 TOTAL 4,136 – 87 – – 4,223 4,223
(1) The carrying value of debentures approximates fair value as the instruments are at prevailing market rates.(2) On account of fair value changes including interest accrued(3) Excludes interest accrued on tax-free bonds

Standalone financial statements | 169 Infosys Annual Report 2017-18
Fair value hierarchy
Level 1 – Quoted prices (unadjusted) in active markets for identical assets or liabilities.
Level 2 – Inputs other than quoted prices included within Level 1 that are observable for the asset or liability, either directly (i.e. as prices) or indirectly (i.e. derived from prices).
Level 3 – Inputs for the assets or liabilities that are not based on observable market data (unobservable inputs).
The fair value hierarchy of assets and liabilities as at March 31, 2018 is as follows : in ` crore
Particulars As at March 31,
2018
Fair value measurement at end of the reporting
period / year using Level 1 Level 2 Level 3
ASSETS Investments in tax-free bonds (Refer to Note 2.3) 2,078 1,806 272 – Investments in government bonds (Refer to Note 2.3) 1 1 – – Investments in equity instruments (Refer to Note 2.3) 1 – – 1 Investments in preference securities (Refer to Note 2.3) 116 – – 116 Investments in fixed maturity plan securities (Refer to Note 2.3) 376 – 376 – Investments in certificates of deposit (Refer to Note 2.3) 4,901 – 4,901 – Investments in non-convertible debentures (Refer to Note 2.3) 3,580 2,493 1,087 – Investments in commercial paper (Refer to Note 2.3) 293 – 293 – Other investments (Refer to Note 2.3) 7 – – 7 Derivative financial instruments - gain on outstanding foreign currency forward and options contracts (Refer to Note 2.5) 16 – 16 – LIABILITIESDerivative financial instruments - loss on outstanding foreign currency forward and options contracts (Refer to Note 2.11) 40 – 40 – Liability towards contingent consideration (Refer to Note 2.11)(1)(2) 54 – – 54
(1) Pertains to contingent consideration payable to selling shareholders of Kallidus and Brilliant Basics Holdings Limited as per the share purchase agreement(2) Discounted ` 21 crore at 10% pertaining to Brilliant Basics
During the year ended March 31, 2018, tax-free bonds and non-convertible debentures of ` 1,797 crore were transferred from Level 2 to Level 1 of fair value hierarchy, since these were valued based on quoted price, and ` 743 crore were transferred from Level 1 to Level 2 of fair value hierarchy, since these were valued based on market observable inputs.
The fair value hierarchy of assets and liabilities as at March 31, 2017 was as follows : in ` crore
Particulars As at March 31,
2017
Fair value measurement at end of the reporting
period / year using Level 1 Level 2 Level 3
ASSETS Investments in liquid mutual fund units (Refer to Note 2.3) 1,755 1,755 – – Investments in tax-free bonds (Refer to Note 2.3) 2,142 206 1,936 – Investments in equity instruments (Refer to Note 2.3) 1 – – 1 Investments in preference securities (Refer to Note 2.3) 131 – – 131 Investments in fixed maturity plan securities (Refer to Note 2.3) 508 – 508 – Investments in certificates of deposit (Refer to Note 2.3) 7,635 – 7,635 – Investments in non-convertible debentures (Refer to Note 2.3) 3,677 3,160 517 – Other investments (Refer to Note 2.3) 3 – – 3 Derivative financial instruments - gain on outstanding foreign currency forward and options contracts (Refer to Note 2.5) 268 – 268 – LIABILITIESDerivative financial instruments - loss on outstanding foreign currency forward and options contracts (Refer to Note 2.11) 2 – 2 – Liability towards contingent consideration (Refer to Note 2.11)(1)(2) 85 – – 85
(1) Pertains to contingent consideration payable to selling shareholders of Kallidus as per the share purchase agreement.(2) Discounted ` 91 crore at 14.2%
During the year ended March 31, 2017, tax-free bonds of ` 115 crore were transferred from Level 1 to Level 2 of fair value hierarchy, since these were valued based on market observable inputs.

170 | Standalone financial statements Infosys Annual Report 2017-18
Company’s exposure to credit risk is influenced mainly by the individual characteristic of each customer and the concentration of risk from the top few customers.
Market risk : The Company operates internationally and a major portion of the business is transacted in several currencies and consequently, the Company is exposed to foreign exchange risk through its sales and services in the United States and elsewhere, and purchases from overseas suppliers in various foreign currencies. The Company holds derivative financial instruments such as foreign exchange forward and options contracts to mitigate the risk of changes in exchange rates on foreign currency exposures. The exchange rate between the Indian rupee and foreign currencies has changed substantially in recent years and may fluctuate substantially in the future. Consequently, the results of the Company’s operations are adversely affected as the rupee appreciates/ depreciates against these currencies.
The foreign currency risks from financial instruments as at March 31, 2018 are as follows :in ` crore
Particulars USD Euro GBP AUD Other currencies
Total
Cash and cash equivalents 858 139 82 186 271 1,536 Trade receivables 7,776 1,522 871 743 550 11,462 Other financials assets (including loans) 2,196 597 335 159 305 3,592 Trade payables (312) (60) (168) (36) (22) (598)Other financial liabilities (1,962) (252) (148) (220) (162) (2,744)Net assets / (liabilities) 8,556 1,946 972 832 942 13,248
The foreign currency risks from financial instruments as at March 31, 2017 were as follows :in ` crore
Particulars USD Euro GBP AUD Other currencies
Total
Cash and cash equivalents 849 79 33 45 97 1,103 Trade receivables 7,611 1,005 793 533 361 10,303 Other financials assets (including loans) 2,686 436 365 148 136 3,771 Trade payables (145) (5) (11) (12) (22) (195)Other financial liabilities (1,847) (227) (169) (186) (137) (2,566)Net assets / (liabilities) 9,154 1,288 1,011 528 435 12,416
Sensitivity analysis between Indian rupee and USD
Particulars Year ended March 31,2018 2017
Impact on the Company’s incremental operating margins 0.52% 0.52%
Sensitivity analysis is computed based on the changes in the income and expenses in foreign currency upon conversion into functional currency, due to exchange rate fluctuations between the previous reporting period and the current reporting period.
Derivative financial instruments
The Company holds derivative financial instruments such as foreign currency forward and options contracts to mitigate the risk of changes in exchange rates on foreign currency
A one percentage point change in the unobservable inputs used in fair valuation of Level 3 assets and liabilities does not have a significant impact in its value.
The movement in contingent consideration as at March 31, 2018 from March 31, 2017 is mainly on account of settlement of ` 45 crore pertaining to Kallidus acquisition and addition of ` 17 crore in relation to acquisition of Brilliant Basics Holdings Limited (Refer to Note 2.2).
Financial risk management Financial risk factors : The Company’s activities expose it to a variety of financial risks : market risk, credit risk and liquidity risk. The Company’s primary focus is to foresee the unpredictability of financial markets and seek to minimize potential adverse effects on its financial performance. The primary market risk to the Company is foreign exchange risk. The Company uses derivative financial instruments to mitigate foreign exchange related risk exposures. The
exposures. The counterparty for these contracts is generally a bank. These derivative financial instruments are valued based on quoted prices for similar assets and liabilities in active markets or inputs that are directly or indirectly observable in the marketplace.

Standalone financial statements | 171 Infosys Annual Report 2017-18
The details in respect of outstanding foreign currency forward and options contracts are as follows :
Particulars As at March 31, 2018 As at March 31, 2017In million In ` crore In million In ` crore
DERIVATIVES DESIGNATED AS CASH FLOW HEDGESForward contracts
In AUD – – 130 644 In Euro – – 95 658 In GBP – – 40 324
Options ContractsIn AUD 60 300 – – In Euro 100 808 40 277 In GBP 20 184 – –
OTHER DERIVATIVESForward contracts
In AUD – – 30 149 In CAD 20 99 – – In Euro 86 695 106 735 In JPY 550 34 – – In NZD 16 76 – – In NOK 40 34 – – In ZAR 25 14 – – In SGD 5 25 5 23 In SEK 50 40 50 36 In CHF 21 146 10 65 In USD 556 3,624 480 3,113 In GBP 45 415 70 566
Options contractsIn AUD 20 100 – – In CAD – – 13 65 In Euro 45 363 25 173 In CHF 5 33 – – In USD 320 2,086 195 1,265 In GBP 25 231 30 243
TOTAL FORWARD AND OPTIONS CONTRACTS 9,307 8,336
The foreign exchange forward and options contracts mature within 12 months. The table below analyzes the derivative financial instruments into relevant maturity groupings based on the remaining period as at the Balance Sheet date :
in ` crore
Particulars As at March 31,2018 2017
Not later than one month 2,693 2,215 Later than one month and not later than three months 4,274 4,103 Later than three months and not later than one year 2,340 2,018 TOTAL 9,307 8,336
During the years ended March 31, 2018 and March 31, 2017, the Company has designated certain foreign exchange forward and options contracts as cash flow hedges to mitigate the risk of foreign exchange exposure on highly probable forecast cash transactions. The related hedge transactions for balance in cash flow hedging reserve as at March 31, 2018 are expected to occur and reclassified to the Statement of Profit or Loss within three months.
Hedge effectiveness is determined at the inception of the hedge relationship, and through periodic prospective effectiveness
assessments to ensure that an economic relationship exists between the hedged item and hedging instrument, including whether the hedging instrument is expected to offset changes in cash flows of hedged items.
If the hedge ratio for risk management purposes is no longer optimal but the risk management objective remains unchanged and the hedge continues to qualify for hedge accounting, the hedge relationship will be rebalanced by adjusting either the volume of the hedging instrument or the volume of the hedged item so that the hedge ratio aligns with the ratio used for risk management purposes. Any hedge ineffectiveness is calculated and accounted for in the Statement of Profit or Loss at the time of the hedge relationship rebalancing.
The reconciliation of effective portion of cash flow hedges is as follows :
in ` crore
Particulars Year ended March 31,2018 2017
Gain / (Loss)Balance at the beginning of the year 39 – Gain / (Loss) recognized in other comprehensive income during the year (93) 121

172 | Standalone financial statements Infosys Annual Report 2017-18
Particulars Year ended March 31,2018 2017
Amount reclassified to profit and loss during the year 41 (69)Tax impact on above 13 (13)Balance at the end of the year – 39
The Company offsets a financial asset and a financial liability when it currently has a legally enforceable right to set off the recognized amounts and the Company intends either to settle on a net basis, or to realize the asset and settle the liability simultaneously.
The quantitative information about offsetting of derivative financial assets and derivative financial liabilities is as follows :in ` crore
Particulars As at March 31, 2018 As at March 31, 2017Derivative
financial asset
Derivative financial liability
Derivative financial
asset
Derivative financial liability
Gross amount of recognized financial asset / liability 20 (44) 269 (3)Amount set off (4) 4 (1) 1 Net amount presented in Balance Sheet 16 (40) 268 (2)
Credit risk
Credit risk refers to the risk of default on its obligation by the counterparty resulting in a financial loss. The maximum exposure to the credit risk at the reporting date is primarily from trade receivables amounting to ` 12,151 crore and ` 10,960 crore as at March 31, 2018 and March 31, 2017, respectively and unbilled revenues amounting to ` 3,573 crore and ` 3,200 crore as at March 31, 2018 and March 31, 2017, respectively. Trade receivables and unbilled revenues are typically unsecured and are derived from revenue earned from customers primarily located in the United States. Credit risk has always been managed by the Company through credit approvals, establishing credit limits and continuously monitoring the creditworthiness of customers to which the Company grants credit terms in the normal course of business. The Company uses expected credit loss model to assess the impairment loss or gain. The Company uses a provision matrix to compute the expected credit loss allowance for trade receivables and unbilled revenues. The provision matrix takes into account available external and internal credit risk factors such as credit default swap quotes, credit ratings from international credit rating agencies and the Company’s historical experience for customers.
The details in respect of percentage of revenues generated from top customer and top 10 customers are as follows :
in %
Particulars Year ended March 31,2018 2017
Revenue from top customer 3.9 3.9Revenue from top 10 customers 21.0 23.1
Credit risk exposure
The allowance for lifetime expected credit loss on customer balances for the years ended March 31, 2018 and March 31, 2017 was ` 18 crore and ` 135 crore respectively.
The movement in credit loss allowance on customer balances is as follows :
in ` crore
Particulars Year ended March 31,2018 2017
Balance at the beginning 379 249 Impairment loss recognized 18 135 Amounts written off (3) (1)Translation differences 7 (4)Balance at the end 401 379
Credit risk on cash and cash equivalents is limited as we generally invest in deposits with banks and financial institutions with high credit ratings assigned by international and domestic credit rating agencies. Investments primarily include investment in liquid mutual fund units, fixed maturity plan securities, quoted bonds issued by government and quasi-government organizations, non-convertible debentures issued by government-aided institutions, certificates of deposit and commercial paper.
Liquidity risk
The Company’s principal sources of liquidity are cash and cash equivalents and the cash flow that is generated from operations. The Company has no outstanding borrowings. The Company believes that the working capital is sufficient to meet its current requirements.
As at March 31, 2018, the Company had a working capital of ` 30,903 crore including cash and cash equivalents of ` 16,770 crore and current investments of ` 5,906 crore. As at March 31, 2017, the Company had a working capital of ` 35,896 crore including cash and cash equivalents of ` 19,153 crore and current investments of ` 9,643 crore.
As at March 31, 2018 and March 31, 2017, the outstanding compensated absences were ` 1,260 crore and ` 1,142 crore, respectively, which have been substantially funded. Accordingly, no liquidity risk is perceived.

Standalone financial statements | 173 Infosys Annual Report 2017-18
The details regarding the contractual maturities of significant financial liabilities as at March 31, 2018 are as follows : in ` crore
Particulars Less than 1 year 1-2 years 2-4 years 4-7 years Total Trade payables 738 – – – 738 Other financial liabilities (excluding liability towards acquisition) (Refer to Note 2.11) 4,241 – – – 4,241 Liability towards acquisitions on an undiscounted basis (contingent consideration) 41 7 7 – 55
The details regarding the contractual maturities of significant financial liabilities as at March 31, 2017 were as follows : in ` crore
Particulars Less than 1 year 1-2 years 2-4 years 4-7 years Total Trade payables 269 – – – 269 Other financial liabilities (excluding liability towards acquisition) (Refer to Note 2.11) 3,867 – – – 3,867 Liability towards acquisitions on an undiscounted basis (contingent consideration) 45 46 – – 91
2.10 Equity
Equity share capitalin ` crore, except as otherwise stated
Particulars As at March 31, 2018 2017
AuthorizedEquity shares, ` 5 par value 240,00,00,000 (240,00,00,000) equity shares 1,200 1,200
Issued, subscribed and paid-upEquity shares, ` 5 par value(1) 218,41,14,257 (229,69,44,664) equity shares fully paid-up 1,092 1,148
1,092 1,148
(1) Refer to Note 2.21 for details of basic and diluted shares.Note : Forfeited shares amounted to ` 1,500 (` 1,500)
The Company has only one class of shares referred to as equity shares having a par value of ̀ 5. Each holder of equity shares is entitled to one vote per share. The equity shares represented by ADSs carry similar rights to voting and dividends as the other equity shares. Each ADS represents one underlying equity share
In the period of five years immediately preceding March 31, 2018 :
• The Company has allotted 114,84,72,332 and 57,42,36,166 fully paid-up shares of face value ` 5 each during the quarter ended June 30, 2015 and December 31, 2014, pursuant to bonus issue approved by the shareholders through postal ballot. For both the bonus issues, bonus share of one equity share for every equity share held, and a stock dividend of one ADS for every ADS held, respectively, has been allotted. Consequently, the ratio of equity shares underlying the ADSs held by an American Depositary Receipt (ADR) holder remains unchanged. Options granted under the restricted stock unit plan (RSU) have been adjusted for bonus shares.
In the event of liquidation of the Company, the holders of equity shares will be entitled to receive any of the remaining assets of the Company in proportion to the number of equity shares held by the shareholders, after distribution of all preferential amounts. However, no such preferential amounts exist currently.
Dividends
Final dividends on shares are recorded as a liability on the date of approval by the shareholders and interim dividends are recorded as a liability on the date of declaration by the Company’s Board of Directors.
The Company declares and pays dividends in Indian rupees. The remittance of dividends outside India is governed by Indian law on foreign exchange and is subject to applicable distribution taxes. Dividend distribution tax paid by subsidiaries may be reduced / available as a credit against dividend distribution tax payable by Infosys Limited.
The amount of per share dividend recognized as distribution to equity shareholders is as follows :
in `
Particulars Year ended March 31,2018 2017
Final dividend for fiscal 2016 – 14.25Interim dividend for fiscal 2017 – 11.00Final dividend for fiscal 2017 14.75 – Interim dividend for fiscal 2018 13.00 –
Effective from fiscal 2018, the Company’s policy is to payout up to 70% of the free cash flow of the corresponding financial year in such manner (including by way of dividend and / or share buyback) as may be decided by the Board from time to time, subject to applicable laws and requisite approvals, if any. Free cash flow is defined as net cash provided by operating

174 | Standalone financial statements Infosys Annual Report 2017-18
The details of shareholders holding more than 5% shares as at March 31, 2018 and March 31, 2017 are set out below :in ` crore, except as stated otherwise
Name of the shareholder As at March 31, 2018 As at March 31, 2017No. of shares % held No. of shares % held
Deutsche Bank Trust Company Americas (Depository of ADRs – legal ownership) 37,99,05,859 17.39 38,33,17,937 16.69Life Insurance Corporation of India 14,95,14,017 6.85 16,14,36,123 7.03
The reconciliation of the number of shares outstanding and the amount of share capital as at March 31, 2018 and March 31, 2017 is as follows :
in ` crore, except as stated otherwise
Particulars As at March 31, 2018 As at March 31, 2017No. of shares Amount No. of shares Amount
Number of shares at the beginning of the period 229,69,44,664 1,148 229,69,44,664 1,148 Add : Shares issued on exercise of employee stock options 2,13,071 – – – Less : Shares bought back 11,30,43,478 56 – – Number of shares at the end of the period 218,41,14,257 1,092 229,69,44,664 1,148
activities less capital expenditure as per the consolidated Statement of Cash Flows prepared under International Financial Reporting Standards. Dividend payout includes dividend distribution tax.
The Board of Directors recommended a final dividend of ` 20.50 per equity share for the financial year ended March 31, 2018 and a special dividend of ` 10 per equity share. The payment is subject to the approval of the shareholders in the ensuing Annual General Meeting of the Company, to be held on June 23, 2018 and if approved would result in a cash outflow of approximately ` 7,982 crore, including dividend distribution tax.
The Board of Directors, at its meeting on October 24, 2017, declared an interim dividend of ` 13 per equity share, which resulted in a cash outflow of ` 3,422 crore, inclusive of dividend distribution tax.
During the year ended March 31, 2018, the Company received ` 846 crore as dividend from Infosys BPM, its majority owned subsidiary. Dividend distribution tax paid by the subsidiary on such dividend has been reduced as credit against dividend distribution tax payable by Infosys.
Buyback
The Board, at its meeting on August 19, 2017, approved a proposal for the Company to buy back its fully paid-up equity shares of face value of ` 5 each from the eligible equity shareholders of the Company for an amount not exceeding ` 13,000 crore. The shareholders approved the
said proposal of buyback of equity shares through the postal ballot that concluded on October 7, 2017. The buyback offer comprised a purchase of 11,30,43,478 equity shares aggregating 4.92% of the paid-up equity share capital of the Company at a price of ` 1,150 per equity share. The buyback was offered to all eligible equity shareholders (including those who became equity shareholders as on the Record date by cancelling ADSs and withdrawing underlying Equity shares) of the Company as on the record date (i.e November 1, 2017) on a proportionate basis through the ‘Tender offer’ route. The Company concluded the buyback procedures on December 27, 2017 and 11,30,43,478 equity shares were extinguished. The Company has utilized its securities premium and general reserve for the buyback of its shares. In accordance with Section 69 of the Companies Act, 2013, the Company has created a Capital Redemption Reserve of ` 56 crore equal to the nominal value of the shares bought back as an appropriation from the general reserve.
The Company’s objective when managing capital is to safeguard its ability to continue as a going concern and to maintain an optimal capital structure so as to maximize shareholder value. In order to maintain or achieve an optimal capital structure, the Company may adjust the amount of dividend payment, return capital to shareholders, issue new shares or buy back issued shares. As of March 31, 2018, the Company has only one class of equity shares and has no debt. Consequent to the above capital structure, there are no externally imposed capital requirements.
Employee Stock Option Plan (ESOP)
Accounting PolicyThe Company recognizes compensation expense relating to share-based payments in net profit using fair-value in accordance with Ind AS 102, Share‑based Payments. The estimated fair value of awards is charged to income on a straight-line basis over the requisite service period for each separately vesting portion of the award as if the award was in substance, multiple awards with a corresponding increase to share options outstanding account.
Amendment to Ind AS 102
Effective April 1, 2017, the Company adopted the amendment to Ind AS 102 which provides specific guidance to measurement of cash-settled awards, modification of cash-settled awards and awards that include a net settlement feature in respect of withholding taxes. The adoption of amendment did not have any material effect on the financial statements.
2015 Stock Incentive Compensation Plan (the 2015 Plan) (formerly 2011 RSU Plan) : On March 31, 2016, pursuant to the approval by the shareholders through a postal ballot, the Board has been authorized to introduce, offer, issue and

Standalone financial statements | 175 Infosys Annual Report 2017-18
allot share-based incentives to eligible employees of the Company and its subsidiaries under the 2015 Stock Incentive Compensation Plan (the 2015 Plan). The maximum number of shares under the 2015 Plan shall not exceed 2,40,38,883 equity shares (this includes 1,12,23,576 equity shares which are held by the trust towards the 2011 Plan as at March 31, 2016). Out of this, 1,70,38,883 equity shares will be issued as RSUs at par value and 70,00,000 equity shares will be issued as stock options at market price on the date of the grant. These instruments will generally vest over a period of four years and the Company expects to grant the instruments under the 2015 Plan over the period of 4 to 7 years.
Controlled trust holds 1,08,01,956 and 1,12,89,514 shares as at March 31, 2018 and March 31, 2017, respectively under the 2015 Plan, out of which 1,00,000 equity shares have been earmarked for welfare activities of the employees.
Stock incentives granted to Salil Parekh (CEO & MD) : Pursuant to the approval of the shareholders through a postal ballot on February 20, 2018, Salil Parekh (CEO & MD) is eligible to receive under the 2015 Plan,
a. an annual grant of RSUs of fair value ` 3.25 crore which will vest over time in three equal annual installments upon completion of each year of service from the respective grant date
b. a one-time grant of RSUs of fair value ̀ 9.75 crore which will vest over time in two equal annual installments upon completion of each year of service from the grant date and
c. an annual grant of performance-based RSUs of fair value ` 13 crore which will vest after completion of three years the first of which concludes on March 31, 2021, subject to achievement of performance targets set by the Board or its committee.
The Board, based on the recommendations of the nomination and remuneration committee, approved on February 27, 2018, the annual time-based grant for fiscal 2018 of 28,256 RSUs and the one-time time-based grant of 84,768 RSUs. The grants were made effective February 27, 2018. Though the annual time-based grants for the remaining employment term have not been granted as of March 31, 2018 , in accordance with Ind AS 102, Share‑based Payments, the Company has recorded employment stock compensation expense.
Stock incentives granted to Dr. Vishal Sikka : Consequent to Dr. Vishal Sikka’s resignation from the Company on August 24, 2017, the unvested stock incentives (time-based and performance-based awards) granted to him were forfeited.
Stock incentives granted to COO : The Nomination and Remuneration Committee (‘the Committee’), at its meeting held on October 14, 2016 recommended a grant of 27,250 RSUs and 43,000 ESOPs amounting to ` 4 crore to U.B. Pravin Rao, under the 2015 Plan and the same was approved by the shareholders through a postal ballot on March 31, 2017. These RSUs and ESOPs have been granted effective May 2, 2017. These RSUs and stock options would vest over a period of four years and shall be exercisable within the period as approved by the Committee. The exercise price of the RSUs will be equal to the par value of the shares and the exercise price of the stock options would be the market price as on the date of grant, as approved by the shareholders.
Stock incentives granted to KMP (other than CEO, Dr. Vishal Sikka, and COO) : On November 1, 2016, 2,47,250 RSUs and 5,02,550 stock options were granted under the 2015 Plan, to key managerial personnel (KMP), excluding Dr. Vishal Sikka and the COO, based on fiscal 2016 performance. On August 1, 2017, 58,150 RSUs and 44,450 ESOPs were granted to KMP. These RSUs and stock options will generally vest over a period of four years and shall be exercisable within the period as approved by the Committee. The exercise price of the RSUs will be equal to the par value of the shares and the exercise price of the stock options would be the market price as on the date of grant. On February 27, 2018, based on the recommendation and approval of the nomination and remuneration committee, the Company granted 2,14,950 RSUs to KMP other than CEO and COO. These instruments will vest over a period of four years and are subject to continued service.
During the year ended March 31, 2018, three of the KMP have resigned (Refer to Note 2.23, Related party transactions for further details) and hence the RSUs and stock options granted to them were forfeited.
Stock incentive granted to employees other than KMP : During fiscal 2017, the Company granted 25,06,740 RSUs and 7,03,300 ESOPs and 1,12,210 incentive units (cash-settled) to certain eligible employees at mid and senior levels under the 2015 Plan. Further, on May 2, 2017, the Company granted 37,090 RSUs (includes equity shares and equity shares represented by ADSs) at par value, 73,600 ESOPs (including equity shares and equity shares represented by ADSs) to be exercised at market price at the time of grant, to certain employees at the senior management level. On August 1, 2017, 7,450 incentive units (cash-settled) were granted to employees at the senior management level. These instruments will vest over a period of four years and are subject to continued service. On February 27, 2018 15,59,920 RSUs and 42,590 incentive units (cash-settled) were granted to eligible employees. These instruments will vest over a period of four years and are subject to continued service.
As at March 31, 2018 and March 31, 2017, 1,11,757 and 1,06,845 incentive units were outstanding (net of forfeitures).
The break-up of employee stock compensation expenses is as follows :
in ` crore
Particulars Year ended March 31,2018 2017
Granted to KMP(2) (13) 36 Employees other than KMP 85 71
TOTAL(1) 72 107
(1) Cash-settled stock compensation expense included ̀ 1 crore each in the years ended March 31, 2018 and March 31, 2017.
(2) Includes a reversal of stock compensation cost of ` 35 crore towards forfeiture of stock incentives granted to Dr. Vishal Sikka upon his resignation.
The carrying value of liability towards cash-settled, share-based payments was ` 6 crore and ` 3 crore as at March 31, 2018 and March 31, 2017, respectively.

176 | Standalone financial statements Infosys Annual Report 2017-18
The activity in the 2015 Plan (formerly 2011 RSU Plan) for equity-settled, share-based payment transactions during the years ended March 31, 2018 and March 31, 2017 is as follows :
Particulars Year ended March 31, 2018 Year ended March 31, 2017Shares
arising out of options
Weighted average exercise
price (`)
Shares arising out of options
Weighted average exercise
price (`)2015 Plan : Restricted Stock Units (RSUs)Outstanding at the beginning 29,61,373 5 2,21,505 5 Granted 22,80,608 5 28,74,690 5 Exercised 6,48,217 5 1,00,760 5 Forfeited and expired 8,43,355 5 34,062 5 Outstanding at the end 37,50,409 5 29,61,373 5 Exercisable at the end 24,205 5 – – 2015 Plan : Employee Stock Options (ESOPs)Outstanding at the beginning 11,97,650 992 – – Granted 4,91,575 943 12,05,850 992 Exercised 52,412 983 – – Forfeited and expired 6,69,900 961 8,200 992 Outstanding at the end 9,66,913 986 11,97,650 992 Exercisable at the end 1,96,912 992 – –
During the years ended March 31, 2018 and March 31, 2017, the weighted average share price of options exercised under the 2015 Plan on the date of exercise was ` 992 and ` 1,084, respectively.
The details of equity-settled RSUs and ESOPs outstanding as at March 31, 2018 are as follows :
Range of exercise prices per share (`) Options outstandingNo. of shares arising
out of optionsWeighted average
remaining contractual life
Weighted average exercise price (`)
2015 Plan0-5 (RSU) 37,50,409 1.89 5.00 900-1100 (ESOP) 9,66,913 6.60 992.68
47,17,322 2.57 207.45
The details of equity-settled RSUs and ESOPs outstanding as at March 31, 2017 were as follows :
Range of exercise prices per share (`)
Options outstandingNo. of shares
arising out of options
Weighted average
remaining contractual
life
Weighted average
exercise price (`)
2015 Plan0-5 (RSU) 29,61,373 1.88 5.00 900-1100 (ESOP) 11,97,650 7.09 1,026.50
41,59,023 3.38 299.16
The fair value of each equity-settled award is estimated on the date of grant using the Black-Scholes-Merton model with the following assumptions :
Particulars
For options granted during the year ended March 31, 2018
Equity shares ADSsRSU ESOP RSU ESOP
Weighted average share price (`) / ($-ADS) 1,144 923 16.61 14.65Exercise price (`) / ($-ADS) 5.00 919 0.08 14.67Expected volatility (%) 20-25 25-28 21-26 25-31Expected life of the option (years) 1-4 3-7 1-4 3-7Expected dividends (%) 2.78 2.78 2.74 2.74Risk-free interest rate (%) 6-7 6-7 1-2 1-2Weighted average fair value as on grant date (`) / ($-ADS) 1,066 254 15.47 2.93

Standalone financial statements | 177 Infosys Annual Report 2017-18
Particulars For options granted during the year ended March 31, 2017
Equity shares ADSsRSU ESOP RSU ESOP
Weighted average share price (`) / ($-ADS) 1,067 989 15.77 15.26Exercise price (`) / ($-ADS) 5 998 0.07 15.26Expected volatility (%) 24-29 27-29 26-29 27-31Expected life of the option (years) 1-4 3-7 1-4 3-7Expected dividends (%) 2.37 2.37 2.29 2.29Risk-free interest rate (%) 6-7 6-7 1-2 1-2Weighted average fair value as on grant date (`) / ($-ADS) 1,002 285 14.84 3.46
The expected life of the RSU / ESOP is estimated based on the vesting term and contractual term of the RSU / ESOP, as well as expected exercise behavior of the employee who receives the RSU / ESOP. Expected volatility during the expected term of the RSU / ESOP is based on historical volatility of the observed market prices of the Company’s publicly traded equity shares during a period equivalent to the expected term of the RSU / ESOP.
2.11 Other financial liabilitiesin ` crore
Particulars As at March 31,2018 2017
NON-CURRENTOthers
Compensated absences 42 – Payable for acquisition of business – Contingent consideration 13 40
TOTAL NON-CURRENT OTHER FINANCIAL LIABILITIES 55 40 CURRENTUnpaid dividends 22 17 Others
Accrued compensation to employees 2,048 1,404 Accrued expenses(1) 1,776 2,013 Retention monies 63 153 Payable for acquisition of business – Contingent consideration 41 45 Capital creditors 148 36 Compensated absences 1,218 1,142 Other payables(2) 184 244 Foreign currency forward and options contracts 40 2
TOTAL CURRENT OTHER FINANCIAL LIABILITIES 5,540 5,056 TOTAL FINANCIAL LIABILITIES 5,595 5,096
Particulars As at March 31,2018 2017
Financial liability carried at amortized cost 4,241 3,867 Financial liability carried at fair value through profit or loss 91 87 Financial liability carried at fair value through other comprehensive income 3 – Liability towards acquisition of business on undiscounted basis 55 91 (1) Includes dues to subsidiaries
(Refer to Note 2.23) 9 3 (2) Includes dues to subsidiaries
(Refer to Note 2.23) 19 14
2.12 Trade payablesin ` crore
Particulars
As at March 31,2018 2017
Trade payables(1) 738 269 TOTAL TRADE PAYABLES 738 269 (1) Includes dues to subsidiaries
(Refer to Note 2.23) 178 135
As at March 31, 2018 and March 31, 2017, there are no outstanding dues to micro and small enterprises. There are no interests due or outstanding on the same.
2.13 Other liabilitiesin ` crore
Particulars
As at March 31,2018 2017
NON-CURRENTDeferred income 36 42 Deferred rent 117 – TOTAL NON-CURRENT OTHER LIABILITIES 153 42 CURRENTUnearned revenues 1,887 1,320 Client deposits 32 – Others
Withholding taxes and others 1,029 1,027 Deferred rent 24 2
TOTAL CURRENT OTHER LIABILITIES 2,972 2,349 TOTAL OTHER LIABILITIES 3,125 2,391
2.14 Provisions
Accounting policyA provision is recognized if, as a result of a past event, the Company has a present legal or constructive obligation that is reasonably estimable, and it is probable that an outflow of economic benefits will be required to settle the obligation. Provisions are determined by discounting the expected future cash flows at a pre-tax rate that reflects current market assessments of the time value of money and the risks specific to the liability.
a. Post-sales client support : The Company provides its clients with a fixed-period post-sales support for corrections of errors and support on all its fixed-price and fixed-timeframe

178 | Standalone financial statements Infosys Annual Report 2017-18
contracts. Costs associated with such support services are accrued at the time related revenues are recorded in the Statement of Profit and Loss. The Company estimates such costs based on historical experience and estimates are reviewed on a periodic basis for any material changes in assumptions and likelihood of occurrence.
b. Onerous contracts : Provisions for onerous contracts are recognized when the expected benefits to be derived by the Company from a contract are lower than the unavoidable costs of meeting the future obligations under the contract. The provision is measured at the present value of the lower of the expected cost of terminating the contract and the expected net cost of continuing with the contract. Before a provision is established, the Company recognizes any impairment loss on the assets associated with that contract.
Provision for post-sales client support and othersin ` crore
Particulars
As at March 31,2018 2017
CURRENTOthers
Post-sales client support and others 436 350
TOTAL PROVISIONS 436 350
The movement in the provision for post-sales client support and others is as follows :
in ` crore
Particulars Year ended March 31, 2018
Balance at the beginning 350 Provision recognized 130 Provision utilized (46)Exchange difference 2 Balance at the end 436
Provision for post-sales client support and other provisions are expected to be utilized over a period of six months to one year.
2.15 Income taxes
Accounting policyIncome tax expense comprises current and deferred income tax. Income tax expense is recognized in net profit in the Statement of Profit and Loss except to the extent that it relates to items recognized directly in equity, in which case it is recognized in other comprehensive income. Current income tax for current and prior periods is recognized at the amount expected to be paid to or recovered from the tax authorities, using the tax rates and tax laws that have been enacted or substantively enacted by the Balance Sheet date. Deferred income tax assets and liabilities are recognized for all temporary differences arising between the tax bases of assets and liabilities and their carrying amounts in the financial statements. Deferred tax assets are reviewed at each reporting date and are reduced to the extent that it is no longer probable that the related tax benefit will be realized.
Deferred income tax assets and liabilities are measured using tax rates and tax laws that have been enacted or substantively
enacted by the Balance Sheet date and are expected to apply to taxable income in the years in which those temporary differences are expected to be recovered or settled. The effect of changes in tax rates on deferred income tax assets and liabilities is recognized as income or expense in the period that includes the enactment or the substantive enactment date. A deferred income tax asset is recognized to the extent that it is probable that future taxable profit will be available against which the deductible temporary differences and tax losses can be utilized. Deferred income taxes are not provided on the undistributed earnings of subsidiaries and branches where it is expected that the earnings of the subsidiary or branch will not be distributed in the foreseeable future. The Company offsets current tax assets and current tax liabilities, where it has a legally enforceable right to set off the recognized amounts and where it intends either to settle on a net basis, or to realize the asset and settle the liability simultaneously. Tax benefits of deductions earned on exercise of employee share options in excess of compensation charged to income are credited to securities premium.
Income tax expense in the Statement of Profit and Loss comprises :
in ` crore
Particulars Year ended March 31,2018 2017
Current taxes 4,003 5,068 Deferred taxes (250) 52 Income tax expense 3,753 5,120
Advance Pricing Agreement (APA) : During the three months ended December 31, 2017, the Company had concluded an APA with the US Internal Revenue Service (IRS) for the US branch covering the years ending March 2011 to March 2021. Under the APA, the Company and the IRS have agreed on the methodology to allocate revenues and compute the taxable income of the Company’s US branch operations.
During the three months ended December 31, 2017, in accordance with the APA, the Company has reversed income tax expense provision of ` 1,432 crore which pertains to previous periods. This comprises reversal of current tax expense of ` 1,610 crore, reversal of ` 132 crore on account of deferred tax assets pertaining to the temporary differences which are no longer required and a deferred tax liability of ` 46 crore pertaining to Branch profit tax for the three months ended December 31, 2017 on account of conclusion of APA. In line with the APA, the Company has to pay an amount of approximately ` 1,488 crore due to the difference between the taxes payable for prior periods as per the APA and the actual taxes paid for such periods. The Company has paid ` 479 crore during the three months ended March 31, 2018, and the balance amount is expected to be paid over the next few quarters.
Additionally, the income tax expense for the years ended March 31, 2018 and March 31, 2017 includes reversal (net of provisions) of ` 240 crore and ` 218 crore, respectively, pertaining to prior periods on account of adjudication of certain disputed matters in favor of the Company across various jurisdictions.

Standalone financial statements | 179 Infosys Annual Report 2017-18
The ‘Tax Cuts and Jobs Act (H.R. 1)’ was signed into law on December 22, 2017 (‘US Tax Reforms’). The US tax reforms has reduced federal tax rates from 35% to 21% effective January 1, 2018, among other measures. During the year ended March 31, 2018, the US tax reforms has resulted in a positive impact of ̀ 155 crore on account of credits pertaining to deferred tax liabilities on branch profit. The impact of US tax reforms is expected to be not significant for future periods.
During the years ended March 31, 2018 and March 31, 2017, a current tax charge of ` 16 crore and current tax credit of ` 8 crore, respectively, have been recorded in other comprehensive income pertaining to remeasurement of defined benefit plan asset.
During the year ended March 31, 2018, a deferred tax credit of ` 13 crore and a deferred tax credit of less than ` 1 crore have been recorded in other comprehensive income pertaining to unrealized gains on derivatives designated as cash flow hedges and unrealized gain on investment in non-convertible debentures, certificates of deposit, commercial paper and equity and preference securities. During the year ended March 31, 2017, a deferred tax charge of ` 13 crore has been recorded in other comprehensive income pertaining to unrealized gains on derivatives designated as cash flow hedges
A reconciliation of the income tax provision to the amount computed by applying the statutory income tax rate to the income before income taxes is summarized as follows :
in ` crore except otherwise stated
Particulars As at March 31,2018 2017
Profit before income taxes 19,908 18,938 Enacted tax rates in India 34.61% 34.61%Computed expected tax expense 6,890 6,554 Tax effect due to non-taxable income for Indian tax purposes (2,008) (1,915)Overseas taxes 678 735 Tax reversals, overseas and domestic (1,566) (218)Effect of exempt non-operating income (385) (51)Effect of non-deductible expenses 299 16 Branch profit tax (209) – Others 54 (1)Income tax expense 3,753 5,120
Infosys is subject to a 15% Branch Profit Tax (BPT) in the US to the extent its US branch’s net profit during the year is greater than the increase in the net assets of the US branch during the year, computed in accordance with the Internal Revenue Code. As at March 31, 2018, Infosys’ US branch net assets amounted to approximately ` 5,030 crore. During the year ended March 31, 2018, an additional deferred tax liability has been created for BPT amounting to ` 46 crore on account of conclusion of APA explained above. Further, on account of US tax Reforms, the Company has a credit of ̀ 155 crore pertaining to BPT for the year ended March 31, 2018. The Company has also reversed ` 55 crore of BPT during
the year ended March 31, 2018. As of March 31, 2018, the Company has a deferred tax liability for BPT of ` 164 crore (net of credits), as the Company estimates that these branch profits are expected to be distributed in the foreseeable future.
Other income for the year ended March 31, 2018 includes interest on income tax refund of ` 257 crore.
The foreign tax expense is due to income taxes payable overseas, principally in the United States. In India, the Company has benefited from certain income tax incentives that the Government of India had provided for export of software from the units registered under the Special Economic Zones Act (SEZs), 2005. SEZ units which began the provision of services on or after April 1, 2005 are eligible for a deduction of 100% of profits or gains derived from the export of services for the first five years from the financial year in which the unit commenced the provision of services and 50% of such profits or gains for further five years. Up to 50% of such profits or gains is also available for a further five years subject to creation of a Special Economic Zone Re-investment Reserve out of the profit for the eligible SEZ units and utilization of such reserve by the Company for acquiring new plant and machinery for the purpose of its business as per the provisions of the Income tax Act, 1961.
Deferred income tax liabilities have not been recognized on temporary differences amounting to ` 5,045 crore and ̀ 5,309 crore as at March 31, 2018 and March 31, 2017, respectively, associated with investments in subsidiaries and branches as it is probable that the temporary differences will not reverse in the foreseeable future.
The details of income tax assets and income tax liabilities as at March 31, 2018 and March 31, 2017 are as follows :
in ` crore
Particulars As at March 31,2018 2017
Income tax assets 5,710 5,454 Current income tax liabilities (1,976) (3,762) Net current income tax asset/ (liability) at the end 3,734 1,692
The gross movement in the current income tax asset / (liability) for the years ended March 31, 2018 and March 31, 2017 is as follows :
in ` crore
Particulars As at March 31,2018 2017
Net current income tax asset / (liability) at the beginning 1,692 1,716 Income tax paid 6,054 5,033 Current income tax expense (4,003) (5,068)Income tax benefit arising on exercise of stock options – 1 Income tax on other comprehensive income (16) 8 Translation differences 7 2 Net current income tax asset/ (liability) at the end 3,734 1,692

180 | Standalone financial statements Infosys Annual Report 2017-18
The tax effects of significant temporary differences that resulted in deferred income tax assets and liabilities are as follows :
in ` crore
Particulars As at March 31, 2018 2017
Deferred income tax assetsProperty, plant and equipment 181 107 Computer software – 40 Accrued compensation to employees – 35 Trade receivables 129 123 Compensated absences 325 336 Post-sales client support 92 93 Derivative financial instruments 13 – Branch profit tax 341 – Others 55 32
Total deferred income tax assets 1,136 766 Deferred income tax liabilities
Branch profit tax (505) (327) Derivative financial instruments (1) (75) Others (7) (18)
Total deferred income tax liabilities (513) (420) Deferred income tax assets after set-off 1,128 346 Deferred income tax liabilities after set-off (505) –
Deferred tax assets and deferred tax liabilities have been offset wherever the Company has a legally enforceable right to set off current tax assets against current tax liabilities and where the deferred tax assets and deferred tax liabilities relate to income taxes levied by the same taxation authority.
In assessing the reliability of deferred income tax assets, the Management considers whether some portion or all of the deferred income tax assets will not be realized. The ultimate realization of deferred income tax assets is dependent upon the generation of future taxable income during the periods in which the temporary differences become deductible. The Management considers the scheduled reversals of deferred income tax liabilities, projected future taxable income, and tax planning strategies in making this assessment. Based on the level of historical taxable income and projections for future taxable income over the periods in which the deferred income tax assets are deductible, the Management believes that the Company will realize the benefits of those deductible differences. The amount of the deferred income tax assets considered realizable, however, could be reduced in the near term if estimates of future taxable income during the carry forward period are reduced.
The gross movement in the deferred income tax account for the years ended March 31, 2018 and March 31, 2017, is as follows :
in ` crore
Particulars As at March 31,2018 2017
Net deferred income tax asset at the beginning 346 405Additions on account of business transfer (Refer to Note 2.3.1) 13 – Translation differences 1 6 Credits / (charge) relating to temporary differences 250 (52)Temporary differences on other comprehensive income 13 (13)Net deferred income tax asset at the end 623 346
The entire deferred income tax, except for a credit of ` 155 crore (on account of US tax reforms explained above), for the year ended March 31, 2018, relates to origination and reversal of temporary differences
The credit relating to temporary differences during the year ended March 31, 2018 is primarily on account of property, plant and equipment and trade receivables partially offset by decrease in compensated absences and accrued compensation to employees. The charge relating to temporary differences during the year ended March 31, 2017 is primarily on account of property, plant and equipment, accrued compensation and compensated absences partially offset by trade receivables.
2.16 Revenue from operations
Accounting policyThe Company derives revenues primarily from software development and related services and from the licensing of software products. Arrangements with customers for software-related services are mainly either on a fixed-price, fixed-timeframe or on a time-and-material basis.
Revenue on time-and-material contracts are recognized as the related services are performed and revenue from the end of the last billing to the Balance Sheet date is recognized as unbilled revenues. Revenue from fixed-price, fixed-timeframe contracts, where there is no uncertainty as to measurement or collectability of consideration, is recognized as per the percentage-of-completion method. When there is uncertainty as to measurement or ultimate collectability, revenue recognition is postponed until such uncertainty is resolved. Efforts or costs expended have been used to measure progress towards completion as there is a direct relationship between input and productivity. Provisions for estimated losses, if any, on uncompleted contracts are recorded in the period in which such losses become probable based on the current contract estimates. Costs and earnings in excess of billings are classified as unbilled revenues while billings in excess of costs and earnings are classified as unearned revenues. Deferred contract costs are amortized over the term of the contract. Maintenance revenue is recognized rateably over the term of the underlying maintenance arrangement.

Standalone financial statements | 181 Infosys Annual Report 2017-18
In arrangements for software development and related services and maintenance services, the Company has applied the guidance in Ind AS 18, Revenue, by applying the revenue recognition criteria for each separately identifiable component of a single transaction. The arrangements generally meet the criteria for considering software development and related services as separately identifiable components. For allocating the consideration, the Company has measured the revenue in respect of each separable component of a transaction at its fair value, in accordance with principles given in Ind AS 18. The price that is regularly charged for an item when sold separately is the best evidence of its fair value. In cases where the Company is unable to establish objective and reliable evidence of fair value for the software development and related services, the Company has used a residual method to allocate the arrangement consideration. In these cases, the balance of the consideration, after allocating the fair values of undelivered components of a transaction, has been allocated to the delivered components for which specific fair values do not exist.
License fee revenues are recognized when the general revenue recognition criteria given in Ind AS 18 are met. Arrangements to deliver software products generally have three elements : license, implementation and Annual Technical Services (ATS). The Company has applied the principles given in Ind AS 18 to account for revenues from these multiple element arrangements. Objective and reliable evidence of fair value has been established for ATS. Objective and reliable evidence of fair value is the price charged when the element is sold separately. When other services are provided in conjunction with the licensing arrangement and objective and reliable evidence of their fair values have been established, the revenue from such contracts are allocated to each component of the contract in a manner, whereby revenue is deferred for the undelivered services and the residual amounts are recognized as revenue for delivered elements. In the absence of objective and reliable evidence of fair value for implementation, the entire arrangement fee for license and implementation is recognized using the percentage-of-completion method as the implementation is performed. Revenue from client training, support and other services arising due to the sale of software products is recognized as the services are performed. ATS revenue is recognized rateably over the period in which the services are rendered.
Advances received for services and products are reported as client deposits until all conditions for revenue recognition are met.
The Company accounts for volume discounts and pricing incentives to customers as a reduction of revenue based on the rateable allocation of the discounts / incentives amount to each of the underlying revenue transaction that results in progress by the customer towards earning the discount / incentive. Also, when the level of discount varies with increases in levels of revenue transactions, the Company recognizes the liability based on its estimate of the customer’s future purchases. If it is probable that the criteria for the discount will not be met, or if the amount thereof cannot be estimated reliably, then discount is not recognized until the payment is probable and the amount can be estimated
reliably. The Company recognizes changes in the estimated amount of obligations for discounts in the period in which the change occurs. The discounts are passed on to the customer either as direct payments or as a reduction of payments due from the customer.
The Company presents revenues net of indirect taxes in its Statement of Profit and Loss.
Revenue from operations for the years ended March 31, 2018 and March 31, 2017 is as follows :
in ` crore
Particulars Year ended March 31,2018 2017
Revenue from software services 61,910 59,257 Revenue from software products 31 32 TOTAL REVENUE FROM OPERATIONS 61,941 59,289
2.17 Other income, net
Accounting policy
2.17.1 Other incomeOther income is comprised primarily of interest income, dividend income, gain / loss on investments and exchange gain / loss on forward and options contracts and on translation of other assets and liabilities. Interest income is recognized using the effective interest method. Dividend income is recognized when the right to receive payment is established.
2.17.2 Foreign currency Functional currency
The functional currency of the Company is the Indian rupee. These financial statements are presented in Indian rupees (rounded off to crore; one crore equals ten million).
Transactions and translations
Foreign-currency denominated monetary assets and liabilities are translated into the relevant functional currency at exchange rates in effect at the Balance Sheet date. The gains or losses resulting from such translations are included in net profit in the Statement of Profit and Loss. Non-monetary assets and non-monetary liabilities denominated in a foreign currency and measured at fair value are translated at the exchange rate prevalent at the date when the fair value was determined. Non-monetary assets and non-monetary liabilities denominated in a foreign currency and measured at historical cost are translated at the exchange rate prevalent at the date of the transaction.
Transaction gains or losses realized upon settlement of foreign currency transactions are included in determining net profit for the period in which the transaction is settled. Revenue, expense and cash flow items denominated in foreign currencies are translated into the relevant functional currencies using the exchange rate in effect on the date of the transaction.

182 | Standalone financial statements Infosys Annual Report 2017-18
Other income for the years ended March 31, 2018 and March 31, 2017 is as follows :
in ` crore
Particulars Year ended March 31,2018 2017
Interest income on financial assets carried at amortized cost
Tax-free bonds and government bonds 138 320 Deposits with banks and others 1,540 2,028
Interest income on financial assets fair valued through other comprehensive income
Non-convertible debentures, commercial paper and certificates of deposit 642 182
Income on investments carried at fair value through profit or loss
Dividend income on liquid mutual funds 3 23 Gain / (loss) on liquid mutual funds 227 111
Dividend income from subsidiary 846 – Write-down of investment in subsidiary (Refer to Note 2.3) (122) – Exchange gains / (losses) on foreign currency forward and options contracts (12) 551 Exchange gains / (losses) on translation of assets and liabilities 265 (324)Miscellaneous income, net 492 171 TOTAL OTHER INCOME 4,019 3,062
2.18 Expenses in ` crore
Particulars Year ended March 31,2018 2017
Employee benefit expensesSalaries including bonus 31,618 30,111 Contribution to provident and other funds 695 640 Share-based payments to employees (Refer to Note 2.10) 72 107 Staff welfare 87 86
32,472 30,944 Cost of software packages and others
For own use 774 729 Third-party items bought for service delivery to clients 496 506
1,270 1,235
Particulars Year ended March 31,2018 2017
Other expensesPower and fuel 162 180 Brand and marketing 247 276 Operating lease payments (Refer to Note 2.19) 328 284 Rates and taxes 116 118 Repairs and maintenance 902 1,073 Consumables 22 31 Insurance 47 45 Provision for post-sales client support 127 84 Commission to non-whole time directors 9 9 Impairment loss recognized / (reversed) on financial assets 24 140 Auditor’s remuneration
Statutory audit fees 3 2 Tax matters 1 – Other services – –
Contributions towards Corporate Social Responsibility 142 215 Others 54 89
2,184 2,546
2.19 Leases
Accounting policyLeases under which the Company assumes substantially all the risks and rewards of ownership are classified as finance leases. When acquired, such assets are capitalized at fair value or present value of the minimum lease payments at the inception of the lease, whichever is lower. Lease payments under operating leases are recognized as an expense on a straight line basis in net profit in the Statement of Profit and Loss over the lease term.
The lease rentals charged during the period are as follows :in ` crore
Particulars Year ended March 31,2018 2017
Lease rentals recognized during the period 328 284
The obligations on long-term, non-cancellable operating leases payable as per the rentals stated in the respective agreements are as follows :
in ` crore
Future minimum lease payable
As at March 31,2018 2017
Not later than 1 year 267 275 Later than 1 year and not later than 5 years 877 809 Later than 5 years 755 631

Standalone financial statements | 183 Infosys Annual Report 2017-18
The operating lease arrangements, are renewable on a periodic basis and for most of the leases extend upto a maximum of 10 years from their respective dates of inception and relates to rented premises. Some of these lease agreements have price escalation clauses.
2.20 Employee benefits
Accounting policy
2.20.1 Gratuity The Company provides for gratuity, a defined benefit retirement plan (‘the Gratuity Plan’) covering eligible employees. The Gratuity Plan provides a lump-sum payment to vested employees at retirement, death, incapacitation or termination of employment, of an amount based on the respective employee’s salary and the tenure of employment with the Company.
Liabilities with regard to the Gratuity Plan are determined by actuarial valuation, performed by an independent actuary, at each Balance Sheet date using the projected unit credit method. The Company fully contributes all ascertained liabilities to the Infosys Limited Employees’ Gratuity Fund Trust (the Trust). Trustees administer contributions made to the Trust and contributions are invested in a scheme with the Life Insurance Corporation of India as permitted by Indian law.
The Company recognizes the net obligation of a defined benefit plan in its Balance Sheet as an asset or liability. Gains and losses through re-measurements of the net defined benefit liability / (asset) are recognized in other comprehensive income and are not reclassified to profit or loss in subsequent periods. The actual return of the portfolio of plan assets, in excess of the yields computed by applying the discount rate used to measure the defined benefit obligation is recognized in other comprehensive income. The effect of any plan amendments are recognized in net profit in the Statement of Profit and Loss.
2.20.2 SuperannuationCertain employees of Infosys are participants in a defined contribution plan. The Company has no further obligations to the plan beyond its monthly contributions which are periodically contributed to a trust fund, the corpus of which is invested with the Life Insurance Corporation of India.
2.20.3 Provident fundEligible employees of Infosys receive benefits from a provident fund, which is a defined benefit plan. Both the eligible employee and the Company make monthly contributions to the provident fund plan equal to a specified percentage of the covered employee’s salary. The Company contributes a portion to the Infosys Limited Employees’ Provident Fund Trust. The trust invests in specific designated instruments as permitted by Indian law. The remaining portion is contributed to the government-administered pension fund. The rate at which the annual interest is payable to the beneficiaries by the trust is being administered by the government. The Company has an obligation to make good the shortfall, if any, between the return from the investments of the Trust and the notified interest rate.
2.20.4 Compensated absences The Company has a policy on compensated absences which are both accumulating and non-accumulating in nature. The expected cost of accumulating compensated absences is determined by actuarial valuation performed by an independent actuary at each Balance Sheet date using projected unit credit method on the additional amount expected to be paid/availed as a result of the unused entitlement that has accumulated at the Balance Sheet date. Expense on non-accumulating compensated absences is recognized in the period in which the absences occur.
a. GratuityThe funded status of the gratuity plans and the amounts recognized in the Company’s financial statements as at March 31, 2018 and March 31, 2017 are as follows :
in ` crore
Particulars As at March 31,2018 2017
Change in benefit obligations Benefit obligations at the beginning 979 826 Service cost 131 111 Interest expense 64 61 Curtailment gain – (3)Transfer of obligation 4 (1)Remeasurements – Actuarial (gains) / losses (57) 61 Benefits paid (93) (76)Benefit obligations at the end 1,028 979 Change in plan assets Fair value of plan assets at the beginning 1,035 828 Interest income 69 69 Transfer of assets 4 – Remeasurements – Return on plan assets excluding amounts included in interest income 11 11 Contributions 25 203 Benefits paid (93) (76)Fair value of plan assets at the end 1,051 1,035 Funded status 23 56
The amounts for the years ended March 31, 2018 and March 31, 2017 recognized in the Statement of Profit and Loss under employee benefit expense are as follows :
in ` crore
Particulars As at March 31,2018 2017
Service cost 131 111 Net interest on the net defined benefit liability / asset (5) (8)Curtailment gain – (3)Net gratuity cost 126 100

184 | Standalone financial statements Infosys Annual Report 2017-18
The amounts for the years ended March 31, 2018 and March 31, 2017 recognized in statement of other comprehensive income are as follows :
in ` crore
Particulars As at March 31,2018 2017
Remeasurements of the net defined benefit liability / (asset) Actuarial (gains) / losses (57) 61 (Return) / loss on plan assets excluding amounts included in the net interest on the net defined benefit liability /(asset) (11) (11) (68) 50
in ` crore
Particulars As at March 31,2018 2017
(Gain) / loss from change in demographic assumptions – – (Gain) / loss from change in financial assumptions (36) 49 (Gain) / loss from change in experience assumptions (21) 12 (57) 61
The weighted-average assumptions used to determine benefit obligations as at March 31, 2018 and March 31, 2017 are as follows :
Particulars As at March 31,2018 2017
Discount rate (%) 7.5 6.9Weighted average rate of increase in compensation levels (%) 8.0 8.0
The weighted-average assumptions used to determine net periodic benefit cost for the years ended March 31, 2018 and March 31, 2017 are as follows :
Particulars As at March 31,2018 2017
Discount rate (%) 6.9 7.8Weighted average rate of increase in compensation levels (%) 8.0 8.0Weighted average duration of defined benefit obligation 6.1 years 6.1 years
Assumptions regarding future mortality experience are set in accordance with the published statistics by the Life Insurance Corporation of India.
The Company assesses these assumptions with its projected long-term plans of growth and prevalent industry standards. The discount rate is based on the government securities yield.
Sensitivity of significant assumptions used for valuation of defined benefit obligations :
in ` crore
Impact from percentage point increase / decrease in
As at March 31, 2018
Discount rate 58Weighted average rate of increase in compensation level 50
Sensitivity for significant actuarial assumptions is computed by varying one actuarial assumption used for the valuation of the defined benefit obligation by one percentage, keeping all other actuarial assumptions constant. In practice, this is not probable, and changes in some of the assumptions may be correlated.
Gratuity is applicable only to employees drawing a salary in Indian rupees and there are no other foreign defined benefit gratuity plans.
The Company contributes all ascertained liabilities towards gratuity to the Infosys Limited Employees’ Gratuity Fund Trust. Trustees administer contributions made to the trust. As at March 31, 2018 and March 31, 2017, the plan assets have been primarily invested in insurer managed funds.
Actual return on assets for each of the years ended March 31, 2018 and March 31, 2017 was ` 80 crore.
The Company expects to contribute ̀ 110 crore to the gratuity trusts during the fiscal 2019.
Maturity profile of defined benefit obligation : in ` crore
Within 1 year 144 1-2 year 151 2-3 year 165 3-4 year 176 4-5 year 186 5-10 years 928
b. SuperannuationThe Company contributed ` 158 crore and ` 151 crore to the Superannuation trust during the years ended March 31, 2018 and March 31, 2017 respectively and the same has been recognized in the Statement of Profit and Loss account under the employee benefit expense.
c. Provident fund Infosys has an obligation to fund any shortfall on the yield of the trust’s investments over the administered interest rates on an annual basis. These administered rates are determined annually predominantly considering the social rather than economic factors and in most cases the actual return earned by the Company has been higher in the past years. The actuary has provided a valuation for provident fund liabilities on the basis of guidance issued by Actuarial Society of India and based on the below provided assumptions, there is no shortfall as at March 31, 2018 and March 31, 2017, respectively.

Standalone financial statements | 185 Infosys Annual Report 2017-18
The details of fund and plan asset position are given below :in ` crore
Particulars As at March 31,2018 2017
Plan assets at period end, at fair value 5,160 4,459 Present value of benefit obligation at period end 5,160 4,459 Asset recognized in Balance Sheet – –
The plan assets have been primarily invested in government securities.
Assumptions used in determining the present value obligation of the interest rate guarantee under the Deterministic Approach :
Particulars As at March 31,2018 2017
Government of India (GOI) bond yield 7.50% 6.90%Remaining term to maturity of portfolio 5.9 years 6 yearsExpected guaranteed interest rate 8.55% 8.60%
The Company contributed ` 397 crore and ` 378 crore during the years ended March 31, 2018 and March 31, 2017 respectively and the same has been recognized in the Statement of Profit and Loss under the employee benefit expense.
The provident plans are applicable only to employees drawing a salary in Indian rupees and there are no other significant foreign defined benefit plans.
Employee benefits costs include :in ` crore
Particulars As at March 31,2018 2017
Salaries and bonus(1)(2) 31,791 30,315 Defined contribution plans 158 151 Defined benefit plans 523 478 32,472 30,944
(1) Includes employee stock compensation expense of ` 72 crore and ` 107 crore for the years ended March 31, 2018 and March 31, 2017, respectively (Refer to Note 2.10).
(2) Included in the above for the year ended March 31, 2018 is a reversal of stock compensation cost of ` 35 crore towards forfeiture of stock incentives granted to Dr. Vishal Sikka upon his resignation. (Refer to Note 2.10).
2.21 Reconciliation of basic and diluted shares used in computing earning per share
Accounting policyBasic earnings per equity share is computed by dividing the net profit attributable to the equity holders of the Company by the weighted average number of equity shares outstanding during the period. Diluted earnings per equity share is computed by dividing the net profit attributable to the equity holders of the Company by the weighted average number of equity shares considered for deriving basic earnings per equity share and also the weighted average number of
equity shares that could have been issued upon conversion of all dilutive potential equity shares. The dilutive potential equity shares are adjusted for the proceeds receivable had the equity shares been actually issued at fair value (i.e. the average market value of the outstanding equity shares). Dilutive potential equity shares are deemed converted as at the beginning of the period, unless issued at a later date. Dilutive potential equity shares are determined independently for each period presented.
The number of equity shares and potentially dilutive equity shares are adjusted retrospectively for all periods presented for any share splits and bonus shares issues including for changes effected prior to the approval of the financial statements by the Board of Directors.
A reconciliation of the equity shares used in the computation of basic and diluted earnings per equity share is as follows :
Particulars Year ended March 31,2018 2017
Basic earnings per equity share – weighted average number of equity shares outstanding 226,63,43,802 229,69,44,664Effect of dilutive common equivalent shares – share options outstanding 10,48,819 2,15,006Diluted earnings per equity share – weighted average number of equity shares and common equivalent shares outstanding 226,73,92,621 229,71,59,670
For the years ended March 31, 2018 and March 31, 2017 number of options to purchase equity shares that had an anti-dilutive effect are 27,876 and 77,942 respectively.
2.22 Contingent liabilities and commitmentsin ` crore
Particulars As at March 31,2018 2017
Contingent liabilities Claims against the Company, not acknowledged as debts(1) [Amount paid to statutory authorities ` 6,486 crore (` 4,694 crore)] 4,627 6,596 Commitments Estimated amount of contracts remaining to be executed on capital contracts and not provided for (net of advances and deposits) 1,405 1,094 Other commitments(2) 36 37
(1) As at March 31, 2018, claims against the Company not acknowledged as debts in respect of income tax matters amounted to ` 4,461 crore. These matters are pending before various appellate authorities and the

186 | Standalone financial statements Infosys Annual Report 2017-18
Management including its tax advisors expect that its position will likely be upheld on ultimate resolution and will not have a material adverse effect on the Company’s financial position and results of operations.
Income tax claims amounting to ̀ 4,670 crore had not been considered as claims not acknowledged as debt because the Company has received favorable decisions on similar claims and therefore, based on its assessment, is of the view that any liability resulting from these claims is remote and will not sustain on ultimate resolution.
Amount paid to statutory authorities against the above tax claims amounted to ` 6,475 crore.
(2) Uncalled capital pertaining to investments
The Company is subject to legal proceedings and claims, which have arisen in the ordinary course of business. The Company’s management does not reasonably expect that these legal actions, when ultimately concluded and determined, will have a material and adverse effect on the Company’s results of operations or financial condition.
2.23 Related party transactionsSubsidiaries
in %
Name of subsidiaries Country
Holdings as at March 31,
2018 2017Infosys Technologies (China) Co. Limited (Infosys China) China 100 100Infosys Technologies S. de R. L. de C. V. (Infosys Mexico) Mexico 100 100Infosys Technologies (Sweden) AB. (Infosys Sweden) Sweden 100 100Infosys Technologies (Shanghai) Company Limited (Infosys Shanghai) China 100 100Infosys Tecnologia do Brasil Ltda. (Infosys Brasil) Brazil 100 100Infosys Nova Holdings LLC. (Infosys Nova) US 100 100EdgeVerve Systems Limited (EdgeVerve) India 100 100Lodestone Management Consultants GmbH (Lodestone Austria)(1) Austria 100 100Skava Systems Pvt. Ltd. (Skava Systems) India 100 100Kallidus Inc. (Kallidus) US 100 100Infosys Chile SpA(2) Chile – – Infosys Arabia Limited(3) Saudi Arabia 70 – Infosys Americas Inc., (Infosys Americas) US 100 100Infosys Technologies (Australia) Pty. Limited (Infosys Australia)(4) Australia 100 100Infosys Public Services, Inc. USA (Infosys Public Services) US 100 100Infosys Canada Public Services Ltd.(5)(6) Canada – – Infosys BPM Limited (formerly Infosys BPO Limited) India 99.98 99.98Infosys (Czech Republic) Limited s.r.o.(7) Czech Republic 99.98 99.98Infosys Poland, Sp z.o.o(7) Poland 99.98 99.98Infosys McCamish Systems LLC(7) US 99.98 99.98Portland Group Pty Ltd(7) Australia 99.98 99.98Infosys BPO Americas LLC.(7) US 99.98 99.98Infosys Consulting Holding AG (Infosys Lodestone) Switzerland 100 100Lodestone Management Consultants Inc.(4)(8) US 100 100Infosys Management Consulting Pty Limited(8) Australia 100 100Infosys Consulting AG(8) Switzerland 100 100Infosys Consulting GmbH(8) Germany 100 100Infosys Consulting SAS(8) France 100 100Infosys Consulting s.r.o.(8) Czech Republic 100 100Lodestone Management Consultants Co., Ltd.(8) China 100 100Infy Consulting Company Ltd(8) UK 100 100Infy Consulting B.V.(8) The Netherlands 100 100Infosys Consulting Sp. z.o.o(8) Poland 100 100Lodestone Management Consultants Portugal, Unipessoal, Lda.(8) Portugal 100 100S.C. Infosys Consulting S.R.L.(8) Romania 100 100Infosys Consulting S.R.L.(8) Argentina 100 100Lodestone GmbH(8)(9) Switzerland – – Lodestone Augmentis AG (10)(11) Switzerland – – Infosys Consulting (Belgium) NV (formerly Lodestone Management Consultants (Belgium) S.A.)(12) Belgium 99.90 99.90Infosys Consulting Ltda.(12) Brazil 99.99 99.99Panaya Inc. (Panaya) US 100 100

Standalone financial statements | 187 Infosys Annual Report 2017-18
Name of subsidiaries Country
Holdings as at March 31,
2018 2017Panaya Ltd.(13) Israel 100 100Panaya GmbH(13) Germany 100 100Panaya Japan Co. Ltd(4)(13) Japan 100 100Panaya Pty Ltd.(13)(14) Australia – – Noah Consulting LLC (Noah)(15) US – 100Noah Information Management Consulting Inc. (Noah Canada)(16)(17) Canada – 100Brilliant Basics Holdings Limited(18) UK 100 – Brilliant Basics Limited(19) UK 100 – Brilliant Basics (MENA) DMCC(19) Dubai 100 – Infosys Consulting Pte Limited(1) Singapore 100 100Infosys Middle East FZ LLC(20) Dubai 100 –
(1) Wholly-owned subsidiary of Infosys Limited(2) Incorporated effective November 20, 2017(3) Subsidiary of Infosys Limited(4) Under liquidation(5) Wholly-owned subsidiary of Infosys Public Services, Inc. (6) Liquidated effective May 9, 2017(7) Wholly-owned subsidiary of Infosys BPM(8) Wholly-owned subsidiaries of Infosys Consulting Holding AG (formerly Lodestone Holding AG)(9) Liquidated effective December 21, 2016(10) Wholly-owned subsidiary of Infosys Consulting AG (formerly Lodestone Management Consultants AG)(11) Liquidated effective October 5, 2016(12) Majority owned and controlled subsidiaries of Infosys Consulting Holding AG (formerly Lodestone Holding AG)(13) Wholly-owned subsidiary of Panaya Inc.(14) Liquidated effective November 16, 2016(15) Liquidated effective November 9, 2017 (Refer to Note 2.3.1)(16) Wholly-owned subsidiary of Noah(17) Liquidated effective December 20, 2017(18) On September 8, 2017, Infosys acquired 100% of the voting interests in Brilliant Basics Holdings Limited, UK. (19) Wholly-owned subsidiary of Brilliant Basics Holdings Limited.(20) Wholly-owned subsidiary of Infosys Consulting Pte Ltd
Infosys has provided guarantee for performance of certain contracts entered into by its subsidiaries.
Associate
Name of associate Country Holdings as at March 31,
2018 2017DWA Nova LLC(1) US – 16%
(1) During the three months ended June 30, 2017, the Company has written down the entire carrying value of the investment in its associate DWA Nova LLC. DWA Nova LLC has been liquidated effective November 17, 2017.
List of other related parties
Particulars Country Nature of relationship
Infosys Limited Employees’ Gratuity Fund Trust India
Post-employment benefit plan of
InfosysInfosys Limited Employees’ Provident Fund Trust India
Post-employment benefit plan of
Infosys
Particulars Country Nature of relationship
Infosys Limited Employees’ Superannuation Fund Trust India
Post-employment benefit plan of
InfosysInfosys Employees’ Welfare Trust India Controlled trustInfosys Employee Benefits Trust India Controlled trustInfosys Science Foundation India Controlled trust
Refer to Note 2.20 for information on transactions with post-employment benefit plans mentioned above.
List of key managerial personnel
Whole-time directors
• Salil Parekh appointed as the Chief Executive Officer and Managing Director (CEO & MD) effective January 2, 2018. The appointment is for a term of 5 years with effect from January 2, 2018 to January 1, 2023 and the remuneration is approved by the shareholders through a postal ballot dated February 20, 2018.

188 | Standalone financial statements Infosys Annual Report 2017-18
• U.B. Pravin Rao, Chief Operating Officer appointed as interim-CEO & MD effective August 18, 2017. Subsequently, he stepped down as the interim-CEO & MD effective January 2, 2018 and will continue as Chief Operating Officer and a whole-time director of the Company.
• Dr. Vishal Sikka resigned as Chief Executive Officer and Managing Director effective August 18, 2017 and as Executive Vice Chairman effective August 24, 2017
Non-whole-time directors
• Nandan M. Nilekani (appointed as Chairman of the Board effective August 24, 2017)
• Ravi Venkatesan (resigned from his position as Co‑Chairman effective August 24, 2017)
• Kiran Mazumdar-Shaw
• Roopa Kudva
• Dr. Punita Kumar-Sinha
• D.N. Prahlad (appointed effective October 14, 2016)
• D. Sundaram (appointed effective July 14, 2017)
• R. Seshasayee (resigned effective August 24, 2017)
• Prof. Jeffrey S. Lehman, (resigned effective August 24, 2017)
• Prof. John W. Etchemendy (resigned effective August 24, 2017)
Executive officers
M.D. RanganathChief Financial Officer
David D. KennedyGeneral Counsel and Chief Compliance Officer (resigned effective December 31, 2016)
Ravi Kumar S.President and Deputy Chief Operating Officer (appointed effective October 13, 2016)
Rajesh K. MurthyPresident (appointed effective October 13, 2016 and resigned effective January 31, 2018)
Sandeep DadlaniPresident (appointed effective October 13, 2016 and resigned effective July 14, 2017)
Mohit JoshiPresident (appointed effective October 13, 2016)
Krishnamurthy ShankarGroup Head ‑ Human Resources and Infosys Leadership Institute (appointed effective October 13, 2016)
Gopi Krishnan RadhakrishnanActing General Counsel (appointed effective January 1, 2017 and resigned effective June 24, 2017)
Inderpreet SawhneyGroup General Counsel and Chief Compliance Officer (appointed effective July 14, 2017)
Company Secretary
A.G.S. Manikantha
The details of amounts due to or due from related parties as at March 31, 2018 and March 31, 2017 are as follows :
in ` crore
Particulars
As at March 31,2018 2017
Investment in debentures EdgeVerve(1) 1,780 2,129
1,780 2,129 Trade receivablesInfosys China 29 41 Infosys Mexico 4 2 Infosys Brasil 1 1
Particulars
As at March 31,2018 2017
Infosys BPM 5 5 Infy Consulting Company Ltd. 77 73 Infosys Public Services 53 61 Infosys Shanghai 7 – Infosys Sweden 1 1 Kallidus 13 6 Infosys McCamish Systems LLC 70 1 Panaya Ltd 75 44
335 235 LoansInfosys China(2) 73 69 Infosys Consulting Holding AG(3) 104 – Brilliant Basics Holdings Limited(4) 8 –
185 69 Prepaid expense and other assetsPanaya Ltd. 114 56 Brilliant Basics Limited 1 –
115 56 Other financial assetsInfosys BPM 10 5 Panaya Ltd. 2 1 Infosys Consulting SAS – 3 Infosys Consulting GmbH 1 1 Infosys China 2 1 Infy Consulting Company Ltd. 9 4 Infosys Consulting AG 1 1 Infosys Public Services 6 – Infy Consulting B.V. – 1 Infosys Consulting Pte Ltd. 1 1 Kallidus 1 – Infosys Consulting Ltda. 1 – Skava Systems Pvt. Ltd. 1 – Lodestone Management Consultants Co., Ltd 1 – EdgeVerve 3 – Infosys Mexico 1 –
40 18 Unbilled revenuesEdgeVerve 32 45 Kallidus – 2
32 47 Trade payablesInfosys China 7 10 Infosys BPM 54 33 Infosys (Czech Republic) Limited s.r.o. 3 3 Infosys Mexico 6 2 Infosys Sweden 5 5 Infosys Shanghai 6 – Infosys Management Consulting Pty Limited 8 8 Infosys Consulting Pte Ltd. 2 4 Infy Consulting Company Ltd. 67 9 Infosys Brasil 2 1 Brilliant Basics Limited 7 – Noah Consulting LLC – 17 Panaya Ltd. 6 1

Standalone financial statements | 189 Infosys Annual Report 2017-18
Particulars
As at March 31,2018 2017
Infosys Public Services 2 3 Kallidus – 35 Noah Canada – 3 Infosys Poland Sp Z.o.o 3 1
178 135 Other financial liabilitiesInfosys BPM 2 2 Infosys Mexico 1 1 Infosys Consulting Holding AG – 10 Infosys Public Services 5 – Infosys China 1 – Infosys Consulting GmbH 1 1 Infosys Middle East FZ-LLC 8 – Infosys Consulting AG 1 –
19 14 Accrued expensesInfosys BPM 9 – Panaya Ltd – 3 9 3
(1) At an interest rate of 7.7% per annum.(2) The above loan carries an interest of 6% per annum and shall be
repayable on demand.(3) The above loan carries an interest of 2.5% per annum and shall be
repayable on demand.(4) The above loan carries an interest rate of 3.5% per annum repayable in
full no later than 12 months or such later date as the parties may agree.
The details of maximum amount outstanding for the years ended March 31, 2018 and March 31, 2017 are as follows :
in ` crore
Particulars Year ended March 31,2018 2017
Loans and advances in the nature of loans given to subsidiaries
Infosys China 92 72 Brilliant Basics 8 – Infosys Sweden – 25 Infosys Consulting Holding AG 105 –
The details of the related parties transactions entered into by the Company for the years ended March 31, 2018 and March 31, 2017 are as follows :
in ` crore
Particulars Year ended March 31,2018 2017
Capital transactions Financing transactionsEquity
Panaya Inc 38 – Infosys China 97 67 Infosys Sweden – 76 Infosys Shanghai 74 180 Infosys Consulting Pte Ltd – 10 Noah Consulting LLC(1) – 71 Brilliant Basics Holdings Limited(2) 29 –
Particulars Year ended March 31,2018 2017
Infosys Arabia Limited 2 – 240 404
Debenture (net of repayment)EdgeVerve (349) (420)
(349) (420)Loans (net of repayment)
Infosys Sweden(3) – (1)Infosys China – 3 Infosys Consulting Holding AG 99 – Brilliant Basics Holdings Limited 7 –
106 2 Revenue transactionsPurchase of services
Infosys China 88 120 Infosys Management Consulting Pty Limited 99 125 Infy Consulting Company Limited 729 697 Infosys Consulting Pte Ltd. 41 36 Portland Group Pty Ltd 9 3 Infosys (Czech Republic) Limited s.r.o. 40 31 Infosys BPM 502 391 Infosys Sweden 56 72 Infosys Shanghai 65 – Infosys Mexico 27 22 Infosys Public Services 22 22 Panaya Ltd. 84 50 Infosys Brasil 13 8 Infosys Poland Sp Z.o.o 14 4 Kallidus 7 75 Noah Consulting, LLC 91 135 McCamish Systems LLC 3 – Brilliant Basics Limited 24 – Noah Canada 2 4 Infosys Middle East FZ-LLC 22 –
1,938 1,795 Purchase of shared services including facilities and personnel
Panaya Ltd. – 2 Infosys BPM 21 19 Infosys Mexico 2 – Infosys Consulting AG 1 – Kallidus 4 – Brilliant Basics 1 –
29 21 Interest income
Infosys China 4 4 Infosys Sweden – 1 Infosys Consulting Holding AG 2 – EdgeVerve 156 197
162 202

190 | Standalone financial statements Infosys Annual Report 2017-18
Particulars Year ended March 31,2018 2017
Dividend incomeInfosys BPM 846 –
846 – Sale of services
Infosys China 27 15 Infosys Mexico 22 31 Infy Consulting Company Limited 40 75 Infosys Brasil 5 12 Infosys BPM 70 58 McCamish Systems LLC 113 1 Infosys Sweden 11 17 Infosys Shanghai 7 – EdgeVerve 407 303 Kallidus 2 6 Infosys Public Services 628 893
1,332 1,411 Sale of shared services including facilities and personnel
EdgeVerve 40 40 Panaya Ltd. 48 32 Infy Consulting Company Limited 3 3 Infy Consulting B.V 1 1 Infosys BPM 67 46 Infosys Public Services 2 1 Infosys Consulting SAS 1 2
162 125
(1) Refer to Note 2.3(2) Excluding contingent consideration of ` 17 crore(3) Loan outstanding (including accrued interest) given to Infosys Sweden
is converted to equity during the year ended March 31, 2017.
Transactions with key managerial personnelThe compensation to key managerial personnel comprising directors and executive officers is as follows :
in ` crore
Particulars Year ended March 31,2018 2017
Salaries and other employee benefits to whole-time directors and executive officers(1)(2)(3)(4) 48 84 Commission and other benefits to non-executive / independent directors 10 10 Total 58 94
(1) On December 2, 2017, the Board appointed Salil Parekh as the Chief Executive Officer and Managing Director of the Company with effect from January 2, 2018. The appointment is for a term of five years with effect from January 2, 2018 to January 1, 2023 and the remuneration is approved by shareholders through a postal ballot dated February 20, 2018.
(2) Total employee stock compensation expense for the year ended March 31, 2018 includes a reversal of ` 13 crore towards KMP. Employee stock compensation expense for the year ended March 31, 2017 includes an expense of ` 36 crore towards key managerial personnel. (Refer to Note 2.10)
(3) Includes a reversal of stock compensation cost of ` 35 crore for the year ended March 31, 2018 towards forfeiture of stock incentives granted to Dr. Vishal Sikka upon his resignation. (Refer to Note 2.10)
(4) Includes ̀ 6 crore payable under severance agreement to David Kennedy, General Counsel and Chief Compliance Officer during the year ended March 31, 2017.
2.24 Corporate social responsibilityAs per Section 135 of the Companies Act, 2013, a company, meeting the applicability threshold, needs to spend at least 2% of its average net profit for the immediately preceding three financial years on corporate social responsibility (CSR) activities. The areas for CSR activities are eradication of hunger and malnutrition, promoting education, art and culture, healthcare, destitute care and rehabilitation, environment sustainability, disaster relief and rural development projects. A CSR committee has been formed by the Company as per the Act. The funds were primarily allocated to a corpus and utilized through the year on these activities which are specified in Schedule VII of the Companies Act, 2013.
a) Gross amount required to be spent by the Company during the year is ` 310 crore.
b) Amount spent during the year on :in ` crore
Particulars In cash Yet to be paid in cash
Total
1. Construction / acquisition of any asset 171 – 171 2. On purposes
other than (1) above 142 – 142
2.25 Segment reportingInd AS 108 establishes standards for the way that public business enterprises report information about operating segments and related disclosures about products and services, geographic areas, and major customers. The Company’s operations predominantly relate to providing end-to-end business solutions to enable clients to enhance business performance. Based on the ‘management approach’ as defined in Ind AS 108, the Chief Operating Decision Maker (CODM) evaluates the Company’s performance and allocates resources based on an analysis of various performance indicators by business segments and geographic segments. Accordingly, the information has been presented both along business segments and geographic segments. The accounting principles used in the preparation of the financial statements are consistently applied to record revenue and expenditure in individual segments, and are as set out in the significant accounting policies.
Business segments of the Company are primarily enterprises in Financial Services (FS), enterprises in Manufacturing (MFG), enterprises in Retail, Consumer packaged goods and Logistics (RCL), enterprises in the Energy & utilities, Communication and Services (ECS), enterprises in Hi-tech (Hi-Tech), enterprises in Life Sciences, Healthcare and Insurance (HILIFE) and all other segments. The FS reportable segments has been aggregated to include the Financial Services operating segment and the Finacle operating segment because of the similarity of the economic characteristics. All other

Standalone financial statements | 191 Infosys Annual Report 2017-18
segments represents the operating segments of businesses in India, Japan and China. Geographic segmentation is based on business sourced from that geographic region and delivered from both on site and off shore locations. North America comprises the United States of America, Canada and Mexico, Europe includes continental Europe (both the east and the west), Ireland and the United Kingdom, and the Rest of the World comprising all other places except those mentioned above and India.
Revenue and identifiable operating expenses in relation to segments are categorized based on items that are individually identifiable to that segment. Revenue for ‘all other segments’ represents revenue generated from customers located in India, Japan and China. Allocated expenses of segments include expenses incurred for rendering services from the Company’s offshore software development centres and on-site expenses, which are categorized in relation to the associated turnover of the segment. Certain expenses such as depreciation, which
form a significant component of total expenses, are not specifically allocable to specific segments as the underlying assets are used interchangeably. The Management believes that it is not practical to provide segment disclosures relating to those costs and expenses, and accordingly these expenses are separately disclosed as ‘unallocated’ and adjusted against the total income of the Company.
Assets and liabilities used in the Company’s business are not identified to any of the reportable segments, as these are used interchangeably between segments. The Management believes that it is currently not practicable to provide segment disclosures relating to total assets and liabilities since a meaningful segregation of the available data is onerous.
Geographical information on revenue and business segment revenue information is collated based on individual customers invoiced or in relation to which the revenue is otherwise recognized.
Business segments For the years ended March 31, 2018 and March 31, 2017 :
in ` crore
Particulars FS MFG ECS RCL HILIFE Hi-tech All other segments
Total
Revenue from operations 15,860 6,485 15,457 10,247 7,825 4,782 1,285 61,941 15,735 6,086 13,999 10,280 7,065 4,901 1,223 59,289
Identifiable operating expenses 8,628 3,523 7,957 5,118 3,946 2,582 659 32,413 8,408 3,136 6,931 5,127 3,607 2,595 788 30,592
Allocated expenses 2,964 1,221 2,909 1,929 1,474 901 242 11,640 3,036 1,180 2,713 1,994 1,369 952 236 11,480
Segment operating income 4,268 1,741 4,591 3,200 2,405 1,299 384 17,888 4,291 1,770 4,355 3,159 2,089 1,354 199 17,217
Unallocable expenses 1,410 1,341
Operating profit 16,478 15,876
Impairment loss on assets held for sale (Refer to Note 2.26) 589
– Other income, net 4,019
3,062 Profit before tax 19,908
18,938 Tax expense 3,753
5,120 Profit for the year 16,155
13,818 Depreciation and amortization expense 1,408
1,331 Non-cash expenses other than depreciation and amortization 713 10

192 | Standalone financial statements Infosys Annual Report 2017-18
Geographic segmentsFor the years ended March 31, 2018 and March 31, 2017
in ` crore
Particulars North America
Europe India Rest of the World
Total
Revenue from operations 38,984 14,426 1,861 6,670 61,941 38,578 13,019 1,798 5,894 59,289
Identifiable operating expenses 20,761 7,702 649 3,301 32,413 20,337 6,664 786 2,805 30,592
Allocated expenses 7,339 2,713 348 1,240 11,640 7,479 2,523 345 1,133 11,480
Segment operating income 10,884 4,011 864 2,129 17,888 10,762 3,832 667 1,956 17,217
Unallocable expenses 1,410 1,341
Operating profit 16,478 15,876
Impairment loss on assets held for sale (Refer to Note 2.26) 589 –
Other income, net 4,019 3,062
Profit before tax 19,908 18,938
Tax expense 3,753 5,120
Profit for the year 16,155 13,818
Depreciation and amortization expense 1,408 1,331
Non-cash expenses other than depreciation and amortization 713 10
Significant clientsNo client individually accounted for more than 10% of the revenues in the years ended March 31, 2018 and March 31, 2017.
2.26 Assets held for sale
Accounting policyNon-current assets and disposal groups are classified under held for sale if their carrying amount is intended to be recovered principally through sale rather than through continuing use. The condition for classification of held for sale is met when the non-current asset or the disposal group is available for immediate sale and the same is highly probable of being completed within one year from the date of classification under held for sale. Non-current assets and
disposal groups held for sale are measured at the lower of carrying amount and fair value less cost to sell.
In the quarter ended March 2018, on conclusion of a strategic review of the portfolio businesses, the Company initiated identification and evaluation of potential buyers for its subsidiaries, Kallidus and Skava (together referred to as ‘Skava’) and Panaya. The Company anticipates completion of the sale by March 2019 and accordingly, investments amounting to ` 1,525 crore in respect of these subsidiaries have been reclassified under ‘assets held for sale’. On reclassification, these investments has been measured at the lower of carrying amount and fair value less cost to sell and consequently, an impairment loss of ` 589 crore in respect of Panaya has been recognized in the standalone profit and loss for the year ended March 31, 2018.

Standalone financial statements | 193 Infosys Annual Report 2017-18
2.27 Function-wise classification of Statement of Profit and Lossin ` crore
Particulars Note no. Year ended March 31,2018 2017
Revenue from operations 2.16 61,941 59,289 Cost of sales 39,138 37,057 GROSS PROFIT 22,803 22,232 OPERATING EXPENSES
Selling and marketing expenses 2,763 2,728 General and administration expenses 3,562 3,628
TOTAL OPERATING EXPENSES 6,325 6,356 OPERATING PROFIT 16,478 15,876 Impairment loss on assets held for sale 2.26 589 – Other income, net 2.17 4,019 3,062 Profit before tax 19,908 18,938 Tax expense
Current tax 2.15 4,003 5,068 Deferred tax 2.15 (250) 52
PROFIT FOR THE YEAR 16,155 13,818 Other comprehensive income Items that will not be reclassified subsequently to profit or loss
Remeasurement of the net defined benefit liability / asset, net 2.20 & 2.15 52 (42)Equity instruments through other comprehensive income, net 2.3 & 2.15 7 (5)
Items that will be reclassified subsequently to profit or lossFair value changes on derivatives designated as cash flow hedge, net 2.9 & 2.15 (39) 39 Fair value changes on investments, net 2.3 & 2.15 1 (10)
Total other comprehensive income, net of tax 21 (18)TOTAL COMPREHENSIVE INCOME FOR THE YEAR 16,176 13,800
for and on behalf of the Board of Directors of Infosys Limited
Nandan M. NilekaniChairman
Salil ParekhChief Executive Officer and Managing Director
U.B. Pravin RaoChief Operating Officer and Whole‑time Director
BengaluruApril 13, 2018
D. SundaramDirector
M.D. RanganathChief Financial Officer
A.G.S. Manikantha Company Secretary

194 | Consolidated financial statements Infosys Annual Report 2017-18
Consolidated Financial Statements under Indian Accounting Standards (Ind AS) for the year ended March 31, 2018
IndexA. Independent Auditors’ Report .............................................................................................. 195B. Consolidated Balance Sheet ................................................................................................ 198C. Consolidated Statement of Profit and Loss ......................................................................... 199D. Consolidated Statement of Changes in Equity ..................................................................... 201E. Consolidated Statement of Cash Flows ............................................................................... 204F. Overview and notes to the consolidated financial statements1. Overview 1.1 Company overview .................................................................................................... 206 1.2 Basis of preparation of financial statements .............................................................. 206 1.3 Basis of consolidation ................................................................................................ 206 1.4 Use of estimates and judgments................................................................................ 206 1.5 Critical accounting estimates ..................................................................................... 207 1.6 Recent accounting pronouncements ......................................................................... 2072. Notes to the consolidated financial statements 2.1 Business combinations ............................................................................................. 208 2.2 Property, plant and equipment ................................................................................... 209 2.3 Goodwill and other intangible assets .......................................................................... 211 2.4 Investments ............................................................................................................... 214 2.5 Loans .......................................................................................................................... 219 2.6 Other financial assets ................................................................................................. 219 2.7 Trade receivables ....................................................................................................... 219 2.8 Cash and cash equivalents ......................................................................................... 220 2.9 Other assets ............................................................................................................... 221 2.10 Financial instruments ................................................................................................. 222 2.11 Equity ......................................................................................................................... 229 2.12 Other financial liabilities.............................................................................................. 233 2.13 Other liabilities ........................................................................................................... 233 2.14 Provisions ................................................................................................................... 233 2.15 Income taxes .............................................................................................................. 234 2.16 Revenue from operations ........................................................................................... 236 2.17 Other income, net ...................................................................................................... 237 2.18 Expenses .................................................................................................................... 238 2.19 Leases ........................................................................................................................ 239 2.20 Employee benefits...................................................................................................... 239 2.21 Reconciliation of basic and diluted shares used in computing earnings per share ...... 241 2.22 Contingent liabilities and commitments .................................................................... 242 2.23 Related party transactions .......................................................................................... 242 2.24 Segment reporting ..................................................................................................... 247 2.25 Disposal group held for sale ....................................................................................... 249 2.26 Function-wise classification of Consolidated Statement of Profit and Loss ............... 250

Consolidated financial statements | 195 Infosys Annual Report 2017-18
Independent Auditors’ Report
To The Members of Infosys Limited
Report on the Consolidated Financial StatementsWe have audited the accompanying consolidated financial statements of INFOSYS LIMITED (hereinafter referred to as ‘the Company’) and its subsidiaries (the Company and its subsidiaries together referred to as ‘the Group’), comprising the Consolidated Balance Sheet as at March 31, 2018, the Consolidated Statement of Profit and Loss (including other comprehensive income), the Consolidated Statement of Changes in Equity, the Consolidated Statement of Cash Flows for the year then ended, and a summary of the significant accounting policies and other explanatory information.
Management’s Responsibility for the Consolidated Financial Statements The Company’s Board of Directors is responsible for the preparation of these consolidated financial statements in terms of the requirements of the Companies Act, 2013 (hereinafter referred to as ‘the Act’) that give a true and fair view of the consolidated financial position, consolidated financial performance including other comprehensive income, consolidated statement of changes in equity and consolidated cash flows of the Group in accordance with the Indian Accounting Standards (Ind AS) prescribed under Section 133 of the Act read with the Companies (Indian Accounting Standards) Rules, 2015, as amended, and other accounting principles generally accepted in India. The respective Board of Directors of the companies included in the Group are responsible for maintenance of adequate accounting records in accordance with the provisions of the Act for safeguarding the assets of the Group and for preventing and detecting frauds and other irregularities; the selection and application of appropriate accounting policies; making judgments and estimates that are reasonable and prudent; and the design, implementation and maintenance of adequate internal financial controls, that were operating effectively for ensuring the accuracy and completeness of the accounting records, relevant to the preparation and presentation of the consolidated financial statements that give a true and fair view and are free from material misstatement, whether due to fraud or error, which have been used for the purpose of preparation of the consolidated financial statements by the Directors of the Company, as aforesaid.
Auditors’ ResponsibilityOur responsibility is to express an opinion on these consolidated financial statements based on our audit. In conducting our audit, we have taken into account the provisions of the Act, the accounting and auditing standards and matters which are required to be included in the audit report under the provisions of the Act and the Rules made thereunder.
We conducted our audit in accordance with the Standards on Auditing specified under Section 143(10) of the Act. Those Standards require that we comply with ethical requirements and plan and perform the audit to obtain reasonable assurance about whether the consolidated financial statements are free from material misstatement.
An audit involves performing procedures to obtain audit evidence about the amounts and the disclosures in the consolidated financial statements. The procedures selected depend on the auditor’s judgment, including the assessment of the risks of material misstatement of the consolidated financial statements, whether due to fraud or error. In making those risk assessments, the auditor considers internal financial control relevant to the Company’s preparation of the consolidated financial statements that give a true and fair view in order to design audit procedures that are appropriate in the circumstances. An audit also includes evaluating the appropriateness of the accounting policies used and the reasonableness of the accounting estimates made by the Company’s Board of Directors, as well as evaluating the overall presentation of the consolidated financial statements.
We believe that the audit evidence obtained by us, is sufficient and appropriate to provide a basis for our audit opinion on the consolidated financial statements.
OpinionIn our opinion and to the best of our information and according to the explanations given to us, the aforesaid consolidated financial statements give the information required by the Act in the manner so required and give a true and fair view in conformity with the Ind AS and other accounting principles generally accepted in India, of the consolidated state of affairs of the Group as at March 31, 2018, and its consolidated profit, consolidated total comprehensive income, consolidated statement of changes in equity and its consolidated cash flows for the year ended on that date.
Independent Auditors’ Report

196 | Consolidated financial statements Infosys Annual Report 2017-18
Report on Other Legal and Regulatory RequirementsAs required by Section 143(3) of the Act, based on our audit, we report that :
(a) we have sought and obtained all the information and explanations which to the best of our knowledge and belief were necessary for the purposes of our audit of the aforesaid consolidated financial statements.
(b) in our opinion, proper books of account as required by law relating to preparation of the aforesaid consolidated financial statements have been kept so far as it appears from our examination of those books.
(c) the Consolidated Balance Sheet, the Consolidated Statement of Profit and Loss (including Other Comprehensive Income), Consolidated Statement of Changes in Equity and the Consolidated Statement of Cash Flows dealt with by this Report are in agreement with the relevant books of account maintained for the purpose of preparation of the consolidated financial statements.
(d) in our opinion, the aforesaid consolidated financial statements comply with the Indian Accounting Standards prescribed under Section 133 of the Act.
(e) on the basis of the written representations received from the Directors of the Company as on March 31, 2018 taken on record by the Board of Directors of the Company and its subsidiaries incorporated in India and the reports of the statutory auditors of its subsidiary companies incorporated in India, none of the directors of the Group companies incorporated in India is disqualified as on March 31, 2018 from being appointed as a director in terms of Section 164(2) of the Act.
(f) with respect to the adequacy of the internal financial controls over financial reporting and the operating effectiveness of such controls, refer to our separate report in ‘Annexure A’ which is based on the auditor’s reports of the Company and its subsidiary companies incorporated in India. Our report expresses an unmodified opinion on the adequacy and operating effectiveness of the internal financial controls over financial reporting of those companies, for the reasons stated therein.
(g) with respect to the other matters to be included in the Auditor’s Report in accordance with Rule 11 of the Companies (Audit and Auditor’s) Rules, 2014, as amended, in our opinion and to the best of our information and according to the explanations given to us :
i. The consolidated financial statements disclose the impact of pending litigations on the consolidated financial position of the Group.
ii. Provision has been made in the consolidated financial statements, as required under the applicable law or accounting standards, for material foreseeable losses, if any, on long-term contracts including derivative contracts.
iii. There has been no delay in transferring amounts, required to be transferred, to the Investor Education and Protection Fund by the Company and its subsidiary companies incorporated in India.
For DELOITTE HASKINS & SELLS LLPChartered Accountants
(Firm’s registration number : 117366W/W-100018)
Bengaluru, April 13, 2018
Sd/-P.R. Ramesh
Partner
(Membership number : 70928)
Annexure A to the Independent Auditors’ Report
(Referred to in paragraph (f) under ‘Report on Other Legal and Regulatory Requirements’ section of our report to the Members of Infosys Limited of even date)
Report on the Internal Financial Controls Over Financial Reporting under Clause (i) of sub-section 3 of Section 143 of the Companies Act, 2013 (‘the Act’)In conjunction with our audit of the consolidated financial statements of the Company as of and for the year ended March 31, 2018, we have audited the internal financial controls over financial reporting of INFOSYS LIMITED (hereinafter referred to as ‘the Company’) and its subsidiary companies, which are companies incorporated in India, as of that date.
Management’s Responsibility for Internal Financial ControlsThe Board of Directors of the Company and its subsidiary companies, which are companies incorporated in India, are responsible for establishing and maintaining internal financial controls based on the internal control over financial reporting criteria established by the respective companies considering the essential components of internal control stated in the Guidance Note on Audit of Internal Financial Controls Over Financial Reporting issued by the Institute of Chartered Accountants of India (‘the ICAI’). These responsibilities include the design, implementation and maintenance of adequate internal financial

Consolidated financial statements | 197 Infosys Annual Report 2017-18
controls that were operating effectively for ensuring the orderly and efficient conduct of its business, including adherence to the respective company’s policies, the safeguarding of its assets, the prevention and detection of frauds and errors, the accuracy and completeness of the accounting records, and the timely preparation of reliable financial information, as required under the Act.
Auditor’s ResponsibilityOur responsibility is to express an opinion on the internal financial controls over financial reporting of the Company and its subsidiary companies, which are companies incorporated in India, based on our audit. We conducted our audit in accordance with the Guidance Note on Audit of Internal Financial Controls Over Financial Reporting (‘the Guidance Note’) issued by the Institute of Chartered Accountants of India and the Standards on Auditing, prescribed under Section 143(10) of the Companies Act, 2013, to the extent applicable to an audit of internal financial controls. Those Standards and the Guidance Note require that we comply with ethical requirements and plan and perform the audit to obtain reasonable assurance about whether adequate internal financial controls over financial reporting was established and maintained and if such controls operated effectively in all material respects.
Our audit involves performing procedures to obtain audit evidence about the adequacy of the internal financial controls system over financial reporting and their operating effectiveness. Our audit of internal financial controls over financial reporting included obtaining an understanding of internal financial controls over financial reporting, assessing the risk that a material weakness exists, and testing and evaluating the design and operating effectiveness of internal control based on the assessed risk. The procedures selected depend on the auditor’s judgement, including the assessment of the risks of material misstatement of the financial statements, whether due to fraud or error.
We believe that the audit evidence we have obtained is sufficient and appropriate to provide a basis for our audit opinion on the internal financial controls system over financial reporting of the Company and its subsidiary companies, which are companies incorporated in India.
Meaning of Internal Financial Controls Over Financial ReportingA company’s internal financial control over financial reporting is a process designed to provide reasonable assurance regarding the reliability of financial reporting and the preparation of financial statements for external purposes in accordance with generally accepted accounting principles. A company’s internal financial control over financial reporting includes those policies and procedures that (1) pertain to the maintenance of records that, in reasonable detail, accurately and fairly reflect the transactions and dispositions of the assets of the company; (2) provide reasonable assurance that transactions are recorded as necessary to permit preparation of financial statements in accordance with generally accepted accounting principles, and that receipts and expenditures of the company are being made only in accordance with authorizations of management and directors of the company; and (3) provide reasonable assurance regarding prevention or timely detection of unauthorized acquisition, use, or disposition of the company’s assets that could have a material effect on the financial statements.
Inherent Limitations of Internal Financial Controls Over Financial ReportingBecause of the inherent limitations of internal financial controls over financial reporting, including the possibility of collusion or improper management override of controls, material misstatements due to error or fraud may occur and not be detected. Also, projections of any evaluation of the internal financial controls over financial reporting to future periods are subject to the risk that the internal financial control over financial reporting may become inadequate because of changes in conditions, or that the degree of compliance with the policies or procedures may deteriorate.
OpinionIn our opinion and to the best of our information and according to the explanations given to us, the Company and its subsidiary companies, which are companies incorporated in India, have, in all material respects, an adequate internal financial controls system over financial reporting and such internal financial controls over financial reporting were operating effectively as at March 31, 2018, based on the internal control over financial reporting criteria established by the respective companies considering the essential components of internal control stated in the Guidance Note on Audit of Internal Financial Controls Over Financial Reporting issued by the Institute of Chartered Accountants of India.
For DELOITTE HASKINS & SELLS LLPChartered Accountants
(Firm’s registration number : 117366W/W-100018)
Bengaluru, April 13, 2018
Sd/-P.R. Ramesh
Partner
(Membership number : 70928)

198 | Consolidated financial statements Infosys Annual Report 2017-18
Consolidated Balance Sheetin ` crore
Particulars Note no. As at March 31,2018 2017
ASSETS NON-CURRENT ASSETS
Property, plant and equipment 2.2 10,116 9,751 Capital work-in-progress 1,606 1,365 Goodwill 2.3.1 & 2.25 2,211 3,652 Other intangible assets 2.3.2 247 776 Investment in associate 2.23 – 71 Financial assets
Investments 2.4 5,756 6,382 Loans 2.5 36 29 Other financial assets 2.6 284 309
Deferred tax assets (net) 2.15 1,282 540 Income tax assets (net) 2.15 6,070 5,716 Other non-current assets 2.9 2,265 1,059
TOTAL NON-CURRENT ASSETS 29,873 29,650 CURRENT ASSETS
Financial assetsInvestments 2.4 6,407 9,970 Trade receivables 2.7 13,142 12,322 Cash and cash equivalents 2.8 19,818 22,625 Loans 2.5 239 272 Other financial assets 2.6 6,684 5,980
Other current assets 2.9 1,667 2,536 47,957 53,705
Assets held for sale 2.25 2,060 – TOTAL CURRENT ASSETS 50,017 53,705
TOTAL ASSETS 79,890 83,355 EQUITY AND LIABILITIES
EQUITY Equity share capital 2.11 1,088 1,144 Other equity 63,835 67,838
Total equity attributable to equity holders of the Company 64,923 68,982 Non-controlling interests 1 – TOTAL EQUITY 64,924 68,982
Consolidated Balance Sheet

Consolidated financial statements | 199 Infosys Annual Report 2017-18
Particulars Note no. As at March 31,2018 2017
LIABILITIESNON-CURRENT LIABILITIES
Financial liabilitiesOther financial liabilities 2.12 61 70
Deferred tax liabilities (net) 2.15 541 207 Other non-current liabilities 2.13 259 83
TOTAL NON-CURRENT LIABILITIES 861 360 CURRENT LIABILITIES
Financial liabilitiesTrade payables 694 367 Other financial liabilities 2.12 6,946 6,349
Provisions 2.14 492 405 Income tax liabilities (net) 2.15 2,043 3,885 Other current liabilities 2.13 3,606 3,007
13,781 14,013 Liabilities directly associated with assets held for sale 2.25 324 –
TOTAL CURRENT LIABILITIES 14,105 14,013 TOTAL EQUITY AND LIABILITIES 79,890 83,355
The accompanying notes form an integral part of the consolidated financial statements.As per our report of even date attached
for Deloitte Haskins & Sells LLPChartered Accountants
Firm’s registration number : 117366W/W-100018
for and on behalf of the Board of Directors of Infosys Limited
P.R. RameshPartner
Membership number : 70928
Nandan M. NilekaniChairman
Salil ParekhChief Executive Officer and Managing Director
U.B. Pravin RaoChief Operating Officer and Whole‑time Director
BengaluruApril 13, 2018
D. SundaramDirector
M.D. RanganathChief Financial Officer
A.G.S. ManikanthaCompany Secretary
Consolidated Statement of Profit and Lossin ` crore, except equity share and per equity share data
Particulars Note no. Year ended March 31,2018 2017
Revenue from operations 2.16 70,522 68,484 Other income, net 2.17 & 2.25 3,193 3,080 TOTAL INCOME 73,715 71,564 EXPENSES
Employee benefit expenses 2.18 38,893 37,659 Cost of technical sub-contractors 4,297 3,833 Travel expenses 1,995 2,235 Cost of software packages and others 2.18 1,870 1,597 Communication expenses 489 549 Consultancy and professional charges 1,043 763 Depreciation and amortization expenses 2.2 & 2.3.2 1,863 1,703 Other expenses 2.18 2,924 3,244
TOTAL EXPENSES 53,374 51,583 Profit before non-controlling interests / share in net profit / (loss) of associate 20,341 19,981 Share in net profit / (loss) of associate, including impairment 2.23 (71) (30)Profit before tax 20,270 19,951
Consolidated Statement of Profit and Loss

200 | Consolidated financial statements Infosys Annual Report 2017-18
Particulars Note no. Year ended March 31,2018 2017
Tax expenseCurrent tax 2.15 4,581 5,653 Deferred tax 2.15 (340) (55)
PROFIT FOR THE YEAR 16,029 14,353 Other comprehensive income Items that will not be reclassified subsequently to profit or loss
Remeasurement of the net defined benefit liability / asset, net 2.20 & 2.15 55 (45)Equity instruments through other comprehensive income, net 2.4 & 2.15 7 (5)
62 (50)Items that will be reclassified subsequently to profit or loss
Fair value changes on derivatives designated as cash flow hedge, net 2.10 & 2.15 (39) 39 Exchange differences on translation of foreign operations 321 (257)Fair value changes on investments, net 2.4 & 2.15 (1) (10)
281 (228)Total other comprehensive income / (loss), net of tax 343 (278)TOTAL COMPREHENSIVE INCOME FOR THE YEAR 16,372 14,075 Profit attributable to
Owners of the Company 16,029 14,353 Non-controlling interests – –
16,029 14,353 Total comprehensive income attributable to
Owners of the Company 16,372 14,075 Non-controlling interests – –
16,372 14,075 Earnings per equity shareEquity shares of par value ` 5 each
Basic (`) 71.07 62.80 Diluted (`) 71.00 62.77
Weighted average equity shares used in computing earnings per equity share 2.21
Basic 225,53,32,322 228,56,39,447 Diluted 225,75,73,870 228,63,96,745
The accompanying notes form an integral part of the consolidated financial statements.As per our report of even date attached
for Deloitte Haskins & Sells LLPChartered Accountants
Firm’s registration number : 117366W/W-100018
for and on behalf of the Board of Directors of Infosys Limited
P.R. RameshPartner
Membership number : 70928
Nandan M. NilekaniChairman
Salil ParekhChief Executive Officer and Managing Director
U.B. Pravin RaoChief Operating Officer and Whole‑time Director
BengaluruApril 13, 2018
D. SundaramDirector
M.D. RanganathChief Financial Officer
A.G.S. ManikanthaCompany Secretary

Consolidated financial statem
ents | 201 Infosys A
nnual Report 2017-18
Consolidated Statement of Changes in Equity in ` crore
Particulars Equity share
capital (1)
Other equity Total equity
attributable to equity
holders of the
Company
Reserves and surplus Other comprehensive income Securities premium
reserve
Retained earnings
Capital reserve
General reserve
Share options
outstanding account
Special Economic Zone Re-
investment Reserve (2)
Other reserves
(3)
Capital redemption
reserve
Equity instruments
through other comprehensive
income
Exchange differences
on translating the financial
statements of a foreign
operation
Effective portion of cash
flow hedges
Other items of other
comprehensive income / (loss)
Balance as at April 1, 2016 1,144 2,213 47,063 54 10,553 8 – 5 – – 715 – (11) 61,744Changes in equity for the year ended March 31, 2017Income tax benefit arising on exercise of stock options – – – – – 1 – – – – – – – 1 Exercise of stock options (Refer to Note 2.11) – 3 – – – (3) – – – – – – – – Dividends (including dividend distribution tax) – –
(6,952) – – – – – – – – – – (6,952)
Transfer to general reserve – – (1,582) – 1,582 – – – – – – – – – Transferred to Special Economic Zone Re-investment Reserve – – (953) – – – 953 – – – – – – – Transferred from Special Economic Zone Re-investment Reserve on utilization – – 953 – – – (953) – – – – – – – Share-based payments to employees (Refer to Note 2.11) – – – – – 114 – – – – – – – 114 Remeasurement of the net defined benefit liability / asset(4) (Refer to Notes 2.20.1 and 2.15) – – – – – – – – – – – – (45) (45)Equity instruments through other comprehensive income(4) (Refer to Note 2.4) – – – – – – – – – (5) – – – (5)Fair value changes on investments, net(4) (Refer to Note 2.4) – – – – – – – – – – – – (10) (10)Fair value changes on derivatives designated as cash flow hedge(4)
(Refer to Note 2.10) – – – – – – – – – – – 39 – 39 Profit for the year – – 14,353 – – – – – – – – – – 14,353 Exchange differences on translation of foreign operations – – – – – – – – – – (257) – – (257)Balance as at March 31, 2017 1,144 2,216 52,882 54 12,135 120 – 5 – (5) 458 39 (66) 68,982
Consolidated Statement of Changes in Equity

202 | Consolidated financial statem
entsInfosys A
nnual Report 2017-18
Consolidated Statement of Changes in Equity (contd.)in ` crore
Particulars Equity share
capital (1)
Other equity Total equity attributable
to equity holders
of the Company
Reserves and surplus Other comprehensive incomeSecurities premium
reserve
Retained earnings
Capital reserve
General reserve
Share options
outstanding account
Special Economic Zone Re-
investment Reserve (2)
Other reserves
(3)
Capital redemption
reserve
Equity instruments
through other comprehensive
income
Exchange differences
on translating the financial
statements of a foreign
operation
Effective portion of cash
flow hedges
Other items of other
comprehensive income / (loss)
Balance as at April 1, 2017 1,144 2,216 52,882 54 12,135 120 – 5 – (5) 458 39 (66) 68,982Changes in equity for the year ended March 31, 2018 Share-based payments to employees (Refer to Note 2.11) – – – – – 79 – – – – – – – 79 Share issued on exercise of stock options (Refer to Note 2.11) – 5 – – – – – – – – – – – 5 Exercise of stock options (Refer to Note 2.11) – 67 – – 2 (69) – – – – – – – – Dividends (including dividend distribution tax) – –
(7,469) – – – – – – – – – – (7,469)
Transfer to general reserve – – (1,382) – 1,382 – – – – – – – – – Transferred to Special Economic Zone Re-investment Reserve – –
(2,200) – – – 2,200 – – – – – – –
Transferred from Special Economic Zone Re-investment Reserve on utilization – – 617 – – – (617) – – – – – – – Amount paid upon buyback (Refer to Note 2.11) (56) (2,206) – – (10,738) – – – – – – – – (13,000)Transaction costs related to buyback(4)(Refer to Note 2.11) – (46) – – – – – – – – – – – (46)Amount transferred to capital redemption reserve upon buyback (Refer to Note 2.11) – – – – (56) – – – 56 – – – – – Remeasurement of the net defined benefit liability / asset(4) (Refer to Notes 2.20.1 and 2.15) – – – – – – – – – – – – 55 55 Equity instruments through other comprehensive income(4) (Refer to Note 2.4) – – – – – – – – – 7 – – – 7

Consolidated financial statem
ents | 203 Infosys A
nnual Report 2017-18
Particulars Equity share
capital (1)
Other equity Total equity attributable
to equity holders
of the Company
Reserves and surplus Other comprehensive incomeSecurities premium
reserve
Retained earnings
Capital reserve
General reserve
Share options
outstanding account
Special Economic Zone Re-
investment Reserve (2)
Other reserves
(3)
Capital redemption
reserve
Equity instruments
through other comprehensive
income
Exchange differences
on translating the financial
statements of a foreign
operation
Effective portion of cash
flow hedges
Other items of other
comprehensive income / (loss)
Fair value changes on investments, net(4) (Refer to Note 2.4) – – – – – – – – – – – – (1) (1)Fair value changes on derivatives designated as cash flow hedge(4) (Refer to Note 2.10) – – – – – – – – – – – (39) – (39)Profit for the year – – 16,029 – – – – – – – – – – 16,029 Exchange differences on translation of foreign operations – – – – – – – – – – 321 – – 321 Balance as at March 31, 2018 1,088 36 58,477 54 2,725 130 1,583 5 56 2 779 – (12) 64,923
(1) Net of treasury shares(2) The Special Economic Zone Re-investment Reserve has been created out of the profit of eligible SEZ units in terms of the provisions of Section 10AA(1)(ii) of Income-tax Act, 1961. The reserve should be utilized by the Company for acquiring new plant and machinery for the purpose of its business in the terms of the Section 10AA(2) of the Income-tax Act, 1961. (3) Under the Swiss Code of Obligation, a few subsidiaries of Infosys Lodestone are required to appropriate a certain percentage of the annual profit to legal reserve, which may be used only to cover losses or for measures
designed to sustain the Company through difficult times, to prevent unemployment or to mitigate its consequences.(4) Net of tax
The accompanying notes form an integral part of the consolidated financial statements.As per our report of even date attached
for Deloitte Haskins & Sells LLPChartered Accountants
Firm’s registration number : 117366W/W-100018
for and on behalf of the Board of Directors of Infosys Limited
P.R. RameshPartner
Membership number : 70928
Nandan M. NilekaniChairman
Salil ParekhChief Executive Officer and Managing Director
U.B. Pravin RaoChief Operating Officer and Whole‑time Director
BengaluruApril 13, 2018
D. SundaramDirector
M.D. RanganathChief Financial Officer
A.G.S. ManikanthaCompany Secretary

204 | Consolidated financial statements Infosys Annual Report 2017-18
Consolidated Statement of Cash Flows
Accounting policyCash flows are reported using the indirect method, whereby profit for the year is adjusted for the effects of transactions of a non-cash nature, any deferrals or accruals of past or future operating cash receipts or payments and item of income or expenses associated with investing or financing cash flows. The cash flows from operating, investing and financing activities of the Company are segregated. The Company considers all highly liquid investments that are readily convertible to known amounts of cash to be cash equivalents.
Amendment to Ind AS 7
Effective April 1, 2017, the Group adopted the amendment to Ind AS 7, which requires the entities to provide disclosures that enable users of financial statements to evaluate changes in liabilities arising from financing activities, including both changes arising from cash flows and non-cash changes, suggesting inclusion of a reconciliation between the opening and closing balances in the Balance Sheet for liabilities arising from financing activities, to meet the disclosure requirement. The adoption of the amendment did not have any material effect on the consolidated financial statements.
in ` crore
Particulars Note no. Year ended March 31,2018 2017
CASH FLOWS FROM OPERATING ACTIVITIESProfit for the year 16,029 14,353 Adjustments to reconcile net profit to net cash provided by operating activities :
Income tax expense 2.15 4,241 5,598 Depreciation and amortization 2.2 & 2.3.2 1,863 1,703 Interest and dividend income (2,360) (2,668)Allowances for credit losses on financial assets 34 132 Exchange differences on translation of assets and liabilities 16 38 Impairment loss on assets held for sale 2.25 118 – Share in net profit / (loss) of associate, including impairment 71 30 Stock compensation expense 2.11 84 117 Other adjustments (133) 37
Changes in assets and liabilitiesTrade receivables and unbilled revenues (1,523) (1,743)Loans, other financial assets and other assets (186) (683)Trade payables 328 (19)Other financial liabilities, other liabilities and provisions 1,465 289
Cash generated from operations 20,047 17,184 Income taxes paid (6,829) (5,653)
NET CASH GENERATED BY OPERATING ACTIVITIES 13,218 11,531 CASH FLOWS FROM INVESTING ACTIVITIES
Expenditure on property, plant and equipment (1,998) (2,760)Loans to employees 28 27 Deposits placed with corporation (130) (164)Interest and dividend received 1,768 2,753 Payment of contingent consideration for acquisition of business (33) (36)Payment for acquisition of business, net of cash acquired (27) –
Payments to acquire investments 2.1Preference and equity securities (23) (68)Tax-free bonds and government bonds (2) (322)Liquid mutual funds and fixed maturity plan securities (62,063) (54,215)Non-convertible debentures (104) (3,956)Certificates of deposit (6,653) (7,823)Commercial paper (291) – Others (23) (26)
Proceeds on sale of investments 2.1Tax-free bonds and government bonds 15 7 Non-convertible debentures 100 – Certificates of deposit 9,690 – Liquid mutual funds and fixed maturity plan securities 64,163 52,041
Consolidated Statement of Cash Flows

Consolidated financial statements | 205 Infosys Annual Report 2017-18
Particulars Note no. Year ended March 31,2018 2017
Preference and equity securities 35 – NET CASH FROM / (USED IN) INVESTING ACTIVITIES 4,452 (14,542)CASH FLOWS FROM FINANCING ACTIVITIES
Payment of dividends (including dividend distribution tax) (7,464) (6,939)Exercise of employee stock options 5 – Buyback including transaction cost 2.11 (13,046) –
NET CASH USED IN FINANCING ACTIVITIES (20,505) (6,939)Net increase / (decrease) in cash and cash equivalents (2,835) (9,950)Cash and cash equivalents at the beginning of the year 2.8 22,625 32,697 Effect of exchange rate changes on cash and cash equivalents 81 (122)CASH AND CASH EQUIVALENTS AT THE END OF THE YEAR 2.8 19,871 22,625 Supplementary information
Restricted cash balance 2.8 533 572
The accompanying notes form an integral part of the consolidated financial statements.As per our report of even date attached
for Deloitte Haskins & Sells LLPChartered Accountants
Firm’s registration number : 117366W/W-100018
for and on behalf of the Board of Directors of Infosys Limited
P.R. RameshPartner
Membership number : 70928
Nandan M. NilekaniChairman
Salil ParekhChief Executive Officer and Managing Director
U.B. Pravin RaoChief Operating Officer and Whole‑time Director
BengaluruApril 13, 2018
D. SundaramDirector
M.D. RanganathChief Financial Officer
A.G.S. ManikanthaCompany Secretary

206 | Consolidated financial statements Infosys Annual Report 2017-18
Overview and notes to the consolidated financial statements
1. Overview
1.1 Company overview Infosys Limited (‘the Company’ or Infosys) is a leading provider of consulting, technology, outsourcing and next-generation services and software. Along with its subsidiaries, Infosys provides business IT services (comprising application development and maintenance, independent validation, infrastructure management, engineering services comprising product engineering and life cycle solutions and business process management); consulting and systems integration services (comprising consulting, enterprise solutions, systems integration and advanced technologies); products, business platforms and solutions to accelerate intellectual property-led innovation. Its new offerings span areas like digital, big data and analytics, cloud, data and mainframe modernization, cyber security, IoT engineering services and API and micro services.
Infosys together with its subsidiaries and controlled trusts is hereinafter referred to as ‘the Group’.
The Company is a public limited company incorporated and domiciled in India and has its registered office at Bengaluru, Karnataka, India. The Company has its primary listings on the BSE Limited and National Stock Exchange of India Limited in India. The Company’s American Depositary Shares (ADSs) representing equity shares are also listed on the New York Stock Exchange (NYSE), Euronext London and Euronext Paris.
The Company has proposed to voluntarily delist its ADS from the Euronext Paris and Euronext London exchanges due to low average daily trading volume of its ADS on these exchanges. The proposed delisting is subject to approval from the said stock exchanges.
The Group’s consolidated financial statements are approved for issue by the Company’s Board of Directors on April 13, 2018.
1.2 Basis of preparation of financial statements These consolidated financial statements are prepared in accordance with Indian Accounting Standards (Ind AS), under the historical cost convention on the accrual basis except for certain financial instruments which are measured at fair values, the provisions of the Companies Act, 2013 (‘the Act’) (to the extent notified) and guidelines issued by the Securities and Exchange Board of India (SEBI). The Ind AS are prescribed under Section 133 of the Act read with Rule 3 of the Companies (Indian Accounting Standards) Rules, 2015 and relevant amendment rules issued thereafter.
Effective April 1, 2016, the Group has adopted all the Ind AS standards and the adoption was carried out in accordance with Ind AS 101, First‑time adoption of Indian Accounting Standards, with April 1, 2015 as the transition date. The transition was carried out from Indian Accounting Principles generally accepted in India as prescribed under Section 133 of the Act, read with Rule 7 of the Companies (Accounts) Rules, 2014 (IGAAP), which was the previous GAAP.
Accounting policies have been consistently applied except where a newly-issued accounting standard is initially adopted
or a revision to an existing accounting standard requires a change in the accounting policy hitherto in use.
Amounts for the years ended March 31, 2017 and as at March 31, 2017 were audited by previous auditors – B S R & Co LLP.
As the year-end figures are taken from the source and rounded to the nearest digits, the figures reported for the previous quarters might not always add up to the year-end figures reported in this statement.
1.3 Basis of consolidation Infosys consolidates entities which it owns or controls. The consolidated financial statements comprise the financial statements of the Company, its controlled trusts, its subsidiaries and associate, as disclosed in Note 2.23. Control exists when the parent has power over the entity, is exposed, or has rights, to variable returns from its involvement with the entity and has the ability to affect those returns by using its power over the entity. Power is demonstrated through existing rights that give the ability to direct relevant activities, those which significantly affect the entity’s returns. Subsidiaries are consolidated from the date control commences until the date control ceases.
The financial statements of the Group companies are consolidated on a line-by-line basis and intra-group balances and transactions including unrealized gain / loss from such transactions are eliminated upon consolidation. These financial statements are prepared by applying uniform accounting policies in use at the Group. Non-controlling interests, which represent part of the net profit or loss and net assets of subsidiaries that are not, directly or indirectly, owned or controlled by the Company, are excluded.
Associates are entities over which the Group has significant influence but not control. Investments in associates are accounted for using the equity method of accounting. The investment is initially recognized at cost, and the carrying amount is increased or decreased to recognize the investor’s share of the profit or loss of the investee after the acquisition date. The Group’s investment in associates includes goodwill identified on acquisition.
1.4 Use of estimates and judgmentsThe preparation of the financial statements in conformity with Ind AS requires the Management to make estimates, judgments and assumptions. These estimates, judgments and assumptions affect the application of accounting policies and the reported amounts of assets and liabilities, the disclosures of contingent assets and liabilities at the date of the financial statements and reported amounts of revenues and expenses during the period. Application of accounting policies that require critical accounting estimates involving complex and subjective judgments and the use of assumptions in these financial statements have been disclosed in Note 1.5. Accounting estimates could change from period to period. Actual results could differ from those estimates. Appropriate changes in estimates are made as the Management becomes aware of changes in circumstances surrounding the estimates.
Notes to the consolidated financial statements

Consolidated financial statements | 207 Infosys Annual Report 2017-18
Changes in estimates are reflected in the financial statements in the period in which changes are made and, if material, their effects are disclosed in the notes to the consolidated financial statements.
1.5 Critical accounting estimates
a. Revenue recognition The Group uses the percentage-of-completion method in accounting for its fixed-price contracts. The use of the percentage-of-completion method requires the Group to estimate the efforts or costs expended to date as a proportion of the total efforts or costs to be expended. Efforts or costs expended have been used to measure progress towards completion as there is a direct relationship between input and productivity. Provisions for estimated losses, if any, on uncompleted contracts are recorded in the period in which such losses become probable, based on the expected contract estimates at the reporting date.
b. Income taxes The Company’s two major tax jurisdictions are India and the US, though the Company also files tax returns in other overseas jurisdictions. Significant judgments are involved in determining the provision for income taxes, including amount expected to be paid / recovered for uncertain tax positions. Also, refer to Notes 2.15 and 2.22.
c. Business combinations and intangible assetsBusiness combinations are accounted for using Ind AS 103, Business Combinations. Ind AS 103 requires the identifiable intangible assets and contingent consideration to be fair valued in order to ascertain the net fair value of identifiable assets, liabilities and contingent liabilities of the acquiree. Significant estimates are required to be made in determining the value of contingent consideration and intangible assets. These valuations are conducted by independent valuation experts.
d. Property, plant and equipment Property, plant and equipment represent a significant proportion of the asset base of the Group. The charge in respect of periodic depreciation is derived after determining an estimate of an asset’s expected useful life and the expected residual value at the end of its life. The useful lives and residual values of the Group’s assets are determined by the Management at the time the asset is acquired and reviewed periodically, including at each financial year end. The lives are based on historical experience with similar assets as well as anticipation of future events, which may impact their life, such as changes in technology.
e. Impairment of goodwillGoodwill is tested for impairment on an annual basis and whenever there is an indication that the recoverable amount of a cash generating unit (CGU) is less than its carrying amount based on a number of factors including operating results, business plans, future cash flows and economic conditions. The recoverable amount of CGUs is determined based on the higher of value-in-use and fair value less cost to sell. The goodwill impairment test is performed at the level of the CGU or groups of CGUs which are benefiting from the synergies of
the acquisition, and which represent the lowest level at which goodwill is monitored for internal management purposes.
Market-related information and estimates are used to determine the recoverable amount. Key assumptions on which the Management has based its determination of recoverable amount include estimated long-term growth rates, weighted average cost of capital and estimated operating margins. The cash flow projections take into account past experience and represent the Management’s best estimate about future developments.
f. Non-current assets and disposal group held for saleAssets and liabilities of disposal groups held for sale are measured at the lower of carrying amount and fair value less cost to sell. The determination of fair value less costs to sell includes use of management estimates and assumptions. The fair value of the disposal groups has been estimated using valuation techniques (including income and market approach) which includes unobservable inputs.
1.6 Recent accounting pronouncements Appendix B to Ind AS 21, Foreign currency transactions and advance consideration : On March 28, 2018, the Ministry of Corporate Affairs (MCA) has notified the Companies (Indian Accounting Standards) Amendment Rules, 2018 containing Appendix B to Ind AS 21, Foreign currency transactions and advance consideration, which clarifies the date of the transaction for the purpose of determining the exchange rate to use on initial recognition of the related asset, expense or income, when an entity has received or paid advance consideration in a foreign currency.
This amendment will come into force from April 1, 2018. The Group has evaluated the effect of this on the consolidated financial statements and the impact is not material.
Ind AS 115, Revenue from Contract with Customers : On March 28, 2018, the MCA has notified the Ind AS 115, Revenue from Contract with Customers. The core principle of the new standard is that an entity should recognize revenue to depict the transfer of promised goods or services to customers in an amount that reflects the consideration to which the entity expects to be entitled in exchange for those goods or services. Further, the new standard requires enhanced disclosures about the nature, amount, timing and uncertainty of revenue and cash flows arising from the entity’s contracts with customers.
The standard permits two possible methods of transition :
• Retrospective approach – Under this approach the standard will be applied retrospectively to each prior reporting period presented in accordance with Ind AS 8, Accounting Policies, Changes in Accounting. Estimates and Errors
• Retrospectively with cumulative effect of initially applying the standard recognized at the date of initial application (Cumulative catch-up approach)
The effective date for adoption of Ind AS 115 is financial periods beginning on or after April 1, 2018.
The Group will adopt the standard on April 1, 2018 by using the cumulative catch-up transition method and accordingly, comparatives for the year ending or ended March 31, 2018

208 | Consolidated financial statements Infosys Annual Report 2017-18
will not be retrospectively adjusted. The effect on adoption of Ind AS 115 is expected to be insignificant.
2.1 Business combinations
Accounting policyBusiness combinations have been accounted for using the acquisition method under the provisions of Ind AS 103, Business Combinations.
The cost of an acquisition is measured at the fair value of the assets transferred, equity instruments issued and liabilities incurred or assumed at the date of acquisition, which is the date on which control is transferred to the Group. The cost of acquisition also includes the fair value of any contingent consideration. Identifiable assets acquired and liabilities and contingent liabilities assumed in a business combination are measured initially at their fair value on the date of acquisition.
Business combinations between entities under common control is accounted for at carrying value.
Transaction costs that the Group incurs in connection with a business combination such as finder’s fees, legal fees, due diligence fees, and other professional and consulting fees are expensed as incurred.
Noah Consulting LLCOn November 16, 2015, Infosys acquired 100% membership interest in Noah Consulting, LLC (Noah), a provider of advanced information management consulting services for the oil and gas industry. The business acquisition was conducted by entering into a share purchase agreement for cash consideration of US$ 33 million (approximately ` 216 crore), contingent consideration of up to US$ 5 million (approximately ` 33 crore on acquisition date) and an additional consideration of up to US$ 32 million (approximately ` 212 crore on acquisition date), referred to as retention bonus, payable to the employees of Noah at each anniversary year following the acquisition date over the next three years, subject to their continuous employment with the Group at each anniversary. The retention bonus is treated as a post-acquisition employee remuneration expense as per Ind AS 103. During the year ended March 31, 2016, based on an assessment of Noah achieving the targets, the entire contingent consideration was reversed in the Consolidated Statement of Profit and Loss.
Business transferOn July 14, 2017, the Board of Directors of Infosys authorized the Company to execute a Business Transfer Agreement and related documents with Noah Consulting LLC, a wholly-owned subsidiary, to transfer the business of Noah Consulting LLC to Infosys Limited, subject to securing the requisite regulatory approvals for a consideration based on an independent valuation. Subsequently on October 17, 2017, the Company entered into a business transfer agreement to transfer the business for a consideration of US$ 41 million (approximately ` 266 crore) and the transfer was with effect from October 25, 2017. The transaction was between a holding company and a wholly-owned subsidiary and therefore, was accounted for at carrying values and did not have any impact on the consolidated financial statements. Subsequently, in November 2017, Noah Consulting LLC was liquidated.
Kallidus Inc. (d.b.a Skava)On June 2, 2015, Infosys acquired 100% of the voting interests in Kallidus Inc., US (Kallidus), a provider of digital experience solutions, including mobile commerce and in-store shopping experiences to large retail clients and 100% of the voting interests of Skava Systems Private Limited, India, an affiliate of Kallidus. The business acquisition was conducted by entering into a share purchase agreement for a cash consideration of US$ 91 million (approximately ` 578 crore) and a contingent consideration of up to US$ 20 million (approximately ` 128 crore on acquisition date).
The balance contingent consideration as at March 31, 2018 and March 31, 2017 were ` 34 crore and ` 91 crore, respectively, on an undiscounted basis.
Brilliant Basics Holdings LimitedOn September 8, 2017, Infosys acquired 100% of the voting interests in Brilliant Basics Holdings Limited, UK, (Brilliant Basics) a product design and customer experience innovator with experience in executing global programs. The business acquisition was conducted by entering into a share purchase agreement for a cash consideration of ` 29 crore, a contingent consideration of up to ̀ 20 crore and an additional consideration of up to ` 13 crore, referred to as retention bonus, payable to the employees of Brilliant Basics at each anniversary year over the next two years, subject to their continuous employment with the Group at each anniversary.
The payment of contingent consideration to sellers of Brilliant Basics is dependent upon the achievement of certain financial targets by Brilliant Basics over a period of three years ending in March 2020.
The fair value of contingent consideration is determined by discounting the estimated amount payable to the sellers of Brilliant Basics on achievement of certain financial targets. The key inputs used in determination of the fair value of contingent consideration are the discount rate of 10% and the probabilities of achievement of the financial targets.
The excess of the purchase consideration paid over the fair value of assets acquired has been attributed to goodwill.
The purchase price has been allocated based on the Management’s estimates and independent appraisal of fair values as follows :
in ` crore
Component Acquiree’s carrying amount
Fair value adjustments
Purchase price
allocatedNet assets(1) 1 – 1Intangible assets – customer relationships – 12 12 Deferred tax liabilities on intangible assets – (2) (2)
1 10 11Goodwill 35Total purchase price 46
(1) Includes cash and cash equivalents acquired of ` 2 crore

Consolidated financial statements | 209 Infosys Annual Report 2017-18
The goodwill is not tax-deductible.
The gross amount of trade receivables acquired and its fair value is ̀ 3 crore and the amounts have been largely collected.
The fair value of each major class of consideration as at the acquisition date is as follows :
in ` crore
Component Consideration settledCash paid 29Fair value of contingent consideration 17Total purchase price 46
The transaction costs of ̀ 2 crore related to the acquisition have been included in the Consolidated Statement of Profit and Loss.
Proposed acquisitionOn April 13, 2018, the Company entered into a definitive agreement to acquire WongDoody Holding Company Inc., a US-based creative and consumer insights agency for a total consideration of up to US$ 75 million (approximately ` 489 crore) including contingent consideration and retention payouts, subject to regulatory approvals and fulfillment of closing conditions.
2.2 Property, plant and equipment
Accounting policyProperty, plant and equipment are stated at cost, less accumulated depreciation and impairment, if any. Costs directly attributable to acquisition are capitalized until the property, plant and equipment are ready for use, as intended by the Management. The Group depreciates property, plant and equipment over their estimated useful lives using the straight-line method. The estimated useful lives of assets are as follows :
Buildings(1) 22-25 yearsPlant and machinery(1) 5 yearsOffice equipment 5 yearsComputer equipment(1) 3-5 yearsFurniture and fixtures(1) 5 yearsVehicles(1) 5 yearsLeasehold improvements Over lease term
(1) Based on technical evaluation, the Management believes that the useful lives as given above best represent the period over which the Management expects to use these assets. Hence, the useful lives for these assets is different from the useful lives as prescribed under Part C of Schedule II of the Companies Act 2013.
Depreciation methods, useful lives and residual values are reviewed periodically, including at each financial year end.
Advances paid towards the acquisition of property, plant and equipment outstanding at each Balance Sheet date is classified as capital advances under other non-current assets and the cost of assets not ready to use before such date are disclosed under ‘Capital work-in-progress’. Subsequent expenditures relating to property, plant and equipment is capitalized only when it is probable that future economic benefits associated with these will flow to the Group and the cost of the item can be measured reliably. Repairs and maintenance costs are recognized in the Consolidated Statement of Profit and Loss when incurred. The cost and related accumulated depreciation are eliminated from the financial statements upon sale or retirement of the asset and the resultant gains or losses are recognized in the Consolidated Statement of Profit and Loss.
ImpairmentProperty, plant and equipment are evaluated for recoverability whenever events or changes in circumstances indicate that their carrying amounts may not be recoverable. For the purpose of impairment testing, the recoverable amount (i.e. the higher of the fair value less cost to sell and the value-in-use) is determined on an individual asset basis unless the asset does not generate cash flows that are largely independent of those from other assets. In such cases, the recoverable amount is determined for the CGU to which the asset belongs.
If such assets are considered to be impaired, the impairment to be recognized in the Consolidated Statement of Profit and Loss is measured by the amount by which the carrying value of the assets exceeds the estimated recoverable amount of the asset. An impairment loss is reversed in the Consolidated Statement of Profit and Loss if there has been a change in the estimates used to determine the recoverable amount. The carrying amount of the asset is increased to its revised recoverable amount, provided that this amount does not exceed the carrying amount that would have been determined (net of any accumulated depreciation) had no impairment loss been recognized for the asset in prior years.

210 | Consolidated financial statements Infosys Annual Report 2017-18
The changes in the carrying value of property, plant and equipment for the year ended March 31, 2018 are as follows : in ` crore
Particulars Land – Freehold
Land – Leasehold
Buildings(1) Plant and machinery
(2)
Office equipment
Computer equipment
Furniture and
fixtures
Leasehold improvements
Vehicles Total
Gross carrying value as at April 1, 2017 1,095 671 7,279 2,048 922 4,540 1,277 469 31 18,332 Additions 134 2 789 264 86 471 130 74 5 1,955 Deletions – – (1) (8) (8) (109) (10) (12) (5) (153)Reclassified under assets held for sale (Refer to Note 2.25) – – – (1) (2) (40) (8) (17) – (68)Translation difference – – 63 3 4 22 4 17 – 113 Gross carrying value as at March 31, 2018 1,229 673 8,130 2,306 1,002 4,884 1,393 531 31 20,179 Accumulated depreciation as at April 1, 2017 – (27) (2,440) (1,337) (599) (3,053) (869) (239) (17) (8,581)Depreciation – (4) (276) (266) (125) (693) (160) (105) (5) (1,634)Accumulated depreciation on deletions – – – 7 6 107 9 11 4 144 Reclassified under assets held for sale (Refer to Note 2.25) – – – 1 1 25 5 15 – 47 Translation difference – – (3) (2) (2) (18) (2) (12) – (39)Accumulated depreciation as at March 31, 2018 – (31) (2,719) (1,597) (719) (3,632)
(1,017) (330) (18)
(10,063)
Carrying value as at April 1, 2017 1,095 644 4,839 711 323 1,487 408 230 14 9,751 Carrying value as at March 31, 2018 1,229 642 5,411 709 283 1,252 376 201 13 10,116
The changes in the carrying value of property, plant and equipment for the year ended March 31, 2017 were as follows : in ` crore
Particulars Land – Freehold
Land – Leasehold
Buildings (1)
Plant and machinery
(2)
Office equipment
Computer equipment
Furniture and
fixtures
Leasehold improvements
Vehicles Total
Gross carrying value as at April 1, 2016 972 650 6,325 1,742 839 4,072 1,130 331 29 16,090 Additions 123 21 981 313 138 800 191 224 8 2,799 Deletions – – – (4) (52) (315) (39) (74) (6) (490)Translation difference – – (27) (3) (3) (17) (4) (13) – (67)Gross carrying value as at March 31, 2017 1,095 671 7,279 2,048 922 4,540 1,278 468 31 18,332 Accumulated depreciation as at April 1, 2016 – (22)
(2,201) (1,089) (509) (2,618) (729) (268) (17)
(7,453)
Depreciation – (5) (239) (256) (119) (678) (161) (54) (5) (1,517)Accumulated depreciation on deletions – – – 4 27 230 18 74 5 358

Consolidated financial statements | 211 Infosys Annual Report 2017-18
Particulars Land – Freehold
Land – Leasehold
Buildings (1)
Plant and machinery
(2)
Office equipment
Computer equipment
Furniture and
fixtures
Leasehold improvements
Vehicles Total
Translation difference – – – 4 2 13 3 9 – 31 Accumulated depreciation as at March 31, 2017 – (27)
(2,440) (1,337) (599) (3,053) (869) (239) (17)
(8,581)
Carrying value as at April 1, 2016 972 628 4,124 653 330 1,454 401 63 12 8,637 Carrying value as of March 31, 2017 1,095 644 4,839 711 323 1,487 409 229 14 9,751
Notes: (1) Buildings include ` 250 being the value of five shares of ` 50 each in Mittal Towers Premises Co-operative Society Limited. (2) Includes CSR spend amounting to ` 168 crore and ` 25 crore for the years ending March 31, 2018 and March 31, 2017, respectively
Gross carrying value of leasehold land represents amounts paid under certain lease-cum-sale agreements to acquire land, including agreements where the Company has an option to purchase or renew the properties on expiry of the lease period.
The aggregate depreciation has been included under depreciation and amortization expense in the consolidated Statement of Profit and Loss.
2.3 Goodwill and other intangible assets
2.3.1 Goodwill
Accounting policyGoodwill represents the cost of business acquisition in excess of the Group’s interest in the net fair value of identifiable assets, liabilities and contingent liabilities of the acquiree. When the net fair value of the identifiable assets, liabilities and contingent liabilities acquired exceeds the cost of business acquisition, the bargain purchase excess is recognized after reassesing the fair value of net assets acquired in the capital reserve. Goodwill is measured at cost less accumulated impairment losses.
ImpairmentGoodwill is tested for impairment on an annual basis and whenever there is an indication that goodwill may be impaired, relying on a number of factors including operating results, business plans and future cash flows. For the purpose of impairment testing, goodwill acquired in a business combination is allocated to the Group’s cash generating units (CGU) or groups of CGUs expected to benefit from the synergies arising from the business combination. A CGU is the smallest identifiable group of assets that generates cash inflows that are largely independent of the cash inflows from other assets or group of assets. Impairment occurs when the carrying amount of a CGU including the goodwill, exceeds the estimated recoverable amount of the CGU. The recoverable amount of a CGU is the higher of its fair value less cost to sell and its value-in-use. Value-in-use is the present value of future cash flows expected to be derived from the CGU.
Total impairment loss of a CGU is allocated first to reduce the carrying amount of goodwill allocated to the CGU and then to the other assets of the CGU pro-rata on the
basis of the carrying amount of each asset in the CGU. An impairment loss on goodwill is recognized in net profit in the Consolidated Statement of Profit and Loss and is not reversed in the subsequent period.
A summary of changes in the carrying amount of goodwill is as follows :
in ` crore
Particulars As at March 31,2018 2017
Carrying value at the beginning 3,652 3,764 Goodwill on Brilliant Basics acquisition (Refer to Note 2.1) 35 – Goodwill reclassified under assets held for sale (Refer to Note 2.25) (1,609) – Translation differences 133 (112)Carrying value at the end 2,211 3,652
For the purpose of impairment testing, goodwill acquired in a business combination is allocated to the CGU or groups of CGUs, which are benefited from the synergies of the acquisition. The chief operating decision maker reviews the goodwill for any impairment at the operating segment level, which is represented through groups of CGUs.
The goodwill has been allocated to the operating segments as at March 31, 2018 and March 31, 2017 as follows :
in ` crore
Segment As at March 31,2018 2017
Financial services 474 826 Manufacturing 252 409 Retail, Consumer packaged goods and Logistics 314 556 Life Sciences, Healthcare and Insurance 446 638 Energy & Utilities, Communication and Services 470 765
1,956 3,194 Operating segments without significant goodwill 255 458 Total 2,211 3,652

212 | Consolidated financial statements Infosys Annual Report 2017-18
The entire goodwill relating to Infosys BPM’s acquisition of McCamish has been allocated to the groups of CGUs which are represented by the Life Sciences, Healthcare and Insurance segment.
The goodwill relating to Infosys BPM, Infosys Lodestone, Portland, Panaya and Kallidus d.b.a Skava acquisitions has been allocated to the groups of CGUs which are represented by a majority of the entity’s operating segment as at March 31, 2017.
The goodwill relating to Infosys BPM, Infosys Lodestone, Portland and Brilliant Basics acquisitions has been allocated to the groups of CGUs which are represented by a majority of the entity’s operating segment as at March 31, 2018 (Refer to Note 2.25).
The entire goodwill relating to Noah acquisition has been allocated to the group of CGUs which is represented by the Energy & Utilities, Communication and Services segment.
The recoverable amount of a CGU is the higher of its fair value less cost to sell and its value-in-use. The fair value of a CGU is determined based on the market capitalization. The value-in-use is determined based on specific calculations. These calculations use pre-tax cash flow projections over a period of five years. A range of each assumption used is mentioned below. As at March 31, 2018 and March 31, 2017, the estimated recoverable amount of the CGU exceeded its carrying amount. The key assumptions used for the calculations are as follows :
(in %)
Particulars As at March 31,2018 2017
Long-term growth rate 8-10 8-10Operating margins 17-20 17-20Discount rate 13.5 14.4
The Management believes that any reasonable possible changes in the key assumptions would not cause the carrying amount to exceed the recoverable amount of the cash generating unit.
2.3.2 Other intangible assets
Accounting policyIntangible assets are stated at cost less accumulated amortization and impairment. Intangible assets are amortized over their respective individual estimated useful lives on a straight-line basis, from the date that they are available for use. The estimated useful life of an identifiable intangible asset is based on a number of factors including the effects of obsolescence, demand, competition, and other economic factors (such as the stability of the industry, and known technological advances). Amortization methods and useful lives are reviewed periodically including at each financial year end.
Research costs are expensed as incurred. Software product development costs are expensed as incurred unless technical and commercial feasibility of the project is demonstrated, future economic benefits are probable, the Company has an intention and ability to complete and use or sell the software and the costs can be measured reliably. The costs which can be capitalized include the cost of material, direct labour, overhead costs that are directly attributable to preparing the asset for its intended use.
ImpairmentIntangible assets are evaluated for recoverability whenever events or changes in circumstances indicate that their carrying amounts may not be recoverable. For the purpose of impairment testing, the recoverable amount (i.e. the higher of the fair value less cost to sell and the value-in-use) is determined on an individual asset basis unless the asset does not generate cash flows that are largely independent of those from other assets. In such cases, the recoverable amount is determined for the CGU to which the asset belongs.
If such assets are considered to be impaired, the impairment to be recognized in the Consolidated Statement of Profit and Loss is measured by the amount by which the carrying value of the assets exceeds the estimated recoverable amount of the asset. An impairment loss is reversed in the Consolidated Statement of Profit and Loss if there has been a change in the estimates used to determine the recoverable amount. The carrying amount of the asset is increased to its revised recoverable amount, provided that this amount does not exceed the carrying amount that would have been determined (net of any accumulated amortization) had no impairment loss been recognized for the asset in prior years.
The changes in the carrying value of acquired intangible assets for the year ended March 31, 2018 are as follows :in ` crore
Particulars Customer -related
Software -related
Sub-contracting
rights -related
Intellectual property
rights -related
Land use – rights -related
Brand or trademark
-related
Others Total
Gross carrying value as at April 1, 2017 750 405 21 1 66 90 62 1,395 Additions through business combination (Refer to Note 2.1) 12 – – – – – – 12 Deletions / retirals during the period (172) – (21) – – (29) (35) (257)

Consolidated financial statements | 213 Infosys Annual Report 2017-18
Particulars Customer -related
Software -related
Sub-contracting
rights -related
Intellectual property
rights -related
Land use – rights -related
Brand or trademark
-related
Others Total
Reclassified under assets held for sale (Refer to Note 2.25) (157) (388) – (1) – (37) – (583)Translation differences 12 2 – – 7 2 – 23 Gross carrying value as at March 31, 2018 445 19 – – 73 26 27 590 Accumulated amortization as at April 1, 2017 (382) (121) (21) (1) (7) (49) (38) (619)Amortization expense (127) (79) – – (1) (12) (10) (229)Deletions / retirals during the period 172 – 21 – – 29 35 257 Reclassified under assets held for sale (Refer to Note 2.25) 56 182 – 1 – 21 – 260 Translation differences (8) (1) – – (2) (1) – (12)Accumulated amortization as at March 31, 2018 (289) (19) – – (10) (12) (13) (343)Carrying value as at April 1, 2017 368 284 – – 59 41 24 776 Carrying value as at March 31, 2018 156 – – – 63 14 14 247 Estimated useful life (in years) 2-10 – – – 50 5 5Estimated remaining useful life (in years) 1-5 – – – 43 3 3
The changes in the carrying value of acquired intangible assets for the year ended March 31, 2017 were as follows :in ` crore
Particulars Customer -related
Software -related
Sub-contracting
rights -related
Intellectual property
rights- related
Land use – rights -related
Brand or trademark
-related
Others Total
Gross carrying value as at April 1, 2016 775 414 21 1 72 93 63 1,439 Additions during the period – – – – – – – – Deletions during the period – – – – – – – – Translation differences (25) (9) – – (6) (3) (1) (44)Gross carrying value as at March 31, 2017 750 405 21 1 66 90 62 1,395 Accumulated amortization as at April 1, 2016 (303) (62) (21) (1) (6) (38) (23) (454)Amortization expense (91) (63) – – (1) (14) (17) (186)Deletions during the period – – – – – – – – Translation differences 12 4 – – – 3 2 21 Accumulated amortization as at March 31, 2017 (382) (121) (21) (1) (7) (49) (38) (619)Carrying value as at April 1, 2016 472 352 – – 66 55 40 985 Carrying value as at March 31, 2017 368 284 – – 59 41 24 776 Estimated useful life (in years) 3-10 5-8 – – 50 3-10 3-5Estimated remaining useful life (in years) 1-6 3-6 – – 44 1-8 1-4
During the year ended March 31, 2017, the Management, based on an internal evaluation, reassessed the remaining useful life of certain technology assets acquired as a part of business combinations. Accordingly, the remaining useful life of the said asset which was eight years had been revised to three years. Amortization expense for the year ended March 31, 2017 was higher by ` 19 crore due to the revision.
The amortization expense has been included under depreciation and amortization expense in the Consolidated Statement of Profit and Loss.

214 | Consolidated financial statements Infosys Annual Report 2017-18
Research and development expenditureResearch and development expense recognized in the consolidated Statement of Profit and Loss for the years ended March 31, 2018 and March 31, 2017 was ` 748 crore and ` 789 crore, respectively.
2.4 Investmentsin ` crore
Particulars As at March 31,2018 2017
NON-CURRENT INVESTMENTSUNQUOTEDInvestments carried at fair value through other comprehensive income (Refer to Note 2.4.1)
Preference securities 116 144 Equity instruments 22 15
138 159 Investments carried at fair value through profit or loss (Refer to Note 2.4.1)
Convertible promissory note 12 10 Others 66 35
78 45 QUOTEDInvestments carried at amortized cost (Refer to Note 2.4.2)
Tax-free bonds 1,896 1,898 1,896 1,898
Investments carried at fair value through profit or loss (Refer to Note 2.4.3)Fixed maturity plan securities 429 407
429 407 Investments carried at fair value through other comprehensive income (Refer to Note 2.4.4)
Non-convertible debentures 3,215 3,873 3,215 3,873
TOTAL NON-CURRENT INVESTMENTS 5,756 6,382 CURRENT INVESTMENTSUNQUOTEDInvestments carried at fair value through profit or loss (Refer to Note 2.4.3)
Liquid mutual fund units 81 1,803 81 1,803
Investments carried at fair value through other comprehensive income Commercial paper (Refer to Note 2.4.4) 293 – Certificates of deposit (Refer to Note 2.4.4) 5,269 7,905
5,562 7,905 QUOTEDInvestment carried at amortized cost (Refer to Note 2.4.2)
Government bonds 1 9 1 9
Investments carried at fair value through profit or loss (Refer to Note 2.4.3)Fixed maturity plan securities – 151
– 151 Investments carried at fair value through other comprehensive income (Refer to Note 2.4.4)
Non-convertible debentures 763 102 763 102
TOTAL CURRENT INVESTMENTS 6,407 9,970 TOTAL INVESTMENTS 12,163 16,352 Aggregate amount of quoted investments 6,304 6,440 Market value of quoted investments (including interest accrued) 6,568 6,701 Aggregate amount of unquoted investments (including investment in associate) 5,859 9,983 Aggregate amount of impairment made for non-current unquoted investments (including investment in associate) 71 18 Investments carried at amortized cost 1,897 1,907 Investments carried at fair value through other comprehensive income 9,678 12,039 Investments carried at fair value through profit or loss 588 2,406
Note : Refer to Note 2.10 for Accounting policies on financial instruments.
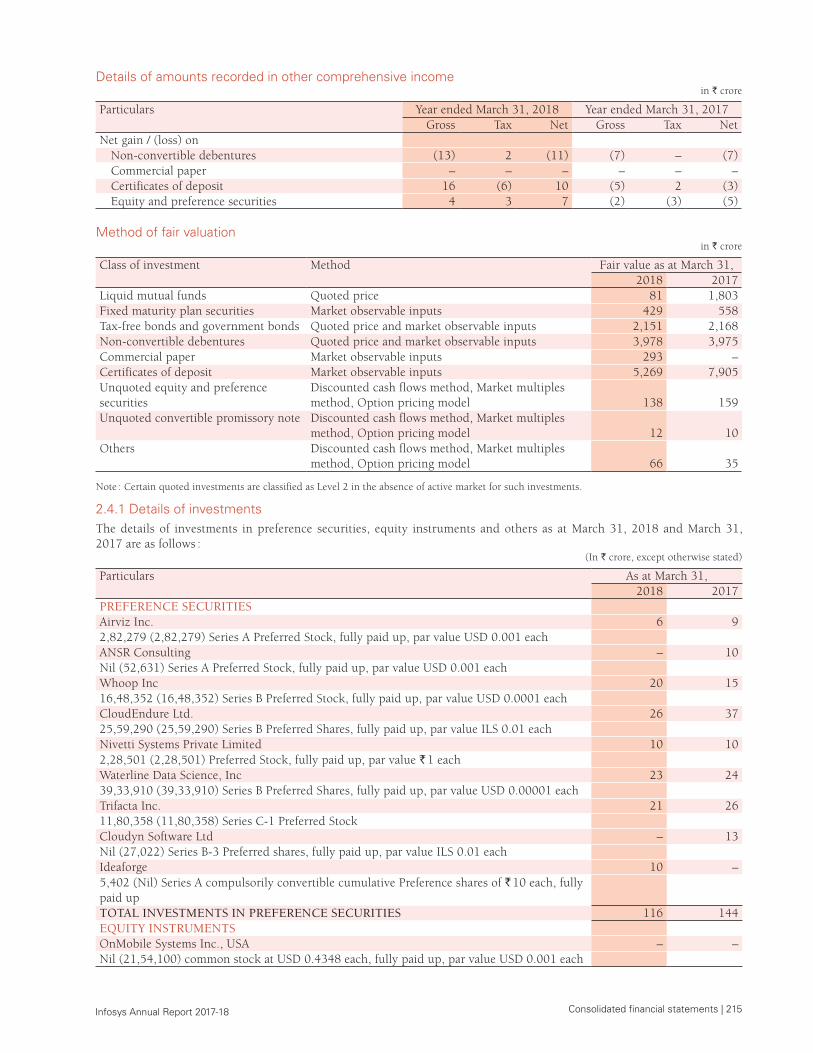
Consolidated financial statements | 215 Infosys Annual Report 2017-18
Details of amounts recorded in other comprehensive incomein ` crore
Particulars Year ended March 31, 2018 Year ended March 31, 2017Gross Tax Net Gross Tax Net
Net gain / (loss) on Non-convertible debentures (13) 2 (11) (7) – (7)Commercial paper – – – – – – Certificates of deposit 16 (6) 10 (5) 2 (3)Equity and preference securities 4 3 7 (2) (3) (5)
Method of fair valuationin ` crore
Class of investment Method Fair value as at March 31,2018 2017
Liquid mutual funds Quoted price 81 1,803 Fixed maturity plan securities Market observable inputs 429 558 Tax-free bonds and government bonds Quoted price and market observable inputs 2,151 2,168 Non-convertible debentures Quoted price and market observable inputs 3,978 3,975 Commercial paper Market observable inputs 293 – Certificates of deposit Market observable inputs 5,269 7,905 Unquoted equity and preference securities
Discounted cash flows method, Market multiples method, Option pricing model 138 159
Unquoted convertible promissory note Discounted cash flows method, Market multiples method, Option pricing model 12 10
Others Discounted cash flows method, Market multiples method, Option pricing model 66 35
Note : Certain quoted investments are classified as Level 2 in the absence of active market for such investments.
2.4.1 Details of investmentsThe details of investments in preference securities, equity instruments and others as at March 31, 2018 and March 31, 2017 are as follows :
(In ` crore, except otherwise stated)
Particulars As at March 31,2018 2017
PREFERENCE SECURITIESAirviz Inc. 6 9 2,82,279 (2,82,279) Series A Preferred Stock, fully paid up, par value USD 0.001 each ANSR Consulting – 10 Nil (52,631) Series A Preferred Stock, fully paid up, par value USD 0.001 eachWhoop Inc 20 15 16,48,352 (16,48,352) Series B Preferred Stock, fully paid up, par value USD 0.0001 eachCloudEndure Ltd. 26 37 25,59,290 (25,59,290) Series B Preferred Shares, fully paid up, par value ILS 0.01 eachNivetti Systems Private Limited 10 10 2,28,501 (2,28,501) Preferred Stock, fully paid up, par value ` 1 eachWaterline Data Science, Inc 23 24 39,33,910 (39,33,910) Series B Preferred Shares, fully paid up, par value USD 0.00001 eachTrifacta Inc. 21 26 11,80,358 (11,80,358) Series C-1 Preferred StockCloudyn Software Ltd – 13 Nil (27,022) Series B-3 Preferred shares, fully paid up, par value ILS 0.01 each Ideaforge 10 – 5,402 (Nil) Series A compulsorily convertible cumulative Preference shares of ` 10 each, fully paid upTOTAL INVESTMENTS IN PREFERENCE SECURITIES 116 144EQUITY INSTRUMENTSOnMobile Systems Inc., USA – – Nil (21,54,100) common stock at USD 0.4348 each, fully paid up, par value USD 0.001 each

216 | Consolidated financial statements Infosys Annual Report 2017-18
Particulars As at March 31,2018 2017
Merasport Technologies Private Limited – – 2,420 (2,420) equity shares at ` 8,052 each, fully paid up, par value ` 10 eachGlobal Innovation and Technology Alliance 1 1 15,000 (15,000) equity shares at ` 1,000 each, fully paid up, par value ` 1,000 eachUnsilo A/S 21 14 69,894 (69,894) Equity Shares, fully paid up, par value DKK 1 eachIdeaforge100 (Nil) equity shares at ` 10, fully paid up – – TOTAL INVESTMENTS IN EQUITY INSTRUMENTS 22 15OTHERSStellaris Venture Partners India 7 3 Vertex Ventures US Fund L.L.P 59 32 TOTAL INVESTMENTS IN OTHERS 66 35CONVERTIBLE PROMISSORY NOTETidalscale 12 10 TOTAL INVESTMENT IN CONVERTIBLE PROMISSORY NOTE 12 10TOTAL 216 204
2.4.2 Details of investments in tax-free bonds and government bondsThe balances held in tax-free bonds as at March 31, 2018 and March 31, 2017 are as follows :
in ` crore, except as otherwise stated
Particulars Face value ` As at March 31, 2018 As at March 31, 2017 Units Amount Units Amount
7.04% Indian Railway Finance Corporation Limited Bonds 03MAR2026 10,00,000 470 50 470 50 7.16% Power Finance Corporation Limited Bonds 17JUL2025 10,00,000 1,000 106 1,000 107 7.18% Indian Railway Finance Corporation Limited Bonds 19FEB2023 1,000 20,00,000 201 20,00,000 201 7.28% Indian Railway Finance Corporation Limited Bonds 21DEC2030 1,000 4,22,800 42 4,22,800 42 7.28% National Highways Authority of India Bonds 18SEP2030 10,00,000 3,300 343 3,300 343 7.34% Indian Railway Finance Corporation Limited Bonds 19FEB2028 1,000 21,00,000 211 21,00,000 211 7.35% National Highways Authority of India Bonds 11JAN2031 1,000 5,71,396 57 5,71,396 57 7.93% Rural Electrification Corporation Limited Bonds 27MAR2022 1,000 2,00,000 21 2,00,000 21 8.00% Indian Railway Finance Corporation Limited Bonds 23FEB2022 1,000 1,50,000 15 1,50,000 15 8.10% Indian Railway Finance Corporation Limited Bonds 23FEB2027 1,000 5,00,000 52 5,00,000 53 8.20% Power Finance Corporation Limited Bonds 01FEB2022 1,000 5,00,000 50 5,00,000 50 8.26% India Infrastructure Finance Company Limited Bonds 23AUG2028 10,00,000 1,000 100 1,000 100 8.30% National Highways Authority of India Bonds 25JAN2027 1,000 5,00,000 53 5,00,000 53 8.35% National Highways Authority of India Bonds 22NOV2023 10,00,000 1,500 150 1,500 150 8.46% India Infrastructure Finance Company Limited Bonds 30AUG2028 10,00,000 2,000 200 2,000 200 8.46% Power Finance Corporation Limited Bonds 30AUG2028 10,00,000 1,500 150 1,500 150 8.48% India Infrastructure Finance Company Limited Bonds 05SEP2028 10,00,000 450 45 450 45

Consolidated financial statements | 217 Infosys Annual Report 2017-18
Particulars Face value ` As at March 31, 2018 As at March 31, 2017 Units Amount Units Amount
8.54% Power Finance Corporation Limited Bonds 16NOV2028 1,000 5,00,000 50 5,00,000 50 TOTAL INVESTMENTS IN TAX-FREE BONDS 74,55,416 1,896 74,55,416 1,898
The balances held in government bonds as at March 31, 2018 and March 31, 2017 are as follows :(In ` crore, except as otherwise stated)
Particulars Face value PHP
As at March 31, 2018 As at March 31, 2017 Units Amount Units Amount
Treasury Notes PHY6972FWQ99 MAT DATE 07 Jun 2017 100 – – 3,40,000 4 Treasury Notes PIBL1217E082 MAT DATE 09 May 2018 100 1,00,000 1 – – Treasury Notes PIBL1217C056 MAT DATE 14 Mar 2018 100 – – 4,00,000 5 TOTAL INVESTMENTS IN GOVERNMENT BONDS 1,00,000 1 7,40,000 9
2.4.3 Details of investments in liquid mutual fund units and fixed maturity plan securitiesThe balances held in liquid mutual fund units as at March 31, 2018 and March 31, 2017 are as follows :
(In ` crore, except as otherwise stated)
Particulars As at March 31, 2018 As at March 31, 2017 Units Amount Units Amount
Aditya Birla Sun Life Cash Plus – Growth – Direct Plan 16,31,554 45 1,45,22,491 380 BSL Cash Manager – Growth – – 2,66,264 11 ICICI Prudential Liquid – Direct Plan – Growth 13,65,687 36 1,03,88,743 250 IDFC Cash Fund – Direct Plan – Growth – – 12,65,679 250 Kotak Low Duration Fund – Direct Plan – Growth (Ultra Short-Term) – – 15,02,564 305 L&T Liquid Fund – Direct Plan – Growth – – 6,72,806 150 Reliance Liquid Fund – Cash Plan – – 28,305 7 Reliance Liquid Fund – Treasury Plan – Direct Growth Plan – Growth Option – – 8,82,465 350 SBI Premier Liquid Fund – Direct Plan – Growth – – 3,91,909 100 TOTAL INVESTMENTS IN LIQUID MUTUAL FUND UNITS 29,97,241 81 2,99,21,226 1,803
The balances held in fixed maturity plan securities as at March 31, 2018 and March 31, 2017 are as follows :(In ` crore, except as otherwise stated)
Particulars As at March 31, 2018 As at March 31, 2017 Units Amount Units Amount
Aditya Birla Sun Life Fixed Term Plan – Series OD 1145 Days – GR Direct 6,00,00,000 65 6,00,00,000 61 Aditya Birla Sun Life Fixed Term Plan – Series OE 1153 Days – GR Direct 2,50,00,000 27 2,50,00,000 25 HDFC FMP 1155D Feb 2017 – Direct Growth – Series 37 3,80,00,000 41 3,80,00,000 38 HDFC FMP 1169D Feb 2017 – Direct – Quarterly Dividend – Series 37 4,50,00,000 45 4,50,00,000 45 ICICI FMP Series 80 –1194 D Plan F Div 5,50,00,000 59 5,50,00,000 55 ICICI Prudential Fixed Maturity Plan Series 80 – 1187 Days Plan G Direct Plan 4,20,00,000 45 4,20,00,000 42 ICICI Prudential Fixed Maturity Plan Series 80 – 1253 Days Plan J Direct Plan 3,00,00,000 32 3,00,00,000 30 IDFC Fixed Term Plan Series 129 Direct Plan – Growth 1147 Days 1,00,00,000 11 1,00,00,000 10 IDFC Fixed Term Plan Series 131 Direct Plan – Growth 1139 Days 1,50,00,000 16 1,50,00,000 15 Kotak FMP Series 199 Direct – Growth 3,50,00,000 37 3,50,00,000 36 Reliance Fixed Horizon Fund – XXXII Series 8 – Dividend Plan 5,00,00,000 51 5,00,00,000 50 Reliance Yearly Interval Fund Series 1 – Direct Plan – Growth Plan – – 10,69,06,898 151 TOTAL INVESTMENTS IN FIXED MATURITY PLAN SECURITIES 40,50,00,000 429 51,19,06,898 558
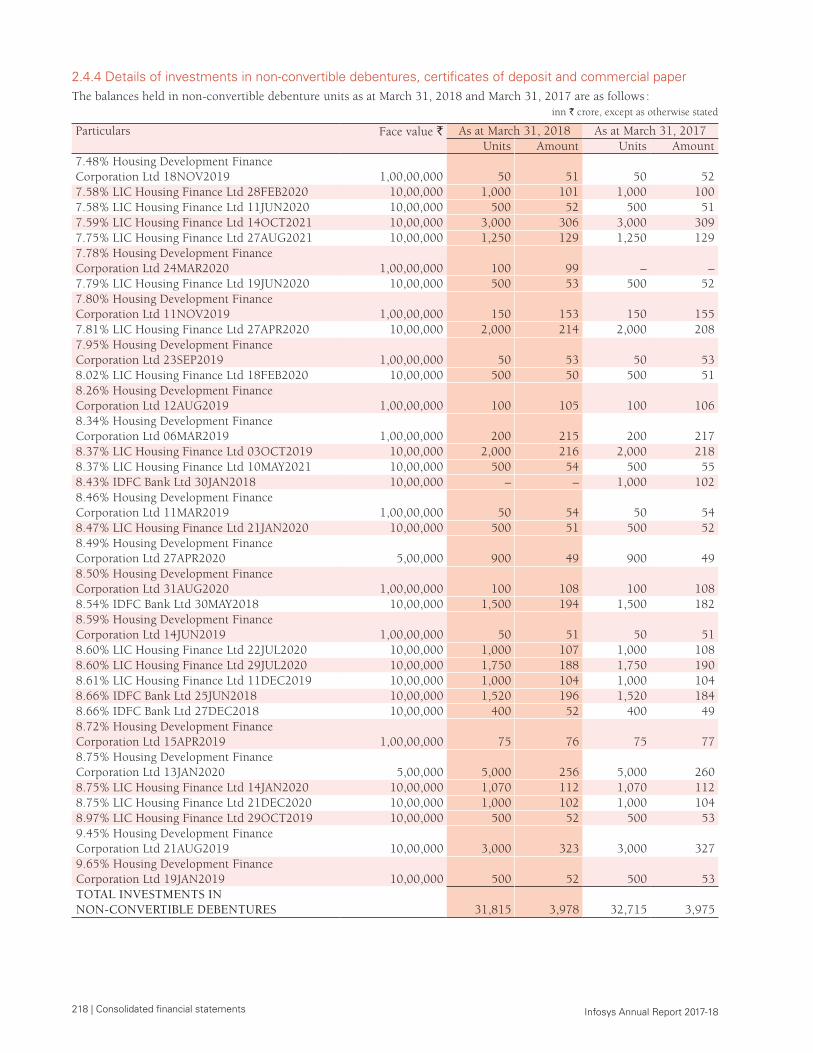
218 | Consolidated financial statements Infosys Annual Report 2017-18
2.4.4 Details of investments in non-convertible debentures, certificates of deposit and commercial paperThe balances held in non-convertible debenture units as at March 31, 2018 and March 31, 2017 are as follows :
inn ` crore, except as otherwise stated
Particulars Face value ` As at March 31, 2018 As at March 31, 2017 Units Amount Units Amount
7.48% Housing Development Finance Corporation Ltd 18NOV2019 1,00,00,000 50 51 50 52 7.58% LIC Housing Finance Ltd 28FEB2020 10,00,000 1,000 101 1,000 100 7.58% LIC Housing Finance Ltd 11JUN2020 10,00,000 500 52 500 51 7.59% LIC Housing Finance Ltd 14OCT2021 10,00,000 3,000 306 3,000 309 7.75% LIC Housing Finance Ltd 27AUG2021 10,00,000 1,250 129 1,250 129 7.78% Housing Development Finance Corporation Ltd 24MAR2020 1,00,00,000 100 99 – – 7.79% LIC Housing Finance Ltd 19JUN2020 10,00,000 500 53 500 52 7.80% Housing Development Finance Corporation Ltd 11NOV2019 1,00,00,000 150 153 150 155 7.81% LIC Housing Finance Ltd 27APR2020 10,00,000 2,000 214 2,000 208 7.95% Housing Development Finance Corporation Ltd 23SEP2019 1,00,00,000 50 53 50 53 8.02% LIC Housing Finance Ltd 18FEB2020 10,00,000 500 50 500 51 8.26% Housing Development Finance Corporation Ltd 12AUG2019 1,00,00,000 100 105 100 106 8.34% Housing Development Finance Corporation Ltd 06MAR2019 1,00,00,000 200 215 200 217 8.37% LIC Housing Finance Ltd 03OCT2019 10,00,000 2,000 216 2,000 218 8.37% LIC Housing Finance Ltd 10MAY2021 10,00,000 500 54 500 55 8.43% IDFC Bank Ltd 30JAN2018 10,00,000 – – 1,000 102 8.46% Housing Development Finance Corporation Ltd 11MAR2019 1,00,00,000 50 54 50 54 8.47% LIC Housing Finance Ltd 21JAN2020 10,00,000 500 51 500 52 8.49% Housing Development Finance Corporation Ltd 27APR2020 5,00,000 900 49 900 49 8.50% Housing Development Finance Corporation Ltd 31AUG2020 1,00,00,000 100 108 100 108 8.54% IDFC Bank Ltd 30MAY2018 10,00,000 1,500 194 1,500 182 8.59% Housing Development Finance Corporation Ltd 14JUN2019 1,00,00,000 50 51 50 51 8.60% LIC Housing Finance Ltd 22JUL2020 10,00,000 1,000 107 1,000 108 8.60% LIC Housing Finance Ltd 29JUL2020 10,00,000 1,750 188 1,750 190 8.61% LIC Housing Finance Ltd 11DEC2019 10,00,000 1,000 104 1,000 104 8.66% IDFC Bank Ltd 25JUN2018 10,00,000 1,520 196 1,520 184 8.66% IDFC Bank Ltd 27DEC2018 10,00,000 400 52 400 49 8.72% Housing Development Finance Corporation Ltd 15APR2019 1,00,00,000 75 76 75 77 8.75% Housing Development Finance Corporation Ltd 13JAN2020 5,00,000 5,000 256 5,000 260 8.75% LIC Housing Finance Ltd 14JAN2020 10,00,000 1,070 112 1,070 112 8.75% LIC Housing Finance Ltd 21DEC2020 10,00,000 1,000 102 1,000 104 8.97% LIC Housing Finance Ltd 29OCT2019 10,00,000 500 52 500 53 9.45% Housing Development Finance Corporation Ltd 21AUG2019 10,00,000 3,000 323 3,000 327 9.65% Housing Development Finance Corporation Ltd 19JAN2019 10,00,000 500 52 500 53 TOTAL INVESTMENTS IN NON-CONVERTIBLE DEBENTURES 31,815 3,978 32,715 3,975

Consolidated financial statements | 219 Infosys Annual Report 2017-18
The balances held in certificates of deposit as at March 31, 2018 and March 31, 2017 are as follows : (In ` crore, except as otherwise stated)
Particulars Face value `
As at March 31, 2018 As at March 31, 2017 Units Amount Units Amount
Andhra Bank 1,00,000 – – 35,000 344 Axis Bank 1,00,000 2,08,000 1,985 3,05,600 2,914 Corporation Bank 1,00,000 – – 33,500 327 DBS Bank 1,00,000 – – 5,000 49 HDFC Bank 1,00,000 15,000 147 – – ICICI Bank 1,00,000 1,26,000 1,186 42,500 413 IDFC Bank 1,00,000 – – 1,40,000 1,328 IndusInd Bank 1,00,000 1,35,000 1,271 1,06,400 1,011 Kotak Bank 1,00,000 70,000 680 85,500 813 Vijaya Bank 1,00,000 – – 14,000 137 Yes Bank 1,00,000 – – 60,000 569 TOTAL INVESTMENTS IN CERTIFICATES OF DEPOSIT 5,54,000 5,269 8,27,500 7,905
The balances held in commercial paper as at March 31, 2018 and March 31, 2017 are as follows :in ` crore, except as otherwise stated
Particulars Face value ` As at March 31, 2018 As at March 31, 2017 Units Amount Units Amount
LIC 5,00,000 6,000 293 – – TOTAL INVESTMENTS IN COMMERCIAL PAPER 6,000 293 – –
2.5 Loansin ` crore
Particulars As at March 31,2018 2017
NON-CURRENTUnsecured, considered good
Other loansLoans to employees 36 29
36 29 Unsecured, considered doubtful
Other loansLoans to employees 17 24
53 53 Less : Allowance for doubtful loans to employees 17 24
TOTAL NON-CURRENT LOANS 36 29 CURRENTUnsecured, considered good
Other loansLoans to employees 239 272
TOTAL CURRENT LOANS 239 272 TOTAL LOANS 275 301
2.6 Other financial assetsin ` crore
Particulars As at March 31,2018 2017
NON-CURRENTSecurity deposits(1) 53 86 Rental deposits(1) 171 175 Restricted deposits(1) 60 48 TOTAL NON-CURRENT OTHER FINANCIAL ASSETS 284 309
Particulars As at March 31,2018 2017
CURRENTSecurity deposits(1) 9 10 Rental deposits(1) 13 9 Restricted deposits(1) 1,535 1,416 Unbilled revenues(1) 4,261 3,648 Interest accrued but not due(1) 766 576 Foreign currency forward and options contracts(2)(3) 16 284 Others(1) 84 37 TOTAL CURRENT OTHER FINANCIAL ASSETS 6,684 5,980 TOTAL OTHER FINANCIAL ASSETS 6,968 6,289(1) Financial assets carried at amortized cost 6,952 6,005 (2) Financial assets carried at fair value
through other comprehensive income 12 52 (3) Financial assets carried at fair value
through profit or loss 4 232
Restricted deposits represent deposits with financial institutions to settle employee-related obligations as and when they arise during the normal course of business.
2.7 Trade receivables (1)
in ` crore
Particulars As at March 31,2018 2017
CURRENTUnsecured
Considered good 13,142 12,322 Considered doubtful 354 318
13,496 12,640 Less : Allowances for credit loss 354 318

220 | Consolidated financial statements Infosys Annual Report 2017-18
Particulars As at March 31,2018 2017
TOTAL TRADE RECEIVABLES 13,142 12,322 (1) Includes dues from companies where
directors are interested – 1
2.8 Cash and cash equivalents in ` crore
Particulars As at March 31,2018 2017
Balances with banksIn current and deposit accounts 13,168 14,889
Cash on hand – – Others
Deposits with financial institutions 6,650 7,736
TOTAL CASH AND CASH EQUIVALENTS 19,818 22,625 Cash and cash equivalents included under assets classified under held for sale (Refer to Note 2.25) 53 –
19,871 22,625 Balances with banks in unpaid dividend accounts 22 17 Deposit with more than 12 months maturity 6,332 6,954 Balances with banks held as margin money deposits against guarantees 356 404
Cash and cash equivalents as at March 31, 2018 and March 31, 2017 include restricted cash and bank balances of ` 533 crore and ` 572 crore, respectively. The restrictions are primarily on account of cash and bank balances held by irrevocable trusts controlled by the Company, bank balances held as margin money deposits against guarantees and balances held in unpaid dividend bank accounts.
The deposits maintained by the Group with banks and financial institutions comprise time deposits, which can be withdrawn by the Group at any point without prior notice or penalty on the principal.
The details of balances as on Balance Sheet dates with banks are as follows :
in ` crore
Particulars As at March 31,2018 2017
Current accountsANZ Bank, Taiwan 9 3 Axis Bank, India – 1 Banamex Bank, Mexico 2 2 Banamex Bank, Mexico (US Dollar account) 13 8 Bank Leumi, Israel – 11 Bank Leumi, Israel (US Dollar account) – 2 Bank of America, Mexico 25 54 Bank of America, USA 1,172 1,030 Bank of Baroda, Mauritius 1 – Bank of Tokyo-Mitsubishi UFJ Ltd., Japan 1 –
Particulars As at March 31,2018 2017
Bank Zachodni WBK S.A, Poland 17 4 Barclays Bank, UK 40 1 BNP Paribas Bank, Norway 88 17 China Merchants Bank, China 6 9 Citibank N.A., Australia 223 19 Citibank N.A., Brazil 14 30 Citibank N.A., China 116 61 Citibank N.A., China (US Dollar account) 9 11 Citibank N.A., Costa Rica 1 5 Citibank N.A., Dubai 6 1 Citibank N.A., EEFC (US Dollar account) 4 1 Citibank N.A., Hungary 6 3 Citibank N.A., India 3 3 Citibank N.A., Japan 18 12 Citibank N.A., New Zealand 11 10 Citibank N.A., Philippines (US Dollar account) – 1 Citibank N.A., Portugal 8 2 Citibank N.A., Romania 2 – Citibank N.A., Singapore 4 2 Citibank N.A., South Africa 33 9 Citibank N.A., South Africa (Euro account) 1 1 Citibank N.A., South Korea 2 1 Citibank N.A., USA 3 78 Commerzbank, Germany – 18 Danske Bank, Sweden 1 – Deutsche Bank, Belgium 27 10 Deutsche Bank, Czech Republic 16 8 Deutsche Bank, Czech Republic (Euro account) 3 7 Deutsche Bank, Czech Republic (US Dollar account) 2 30 Deutsche Bank, EEFC (Australian Dollar account) 2 38 Deutsche Bank, EEFC (Euro account) 34 25 Deutsche Bank, EEFC (Swiss Franc account) 2 2 Deutsche Bank, EEFC (US Dollar account) 32 76 Deutsche Bank, EEFC (United Kingdom Pound Sterling account) 9 10 Deutsche Bank, France 19 8 Deutsche Bank, Germany 100 48 Deutsche Bank, Hong Kong 1 – Deutsche Bank, India 44 12 Deutsche Bank, Malaysia 5 7 Deutsche Bank, Netherlands 15 2 Deutsche Bank, Philippines 25 5 Deutsche Bank, Philippines (US Dollar account) 3 4 Deutsche Bank, Poland 18 12 Deutsche Bank, Poland (Euro account) 8 4

Consolidated financial statements | 221 Infosys Annual Report 2017-18
Particulars As at March 31,2018 2017
Deutsche Bank, Russia 3 3 Deutsche Bank, Russia (US Dollar account) 5 1 Deutsche Bank, Singapore 17 6 Deutsche Bank, Spain 1 – Deutsche Bank, Switzerland 29 9 Deutsche Bank, Switzerland (US Dollar account) – 1 Deutsche Bank, United Kingdom 79 26 Deutsche Bank, USA 2 12 HSBC Bank, Brazil – 1 HSBC Bank, Dubai 2 – HSBC Bank, Hong Kong 2 1 HSBC Bank, United Kingdom 6 – ICICI Bank, EEFC (Euro account) 1 1 ICICI Bank, EEFC (US Dollar account) 40 5 ICICI Bank, EEFC (United Kingdom Pound Sterling account) 11 1 ICICI Bank, India 52 53 ING Bank, Belgium – 2 Nordbanken, Sweden 50 33 Punjab National Bank, India 12 6 Raiffeisen Bank, Czech Republic 5 4 Raiffeisen Bank, Romania 3 4 Royal Bank of Canada, Canada 166 83 Santander Bank, Argentina 1 1 Silicon Valley Bank, USA – 4 Silicon Valley Bank (Euro account) – 19 Silicon Valley Bank (United Kingdom Pound Sterling account) – 2 Splitska Banka D.D., Société Générale Group, Croatia 8 – State Bank of India, India 1 7 The Saudi British Bank, Saudi Arabia 3 – Union Bank of Switzerland AG – 3 Union Bank of Switzerland AG (Euro account) – 4 Wells Fargo Bank N.A., USA – 33 Westpac, Australia – 1
2,703 2,044 Deposit accountsAxis Bank – 1,175 Bank BGZ BNP Paribas S.A. 144 183 Barclays Bank 200 825 Canara Bank 84 84 Citibank 224 165 Deutsche Bank, AG 24 – Deutsche Bank, Poland 211 71 HDFC Bank 2,498 469 HSBC Bank – 500 ICICI Bank 3,497 4,644 IDBI Bank 250 1,750 IDFC Bank 1,500 200 IndusInd Bank 1,000 191 Kotak Mahindra Bank – 535
Particulars As at March 31,2018 2017
South Indian Bank 450 450 Standard Chartered Bank – 500 Syndicate Bank – 49 Yes Bank 5 633
10,087 12,424 Unpaid dividend accountsAxis Bank, unpaid dividend account 1 2 HDFC Bank, unpaid dividend account 1 2 ICICI Bank, unpaid dividend account 20 13
22 17 Margin money deposits against guaranteesCanara Bank 151 177 Citibank 3 2 ICICI Bank 202 225
356 404 Deposits with financial institutions HDFC Limited 5,450 7,036 LIC Housing Finance Limited 1,200 700
6,650 7,736 TOTAL CASH AND CASH EQUIVALENTS 19,818 22,625
2.9 Other assetsin ` crore
Particulars As at March 31,2018 2017
NON-CURRENTCapital advances 421 600 Advances other than capital advances
Prepaid gratuity (Refer to Note 2.20.1) 43 79
OthersWithholding taxes and others 1,428 – Prepaid expenses 111 96 Deferred contract cost 262 284
TOTAL NON-CURRENT OTHER ASSETS 2,265 1,059 CURRENTAdvances other than capital advances
Payment to vendors for supply of goods 119 131
OthersWithholding taxes and others 1,032 1,886 Prepaid expenses 472 441 Deferred contract cost 44 78
TOTAL CURRENT OTHER ASSETS 1,667 2,536 TOTAL OTHER ASSETS 3,932 3,595
Deferred contract costs are upfront costs incurred for the contract and are amortized over the term of the contract. Withholding taxes and others primarily consist of input tax credits.

222 | Consolidated financial statements Infosys Annual Report 2017-18
2.10 Financial instruments
Accounting policy
2.10.1 Initial recognitionThe Group recognizes financial assets and financial liabilities when it becomes a party to the contractual provisions of the instrument. All financial assets and liabilities are recognized at fair value on initial recognition, except for trade receivables which are initially measured at transaction price. Transaction costs that are directly attributable to the acquisition or issue of financial assets and financial liabilities, that are not at fair value through profit or loss, are added to the fair value on initial recognition. Regular way purchase and sale of financial assets are accounted for at trade date.
2.10.2 Subsequent measurement
a. Non-derivative financial instruments (i) Financial assets carried at amortized cost
A financial asset is subsequently measured at amortized cost if it is held within a business model whose objective is to hold the asset in order to collect contractual cash flows and the contractual terms of the financial asset give rise on specified dates to cash flows that are solely payments of principal and interest on the principal amount outstanding.
(ii) Financial assets at fair value through other comprehensive income (FVOCI)
A financial asset is subsequently measured at fair value through other comprehensive income if it is held within a business model whose objective is achieved by both collecting contractual cash flows and selling financial assets and the contractual terms of the financial asset give rise on specified dates to cash flows that are solely payments of principal and interest on the principal amount outstanding. The Company has made an irrevocable election for its investments which are classified as equity instruments to present the subsequent changes in fair value in other comprehensive income based on its business model.
(iii) Financial assets at fair value through profit or loss
A financial asset which is not classified in any of the above categories is subsequently fair valued through profit or loss.
(iv) Financial liabilities
Financial liabilities are subsequently carried at amortized cost using the effective interest method, except for contingent consideration recognized in a business combination which is subsequently measured at fair value through profit or loss. For trade and other payables maturing within one year from the Balance Sheet date, the carrying amounts approximate the fair value due to the short maturity of these instruments.
b. Derivative financial instrumentsThe Group holds derivative financial instruments such as foreign exchange forward and options contracts to mitigate the risk of changes in exchange rates on foreign currency exposures. The counterparty for these contracts is generally a bank.
(i) Financial assets or financial liabilities, at fair value through profit or loss.
This category includes derivative financial assets or liabilities which are not designated as hedges.
Although the Group believes that these derivatives constitute hedges from an economic perspective, they may not qualify for hedge accounting under Ind AS 109, Financial Instruments. Any derivative that is either not designated as hedge, or is so designated but is ineffective as per Ind AS 109, is categorized as a financial asset or financial liability, at fair value through profit or loss.
Derivatives not designated as hedges are recognized initially at fair value and attributable transaction costs are recognized in net profit in the consolidated Statement of Profit and Loss when incurred. Subsequent to initial recognition, these derivatives are measured at fair value through profit or loss and the resulting exchange gains or losses are included in other income. Assets / liabilities in this category are presented as current assets / current liabilities if they are either held for trading or are expected to be realized within 12 months after the Balance Sheet date.
(ii) Cash flow hedge
The Group designates certain foreign exchange forward and options contracts as cash flow hedges to mitigate the risk of foreign exchange exposure on highly probable forecast cash transactions.
When a derivative is designated as a cash flow hedging instrument, the effective portion of changes in the fair value of the derivative is recognized in other comprehensive income and accumulated in the cash flow hedging reserve. Any ineffective portion of changes in the fair value of the derivative is recognized immediately in the net profit in the Consolidated Statement of Profit and Loss. If the hedging instrument no longer meets the criteria for hedge accounting, then hedge accounting is discontinued prospectively. If the hedging instrument expires or is sold, terminated or exercised, the cumulative gain or loss on the hedging instrument recognized in cash flow hedging reserve till the period the hedge was effective remains in cash flow hedging reserve until the forecasted transaction occurs. The cumulative gain or loss previously recognized in the cash flow hedging reserve is transferred to the net profit in the Consolidated Statement of Profit and Loss upon the occurrence of the related forecasted transaction. If the forecasted transaction is no longer expected to occur, then the amount accumulated in cash flow hedging reserve is reclassified to net profit in the Consolidated Statement of Profit and Loss.
c. Share capital and treasury shares (i) Ordinary shares
Ordinary shares are classified as equity. Incremental costs directly attributable to the issuance of new ordinary shares and share options and buyback of ordinary shares are recognized as a deduction from equity, net of any tax effects.
(ii) Treasury shares
When any entity within the Group purchases the Company’s ordinary shares, the consideration paid including any directly attributable incremental cost, is presented as a deduction

Consolidated financial statements | 223 Infosys Annual Report 2017-18
from total equity, until they are cancelled, sold or reissued. When treasury shares are sold or reissued subsequently, the amount received is recognized as an increase in equity, and the resulting surplus or deficit on the transaction is transferred to / from share premium.
2.10.3 Derecognition of financial instrumentsThe Group derecognizes a financial asset when the contractual rights to the cash flows from the financial asset expire or it transfers the financial asset and the transfer qualifies for derecognition under Ind AS 109. A financial liability (or a part of a financial liability) is derecognized from the Group’s Balance Sheet when the obligation specified in the contract is discharged or cancelled or expires.
2.10.4 Fair value of financial instrumentsIn determining the fair value of its financial instruments, the Group uses a variety of methods and assumptions that are based on market conditions and risks existing at each reporting date. The methods used to determine fair value include discounted cash flow analysis, available quoted market prices and dealer quotes. All methods of assessing fair value result in general approximation of value, and such value may never actually be realized.
Refer to table ‘Financial instruments by category’ below for the disclosure on carrying value and fair value of financial assets and liabilities. For financial assets and liabilities maturing within one year from the Balance Sheet date and which are not carried at fair value, the carrying amounts approximates fair value due to the short maturity of those instruments.
2.10.5 Impairment The Group recognizes loss allowances using the expected credit loss (ECL) model for the financial assets which are not fair valued through profit or loss. Loss allowance for trade receivables with no significant financing component is measured at an amount equal to lifetime ECL. For all other financial assets, expected credit losses are measured at an amount equal to the 12-month ECL, unless there has been a significant increase in credit risk from initial recognition in which case those are measured at lifetime ECL. The amount of expected credit losses (or reversal) that is required to adjust the loss allowance at the reporting date to the amount that is required to be recognized is recognized as an impairment gain or loss in Consolidated Statement of Profit and Loss.
Financial instruments by category The carrying value and fair value of financial instruments by categories as at March 31, 2018 is as follows :
in ` crore
Particulars Amortized cost
Financial assets / liabilities at fair value through profit or loss
Financial assets / liabilities at fair value
through OCI
Total carrying
value
Total fair
value
Designated upon initial recognition
Mandatory Equity instruments designated
upon initial recognition
Mandatory
ASSETSCash and cash equivalents (Refer to Note 2.8) 19,818 – – – – 19,818 19,818 Investments (Refer to Note 2.4)
Preference securities and equity instruments – – – 138 – 138 138 Tax-free bonds and government bonds 1,897 – – – – 1,897 (1) 2,151Liquid mutual fund units – – 81 – – 81 81 Non-convertible debentures – – – – 3,978 3,978 3,978 Certificates of deposit – – – – 5,269 5,269 5,269 Commercial paper – – – – 293 293 293 Convertible promissory note – – 12 – – 12 12 Other investments – – 66 – – 66 66 Fixed maturity plan securities – – 429 – – 429 429
Trade receivables (Refer to Note 2.7) 13,142 – – – – 13,142 13,142 Loans (Refer to Note 2.5) 275 – – – – 275 275 Other financial assets (Refer to Note 2.6) 6,952 – 4 – 12 6,968 (2) 6,884 TOTAL 42,084 – 592 138 9,552 52,366 52,536

224 | Consolidated financial statements Infosys Annual Report 2017-18
Particulars Amortized cost
Financial assets / liabilities at fair value through profit or loss
Financial assets / liabilities at fair value
through OCI
Total carrying
value
Total fair
value
Designated upon initial recognition
Mandatory Equity instruments designated
upon initial recognition
Mandatory
LIABILITIESTrade payables 694 – – – – 694 694 Other financial liabilities (Refer to Note 2.12) 5,442 – 93 – 3 5,538 5,538 TOTAL 6,136 – 93 – 3 6,232 6,232
(1) On account of fair value changes including interest accrued(2) Excludes interest accrued on tax-free bonds and government bonds
The carrying value and fair value of financial instruments by categories as at March 31, 2017 were as follows : in ` crore
Particulars Amortized cost
Financial assets / liabilities at fair value through profit or loss
Financial assets / liabilities at fair value
through OCI
Total carrying
value
Total fair
value
Designated upon initial recognition
Mandatory Equity instruments designated
upon initial recognition
Mandatory
ASSETSCash and cash equivalents (Refer to Note 2.8) 22,625 – – – – 22,625 22,625 Investments (Refer to Note 2.4)
Preference securities and equity instruments – – – 159 – 159 159 Tax-free bonds and government bonds 1,907 – – – – 1,907 (1) 2,168
Liquid mutual fund units – – 1,803 – – 1,803 1,803 Non-convertible debentures – – – – 3,975 3,975 3,975 Certificates of deposit – – – – 7,905 7,905 7,905 Convertible promissory note – – 10 – – 10 10 Other investments – – 35 – – 35 35 Fixed maturity plan securities – – 558 – – 558 558
Trade receivables (Refer to Note 2.7) 12,322 – – – – 12,322 12,322 Loans (Refer to Note 2.5) 301 – – – – 301 301 Other financial assets (Refer to Note 2.6) 6,005 – 232 – 52 6,289 (2) 6,205TOTAL 43,160 – 2,638 159 11,932 57,889 58,066 LIABILITIESTrade payables 367 – – – – 367 367 Other financial liabilities (Refer to Note 2.12) 4,973 – 87 – – 5,060 5,060 TOTAL 5,340 – 87 – – 5,427 5,427
(1) On account of fair value changes including interest accrued(2) Excludes interest accrued on tax-free bonds and government bonds
Fair value hierarchy
Level 1 – Quoted prices (unadjusted) in active markets for identical assets or liabilities.
Level 2 – Inputs other than quoted prices included within Level 1 that are observable for the asset or liability, either directly (i.e. as prices) or indirectly (i.e. derived from prices).
Level 3 – Inputs for the assets or liabilities that are not based on observable market data (unobservable inputs).

Consolidated financial statements | 225 Infosys Annual Report 2017-18
The fair value hierarchy of assets and liabilities as at March 31, 2018 is as follows :in ` crore
Particulars As at March 31,
2018
Fair value measurement at end of the reporting period / year using
Level 1 Level 2 Level 3ASSETS Investments in liquid mutual funds units (Refer to Note 2.4) 81 81 – – Investments in tax-free bonds (Refer to Note 2.4) 2,150 1,878 272 – Investments in government bonds (Refer to Note 2.4) 1 1 – – Investments in equity instruments (Refer to Note 2.4) 22 – – 22 Investments in preference securities (Refer to Note 2.4) 116 – – 116 Investments in non-convertible debentures (Refer to Note 2.4) 3,978 2,695 1,283 – Investments in certificates of deposit (Refer to Note 2.4) 5,269 – 5,269 – Investments in commercial paper (Refer to Note 2.4) 293 – 293 – Investments in fixed maturity plan securities (Refer to Note 2.4) 429 – 429 – Investments in convertible promissory note (Refer to Note 2.4) 12 – – 12 Other investments (Refer to Note 2.4) 66 – – 66 Derivative financial instruments – gain on outstanding foreign currency forward and options contracts (Refer to Note 2.6) 16 – 16 – LIABILITIESDerivative financial instruments – loss on outstanding foreign currency forward and options contracts (Refer to Note 2.12) 42 – 42 – Liability towards contingent consideration (Refer to Note 2.12)(1)(2) 54 – – 54
(1) Pertains to contingent consideration payable to selling shareholders of Kallidus and Brilliant Basics Holdings Limited as per the share purchase agreement(2) Includes ` 21 crore pertaining to acquisition of Brilliant Basics discounted at 10%
During the year ended March 31, 2018, tax-free bonds and non-convertible debentures of ` 1,797 crore were transferred from Level 2 to Level 1 of fair value hierarchy, since these were valued based on quoted price and ` 850 crore were transferred from Level 1 to Level 2 of fair value hierarchy, since these were valued based on market observable inputs.
The fair value hierarchy of assets and liabilities as at March 31, 2017 was as follows :in ` crore
Particulars As at March 31,
2017
Fair value measurement at end of the reporting period / year using
Level 1 Level 2 Level 3ASSETSInvestments in liquid mutual funds units (Refer to Note 2.4) 1,803 1,803 – –Investments in tax-free bonds (Refer to Note 2.4) 2,159 282 1,877 –Investments in government bonds (Refer to Note 2.4) 9 9 – –Investments in equity instruments (Refer to Note 2.4) 15 – – 15Investments in preference securities (Refer to Note 2.4) 144 – – 144Investments in non-convertible debentures (Refer to Note 2.4) 3,975 3,371 604 –Investments in certificates of deposit (Refer to Note 2.4) 7,905 – 7,905 –Investments in fixed maturity plan securities (Refer to Note 2.4) 558 – 558 –Investments in convertible promissory notes (Refer to Note 2.4) 10 – – 10Other investments (Refer to Note 2.4) 35 – – 35Derivative financial instruments - gain on outstanding foreign currency forward and options contracts (Refer to Note 2.6) 284 – 284 –LIABILITIESDerivative financial instruments - loss on outstanding foreign currency forward and options contracts (Refer to Note 2.12) 2 – 2 –Liability towards contingent consideration (Refer to Note 2.12)(1)(2) 85 – – 85
(1) Pertains to contingent consideration payable to selling shareholders of Kallidus as per the share purchase agreement.(2) Discounted ` 91 crore at 14.2%
During the year ended March 31, 2017, tax-free bonds of ` 115 crore were transferred from Level 1 to Level 2 of fair value hierarchy, since these were valued based on market observable inputs.
A one percentage point change in the unobservable inputs used in fair valuation of Level 3 assets and liabilities does not have a significant impact in its value.
The movement in contingent consideration as at March 31, 2018 from March 31, 2017 is mainly on account of settlement of ` 45 crore pertaining to Kallidus acquisition and addition of ` 17 crore in relation to acquisition of Brilliant Basics Holdings Limited (Refer to Note 2.3)

226 | Consolidated financial statements Infosys Annual Report 2017-18
Financial risk management Financial risk factors
The Group’s activities expose it to a variety of financial risks : market risk, credit risk and liquidity risk. The Group’s primary focus is to foresee the unpredictability of financial markets and seek to minimize potential adverse effects on its financial performance. The primary market risk to the Group is foreign exchange risk. The Group uses derivative financial instruments to mitigate foreign exchange related risk exposures. The Group’s exposure to credit risk is influenced mainly by the individual characteristic of each customer and the concentration of risk from the top few customers.
Market risk
The Group operates internationally and a major portion of the business is transacted in several currencies and consequently the Group is exposed to foreign exchange risk through its sales and services in the United States and elsewhere, and purchases from overseas suppliers in various foreign currencies. The Group holds derivative financial instruments such as foreign exchange forward and options contracts to mitigate the risk of changes in exchange rates on foreign currency exposures. The exchange rate between the Indian rupee and foreign currencies has changed substantially in recent years and may fluctuate substantially in the future. Consequently, the results of the Group’s operations are adversely affected as the rupee appreciates / depreciates against these currencies.
The foreign currency risk from financial instruments as at March 31, 2018 is as follows : in ` crore
Particulars USD Euro GBP AUD Other currencies
Total
Cash and cash equivalents 1,287 218 147 353 1,192 3,197 Trade receivables 8,317 1,751 845 788 781 12,482 Other financial assets (including loans) 2,636 663 330 173 470 4,272 Trade payables (273) (81) (114) (30) (58) (556)Other financial liabilities (2,289) (417) (215) (273) (596) (3,790)Net assets / (liabilities) 9,678 2,134 993 1,011 1,789 15,605
The foreign currency risk from financial instruments as at March 31, 2017 was as follows :in ` crore
Particulars USD Euro GBP AUD Other currencies
Total
Cash and cash equivalents 1,334 131 36 183 700 2,384 Trade receivables 8,345 1,244 775 561 702 11,627 Other financial assets (including loans) 2,862 535 372 159 403 4,331 Trade payables (115) (32) (13) (5) (158) (323)Other financial liabilities (2,129) (406) (211) (211) (547) (3,504)Net assets / (liabilities) 10,297 1,472 959 687 1,100 14,515
Sensitivity analysis between Indian rupee and USD
Particulars Year ended March 31,2018 2017
Impact on the Group’s incremental operating margins 0.50% 0.50%
Sensitivity analysis is computed based on the changes in the income and expenses in foreign currency upon conversion into functional currency, due to exchange rate fluctuations between the previous reporting period and the current reporting period.
Derivative financial instruments
The Group holds derivative financial instruments such as foreign currency forward and options contracts to mitigate the risk of changes in exchange rates on foreign currency exposures. The counterparty for these contracts is generally a bank. These derivative financial instruments are valued based on quoted prices for similar assets and liabilities in active markets or inputs that are directly or indirectly observable in the marketplace.
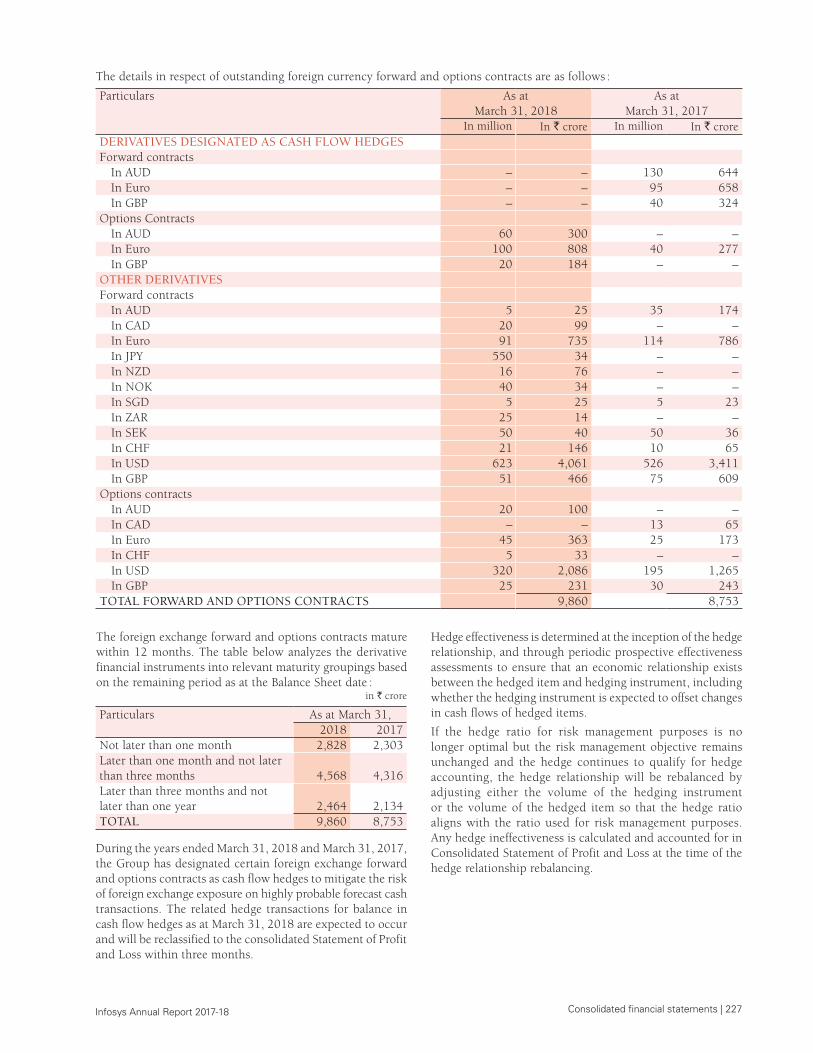
Consolidated financial statements | 227 Infosys Annual Report 2017-18
The details in respect of outstanding foreign currency forward and options contracts are as follows :
Particulars As at March 31, 2018
As at March 31, 2017
In million In ` crore In million In ` croreDERIVATIVES DESIGNATED AS CASH FLOW HEDGESForward contracts
In AUD – – 130 644 In Euro – – 95 658 In GBP – – 40 324
Options ContractsIn AUD 60 300 – – In Euro 100 808 40 277In GBP 20 184 – –
OTHER DERIVATIVESForward contracts
In AUD 5 25 35 174In CAD 20 99 – – In Euro 91 735 114 786In JPY 550 34 – – In NZD 16 76 – – In NOK 40 34 – – In SGD 5 25 5 23In ZAR 25 14 – – In SEK 50 40 50 36In CHF 21 146 10 65In USD 623 4,061 526 3,411In GBP 51 466 75 609
Options contractsIn AUD 20 100 – – In CAD – – 13 65 In Euro 45 363 25 173 In CHF 5 33 – – In USD 320 2,086 195 1,265 In GBP 25 231 30 243
TOTAL FORWARD AND OPTIONS CONTRACTS 9,860 8,753
The foreign exchange forward and options contracts mature within 12 months. The table below analyzes the derivative financial instruments into relevant maturity groupings based on the remaining period as at the Balance Sheet date :
in ` crore
Particulars As at March 31,2018 2017
Not later than one month 2,828 2,303 Later than one month and not later than three months 4,568 4,316 Later than three months and not later than one year 2,464 2,134 TOTAL 9,860 8,753
During the years ended March 31, 2018 and March 31, 2017, the Group has designated certain foreign exchange forward and options contracts as cash flow hedges to mitigate the risk of foreign exchange exposure on highly probable forecast cash transactions. The related hedge transactions for balance in cash flow hedges as at March 31, 2018 are expected to occur and will be reclassified to the consolidated Statement of Profit and Loss within three months.
Hedge effectiveness is determined at the inception of the hedge relationship, and through periodic prospective effectiveness assessments to ensure that an economic relationship exists between the hedged item and hedging instrument, including whether the hedging instrument is expected to offset changes in cash flows of hedged items.
If the hedge ratio for risk management purposes is no longer optimal but the risk management objective remains unchanged and the hedge continues to qualify for hedge accounting, the hedge relationship will be rebalanced by adjusting either the volume of the hedging instrument or the volume of the hedged item so that the hedge ratio aligns with the ratio used for risk management purposes. Any hedge ineffectiveness is calculated and accounted for in Consolidated Statement of Profit and Loss at the time of the hedge relationship rebalancing.

228 | Consolidated financial statements Infosys Annual Report 2017-18
The reconciliation of cash flow hedge reserve is as follows :in ` crore
Particulars Year ended March 31,2018 2017
Gain / (Loss)Balance at the beginning of the year 39 – Gain / (Loss) recognized in other comprehensive income during the year (93) 121 Amount reclassified to profit and loss during the year 41 (69)Tax impact on above 13 (13)Balance at the end of the year – 39
The Group offsets a financial asset and a financial liability when it currently has a legally enforceable right to set off the recognized amounts and the Group intends either to settle on a net basis, or to realize the asset and settle the liability simultaneously.
The quantitative information about offsetting of derivative financial assets and derivative financial liabilities is as follows :
in ` crore
Particulars As at March 31,2018 2017
Derivative financial
asset
Derivative financial liability
Derivative financial
asset
Derivative financial liability
Gross amount of recognized financial asset / liability 20 (46) 285 (3)Amount set off (4) 4 (1) 1 Net amount presented in Balance Sheet 16 (42) 284 (2)
Credit risk
Credit risk refers to the risk of default on its obligation by the counterparty resulting in a financial loss. The maximum exposure to the credit risk at the reporting date is primarily from trade receivables amounting to ` 13,142 crore and ` 12,322 crore as at March 31, 2018 and March 31, 2017, respectively and unbilled revenues amounting to ` 4,261 crore and ` 3,648 crore as at March 31, 2018 and March 31, 2017, respectively. Trade receivables and unbilled revenues are typically unsecured and are derived from revenue earned from customers primarily located in the United States. Credit risk has always been managed by the Group through credit approvals, establishing credit limits and continuously monitoring the creditworthiness of customers to which the Group grants credit terms in the normal course of business. As per Ind AS 109, the Group uses ECL model to assess the impairment loss or gain. The Group uses a provision matrix to compute the ECL allowance for trade receivables and unbilled revenues. The provision matrix takes into account available external and internal credit risk factors such as credit default swap quotes, credit ratings from international credit rating agencies and the Group’s historical experience for customers.
The details in respect of percentage of revenues generated from top customer and top 10 customers are as follows :
(In %)
Particulars Year ended March 31,2018 2017
Revenue from top customer 3.4 3.4Revenue from top 10 customers 19.3 21.0
Credit risk exposure
The allowance of lifetime ECL on customer balances for the years ended March 31, 2018 and March 31, 2017 was ` 34 crore and ` 132 crore, respectively.
The movement in credit loss allowance on customer balances is as follows :
in ` crore
Particulars Year ended March 31,2018 2017
Balance at the beginning 411 289 Impairment loss recognized 34 132 Write-offs (5) (1)Reclassified under held for sale (Refer to Note 2.25) (1) – Translation differences 10 (9)Balance at the end 449 411
Credit exposure
The Company’s credit period generally ranges from 30-60 days. in ` crore
As at March 31,2018 2017
Trade receivables 13,142 12,322 Unbilled revenues 4,261 3,648
Days sales outstanding was 67 days and 68 days as of March 31, 2018 and March 31, 2017, respectively.
Credit risk on cash and cash equivalents is limited as we generally invest in deposits with banks and financial institutions with high credit ratings assigned by international and domestic credit rating agencies. Investments primarily include investment in liquid mutual fund units, fixed maturity plan securities, certificates of deposit, quoted bonds issued by government and quasi-government organizations, commercial paper and non-convertible debentures.
Liquidity risk
The Group’s principal sources of liquidity are cash and cash equivalents and the cash flow that is generated from operations. The Group has no outstanding borrowings. The Group believes that the working capital is sufficient to meet its current requirements.
As at March 31, 2018, the Group had a working capital of ` 34,176 crore including cash and cash equivalents of ` 19,818 crore and current investments of ̀ 6,407 crore. As at March 31, 2017, the Group had a working capital of ` 39,692 crore including cash and cash equivalents of ` 22,625 crore and current investments of ` 9,970 crore.

Consolidated financial statements | 229 Infosys Annual Report 2017-18
As at March 31, 2018 and March 31, 2017, the outstanding compensated absences were ` 1,469 crore and ` 1,359 crore, respectively, which have been substantially funded. Accordingly, no liquidity risk is perceived.
The details regarding the contractual maturities of significant financial liabilities as at March 31, 2018 are as follows : in ` crore
Particulars Less than 1 year 1-2 years 2-4 years 4-7 years Total Trade payables 694 – – – 694 Other financial liabilities (excluding liability towards acquisition) (Refer to Note 2.12) 5,442 – – – 5,442 Liability towards acquisitions on an undiscounted basis (contingent consideration) (Refer to Note 2.12) 41 7 7 – 55
The details regarding the contractual maturities of significant financial liabilities as at March 31, 2017 are as follows : in ` crore
Particulars Less than 1 year 1-2 years 2-4 years 4-7 years Total Trade payables 367 – – – 367 Other financial liabilities (excluding liability towards acquisition) (Refer to Note 2.12) 4,943 31 – – 4,974 Liability towards acquisitions on an undiscounted basis (contingent consideration) (Refer to Note 2.12) 45 46 – – 91
2.11 Equity
Share capitalin ` crore, except as otherwise stated
Particulars As at March 31,2018 2017
AuthorizedEquity shares, ` 5 par value 240,00,00,000 (240,00,00,000) equity shares 1,200 1,200 Issued, subscribed and paid-upEquity shares, ` 5 par value (1) 217,33,12,301 (228,56,55,150) equity shares fully paid-up(2) 1,088 1,144
1,088 1,144
Note : Forfeited shares amounted to ` 1,500 (` 1,500)(1) Refer to Note 2.21 for details of basic and diluted shares(2) Net of treasury shares 1,08,01,956 (1,12,89,514)
The Company has only one class of shares referred to as equity shares having a par value of ` 5. Each holder of equity shares is entitled to one vote per share. The equity shares represented by ADSs carry similar rights to voting and dividends as the other equity shares. Each ADS represents one underlying equity share.
In the period of five years immediately preceding March 31, 2018 :
• The Company has allotted 114,84,72,332 and 57,42,36,166 fully paid-up shares of face value ` 5 each during the quarter ended June 30, 2015 and December 31, 2014, pursuant to bonus issue approved by the shareholders through a postal ballot. For both the bonus issues, bonus share of one equity share for every equity share held, and a stock dividend of one ADS for every ADS held, respectively, have been allotted. Consequently, the ratio of equity shares underlying the ADSs held by an American Depositary Receipt holder remains unchanged. Options granted under the restricted stock unit plan (RSU) have been adjusted for bonus shares.
In the event of liquidation of the Company, the holders of equity shares will be entitled to receive any of the remaining assets of the Company in proportion to the number of equity shares held by the shareholders, after distribution of all preferential amounts. However, no such preferential amounts exist currently, other than the amounts held by irrevocable controlled trusts. For irrevocable controlled trusts, the corpus would be settled in favour of the beneficiaries.
Dividend
The final dividend on shares is recorded as a liability on the date of approval by the shareholders and interim dividends are recorded as a liability on the date of declaration by the Company’s Board of Directors.
The Company declares and pays dividends in Indian rupees. The remittance of dividends outside India is governed by Indian law on foreign exchange and is subject to applicable distribution taxes. Dividend distribution tax paid by subsidiaries may be reduced / available as credit against dividend distribution tax payable by Infosys Limited.
Amount of per share dividend recognized as distribution to equity shareholders :
in `
Particulars Year ended March 31,2018 2017
Final dividend for fiscal 2016 – 14.25 Interim dividend for fiscal 2017 – 11.00 Final dividend for fiscal 2017 14.75 – Interim dividend for fiscal 2018 13.00 –
Effective from fiscal 2018, the Company’s policy is to pay out up to 70% of the free cash flow of the corresponding financial year in such manner (including by way of dividend and / or share buyback) as may be decided by the Board from time to time, subject to applicable laws and requisite approvals, if any. Free cash flow is defined as net cash provided by operating activities less capital expenditure as per the consolidated Statement of Cash Flows prepared under IFRS. Dividend payout includes dividend distribution tax.

230 | Consolidated financial statements Infosys Annual Report 2017-18
The Board of Directors recommended a final dividend of ` 20.50 per equity share for the financial year ended March 31, 2018 and a special dividend of ` 10 per equity share. The payment is subject to the approval of the shareholders in the ensuing Annual General Meeting of the Company, to be held on June 23, 2018 and if approved would result in a cash outflow of approximately ` 7,949 crore, (excluding dividend paid on treasury shares) including dividend distribution tax.
The Board of Directors, at its meeting on October 24, 2017, declared an interim dividend of ` 13 per equity share which resulted in a net cash outflow of approximately ` 3,408 crore (excluding dividend paid on treasury shares) inclusive of dividend distribution tax.
Buyback
The Board, at its meeting on August 19, 2017, approved a proposal for the Company to buy back its fully paid-up equity shares of face value of ` 5 each from the eligible equity shareholders of the Company for an amount not exceeding ` 13,000 crore. The shareholders approved the said proposal of buyback of equity shares through a postal ballot that concluded on October 7, 2017. The buyback offer comprised a purchase of 11,30,43,478 equity shares aggregating 4.92% of the paid-up equity share capital of the Company at a price
of ` 1,150 per equity share. The buyback was offered to all eligible equity shareholders (including those who became equity shareholders as on the record date by cancelling ADSs and withdrawing underlying equity shares) of the Company as on the record date (i.e November 1, 2017) on a proportionate basis through the ‘Tender offer’ route. The Company concluded the buyback procedures on December 27, 2017 and 11,30,43,478 equity shares were extinguished. The Company has utilized securities premium and general reserve for the buyback of its shares. In accordance with Section 69 of the Companies Act, 2013, the Company has created a Capital Redemption Reserve of ` 56 crore equal to the nominal value of the shares bought back as an appropriation from the general reserve.
The Company’s objective when managing capital is to safeguard its ability to continue as a going concern and to maintain an optimal capital structure so as to maximize shareholder value. In order to maintain or achieve an optimal capital structure, the Company may adjust the amount of dividend payment, return capital to shareholders, issue new shares or buy back issued shares. As of March 31, 2018, the Company has only one class of equity shares and has no debt. Consequent to the above capital structure, there are no externally imposed capital requirements.
The details of shareholder holding more than 5% shares as at March 31, 2018 and March 31, 2017 are as follows :
Name of the shareholder As at March 31, 2018 As at March 31, 2017No. of shares % held No. of shares % held
Deutsche Bank Trust Company Americas (Depository of ADRs – legal ownership) 37,99,05,859 17.39 38,33,17,937 16.69Life Insurance Corporation of India 14,95,14,017 6.85 16,14,36,123 7.03
The reconciliation of the number of shares outstanding and the amount of share capital as at March 31, 2018 and March 31, 2017 is as follows :
in ` crore, except as stated otherwise
Particulars As at March 31, 2018 As at March 31, 2017No. of shares Amount No. of shares Amount
At the beginning of the period 228,56,55,150 1,144 228,56,21,088 1,144 Add : Shares issued on exercise of employee stock options 7,00,629 – 34,062 – Less : Shares bought back 11,30,43,478 56 – – At the end of the period 217,33,12,301 1,088 228,56,55,150 1,144
Employee Stock Option Plan (ESOP)
Accounting policyThe Group recognizes compensation expense relating to share-based payments in net profit using fair value in accordance with Ind AS 102, Share‑based Payment. The estimated fair value of awards is charged to income on a straight-line basis over the requisite service period for each separately vesting portion of the award as if the award was in-substance, multiple awards with a corresponding increase to share options outstanding account.
Amendment to Ind AS 102 :
Effective April 1, 2017, the Group adopted amendment to Ind AS 102 which provides specific guidance to measurement of cash-settled awards, modification of cash-settled awards and awards that include a net settlement feature in respect of
withholding taxes. The adoption of amendment did not have any material effect on the consolidated financial statements.
2015 Stock Incentive Compensation Plan (‘the 2015 Plan’) (formerly 2011 RSU Plan) :
On March 31, 2016, pursuant to the approval by the shareholders through a postal ballot, the Board has been authorized to introduce, offer, issue and allot share-based incentives to eligible employees of the Company and its subsidiaries under the 2015 Plan. The maximum number of shares under the 2015 Plan shall not exceed 2,40,38,883 equity shares (this includes 1,12,23,576 equity shares which are held by the trust towards the 2011 Plan as at March 31, 2016). Out of this, 1,70,38,883 equity shares will be issued as RSUs at par value and 70,00,000 equity shares will be issued as stock options at market price on the date of the grant. These instruments will generally vest over a period of

Consolidated financial statements | 231 Infosys Annual Report 2017-18
four years and the Company expects to grant the instruments under the 2015 Plan over the period of four to seven years.
Controlled trust holds 1,08,01,956 and 1,12,89,514 shares as at March 31, 2018 and March 31, 2017, respectively under the 2015 Plan, out of which 1,00,000 equity shares have been earmarked for welfare activities of the employees.
Stock incentives granted to Salil Parekh (Chief Executive Officer and Managing Director)
Pursuant to the approval of the shareholders through a postal ballot on February 20, 2018, Salil Parekh (CEO & MD) is eligible to receive under the 2015 Plan, a) an annual grant of RSUs of fair value ` 3.25 crore which will vest over time in three equal annual installments upon completion of each year of service from the respective grant date, b) a one-time grant of RSUs of fair value ` 9.75 crore which will vest over time in two equal annual installments upon completion of each year of service from the grant date, and c) annual grant of performance-based RSUs of fair value ` 13 crore which will vest after completion of three years, the first of which concludes on March 31, 2021, subject to the achievement of performance targets set by the Board or its committee.
The Board, based on the recommendations of the nomination and remuneration committee, approved on February 27, 2018, the annual time-based grant for fiscal 2018 of 28,256 RSUs and the one-time time-based grant of 84,768 RSUs. The grants were made effective February 27, 2018. Though the annual time-based grants for the remaining employment term have not been granted as of March 31, 2018 , in accordance with Ind AS 102, Share‑based Payment, the Company has recorded employment stock compensation expense.
Stock incentives granted to Dr. Vishal Sikka
Consequent to Dr. Vishal Sikka’s resignation from the Company on August 24, 2017, the unvested stock incentives (time-based and performance-based awards) granted to him were forfeited.
Stock incentives granted to COO
The nomination and remuneration committee (‘the Committee’), at its meeting held on October 14, 2016 recommended a grant of 27,250 RSUs and 43,000 ESOPs amounting to ` 4 crore to U.B. Pravin Rao, under the 2015 Plan and the same was approved by the shareholders through a postal ballot on March 31, 2017. These RSUs and ESOPs have been granted effective May 2, 2017. These RSUs and stock options would vest over a period of four years and shall be exercisable within the period as approved by the Committee. The exercise price of the RSUs will be equal to the par value of the shares and the exercise price of the stock options would be the market price as on the date of grant, as approved by the shareholders.
Stock incentives granted to KMP (other than CEO, Dr. Vishal Sikka, and COO)
On November 1, 2016, the Company granted 2,47,250 RSUs and 5,02,550 stock options under the 2015 Plan, to key managerial personnel (KMP), other than Dr. Vishal Sikka and
the COO, based on fiscal 2016 performance. On August 1, 2017, the Company granted 58,150 RSUs and 44,450 ESOPs to KMP. These RSUs and stock options will generally vest over a period of four years and shall be exercisable within the period as approved by the Committee. The exercise price of the RSUs will be equal to the par value of the shares and the exercise price of the stock options would be the market price as on the date of grant. On February 27, 2018, based on the recommendation and approval of the nomination and remuneration committee, the Company granted 2,14,950 RSUs to the KMP other than CEO and COO. These instruments will vest over a period of four years and are subject to continued service.
During the year ended March 31, 2018, three of the KMP have resigned (Refer to Note 2.23, Related party transactions for further details) and hence, the RSUs and stock options granted to them were forfeited.
Stock incentive granted to employees other than KMP
During fiscal 2017, the Company granted 25,06,740 RSUs and 7,03,300 ESOPs and 1,12,210 incentive units (cash-settled) to certain eligible employees at mid and senior levels under the 2015 Plan. Further, on May 2, 2017, the Company granted 37,090 RSUs (includes equity shares and equity shares represented by ADS) at par value, 73,600 employee stock options (ESOPs) (including equity shares and equity shares represented by ADS) to be exercised at market price at the time of grant, to certain employees at the senior management level. On August 1, 2017, the Company granted 7,450 incentive units (cash-settled) to employees at the senior management level. These instruments will vest over a period of four years and are subject to continued service. On February 27, 2018 15,59,920 RSUs and 42,590 incentive units (cash-settled) were granted to eligible employees. These instruments will vest over a period of 4 years and are subject to continued service.
As at March 31, 2018 and March 31, 2017, 1,11,757 and 1,06,845 incentive units were outstanding (net of forfeitures).
The break-up of employee stock compensation expense is as follows :
in ` crore
Particulars Year ended March 31, 2018 2017
Granted to KMP(2) (13) 36 Employees other than KMP 97 81 TOTAL(1) 84 117
(1) Cash-settled stock compensation expense included above is ` 5 crore and ` 1 crore in the years ended March 31, 2018 and March 31, 2017, respectively.
(2) Includes a reversal of stock compensation cost of ` 35 crore towards forfeiture of stock incentives granted to Dr. Vishal Sikka upon his resignation
The carrying value of liability towards cash-settled, share-based payments was ` 6 crore and ` 3 crore as at March 31, 2018 and March 31, 2017, respectively.

232 | Consolidated financial statements Infosys Annual Report 2017-18
The activity in the 2015 Plan (formerly 2011 RSU Plan) for equity-settled, share-based payment transactions during the year ended March 31, 2018 is as follows :
Particulars Year ended March 31, 2018Shares arising out of options
Weighted average exercise
price (`)2015 Plan : Restricted Stock Units (RSUs)Outstanding at the beginning 29,61,373 5 Granted 22,80,608 5 Exercised 6,48,217 5 Forfeited and expired 8,43,355 5 Outstanding at the end 37,50,409 5 Exercisable at the end 24,205 5 2015 Plan : Employee Stock Options (ESOPs)Outstanding at the beginning 11,97,650 992 Granted 4,91,575 943 Exercised 52,412 983 Forfeited and expired 6,69,900 961 Outstanding at the end 9,66,913 986 Exercisable at the end 1,96,912 992
The activity in the 2015 Plan (formerly 2011 RSU Plan) for equity-settled, share-based payment transactions during the year ended March 31, 2017 was as follows :
Particulars Year ended March 31, 2017Shares arising out of options
Weighted average exercise
price (`)2015 Plan : RSUsOutstanding at the beginning 2,21,505 5 Granted 28,74,690 5 Forfeited and expired 1,00,760 5 Exercised 34,062 5 Outstanding at the end 29,61,373 5 Exercisable at the end – – 2015 Plan : ESOPsOutstanding at the beginning – – Granted 12,05,850 992 Forfeited and expired 8,200 992 Exercised – – Outstanding at the end 11,97,650 992 Exercisable at the end – –
During the years ended March 31, 2018, and March 31, 2017, the weighted average share price of options exercised under the 2015 Plan on the date of exercise was ` 992 and ` 1,084, respectively.
The summary of information about equity-settled RSUs and ESOPs outstanding as at March 31, 2018 is as follows :
Range of exercise prices per share (`)
Options outstandingNo. of shares
arising out of options
Weighted average
remaining contractual life
Weighted average exercise
price (`)
2015 Plan :0-5 (RSU) 37,50,409 1.89 5.00 900-1100 (ESOP) 9,66,913 6.60 992.68
47,17,322 2.57 207.45
The summary of information about equity-settled RSUs and ESOPs outstanding as at March 31, 2017 was as follows :
Range of exercise prices per share (`)
Options outstandingNo. of shares
arising out of options
Weighted average
remaining contractual life
Weighted average exercise
price (`)
2015 Plan :0-5 (RSU) 29,61,373 1.88 5.00 900-1100 (ESOP) 11,97,650 7.09 1,026.50
41,59,023 3.38 299.16
The fair value of each equity settled award is estimated on the date of grant using the Black–Scholes–Merton model with the following assumptions :
Particulars For options granted during the year ended March 31, 2018
Equity shares ADSRSU ESOP RSU ESOP
Weighted average share price (`) / ($-ADS) 1,144 923 16.61 14.65Exercise price (`) / ($-ADS) 5.00 919 0.08 14.67Expected volatility (%) 20-25 25-28 21-26 25-31Expected life of the option (years) 1-4 3-7 1-4 3-7Expected dividends (%) 2.78 2.78 2.74 2.74Risk-free interest rate (%) 6-7 6-7 1-2 1-2Weighted average fair value as on grant date (`) / ($-ADS) 1,066 254 15.47 2.93
Particulars For options granted during the year ended March 31, 2017
Equity shares ADSRSU ESOP RSU ESOP
Weighted average share price (`) / ($-ADS) 1,067 989 15.77 15.26 Exercise price (`) / ($-ADS) 5.00 998 0.07 15.26 Expected volatility (%) 24-29 27-29 26-29 27-31Expected life of the option (years) 1-4 3-7 1-4 3-7Expected dividends (%) 2.37 2.37 2.29 2.29 Risk-free interest rate (%) 6-7 6-7 1-2 1-2

Consolidated financial statements | 233 Infosys Annual Report 2017-18
Particulars For options granted during the year ended March 31, 2017
Equity shares ADSRSU ESOP RSU ESOP
Weighted average fair value as on grant date (`) / ($-ADS) 1,002 285 14.84 3.46
The expected life of the RSU / ESOP is estimated based on the vesting term and contractual term of the RSU / ESOP, as well as expected exercise behavior of the employee who receives the RSU / ESOP. Expected volatility during the expected term of the RSU / ESOP is based on historical volatility of the observed market prices of the Company’s publicly traded equity shares during a period equivalent to the expected term of the RSU / ESOP.
2.12 Other financial liabilitiesin ` crore
Particulars As at March 31,2018 2017
NON-CURRENTOthers
Accrued compensation to employees(1) – 30 Compensated absences 48 – Payable for acquisition of business - Contingent consideration (Refer to Note 2.1)(2) 13 40
TOTAL NON-CURRENT OTHER FINANCIAL LIABILITIES 61 70 CURRENTUnpaid dividends(1) 22 17 Others
Accrued compensation to employees(1) 2,509 1,881 Accrued expenses(1) 2,452 2,585 Retention monies(1) 132 220 Payable for acquisition of business - Contingent consideration (Refer to Note 2.1)(2) 41 45 Payable by controlled trusts(1) 139 145 Compensated absences 1,421 1,359 Foreign currency forward and options contracts(2)(3) 42 2 Capital creditors(1) 155 48 Other payables(1) 33 47
TOTAL CURRENT OTHER FINANCIAL LIABILITIES 6,946 6,349 TOTAL FINANCIAL LIABILITIES 7,007 6,419 (1) Financial liability carried at amortized cost 5,442 4,973 (2) Financial liability carried at fair value
through profit or loss 93 87 (3) Financial liability carried at fair value
through other comprehensive income 3 – Contingent consideration on undiscounted basis 55 91
2.13 Other liabilitiesin ` crore
Particulars As at March 31,2018 2017
NON-CURRENTOthers
Deferred income – government grant on land use rights 44 41 Accrued gratuity (Refer to Note 2.20.1) 28 –Deferred rent 151 – Deferred income 36 42
TOTAL NON-CURRENT OTHER LIABILITIES 259 83 CURRENTUnearned revenues 2,295 1,777 Client deposit 38 – Others
Withholding taxes and others 1,240 1,226 Accrued gratuity (Refer to Note 2.20.1) – 1 Deferred rent 32 2 Deferred income – government grant on land use rights 1 1
TOTAL CURRENT OTHER LIABILITIES 3,606 3,007 TOTAL OTHER LIABILITIES 3,865 3,090
2.14 Provisions
Accounting policyA provision is recognized if, as a result of a past event, the Group has a present legal or constructive obligation that is reasonably estimable, and it is probable that an outflow of economic benefits will be required to settle the obligation. Provisions are determined by discounting the expected future cash flows at a pre-tax rate that reflects current market assessments of the time value of money and the risks specific to the liability.
a. Post-sales client supportThe Group provides its clients with a fixed-period post-sales support for corrections of errors and support on all its fixed-price, fixed-timeframe contracts. Costs associated with such support services are accrued at the time-related revenues are recorded and included in Consolidated Statement of Profit and Loss. The Group estimates such costs based on historical experience and estimates are reviewed on a periodic basis for any material changes in assumptions and likelihood of occurrence.

234 | Consolidated financial statements Infosys Annual Report 2017-18
b. Onerous contractsProvisions for onerous contracts are recognized when the expected benefits to be derived by the Group from a contract are lower than the unavoidable costs of meeting the future obligations under the contract. The provision is measured at the present value of the lower of the expected cost of terminating the contract and the expected net cost of continuing with the contract. Before a provision is established the Group recognizes any impairment loss on the assets associated with that contract.
Provision for post-sales client support and othersin ` crore
Particulars As at March 31,2018 2017
CURRENTOthers
Post-sales client support and others 492 405
TOTAL PROVISIONS 492 405
The movement in the provision for post-sales client support and others is as follows :
in ` crore
Particulars Year ended March 31,
2018 2017Balance at the beginning 405 512 Provision recognized 143 94 Provision utilized (62) (195)Exchange difference 6 (6)Balance at the end 492 405
Provision for post-sales client support and other provisions are expected to be utilized over a period of six months to one year.
2.15 Income taxes
Accounting policyIncome tax expense comprises current and deferred income tax. Income tax expense is recognized in net profit in the Consolidated Statement of Profit and Loss except to the extent that it relates to items recognized directly in equity, in which case it is recognized in other comprehensive income. Current income tax for current and prior periods is recognized at the amount expected to be paid to or recovered from the tax authorities, using the tax rates and tax laws that have been enacted or substantively enacted by the Balance Sheet date. Deferred income tax assets and liabilities are recognized for all temporary differences arising between the tax bases of assets and liabilities and their carrying amounts in the financial statements except when the deferred income tax arises from the initial recognition of goodwill or an asset or liability in a transaction that is not a business combination and affects neither accounting nor taxable profit or loss at the time of the transaction. Deferred tax assets are reviewed at each reporting date and are reduced to the extent that it is no longer probable that the related tax benefit will be realized.
Deferred income tax assets and liabilities are measured using tax rates and tax laws that have been enacted or substantively enacted by the Balance Sheet date and are expected to apply
to taxable income in the years in which those temporary differences are expected to be recovered or settled. The effect of changes in tax rates on deferred income tax assets and liabilities is recognized as income or expense in the period that includes the enactment or the substantive enactment date. A deferred income tax asset is recognized to the extent that it is probable that future taxable profit will be available against which the deductible temporary differences and tax losses can be utilized. Deferred income taxes are not provided on the undistributed earnings of subsidiaries and branches where it is expected that the earnings of the subsidiary or branch will not be distributed in the foreseeable future. The Group offsets current tax assets and current tax liabilities, where it has a legally enforceable right to set off the recognized amounts and where it intends either to settle on a net basis, or to realize the asset and settle the liability simultaneously. Tax benefits of deductions earned on exercise of employee share options in excess of compensation charged to income are credited to securities premium.
Income tax expense in the consolidated Statement of Profit and Loss comprises :
in ` crore
Particulars Year ended March 31,2018 2017
Current taxes 4,581 5,653 Deferred taxes (340) (55)Income tax expense 4,241 5,598
Advance Pricing Agreement (APA)
During the three months ended December 31, 2017, the Company had concluded an APA with the US Internal Revenue Service (IRS) for the US branch covering the years ending March 2011 to March 2021. Under the APA, the Company and the IRS have agreed on the methodology to allocate revenues and compute the taxable income of the Company’s US branch operations.
During the three months ended December 31, 2017, in accordance with the APA, the Company has reversed income tax expense provision of ` 1,432 crore which pertains to previous periods. This comprises reversal of current tax expense of ` 1,610 crore, reversal of ` 132 crore on account of deferred tax assets pertaining to the temporary differences which are no longer required and a deferred tax liability of ` 46 crore pertaining to BPT for the three months ended December 31, 2017 on account of conclusion of APA. In line with the APA, the Company has to pay an amount of approximately ` 1,488 crore due to the difference between the taxes payable for prior periods as per the APA and the actual taxes paid for such periods. The Company has paid ` 479 crore during the three months ended March 31, 2018, and the balance amount is expected to be paid over the next few quarters.
Additionally, income tax expense for the year ended March 31, 2018 includes reversal (net of provisions) of ` 291 crore, pertaining to prior periods on account of adjudication of certain disputed matters in favor of the Company across various jurisdictions.

Consolidated financial statements | 235 Infosys Annual Report 2017-18
Income tax expense for the year ended March 31, 2017 includes reversal (net of provisions) of ` 152 crore, pertaining to prior periods.
The ‘Tax Cuts and Jobs Act (H.R. 1)’ was signed into law on December 22, 2017 (‘US tax reforms’). The US tax reforms has reduced federal tax rates from 35% to 21% effective January 1, 2018 among other measures. During the year ended March 31, 2018 , the US tax reforms has resulted in a positive impact of ̀ 155 crore on account of credits pertaining to deferred tax liabilities on branch profit. The impact of US tax reforms is expected to be not significant for future periods.
During the years ended March 31, 2018 and March 31, 2017, a current tax charge of ` 17 crore and current tax credit of ` 10 crore, respectively have been recorded in other comprehensive income pertaining to remeasurement of defined benefit plan asset.
During the year ended March 31, 2018, a deferred tax credit of ` 13 crore and a deferred tax charge of ` 1 crore have been recorded in other comprehensive income pertaining to unrealized gains on derivatives designated as cash flow hedges and unrealized gain on investment in non-convertible debentures, certificates of deposit, commercial paper and equity and preference securities.
During the year ended March 31, 2017, a deferred tax charge of ` 13 crore has been recorded in other comprehensive income pertaining to unrealized gains on derivatives designated as cash flow hedges.
A reconciliation of the income tax provision to the amount computed by applying the statutory income tax rate to the income before income taxes is as follows :
in ` crore except otherwise stated
Particulars Year ended March 31,2018 2017
Profit before income taxes 20,270 19,951 Enacted tax rates in India 34.61% 34.61%Computed expected tax expense 7,015 6,905 Tax effect due to non-taxable income for Indian tax purposes (2,068) (1,982)Overseas taxes 701 750 Tax provision (reversals) (1,617) (152)Effect of exempt non-operating income (66) (65)Effect of unrecognized deferred tax assets 188 93 Effect of differential overseas tax rates 52 64 Effect of non-deductible expenses 57 26 Branch profit tax (net of credits) (210) – Subsidiary dividend distribution tax 172 – Others 17 (41)Income tax expense 4,241 5,598
Infosys is subject to a 15% BPT in the US to the extent its US branch’s net profit during the year is greater than the increase in the net assets of the US branch during the year, computed in accordance with the Internal Revenue Code. As of March 31, 2018, Infosys’ US branch net assets amounted to
approximately ̀ 5,030 crore. During the year ended March 31, 2018, an additional deferred tax liability has been created for BPT amounting to ` 46 crore on account of conclusion of APA explained above. Further, on account of US tax reforms, the Company has a credit of ` 155 crore pertaining to BPT for the year ended March 31, 2018. The Company has also reversed ` 55 crore of BPT during the year ended March 31, 2018. As of March 31, 2018, the Company has a deferred tax liability for BPT of ` 164 crore (net of credits), as the Company estimates that these branch profits are expected to be distributed in the foreseeable future.
Other income for the year ended March 31, 2018 includes interest on income tax refund of ` 262 crore.
The foreign tax expense is due to income taxes payable overseas, principally in the United States. In India, the Company has benefited from certain income tax incentives that the Government of India had provided for export of software from the units registered under the Special Economic Zones Act (SEZs), 2005. SEZ units which began the provision of services on or after April 1, 2005 are eligible for a deduction of 100% of profits or gains derived from the export of services for the first five years from the financial year in which the unit commenced the provision of services and 50% of such profits or gains for further five years. Up to 50% of such profits or gains is also available for a further five years subject to the creation of a Special Economic Zone re-investment Reserve out of the profit for the eligible SEZ units and utilization of such reserve by the Company for acquiring new plant and machinery for the purpose of its business as per the provisions of the Income-tax Act, 1961.
During the year ended March 31, 2018, the Company received ` 846 crore as dividend from Infosys BPM, its majority owned subsidiary. Dividend distribution tax paid by the subsidiary on such dividend has been reduced as credit against dividend distribution tax payable by Infosys. Accordingly, the Group has recorded a charge of ` 172 crore as income tax expense during the year ended March 31, 2018.
Deferred income tax liabilities have not been recognized on temporary differences amounting to ` 5,045 crore and ̀ 5,309 crore as at March 31, 2018 and March 31, 2017, respectively, associated with investments in subsidiaries and branches as it is probable that the temporary differences will not reverse in the foreseeable future.
The following table provides the details of income tax assets and income tax liabilities as at March 31, 2018 and March 31, 2017 :
in ` crore
Particulars As at March 31,2018 2017
Income tax assets 6,070 5,716 Current income tax liabilities (2,043) (3,885)Net current income tax asset / (liability) at the end 4,027 1,831

236 | Consolidated financial statements Infosys Annual Report 2017-18
The gross movement in the current income tax asset / (liability) for the years ended March 31, 2018 and March 31, 2017 is as follows :
in ` crore
Particulars Year ended March 31,2018 2017
Net current income tax asset / (liability) at the beginning 1,831 1,820 Income tax paid 6,829 5,653 Current income tax expense (4,581) (5,653)Income tax benefit arising on exercise of stock options – 1 Income tax on other comprehensive income (17) 10 Reclassified under assets held for sale (Refer to Note 2.25) (35) – Net current income tax asset / (liability) at the end 4,027 1,831
The tax effects of significant temporary differences that resulted in deferred income tax assets and liabilities are as follows :
in ` crore
Particulars As at March 31,2018 2017
Deferred income tax assets Property, plant and equipment 215 138Computer software – 40Accrued compensation to employees 12 57Trade receivables 141 136Compensated absences 366 374Post-sales client support 98 97 Derivative financial instruments 13 – Intangibles 9 22 Credits related to branch profits 341 – Others 117 143Total deferred income tax assets 1,312 1,007
Deferred income tax liabilitiesIntangible assets (38) (206)Branch profit tax (505) (327)Derivative financial instruments (2) (74)Others (26) (67)Total deferred income tax liabilities (571) (674)
Deferred income tax assets after set-off 1,282 540 Deferred income tax liabilities after set-off (541) (207)
Deferred tax assets and deferred tax liabilities have been offset wherever the Group has a legally enforceable right to set off current tax assets against current tax liabilities and where the deferred tax assets and deferred tax liabilities relate to income taxes levied by the same taxation authority.
In assessing the reliability of deferred income tax assets, the Management considers whether some portion or all of the deferred income tax assets will not be realized. The ultimate realization of deferred income tax assets is dependent upon the generation of future taxable income during the periods in which the temporary differences become deductible. The Management considers the scheduled reversals of deferred income tax liabilities, projected future taxable income, and tax-planning strategies in making this assessment. Based on the level of historical taxable income and projections for future taxable income over the periods in which the deferred income tax assets are deductible, the Management believes that the Group will realize the benefits of those deductible differences. The amount of the deferred income tax assets considered realizable, however, could be reduced in the near term if estimates of future taxable income during the carry forward period are reduced.
The gross movement in the deferred income tax account for the years ended March 31, 2018 and March 31, 2017, is as follows :
in ` crore
Particulars Year ended March 31,2018 2017
Net deferred income tax asset at the beginning 333 284 Addition through business combination (Refer to Note 2.1) (2) – Translation differences 5 7 Credits / (charge) relating to temporary differences 340 55 Temporary differences on other comprehensive income 12 (13)Reclassified under assets held for sale (Refer to Note 2.25) 53 – Net deferred income tax asset at the end 741 333
The entire deferred income tax, except for a credit of ` 155 crore (on account of US tax reforms explained above), for the year ended March 31, 2018, relates to origination and reversal of temporary differences.
The credit relating to temporary differences during the year ended March 31, 2018 is primarily on account of property plant and equipment and trade receivables partially offset by accrued compensation to employees. The credit relating to temporary differences during the year ended March 31, 2017 are primarily on account of property, plant and equipment, and compensated absences partially offset by trade receivables and post-sales client support.
2.16 Revenue from operations
Accounting policyThe Company derives revenues primarily from software development and related services and from the licensing of software products. Arrangements with customers for software-related services are either on a fixed-price, fixed-timeframe or on a time-and-material basis.
Revenue on time-and-material contracts are recognized as the related services are performed and revenue from the end

Consolidated financial statements | 237 Infosys Annual Report 2017-18
of the last billing to the Balance Sheet date is recognized as unbilled revenues. Revenue from fixed-price, fixed-timeframe contracts, where there is no uncertainty as to measurement or collectability of consideration, is recognized as per the percentage-of-completion method. When there is uncertainty as to measurement or ultimate collectability, revenue recognition is postponed until such uncertainty is resolved. Efforts or costs expended have been used to measure progress towards completion as there is a direct relationship between input and productivity. Provisions for estimated losses, if any, on uncompleted contracts are recorded in the period in which such losses become probable based on the current contract estimates. Costs and earnings in excess of billings are classified as unbilled revenues, while billings in excess of costs and earnings are classified as unearned revenues. Deferred contract costs are amortized over the term of the contract. Maintenance revenue is recognized rateably over the term of the underlying maintenance arrangement.
In arrangements for software development and related services and maintenance services, the Company has applied the guidance in Ind AS 18, Revenue, by applying the revenue recognition criteria for each separately identifiable component of a single transaction. The arrangements generally meet the criteria for considering software development and related services as separately identifiable components. For allocating the consideration, the Company has measured the revenue in respect of each separable component of a transaction at its fair value, in accordance with principles given in Ind AS 18. The price that is regularly charged for an item when sold separately is the best evidence of its fair value. In cases where the Company is unable to establish objective and reliable evidence of fair value for the software development and related services, the Company has used a residual method to allocate the arrangement consideration. In these cases the balance of the consideration, after allocating the fair values of undelivered components of a transaction, has been allocated to the delivered components for which specific fair values do not exist.
License fee revenues are recognized when the general revenue recognition criteria given in Ind AS 18 are met. Arrangements to deliver software products generally have three elements : license, implementation and Annual Technical Services (ATS). The Company has applied the principles given in Ind AS 18 to account for revenues from these multiple element arrangements. Objective and reliable evidence of fair value has been established for ATS. Objective and reliable evidence of fair value is the price charged when the element is sold separately. When other services are provided in conjunction with the licensing arrangement and objective and reliable evidence of their fair values have been established, the revenue from such contracts are allocated to each component of the contract in a manner, whereby revenue is deferred for the undelivered services and the residual amounts are recognized as revenue for delivered elements. In the absence of objective and reliable evidence of fair value for implementation, the entire arrangement fee for license and implementation is recognized using the percentage-of-completion method as the implementation is performed. Revenue from client training, support and other services arising due to the sale of software
products is recognized as the services are performed. ATS revenue is recognized rateably over the period in which the services are rendered.
Advances received for services and products are reported as client deposits until all conditions for revenue recognition are met.
The Group accounts for volume discounts and pricing incentives to customers as a reduction of revenue based on the rateable allocation of the discounts / incentives amount to each of the underlying revenue transaction that results in progress by the customer towards earning the discount / incentive. Also, when the level of discount varies with increase in levels of revenue transactions, the Company recognizes the liability based on its estimate of the customer’s future purchases. If it is probable that the criteria for the discount will not be met, or if the amount thereof cannot be estimated reliably, then discount is not recognized until the payment is probable and the amount can be estimated reliably. The Company recognizes changes in the estimated amount of obligations for discounts in the period in which the change occurs. The discounts are passed on to the customer either as direct payments or as a reduction of payments due from the customer.
The Group presents revenues net of indirect taxes in its Consolidated Statement of Profit and Loss.
Revenues for the years ended March 31, 2018 and March 31, 2017 are as follows :
in ` crore
Particulars Year ended March 31,2018 2017
Revenue from software services 68,460 66,383 Revenue from software products 2,062 2,101 TOTAL REVENUE FROM OPERATIONS 70,522 68,484
2.17 Other income, net
Accounting policy
Other incomeOther income is comprised primarily of interest income, dividend income, gain / loss on investment and exchange gain / loss on forward and options contracts and on translation of other assets and liabilities. Interest income is recognized using the effective interest method. Dividend income is recognized when the right to receive payment is established.
Foreign currency Functional currency
The functional currency of Infosys, Infosys BPM, controlled trusts, EdgeVerve and Skava is the Indian rupee. The functional currencies for Infosys Australia, Infosys China, Infosys Mexico, Infosys Sweden, Infosys Brasil, Infosys Public Services, Infosys Shanghai, Infosys Lodestone, Infosys Americas, Infosys Nova, Infosys Consulting Pte Ltd., Panaya, Kallidus, Brilliant Basics and Noah are the respective local currencies. These financial statements are presented in Indian rupees (rounded off to crore; one crore equals ten million).

238 | Consolidated financial statements Infosys Annual Report 2017-18
Transactions and translations
Foreign-currency-denominated monetary assets and liabilities are translated into the relevant functional currency at exchange rates in effect at the Balance Sheet date. The gains or losses resulting from such translations are included in net profit in the Consolidated Statement of Profit and Loss. Non-monetary assets and non-monetary liabilities denominated in a foreign currency and measured at fair value are translated at the exchange rate prevalent at the date when the fair value was determined. Non-monetary assets and non-monetary liabilities denominated in a foreign currency and measured at historical cost are translated at the exchange rate prevalent at the date of transaction.
Transaction gains or losses realized upon settlement of foreign currency transactions are included in determining net profit for the period in which the transaction is settled. Revenue, expense and cash-flow items denominated in foreign currencies are translated into the relevant functional currencies using the exchange rate in effect on the date of the transaction.
The translation of financial statements of the foreign subsidiaries to the presentation currency is performed for assets and liabilities using the exchange rate in effect at the Balance Sheet date and for revenue, expense and cash-flow items using the average exchange rate for the respective periods. The gains or losses resulting from such translation are included in currency translation reserves under other components of equity. When a subsidiary is disposed off, in full, the relevant amount is transferred to net profit in the Consolidated Statement of Profit and Loss. However when a change in the parent’s ownership does not result in loss of control of a subsidiary, such changes are recorded through equity.
Goodwill and fair value adjustments arising on the acquisition of a foreign entity are treated as assets and liabilities of the foreign entity and translated at the exchange rate in effect at the Balance Sheet date.
Government grantsThe Group recognizes government grants only when there is reasonable assurance that the conditions attached to them shall be complied with, and the grants will be received. Government grants related to assets are treated as deferred income and are recognized in net profit in the Consolidated Statement of Profit and Loss on a systematic and rational basis over the useful life of the asset. Government grants related to revenue are recognized on a systematic basis in net profit in the Consolidated Statement of Profit and Loss over the periods necessary to match them with the related costs which they are intended to compensate.
Other income for the years ended March 31, 2018 and March 31, 2017 is as follows :
in ` crore
Particulars Year ended March 31,2018 2017
Interest income on financial assets carried at amortized cost
Tax-free bonds and government bonds 143 128
Particulars Year ended March 31,2018 2017
Deposits with banks and others 1,531 2,233
Interest income on financial assets carried at fair value through other comprehensive income
Non-convertible debentures, certificates of deposit and commercial paper 682 190
Income on investments carried at fair value through profit or loss
Dividend income on liquid mutual funds 4 29 Gain / (loss) on liquid mutual funds 253 119
Exchange gains / (losses) on foreign currency forward and options contracts 1 591 Exchange gains / (losses) on translation of assets and liabilities 233 (359)Impairment loss on assets classified under held for sale (Refer to Note 2.25) (118) – Miscellaneous income, net 464 149 TOTAL OTHER INCOME 3,193 3,080
2.18 Expensesin ` crore
Particulars Year ended March 31,2018 2017
Employee benefit expensesSalaries including bonus 37,764 36,557 Contribution to provident and other funds 828 770 Share-based payments to employees (Refer to Note 2.11) 84 117 Staff welfare 217 215
38,893 37,659 Cost of software packages and others
For own use 887 795 Third-party items bought for service delivery to clients 983 802
1,870 1,597 Other expenses
Repairs and maintenance 1,089 1,242 Power and fuel 207 228 Brand and marketing 305 342 Operating lease payments (Refer to Note 2.19) 528 491 Rates and taxes 166 148 Consumables 30 40 Insurance 59 56 Provision for post-sales client support 142 80

Consolidated financial statements | 239 Infosys Annual Report 2017-18
Particulars Year ended March 31,2018 2017
Commission to non-whole time directors 9 10 Impairment loss recognized / (reversed) on financial assets 71 140 Contributions towards corporate social responsibility 156 230 Others 162 237
2,924 3,244
2.19 Leases
Accounting policyLeases under which the Group assumes substantially all the risks and rewards of ownership are classified as finance leases. When acquired, such assets are capitalized at fair value or present value of the minimum lease payments at the inception of the lease, whichever is lower. Lease payments under operating leases are recognized as an expense on a straight line basis in net profit in the Consolidated Statement of Profit and Loss over the lease term.
The lease rentals charged during the period is as follows :in ` crore
Particulars Year ended March 31,2018 2017
Lease rentals recognized during the period 528 491
The obligations on long-term, non-cancellable operating leases payable as per the rentals stated in the respective agreements are as follows :
in ` crore
Future minimum lease payable As at March 31,2018 2017
Not later than 1 year 456 461 Later than 1 year and not later than 5 years 1,388 1,237 Later than 5 years 874 740
The operating lease arrangements are renewable on a periodic basis and for most of the leases extend up to a maximum of ten years from their respective dates of inception and relates to rented premises. Some of these lease agreements have price escalation clauses.
2.20 Employee benefits
Accounting policy
Gratuity The Group provides for gratuity, a defined benefit retirement plan (‘the Gratuity Plan’) covering eligible employees of Infosys and its Indian subsidiaries. The Gratuity Plan provides a lumpsum payment to vested employees at retirement, death, incapacitation or termination of employment, of an amount based on the respective employee’s salary and the tenure of employment with the Group.
Liabilities with regard to the Gratuity Plan are determined by actuarial valuation, performed by an independent actuary, at
each Balance Sheet date using the projected unit credit method. The Company fully contributes all ascertained liabilities to the Infosys Limited Employees’ Gratuity Fund Trust (the Trust). In case of Infosys BPM and EdgeVerve, contributions are made to the Infosys BPO’s Employees’ Gratuity Fund Trust and EdgeVerve Systems Limited Employees’ Gratuity Fund Trust, respectively. Trustees administer contributions made to the Trusts and contributions are invested in a scheme with the Life Insurance Corporation of India as permitted by Indian law.
The Group recognizes the net obligation of a defined benefit plan in its Balance Sheet as an asset or liability. Gains and losses through remeasurements of the net defined benefit liability / (asset) are recognized in other comprehensive income and are not reclassified to the Consolidated Statement of Profit or Loss in subsequent periods. The actual return of the portfolio of plan assets, in excess of the yields computed by applying the discount rate used to measure the defined benefit obligation is recognized in other comprehensive income. The effect of any plan amendments is recognized in the Consolidated Statement of Profit and Loss.
Superannuation Certain employees of Infosys, Infosys BPM and EdgeVerve are participants in a defined contribution plan. The Group has no further obligations to the plan beyond its monthly contributions which are periodically contributed to a trust fund, the corpus of which is invested with the Life Insurance Corporation of India.
Provident fund Eligible employees of Infosys receive benefits from a provident fund, which is a defined benefit plan. Both the eligible employee and the Company make monthly contributions to the provident fund plan equal to a specified percentage of the covered employee’s salary. The Company contributes a portion to the Infosys Limited Employees’ Provident Fund Trust. The trust invests in specific designated instruments as permitted by Indian law. The remaining portion is contributed to the government-administered pension fund. The rate at which the annual interest is payable to the beneficiaries by the trust is being administered by the government. The Company has an obligation to make good the shortfall, if any, between the return from the investments of the trust and the notified interest rate.
In respect of Indian subsidiaries, eligible employees receive benefits from a provident fund, which is a defined contribution plan. Both the eligible employee and the respective companies make monthly contributions to this provident fund plan equal to a specified percentage of the covered employee’s salary. Amounts collected under the provident fund plan are deposited in a government administered provident fund. The Companies have no further obligation to the plan beyond its monthly contributions.
Compensated absences The Group has a policy on compensated absences which are both accumulating and non-accumulating in nature. The expected cost of accumulating compensated absences is determined by actuarial valuation performed by an independent actuary at each Balance Sheet date using

240 | Consolidated financial statements Infosys Annual Report 2017-18
projected unit credit method on the additional amount expected to be paid / availed as a result of the unused entitlement that has accumulated at the Balance Sheet date. Expense on non-accumulating compensated absences is recognized in the period in which the absences occur.
2.20.1 GratuityThe funded status of the Gratuity Plan and the amounts recognized in the Group’s financial statements as at March 31, 2018 and March 31, 2017 are as follows :
in ` crore
Particulars As at March 31,2018 2017
Change in benefit obligations Benefit obligations at the beginning 1,117 944 Service cost 150 129 Interest expense 73 69 Remeasurements – Actuarial (gains) / losses (59) 67 Transfer 28 – Curtailment gain – (3)Benefits paid (107) (89)Reclassified under held for sale (Refer to Note 2.25) (1) – Benefit obligations at the end 1,201 1,117 Change in plan assets Fair value of plan assets at the beginning 1,195 947 Interest income 80 79 Remeasurements – Return on plan assets excluding amounts included in interest income 13 12 Contributions 35 246 Benefits paid (107) (89)Fair value of plan assets at the end 1,216 1,195 Funded status 15 78 Prepaid gratuity benefit 43 79 Accrued gratuity (28) (1)
The amounts for the years ended March 31, 2018 and March 31, 2017 recognized in the Consolidated Statement of Profit and Loss under employee benefit expense are as follows :
in ` crore
Particulars Year ended March 31,2018 2017
Service cost 150 129 Net interest on the net defined benefit liability / asset (7) (10)Curtailment gain – (3)Net gratuity cost 143 116
The amounts for the years ended March 31, 2018 and March 31, 2017 recognized in the consolidated statement of other comprehensive income are as follows :
in ` crore
Particulars Year ended March 31,2018 2017
Remeasurements of the net defined benefit liability / (asset) Actuarial (gains) / losses (59) 67 (Return) / loss on plan assets excluding amounts included in the net interest on the net defined benefit liability / (asset) (13) (12)
(72) 55
in ` crore
Particulars Year ended March 31,2018 2017
(Gain) / loss from change in demographic assumptions – – (Gain) / loss from change in financial assumptions (41) 56 (Gain) / loss from experience adjustment (18) 11
(59) 67
The weighted-average assumptions used to determine benefit obligations as at March 31, 2018 and March 31, 2017 are as follows :
Particulars As at March 31,2018 2017
Discount rate (%) 7.5 6.9Weighted average rate of increase in compensation levels (%) 8.0 8.0
The weighted-average assumptions used to determine net periodic benefit cost for the years ended March 31, 2018 and March 31, 2017 are as follows :
Particulars Year ended March 31,2018 2017
Discount rate (%) 6.9 7.8Weighted average rate of increase in compensation levels (%) 8.0 8.0Weighted average duration of defined benefit obligation (years) 6.1 6.1
Assumptions regarding future mortality experience are set in accordance with the published statistics by the Life Insurance Corporation of India.
The Company assesses these assumptions with its projected long-term plans of growth and prevalent industry standards. The discount rate is based on the government securities yield.

Consolidated financial statements | 241 Infosys Annual Report 2017-18
Sensitivity of significant assumptions used for valuation of defined benefit obligation :
in ` crore
Impact from percentage point increase / decrease in
As at March 31, 2018
Discount rate 58Weighted average rate of increase in compensation levels 50
Sensitivity to significant actuarial assumptions is computed by varying one actuarial assumption used for the valuation of the defined benefit obligation by one percentage, keeping all other actuarial assumptions constant. In practice, this is not probable, and changes in some of the assumptions may be correlated.
Gratuity is applicable only to employees drawing a salary in Indian rupees and there are no other significant foreign defined benefit gratuity plans.
The Company contributes all ascertained liabilities towards gratuity to the Infosys Limited Employees’ Gratuity Fund Trust. In case of Infosys BPM and EdgeVerve, contributions are made to the Infosys BPO Employees’ Gratuity Fund Trust and EdgeVerve Systems Limited Employees Gratuity Fund Trust, respectively. Trustees administer contributions made to the trust. As at March 31, 2018 and March 31, 2017, the plan assets have been primarily invested in insurer managed funds.
Actual return on assets for the years ended March 31, 2018, and March 31, 2017 were ` 93 crore and ` 91 crore, respectively.
The Group expects to contribute ` 130 crore to the gratuity trusts during fiscal 2019.
Maturity profile of defined benefit obligation :in ` crore
Within 1 year 174 1-2 year 178 2-3 year 192 3-4 year 203 4-5 year 211 5-10 years 1,023
2.20.2 SuperannuationThe Group contributed ` 173 crore and ` 168 crore during the years ended March 31, 2018 and March 31, 2017, respectively and the same has been recognized in the Consolidated Statement of Profit and Loss under the head employee benefit expense.
2.20.3 Provident fund Infosys has an obligation to fund any shortfall on the yield of the trust’s investments over the administered interest rates on an annual basis. These administered rates are determined annually predominantly considering the social rather than economic factors and in most cases the actual return earned by the Company has been higher in the past years. The actuary has provided a valuation for provident fund liabilities on the basis of guidance issued by Actuarial Society of India and based on the assumptions provided below there is no shortfall as at March 31, 2018 and March 31, 2017, respectively.
The details of fund and plan asset position are as follows :in ` crore
Particulars As at March 31,2018 2017
Plan assets at period end, at fair value 5,160 4,459 Present value of benefit obligation at period end 5,160 4,459 Asset recognized in Balance Sheet – –
The plan assets have been primarily invested in government securities.
Assumptions used in determining the present value obligation of the interest rate guarantee under the Deterministic Approach :
Particulars As at March 31,2018 2017
Government of India (GOI) bond yield (%) 7.50 6.90Remaining term to maturity of portfolio (year) 5.9 6.0 Expected guaranteed interest rate (%) 8.55 8.60
The Group contributed ̀ 484 crore and ̀ 462 crore during the years ended March 31, 2018 and March 31, 2017, respectively. The same has been recognized in the Consolidated Statement of Profit and Loss under the head employee benefit expense.
The provident plans are applicable only to employees drawing a salary in Indian rupees and there are no other significant foreign defined benefit plans.
2.20.4 Employee benefit costsin ` crore
Particulars Year ended March 31,2018 2017
Salaries and bonus(1)(2) 38,093 36,913 Defined contribution plans 260 252 Defined benefit plans 540 494
38,893 37,659
(1) Includes a employee stock compensation expense of ` 84 crore, for the year ended March 31, 2018. Similarly, includes employee stock compensation expense of ` 117 crore for the year ended March 31, 2017.
(2) Included in the above is a reversal of stock compensation cost of ` 35 crore towards forfeiture of stock incentives granted to Dr. Vishal Sikka upon his resignation. Refer to Note 2.11.
2.21 Reconciliation of basic and diluted shares used in computing earnings per share
Accounting policyBasic earnings per equity share is computed by dividing the net profit attributable to the equity holders of the Company by the weighted average number of equity shares outstanding during the period. Diluted earnings per equity share is computed by dividing the net profit attributable to the equity holders of the Company by the weighted average number of equity shares considered for deriving basic earnings per equity share and also the weighted average number of equity shares that could have been issued upon conversion

242 | Consolidated financial statements Infosys Annual Report 2017-18
of all dilutive potential equity shares. The dilutive potential equity shares are adjusted for the proceeds receivable had the equity shares been actually issued at fair value (i.e. the average market value of the outstanding equity shares). Dilutive potential equity shares are deemed converted as of the beginning of the period, unless issued at a later date. Dilutive potential equity shares are determined independently for each period presented.
The number of equity shares and potentially dilutive equity shares are adjusted retrospectively for all periods presented for any share splits and bonus shares issues including for changes effected prior to the approval of the financial statements by the Board of Directors.
A reconciliation of the equity shares used in the computation of basic and diluted earnings per equity share is as follows :
Particulars Year ended March 31,2018 2017
Basic earnings per equity share – weighted average number of equity shares outstanding(1) 225,53,32,322 228,56,39,447Effect of dilutive common equivalent shares – share options outstanding 22,41,548 7,57,298 Diluted earnings per equity share – weighted average number of equity shares and common equivalent shares outstanding 225,75,73,870 228,63,96,745
(1) Excludes treasury shares
For the year ended March 31, 2018, 67,238 options to purchase equity shares had an anti-dilutive effect.
For the year ended March 31, 2017, 1,12,190 options to purchase equity shares had an anti-dilutive effect.
2.22 Contingent liabilities and commitments in ` crore
Particulars As at March 31,2018 2017
Contingent liabilitiesClaims against the Company, not acknowledged as debts(2) [Amount paid to statutory authorities ` 6,551 crore (` 4,717 crore)] 4,802 6,714 CommitmentsEstimated amount of contracts remaining to be executed on capital contracts and not provided for (net of advances and deposits) 1,452 1,149 Other commitments(1) 81 114
(1) Uncalled capital pertaining to investments(2) As at March 31, 2018, claims against the Group not acknowledged as debts in respect of income tax matters amounted to ` 4,542 crore. These matters
are pending before various Appellate Authorities and the Management, including its tax advisors, expect that its position will likely be upheld on ultimate resolution and will not have a material adverse effect on the Group’s financial position and results of operations.
Income tax claims amounting to ̀ 4,670 crore have not been considered as claims not acknowledged as debt because the Company has received favorable decisions on similar claims and therefore, based on its assessment, is of the view that any liability resulting from these claims is remote and will not sustain on ultimate resolution.
Amount paid to statutory authorities against the above tax claims amounted to ` 6,540 crore.
The Company is subject to legal proceedings and claims, which have arisen in the ordinary course of business. The Company’s management does not reasonably expect that these legal actions, when ultimately concluded and determined, will have a material and adverse effect on the Company’s results of operations or financial condition.
2.23 Related party transactions
Subsidiariesin %
Name of subsidiaries Country Holdings as at March 31,2018 2017
Infosys Technologies (China) Co. Limited (Infosys China) China 100 100Infosys Technologies S. de R. L. de C. V. (Infosys Mexico) Mexico 100 100Infosys Technologies (Sweden) AB. (Infosys Sweden) Sweden 100 100Infosys Technologies (Shanghai) Company Limited (Infosys Shanghai) China 100 100Infosys Tecnologia do Brasil Ltda. (Infosys Brasil) Brazil 100 100Infosys Nova Holdings LLC. (Infosys Nova) US 100 100EdgeVerve Systems Limited (EdgeVerve) India 100 100Lodestone Management Consultants GmbH(1) Austria 100 100Skava Systems Pvt. Ltd. (Skava Systems) India 100 100Kallidus Inc. (Kallidus) US 100 100

Consolidated financial statements | 243 Infosys Annual Report 2017-18
Name of subsidiaries Country Holdings as at March 31,2018 2017
Infosys Chile SpA(2) Chile – – Infosys Arabia Limited(3) Saudi Arabia 70 – Infosys Americas Inc., (Infosys Americas) US 100 100Infosys Technologies (Australia) Pty. Limited (Infosys Australia)(4) Australia 100 100Infosys Public Services, Inc. USA (Infosys Public Services) US 100 100Infosys Canada Public Services Ltd.(5)(6) Canada – – Infosys BPM Limited (formerly Infosys BPO Limited) India 99.98 99.98Infosys (Czech Republic) Limited s.r.o.(7) Czech Republic 99.98 99.98Infosys Poland, Sp z.o.o(7) Poland 99.98 99.98Infosys McCamish Systems LLC (7) US 99.98 99.98Portland Group Pty Ltd(7) Australia 99.98 99.98Infosys BPO Americas LLC.(7) US 99.98 99.98Infosys Consulting Holding AG (Infosys Lodestone) Switzerland 100 100Lodestone Management Consultants Inc.(4)(8) US 100 100Infosys Management Consulting Pty Limited(8) Australia 100 100Infosys Consulting AG(8) Switzerland 100 100Infosys Consulting GmbH(8) Germany 100 100Infosys Consulting SAS(8) France 100 100Infosys Consulting s.r.o.(8) Czech Republic 100 100Lodestone Management Consultants Co., Ltd.(8) China 100 100Infy Consulting Company Ltd(8) UK 100 100Infy Consulting B.V.(8) The Netherlands 100 100Infosys Consulting Sp. z.o.o(8) Poland 100 100Lodestone Management Consultants Portugal, Unipessoal, Lda. (8) Portugal 100 100S.C. Infosys Consulting S.R.L.(8) Romania 100 100Infosys Consulting S.R.L.(8) Argentina 100 100Lodestone GmbH(8)(9) Switzerland – – Lodestone Augmentis AG (10)(11) Switzerland – – Infosys Consulting (Belgium) NV (formerly Lodestone Management Consultants (Belgium) S.A.)(12) Belgium 99.90 99.90Infosys Consulting Ltda.(12) Brazil 99.99 99.99Panaya Inc. (Panaya) US 100 100Panaya Ltd.(13) Israel 100 100Panaya GmbH(13) Germany 100 100Panaya Japan Co. Ltd(4)(13) Japan 100 100Panaya Pty Ltd.(13)(14) Australia – – Noah Consulting LLC (Noah)(15) US – 100Noah Information Management Consulting Inc. (Noah Canada)(16)(17) Canada – 100Brilliant Basics Holdings Limited(18) UK 100 – Brilliant Basics Limited(19) UK 100 – Brilliant Basics (MENA) DMCC(19) Dubai 100 – Infosys Consulting Pte Limited(1) Singapore 100 100Infosys Middle East FZ LLC(20) Dubai 100 –
(1) Wholly-owned subsidiary of Infosys Limited(2) Incorporated effective November 20, 2017(3) Subsidiary of Infosys Limited(4) Under liquidation(5) Wholly-owned subsidiary of Infosys Public Services, Inc. (6) Liquidated effective May 9, 2017(7) Wholly-owned subsidiary of Infosys BPM(8) Wholly-owned subsidiaries of Infosys Consulting Holding AG (formerly Lodestone Holding AG)(9) Liquidated effective December 21, 2016(10) Wholly-owned subsidiary of Infosys Consulting AG (formerly Lodestone Management Consultants AG)(11) Liquidated effective October 5, 2016(12) Majority owned and controlled subsidiaries of Infosys Consulting Holding AG (formerly Lodestone Holding AG)(13) Wholly-owned subsidiary of Panaya Inc.(14) Liquidated effective November 16, 2016(15) Liquidated effective November 9, 2017(16) Wholly-owned subsidiary of Noah(17) Liquidated effective December 20, 2017
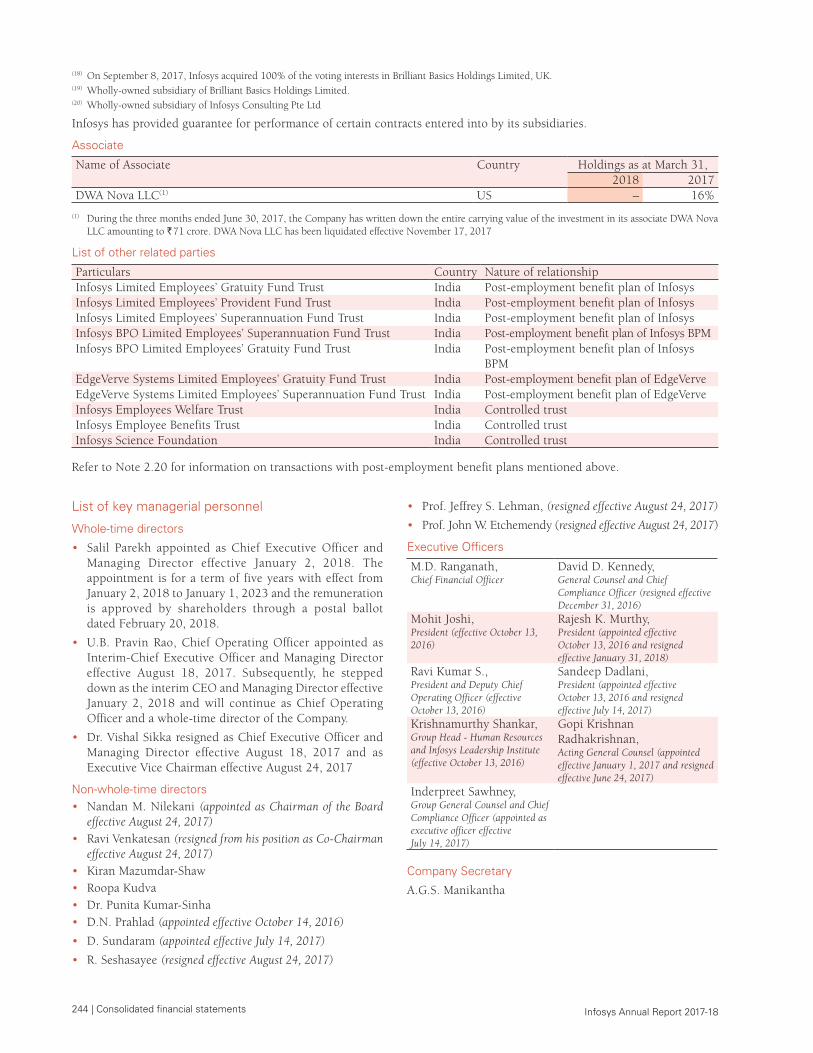
244 | Consolidated financial statements Infosys Annual Report 2017-18
(18) On September 8, 2017, Infosys acquired 100% of the voting interests in Brilliant Basics Holdings Limited, UK.(19) Wholly-owned subsidiary of Brilliant Basics Holdings Limited.(20) Wholly-owned subsidiary of Infosys Consulting Pte Ltd
Infosys has provided guarantee for performance of certain contracts entered into by its subsidiaries.
Associate
Name of Associate Country Holdings as at March 31,2018 2017
DWA Nova LLC(1) US – 16%
(1) During the three months ended June 30, 2017, the Company has written down the entire carrying value of the investment in its associate DWA Nova LLC amounting to ` 71 crore. DWA Nova LLC has been liquidated effective November 17, 2017
List of other related parties
Particulars Country Nature of relationship Infosys Limited Employees’ Gratuity Fund Trust India Post-employment benefit plan of InfosysInfosys Limited Employees’ Provident Fund Trust India Post-employment benefit plan of InfosysInfosys Limited Employees’ Superannuation Fund Trust India Post-employment benefit plan of InfosysInfosys BPO Limited Employees’ Superannuation Fund Trust India Post-employment benefit plan of Infosys BPMInfosys BPO Limited Employees’ Gratuity Fund Trust India Post-employment benefit plan of Infosys
BPMEdgeVerve Systems Limited Employees’ Gratuity Fund Trust India Post-employment benefit plan of EdgeVerveEdgeVerve Systems Limited Employees’ Superannuation Fund Trust India Post-employment benefit plan of EdgeVerveInfosys Employees Welfare Trust India Controlled trustInfosys Employee Benefits Trust India Controlled trustInfosys Science Foundation India Controlled trust
Refer to Note 2.20 for information on transactions with post-employment benefit plans mentioned above.
List of key managerial personnel
Whole-time directors
• Salil Parekh appointed as Chief Executive Officer and Managing Director effective January 2, 2018. The appointment is for a term of five years with effect from January 2, 2018 to January 1, 2023 and the remuneration is approved by shareholders through a postal ballot dated February 20, 2018.
• U.B. Pravin Rao, Chief Operating Officer appointed as Interim-Chief Executive Officer and Managing Director effective August 18, 2017. Subsequently, he stepped down as the interim CEO and Managing Director effective January 2, 2018 and will continue as Chief Operating Officer and a whole-time director of the Company.
• Dr. Vishal Sikka resigned as Chief Executive Officer and Managing Director effective August 18, 2017 and as Executive Vice Chairman effective August 24, 2017
Non-whole-time directors• Nandan M. Nilekani (appointed as Chairman of the Board
effective August 24, 2017)• Ravi Venkatesan (resigned from his position as Co‑Chairman
effective August 24, 2017)• Kiran Mazumdar-Shaw• Roopa Kudva • Dr. Punita Kumar-Sinha• D.N. Prahlad (appointed effective October 14, 2016)
• D. Sundaram (appointed effective July 14, 2017)
• R. Seshasayee (resigned effective August 24, 2017)
• Prof. Jeffrey S. Lehman, (resigned effective August 24, 2017)
• Prof. John W. Etchemendy (resigned effective August 24, 2017)
Executive Officers
M.D. Ranganath,Chief Financial Officer
David D. Kennedy,General Counsel and Chief Compliance Officer (resigned effective December 31, 2016)
Mohit Joshi, President (effective October 13, 2016)
Rajesh K. Murthy, President (appointed effective October 13, 2016 and resigned effective January 31, 2018)
Ravi Kumar S., President and Deputy Chief Operating Officer (effective October 13, 2016)
Sandeep Dadlani, President (appointed effective October 13, 2016 and resigned effective July 14, 2017)
Krishnamurthy Shankar, Group Head ‑ Human Resources and Infosys Leadership Institute (effective October 13, 2016)
Gopi Krishnan Radhakrishnan,Acting General Counsel (appointed effective January 1, 2017 and resigned effective June 24, 2017)
Inderpreet Sawhney, Group General Counsel and Chief Compliance Officer (appointed as executive officer effective July 14, 2017)
Company Secretary
A.G.S. Manikantha

Consolidated financial statements | 245 Infosys Annual Report 2017-18
Transaction with key managerial personnelThe compensation to KMP comprising directors and executive officers is as follows :
in ` crore
Particulars Year ended March 31,2018 2017
Salaries and other employee benefits to whole-time directors and executive officers(1)(2)(3)(4) 48 84 Commission and other benefits to non-executive / independent directors 10 11 Total 58 95
(1) On December 2, 2017, the Board appointed Salil Parekh as the Chief Executive Officer and Managing Director of the Company with effect from January 2, 2018. The appointment is for a term of five years with effect from January 2, 2018 to January 1, 2023 and the remuneration is approved by shareholders through a postal ballot dated February 20, 2018.
(2) Total employee stock compensation expense for the year ended March 31, 2018 includes a reversal of ` 13 crore, towards KMP. For the year ended March 31, 2017, an employee stock compensation expense of ` 36 crore, was recorded towards KMP. (Refer to Note 2.11)
(3) Includes a reversal of stock compensation cost of ̀ 35 crore for the year ended March 31, 2018 towards forfeiture of stock incentives granted to Dr. Vishal Sikka upon his resignation. (Refer to Note 2.11)
(4) Includes ` 6 crore payable under severance agreement to David Kennedy, General Counsel and Chief Compliance Officer during the year ended March 31, 2017.
Additional information pursuant to para 2 of general instructions for the preparation of consolidated financial statements
in ` crore, except as otherwise stated
Name of entity Net assets Share in profit or loss Share in other comprehensive income
Share in total comprehensive income
as % of consolidated
net assets
Amount as % of consolidated profit or loss
Amount as % of consolidated
other comprehensive
income
Amount as % of consolidated
total comprehensive
income
Amount
Infosys Ltd. 93.2 63,502 97.3 16,155 95.4 21 97.3 16,176 Indian subsidiariesInfosys BPM 5.1 3,441 2.8 469 (22.7) (5) 2.8 464 EdgeVerve (2.1) (1,397) 1.9 312 27.3 6 1.9 318 Skava Systems(1) 0.1 38 0.1 15 0.0 – 0.1 15 Foreign subsidiariesInfosys China 0.2 151 (0.4) (66) 0.0 – (0.4) (66)Infosys Mexico 0.2 161 0.2 31 0.0 – 0.2 31 Infosys Sweden 0.0 24 0.0 6 0.0 – 0.0 6 Infosys Shanghai 1.2 808 (0.7) (109) 0.0 – (0.6) (109)Infosys Brasil 0.2 123 0.2 26 0.0 – 0.2 26 Infosys Public Services 0.7 463 0.5 73 0.0 – 0.4 73 Infosys Americas 0.0 1 0.0 – 0.0 – 0.0 – Infosys (Czech Republic) Limited s.r.o. 0.1 75 0.0 1 0.0 – 0.0 1 Infosys BPO (Poland) Sp Z.o.o 0.9 580 0.4 68 0.0 – 0.4 68 Infosys BPO Americas 0.0 (2) 0.0 (6) 0.0 – 0.0 (6)Infosys McCamish Systems LLC 0.2 169 0.3 42 0.0 – 0.3 42 Portland Group Pty Ltd 0.2 109 0.0 2 0.0 – 0.0 2 Infosys Australia 0.1 38 0.0 1 0.0 – 0.0 1 Infosys Lodestone 0.3 228 0.1 14 0.0 – 0.1 14 Lodestone Management Consultants Inc 0.0 26 0.0 (3) 0.0 – 0.0 (3)Infosys Management Consulting Pty Limited 0.0 12 0.1 15 0.0 – 0.1 15 Infosys Consulting AG 0.1 80 0.1 12 0.0 – 0.1 12

246 | Consolidated financial statements Infosys Annual Report 2017-18
Name of entity Net assets Share in profit or loss Share in other comprehensive income
Share in total comprehensive income
as % of consolidated
net assets
Amount as % of consolidated profit or loss
Amount as % of consolidated
other comprehensive
income
Amount as % of consolidated
total comprehensive
income
Amount
Infosys Conslting (Belgium) NV 0.0 (24) 0.0 1 0.0 – 0.0 1 Infosys Consulting GmbH (0.1) (36) 0.0 (1) 0.0 – 0.0 (1)Infosys Consulting Pte Ltd. 0.0 1 0.0 3 0.0 – 0.0 3 Infosys Consulting SAS 0.0 6 0.0 7 0.0 – 0.0 7 Infosys Consulting s.r.o. 0.0 5 0.0 – 0.0 – 0.0 – Lodestone Management Consultants GmbH 0.0 – 0.0 2 0.0 – 0.0 2 Lodestone Management Consultants Co., Ltd (0.2) (137) (0.4) (69) 0.0 – (0.4) (69)Infy Consulting Company Ltd. 0.0 9 0.1 24 0.0 – 0.1 24 Infy Consulting B.V. 0.0 33 0.0 3 0.0 – 0.0 3 Infosys Consulting Ltda. (0.1) (72) (0.3) (54) 0.0 – (0.3) (54)Infosys Consulting Sp. Z.o.o 0.0 7 0.0 5 0.0 – 0.0 5 Lodestone Management Consultants Portugal, Unipessoal, Lda. 0.0 4 0.0 1 0.0 – 0.0 1 S.C. Infosys Consulting S.R.L. 0.0 4 0.0 1 0.0 – 0.0 1 Infosys Consulting S.R.L. 0.0 (4) 0.0 (3) 0.0 – 0.0 (3)Infosys Nova 0.0 – (0.5) (79) 0.0 – (0.5) (79)Panaya Inc.(1) 0.2 110 0.0 2 0.0 – 0.0 2 Panaya Ltd.(1) (0.6) (435) (0.9) (149) 0.0 – (0.9) (149)Panaya Gmbh(1) 0.0 (2) 0.0 1 0.0 – 0.0 1 Panaya Japan Co. Ltd.(1) 0.0 (1) 0.0 – 0.0 – 0.0 – Kallidus(1) 0.1 51 (0.5) (82) 0.0 – (0.5) (82)Noah 0.0 – (0.3) (46) 0.0 – (0.3) (46)Noah Canada 0.0 – 0.1 14 0.0 – 0.1 14 Brilliant Basics Holdings 0.0 – 0.0 – 0.0 – 0.0 – Brilliant Basics Limited 0.0 (5) 0.0 (4) 0.0 – 0.0 (4)Brilliant Basics (MENA) 0.0 (2) 0.0 (3) 0.0 – 0.0 (3)Infosys Middle East FZ-LLC 0.0 (26) (0.2) (26) 0.0 – (0.2) (26)Infosys Arabia Limited 0.0 3 0.0 – 0.0 – 0.0 – Subtotal 100 68,119 100 16,606 100 22 100 16,628

Consolidated financial statements | 247 Infosys Annual Report 2017-18
Name of entity Net assets Share in profit or loss Share in other comprehensive income
Share in total comprehensive income
as % of consolidated
net assets
Amount as % of consolidated profit or loss
Amount as % of consolidated
other comprehensive
income
Amount as % of consolidated
total comprehensive
income
Amount
Controlled trusts 115 (7) – (7)Adjustment arising out of consolidation (3,310) (499) 321 (178)AssociateDWA Nova – (71) – (71)Total 64,924 16,029 343 16,372
(1) Classified under assets held for sale. Refer to Note 2.25.
2.24 Segment reportingInd AS 108 establishes standards for the way that public business enterprises report information about operating segments and related disclosures about products and services, geographic areas, and major customers. The Group’s operations predominantly relate to providing end-to-end business solutions to enable clients to enhance business performance. Based on the ‘management approach’ as defined in Ind AS 108, the Chief Operating Decision Maker (CODM) evaluates the Group’s performance and allocates resources based on an analysis of various performance indicators by business segments and geographic segments. Accordingly, information has been presented both along business segments and geographic segments. The accounting principles used in the preparation of the financial statements are consistently applied to record revenue and expenditure in individual segments, and are as set out in the significant accounting policies.
Business segments of the Group are primarily enterprises in Financial Services (FS), enterprises in Manufacturing (MFG), enterprises in Retail, Consumer packaged goods and Logistics (RCL), enterprises in the Energy & utilities, Communication and Services (ECS), enterprises in Hi-tech (Hi-tech), enterprises in Life Sciences, Healthcare and Insurance (HILIFE) and all other segments. The FS reportable segments has been aggregated to include the Financial Services operating segment and the Finacle operating segment because of the similarity of the economic characteristics. All other segments represent the operating segments of businesses in India, Japan, China and IPS. Geographic segmentation is based on business sourced from that geographic region and delivered from both onsite and offshore locations. North America comprises the United States of America, Canada
and Mexico, Europe includes continental Europe (both the east and the west), Ireland and the United Kingdom, and the Rest of the World comprises all other places except those mentioned above and India.
Revenue and identifiable operating expenses in relation to segments are categorized based on items that are individually identifiable to that segment. Revenue for ‘all other segments’ represents revenue generated by IPS and revenue generated from customers located in India, Japan and China. Allocated expenses of segments include expenses incurred for rendering services from the Company’s offshore software development centres and onsite expenses, which are categorized in relation to the associated turnover of the segment. Certain expenses such as depreciation, which form a significant component of total expenses, are not specifically allocable to specific segments as the underlying assets are used interchangeably. The Management believes that it is not practical to provide segment disclosures relating to those costs and expenses, and accordingly these expenses are separately disclosed as ‘unallocated’ and adjusted against the total income of the Group.
Assets and liabilities used in the Group’s business are not identified to any of the reportable segments, as these are used interchangeably between segments. The management believes that it is currently not practicable to provide segment disclosures relating to total assets and liabilities since a meaningful segregation of the available data is onerous.
Geographical information on revenue and business segment revenue information is collated based on individual customers invoiced or in relation to which the revenue is otherwise recognized.

248 | Consolidated financial statements Infosys Annual Report 2017-18
Business segmentFor the years ended March 31, 2018 and March 31, 2017 :
in ` crore
Particulars FS MFG ECS RCL HILIFE Hi-Tech All other segments
Total
Revenue from operations 18,638 7,699 16,757 11,104 9,271 5,047 2,006 70,522 18,555 7,507 15,430 11,225 8,437 5,122 2,208 68,484
Identifiable operating expenses 9,476 4,135 8,411 5,339 4,596 2,679 1,162 35,798 9,271 3,922 7,430 5,378 4,178 2,659 1,406 34,244
Allocated expenses 3,955 1,745 3,796 2,516 2,100 1,144 455 15,711 4,075 1,737 3,569 2,598 1,951 1,186 510 15,626
Segmental operating income 5,207 1,819 4,550 3,249 2,575 1,224 389 19,013 5,209 1,848 4,431 3,249 2,308 1,277 292 18,614
Unallocable expenses 1,865 1,713
Other income, net (Refer to Notes 2.17 and 2.25) 3,193
3,080 Share in net profit / (loss) of associate, including impairment (71)
(30)Profit before tax 20,270
19,951 Tax expense 4,241
5,598 Profit for the year 16,029
14,353 Depreciation and amortization expense 1,863
1,703 Non-cash expenses other than depreciation and amortization 191
28

Consolidated financial statements | 249 Infosys Annual Report 2017-18
Geographic segmentsFor the years ended March 31, 2018 and March 31, 2017 :
in ` crore
Particulars North America Europe India Rest of the World
Total
Revenue from operations 42,575 16,738 2,231 8,978 70,522 42,408 15,392 2,180 8,504 68,484
Identifiable operating expenses 22,105 8,535 906 4,252 35,798 21,618 7,694 1,002 3,930 34,244
Allocated expenses 9,624 3,778 426 1,883 15,711 9,799 3,548 442 1,837 15,626
Segmental operating income 10,846 4,425 899 2,843 19,013 10,991 4,150 736 2,737 18,614
Unallocable expenses 1,865 1,713
Other income, net (Refer to Notes 2.17 and 2.25) 3,193 3,080
Share in net profit / (loss) of associate, including impairment (71)
(30)Profit before tax 20,270
19,951 Tax expense 4,241
5,598 Profit for the year 16,029
14,353 Depreciation and amortization expense 1,863
1,703 Non-cash expenses other than depreciation and amortization 191
28
Significant clientsNo client individually accounted for more than 10% of the revenues in the years ended March 31, 2018 and March 31, 2017.
2.25 Disposal group held for sale
Accounting policyNon-current assets and disposal groups are classified under held for sale if their carrying amount is intended to be recovered principally through sale rather than through continuing use. The condition for classification of held for sale is met when the non-current asset or the disposal group is available for immediate sale and the same is highly probable of being completed within one year from the date of classification under held for sale. Non-current assets and disposal groups held for sale are measured at the lower of carrying amount and fair value less cost to sell.
In March 2018, on conclusion of a strategic review of the portfolio businesses, the Company initiated identification and evaluation of potential buyers for its subsidiaries, Kallidus and Skava (together referred to as ‘Skava’) and Panaya (collectively referred to as ‘the disposal group’). The Company anticipates completion of the sale by March 2019 and accordingly, assets amounting to ̀ 2,060 crore and liabilities amounting to ̀ 324 crore in respect of the disposal group have been reclassified under ‘held for sale’. On reclassification, the disposal group has been measured at the lower of carrying amount and fair value less cost to sell and consequently, an impairment loss of ` 118 crore in respect of Panaya has been recognized in the consolidated Statement of Profit and Loss for the year ended March 31, 2018. The disposal group does not constitute a separate major component of the Company and therefore, has not been classified as discontinued operations.

250 | Consolidated financial statements Infosys Annual Report 2017-18
2.26 Function-wise classification of Consolidated Statement of Profit and Loss in ` crore
Particulars Note no. Year ended March 31,2018 2017
Revenue from operations 2.16 70,522 68,484 Cost of sales 45,130 43,253 GROSS PROFIT 25,392 25,231 OPERATING EXPENSES
Selling and marketing expenses 3,560 3,591 General and administration expenses 4,684 4,739
TOTAL OPERATING EXPENSES 8,244 8,330 OPERATING PROFIT 17,148 16,901 Other income, net 2.17 & 2.25 3,193 3,080 Profit before non-controlling interest / Share in net profit / (Loss) of associate 20,341 19,981 Share in net profit / (loss) of associate, including impairment 2.23 (71) (30)Profit before tax 20,270 19,951 Tax expense
Current tax 2.15 4,581 5,653 Deferred tax 2.15 (340) (55)
PROFIT FOR THE YEAR 16,029 14,353 Other comprehensive income Items that will not be reclassified subsequently to profit or loss
Remeasurement of the net defined benefit liability / asset 2.20 & 2.15 55 (45)Equity instruments through other comprehensive income, net 2.4 & 2.15 7 (5)
62 (50)Items that will be reclassified subsequently to profit or loss
Fair value changes on derivatives designated as cash flow hedge, net 2.10 & 2.15 (39) 39 Exchange differences on translation of foreign operations 321 (257)Fair value changes on investments, net 2.4 & 2.15 (1) (10)
281 (228)Total other comprehensive income, net of tax 343 (278)TOTAL COMPREHENSIVE INCOME FOR THE YEAR 16,372 14,075 Profit attributable to
Owners of the Company 16,029 14,353 Non-controlling interests – –
16,029 14,353 Total comprehensive income attributable to
Owners of the Company 16,372 14,075 Non-controlling interests – –
16,372 14,075
for and on behalf of the Board of Directors of Infosys Limited
Nandan M. NilekaniChairman
Salil ParekhChief Executive Officer and Managing Director
U.B. Pravin RaoChief Operating Officer and Whole‑time Director
BengaluruApril 13, 2018
D. SundaramDirector
M.D. RanganathChief Financial Officer
A.G.S. Manikantha Company Secretary

Business Responsibility Report | 251 Infosys Annual Report 2017-18
Business Responsibility Report 2017-18
The Infosys Business Responsibility Report 2017-18 follows the National Voluntary Guidelines on Social, Environmental and Economic Responsibilities of Business, as notified by the Ministry of Corporate Affairs (MCA), Government of India. We also publish a comprehensive Sustainability Report annually, independently assured by DNV GL, in accordance with the Global Reporting Initiative’s framework.
The Sustainability Report will be available at https://www.infosys.com/sustainability/resources/Pages/index.aspx.
Our Business Responsibility Report includes our responses to questions on our practices and performance on key principles defined by Regulation 34(2)(f) of SEBI (Listing Obligations and Disclosure Requirements) Regulations 2015, covering topics across environment, governance, and stakeholder relationships. In keeping with the guiding principles of integrated reporting, we have provided cross-references to the reported data within the main sections of this Annual Report for all aspects that are material to us and to our stakeholders.
Business Responsibility Report (As per Regulation 34(2)(f) of the SEBI (Listing Obligations and Disclosure Requirements) Regulations, 2015)
Section A : General information about the Company1. Corporate Identity Number (CIN) of the Company L 8 5 1 1 0 K A 1 9 8 1 P L C 0 1 3 1 1 5
2. Name of the Company Infosys Limited
3. Registered address Electronics City, Hosur Road, Bengaluru, Karnataka 560 100, India
4. Website www.infosys.com
5. Email ID [email protected]
6. Financial year reported April 1, 2017 to March 31, 2018
7. Sector(s) that the Company is engaged in (industrial activity code-wise)
Name and description of main products / services : Computer programming, consultancy and related activities
NIC code of the product / service : 620
8. List three key products / services that the Company manufactures / provides (as in Balance Sheet)
Software services, consulting, and products
9. Total number of locations where business activity is undertaken by the Company
i. Number of international locations https://www.infosys.com/about/Pages/locations.aspx (Provide details of major five)
ii. Number of national locations https://www.infosys.com/about/Pages/locations.aspx
10. Markets served by the Company – Local / State / National / International
Refer to Segment reporting, page 192 and page 249
Section B : Financial details of the Company(1)
1. Paid-up capital (`) ` 1,092 crore
2. Total turnover (`) ` 61,941 crore
3. Total profit after taxes (`) ` 16,155 crore
4. Total spending on Corporate Social Responsibility (CSR) as percentage of profit after tax (%)
2% of average net profits of the Company made during the three immediately preceding financial years. Refer to Annexure 7 in the Annual Report, page 77
5. List of activities in which expenditure in 4 above has been incurred
Refer to Annexure 7 in the Annual Report, page 77
(1) As per the standalone Ind AS financials
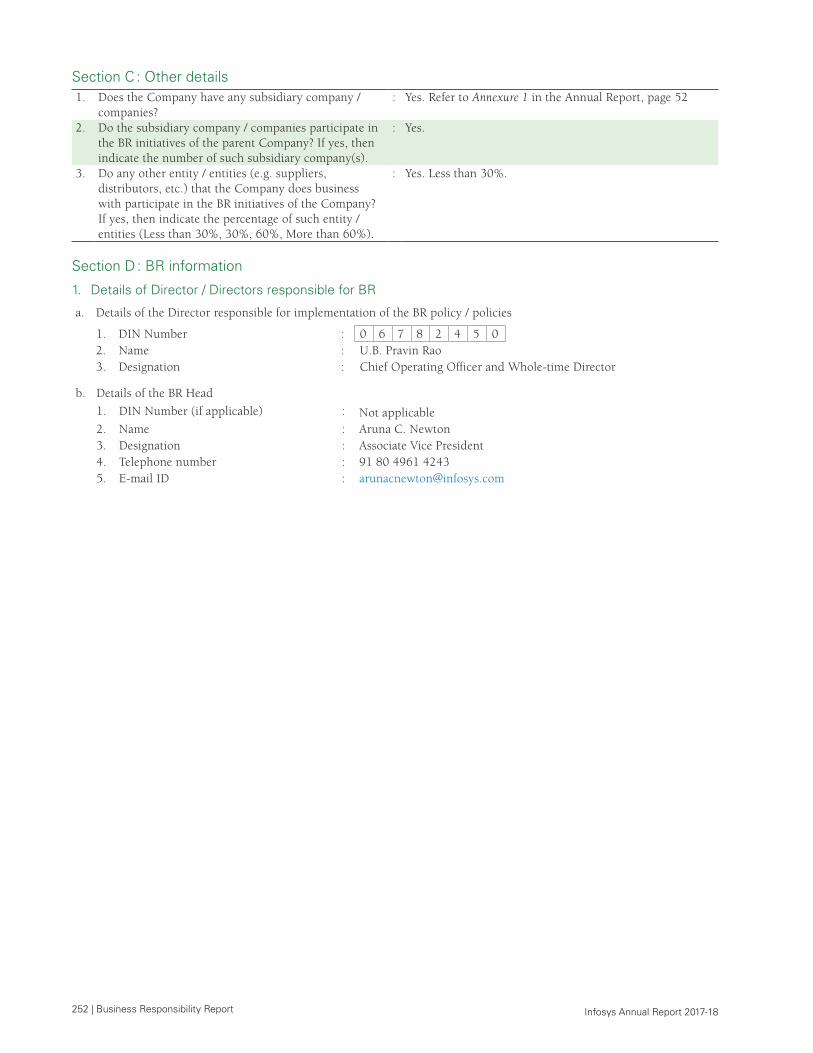
252 | Business Responsibility Report Infosys Annual Report 2017-18
Section C : Other details1. Does the Company have any subsidiary company /
companies?: Yes. Refer to Annexure 1 in the Annual Report, page 52
2. Do the subsidiary company / companies participate in the BR initiatives of the parent Company? If yes, then indicate the number of such subsidiary company(s).
: Yes.
3. Do any other entity / entities (e.g. suppliers, distributors, etc.) that the Company does business with participate in the BR initiatives of the Company? If yes, then indicate the percentage of such entity / entities (Less than 30%, 30%, 60%, More than 60%).
: Yes. Less than 30%.
Section D : BR information
1. Details of Director / Directors responsible for BR
a. Details of the Director responsible for implementation of the BR policy / policies
1. DIN Number : 0 6 7 8 2 4 5 02. Name : U.B. Pravin Rao3. Designation : Chief Operating Officer and Whole-time Director
b. Details of the BR Head
1. DIN Number (if applicable) : Not applicable2. Name : Aruna C. Newton3. Designation : Associate Vice President4. Telephone number : 91 80 4961 42435. E-mail ID : [email protected]

Business R
esponsibility Report | 253
Infosys Annual R
eport 2017-18
2. Principle-wise (as per National Voluntary Guidelines) Business Responsibility (BR) policy / policies (reply with Yes / No)S.No. Questions P1 P2 P3 P4 P5 P6 P7 P8 P91. Do you have a policy / policies for... Yes Yes Yes Yes Yes Yes Yes Yes Yes
2. Has the policy been formulated in consultation with the relevant stakeholders?
Yes Yes Yes Yes Yes Yes Yes Yes Yes
3. Does the policy conform to any national / international standards? Yes Yes Yes Yes Yes Yes Yes Yes Yes
4. Has the policy been approved by the Board? If yes, has it been signed by the MD / owner / CEO / appropriate Board Director?(1)
Yes Yes Yes Yes Yes Yes Yes Yes Yes
5. Does the Company have a specified committee of the Board / Director / Official to oversee the implementation of the policy?
Yes Yes Yes Yes Yes Yes Yes Yes Yes
6. Indicate the link for the policy to be viewed online.
Refer to the Whistleblower Policy, Code of Conduct and Ethics (available on www.infosys.com) and Anti-Bribery Policy (available on our intranet)
Available on our intranet
Available on our intranet
Refer to the CSR Policy (available on www.infosys.com) and Sustainability Policy (available on our intranet).
Available on our intranet
Available on our intranet
Available on our intranet
Refer to the CSR committee charter, CSR Policy (available on www.infosys.com) and Sustainability Policy (available on our intranet).
Available on our intranet
7. Has the policy been formally communicated to all relevant internal and external stakeholders?
Yes Yes Yes Yes Yes Yes Yes Yes Yes
8. Does the Company have an in-house structure to implement the policy / policies?
Yes Yes Yes Yes Yes Yes Yes Yes Yes
9. Does the Company have a grievance redressal mechanism related to the policy / policies to address stakeholders’ grievances related to the policy / policies?
Yes Yes Yes Yes Yes Yes Yes Yes Yes
10. Has the Company carried out independent audit / evaluation of the working of this policy by an internal or external agency?
Yes Yes Yes Yes Yes Yes Yes Yes Yes
Principle-wise index :
P1 – Whistleblower Policy, Anti-Bribery Policy and Code of Conduct and EthicsP2 – Responsible Supply Chain Policy, Supplier Code of Conduct, Information
Security PolicyP3 – HR Policies, Human Rights Statement
P4 – CSR Policy, Sustainability PolicyP5 – Human Rights Statement P6 – HSE Policy
P7 – Sustainability policyP8 – CSR Policy, Sustainability PolicyP9 – Information Security Policy, Brand Guidelines, Data Privacy Policy
(1) Designated department heads, who report to the Chief Executive Officer (CEO) / Chief Operating Officer (COO) monitor and oversee policy implementation. The CEO / COO monitors policy implementation and progress on initiatives and actions through periodic reviews.

254 | Business R
esponsibility Report
Infosys Annual R
eport 2017-18
2a. If answer to Sl. No. 1 against any principle is ‘No’, please explain why (tick up to two options) – Not applicableS.No. Questions P1 P2 P3 P4 P5 P6 P7 P8 P9
1. The Company has not understood the principles.
Not applicable
2. The Company is not at a stage where it finds itself in a position to formulate and implement the policies on specified principles.
3. The Company does not have financial or manpower resources available for the task.
4. It is planned to be done within the next six months.
5. It is planned to be done within the next one year.
6. Any other reason (please specify).
3. Governance related to BR
Indicate the frequency with which the Board of Directors, committee of the Board or CEO assesses the BR performance of the Company – Within 3 months, 3-6 months, annually, more than 1 year.
: The Board of Directors, committees of the Board, and the CEO assesses the BR performance of the Company every three months. For more information, read the ‘Corporate governance’ section in the Board’s report, which is a part of this Annual Report.
Does the Company publish a BR or a Sustainability Report? What is the hyperlink for viewing this report? How frequently is it published?
: Yes, annual. https://www.infosys.com/sustainability/resources/Pages/index.aspx
Section E : Principle-wise performance
Principle No. Description Response
P1 – Business should conduct and govern themselves with ethics, transparency and accountability.
1.1 Does the policy relating to ethics, bribery and corruption cover only the Company? Yes / No. Does it extend to the Group / Joint Ventures / Suppliers / Contractors / NGOs / Others?
Our corporate governance practices apply across the Infosys Group and extend to our suppliers and partners. Our Code of Conduct and Ethics complies with the legal requirements of applicable laws and regulations, including anti-bribery and anti-corruption policies, ethical handling of conflicts of interest, and fair, accurate and timely disclosure of reports and documents that are filed with the required regulatory bodies in the regions we operate. Additionally, we have the Supplier Code of Conduct which sets out standards of ethical conduct for our third parties. We also have the Anti-Bribery Policy and Anti-Corruption Policy for our employees in the Infosys Group.

Business R
esponsibility Report | 255
Infosys Annual R
eport 2017-18
Principle No. Description Response
1.2 How many stakeholder complaints have been received in the past financial year, and what percentage was satisfactorily resolved by the Management? If so, provide the details thereof, in about 50 words or so.
Infosys’ stakeholders include our investors, clients, employees, vendors / partners, government and local communities. For details on investor complaints and resolution, refer to the ‘Investor complaints’ in the Shareholder information which is a part of this Annual Report.
For details on employee grievances and resolution, refer to the table in section 3.7. More details will be available in our Sustainability Report at https://www.infosys.com/sustainability/resources/Pages/index.aspx.
P2 – Businesses should provide goods and services that are safe and contribute to sustainability throughout their life cycle.
2.1 List up to three of your products or services whose design has incorporated social or environmental concerns, risks and / or opportunities.
Infosys is a provider of consulting, technology, out-sourcing and next-generation services. Our sustainability strategy strives to make :• Our business sustainable• Our clients’ businesses sustainable• Our ecosystem sustainable
We continue to work on large-scale, digital-transformation projects that significantly impact the socio-economic progress of the country. Here is a brief account of three such projects we have undertaken this year :
The Government of India’s impetus to digital payments propelled many organizations towards providing enabling services and platforms. The Reserve Bank of India issued Payments Bank licenses to non-banking business entities to promote digital and cashless banking. Infosys’ Finacle® solution has enabled four large Payments Banks to set up their banking operations, thereby empowering crores of citizens to conduct their day-to-day transactions in a digital and paperless manner. Infosys’ core banking solutions have helped reduce the cash reliance, while delivering superior and convenient banking services.
A large commercial vehicle manufacturer in India partnered with Infosys for two technology-based solutions in the highly disorganized aftersales and services market for vehicles. Infosys developed a cloud-native Big Data platform that can help the customer track the vehicle’s health, get vital information in real-time and trigger alerts if the vehicle needs attention. Upon implementation, the service is processing real-time data for more than 1,000 vehicles, and the client is planning to expand this to soon cover about 40,000 commercial vehicles. The other solution developed by Infosys for the client, ensures round-the-clock availability of genuine spares along with doorstep delivery. Today, this program covers 11 states in India, enabling our client to register a strong presence in the aftermarket business in these states.
The Government of India introduced a major socioeconomic reform, the Goods and Services Tax (GST), an indirect tax levied on the supply of goods and services. As a tax reform, GST has introduced a single system of taxation across the country that subsumes most of the indirect taxes from the earlier VAT regime. Infosys created a seamless technology platform for hassle-free registration, return, refund and payments. Within a short time of being rolled out, the platform showed results in the form of increased percentage filing of returns and registrations crossing the one-crore mark. As at March 31, 2018, total registered taxpayers were around 1.06 crore. Around 8.6 crore returns filings were done and over 249.98 crore invoices were uploaded.

256 | Business R
esponsibility Report
Infosys Annual R
eport 2017-18
Principle No. Description Response
2.2 For each such product, provide the following details in respect of resource use (energy, water, raw material, etc.) per unit of product (optional) :
Our business being IT services and consulting, our solutions that have been detailed under 2.1 fuel the digital transformation of our nation.
Being a responsible corporation, we track the consumption of resources critically, and our goals and performance related to these parameters will be provided in our Sustainability Report at https://www.infosys.com/sustainability/resources/Pages/index.aspx.
2.3 Does the Company have procedures in place for sustainable sourcing (including transportation)?
If yes, what percentage of your inputs was sourced sustainably? Also, provide details thereof, in about 50 words or so.
We have a Responsible Supply Chain Policy and a Supplier Code of Conduct. Our suppliers are categorized into three broad categories – People, Services and Products. Our contracts have appropriate clauses and checks to prevent the employment of child labor or forced labor in any form. We also provide forums where suppliers can voice their concerns and issues. We continue to engage with all supplier segments working within our boundary covering People and Services categories by conducting training, assessments and audits on Health and Safety, Compliance and Anti-corruption, Human Rights and Anti-harassment. We engage with local suppliers for our People and Services categories.
2.4 Has the Company taken any steps to procure goods and services from local and small producers, including communities surrounding their place of work? If yes, what steps have been taken to improve their capacity and capability of local and small vendors?
Our Responsible Supply Chain Policy guides our actions in the supply chain and interactions with our supply chain partners. We have a comprehensive engagement model, to meaningfully engage with our suppliers on material aspects. Regular capacity building and assessments are conducted for key suppliers. The proportion of spending on domestic suppliers at significant locations was about 82% in fiscal 2018.
2.5 Does the Company have a mechanism to recycle products and waste?
If yes, what is the percentage of recycling of products and waste (separately as <5%, 5-10%, >10%)? Also, provide details thereof, in about 50 words or so.
As a company aware of the responsible use of finite natural resources, we have adopted a focused approach to manage the waste generated by our operations. Our waste management strategy is framed around the three Rs – Reduce, Reuse and Recycle. Rigorous waste-segregation at source, followed by appropriate treatment or disposal in adherence to applicable legislations, ensures that we send minimum waste to landfills.
For more information, visit our sustainability microsite at https://www.infosys.com/sustainability/.
P3 – Businesses should promote the wellbeing of all employees.
3.1 Please indicate the total number of employees.
Our global full-time, permanent employee count stands at 2,04,107 as on March 31, 2018.
3.2 Please indicate the total number of employees hired on a temporary / contractual / casual basis.
Most of our employees work as full-time, permanent employees. More details will be available in our Sustainability Report at https://www.infosys.com/sustainability/resources/Pages/index.aspx.

Business R
esponsibility Report | 257
Infosys Annual R
eport 2017-18
Principle No. Description Response
3.3 Please indicate the number of permanent women employees.
The number of our global permanent women employees is 73,717 as on March 31, 2018.
3.4 Please indicate the number of permanent employees with disabilities.
Being an equal opportunity employer, we encourage employees to disclose their disabilities and seek reasonable accommodation to allow them to perform to their full potential.
The number of employees who have voluntarily disclosed their disability status and the nature of disability stands at 283, as on March 31, 2018.
3.5 Do you have an employee association that is recognized by the Management?
We recognize the right to freedom of association through Collective Bargaining Agreements (CBAs) in accordance with the guidelines and compliance frameworks put forth by governments in countries where we have our operations.
A de minimis percentage of our employees are covered by CBA.
We have established multiple channels to engage and communicate with our employees across levels. We have frequent interactive sessions with the top leaders across locations through townhalls. In addition, we have employee communication channels such as organization-wide mailers, newsletters within units, our corporate intranet (Sparsh), corporate TV channel (InfyTV), corporate radio channel (InfyRadio), our social networking hub (Yammer), the annual employee satisfaction survey – LITMUS (Let’s Interact on Themes that Matter to Us), blogs, an exclusive platform for managers (Managers Portal) and our internal branding and marketing portal, MPlus. Each of these communication channels gives a much-needed impetus to foster a culture of networking in a fast-growing environment.
3.6 What percentage of your permanent employees are members of this recognized employee association?
Details will be available in our Sustainability Report at https://www.infosys.com/sustainability/resources/Pages/index.aspx.
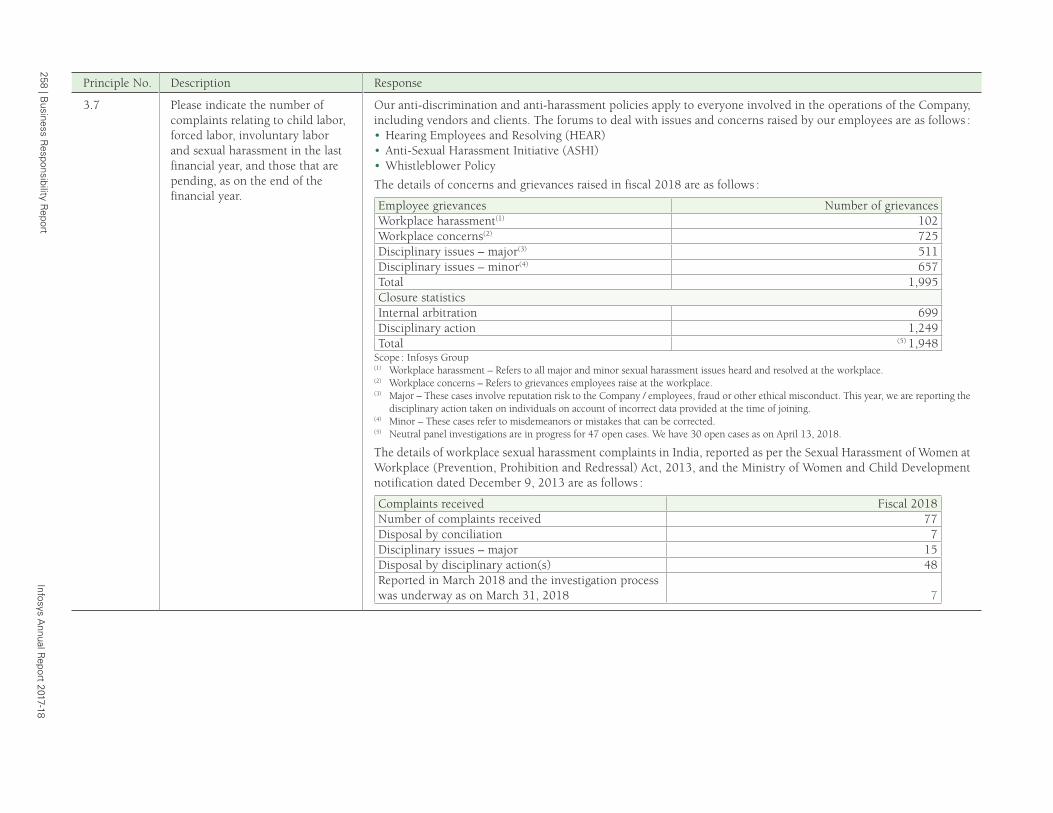
258 | Business R
esponsibility Report
Infosys Annual R
eport 2017-18
Principle No. Description Response
3.7 Please indicate the number of complaints relating to child labor, forced labor, involuntary labor and sexual harassment in the last financial year, and those that are pending, as on the end of the financial year.
Our anti-discrimination and anti-harassment policies apply to everyone involved in the operations of the Company, including vendors and clients. The forums to deal with issues and concerns raised by our employees are as follows :• Hearing Employees and Resolving (HEAR)• Anti-Sexual Harassment Initiative (ASHI)• Whistleblower Policy
The details of concerns and grievances raised in fiscal 2018 are as follows :
Employee grievances Number of grievancesWorkplace harassment(1) 102Workplace concerns(2) 725Disciplinary issues – major(3) 511Disciplinary issues – minor(4) 657Total 1,995Closure statisticsInternal arbitration 699Disciplinary action 1,249Total (5) 1,948
Scope : Infosys Group (1) Workplace harassment – Refers to all major and minor sexual harassment issues heard and resolved at the workplace. (2) Workplace concerns – Refers to grievances employees raise at the workplace.(3) Major – These cases involve reputation risk to the Company / employees, fraud or other ethical misconduct. This year, we are reporting the
disciplinary action taken on individuals on account of incorrect data provided at the time of joining.(4) Minor – These cases refer to misdemeanors or mistakes that can be corrected.(5) Neutral panel investigations are in progress for 47 open cases. We have 30 open cases as on April 13, 2018.
The details of workplace sexual harassment complaints in India, reported as per the Sexual Harassment of Women at Workplace (Prevention, Prohibition and Redressal) Act, 2013, and the Ministry of Women and Child Development notification dated December 9, 2013 are as follows :
Complaints received Fiscal 2018Number of complaints received 77Disposal by conciliation 7Disciplinary issues – major 15Disposal by disciplinary action(s) 48Reported in March 2018 and the investigation process was underway as on March 31, 2018 7

Business R
esponsibility Report | 259
Infosys Annual R
eport 2017-18
Principle No. Description Response
3.8 What percentage of your under-mentioned employees were given safety and skill up-gradation training in the last year?• Permanent employees• Permanent women employees• Casual / temporary / contractual
employees• Employees with disabilities
Skill up-gradation : Our training programs cover all our employees irrespective of race, gender, or physical disability. Our Education, Training and Assessment (ETA) group offers industry-benchmarked learning programs to ensure talent enablement.
The total number of training days for the last three years is as follows :
Particulars Fiscal 2018 Fiscal 2017 Fiscal 2016
Employee count 2,04,107 2,00,364 1,94,044
Total training days 16,87,983 20,40,962 21,22,318
Safety : Ozone, our Heath, Safety and Environmental Management System (HSEMS) seeks to provide a safe and healthy workplace to our employees, visitors and contract workers. The initiative also keeps personnel well-informed, trained and committed to our Health, Safety and Environment (HSE) policy and procedures.
The HSE training needs are identified for different personnel based on the nature of their jobs. Accordingly, training – including awareness sessions, mock drills, classroom sessions and periodic demonstrations related to safety, security and well-being is provided. HSEMS training is also a part of our employee-induction programs. E-learning modules have also been rolled out for creating awareness.
P4 – Businesses should respect the interests of, and be responsive towards all stakeholders, especially those who are disadvantaged, vulnerable and marginalized.
4.1 Has the Company mapped its internal and external stakeholders?
Yes. The details are provided on our website, at https://www.infosys.com/sustainability/about-us/overview/pages/index.aspx.
4.2 Out of the above, has the Company identified the disadvantaged, vulnerable and marginalized stakeholders?
Yes. The details are provided under ‘Foundations’ tab on our website, at https://www.infosys.com/sustainability/social.
4.3 Are there any special initiatives undertaken by the Company to engage with the disadvantaged, vulnerable and marginalized stakeholders? If so, provide the details thereof, in about 50 words or so.
Yes, as a socially responsible organization, we are committed to work for the welfare of the communities around us. Our community engagement interventions include :• Grant-making• Organization-led projects• Employee-driven initiatives• Community sabbaticals
For more details on our work with communities, refer to Annexure 7 to Boards’ report in the Annual Report and our websites, www.infosys.org and https://www.infosys.com/sustainability/.
P5 – Businesses should respect and promote human rights.
5.1 Does the policy of the Company on human rights cover only the Company or extend to the Group / Joint Ventures / Suppliers / Contractors / NGOs / Others?
Yes, all companies in the Infosys Group including employees and contractors are covered by the policy.

260 | Business R
esponsibility Report
Infosys Annual R
eport 2017-18
Principle No. Description Response
5.2 How many stakeholder complaints have been received in the past financial year, and what percentage was satisfactorily resolved by the Management?
Our stakeholder engagement processes are robust and have strong listening mechanisms.
Additionally, all stakeholders have access to the Whistleblower Policy of Infosys at https://www.infosys.com/investors/corporate-governance/Documents/whistleblower-policy.pdf.
Refer to the table under 1.2 for more information.
P6 – Business should respect, protect, and make efforts to restore the environment.
6.1 Does the policy related to Principle 6 cover only the Company, or does it extend to the Group / Joint Ventures / Suppliers / Contractors / NGOs / Others?
Protection of the environment ranks high among our corporate goals and as a responsible corporate citizen, we have established a global HSE policy which defines our commitment to ensure environmental protection. The policy is made available to all our employees worldwide on Sparsh (our intranet), and as posters and instructions on digital and physical display areas across our campuses. It is also published in our sustainability microsite. We are certified to ISO 14001:2015 and OHSAS 18001:2007 at 64% of our locations in India. All personnel working for or on behalf of the organization are expected to mandatorily adhere to the established HSE policy and procedures. Vendor partners are also encouraged or influenced to follow our stated HSE requirements at a minimum and ensure compliance as detailed in our agreements.
6.2 Does the Company have strategies / initiatives to address global environmental issues such as climate change, global warming, etc? Yes / No. If yes, please give the hyperlink for the web page, etc.
Global environmental issues are addressed as a part of our business context. Our efforts included aggressive targets to reduce consumption and switch to renewable energy resources for our business operations. We have undertaken aggressive goals of carbon neutrality, reducing our per capita energy consumption by 50%.
For more details, visit our website, www.infosys.com, and our sustainability microsite, https://www.infosys.com/sustainability/.
6.3 Does the Company identify and assess potential environmental risks?
Environmental risks form a part of our operational risks in the ‘Integrated Risk Management’ framework. Ozone, our Health, Safety and Environment Management System (HSEMS), guides our efforts in managing environmental impacts of our operations.
Read our Sustainability Reports at https://www.infosys.com/sustainability/about-us/overview/pages/index.aspx for information on the progress of our environmental sustainability efforts.
6.4 Does the Company have any project related to the Clean Development Mechanism? If so, provide details thereof, in about 50 words or so. Also, if yes, has any environmental compliance report been filed?
Not applicable

Business R
esponsibility Report | 261
Infosys Annual R
eport 2017-18
Principle No. Description Response
6.5 Has the Company undertaken any other initiatives on clean technology, energy efficiency, renewable energy, etc.? Yes / No. If yes, please give the hyperlink for the web page, etc.
In continuation with our efforts to invest more in cleaner and greener technologies, we installed a solar farm of 30MW capacity in Karnataka. Apart from the large-scale installations, we are also investing in roof-top solar plants at various locations pan India.
For more details, visit our website, www.infosys.com, and our sustainability microsite, https://www.infosys.com/sustainability/environment.
6.6 Are the emissions / waste generated by the Company within the permissible limits given by CPCB / SPCB for the financial year being reported?
Yes, we comply with all applicable environmental legislations in the locations we operate from. We monitor and track all parameters as defined by CPCB or SPCBs and ensure they are maintained within norms.
For more details, visit our sustainability microsite, https://www.infosys.com/sustainability/.
6.7 Number of show cause / legal notices received from CPCB / SPCB which are pending (i.e., not resolved to satisfaction) as on the end of the financial year.
We did not have any monetary or non-monetary sanctions imposed on us for non-compliance with environmental laws and regulations during fiscal 2018.
P7 – Businesses, when engaged in influencing public and regulatory policy, should do so in a responsible manner.
7.1 Is your Company a member of any trade and chamber or association? If yes, name only those major ones that your business deals with.
Yes, as an industry influencer, we are part of global and local associations. We forge strategic partnerships with industry bodies and consortiums at the local, national and international levels. The following are the significant associations during fiscal 2018 :a. National Association of Software and Services Companies (NASSCOM)b. World Business Council for Sustainable Development (WBCSD)c. Confederation of Indian Industry (CII)d. Federation of Indian Chambers of Commerce and Industry (FICCI)e. IEEE Bangalore Sectionf. Indo-Australian Chamber of Commerceg. business disability international (bdi)h. Chamber of Commerce of the U.S.A.i. National Renewable Energy Laboratory (NREL), USj. Alliance for an Energy Efficient Economy (AEEE), Indiak. Solar Energy Research Institute for India and the US (SERIIUS)l. Indian Green Building Council (IGBC)m. United Nations Economic and Social Commission for Asia and the Pacific (UNESCAP)n. United States Green Building Council (USGBC)o. Center for the Built Environment, Berkley (CBE) p. RE 100q. World Economic Forum (WEF)

262 | Business R
esponsibility Report
Infosys Annual R
eport 2017-18
Principle No. Description Response
7.2 Have you advocated / lobbied through the above associations for the advancement or improvement of public good? Yes / No. If yes, specify the broad areas (Governance and Administration, Economic Reforms, Inclusive Development Policies, Energy Security, Water, Food Security, Sustainable Business Principles, Others).
We believe that it is our responsibility to help build a better business environment and thus a better world with opportunities for everyone. Our advocacy efforts are championed across the world by our senior leaders. In an effort to drive advocacy globally and locally, we have been part of governance bodies of national and international organizations across economic, social and environmental dimensions.
For more details, visit https://www.infosys.com/sustainability/about-us/overview/Pages/partnerships.aspx.
P8 – Businesses should support inclusive growth and equitable development.
8.1 Does the Company have specified programs / initiatives / projects in pursuit of the policy related to Principle 8? If yes, provide the details thereof.
Our corporate social responsibility supports inclusive growth of not only communities where we have our operations, but also encompasses the overall development of societies and human capabilities. From uplifting the poorest sections of the society through the Infosys Foundation, promoting science and math education in the US through the Infosys Foundation USA, encouraging science and research through the Infosys Science Foundation, increasing the employability of engineering students through Campus Connect, to empowering our employees to become responsible citizens through volunteering, we will continue to strive towards inclusive growth and community development.
For more details, refer to www.infosys.org and https://www.infosys.com/sustainability/social.
8.2 Are the programs / projects undertaken through an in-house team / own foundation / external NGO / government structures / any other organization?
Infosys has established foundations in India and the US. For more details on our work with the community, visit www.infosys.org and https://www.infosys.com/sustainability/social.
8.3 Have you done any impact assessment of your initiative?
Yes, the impact due to the Foundations’ programs are provided on the respective websites, www.infosys.org and https://www.infosys.com/sustainability/social.
8.4 What is your Company’s direct contribution to community development projects – amount in ` and the details of the projects undertaken.
Refer to Annexure 7 of the Annual Report. For more details on our work with the community, visit www.infosys.org and https://www.infosys.com/sustainability/social.
8.5 Have you taken steps to ensure that this community development initiative is successfully adopted by the community? Please explain in 50 words or so.
Yes, a majority of our community development projects go beyond the philanthropic one-time engagement and are designed for self-sustenance through a ‘teach fishing’ model. For more details on our work with the community, visit www.infosys.org and https://www.infosys.com/sustainability/social.

Business R
esponsibility Report | 263
Infosys Annual R
eport 2017-18
Principle No. Description Response
P9 – Businesses should engage with and provide value to their customers and consumers in a responsible manner.
9.1 What percentage of client complaints / consumer cases are pending as on the end of the financial year?
None
9.2 Does the Company display product information on the product label, over and above what is mandated as per local laws? Yes / No / NA / Remarks (additional information).
Not applicable
9.3 Is there any case filed by any stakeholder against the Company regarding unfair trade practices, irresponsible advertising, and / or anti-competitive behavior during the last five years and pending as on the end of the financial year? If so, provide the details thereof, in about 50 words or so.
We have various mechanisms to receive and address complaints from stakeholders related to compliance, corruption or bribery. As of March 31, 2018, no stakeholder has filed any case against the Company, nor are any cases pending regarding unfair trade practices, irresponsible advertising and / or anti-competitive behavior.
9.4 Did your Company carry out any consumer survey / measure consumer satisfaction trends?
Customer-focused excellence demands constant sensitivity to changing and emerging customer requirements and close attention to the voice of the customer. We interact with our clients on a regular basis and across multiple platforms. In addition to various client interactions, we have adopted a formal and robust approach in the form of an annual Client Value Survey. The survey enables us to comprehensively understand the client’s expectations and needs, and serves as one of the inputs to make investment decisions. The survey framework includes a structured questionnaire and the feedback is collected through a web survey hosted by an independent organization. The survey is designed to provide the following insights :
• Client expectations and fulfilment
• Client disposition : Overall experience of working with Infosys, Satisfaction, Loyalty, advocacy and value for money.
• Client priorities
• Service line feedback
The account teams use this data to review their relationships with clients and to design interventions that create a positive and visible impact on our clients. Various members across levels engage with the clients to implement the improvement actions.
Infosys’ customer experience increased significantly in 2017. All four measures of client expectations and fulfilment, client disposition, client priorities and service line feedback witnessed a healthy increase.
For more details on our business and sustainable practices, visit our website, www.infosys.com/investors/reports-filings and https://www.infosys.com/sustainability.

Infosys Annual Report 2017-18
Notes

Infosys Annual Report 2017-18
Notes

Infosys Annual Report 2017-18
Safe HarborThis Annual Report contains ‘forward-looking statements’ that are based on our current expectations, assumptions, estimates and projections about the Company, our industry, economic conditions in the markets in which we operate, and certain other matters. Generally, these forward-looking statements can be identified by the use of forward-looking terminology such as ‘anticipate’, ‘believe’, ‘estimate’, ‘expect’, ‘intend’, ‘will’, ‘project’, ‘seek’, ‘should’ and similar expressions. Those statements include, among other things, the discussions of our business strategy and expectations concerning our market position, future operations, margins, profitability, liquidity and capital resources. These statements are subject to known and unknown risks, uncertainties and other factors, which may cause actual results or outcomes to differ materially from those implied by the forward-looking statements. Important factors that may cause actual results or outcomes to differ from those implied by the forward-looking statements include, but are not limited to, those discussed in the “Outlook, risks and concerns” section in this Annual Report. In light of these and other uncertainties, you should not conclude that the results or outcomes referred to in any of the forward-looking statements will be achieved. All forward-looking statements included in this Annual Report are based on information available to us on the date hereof, and we do not undertake to update these forward-looking statements unless required to do so by law.
Creative concept and design by Communication Design Group, Infosys Limited.© 2018 Infosys Limited, Bengaluru, India. Infosys acknowledges the proprietary rights in the trademarks and product names of other companies mentioned in this report.


www.infosys.com
The Annual Report is printed on 100% recycled paper certified by the UK-based National Association of Paper Merchants (NAPM) and Germany-based Blue Angel.
To read the report online : https://www.infosys.com/AR-2018

May 17, 2018
Dear member,
You are cordially invited to attend the 37th Annual General Meeting of the members of Infosys Limited (‘the Company’) to be held on Saturday, June 23, 2018 at 3:00 p.m. IST at the Christ University Auditorium, Hosur Road, Bengaluru 560 029, Karnataka, India.
The Notice of the meeting, containing the business to be transacted, is enclosed herewith. As per Section 108 of the Companies Act, 2013, read with the related Rules and Regulation 44 of the SEBI (Listing Obligations and Disclosure Requirements) Regulations, 2015, the Company is pleased to provide its members the facility to cast their vote by electronic means on all resolutions set forth in the Notice. The instructions for e-voting are enclosed herewith.
Very truly yours,
Nandan M. NilekaniChairman
Enclosures :1. Notice of the 37th Annual General Meeting (AGM)2. Proxy form3. Attendance slip4. Instructions for e-voting
Note : Attendees who are differently-abled and require assistance at the AGM are requested to contact: Bhawesh Kumar, Regional Head – Facilities, Infosys Limited, Electronics City, Hosur Road, Bengaluru 560 100, India. Tel: 91 80 3980 2035 Ext : 2035, Mobile : 91 98451 80174
INFOSYS LIMITEDCIN : L85110KA1981PLC013115Electronics City, Hosur RoadBengaluru 560 100, IndiaTel : 91 80 2852 0261Fax : 91 80 2852 0362

2 | Notice of the 37th Annual General Meeting Infosys Limited
Hosur Main Road
Dairy Circle Flyover
Dairy Circle Road
H
osur Road
Hosur Road
From Silk Board
Christ University Auditorium
Bangalore Dairy
New Mico Road
AdugodiPolice Station
Bosch
MicoFactory
ForumMall
St. Anthony’sChurch
St. John’s Hospital
NIMHANS
Sarjapur Road
Outer Ring Road Outer Ring Road
Ba
nner
ghat
ta M
ain
Road
Ba
nner
ghat
ta M
ain
Road
Koramangala
Madiwala
Silk Board
From
M. G
. Roa
d
Route map to the venue of the AGM
Christ University AuditoriumHosur Road,Bengaluru 560 029Karnataka, India.www.christuniversity.in
For queries, contact us :+91 80 2852 [email protected]
Notice of the 37th Annual General Meeting | 3Infosys Limited
Notice of the 37th Annual General Meeting
Notice is hereby given that the 37th Annual General Meeting (AGM) of the members of Infosys Limited will be held on Saturday, June 23, 2018, at 3:00 p.m. IST at the Christ University Auditorium, Hosur Road, Bengaluru 560 029, Karnataka, India, to transact the following business :
Ordinary business
Item no. 1 – Adoption of financial statementsTo consider and adopt the audited financial statements (including the consolidated financial statements) of the Company for the financial year ended March 31, 2018 and the reports of the Board of Directors (‘the Board’) and auditors thereon.
Item no. 2 – Declaration of dividendTo declare a final dividend of ` 20.50 per equity share and a special dividend of ` 10.00 per equity share. Further, to approve an interim dividend of ` 13.00 per equity share, already paid during the year, for the year ended March 31, 2018.
Item no. 3 – Appointment of U.B. Pravin Rao as a director liable to retire by rotationTo appoint a director in place of U.B. Pravin Rao (DIN: 06782450), who retires by rotation and, being eligible, seeks reappointment.Explanation : Based on the terms of appointment, executive directors and the non-executive, non-independent Chairman are subject to retirement by rotation. U.B. Pravin Rao, who was appointed on August 18, 2017 in the current term, and is the longest-serving member on the Board, retires by rotation and, being eligible, seeks reappointment.To the extent that U.B. Pravin Rao is required to retire by rotation, he would need to be reappointed as a director.Therefore, shareholders are requested to consider and if thought fit, to pass the following resolution as an ordinary resolution :RESOLVED THAT, pursuant to the provisions of Section 152 and other applicable provisions of the Companies Act, 2013, the approval of the members of the Company be, and is hereby accorded to the reappointment of U.B. Pravin Rao (DIN: 06782450) as a director, to the extent that he is required to retire by rotation.
Item no. 4 – Ratification of appointment of auditorsTo ratify the appointment of auditors of the Company, and to fix the remuneration payable to them for the financial year ending March 31, 2019, as may be determined by the Board of Directors in consultation with the auditors, and that such remuneration may be paid on a progressive billing basis as may be agreed upon between the auditors and the Board of Directors.Explanation : Under Section 139 of the Companies Act, 2013 (‘the Act’) and the Rules made thereunder, it is mandatory to rotate the statutory auditors on completion of the maximum term permitted under the said section. In line with the requirements of the Act, Deloitte Haskins & Sells LLP, Chartered Accountants (Firm registration number : 117366 W/W 100018) (‘Deloitte’) was appointed as the statutory auditors of the Company to hold office for a period of five consecutive years from the conclusion of the 36th Annual General Meeting of the Company held on June 24, 2017, till the conclusion of the 41st Annual General Meeting to be held in the year 2022, subject to ratification by shareholders at the general meeting or as may be necessitated by the Act from time to time. The first year of audit was of the financial statements for the year ending March 31, 2018, which included the audit of the quarterly financial statements for the year. Accordingly, the appointment of Deloitte Haskins & Sells LLP is being placed before the shareholders for ratification.RESOLVED THAT, pursuant to Section 139, 142 and other applicable provisions of the Companies Act, 2013 and the Rules made thereunder, as amended from time to time, pursuant to the recommendations of the audit committee of the Board of Directors, and pursuant to the resolution passed by the members at the AGM held on June 24, 2017, the appointment of Deloitte Haskins & Sells LLP, Chartered Accountants (Firm registration number : 117366 W/W 100018) as the auditors of the Company to hold office till the conclusion of the next AGM be and is hereby ratified and that the Board of Directors be and is hereby authorized to fix the remuneration payable to them for

4 | Notice of the 37th Annual General Meeting Infosys Limited
the financial year ending March 31, 2019, as may be determined by the audit committee in consultation with the auditors, and that such remuneration may be paid on a progressive billing basis as may be agreed upon between the auditors and the audit committee / Board of Directors.
Registered office :Electronics City, Hosur RoadBengaluru 560 100India
by order of the Board of Directors for Infosys Limited
A.G.S. ManikanthaCompany Secretary April 13, 2018
Notes1. A member entitled to attend and vote at the AGM is entitled to appoint a proxy to attend and vote in the
meeting instead of himself / herself, and the proxy need not be a member of the Company. A person can act as a proxy on behalf of a maximum of 50 members and holding in aggregate not more than 10% of the total share capital of the Company. A member holding more than 10% of the total share capital of the Company carrying voting rights may appoint a single person as proxy, provided that the person does not act as proxy for any other person or shareholder.
2. Corporate members intending to send their authorized representatives to attend the meeting are requested to send a certified copy of the Board resolution to the Company or upload it on the e-voting portal, authorizing their representative to attend and vote on their behalf at the meeting.
3. The instrument appointing the proxy, duly completed, must be deposited at the Company’s registered office not less than 48 hours before the commencement of the meeting (on or before June 21, 2018, 3:00 p.m. IST). A proxy form for the AGM is enclosed.
4. During the period beginning 24 hours before the time fixed for the commencement of the AGM and until the conclusion of the meeting, a member would be entitled to inspect the proxies lodged during the business hours of the Company, provided that not less than three days of notice in writing is given to the Company.
5. Members / proxies / authorized representatives should bring the duly filled attendance slip enclosed herewith to attend the meeting.
6. The Register of Directors and Key Managerial Personnel and their shareholding, maintained under Section 170 of the Act, and the Register of Contracts or Arrangements in which the directors are interested, maintained under Section 189 of the Act, will be available for inspection by the members at the AGM.
7. The Register of Members and Share Transfer Books will remain closed on June 16, 2018 for the purpose of payment of the final dividend for the financial year ended March 31, 2018, special dividend and the AGM.
8. Subject to the provisions of the Act, dividend as recommended by the Board, if declared at the meeting, will be paid within a period of 30 days from the date of declaration, to those members whose names appear on the Register of Members as at the end of June 15, 2018. The final dividend is ` 20.50 per equity share and special dividend is ` 10.00 per equity share. The dividend will be paid on or before June 26, 2018.
9. Members whose shareholding is in electronic mode are requested to direct change of address notifications and updates of bank account details to their respective depository participant(s). We urge the members to utilize the Electronic Clearing System (ECS) for receiving dividends.
10. Members are requested to address all correspondence, including on dividends, to the Registrar and Share Transfer Agents, Karvy Computershare Private Limited, Unit : Infosys Limited, Karvy Selenium Tower B, Plot 31-32, Gachibowli, Financial District, Nanakramguda, Hyderabad 500 032.
11. Members wishing to claim dividends that remain unclaimed are requested to correspond with the Registrar and Share Transfer Agents as mentioned above, or to the Company Secretary, at the Company’s registered office. Members are requested to note that dividends that are not claimed within seven years from the date of transfer to the Company’s Unpaid Dividend Account, will, as per Section 124 of the Act, be transferred to the Investor Education and Protection Fund (IEPF). Shares on which dividend remains unclaimed for seven consecutive years will be transferred to the IEPF as per Section 124 of the Act, and the applicable rules.
12. We urge members to support our commitment to environmental protection by choosing to receive their shareholding communication through email. You can do this by updating your email addresses with your depository participants.

Notice of the 37th Annual General Meeting | 5Infosys Limited
13. In compliance with Section 108 of the Act, read with corresponding rules, and Regulation 44 of the SEBI (Listing Obligations and Disclosure Requirements) Regulations, 2015 (‘the Listing Regulations’), the Company has provided a facility to its members to exercise their votes electronically through the electronic voting (e-voting) service facilitated by the National Securities Depository Limited (NSDL). The facility for voting will also be made available at the AGM and members attending the AGM, who have not already cast their votes by remote e-voting shall be able to exercise their right at the AGM. Members who have cast their votes by remote e-voting prior to the AGM may attend the AGM but shall not be entitled to cast their votes again. The instructions for e-voting are annexed to the Notice. The Board has appointed Parameshwar G. Hegde, Practicing Company Secretary, as the Scrutinizer to scrutinize the e-voting / ballot process / instapoll in a fair and transparent manner.
14. The e-voting period commences on June 18, 2018 (9:00 a.m. IST) and ends on June 22, 2018 (5:00 p.m. IST). During this period, members holding shares either in physical or dematerialized form, as on the cut-off date, i.e. June 16, 2018 may cast their vote electronically. The e-voting module will be disabled by NSDL for voting thereafter. A member will not be allowed to vote again on any resolution for which the vote has already been cast. The voting rights of members shall be proportionate to their share of the paid-up equity share capital of the Company as on the cut-off date, i.e. June 16, 2018. E-voting rights cannot be exercised by a proxy, though corporate and institutional shareholders shall be entitled to vote through their authorized representatives with proof of their authorization.
15. The Annual Report 2017-18, the Notice of the 37th AGM, and instructions for e-voting, along with the attendance slip and proxy form, are being sent by electronic mode to members whose email addresses are registered with the Company / depository participant(s), unless a member has requested for a physical copy of the documents. For members who have not registered their email addresses, physical copies are being sent by the permitted mode.
16. Members may also note that the Notice of the 37th AGM and the Infosys Annual Report 2017-18 will be available on the Company’s website, www.infosys.com.
17. Additional information, pursuant to Regulation 36 of the Listing Regulations, in respect of the directors seeking appointment / reappointment at the AGM, forms part of the Notice.
18. The SEBI has mandated the submission of the Permanent Account Number (PAN) by every participant in the securities market. Members holding shares in electronic form are, therefore, requested to submit their PAN to their depository participant(s). Members holding shares in physical form are required to submit their PAN details to the Registrar and Share Transfer Agents.
19. All documents referred to in the Notice will be available for inspection at the Company’s registered office during normal business hours on working days up to the date of the AGM.
• The attendance registration procedure for the AGM is as follows:a. Shareholders are requested to tender their attendance slips at the registration counters at the venue of the
AGM and seek registration before entering the meeting hall.b. Alternatively, to facilitate smooth registration / entry, the Company has also provided a web check-in facility,
which would help the shareholder enter the AGM hall directly without going through the registration formalities at the registration counters.
c. The web check-in facility will be available from June 20, 2018 (9:00 a.m. IST) to June 22, 2018 (5:00 p.m. IST).• The procedure of web check-in for the AGM is as follows :
a. Log in to https://karisma.karvy.com and click on the web check-in link.b. Select the company name.c. Pass through the security credentials viz., DP ID, Client ID / Folio entry, PAN No., and ‘CAPTCHA’ as directed
by the system and click on the ‘Submit’ button.d. The system will validate the credentials. Click on the ‘Generate my attendance slip’ button that appears on
the screen.e. The attendance slip in PDF format will appear on the screen. Select the ‘PRINT’ option for direct printing
or download and save for printing.The shareholder needs to furnish the printed attendance slip along with a valid identity proof such as the PAN card, passport, AADHAAR card or driving license to enter the AGM hall.
Registered office :Electronics City, Hosur RoadBengaluru 560 100India
by order of the Board of Directorsfor Infosys Limited
A.G.S. ManikanthaCompany Secretary April 13, 2018

6 | Notice of the 37th Annual General Meeting Infosys Limited
Additional information on director recommended for appointment / reappointment as required under Regulation 36 of SEBI (Listing Obligations and Disclosure Requirements) Regulations, 2015
U.B. Pravin Rao
U.B. Pravin Rao is the Chief Operating Officer and a whole-time director of Infosys Limited. He was inducted on January 10, 2014 as a member of the Board. Pravin was the Interim Chief Executive Officer and Managing Director from August 18, 2017 to January 2, 2018.As Chief Operating Officer of Infosys Limited, Pravin has overall strategic and operational responsibility for the entire portfolio of the Company’s offerings. He oversees the key functions of global sales, global delivery and business enablement. He drives the continuous renewal of key processes, systems and policies across the Company in client relationship management, sales effectiveness, delivery excellence, quality, talent management and leadership development. Pravin has over 30 years of industry experience. Since joining Infosys in 1986, Pravin has held a number of senior leadership roles including Head of Infrastructure Management Services, Delivery Head for Europe, and Head of Retail, Consumer Packaged Goods, Logistics and Life Sciences.Pravin holds a degree in electrical engineering from Bangalore University, India. He is a member of the National Council of the Confederation of Indian Industry (CII) and the Executive Councils of NASSCOM and the World Business Council for Sustainable Development (WBCSD).
Age – 56 years
Nature of expertise in specific functional areasInformation Technology Services and Business Management
Disclosure of inter-se relationships between directors and Key Managerial PersonnelNil
Listed companies (other than Infosys Group) in which U.B. Pravin Rao holds directorship and committee membership :DirectorshipNilChairperson / Membership of Board committeesNil
Shareholding in the Company5,30,036
Note : Details of U.B. Pravin Rao’s remuneration and number of Board meetings attended during fiscal 2018 are provided in the Corporate governance report section of the Annual Report 2017-18.
Instructions for e-voting
A detailed list of instructions for e-voting is annexed to this Notice.

Notice of the 37th Annual General Meeting | 7Infosys Limited
Proxy form
[Pursuant to Section 105(6) of the Companies Act, 2013 and Rule 19 (3) of the Companies (Management and Administration) Rules, 2014 – Form No. MGT-11]
INFOSYS LIMITEDCIN : L85110KA1981PLC013115
Electronics City, Hosur Road, Bengaluru 560 100, India, 91 80 2852 0261, 91 80 2852 0362
[email protected] | www.infosys.com
37th Annual General Meeting – June 23, 2018
Name of the member(s)
Registered address
Registered email address
Folio no. / Client ID
DP ID
I / We, being the member(s) of ………………….………………………………………. shares of the above named company, hereby appoint
Name : .......................................................................... Email : ......................................................................
Address : ..................................................................................................................................................................
....................................................................................................Signature : __________________________
or failing him / her
Name : .......................................................................... Email : ......... .............................................................
Address : ..................................................................................................................................................................
....................................................................................................Signature : __________________________
or failing him / her
Name : .......................................................................... Email : ......................................................................
Address : ..................................................................................................................................................................
... .................................................................................................Signature : __________________________

8 | Notice of the 37th Annual General Meeting Infosys Limited
as my / our proxy to attend and vote (on a poll) for me / us and on my / our behalf at the 37th Annual General Meeting of the Company, to be held on Saturday, June 23, 2018, at 3:00 p.m. IST, at the Christ University Auditorium, Hosur Road, Bengaluru 560 029, Karnataka, India and at any adjournment thereof in respect of such resolutions as are indicated below :
Resolution number
Resolution Vote (Optional, see Note 2)(Please mention no. of shares)
For Against
Ordinary business
1 Adoption of financial statements
2 Declaration of dividend
3 Appointment of U.B. Pravin Rao as a director liable to retire by rotation
4 Ratification of appointment of auditors
Signed this …………………………………. day of ………………………… 2018.
……………………………....……Signature of the member
………………………...............…………Signature of the proxy holder(s)
Affix revenue
stamp of not less than
` 1
Notes :1. This form, in order to be effective, should be duly stamped, completed, signed and deposited at the registered office of the Company, not
less than 48 hours before the Annual General Meeting (on or before 3:00 p.m. IST on June 21, 2018).2. It is optional to indicate your preference. If you leave the ‘for’ or ‘against’ column blank against any or all of the resolutions, your proxy will
be entitled to vote in the manner as he / she may deem appropriate.
Attendance slip
INFOSYS LIMITEDCIN : L85110KA1981PLC013115
Electronics City, Hosur Road, Bengaluru 560 100, India, 91 80 2852 0261, 91 80 2852 0362
[email protected] | www.infosys.com
37th Annual General Meeting – June 23, 2018
Registered Folio no. / DP ID no. / Client ID no. :
Number of shares held :
I certify that I am a member / proxy / authorized representative for the member of the Company.I hereby record my presence at the 37th Annual General Meeting of the Company at the Christ University Auditorium, Hosur Road, Bengaluru 560 029, Karnataka, India, on Saturday, June 23, 2018, at 3:00 p.m. IST.
………………...........………………… ………………………...............…………Name of the member / proxy Signature of the member / proxy(in BLOCK letters)
Note : Please fill up this attendance slip and hand it over at the entrance of the meeting hall at the registration desk. Members are requested to bring their copies of the Annual Report to the AGM.
…………………………………….........………Please tear here…………………………………………………………

Registered Folio no. / DP ID no. / Client ID no. :
<<ID1>>
Number of shares held :
Dear member,
Subject : Instructions for e-votingPursuant to the provisions of Section 108 of the Companies Act, 2013, Rule 20 of the Companies (Management and Administration) Rules, 2014, substituted by Companies (Management and Administration) Amendment, 2015 and Regulation 44 of the SEBI (Listing Obligations and Disclosure Requirements) Regulations, 2015, the Company is pleased to provide e-voting facility to the members to cast their votes electronically on all resolutions set forth in the Notice convening the 37th Annual General Meeting to be held on Saturday, June 23, 2018, at 3:00 p.m. IST. The Company has engaged the services of the National Securities Depository Limited (NSDL) to provide the e-voting facility. The Notice is displayed on the Company’s website, www.infosys.com, and on the website of NSDL, www.evoting.nsdl.com.The e-voting facility is available at the link, https://www.evoting.nsdl.com
E-voting particulars
EVEN (e-voting event number) User ID Password
<<ID1>> <<ID1>> <<PWD>>
The e-voting facility will be available during the following voting period :
Commencement of e-voting End of e-voting
June 18, 2018 at 9:00 a.m. IST June 22, 2018 at 5:00 p.m. IST
Please read the following instructions before exercising your vote :These details and instructions form an integral part of the Notice of the Annual General Meeting to be held on June 23, 2018.
INFOSYS LIMITEDCIN : L85110KA1981PLC013115Electronics City, Hosur Road Bengaluru 560 100, IndiaT 91 80 2852 0261F 91 80 2852 0362
[email protected] www.infosys.com
*EM698700010IN*Member NameAddress 1Address 2Address 3City PIN

Instructions for e-voting
In compliance with Regulation 44, SEBI (Listing Obligation and Disclosure Requirements) Regulations, 2015, and Section 108 and other applicable provisions of the Companies Act, 2013, read with the related Rules, the Company is pleased to provide e-voting facility to all its members, to enable them to cast their votes electronically. The Company has engaged the services of NSDL for the purpose of providing e-voting facility to all its Members.The instructions for e-voting are as follows :Step 1: Log in to NSDL’s e-voting system at https://www.evoting.nsdl.com/Step 2: Cast your vote electronically on NSDL’s e-voting system.
Step 1How to log in to the NSDL e-voting website
1. Visit the e-voting website of NSDL by opening your web browser and typing the following URL either on a desktop computer / laptop or on a mobile or scan the QR code using your smart phone :
https://www.evoting.nsdl.com
2. Once the homepage of the e-voting system is launched, click on the icon, ‘Login’, available under ‘Shareholders’.3. A new screen will open. You will have to enter your User ID, your Password and a Verification Code as shown
on the screen.Alternatively, if you are registered for NSDL e-services, i.e. IDEAS, you can log in at https://eservices.nsdl.com/ with your existing IDEAS log-in details. Once you log in to NSDL e-services using your log-in credentials, click on ‘e-Voting’ and proceed to Step 2, i.e., cast your vote electronically.
4. Your User ID details are given below :
Manner of holding shares, i.e., Demat (NSDL or CDSL) or Physical
User ID
a) For members who hold shares in demat accounts with NSDL.
8-character DP ID followed by 8-digit Client IDFor example, if your DP ID is IN300*** and Client ID is 12****** then your User ID is IN300***12******.
b) For members who hold shares in demat account with CDSL.
16-digit Beneficiary IDFor example, if your Beneficiary ID is 12************** then your user ID is 12**************
c) For members holding shares in physical form.
EVEN, followed by Folio Number registered with the companyFor example, if your EVEN is 101456, and Folio Number is 001***, then your User ID is 101456001***
5. Your password details are given below :a) If you are already registered for e-voting, then you can use your existing password to log in and cast your
vote.b) If you are using the NSDL e-voting system for the first time, you will need to retrieve the ‘initial password’
which was communicated to you. Once you retrieve your ‘initial password’, you need to enter the ‘initial password’, and change your password, as prompted by the system.
c) How to retrieve your ‘initial password’?(i) If your email ID is registered in your demat account or with the company, your ‘initial password’ is
communicated to you on your email ID. Trace the email sent to you by NSDL from your mailbox. Open the email and open the attachment (it will be a .pdf file). Open the file. The password to open the file is your 8-digit client ID for your NSDL account, or the last 8 digits of your CDSL client ID, or folio number for shares held in physical form. The .pdf file contains your ‘User ID’ and your ‘initial password’.
(ii) If your email ID is not registered, your ‘initial password’ is communicated to you on your postal address.

6. If you have not received the ‘initial password’, or are unable to retrieve it, or have forgotten your password :a) Click on the ‘Forgot User Details / Password?’ (for those holding shares in demat accounts with NSDL or
CDSL) option available on www.evoting.nsdl.com.b) A ‘Physical User Reset Password?’ (for those holding shares in physical mode) option is also available on
www.evoting.nsdl.com.c) If you are unable to get your password following the aforesaid options, you can send a request to
[email protected] mentioning your demat account number / folio number, your PAN, your name, and your registered address.
7. After entering your password, agree to the terms and conditions by checking the box.8. Next, click on the ‘Login’ button.9. After you click on the ‘Login’ button, the homepage of e-voting will open.
Step 2How to cast your vote electronically on the NSDL e-voting system?
1. After successfully logging in following Step 1, you will be able to see the e-voting homepage. Click on ‘e-Voting’. Then, click on ‘Active Voting Cycles’.
2. Upon clicking on ‘Active Voting Cycles’, you will be able to see the ‘EVEN’ of all the companies in which you hold shares and whose voting cycles are in ‘active’ status.
3. Select the ‘EVEN’ of the company for which you wish to cast your vote.4. Now you are on the voting page and ready for e-voting.5. Cast your vote by selecting appropriate options, i.e., assent or dissent, verify / modify the number of shares
for which you wish to cast your vote, and click on ‘Submit’. Also click on ‘Confirm’ when prompted.6. Upon confirmation, the message, ‘Vote cast successfully’, will be displayed. 7. You can also take the printout of the votes cast by you by clicking on the print option on the confirmation page.8. Please remember that you are not allowed to modify your vote once you confirm your vote on a resolution.
General guidelines for shareholders1. Institutional shareholders (i.e. other than individuals, HUF, NRI etc.) are required to send a scanned
copy (PDF / JPG Format) of the relevant Board Resolution / Authority letter etc. with attested specimen signature of the duly authorized signatory(ies) who are authorized to vote, to the Scrutinizer by e-mail to [email protected] with a copy marked to [email protected].
2. It is strongly recommended that you do not to share your password with any other person and take utmost care to keep your password confidential. Log in to the e-voting website will be disabled upon five unsuccessful attempts to key in the correct password. In such an event, you will need to go through the ‘Forgot User Details / Password?’ or the ‘Physical User Reset Password?’ option available on www.evoting.nsdl.com, to reset the password.
3. In case of any queries, you may refer to the Frequently Asked Questions (FAQs) for shareholders and the e-voting user manual for shareholders available in the download section of www.evoting.nsdl.com, or call on the toll-free no.: 1800-222-990, or contact Pallavi Mhatre, Assistant Manager, National Securities Depository Ltd., Trade World, ‘A’ Wing, 4th Floor, Kamala Mills Compound, Senapati Bapat Marg, Lower Parel, Mumbai – 400 013, at the designated email address: [email protected]/[email protected] or at telephone no. +91 22 2499 4545 who will also address grievances connected with voting by electronic means.
4. The e-voting period commences on June 18, 2018 (9:00 a.m. IST) and ends on June 22, 2018 (5:00 p.m. IST). During this period, members of the Company holding shares either in physical or dematerialized form, as on the relevant date i.e. June 16, 2018, may cast their vote electronically. The e-voting module shall be disabled by NSDL for voting thereafter. A member will not be allowed to vote again on any resolution on which a vote has already been cast. Any person, who acquires shares of the Company and becomes a member of the Company after dispatch of the Notice convening the AGM and up to the cut-off date i.e. June 16, 2018, may obtain his login ID and password by sending a request at [email protected].
5. The voting rights of members shall be proportionate to their share of the paid-up equity share capital of the Company as on the relevant date i.e. June 16, 2018.