naz 2015 annual report on academic outcomes · naz 2015 academic outcomes 2015 2 wilder research,...
TRANSCRIPT

Wilder Research Information. Insight. Impact.
451 Lexington Parkway North | Saint Paul, Minnesota 55104 651-280-2700 | www.wilderresearch.org
NAZ 2015 Annual Report on Academic Outcomes
A P R I L 4 , 2 0 1 6
Prepared by: Ellen Shelton, Cael Warren, and Sarah Gehrig

NAZ Academic Outcomes 2015 Wilder Research, April 2015
Contents Summary of findings........................................................................................................... 1
Background ......................................................................................................................... 2
Overview of NAZ strategies and programs .................................................................... 2
Evaluation scope and purposes ....................................................................................... 3
Key measures ...................................................................................................................... 4
Kindergarten readiness........................................................................................................ 6
Early childhood implementation history and 2015 status ............................................... 7
Reading proficiency .......................................................................................................... 10
Involvement in several core NAZ strategies is associated with higher rates of reading proficiency ....................................................................................................... 11
Math proficiency ............................................................................................................... 16
Challenges and areas for continued work ..................................................................... 18
High school graduation ..................................................................................................... 20
Other challenges and areas for continued work ................................................................ 21
Changes in state and district tests make it difficult to track progress consistently or against long-term goals ................................................................................................. 21
Population-level results will take more time than initially hoped ................................ 22
Appendix I: Demographics of students represented in this report .................................... 23
Appendix II: Implementation summary ............................................................................ 25
Appendix III: Geographic distribution of NAZ-enrolled families .................................... 27
Appendix IV: Supplemental charts ................................................................................... 30
Appendix V: Additional analyses ..................................................................................... 34
MCA reading and math growth .................................................................................... 34
Spotlight on an example of an Anchor School site with more mature implementation: Hall International .......................................................................................................... 35
Appendix VI: Data notes .................................................................................................. 37
Academic data ............................................................................................................... 37
NAZ solutions ............................................................................................................... 39

NAZ Academic Outcomes 2015 Wilder Research, April 2015
Figures 1. Kindergarten readiness (literacy) ................................................................................ 6
2. Percent of entering kindergartners proficient in BKA literacy test, 2014 .................. 8
3. MCA reading proficiency, grade 3 ........................................................................... 10
4. MCA reading proficiency, grades 3-5 ...................................................................... 11
5. 2014-15 MCA reading proficiency by type and combination of NAZ services, grades 3-5 .................................................................................................................. 12
6. 2014-15 MCA reading growth by type and combination of NAZ services, grades 4-5 .................................................................................................................. 14
7. 2014-15 MCA reading growth by Expanded Learning participation, grades 4-5 ................................................................................................................. 15
8. 2014-2015 MCA reading proficiency by Anchor School’s level of implementation, grades 3-5 .................................................................................................................. 15
9. MCA math proficiency, grade 8 ............................................................................... 16
10. MCA math proficiency, grades 3-5 .......................................................................... 17
11. MCA math proficiency, grades 6-8 .......................................................................... 17
12. 2014-15 MCA math growth by Expanded Learning participation, grades 4-5 ...... 19
13. 2014-15 MCA math proficiency by Anchor School’s level of implementation, grades 3-5 .................................................................................................................. 19
14. High school graduation rates, Anchor Schools, 2008-2014 ..................................... 20
A1. Comparison of 2014-15 elementary-age MCA proficiency rates for reading (to accompany Figures 4 and A7) .................................................................................. 23
A2. Comparison of 2015 MCA reading proficiency rates by extent of participation in Expanded Learning (to accompany Figure 7) ........................................................... 24
A3. Residents of NAZ: Northside.................................................................................... 28
A4. Residents of NAZ: Region ........................................................................................ 29
A5. Fall 2014 kindergarten readiness (literacy) – supplements Figure 1 ........................ 30
A6. MCA reading proficiency, grade 3, 2012–2015 – supplements Figure 3 ................. 31
A7. MCA reading proficiency, grades 3-5, 2012–2015 – supplements Figure 4 ............ 31
A8. MCA math proficiency, grade 8, 2012–2015 – supplements Figure 9 ..................... 32
A9. MCA math proficiency, grades 3-5, 2012–2015 – supplements Figure 10 .............. 32

NAZ Academic Outcomes 2015 Wilder Research, April 2015
Figures (continued) A10. MCA math proficiency, grades 6-8, 2012–2015 – supplements Figure 11 .............. 33
A11. MCA reading growth 2014-15, grades 4-8 ............................................................... 34
A12. MCA math growth 2014-15, grades 4-8 ................................................................... 35
A13. 2014-15 MCA reading proficiency, Grades 3-5, Hall compared to other Anchor Schools ......................................................................................................... 36
A14. 2014-15 MCA reading proficiency by Expanded Learning participation, Hall only .... 36
A15. Hypothetical 4th grade score distribution for students with 3rd grade score of 339 .. 39
NAZ 2015 Academic Outcomes 2015 1 Wilder Research, April 2016
Summary of findings 1. NAZ is showing increases in kindergarten readiness. These gains are strongly
associated with scholars’ participation in high-quality early learning programs and parents’ participation in Family Academy.
2. NAZ is showing increases in school-age scholars’ reading proficiency in connection with several core NAZ strategies:
a. Higher levels of participation in Expanded Learning (including both summer and school-year sessions)
b. Layering of multiple, aligned NAZ strategies and supports, including family engagement, Expanded Learning, and enrollment in a NAZ Anchor School
c. Growing maturity of implementation of NAZ school-level strategies within Anchor Schools
3. Even when scholars are not yet attaining full proficiency in reading, NAZ solutions are associated with increased levels of growth from year to year
4. 2015 findings show some challenges remain, including:
a. Current NAZ strategies are showing less clear gains in math than in reading
b. Changes in the tests administered by the state (MCA reading and math) and district (kindergarten readiness) make it difficult to track progress over time in a consistent way, and have made it impossible to measure progress against long-term goals
c. Given the focus on scholars who start at the lowest proficiency level, large-scale gains for entire cohorts will take longer than originally hoped

NAZ 2015 Academic Outcomes 2015 2 Wilder Research, April 2016
Background The Northside Achievement Zone (NAZ) is a collaborative effort of 33 organizations and 10 schools working together to close the achievement gap in a geographic “Zone” of North Minneapolis (from Broadway to North 35th Avenue and from I-94 to Penn Avenue). NAZ grew out of a community conversation that began in 2008, when, desperate for real change and inspired by the results of the Harlem Children’s Zone, Northside organizations and residents came together to explore solutions to seemingly intractable issues that plagued the neighborhood. The partners identified educational achievement as the key lever for change, and saw that the community needed to move from a patchwork of isolated programs to a coordinated, multi-sector, cross-agency, community-driven effort that works with families as full and equal partners. NAZ was formally created in 2010 as a collaboration designed to create real alignment by removing silos between organizations. A process for continuous results-based accountability was formally launched in 2014.
NAZ's mission is to ensure that all children in the community graduate from high school ready for college. The goal is to end multigenerational poverty using education as a lever. It aligns partners’ efforts and resources behind the same families in the same community at the same time, so that children have everything they need to succeed in school, and families have everything they need to put themselves and the community on a path to success. This two-generation approach means that NAZ works with both children and their parents at the same time, based on the conviction that successful families support successful children, and it ensures that parents are the leaders in driving lasting change.
Overview of NAZ strategies and programs
NAZ engages parents in the academic success of their children. Through the work of peer Connectors, NAZ support parents in building the belief that their children can and will succeed, and building the knowledge and skills to support their children’s educational success.
NAZ surrounds families with an “ecosystem” of support that holistically addresses gaps and needs at every point along a child’s trajectory from birth to college and career. This ecosystem is built from a set of comprehensive, coordinated services provided by NAZ and its partners, and has two main components:
An education pipeline that provides high-quality educational experiences from birth through graduation, including early learning, effective K-12 schools, academic-focused after school and summer Expanded Learning, mentoring, and colleges focused on preparing and supporting students in high school for college success.

NAZ 2015 Academic Outcomes 2015 3 Wilder Research, April 2016
Whole family support so that families have reliable housing, parents who are on a high-quality career path, physical and behavioral health and wellness for both parents and children, and strong ties to others in the community—all so that children go to school ready to learn.
Family Academy is another important program designed and delivered directly by NAZ, which links family supports and academic supports. It includes several different ten-week parenting classes that include overall personal effectiveness and empowerment as well as parenting training specific to particular ages of children.
Direct services focus on individual families and students, but the overall partnership also works across North Minneapolis to impact systems and achieve lasting, community-wide results.
Evaluation scope and purposes
NAZ contracts with Wilder Research for independent evaluation support for the continuous improvement process and for annual reporting on outcomes on a set of key measures of academic success.
This report provides an end-of-year summary for 2015 (academic year 2014-15) academic outcomes. Primary data sources are academic data provided by the Minneapolis Public Schools and each of the other partner schools, plus school-wide academic data from the Minnesota Department of Education (MDE) “report card” website. To provide context for interpreting outcomes, information about services received by NAZ-enrolled scholars and families is also included, from case management records maintained by NAZ. Details about data sources is in Appendix VI.

NAZ 2015 Academic Outcomes 2015 4 Wilder Research, April 2016
Key measures NAZ tracks its results against four key academic benchmarks to identify where the organization is on track and where adjustments are necessary to reach their long-term targets. The targets were set based on the level of achievement necessary to reach the same proficiency levels as white students statewide (or, for kindergarten readiness, in Minneapolis). The key benchmarks are:
Kindergarten readiness
Third grade reading proficiency
Eighth grade math proficiency
High school graduation
For these annual status reports, these benchmarks are reported for each of three populations which it influences:
(1) NAZ-enrolled scholars
(2) Zone-wide (all K-12 students who live within the Zone for whom we are able to obtain academic data)
(3) Anchor Schools (all students enrolled in NAZ’s nine anchor partner schools, regardless of where they live)
Unlike in previous years, this report’s Zone-wide figures exclude NAZ-enrolled scholars, to more clearly illustrate differences between the two groups. For more information on these groups, see Data Notes in Appendix VI.
In previous annual reports we have presented targets and actual results in a table. However, over the course of multiple program years, and with changes in all three of the tests involved, and the addition of the third population (Anchor Schools), it has become difficult to use the original table format to read and interpret the data. For this reason, we have revised the presentation of the data. All original measures are included in this report, but they are presented separately for each of the four key benchmarks. This allows the addition of relevant comparison points (overall Minneapolis Public Schools and statewide scores, as available), and more complete context, relevant for each measure, to show how performance compares to expectations. To maintain the primary focus on results for
1
2
3

NAZ 2015 Academic Outcomes 2015 5 Wilder Research, April 2016
NAZ-enrolled scholars, the main comparison here is to non-NAZ Zone-wide peers. Data for Anchor School students are presented in supplementary charts in Appendix IV.
We look forward to developing a new way to present a summary of findings in a simple, easy-to-read dashboard. It will be developed in consultation with board members on the Impact Committee over the next few months. The process will also include a discussion about the value of the current one-grade-only benchmarks, which are subject to more year-to-year fluctuation than measures that pool multiple grades.

NAZ 2015 Academic Outcomes 2015 6 Wilder Research, April 2016
Kindergarten readiness NAZ-enrolled kindergartners arrive in kindergarten more ready to learn than other Zone residents.
Proficiency on Minneapolis’s Beginning of Kindergarten Assessment (BKA) for literacy is defined as a score that predicts proficiency on the third grade MCA reading test three years later. When the MCA reading test changed to one with a higher standard for proficiency, the standard for kindergarten readiness was similarly increased, resulting in far fewer entering students being rated as “proficient.” The large reductions in proficiency rates depicted in Figure 1 are therefore indicative of a more rigorous proficiency standard, and do not necessarily indicate any reduction in academic performance among incoming kindergartners. Moreover, the BKA test is unique to Minneapolis and its results cannot be compared to those of other districts, where assessments are not necessarily linked to later MCA proficiency.
It should be noted that the relative readiness levels of the NAZ populations did not change with respect to each other. That is, NAZ-enrolled scholars continue to have higher proficiency rates than their Zone-wide peers (Figure 1), but this analysis is not able to explain why both groups dropped more than the district-wide average. Also, as can be seen in the supplementary charts in the Appendix, Anchor School kindergartners, who come from a wider geographic area, continue to out-perform both NAZ and other Zone children.
1. Kindergarten readiness (literacy) a
Ns 2011-12 2012-13 2013-14 2014-15
NAZ-enrolled 9(c) 19 41 73
Zone-wide (non-NAZ) 162 171 251 247 a Numeracy is still tested, but beginning in fall 2014 it is no longer scored against a standard of proficiency. b 2013-14 is the first year all NAZ Anchor Schools used the BKA. Prior years’ figures reflect only Nellie Stone Johnson and Hall. c NAZ-enrolled counts for 2011-12 are suppressed due to the small number of students tested (N<10). d Test scoring changed in 2014-15 based on a change in the MCA reading test in 2013 that raised the standard for proficiency.
79% 73%
25%
63%55% 56%
18%
65% 61% 70%
26%
70% 71% 70%
40%
2011-12 2012-13 2013-14 2014-15
NAZ-enrolled Zone-wide (non-NAZ) Anchor Schools MPS
TEST
CH
ANG
E
b b, c

NAZ 2015 Academic Outcomes 2015 7 Wilder Research, April 2016
Early childhood implementation history and 2015 status
NAZ implemented early childhood solutions earlier than other solutions and has had a broad reach into this age group. In addition, the youngest children generally have less catching up to do than their older peers. As a result, early childhood outcomes are often achievable sooner than outcomes for older students. These early outcomes also provide a stronger foundation for better outcomes for students as they move into the elementary and upper grades.
NAZ early learning solutions were among the first to be implemented. By late 2010, NAZ was offering Family Academy: College Bound Babies (CBB) for parents of 0- through 3-year-olds, and they began driving and tracking enrollment in early learning programs with alignment of the Race to the Top federal investment. NAZ intentionally targeted Race to the Top Scholarships, and later Pathway I State Scholarships, to scholars within one year of kindergarten entry who otherwise did not have access to high quality early learning. In 2015, NAZ and Minneapolis Public Schools (MPS) facilitated the second annual Transition to Kindergarten event, with goals to: use key elements of Family Academy curriculum to prepare parents for this transition; provide parents with a forum to ask questions; offer families an opportunity to build relationships with other families at their new school; and build relationships between families and NAZ/MPS staff. Lastly, 2015 saw an increase in integration between MPS Early Childhood Screening and NAZ's Anchor early learning programs, which optimized opportunities to screen scholars as close to their third birthday as possible, coordinate follow-up services, and engage with parents.
The following data on implementation is drawn from the Results NAZ: Early Childhood Education report (July 2015) and Family Engagement / Family Academy report (November 2015):
As of June 2015, 56 percent of all NAZ scholars ages birth through 2 who were enrolled in early childhood education were enrolled in a high-quality program.
As of June 2015, 47 percent of all NAZ scholars ages 3 through 5 were enrolled in a high-quality early childhood education program.
Since 2013, a total of 167 financial resources—including scholarships or need-based aid through the Child Care Assistance Program (CCAP)—have been accessed by 112 NAZ-enrolled scholars currently ages 0 to 5.
Of all 567 families who were actively enrolled in NAZ during the 2014-15 year, 24 percent (135 of 567) had completed at least one Family Academy program (regardless of whether or not they had set this as a goal).
88 families completed Family Academy: College Bound Babies during FY 2015.

NAZ 2015 Academic Outcomes 2015 8 Wilder Research, April 2016
Increased rates of kindergarten readiness in literacy are strongly associated with scholars’ participation in high-quality early learning programs and parents’ participation in Family Academy.
NAZ scholars (NAZ-enrolled students) who had enrolled in high-quality early learning programs tended to enter kindergarten more ready than their counterparts (Figure 2). If their parents also graduated from a Family Academy program, their rates of kindergarten readiness were even higher. By contrast, scholars enrolled in NAZ who received neither of these solutions had significantly lower readiness rates than their Zone-wide peers.
2. Percent of entering kindergartners proficient in BKA literacy test, 2014
a 15 of the 16 scholars in the Family Academy group also had been enrolled in high-quality early learning programs.
Another NAZ strategy focuses on screening all preschool scholars every six months, with an emphasis on age 3, to identify and address learning barriers early.
During 2014-15, 200 scholars were screened at least once with the Ages and Stages Questionnaire (ASQ) and Ages and Stages Questionnaire: Social-Emotional (ASQ:SE), of whom 45 percent were on track in all six learning domains (communication; gross motor; fine motor; problem solving; personal-social, and social-emotional) in their most recent assessment. Among the 3-through-5-year-olds (n=116 screened in all domains), 47 percent were proficient in all six domains. Among the 0-through-2-year-olds (n=84 screened in all domains), 42 percent were proficient in all areas. However, proficiency on individual domains was high (70-87%).
Many 4- and 5-year-old scholars also complete the Indicators of Individual Growth and Development for Infants and Toddlers (IGDI) assessment. In every content area but one (Sound Identification), a greater percentage of scholars assessed in spring 2015 were proficient than those assessed in fall 2014. NAZ scholars who were screened
50%
34%
12%
18%
50%
66%
88%
82%
NAZ-Enrolled with FamilyAcademy (N=16)
NAZ-Enrolled with High-QualityEarly Learning Program (N=38)
NAZ-Enrolled, No EarlyChildhood Services (N=34)
Zone-wide (Non-NAZ, N=243)
Proficient Not proficient
a

NAZ 2015 Academic Outcomes 2015 9 Wilder Research, April 2016
outperformed a comparable research sample in all three math measures, but they lagged behind their peers in reading skills.
Assessment changes will continue to affect kindergarten readiness reporting
In the fall of 2015-16, MPS used a new kindergarten readiness assessment, which was developed by its reading curriculum vendor Reading Horizons. The relationship with this vendor has since been discontinued. The results of the test are not available for analysis, and the same test will not be used again. As a result, the 2016 end-of-year report will be unable to include any consistent measure of readiness for all entering kindergarten students, and results in future years may or may not be comparable to those collected so far.

NAZ 2015 Academic Outcomes 2015 10 Wilder Research, April 2016
Reading proficiency In most grades, reading proficiency rates among NAZ scholars and Zone-wide students have held steady. For the past two years, NAZ scholars have attained higher proficiency rates than their Zone-wide peers in grades 3-5.
Reading and math proficiency are measured by the state-mandated Minnesota Comprehensive Assessments (MCA tests), administered every spring in grades 3 through 8 and in one high school grade (grade 10 for reading, grade 11 for math). The results here include scores on alternate forms of these accountability tests, which are given for students whose disabilities preclude a reasonable expectation of proficiency on the main test.
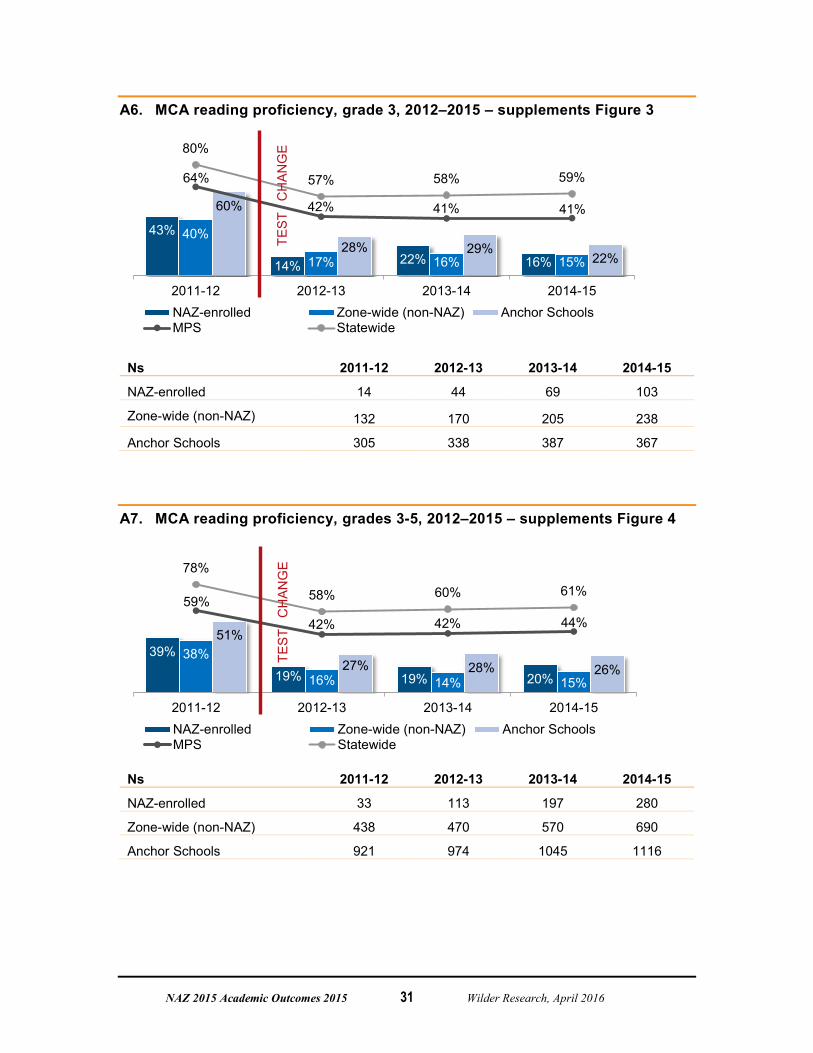
When third grade is examined by itself, there is considerable year-to-year fluctuation among the NAZ-enrolled group (Figure 3).
3. MCA reading proficiency, grade 3
Ns 2011-12 2012-13 2013-14 2014-15
NAZ-enrolled 14 44 69 103
Zone-wide (non-NAZ) 132 170 205 238
Notes: The 2012-13 test applied a significantly higher standard for proficiency, resulting in large drops across the board in the number and proportion of students who were rated as proficient. See Appendix for more detail including Anchor School results.
Across groups, third-graders in 2014-15show lower proficiency rates than the third-graders who took the test in the prior year. However, this may be due simply to random differences among cohorts of students from year to year. A more reliable measure of change is to look at multiple grades, pooled. This compensates for the fact that a different cohort of third graders takes the test every year, with unknown differences between each year’s cohort and the next. The pooled grade chart smooths out random fluctuations and shows a more reliable measure of change.
43%
14% 22% 16%
40%
17% 16% 15%
60%
28% 29%22%
64%
42% 41% 41%
80%
57% 58% 59%
2011-12 2012-13 2013-14 2014-15NAZ-enrolled Zone-wide (non-NAZ) Anchor SchoolsMPS Statewide
TEST
C
HAN
GE

NAZ 2015 Academic Outcomes 2015 11 Wilder Research, April 2016
The pooled results for grades 3 through 5 (Figure 4) reflect the grades where NAZ programs have been implemented with the greatest breadth, and have been refined through cycles of improvement based on experience. Although this implementation has been at depth for all elementary grades (K-5), only third through fifth grades take the MCA, which is the key measure for reading proficiency.
These pooled elementary grade results have remained essentially the same over the last three years for each of NAZ’s three populations of interest, with the NAZ-enrolled scholars slightly out-performing their Zone-wide peers. Unlike in the third-grade-only results, proficiency rates did not drop in 2014-15 for the NAZ-enrolled or Zone-wide groups.
4. MCA reading proficiency, grades 3-5
Ns 2011-12 2012-13 2013-14 2014-15
NAZ-enrolled 33 113 197 280
Zone-wide (non-NAZ) 438 470 570 690
Involvement in several core NAZ strategies is associated with higher rates of reading proficiency
These are the strategies that are associated with higher rates of reading proficiency:
Layering of multiple, aligned NAZ strategies and supports, including family engagement, Expanded Learning, and enrollment in a NAZ Anchor School
More intensive participation in Expanded Learning (including both summer and school-year sessions)
Growing maturity of implementation of NAZ school-level strategies within Anchor Schools
39%
19% 19% 20%
38%
16% 14% 15%
51%
27% 28% 26%
59%
42% 42% 44%
78%
58% 60% 61%
2011-12 2012-13 2013-14 2014-15NAZ-enrolled Zone-wide (non-NAZ) Anchor SchoolsMPS Statewide
TEST
C
HAN
GE

NAZ 2015 Academic Outcomes 2015 12 Wilder Research, April 2016
Without a control group, this evaluation cannot claim that NAZ causes the changes we are seeing. However, based on the evidence available, especially from comparison to non-NAZ students who also live in the Zone, we feel confident in suggesting that NAZ efforts are most likely a strong contribution to these outcomes.
Layering of multiple solutions are associated with increased reading proficiency
NAZ’s academic solutions are designed to be mutually reinforcing. Parent engagement with a Connector is the most basic strategy. Connectors encourage parents to believe in their scholars’ potential and help parents to develop a plan that promotes academic achievement, including enrolling their children in programs that provide academic supports. These programs are available in the school setting through the Anchor School partnerships, and in supplementary Expanded Learning (ExL) programs offered during the summer or after school. Some scholars are both in Anchor Schools and attend ExL programs. As Figure 5 shows, scholars engaged in these additional strategies have considerably higher rates of proficiency on the MCA reading test.
5. 2014-15 MCA reading proficiency by type and combination of NAZ services, grades 3-5
Multiple solutions are also associated with increased rates of reading growth
For scholars who start at a skill level considerably below proficiency, it is possible for them to improve greatly from their starting point but still not reach the proficiency standard. For this reason, we have supplemented our analysis of academic proficiency with a measure that looks at growth.
Growth scores for NAZ-enrolled scholars show that many scholars who are not yet fully proficient are nevertheless making higher than average growth, thereby coming closer to proficient than in the previous year. It also shows the additional layers of NAZ solutions (Connector plus Anchor School plus Expanded Learning) may contribute to greater
21%
26%
15%
79%
74%
85%
Connector + Anchor + ExL(N=123)
Connector + Anchor OR ExL(not both) (N=89)
Connector only, No ExLor Anchor (N=33)
Proficient Not proficient

NAZ 2015 Academic Outcomes 2015 13 Wilder Research, April 2016
growth than just two of these solutions, even though most of the scholars being assessed have not yet attained full proficiency.
What are growth scores and what do they tell us about student progress?
Growth scores are computed by the state based on a comparison of students’ MCA results from one year to the next year. All Minnesota students who have similar scores in the first year are grouped, and they are assigned normalized growth scores based on how their second-year MCA scores compare to those of others in the same group. About one-third of students score within half a standard deviation of the average score. The state calls this “medium growth.” For this report, we follow Minneapolis Public Schools practice and subdivide this middle group to show the proportions who score above and below the mean for their group. A growth score in “Slightly above average growth” (the top half of the middle group) or “Well above average growth” (the state’s top category) means that a scholar has made more progress in one year than his or her peers statewide, where “peers” are students who earned the same score on the MCA in the previous year. (For more technical details, see Appendix V: Data Notes.)
Growth scores supplement what we can learn from MCA proficiency rates in two important ways. • A scholar who starts far behind his or
her classmates but makes a lot of progress in a year may actually be showing greater academic gains than another who is proficient to begin with and merely maintains the same level of proficiency. Growth rates allow us to see how many scholars are closing the gap, even if they have not yet reached the level needed to be rated as proficient.
• If two groups are compared with each other, but some start from a higher initial proficiency level, looking at growth instead of proficiency helps make the comparison a more equal one, because growth scores are computed in comparison to other students statewide who started with the same initial level.
In Figure 5, the layering of a Connector (which serves as a proxy for family engagement) with Anchor School enrollment and Expanded Learning did not show evidence of any greater proficiency rates than just a Connector plus just one of the two academic strategies. However, when we examine growth instead of proficiency (Figure 6), we do see higher results with the combination of all three strategies. Notably, the difference is most evident
NAZ 2015 Academic Outcomes 2015 14 Wilder Research, April 2016
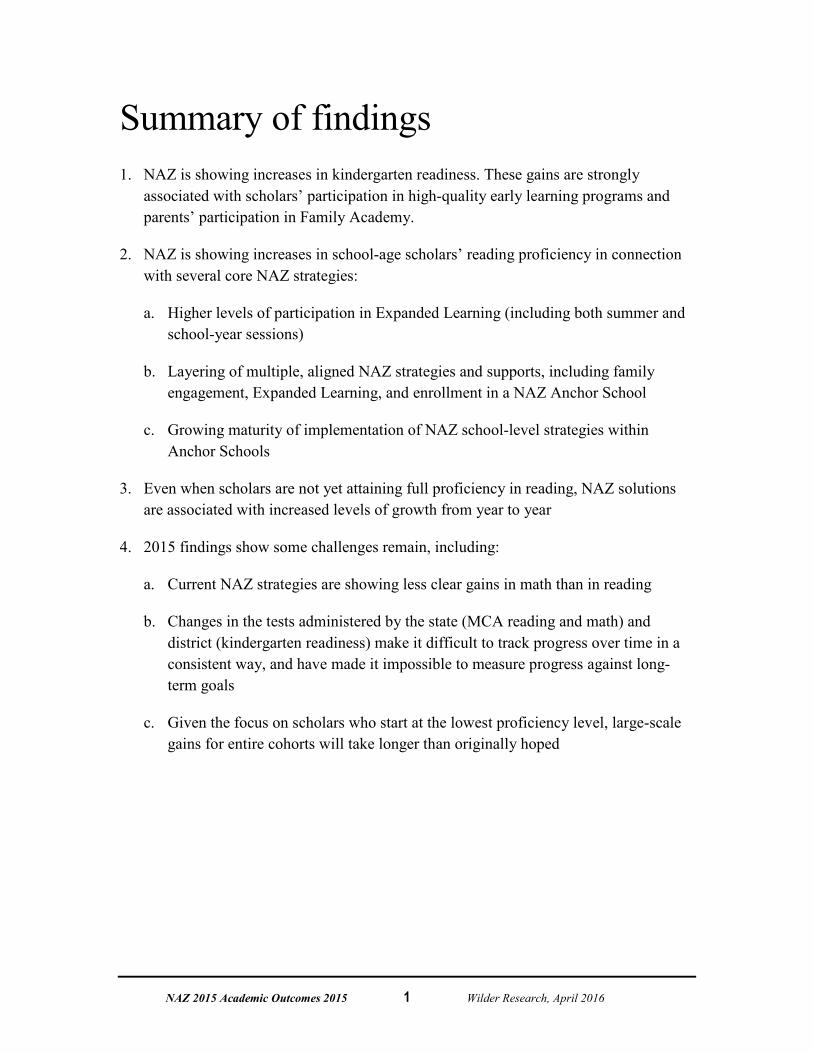
in the larger proportions making “well above average growth,” and smaller proportions in the lowest category of “well below average growth.”
6. 2014-15 MCA reading growth by type and combination of NAZ services, grades 4-5
More intensive participation in Expanded Learning – including both summer and school-year sessions – is associated with higher levels of growth in reading
In addition to the evidence supporting the combination of multiple solutions, we see evidence that greater intensity of participation in just one effective solution (Expanded Learning) is associated with higher rates of growth in reading (Figure 7). Again using growth scores to examine progress among those who may not yet be proficient, we see that participation in more Expanded Learning sessions, especially when it includes the summer session to prevent “summer slide,” appears to contribute to greater reading growth. As in Figure 6, the most notable difference as the extent of participation increases is to also see more scholars in the “well above average growth” category, and fewer making “well below average growth.”

NAZ 2015 Academic Outcomes 2015 15 Wilder Research, April 2016
7. 2014-15 MCA reading growth by Expanded Learning participation, grades 4-5
Integration of NAZ strategies in Anchor Schools is associated with increased reading proficiency
The efficacy of more intensive solutions can be seen not only in scholars’ levels of participation in Expanded Learning, but also in the maturity with which solutions are implemented. This is exemplified by the comparison of reading proficiency rates for scholars in Anchor Schools with more or less experience implementing all of the NAZ Anchor School strategies (Figure 8). These strategies include: the coordinated implementation of family engagement with the schools; services of an Academic Navigator to help scholars connect to resources to support their academic success; the incorporation of NAZ as an essential strategy for the school along with recognition of the school’s vital role in the larger NAZ ecology; and regular use of data to inform strategies for helping scholars succeed. (More details about the criteria for identifying highly implementing schools are in Appendix VI.)
In schools that NAZ rated as having implemented all of these strategies the longest and most thoroughly prior to the 2015 MCA testing, reading proficiency rates were significantly higher than in schools where implementation was not yet equally mature.
8. 2014-2015 MCA reading proficiency by Anchor School’s level of implementation, grades 3-5
35%
15%
65%
85%
More integrated (N=74)
Less integrated (N=97)
Proficient Not proficient
15%
15%
30%
31%
16%
23%
13%
21%
23%
21%
22%
21%
46%
41%
35%
28%
No ExL (N=61)
1-2 sessions, schoolyear only (N=39)
Summer session only (N=23)
Summer + 1-2 schoolyear sessions (N=39)
Well above average growth Slightly above average growthSlightly below average growth Well below average growth
NAZ 2015 Academic Outcomes 2015 16 Wilder Research, April 2016
Math proficiency Math proficiency rates among NAZ scholars and the Zone-wide population generally held steady in 2015, with fluctuations up and down at different grade levels.
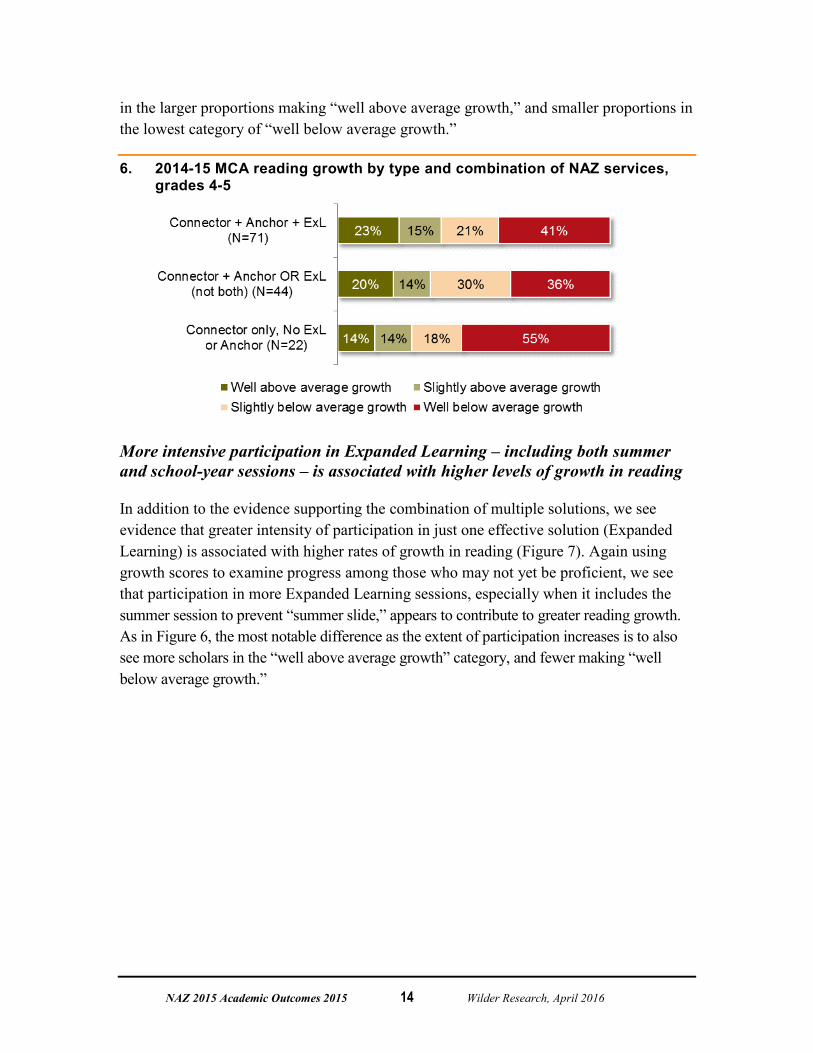
While caution is necessary when interpreting trends in a single-grade cohort, the 2015 class of NAZ-enrolled 8th grade students saw an impressive increase in their proficiency rate compared to the prior year’s 8th grade class (Figure 9). We may speculate as to the NAZ solutions that might have contributed to this result, but as this measure does not track the same group of students over time, proficiency rates may fluctuate a great deal over time with no intervention, due only to natural variation across cohorts of students. Still, the positive result is encouraging, especially as this particular cohort did not show outstanding proficiency rates the previous year as seventh graders. If this gain can be maintained in future years, the trend may provide more evidence supporting NAZ’s middle school academic solutions.
9. MCA math proficiency, grade 8
Ns 2011-12 2012-13 2013-14 2014-15
NAZ-enrolled 6* 19 36 46
Zone-wide (non-NAZ) 98 155 146 190
Note: NAZ-enrolled rates are suppressed for 2011-12 due to small numbers (N<10).
We examined pooled-grade proficiency rates for the elementary grades (grades 3-5) separately, because those grades are where NAZ implementation is the most robust, and they provide a leading indicator of how grade 8 rates may change in the future as scholars move up the grades and NAZ middle-school programming grows in scale. These figures show a consistent pattern of NAZ-enrolled scholars out-performing their Zone-wide peers (Figure 10). The larger sample still shows a generally declining trend in the proficiency rates over the past three years, for unknown reasons. Over this time, however, NAZ-
21% 17%26%29%
19% 16% 18%
40% 46%29% 25%
38% 38% 42% 44%
61% 57% 58% 58%
2011-12 2012-13 2013-14 2014-15NAZ-enrolled Zone-wide (non-NAZ) Anchor SchoolsMPS Statewide

NAZ 2015 Academic Outcomes 2015 17 Wilder Research, April 2016
enrolled proficiency rates have dropped less than Anchor School rates (see Appendix IV: Supplemental Charts).
10. MCA math proficiency, grades 3-5
Ns 2011-12 2012-13 2013-14 2014-15
NAZ-enrolled 35 113 197 277
Zone-wide (non-NAZ) 448 480 573 692
Because the current benchmark for math proficiency is the eighth grade, we also show math proficiency for the pooled intermediate grades (grades six through eight) (Figure 11). These rates are lower than for the elementary grades where NAZ solutions have been implemented with more scholars, over a longer period of time, and beginning earlier in the scholars’ academic careers. However, the trend across the last four years shows NAZ-enrolled scholars consistently gaining on the other groups (including Anchor School-wide students, as shown in Appendix IV).
11. MCA math proficiency, grades 6-8
Ns 2011-12 2012-13 2013-14 2014-15
NAZ-enrolled 23 74 129 154
Zone-wide (non-NAZ) 372 442 480 553
23%34% 30% 27%28% 27% 23% 25%
47% 45% 42%33%
45% 48% 49% 50%
70% 67% 68% 67%
2011-12 2012-13 2013-14 2014-15NAZ-enrolled Zone-wide (non-NAZ) Anchor SchoolsMPS Statewide
13% 15% 16% 17%17% 17% 14% 15%
36% 28% 27% 21%
36% 38% 39% 41%
59% 56% 57% 57%
2011-12 2012-13 2013-14 2014-15NAZ-enrolled Zone-wide (non-NAZ) Anchor SchoolsMPS Statewide
NAZ 2015 Academic Outcomes 2015 18 Wilder Research, April 2016
Challenges and areas for continued work
Evaluation results are useful not only when they show strategies that are effective and that can be expanded and built upon, but also when they help identify areas that are more resistant to change. Patterns of the 2014-15 and longer-term outcomes to date help identify particular strategies that warrant further examination and discussion for NAZ and Anchor School leaders.
Solutions that are working for reading are not working so well for math; we have less evidence so far on what works to increase math proficiency
Solutions such as Expanded Learning or whole-school strengthening of curriculum and instruction may include large differences among sites in how they emphasize different content areas such as reading, math, arts, or other important areas of learning. Also, math and reading draw on different kinds of skills that may require more or less time or different approaches to change. Solutions that effectively raise student performance in reading may thus not show similar results for math. The results for academic year 2015 show more success for reading than for math, and less clear evidence for what strategies should be expanded or modified to improve results.
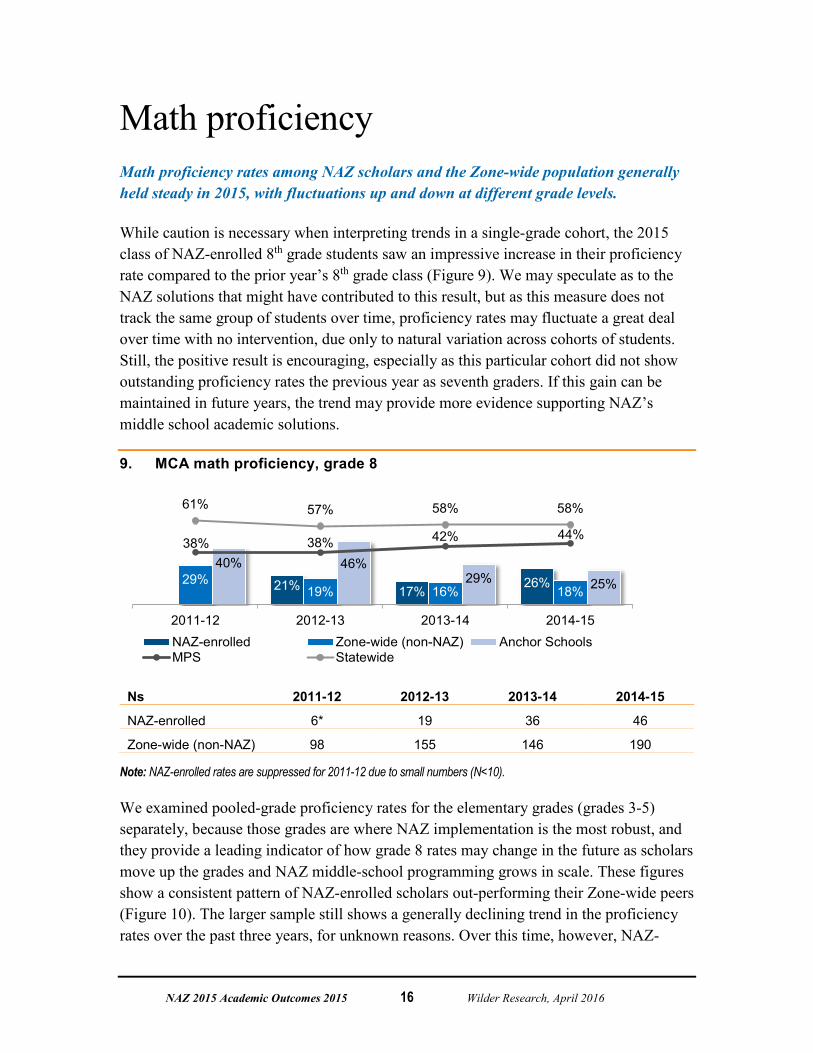
Adding more layers of solutions has less effect on math growth than on reading growth
Although greater reading growth was clearly related to greater intensity of participation in Expanded Learning (Figure 7, above), the same cannot be said for math growth (Figure 12, below). For math, the highest dosage of the strategy – enrollment in both school-year sessions and the summer session – does show the highest results (a combined 39% of scholars with above-average math growth, including 21% well above average), but this rate is not meaningfully higher than for the group that did not participate in Expanded Learning at all (36% of whom had above-average growth, including 20% well above average). Moreover, the math growth that may have been gained or preserved during the summer session does not appear to be sustained until the spring testing season without continued school-year reinforcement. These lower math results do not suggest that Expanded Learning cannot be an effective strategy for promoting math achievement; it is likely that they instead reflect the relative emphasis that current ExL programs place on math compared to reading.

NAZ 2015 Academic Outcomes 2015 19 Wilder Research, April 2016
12. 2014-15 MCA math growth by Expanded Learning participation, grades 4-5
A higher level of integration at Anchor Schools is not associated with higher math proficiency
Similar to results for higher scholar-level dosage in Expanded Learning, the analysis of the strength of implementation of school-level strategies also shows a different pattern for math (Figure 13) than for reading (Figure 8). Reasons for these differences are not known, and should be explored with Anchor School leaders.
13. 2014-15 MCA math proficiency by Anchor School’s level of implementation, grades 3-5
26%
35%
74%
65%
More integrated (N=74)
Less integrated (N=97)
Proficient Not proficient
20%
18%
14%
21%
16%
15%
9%
18%
16%
21%
36%
18%
48%
46%
41%
42%
No ExL (N=61)
1-2 sessions, schoolyear only (N=39)
Summer session only (N=22)
Summer + 1-2 schoolyear sessions (N=38)
Well above average growth Slightly above average growthSlightly below average growth Well below average growth

NAZ 2015 Academic Outcomes 2015 20 Wilder Research, April 2016
High school graduation The graduation rate has trended upward in recent years in NAZ anchor high schools (Patrick Henry and Plymouth Youth Center) (Figure 14). As NAZ implementation is still relatively new at the high school level, it is unclear whether these gains are attributable to NAZ efforts, Minneapolis’s district-wide efforts, or other causes. For example, statewide graduation requirements changed to drop the necessity of passing a GRAD (Graduation-Required Assessments for Diploma) test during high school, which may have influenced graduation rates. As high school implementation scales up, future analyses will evaluate the impact of high school solutions on graduation rates among NAZ scholars.
14. High school graduation rates, Anchor Schools, 2008-2014
56% 64%
49% 59%
77% 81%
2010-11 2011-12 2012-13 2013-14
NAZ Anchor Schools MPS Statewide

NAZ 2015 Academic Outcomes 2015 21 Wilder Research, April 2016
Other challenges and areas for continued work In addition to the further examination of strategies to increase math results, two other ongoing challenges for NAZ’s work, commented on in previous reports, merit mention again based on 2015 results. These are:
Changes in the tests used to measure proficiency make it difficult to track progress consistently or against long-term goals
Population-level results will take longer to achieve than originally hoped
Changes in state and district tests make it difficult to track progress consistently or against long-term goals
Since the Promise Neighborhood grant was awarded in December 2011, proficiency rates have been affected by a change in the state-administered reading assessment (spring 2013). In addition, the Minneapolis Public Schools have changed aspects of the kindergarten readiness test twice: in fall 2014-15, when it no longer assigned a proficiency rating for numeracy, and again in fall 2015-16 when it used a different test entirely. Thus, we are unable to present consistent trends over all four of NAZ’s Promise Neighborhood years for three of the four key benchmarks.
In the year immediately following a test change, these changes have made it difficult or impossible (depending on the nature of the change) to determine whether students have made progress since the prior year. The inability to establish a consistent trend over multiple years makes it more difficult to determine if even the comparable year-to-year changes truly represent a consistent pattern over time or may be due to fluctuations based on random or incidental external factors.
One other consideration related to testing merits mention here. One strength of the Minneapolis Public Schools’ Beginning of Kindergarten Assessment (BKA) is its alignment to the third grade MCA reading assessment. A weakness of the test, however, is that it is unique to the district and cannot be compared with results anywhere else in the state, which do not necessarily align to the MCA reading standard. Also, with the elimination of a proficiency rating for the numeracy part of the test, the BKA is now narrowly focused on literacy readiness, to the exclusion of many other kinds of development considered important for kindergarten and later school success.

NAZ 2015 Academic Outcomes 2015 22 Wilder Research, April 2016
Population-level results will take more time than initially hoped
NAZ’s focus on a community experiencing many intersecting social disadvantages, and its focus on recruiting the enrollment of families whose children are seen to have the most need to catch up in their education, make it nearly impossible to expect population-scale results in just a few years. For example, the sense of safety in the neighborhood, including in the immediate vicinity of some of the schools themselves, was shaken in 2015 by episodes of gun violence. It is well-documented that the anxiety and stress related to neighborhood violence undercuts learning by occupying an undue amount of the attention and mental processing capacity that a child can devote to academic tasks.
In addition to these and other community influences on academic outcomes, NAZ has not yet been in operation long enough for its scholars who received its strong preschool preparation to have reached an age to take their first MCA tests (in third grade). Scholars whose MCA results are reported here have all received NAZ solutions for only a part of their academic career. Because NAZ enrollment was increased gradually over a period of years, most have been enrolled for only two years or less.
There is yet another reason to expect that results will continue to strengthen in the coming years. Besides the longer time this will allow for individual- and community-level solutions to take hold and have gradual but growing effects, the NAZ strategies themselves are continuing to become more effective as NAZ and its partners learn from experience, ongoing data analysis, and periodic evaluation findings, and put the learnings into practice with modified and improved programs.

NAZ 2015 Academic Outcomes 2015 23 Wilder Research, April 2016
Appendix I: Demographics of students represented in this report Through 2015 the evaluators have collected limited data from schools on the demographic characteristics of students. This has prevented us from examining the extent to which differences among students may account for some of the differences in results among the groups that are compared in this report. For example, although we know race, gender, and attendance rates, we do not have data on English Language Learner or special education status, or whether or not a student was known to be homeless or highly mobile – all characteristics that are known to be associated with differences in academic performance. At the recommendation of the leadership of the Minneapolis Public Schools Research, Evaluation and Assessment office, more of this contextual data will be requested in future years.
For this 2015 report, as an initial exploration of between-group similarities and differences, we have summarized the data currently available to us for two different kinds of analyses, shown below.
In a comparison of the three main populations (NAZ-enrolled, Zone-wide but not NAZ-enrolled, and Anchor School) (Figure A1), prior year MCA scores for fourth and fifth graders were somewhat similar across the groups. The main difference, other than NAZ enrollment itself, is in the racial composition of the NAZ and non-NAZ groups, with NAZ having a disproportionate proportion of African American students. Further exploration, after other important demographic data are available, will be helpful.
A1. Comparison of 2014-15 elementary-age MCA proficiency rates for reading (to accompany Figures 4 and A7)
2014-15 reading proficiency rate
(N)
Mean MCA score in 2014
(N)a
Average attendance
rate (N) % Male
(N)
% African American
(N)
% with a Connector
(N)
Gr4 Gr5
NAZ-enrolled 20% (280)
332 (86)
437 (72)
94.0% (278)
50% (280)
82% (277)
85% (280)
Zone-wide (non-NAZ) 15% (690)
329 (193)
431 (165)
93.1% (687)
54% (690)
65% (680)
5% (690)
Anchor Schools 26%
(1116) 334
(366) 439
(337) 94.5% (1076)
52% (1114)
80% (1018)
18% (1114)
a MCA testing begins in grade 3, so prior year (2014) scores are unavailable for students in grade 3. In addition, prior year scores are only available for students for whom we have two years of data. It is likely that these are less-mobile students, so the prior year scores shown here may over-estimate the scores for the full group.
Because demographic data are incomplete, the number of cases for which data were available is shown below each percentage.
NAZ 2015 Academic Outcomes 2015 24 Wilder Research, April 2016
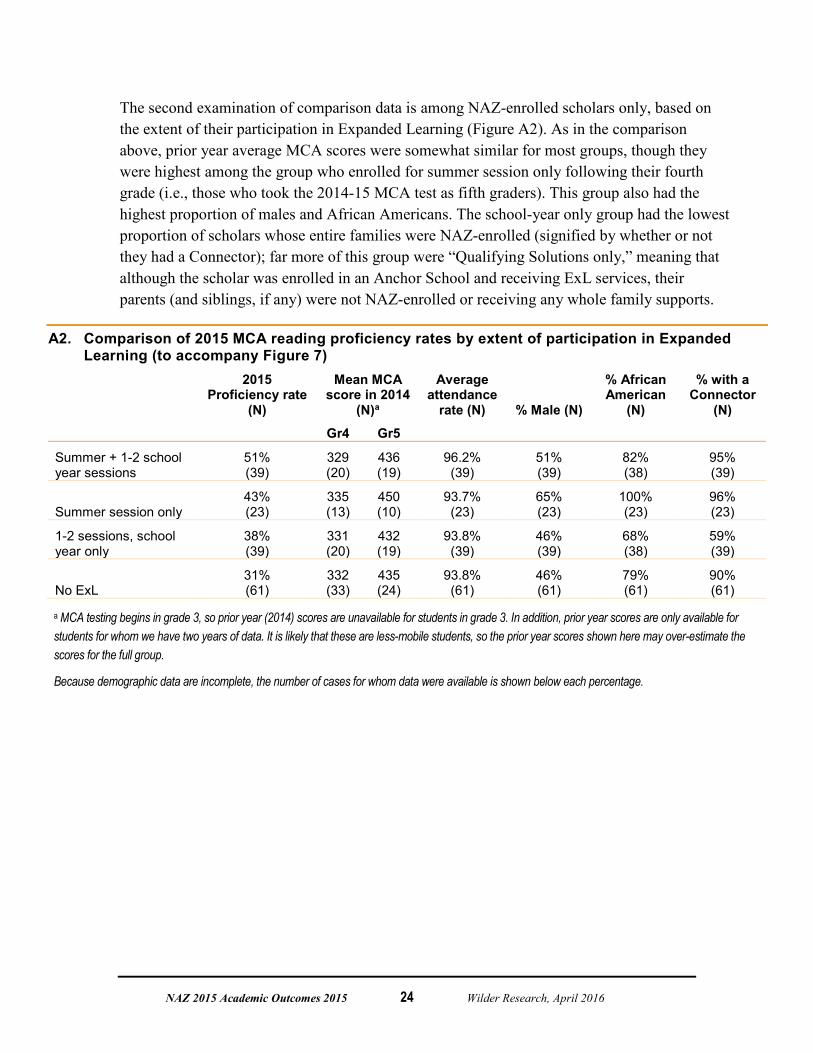
The second examination of comparison data is among NAZ-enrolled scholars only, based on the extent of their participation in Expanded Learning (Figure A2). As in the comparison above, prior year average MCA scores were somewhat similar for most groups, though they were highest among the group who enrolled for summer session only following their fourth grade (i.e., those who took the 2014-15 MCA test as fifth graders). This group also had the highest proportion of males and African Americans. The school-year only group had the lowest proportion of scholars whose entire families were NAZ-enrolled (signified by whether or not they had a Connector); far more of this group were “Qualifying Solutions only,” meaning that although the scholar was enrolled in an Anchor School and receiving ExL services, their parents (and siblings, if any) were not NAZ-enrolled or receiving any whole family supports.
A2. Comparison of 2015 MCA reading proficiency rates by extent of participation in Expanded Learning (to accompany Figure 7)
2015 Proficiency rate
(N)
Mean MCA score in 2014
(N)a
Average attendance
rate (N) % Male (N)
% African American
(N)
% with a Connector
(N)
Gr4 Gr5
Summer + 1-2 school year sessions
51% (39)
329 (20)
436 (19)
96.2% (39)
51% (39)
82% (38)
95% (39)
Summer session only 43% (23)
335 (13)
450 (10)
93.7% (23)
65% (23)
100% (23)
96% (23)
1-2 sessions, school year only
38% (39)
331 (20)
432 (19)
93.8% (39)
46% (39)
68% (38)
59% (39)
No ExL 31% (61)
332 (33)
435 (24)
93.8% (61)
46% (61)
79% (61)
90% (61)
a MCA testing begins in grade 3, so prior year (2014) scores are unavailable for students in grade 3. In addition, prior year scores are only available for students for whom we have two years of data. It is likely that these are less-mobile students, so the prior year scores shown here may over-estimate the scores for the full group.
Because demographic data are incomplete, the number of cases for whom data were available is shown below each percentage.

NAZ 2015 Academic Outcomes 2015 25 Wilder Research, April 2016
Appendix II: Implementation summary The following information, provided by NAZ from administrative data, gives additional detail about the services and supports received by NAZ scholars and their families during 2015.
NAZ believes a culture of achievement can only be built from within the community—one family at a time – and takes a multi-generational approach working with both parents and scholars to make that happen.
NAZ is making strides in how it supports parents to guide their children on a college path and grow as community leaders. By December 31, 2015, 50 parents had been designated as Parent Leaders for their level of community leadership at nine different Northside partners.
In addition, 100% of scholars ages 5-18 had a parent setting an education Achievement Plan to support their child’s academic success in the second half of 2015. In addition, 237 scholars had set a personal Scholar Achievement Plan to help them improve their academic outcomes.
Further, Career & Financial Pathways supports are designed to strengthen NAZ parents’ economic ability to provide a healthy and financially stable environment at home—so their children can succeed academically. As parents improve their own trajectory, they are better able to support their children in preparing for college and a career. As of 31 Dec 2015, 300 parents had set a career goal.
After at least three months of demonstrated focus working toward their goals, families may be connected with the NAZ Housing Navigator to receive specialized support to find housing opportunities. The Navigator works to understand each family’s goals and budget;
50
Parent Leaders In the period 7/1/2015-12/31/2015
100% Families of school age scholars setting an education Achievement Plan In the period 7/1/2015-12/31/2015
237
NAZ Scholars setting a personal Scholar Achievement Plan In the period 7/1/2015-12/31/2015
300
NAZ Parents with active career goals In the period 7/1/2015-12/31/2015
100
Families
303
NAZ Children supported to stabilize housing

NAZ 2015 Academic Outcomes 2015 26 Wilder Research, April 2016
helps them create a housing stabilization plan; and works with housing partners to secure housing placement. In FY2015 ending on June 30th, 2015, 100 families including 303 children were supported by NAZ and its partners to stabilize housing needs.
As a learning organization, NAZ is constantly striving to learn from past performance and improve future outcomes. In 2015, NAZ completed a full series of roundtable discussions focused on drawing lessons from each aspect of NAZ’s wrap-around approach. Known as “Results NAZ,” these convenings bring together NAZ parents, staff, partners, and other stakeholders to drive the improvement process forward.

NAZ 2015 Academic Outcomes 2015 27 Wilder Research, April 2016
Appendix III: Geographic distribution of NAZ-enrolled families The two maps below show the residences of all families enrolled in NAZ as of the end of academic/fiscal year 2015. Some of those outside the Zone began as Zone residents but were obliged to take housing outside the Zone due to the shortage of affordable housing within the Zone. Others outside the boundaries of the Zone are families referred to NAZ by Anchor Schools where their children attended. The vast majority of NAZ-enrolled families live on the Northside, but as Figure A4 illustrates, a few are scattered somewhat more broadly.

NAZ 2015 Academic Outcomes 2015 28 Wilder Research, April 2016
A3. Residents of NAZ: Northside

NAZ 2015 Academic Outcomes 2015 29 Wilder Research, April 2016
A4. Residents of NAZ: Region

NAZ 2015 Academic Outcomes 2015 30 Wilder Research, April 2016
Appendix IV: Supplemental charts The focus of this 2015 report is on results for NAZ-enrolled scholars, which are compared throughout to results of other children in the Zone who are not enrolled in NAZ. However, the evaluation has continued to also collect data for all students enrolled in NAZ Anchor Schools. This section supplements the charts in the main report by also showing results for all Anchor School students, as an additional point of comparison.
During the past several years, and across all grade groupings, Anchor School students have consistently achieved higher proficiency rates in math and reading than NAZ-enrolled and Zone residents (Figure A5). In both cases, this result is to be expected. The geographic area of the Zone was defined for its high level of need; students living in the Zone experience high levels of poverty and mobility, which present challenges in the classroom, leading to lower performance for Zone residents. Furthermore, the NAZ-enrolled population is a combination of Zone residents and the non-Zone Anchor School attendees who were recruited for NAZ enrollment because they were in greatest need, leading to lower average performance than for the schools as a whole.
A5. Fall 2014 kindergarten readiness (literacy) – supplements Figure 1
Ns 2011-12 2012-13 2013-14 2014-15
N NAZ-enrolled 9* 19 41 73
N Zone-wide (non-NAZ) 162 171 251 247
N Anchor Schools 152 153 439 427
Note: NAZ-enrolled counts for 2011-12 are suppressed due to the small number of students tested (N<10).
79% 73%
25%
63%55% 56%
18%
65% 61% 70%
26%
70% 71% 70%
40%
2011-12 2012-13 2013-14 2014-15
NAZ-enrolled Zone-wide (non-NAZ) Anchor Schools MPS
TEST
CH
ANG
E
b b, c
NAZ 2015 Academic Outcomes 2015 31 Wilder Research, April 2016
A6. MCA reading proficiency, grade 3, 2012–2015 – supplements Figure 3
Ns 2011-12 2012-13 2013-14 2014-15
NAZ-enrolled 14 44 69 103
Zone-wide (non-NAZ) 132 170 205 238
Anchor Schools 305 338 387 367
A7. MCA reading proficiency, grades 3-5, 2012–2015 – supplements Figure 4
Ns 2011-12 2012-13 2013-14 2014-15
NAZ-enrolled 33 113 197 280
Zone-wide (non-NAZ) 438 470 570 690
Anchor Schools 921 974 1045 1116
43%
14% 22% 16%
40%
17% 16% 15%
60%
28% 29%22%
64%
42% 41% 41%
80%
57% 58% 59%
2011-12 2012-13 2013-14 2014-15NAZ-enrolled Zone-wide (non-NAZ) Anchor SchoolsMPS Statewide
TEST
C
HAN
GE
39%
19% 19% 20%
38%
16% 14% 15%
51%
27% 28% 26%
59%
42% 42% 44%
78%
58% 60% 61%
2011-12 2012-13 2013-14 2014-15NAZ-enrolled Zone-wide (non-NAZ) Anchor SchoolsMPS Statewide
TEST
C
HAN
GE

NAZ 2015 Academic Outcomes 2015 32 Wilder Research, April 2016
A8. MCA math proficiency, grade 8, 2012–2015 – supplements Figure 9
Ns 2011-12 2012-13 2013-14 2014-15
NAZ-enrolled * 19 36 46
Zone-wide (non-NAZ) 98 155 146 190
Anchor Schools 168 175 228 226
Notes: NAZ-enrolled counts for 2011-12 are suppressed due to the small number of students tested (N<10).
It is noteworthy that Anchor School proficiency rates have declined over the past three years, while MPS district-wide rates have risen. The cause of the proficiency decline in the Anchor School population is unknown. Most NAZ scholars represented in this report (the students for whom academic data are available) attend one of these Anchor Schools, and are therefore likely subject to the same unknown factors that have led to lower proficiency rates in these schools as a whole. These results thus suggest that NAZ efforts may be helping their scholars to withstand these factors.
A9. MCA math proficiency, grades 3-5, 2012–2015 – supplements Figure 10
Ns 2011-12 2012-13 2013-14 2014-15
NAZ-enrolled 35 113 197 277
Zone-wide (non-NAZ) 448 480 573 692
Anchor Schools 934 970 1043 1123
21% 17%26%29%
19% 16% 18%
40% 46%29% 25%
38% 38% 42% 44%
61% 57% 58% 58%
2011-12 2012-13 2013-14 2014-15NAZ-enrolled Zone-wide (non-NAZ) Anchor SchoolsMPS Statewide
23%34% 30% 27%28% 27% 23% 25%
47% 45% 42%33%
45% 48% 49% 50%
70% 67% 68% 67%
2011-12 2012-13 2013-14 2014-15NAZ-enrolled Zone-wide (non-NAZ) Anchor SchoolsMPS Statewide

NAZ 2015 Academic Outcomes 2015 33 Wilder Research, April 2016
A10. MCA math proficiency, grades 6-8, 2012–2015 – supplements Figure 11
Ns 2011-12 2012-13 2013-14 2014-15
NAZ-enrolled 23 74 129 154
Zone-wide (non-NAZ) 372 442 480 553
Anchor Schools 608 687 749 783
13% 15% 16% 17%17% 17% 14% 15%
36% 28% 27% 21%
36% 38% 39% 41%
59% 56% 57% 57%
2011-12 2012-13 2013-14 2014-15NAZ-enrolled Zone-wide (non-NAZ) Anchor SchoolsMPS Statewide

NAZ 2015 Academic Outcomes 2015 34 Wilder Research, April 2016
Appendix V: Additional analyses The charts in this Appendix represent additional analyses that have been conducted, and provide additional detail about some of the points illustrated in the main report. Figures A11 and A12 supplement the proficiency rates for the three groups shown in Appendix IV with growth rates for the most recent year tested. Figures A13 and A14 provide more detailed results in reading proficiency at the elementary school that has the longest experience fully implementing NAZ strategies at the schoolwide level. .
MCA reading and math growth
A11. MCA reading growth 2014-15, grades 4-8

NAZ 2015 Academic Outcomes 2015 35 Wilder Research, April 2016
A12. MCA math growth 2014-15, grades 4-8
Spotlight on an example of an Anchor School site with more mature implementation: Hall International
Elizabeth Hall International Elementary School, one of NAZ’s 10 Anchor Schools, has the longest experience fully integrating NAZ strategies. As envisioned in the Anchor School theory of change, Hall not only hosts NAZ staff but also has taken in the NAZ staff as their own resource, incorporated directly into the school’s process of working with scholars and their families. NAZ and Hall staff work together on a shared vision; Hall staff and leadership see NAZ as an essential strategy for their school and understand their school’s vital role in the broader NAZ strategy. Hall is invested in NAZ’s data-driven approach, and they make regular use of their own data as well as data shared by NAZ to inform their strategies to help their scholars succeed. Finally, in their day-to-day work, the NAZ team shares their office space with Hall staff to facilitate an ongoing dialogue among the team members. The result is a complete and fully aligned pipeline from the scholar’s academic performance to Hall staff to the Navigator and Connector to the parent and back again. This pipeline keeps parents aware of what’s going on in the school and keeps teachers aware of what’s going on at home, creating an integrated support system for each scholar.
This integrated approach has yielded strong results for NAZ scholars at Hall (Figure A13). The reading proficiency rate among NAZ scholars at Hall is 32 percent, compared to 18 percent for other Zone residents attending Hall and 17 percent for NAZ scholars at other Anchor Schools.

NAZ 2015 Academic Outcomes 2015 36 Wilder Research, April 2016
A13. 2014-15 MCA reading proficiency, Grades 3-5, Hall compared to other Anchor Schools
Ns Hall Other Anchors
NAZ-enrolled students 50 230
Zone-wide students not enrolled in NAZ 39 651
Anchor students not enrolled in NAZ 198 918
While NAZ scholars at Hall have excelled, these strong results do not appear to be tied to any individual solution, suggesting that the whole of NAZ implementation achieves results much greater than the sum of its parts. For example, NAZ scholars who participated in Expanded Learning show lower proficiency rates than their NAZ-enrolled peers who did not participate, a result likely driven by the deliberate selection of lower-performing students into the after-school programming (Figure A14). At Hall, many NAZ scholars have begun to thrive, but the available data indicate that these strong results are driven by the whole of NAZ, not by any single solution.
A14. 2014-15 MCA reading proficiency by Expanded Learning participation, Hall only
32%
17%18% 15%
29%26%
NAZ-enrolled students
Zone residents not enrolled in NAZ
All students at the school
Hall Other anchor schools
52%
17%
48%
83%
No ExL (N=21)
1+ sessions of ExL (N=29)
Proficient Not proficient
NAZ 2015 Academic Outcomes 2015 37 Wilder Research, April 2016
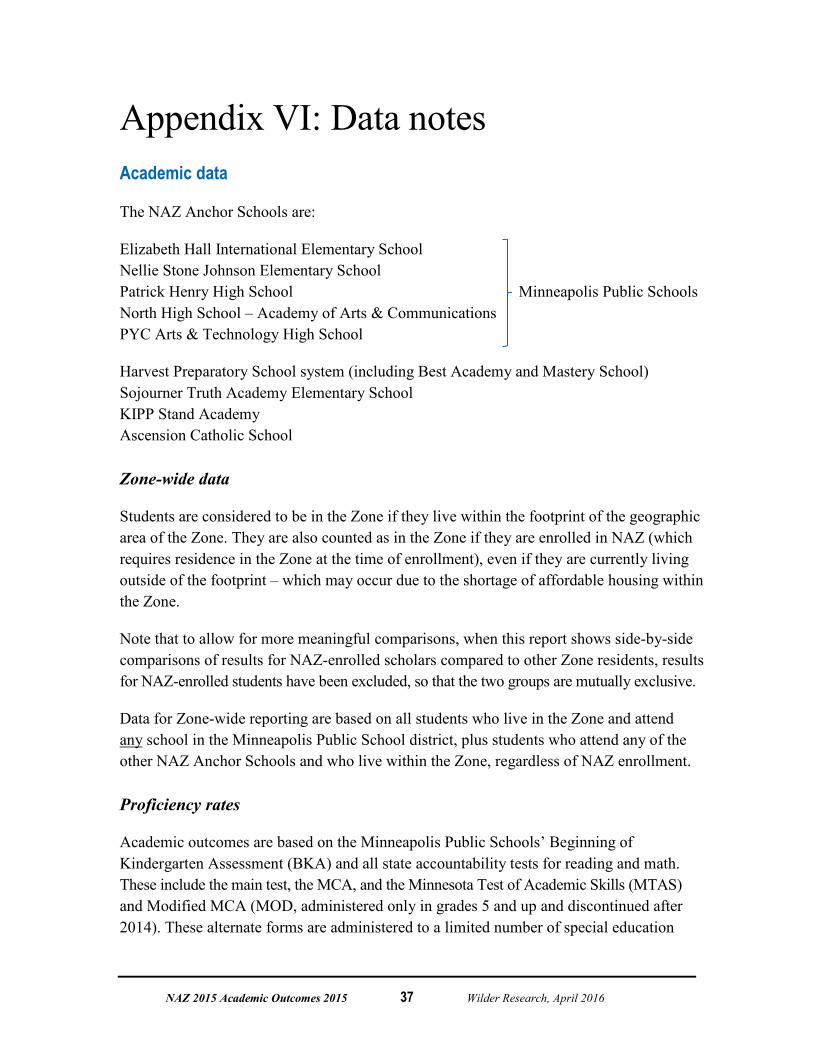
Appendix VI: Data notes Academic data
The NAZ Anchor Schools are:
Elizabeth Hall International Elementary School Nellie Stone Johnson Elementary School Patrick Henry High School Minneapolis Public Schools North High School – Academy of Arts & Communications PYC Arts & Technology High School
Harvest Preparatory School system (including Best Academy and Mastery School) Sojourner Truth Academy Elementary School KIPP Stand Academy Ascension Catholic School
Zone-wide data
Students are considered to be in the Zone if they live within the footprint of the geographic area of the Zone. They are also counted as in the Zone if they are enrolled in NAZ (which requires residence in the Zone at the time of enrollment), even if they are currently living outside of the footprint – which may occur due to the shortage of affordable housing within the Zone.
Note that to allow for more meaningful comparisons, when this report shows side-by-side comparisons of results for NAZ-enrolled scholars compared to other Zone residents, results for NAZ-enrolled students have been excluded, so that the two groups are mutually exclusive.
Data for Zone-wide reporting are based on all students who live in the Zone and attend any school in the Minneapolis Public School district, plus students who attend any of the other NAZ Anchor Schools and who live within the Zone, regardless of NAZ enrollment.
Proficiency rates
Academic outcomes are based on the Minneapolis Public Schools’ Beginning of Kindergarten Assessment (BKA) and all state accountability tests for reading and math. These include the main test, the MCA, and the Minnesota Test of Academic Skills (MTAS) and Modified MCA (MOD, administered only in grades 5 and up and discontinued after 2014). These alternate forms are administered to a limited number of special education
NAZ 2015 Academic Outcomes 2015 38 Wilder Research, April 2016
students whose disabilities prevent them from attaining grade-level proficiency; achievement expectations on these tests are less rigorous.
Growth scores
Reporting on growth is based on growth Z-scores assigned by the state for all students in grades 4 through 8 (as well as 10th grade reading and 11th grade math), provided they took the same version of the MCA test in two consecutive years and made the normal progression from grade to grade between the two tests. The scores are based on grouping students who have similar scores in the first year, and looking at the full range of scores for that group in the second year. Using a standard method of normalization, differences in raw scale scores are converted to Z-scores based on how far they are from the average. Those whose second-year scores are more than half a standard deviation below the statewide mean (in approximately the lowest one-third of the statewide distribution for their group) are classified by the state as having “low growth.” Those whose second-year scores are at least half a standard deviation above the statewide mean for the group (in approximately the top one-third of the distribution for their group) are classified as having “high growth.” Those within half a standard deviation of the mean are classified as “medium growth” and make up approximately one-third of most normally distributed groups.
This report follows the practices of the Minneapolis Public Schools by further dividing the “medium growth” group into those whose growth Z-scores were above or below the mean. The resulting groups are labeled “slightly above average growth” and “slightly below average growth.” To make the distinctions clear, the original state groups of “high growth” and “low growth” are labeled as “well above average growth” and “well below average growth,” respectively.
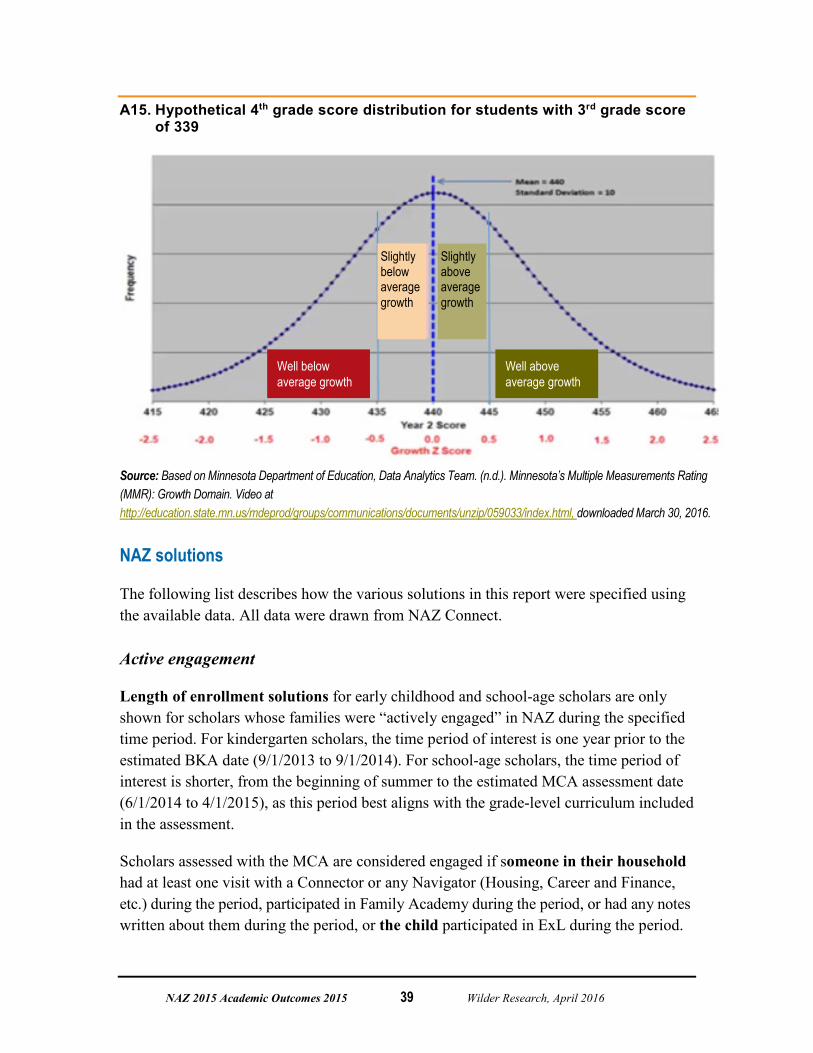
As an illustration, Figure A15 below shows how Z-scores are assigned for fourth grade students who shared the third grade MCA score of 339. In this hypothetical example, the average fourth grade scale score (represented by the vertical line at the highest point on the distribution) was 440, and the standard deviation (a score range which usually includes roughly two-thirds of most students) includes all scale scores within 10 points above or below that number. (The actual definition of standard deviation is more technical and is based on the average amount by which scores vary from the mean.) Growth Z-scores are capped at -3.0 for the least growth and at +3.0 for the highest growth. Students whose second-year scores were exactly at the average are in the “Slightly above average growth” group.
NAZ 2015 Academic Outcomes 2015 39 Wilder Research, April 2016
A15. Hypothetical 4th grade score distribution for students with 3rd grade score of 339
Source: Based on Minnesota Department of Education, Data Analytics Team. (n.d.). Minnesota’s Multiple Measurements Rating (MMR): Growth Domain. Video at http://education.state.mn.us/mdeprod/groups/communications/documents/unzip/059033/index.html, downloaded March 30, 2016.
NAZ solutions
The following list describes how the various solutions in this report were specified using the available data. All data were drawn from NAZ Connect.
Active engagement
Length of enrollment solutions for early childhood and school-age scholars are only shown for scholars whose families were “actively engaged” in NAZ during the specified time period. For kindergarten scholars, the time period of interest is one year prior to the estimated BKA date (9/1/2013 to 9/1/2014). For school-age scholars, the time period of interest is shorter, from the beginning of summer to the estimated MCA assessment date (6/1/2014 to 4/1/2015), as this period best aligns with the grade-level curriculum included in the assessment.
Scholars assessed with the MCA are considered engaged if someone in their household had at least one visit with a Connector or any Navigator (Housing, Career and Finance, etc.) during the period, participated in Family Academy during the period, or had any notes written about them during the period, or the child participated in ExL during the period.
Well above average growth
Well below average growth
Slightly above average growth
Slightly below average growth

NAZ 2015 Academic Outcomes 2015 40 Wilder Research, April 2016
Kindergarten scholars assessed with the BKA are considered engaged if someone in their household had at least one visit with a Connector or any Navigator (Housing, Career and Finance, etc.) during the period, participated in Family Academy during the period, or had any notes written about them during the period, or the child attended a high-quality early childhood program or received an early learning scholarship during the period.
Solutions for early childhood scholars
The following solutions were compared to impacts on kindergarten scholars, whose progress is assessed using the Beginning Kindergarten Assessment (BKA), which is administered at the beginning of kindergarten, generally one or two months into the school year.
Length of enrollment prior to the BKA measures the number of months a scholar had been enrolled prior to September 1, 2014, which approximates the date of BKA administration. Length of enrollment data are only provided for scholars who were actively engaged in NAZ during the year prior to the assessment, approximately September 1, 2013 to September 1, 2014.
Early childhood program enrollment is defined as enrollment in a high-quality early learning program—that is, one that has received a 3- or 4-star rating from Parent Aware—at any time prior to the BKA. Connections to early childhood learning programs are facilitated by NAZ.
Receipt of an early childhood scholarship is defined as a scholar’s documented receipt of an early childhood scholarship, secured via NAZ, at any point during the scholar’s enrollment prior to the BKA. These scholarships were primarily Race to the Top scholarships, though many scholars also received Pathway I State Scholarships and Buuck-Morgan scholarships.
Family Academy completion is defined as any family member’s documented completion of a Family Academy program at any time prior to scholar’s BKA.
Solutions for school-age scholars
Length of enrollment prior to the MCA measures the number of months a scholar had been enrolled prior to the assessment. Length of enrollment data are only provided for scholars who were actively engaged in NAZ between June 1, 2014 and April 1, 2015. This period best aligns with the curriculum assessed on the MCA.

NAZ 2015 Academic Outcomes 2015 41 Wilder Research, April 2016
Expanded Learning (ExL) participation is measured as enrollment in ExL during at least one of the three sessions prior to the 2014-15 MCA: Summer 2014, Fall 2014, and Spring 2015. This period best aligns with the curriculum assessed. This measure only reflects enrollment; analyses of program attendance were not performed.
Academic Navigation identifies the number of scholars with an “active” navigator on their team at any point between June 1, 2014 and April 1, 2015. This period best aligns with the curriculum assessed on the MCA.
Engagement with a Connector is included as a layer in some analyses. In this analysis, Connector engagement is defined at least one visit with a Connector by someone in the household between June 1, 2014 and April 1, 2015.
High-implementation Anchor Schools
The following criterial were used by NAZ staff to identify elementary schools that were most fully incorporating NAZ strategies and supports as part of their regular practices. The schools identified as having high implementation during 2014-15 were Hall and Ascension.
NAZ Space and Team Integration:
Co-located NAZ Staff have dedicated office space for all co-located staff. The space is located near the entrance to the building and families can easily access the office. There is identified space for private meetings with families, as needed.
School leadership and staff know the NAZ Staff and can articulate the role of NAZ Staff in relation to the school's mission and outcomes
NAZ Staff are consistently included in important school communication and routinely invited to relevant staff meetings and professional development
Family and Scholar connection / roster
Families/scholars are consistently connected for enrollment into NAZ through a clearly articulated pathway from school staff to NAZ staff.
School staff and NAZ staff collaboratively recruit families for NAZ enrollment through a team model that families understand as an integrated model of supports.
NAZ Staff have met their family enrollment and scholar roster target numbers for the school.

NAZ 2015 Academic Outcomes 2015 42 Wilder Research, April 2016
Utilization and Alignment of NAZ as Strategy
School and NAZ strategies are integrated as one, with performance measures and targets for NAZ clearly articulated within the full school plan
School and NAZ staff routinely use the "Team Scholar/Family" approach to align supports and actions for a scholar/family towards an agreed upon outcome for the family/scholar
School and NAZ staff create, develop, and implement strategies for families that utilize the Achievement Planning practice, build leadership pathways, and create cohorts of parents around a College-Bound Culture