nb private equity partners investor presentation... · investor presentationnavigating markets. ......
TRANSCRIPT

Navigating Markets. Discovering Opportunities.INVESTOR PRESENTATION
JANUARY 2017FINANCIAL INFORMATION AS OF 31 DECEMBER 2016 UNLESS OTHERWISE NOTED
NB PRIVATE EQUITY PARTNERS

NB PRIVATE EQUITY PARTNERS (“NBPE”)
OBJECTIVETo provide investors the opportunity for capital appreciation (through share price growth) and current income (through a regular dividend)…
MANAGER …using the sourcing and due diligence capabilities of Neuberger Berman’s $45 billion1 private equity platform…
STRATEGY…by investing directly into private equity-backed companies, across the capital structure in the best relative value opportunities…
_______________________1. Since inception through December 2016. Represents commitments managed and commitments still in the process of documentation.
EFFICIENCY …with lower all-in costs to investors than other listed PE vehicles
2

NBPE MANAGER: NEUBERGER BERMANWe invest directly into companies alongside private equity funds in their core areas of expertise
PRIVATE EQUITY PLATFORMOver $45 billion of commitments managed(1)
FUND INVESTMENTS DIRECT INVESTMENTS
Primary Secondary Co-Investments Private Debt Other Yielding Strategies
NBPE Focus
• Industry Leadership: 30 years as a private equity investor; committed approximately $3 billion annually(2) to private equity over the past three years
• Active Fund Relationships: 400+ with over 270 funds reviewed each year
• Experienced Investors: Expertise across fund investments, direct investments and yielding investments
• Deep Team: Over 115 dedicated private equity investment professionals with extensive networks
• Global Presence: Investment offices in New York, Dallas, Boston, London, Milan, Hong Kong and Bogota
_______________________1. Since inception through December 2016. Includes commitments still in the process of documentation.2. As of September 2016.
3

KEY INVESTMENT ATTRIBUTES
• Diversified portfolio of direct private equity and debt investments with a single
layer of fees
• Reasonable portfolio valuations and good underlying growth
• Strong historic investment performance and portfolio liquidity
• Conservative capital structure
1
2
3
4
NBPE has a number of compelling attributes
4
_______________________Note: as of 31 December 2016. This is intended as a broad overview of the Investment Managers’ style, philosophy and process and is subject to change without notice.
EQUITY INVESTMENTS
INCOME INVESTMENTS
FUND INVESTMENTS
21%
60%
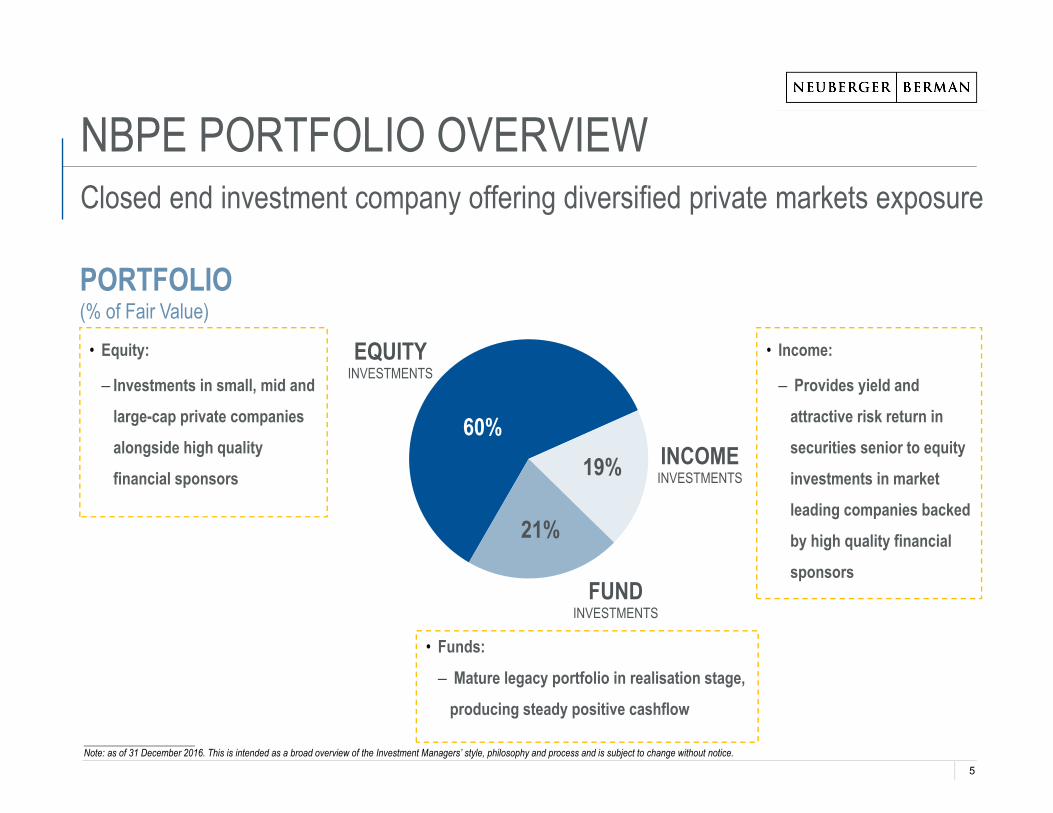
NBPE PORTFOLIO OVERVIEWClosed end investment company offering diversified private markets exposure
PORTFOLIO(% of Fair Value)
• Equity:
Investments in small, mid and
large-cap private companies
alongside high quality
financial sponsors
• Income:
Provides yield and
attractive risk return in
securities senior to equity
investments in market
leading companies backed
by high quality financial
sponsors
19%
• Funds:
Mature legacy portfolio in realisation stage,
producing steady positive cashflow
5

78% of NAV invested
in direct investments
and NAV per Share of
$15.43
_________________________Note: 31 December 2016 information above and throughout this presentation is based on the monthly estimate. Audited year-end financials will be available in March 2017.
NBPE SUMMARY BALANCE SHEET
NBPE BALANCE SHEET SUMMARY
($ in millions, except per share values)
31 December 2016 (Unaudited)
31 December 2015 (Audited)
Direct Investments
Income Investments $139.1 $283.0Equity Investments 451.4 350.5
Total Direct Investments 590.5 633.5Legacy Fund Investments 156.0 180.1Total Private Equity Fair Value 746.5 813.6Private Equity Investment Level 99% 116%Cash and Cash Equivalents 92.5 26.1Credit Facility Borrowings - (52.5)ZDP Share Liability - 2017 (14.5) (74.7)ZDP Share Liability - 2022 including FX Hedge (65.7) - Net Other Assets (Liabilities), including Minority Interest (5.6) (12.1)Net Asset Value $753.2 $700.3Net Asset Value per Share $15.43 $14.35Net Asset Value Plus Dividends Paid During Financial Period $15.93 -
6

North America87%
Europe8%
Asia / ROW5%
Well diversified portfolio weighted to North American investments
_______________________Note: as of 31 December 2016. Numbers may not sum due to rounding.
ASSET CLASS
Business Services
9%
Comm. / Media
4%Consumer
Discretionary14%Energy
9%
Financial Services
13%
Healthcare15%
Industrials12%
Technology19% Transp.
2%Div / Other
3%2008 & Earlier
8%
20093%
20105%
20115%
20127%2013
11%
201421%
201523%
201617%
Direct Equity Investments
60%
Funds21%
Income Investments
19%
DIVERSIFICATION BY FAIR VALUE
GEOGRAPHY
VINTAGE YEAR INDUSTRY
7
$16 $11 $36
$72
$31
$73
$53$16
$22$20
$14
$54
$6
$66
$6
$85
$24 $16
$24
$21
$20
$26
$12
$19$25
$33
$28
$15
$7
$5
$48
$11
$0
$20
$40
$60
$80
$100
$120
ContDist ContDist ContDist ContDist ContDist ContDist ContDist ContDist
FUNDS INCOME EQUITY
_______________________Note: as of 31 December 2016. Numbers may not sum due to rounding.
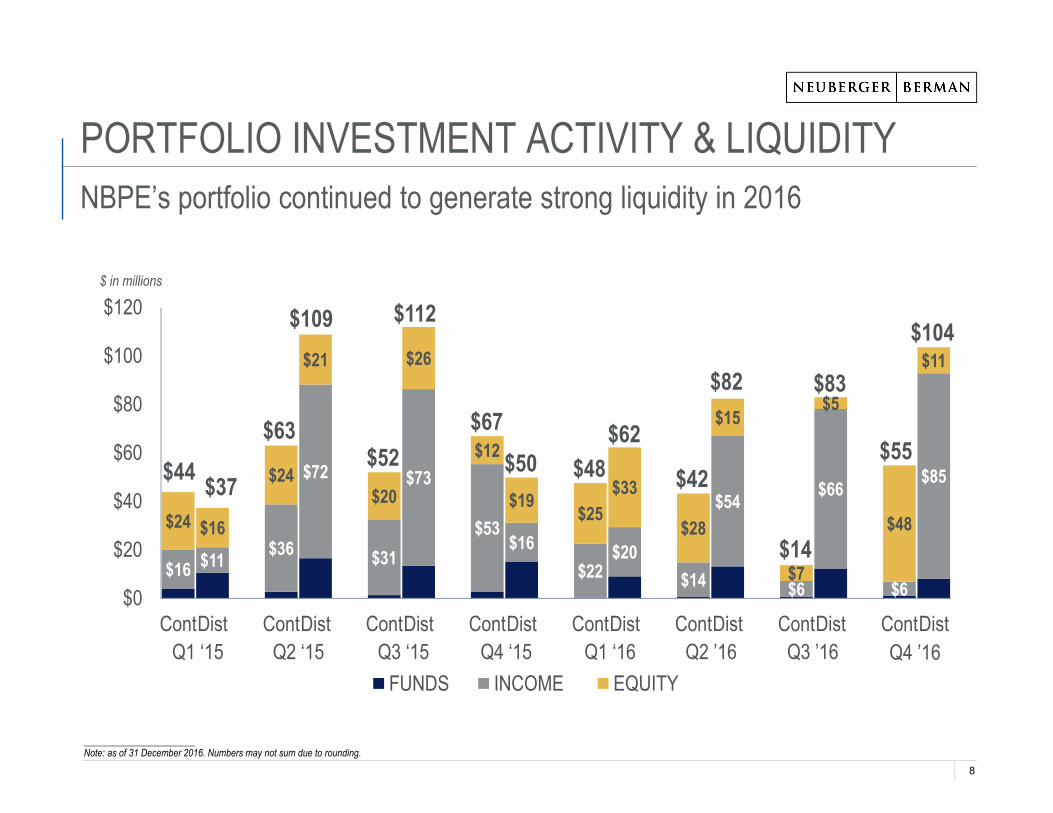
PORTFOLIO INVESTMENT ACTIVITY & LIQUIDITYNBPE’s portfolio continued to generate strong liquidity in 2016
$ in millions
$37
$63
$112
$44 $48$62
$82
$109
$52$67
$50 $42
Q1 ‘15 Q2 ‘15 Q3 ‘15 Q4 ‘15 Q1 ‘16 Q2 ’16 Q3 ’16
$14
$83
Q4 ’16
$55
$104
8

PERFORMANCE OVERVIEW2016 annual, three year, and five year investment performance summary
_______________________As of 31 December 2016. Numbers may not sum due to rounding.
Investment Type 31 Dec 2016 Fair Value
($M)
IRR: 2016 Annual
IRR: Three Year
IRR: Five Year
Direct Equity Investments 451.4 16.0% 20.6% 18.8%
Income Investments 139.1 13.5% 10.4% 11.8%
Funds 156.0 10.1% 5.9% 9.6%
NBPE Portfolio Gross IRR 746.5 14.0% 12.9% 13.2%
Key Takeaways:
• Direct equity investments have performed well across time periods• Income investments are performing well and have provided strong yields• Funds are now “tail ends” and winding down over time
9

DIRECT EQUITY INVESTMENTS

DIRECT EQUITY INVESTMENT STRATEGY
INVEST IN NEW DEALS CO-INVEST “MID-LIFE” INTO EXISTING PRIVATE EQUITY PORTFOLIO COMPANIES
Build and maintain a portfolio of direct private equity investments alongside leading private equity firms
• Working alongside lead GPs • Provides primary equity for growth / M&A
• Provides liquidity to investors • Provides primary equity to recapitalise balance sheets
ADD-ON ACQUISITIONS/GROWTH CAPITAL PARTIAL REALISATIONS RECAPITALISATIONSNEW BUYOUTS
• High quality businesses• Reasonable investment valuations• Co-investing alongside Managers in their core areas of expertise• Bias towards investments with shorter expected time to liquidity
11
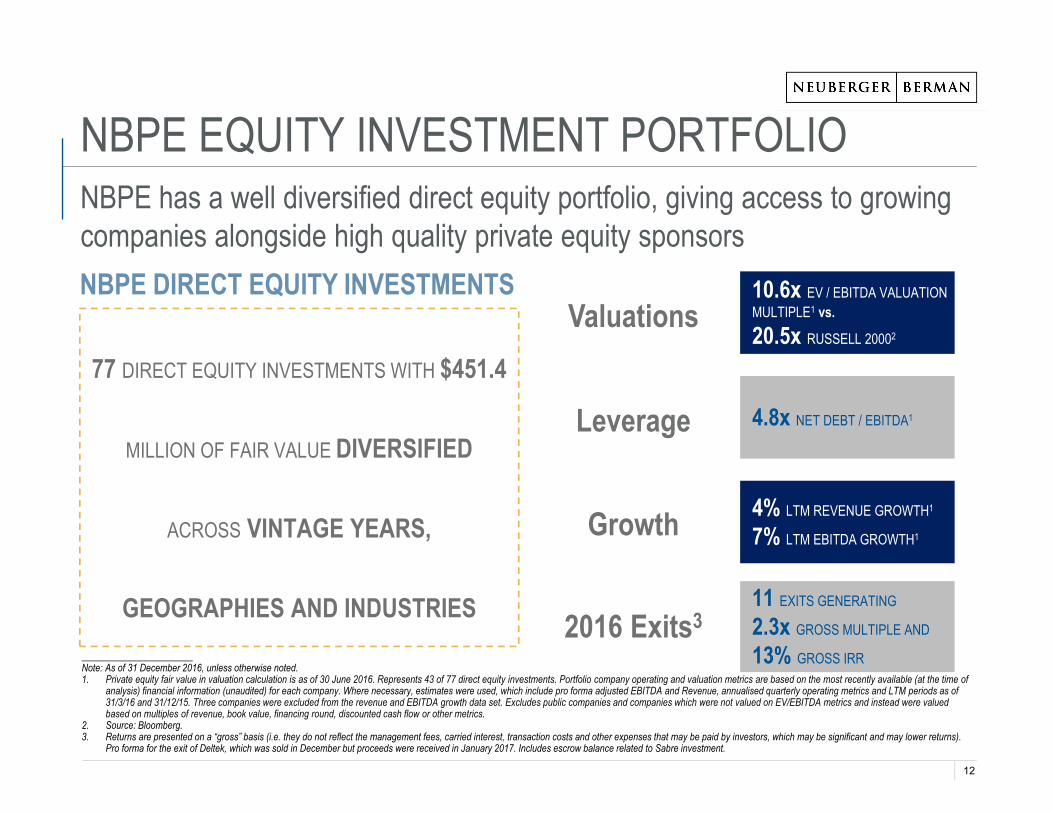
10.6x EV / EBITDA VALUATION MULTIPLE1 vs.
20.5x RUSSELL 20002
4.8x NET DEBT / EBITDA1
4% LTM REVENUE GROWTH1
7% LTM EBITDA GROWTH1
NBPE EQUITY INVESTMENT PORTFOLIONBPE has a well diversified direct equity portfolio, giving access to growing companies alongside high quality private equity sponsorsNBPE DIRECT EQUITY INVESTMENTS
77 DIRECT EQUITY INVESTMENTS WITH $451.4
MILLION OF FAIR VALUE DIVERSIFIED
ACROSS VINTAGE YEARS,
GEOGRAPHIES AND INDUSTRIES
Valuations
Leverage
Growth
11 EXITS GENERATING
2.3x GROSS MULTIPLE AND
13% GROSS IRR
2016 Exits3_______________________Note: As of 31 December 2016, unless otherwise noted.1. Private equity fair value in valuation calculation is as of 30 June 2016. Represents 43 of 77 direct equity investments. Portfolio company operating and valuation metrics are based on the most recently available (at the time of
analysis) financial information (unaudited) for each company. Where necessary, estimates were used, which include pro forma adjusted EBITDA and Revenue, annualised quarterly operating metrics and LTM periods as of 31/3/16 and 31/12/15. Three companies were excluded from the revenue and EBITDA growth data set. Excludes public companies and companies which were not valued on EV/EBITDA metrics and instead were valued based on multiples of revenue, book value, financing round, discounted cash flow or other metrics.
2. Source: Bloomberg.3. Returns are presented on a “gross” basis (i.e. they do not reflect the management fees, carried interest, transaction costs and other expenses that may be paid by investors, which may be significant and may lower returns).
Pro forma for the exit of Deltek, which was sold in December but proceeds were received in January 2017. Includes escrow balance related to Sabre investment.
12
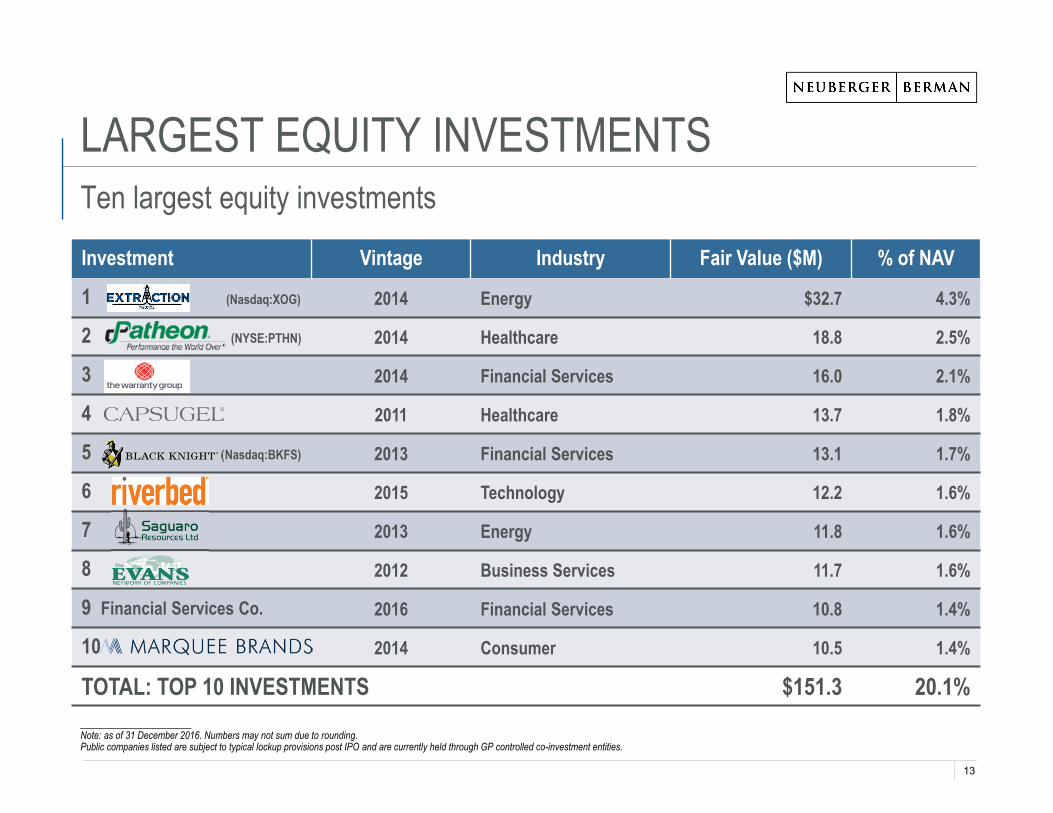
LARGEST EQUITY INVESTMENTSTen largest equity investments
Investment Vintage Industry Fair Value ($M) % of NAV
1 (Nasdaq:XOG) 2014 Energy $32.7 4.3%
2 (NYSE:PTHN) 2014 Healthcare 18.8 2.5%
3 2014 Financial Services 16.0 2.1%
4 2011 Healthcare 13.7 1.8%
5 (Nasdaq:BKFS) 2013 Financial Services 13.1 1.7%
6 2015 Technology 12.2 1.6%
7 2013 Energy 11.8 1.6%
8 2012 Business Services 11.7 1.6%
9 Financial Services Co. 2016 Financial Services 10.8 1.4%
10 2014 Consumer 10.5 1.4%
TOTAL: TOP 10 INVESTMENTS $151.3 20.1%_______________________Note: as of 31 December 2016. Numbers may not sum due to rounding.Public companies listed are subject to typical lockup provisions post IPO and are currently held through GP controlled co-investment entities.
13
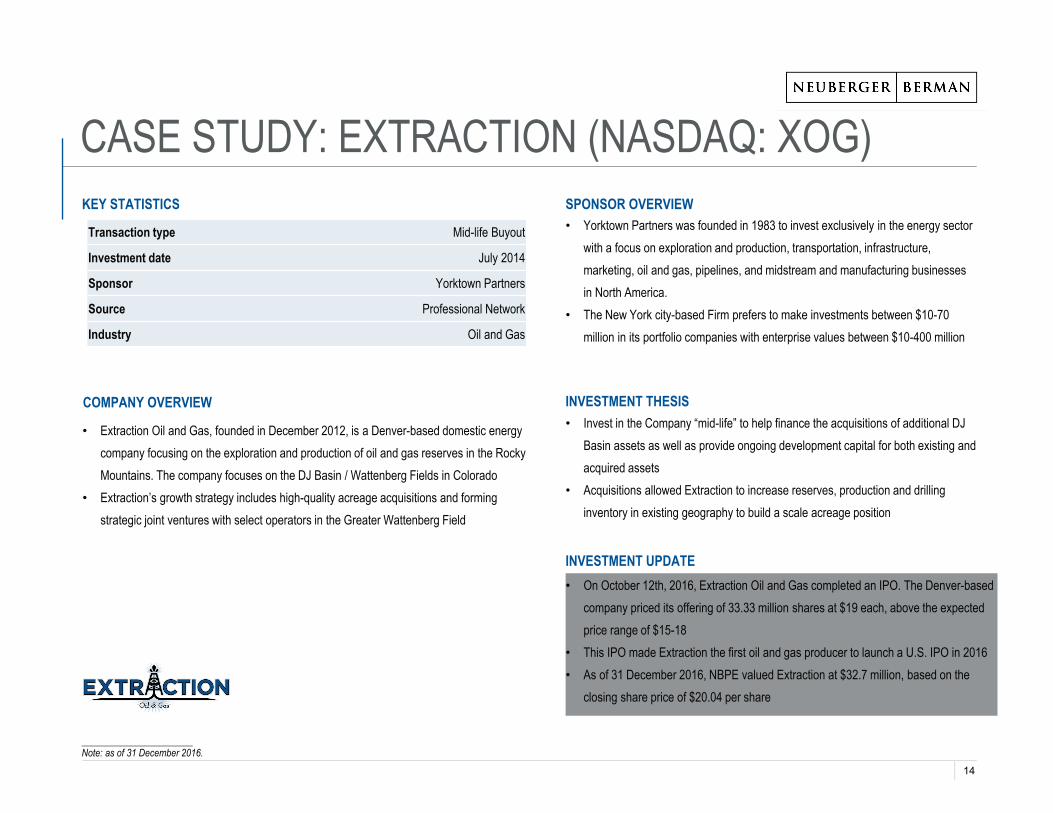
Transaction type Mid-life Buyout
Investment date July 2014
Sponsor Yorktown Partners
Source Professional Network
Industry Oil and Gas
• Yorktown Partners was founded in 1983 to invest exclusively in the energy sector with a focus on exploration and production, transportation, infrastructure, marketing, oil and gas, pipelines, and midstream and manufacturing businesses in North America.
• The New York city-based Firm prefers to make investments between $10-70 million in its portfolio companies with enterprise values between $10-400 million
CASE STUDY: EXTRACTION (NASDAQ: XOG)
_______________________Note: as of 31 December 2016.
INVESTMENT THESIS• Invest in the Company “mid-life” to help finance the acquisitions of additional DJ
Basin assets as well as provide ongoing development capital for both existing and acquired assets
• Acquisitions allowed Extraction to increase reserves, production and drilling inventory in existing geography to build a scale acreage position
COMPANY OVERVIEW
• Extraction Oil and Gas, founded in December 2012, is a Denver-based domestic energy company focusing on the exploration and production of oil and gas reserves in the Rocky Mountains. The company focuses on the DJ Basin / Wattenberg Fields in Colorado
• Extraction’s growth strategy includes high-quality acreage acquisitions and forming strategic joint ventures with select operators in the Greater Wattenberg Field
SPONSOR OVERVIEW
INVESTMENT UPDATE• On October 12th, 2016, Extraction Oil and Gas completed an IPO. The Denver-based
company priced its offering of 33.33 million shares at $19 each, above the expected price range of $15-18
• This IPO made Extraction the first oil and gas producer to launch a U.S. IPO in 2016• As of 31 December 2016, NBPE valued Extraction at $32.7 million, based on the
closing share price of $20.04 per share
KEY STATISTICS
14

8.7x 8.8x9.7x 10.3x 10.0x
10.6x
12.7x
15.9x15.1x
20.5x
9.3x8.7x
10.0x9.2x
10.0x
9.0x9.6x 10.1x
9.5x
12.2x
0x
2x
4x
6x
8x
10x
12x
14x
16x
18x
20x
22x
2012 2013 2014 2015 2016
NBPE Valuation(1): 10.6x
PRIVATE EQUITY BUYOUT MULTIPLESNBPE’s portfolio was held at 10.6x EV / EBITDA1. U.S. public markets were valued at 20.5x and new private market transactions occurred at an average of 10.0x, as of 31 December 2016
PUBLIC AND PRIVATE MARKET VS. NBPE VALUATIONS
U.S. Private U.S. Public Europe Private Europe Public_______________________Source: S&P Leveraged Buyout Quarterly Review as of Q4 2016. Public multiples based on Russell 2000 for the US and MSCI Europe Small Cap for Europe.1. Private equity fair value in valuation calculation is as of 30 June 2016. Represents 43 of 77 direct equity investments. Portfolio company operating and valuation metrics are based on the most recently available (at the time of
analysis) financial information (unaudited) for each company. Where necessary, estimates were used, which include pro forma adjusted EBITDA and Revenue, annualised quarterly operating metrics and LTM periods as of 31/3/16 and 31/12/15. Three companies were excluded from the revenue and EBITDA growth data set. Excludes public companies and companies which were not valued on EV/EBITDA metrics and instead were valued based on multiples of revenue, book value, financing round, discounted cash flow or other metrics.
15

EQUITY REALISATIONS AND IPOS IN 2016Investment Description Outcome1 • Sabre technology powers global travel systems
• Processes approximately $120 billion in travel spend each year• Fully exited – final sale of public stock in
2016; small escrow position remaining
2 • Oil and gas exploration and production in Colorado• The first oil producer to launch a U.S. IPO in 2016
• IPO – the company went public in October 2016. Public position still held
3 • Provider of enterprise software and information solutions• Serves government contractors, services and other project-based businesses
• Sold to Roper Technologies for $2.8 billion
4 • Manufacturing services for prescription drugs• World’s second biggest contract manufacturing organisation post merger
• IPO in July 2016. Public position still held
5 • #2 provider of automotive breakdown services in the United Kingdom • Sold to CVC for £2.2 billion
6 • Provides semiconductor-based technologies for connected devices• NXP merged with Freescale, creating a $10B combined-revenue company
• Fully exited – sold over time through secondary sales
7 • Helps companies design, build and manage wire and wireless networks• Portfolio of network infrastructure solutions, including fiber optics
• IPO in 2015; shares sold through series of secondary sales; final exit in 2016
8 • Global leader in aviation ground services • Sold to HNA Group for CHF 2.7 billion
9 • Three remaining generation assets were in the TPF Genco portfolio• Transaction included approximately 1,380 MW of natural gas-fired power
• Sold to Avenue Capital
10 • The company provides patient advisory services to healthcare providers• In May 2015, it raised $223 million via an IPO
• Fully exited – sold over time through secondary sales
11 • Provider of multi-channel billing and communications solutions• Serves healthcare and financial services industries with end-to-end solutions
• Sold to GTCR in November 2016
12 • Producer and distributor of environmentally-safe household products • Sold to Unilever in September 2016
13 • Leading provider of full life-cycle IT services including agile software development, data analytics, infrastructure optimisation and enterprise IT
• Merger / acquisition with CRGT for cash consideration
The below realisations and IPOs represent $166 million of total value and a 2.3x multiple of invested capital
_______________________Note: as of 31 December 2016. Includes exit of Deltek, which was sold in December, but cash was received in January 2017. Numbers may not sum due to rounding. Currently held public companies listed are subject to typical lockup provisions post IPO and are currently held through GP controlled co-investment entities.
TPF Genco
16
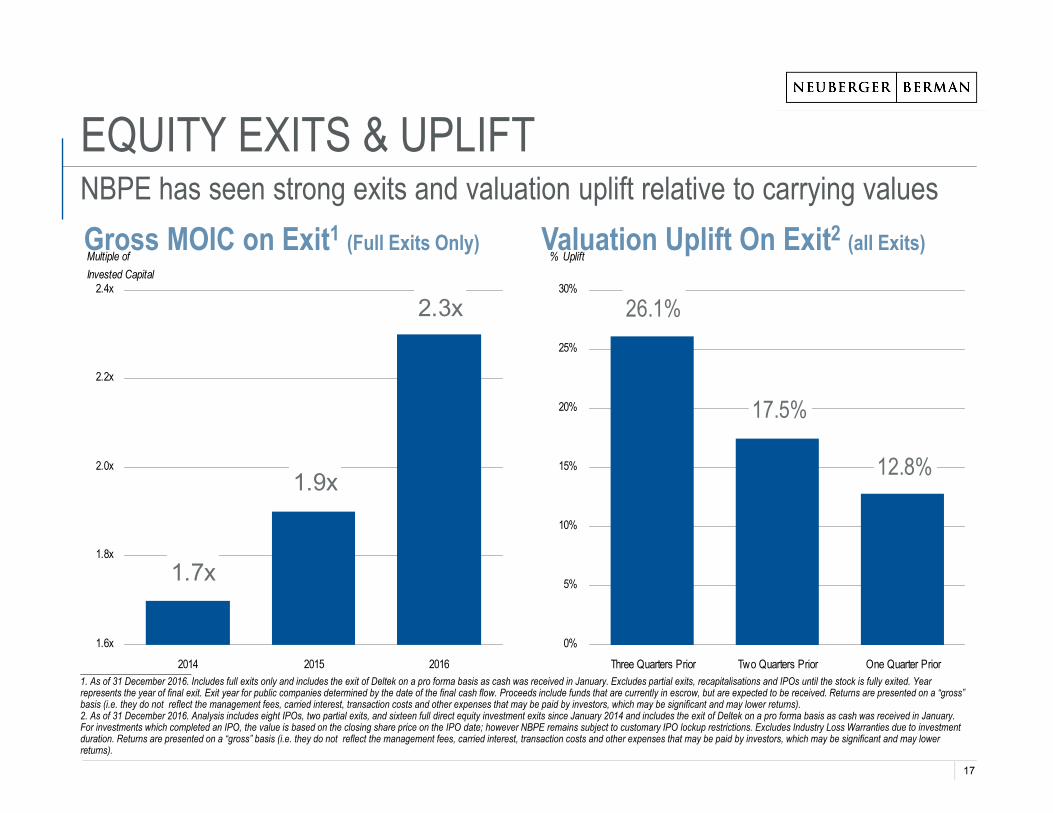
EQUITY EXITS & UPLIFTNBPE has seen strong exits and valuation uplift relative to carrying values
_______________________1. As of 31 December 2016. Includes full exits only and includes the exit of Deltek on a pro forma basis as cash was received in January. Excludes partial exits, recapitalisations and IPOs until the stock is fully exited. Year represents the year of final exit. Exit year for public companies determined by the date of the final cash flow. Proceeds include funds that are currently in escrow, but are expected to be received. Returns are presented on a “gross” basis (i.e. they do not reflect the management fees, carried interest, transaction costs and other expenses that may be paid by investors, which may be significant and may lower returns).2. As of 31 December 2016. Analysis includes eight IPOs, two partial exits, and sixteen full direct equity investment exits since January 2014 and includes the exit of Deltek on a pro forma basis as cash was received in January. For investments which completed an IPO, the value is based on the closing share price on the IPO date; however NBPE remains subject to customary IPO lockup restrictions. Excludes Industry Loss Warranties due to investment duration. Returns are presented on a “gross” basis (i.e. they do not reflect the management fees, carried interest, transaction costs and other expenses that may be paid by investors, which may be significant and may lower returns).
2.3x
1.9x
1.7x
1.6x
1.8x
2.0x
2.2x
2.4x
2014 2015 2016
Multiple of Invested Capital
Gross MOIC on Exit1 (Full Exits Only) Valuation Uplift On Exit2 (all Exits)
12.8%
17.5%
26.1%
0%
5%
10%
15%
20%
25%
30%
Three Quarters Prior Two Quarters Prior One Quarter Prior
% Uplift
17

INCOME INVESTMENTS

INCOME INVESTMENT STRATEGY
INVEST IN THE DEBT OF PRIVATE EQUITY BACKED COMPANIES
Since inception, robust deal flow and selectivity have led to strong and stable performance
CORPORATE DEBT - SECONDARY
• Invest in the junior debt of private equity backed businesses• Use the knowledge and relationships of the NB Private Equity platform for sourcing and due diligence• Invest on a Primary and Secondary basis
CORPORATE DEBT - PRIMARY
Second Lien Mezzanine
• Target smaller, less liquid issuers
• Rigorous fundamental private equity due diligence
• Long-term investment capabilities
• Target equity-like returns in fixed income
Mispricings or Dislocations Misunderstood Credits
19

_______________________Note: As of 31 December 2016. These are general characteristics that the Manager looks for in transactions but there is no assurance that the investments in NBPE will have all of these characteristics.1. Capital structure excludes small business loan programs and healthcare credit investments. Small business loan programs are excluded from yield calculations but are at an interest rate at least at the rate stated above.2. As of 30 June 2016. Based on most recent company data (unaudited).
NBPE DIRECT INCOME INVESTMENTSThe NBPE income portfolio is well diversified, performing well and has a reasonable average level of total leverage in the capital structureNBPE INCOME INVESTMENTS
31 INCOME INVESTMENTS TOTALING
$139.1 MILLION OF FAIR VALUE GENERATING
STRONG CASH YIELDS
Strong Cash Yield1
Position in Capital
Structure2
Variable Rates with Fixed Floor
Helps Support NBPE Dividend
10.0% CASH YIELD &
11.2% EST. YIELD TO MATURITY
5.3x WTD. AVG. TOTAL DEBT / EBITDA
3.9x WTD. AVG. SENIOR DEBT/ EBITDA
80% OF FAIR VALUE IN FLOATING RATE DEBT
52% DIVIDEND COVERAGE FROM YIELD FROM INCOME PORTFOLIO
20

21
INCOME PORTFOLIO CHARACTERISTICSThe income portfolio offers attractive risk / return characteristics in strong private equity back companies in securities senior to equity
_______________________Note: As of 31 December 2016. Percentages based on fair value of underlying income investments. Excludes Royalty-backed healthcare credit investments and small business loan portfolios.1. Companies have a leading market position in their industry or niche based on NB’s due diligence.
90% of income investments are in asset light companies
75% of income investments are in a market leading position1
66% of income investments are in companies with a >40% equity cushion
47% of income investments are in companies with a >25% EBITDA margin
100% of income investments are in performing credits with no covenant issues
21

LARGEST INCOME INVESTMENTS1
Ten largest income investmentsInvestment Industry Cash Yield Variable Rate Fair Value ($M) % of NAV
1 Business Services 10.4% Yes 10.3 1.4%
2 Technology 9.2% Yes 10.1 1.3%
3 Consumer NA Yes 10.0 1.3%
4 Healthcare 9.4% Yes 9.9 1.3%
5 Business Services 10.1% Yes 8.9 1.2%
6 Technology 8.1% Yes 6.4 0.8%
7 Technology 7.9% Yes 6.1 0.8%
8 Packaging 9.6% Yes 6.0 0.8%
9 Central Security Group Consumer 10.3% Yes 5.9 0.8%
10 Consumer 10.3% Yes 5.9 0.8%
TOTAL: TOP 10 INVESTMENTS $79.5 10.5%_______________________Note: as of 31 December 2016. Small business loan programs are excluded from the cash yield. Numbers may not sum due to rounding.1. Excludes credit ops positions.
22

Platform Investment Second Lien
Debt Terms L + 9.5% cash, 1.00% Floor
Transaction type Primary
Investment date December 2015
Sponsor CI Capital
Industry Business Services
NBPE Fair Value $10.3 million
• CI Capital is a North American focused private equity firm founded in 1993 with approximately $1.9 billion of AUM
• CI Capital focuses on making control investments in middle-market buyout companies and seeks to add value through add-on acquisitions, organic growth and operational improvements
• Since inception, CI Capital has acquired more than 150 companies representing over $7 billion in enterprise value
TOTAL FLEET SOLUTIONS
_______________________Note: as of 31 December 2016.
INVESTMENT THESIS• Strong value proposition to customers with the ability to deliver significant cost
savings• Complete solution for fleet management results in sticky customer base and
reoccurring revenue streams • Robust industry growth; favourable outsourcing trends• Diversified blue-chip customer base• Strong management team
COMPANY OVERVIEW• Total Fleet Solutions has been providing material handling equipment fleets with turnkey
fleet management solutions since 2001• Fleet management solutions allow customers to manage every aspect of fleet operations
to generate significant improvements and cost savings across the full life cycle of fleets they manage
• The company serves Fortune 1000 companies and large manufacturing and distribution companies throughout North America
• The company is headquartered in Holland, OH
SPONSOR OVERVIEW
INVESTMENT UPDATE• Strong financial performance to date
KEY STATISTICS
23

$210.7
$449.5
$100.0
$150.0
$200.0
$250.0
$300.0
$350.0
$400.0
$450.0
$500.0
LTM EXITS SINCE INCEPTION
INCOME INVESTMENT REALISATIONSStrong realisation activity from income investment portfolio
___________________________Note: As of 31 December 2016. Includes interest and principal. Returns are presented on a “gross” basis (i.e. they do not reflect the management fees, carried interest, transaction costs and other expenses that may be paid by investors, which may be significant and may lower returns).
$ in millions
Returns of Realised Investments
Since Inception:
13% IRR
1.2x gross multiple
Returns of Realised Investments
over Last Twelve Months:
12% IRR
1.2x gross multiple
24

FUND INVESTMENTS

_______________________Note: as of 31 December 2016. Numbers may not sum due to rounding.
FUND INVESTMENT PORTFOLIO LIQUIDITYNBPE’s fund portfolio has continued to produce strong liquidity while becoming an increasingly immaterial component of the overall portfolio
$43
$21 $16$7 $11
$2
$115
$90
$55
$148
$43
$112
$0
$40
$80
$120
$160
2011 2012 2013 2014 2015 20160%
20%
40%
60%
80%
Contributions Distributions Fund Investments as a % of Portfolio by Fair Value
$ millions Percentage of Portfolio
26

CAPITAL POSITION, RETURNS & PERFORMANCE

CAPITAL POSITIONStrong capital position and low adjusted unfunded commitments
NBPE CAPITAL POSITIONAS OF 31 DECEMBER 2016
CASH + CREDIT FACILITY AVAILABLE FOR BORROWING
$242.5M
LESS: UNFUNDED COMMITMENTSADJUSTED BASIS
($43.7M)
EXCESS CAPITAL RESOURCESADJUSTED BASIS
$198.8M
COMMITMENT COVERAGEADJUSTED BASIS
555%
_______________________Note: as of 31 December 2016. Unfunded commitments are adjusted by funds past their investment period and amounts which NBPE has the right to terminate if it so chooses.
28

HISTORIC PERFORMANCE
CUMULATIVE RETURNS OVER TIME1AS OF 31 DECEMBER 2016
ONEYEAR
THREEYEAR
FIVEYEAR
SINCE INCEPTION
NET ASSET VALUE2TOTAL RETURN 11.4% 35.9% 60.5% 77.1%
SHARE PRICETOTAL RETURN 17.9% 45.3% 103.2% 42.2%
_______________________Note: NAV data as of 31 December 2016. NBPE share price data based on NYSE Euronext as of 31 December 2016.1. All performance figures assume re-investment of dividends at NAV or closing share price on the ex-divided date and reflect cumulative returns over the relevant time periods shown and are not annualised returns.2. Based on 31 December 2016 monthly NAV of $15.43 per share.
29

$8
$10
$12
$14
$16
$18
Dec-11 Dec-12 Dec-13 Dec-14 Dec-15 Dec-16
NAV per Share
NAV per Share NAV Per Share (Including Dividends)
NBPE NAV GROWTHTotal return NAV increase of 60.5% over the past five years
_______________________Note: as of 31 December 2016.
30

$6.78
$0.26 $0.50$0.00
$1.00
$2.00
$3.00
$4.00
$5.00
$6.00
$7.00
2016 CASH DIST. TO NBPE
RUN RATE CASH INCOME
ANNUALISED DIVIDEND
DIVIDEND COVERAGEDividend is 52% covered by the cash yield from the income portfolio and ~14x covered by total cash distributions to NBPE in 2016$ per Share
52% DividendCoverage1
ANNUALISED YIELD2:
4.1% on share price
3.2% on NAV
INCOME INVESTMENTS:$139M of value / 10.0% cash yield
___________________________Note: See endnote #3 for important information related to the dividend. Cash yield and income excludes loan programs. As of 31 December 2016.1. Dividend coverage is gross of fees, expenses and financing costs.2. Based on the company’s most recent dividend and the London Stock Exchange closing share price of $12.16 on 19 January 2017 and the 31 December 2016 NAV of $15.43 per share.
31
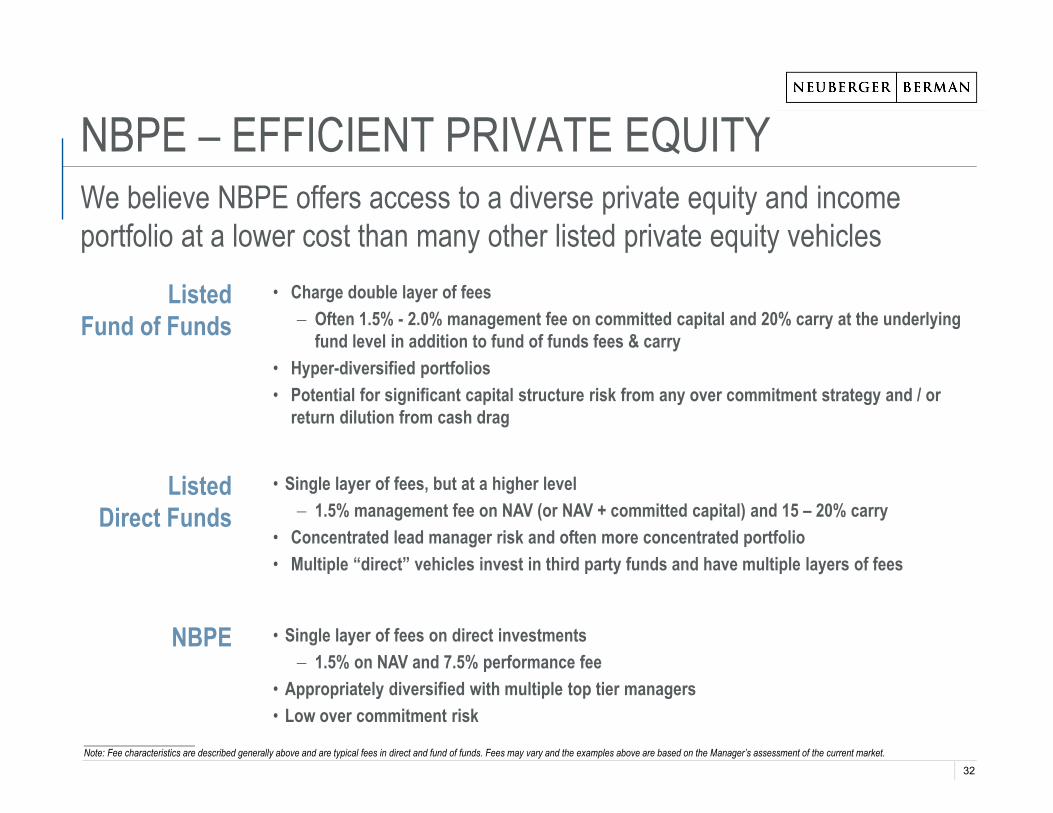
NBPE – EFFICIENT PRIVATE EQUITYWe believe NBPE offers access to a diverse private equity and income portfolio at a lower cost than many other listed private equity vehicles
ListedFund of Funds
• Charge double layer of fees Often 1.5% - 2.0% management fee on committed capital and 20% carry at the underlying
fund level in addition to fund of funds fees & carry• Hyper-diversified portfolios• Potential for significant capital structure risk from any over commitment strategy and / or
return dilution from cash drag
ListedDirect Funds
• Single layer of fees, but at a higher level 1.5% management fee on NAV (or NAV + committed capital) and 15 – 20% carry
• Concentrated lead manager risk and often more concentrated portfolio• Multiple “direct” vehicles invest in third party funds and have multiple layers of fees
NBPE • Single layer of fees on direct investments 1.5% on NAV and 7.5% performance fee
• Appropriately diversified with multiple top tier managers• Low over commitment risk
_______________________Note: Fee characteristics are described generally above and are typical fees in direct and fund of funds. Fees may vary and the examples above are based on the Manager’s assessment of the current market.
32

ATTRACTIVE VALUE PROPOSITIONWe believe NBPE offers a compelling investment opportunity
Capital appreciation and growth from equity investments
Income through an attractive dividend, supported by the cash yield from the income portfolio and investment realisations
Strong capital structure and commitment coverage
Private equity exposure with attractive fee structure – lower all-in fees than investing directly into LP funds
33

APPENDIX
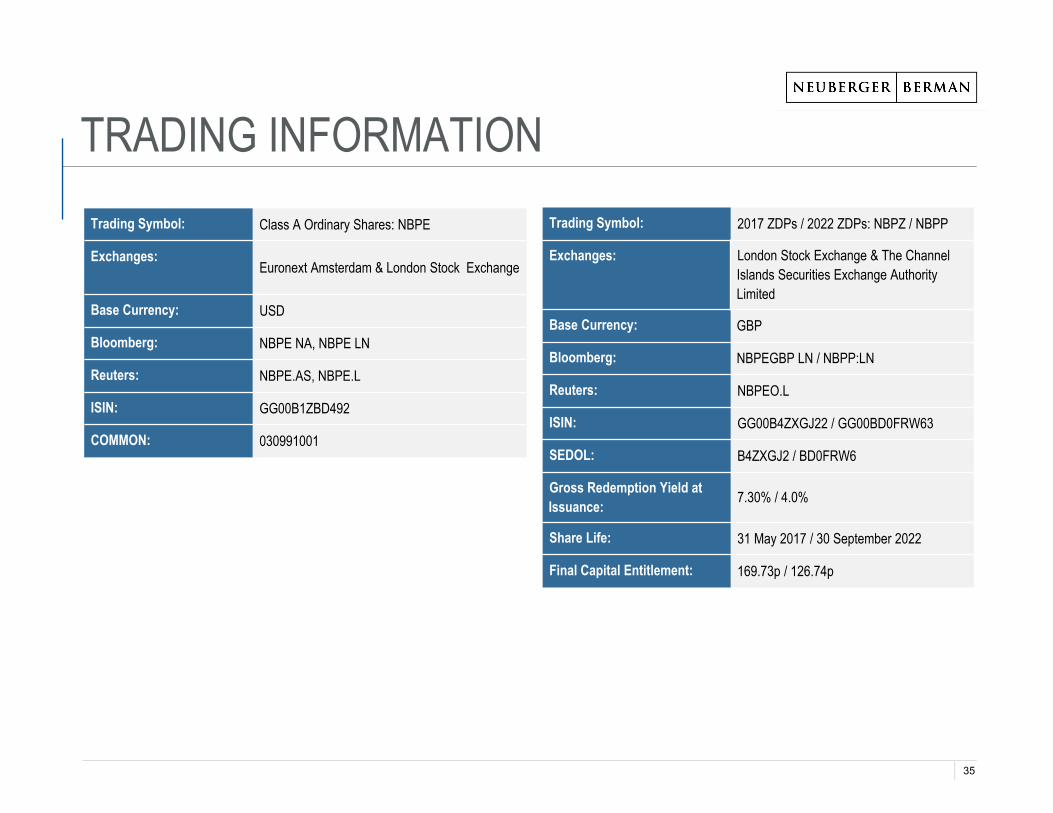
Trading Symbol: Class A Ordinary Shares: NBPE
Exchanges:Euronext Amsterdam & London Stock Exchange
Base Currency: USD
Bloomberg: NBPE NA, NBPE LN
Reuters: NBPE.AS, NBPE.L
ISIN: GG00B1ZBD492
COMMON: 030991001
Trading Symbol: 2017 ZDPs / 2022 ZDPs: NBPZ / NBPP
Exchanges: London Stock Exchange & The Channel Islands Securities Exchange Authority Limited
Base Currency: GBP
Bloomberg: NBPEGBP LN / NBPP:LN
Reuters: NBPEO.L
ISIN: GG00B4ZXGJ22 / GG00BD0FRW63
SEDOL: B4ZXGJ2 / BD0FRW6
Gross Redemption Yield at Issuance: 7.30% / 4.0%
Share Life: 31 May 2017 / 30 September 2022
Final Capital Entitlement: 169.73p / 126.74p
TRADING INFORMATION
35

Registered Office: NB Private Equity Partners LimitedP.O. Box 225Heritage Hall, Le Marchant StreetSt. Peter Port, Guernsey GY1 4HYChannel IslandsTel: +44.(0).1481.716.000
Investment Manager: NB Alternatives Advisers LLC325 N. Saint Paul StreetSuite 4900Dallas, TX 75201United States of America
Investor Relations: Web: www.nbprivateequitypartners.comEmail: [email protected]: +1.214.647.9593
Media Relations: Neustria PartnersNick HendersonTel: +44.20.3021.2583
Corporate Brokers: Stifel NicolausNeil WinwardTel: +44.20.7710.7600
Jefferies International LimitedGary Gould/Stuart KleinTel: +44.20.7029.8766
Research Analysts: Stifel Nicolaus– Iain ScoullerEmail: [email protected]
Jefferies – Mark Ambrose, CFAEmail: [email protected]
J.P. Morgan Cazenove – Christopher BrownEmail: [email protected]
Canaccord Genuity – Alan BrierleyEmail: [email protected]
Fidante – Tom Skinner Email: [email protected]
Liberum Capital – Coner FinnEmail: [email protected]
Numis – Charles Cade & Sarah LewandowskiEmail: [email protected]
Winterflood – Simon ElliottEmail: [email protected]
CONTACT INFORMATION
36

1. The diversification analysis by asset class and investment type is based on the fair value of underlying fund investments and direct/co-investments. Determinations regarding asset classand investment type represent the Investment Manager’s estimates. Accordingly, the actual diversification of our investment portfolio and the diversification of our investment portfolio onan ongoing basis may vary from the foregoing information. For the NB Alternatives Direct Co-investment Program and the NB Healthcare Credit Investment Program commitments, totalexposure only reflects the funded investments to date. Unfunded amounts and unfunded percentages within each of these programs are excluded from the analysis, as capitaldeployment is opportunistic and cannot be accurately forecast at this time.
2. The diversification analysis by geography is based on the diversification of underlying portfolio company investments at fair value as estimated by the Investment Manager.Determinations regarding geography and industry also represent the Investment Manager’s estimates. Accordingly, the actual diversification of our investment portfolio and thediversification of our investment portfolio on an ongoing basis may vary from the foregoing information. For the NB Alternatives Direct Co-investment Program and the NB HealthcareCredit Investment Program commitments, total exposure only reflects the funded investments to date. Unfunded amounts and unfunded percentages within each of these programs areexcluded from the analysis, as capital deployment is opportunistic and cannot be accurately forecast at this time.
3. Guidance regarding NBPE’s future portfolio and performance is a target only and not a profit forecast. There can be no assurance that this target will be met or that the Company willmake any future distributions whatsoever. Any such changes will be notified to shareholders through a regulatory information service. NBPE’s Board of Directors will continue to evaluatethe Company’s financial position, annual dividend target and the timing of future dividends. Future dividend payments will be announced by NBPE after the Board of Directors havecompleted such evaluation.
4. Yield to maturities represent the return (IRR) from this reporting period to maturity of the investment. Includes a portfolio of small business loans at an interest rate at least at the ratestated above but not included in the yield calculations. The Taylor Precision Products debt notes currently pay 13% cash, but issuer has the option to pay 11% and 2% PIK.
5. Actual unfunded commitments are $321.2 million at 31 December 2016, corresponding to actual over commitment of $78.7 million and an actual commitment coverage ratio of 75.5%.Unfunded adjustments include removing unfunded commitments to funds past their investment period (although some amount may be called for future follow-ons or expenses), andamounts which can be terminated by NBPE if it so chooses.
ENDNOTES
37
THE CONTENTS OF THIS DOCUMENT AND THE PRESENTATION ARE STRICTLY CONFIDENTIAL AND MAY NOT BE COPIED, DISTRIBUTED, PUBLISHED OR REPRODUCED INWHOLE OR IN PART, OR DISCLOSED OR DISTRIBUTED BY RECIPIENTS TO ANY OTHER PERSON. ANY RECIPIENT OF THIS DOCUMENT AGREES TO KEEP PERMANENTLYCONFIDENTIAL ALL INFORMATION HEREIN NOT ALREADY IN THE PUBLIC DOMAIN.This document and the presentation are not for release, publication or distribution (directly or indirectly) in or into the United States, Canada, Australia or Japan or to any "US person" asdefined in Regulation S under the United States Securities Act of 1933, as amended (the "Securities Act") or into any other jurisdiction where applicable laws prohibit its release,distribution or publication. It does not constitute an offer of securities for sale anywhere in the world, including in or into the United States, Canada, Australia or Japan. No recipient maydistribute, or make available, this document or the presentation (directly or indirectly) to any other person. Recipients of this document and the presentation should inform themselves aboutand observe any applicable legal requirements in their jurisdictions. In particular, the distribution of this document and the presentation may in certain jurisdictions be restricted by law.Accordingly, recipients represent that they are able to receive this document and relating presentation without contravention of any applicable legal or regulatory restrictions in thejurisdiction in which they reside or conduct business.This document and the presentation have been prepared by NB Private Equity Partners Limited ("NBPE") and NB Alternatives Advisers LLC (the "Investment Manager"). No member ofthe Neuberger Berman Group nor any of their respective directors, officers, employees, advisors, representatives, or other agents makes or has been authorised to make any representationor warranties (express or implied) in relation to NBPE or as to the truth, accuracy or completeness of this document or the presentation, or any other written or oral statement provided. Inparticular, no representation or warranty is given as to the achievement or reasonableness of, and no reliance should be placed on any projections, targets, estimates or forecasts containedin this document or the presentation and nothing in this document or the presentation is or should be relied on as a promise or representation as to the future. The name "NeubergerBerman" is used interchangeably throughout these materials for a number of entities that are part of, or are associated with, the Neuberger Berman Group and when used in this noticeincludes all such entities.This document does not constitute a prospectus or offering memorandum or an offer in respect of any securities and is not intended to provide the basis for any decision inrespect of NBPE or other evaluation of any securities of NBPE or any other entity and should not be considered as a recommendation that any investor should subscribe for orpurchase any such securities. Neither the issue of this document nor the presentation nor any part of their contents constitutes an offer to sell or invitation to purchase anysecurities of NBPE or any other entity or any persons holding securities of NBPE and no information set out in this document or the presentation or referred to in other writtenor oral information is intended to form the basis of any contract of sale, investment decision or any decision to purchase any securities referred to in it.The information contained in this document is given at the date of its publication (unless otherwise marked) and is subject to updating, revision and amendment. No reliance may be placedfor any purpose whatsoever on the information of opinions contained in this document or on its completeness, accuracy or fairness. The contents of this document have not been approvedby any competent regulatory or supervisory authority.This document, any presentation made in conjunction with this document and any accompanying materials (the "Information Materials") are made available for information purposes only.The Information Materials, which are not a prospectus or listing particulars or an admission document, do not contain any representations, do not constitute or form part of any offer orinvitation to sell or transfer, or to underwrite, subscribe for or acquire, any shares or other securities, and do not constitute or form any part of any solicitation of any such offer or invitation,nor shall they are or any part of them or the fact of their distribution form the basis of or be relied upon in connection with any contract therefore, and do not constitute a recommendationregarding the securities of NBPE.Neither NBPE nor Neuberger Berman gives any undertaking to provide the recipient with access to any additional information, or to update this document, the presentation or any additionalinformation, or to correct any inaccuracies in it which may become apparent and the distribution of this document and the presentation shall not be deemed to be any form of commitment onthe part of NBPE, the Investment Manager or Neuberger Berman to proceed with any transaction.
LEGAL DISCLAIMER
38

THE PROMOTION OF NBPE AND THE DISTRIBUTION OF THIS DOCUMENT AND THE PRESENTATION IN THE UNITED KINGDOM IS RESTRICTED BY LAW. ACCORDINGLY, THIS COMMUNICATION ISDIRECTED ONLY AT (I) PERSONS OUTSIDE THE UNITED KINGDOM TO WHOM IT IS LAWFUL TO COMMUNICATE TO, OR (II) PERSONS HAVING PROFESSIONAL EXPERIENCE IN MATTERS RELATING TOINVESTMENTS WHO FALL WITHIN THE DEFINITION OF "INVESTMENT PROFESSIONALS" IN ARTICLE 19(5) OF THE FINANCIAL SERVICES AND MARKETS ACT 2000 (FINANCIAL PROMOTION) ORDER2005 (AS AMENDED), OR (III) HIGH NET WORTH COMPANIES, UNINCORPORATED ASSOCIATIONS AND PARTNERSHIPS AND TRUSTEES OF HIGH VALUE TRUSTS AS DESCRIBED IN ARTICLE 49(2) OFTHE FINANCIAL SERVICES AND MARKETS ACT 2000 (FINANCIAL PROMOTION) ORDER 2005 (AS AMENDED); PROVIDED THAT IN THE CASE OF PERSONS FALLING INTO CATEGORIES (II) OR (III), THECOMMUNICATION IS ONLY DIRECTED AT PERSONS WHO ARE ALSO "QUALIFIED INVESTORS" AS DEFINED IN SECTION 86 OF THE FINANCIAL SERVICES AND MARKETS ACT 2000 (EACH A "RELEVANTPERSON"). ANY INVESTMENT OR INVESTMENT ACTIVITY TO WHICH THIS COMMUNICATION RELATES IS AVAILABLE ONLY TO AND WILL BE ENGAGED IN ONLY WITH SUCH RELEVANT PERSONS.PERSONS WITHIN THE UNITED KINGDOM WHO RECEIVE THIS COMMUNICATION (OTHER THAN PERSONS FALLING WITHIN (II) AND (III) ABOVE) SHOULD NOT RELY ON OR ACT UPON THISCOMMUNICATION. YOU REPRESENT AND AGREE THAT YOU ARE A RELEVANT PERSON.NBPE HAS NOT BEEN, AND HAS NO INTENTION TO BE, REGISTERED UNDER THE U.S. INVESTMENT COMPANY ACT OF 1940, AS AMENDED (THE "INVESTMENT COMPANY ACT") AND INVESTORS WILLNOT BE ENTITLED TO THE BENEFITS OF THAT ACT. THE SECURITIES DESCRIBED IN THIS DOCUMENT HAVE NOT BEEN AND WILL NOT BE REGISTERED UNDER THE SECURITIES ACT.CONSEQUENTLY, SUCH SECURITIES MAY NOT BE OFFERED OR SOLD IN THE UNITED STATES OR TO U.S. PERSONS (AS SUCH TERM IS DEFINED IN REGULATION S UNDER THE SECURITIES ACT)UNLESS SUCH SECURITIES ARE REGISTERED UNDER THE SECURITIES ACT OR AN EXEMPTION FROM THE REGISTRATION REQUIREMENT OF THE SECURITIES ACT IS AVAILABLE. NO PUBLICOFFERING OF THE SECURITIES IS BEING MADE IN THE UNITED STATES.PROSPECTIVE INVESTORS SHOULD TAKE NOTE THAT ANY SECURITIES MAY NOT BE ACQUIRED BY INVESTORS USING ASSETS OF ANY RETIREMENT PLAN OR PENSION PLAN THAT IS SUBJECT TOPART 4 OF SUBTITLE B OF TITLE I OF THE UNITED STATES EMPLOYEE RETIREMENT INCOME SECURITY ACT OF 1974, AS AMENDED ("ERISA") OR SECTION 4975 OF THE UNITED STATES INTERNALREVENUE CODE OF 1986, AS AMENDED (THE "CODE"), ENTITIES WHOSE UNDERLYING ASSETS ARE CONSIDERED TO INCLUDE "PLAN ASSETS" OF ANY SUCH RETIREMENT PLAN OR PENSION PLAN,OR ANY GOVERNMENTAL PLAN, CHURCH PLAN, NON-U.S. PLAN OR OTHER INVESTOR SUBJECT TO ANY STATE, LOCAL, NON-U.S. OR OTHER LAWS OR REGULATIONS SIMILAR TO TITLE I OR ERISAOR SECTION 4975 OF THE CODE OR THAT WOULD HAVE THE EFFECT OF THE REGULATIONS ISSUED BY THE UNITED STATES DEPARTMENT OF LABOR SET FORTH AT 29 CFR SECTION 2510.3-101,AS MODIFIED BY SECTION 3(42) OF ERISA.THE MERITS OR SUITABILITY OF ANY SECURITIES MUST BE INDEPENDENTLY DETERMINED BY THE RECIPIENT ON THE BASIS OF ITS OWN INVESTIGATION AND EVALUATION OF NBPE, THEINVESTMENT MANAGER, AND NEUBERGER BERMAN. ANY SUCH DETERMINATION SHOULD INVOLVE, AMONG OTHER THINGS, AN ASSESSMENT OF THE LEGAL, TAX, ACCOUNTING, REGULATORY,FINANCIAL, CREDIT AND OTHER RELATED ASPECTS OF THE SECURITIES. RECIPIENTS OF THIS DOCUMENT AND THE PRESENTATION ARE RECOMMENDED TO SEEK THEIR OWN INDEPENDENTLEGAL, TAX, FINANCIAL AND OTHER ADVICE AND SHOULD RELY SOLELY ON THEIR OWN JUDGMENT, REVIEW AND ANALYSIS IN EVALUATING NBPE, THE INVESTMENT MANAGER, AND NEUBERGERBERMAN, AND THEIR BUSINESS AND AFFAIRS.THIS DOCUMENT AND THE PRESENTATION MAY CONTAIN CERTAIN FORWARD-LOOKING STATEMENTS. FORWARD-LOOKING STATEMENTS RELATE TO EXPECTATIONS, BELIEFS, PROJECTIONS,FUTURE PLANS AND STRATEGIES, ANTICIPATED EVENTS OR TRENDS AND SIMILAR EXPRESSIONS CONCERNING MATTERS THAT ARE NOT HISTORICAL FACTS. IN SOME CASES, FORWARD-LOOKING STATEMENTS CAN BE INDENTIFIED BY TERMS SUCH AS "ANTICIPATE", BELIEVE", "COULD", "ESTIMATE", "EXPECT", "INTEND", "MAY", "PLAN", "POTENTIAL", "SHOULD", "WILL", AND "WOULD",OR THE NEGATIVE OF THOSE TERMS OR OTHER COMPARABLE TERMINOLOGY. THE FORWARD-LOOKING STATEMENTS ARE BASED ON NBPE’S AND/OR NEUBERGER BERMAN'S BELIEFS,ASSUMPTIONS AND EXPECTATIONS OF FUTURE PERFORMANCE AND MARKET DEVELOPMENTS, TAKING INTO ACCOUNT ALL INFORMATION CURRENTLY AVAILABLE. THESE BELIEFS,ASSUMPTIONS, AND EXPECTATIONS CAN CHANGE AS A RESULT OF MANY POSSIBLE EVENTS OR FACTORS, NOT ALL OF WHICH ARE KNOWN OR ARE WITHIN NBPE’S OR NEUBERGER BERMAN’SCONTROL. IF A CHANGE OCCURS, NBPE’S BUSINESS, FINANCIAL CONDITION, LIQUIDITY AND RESULTS OF OPERATIONS MAY VARY MATERIALLY FROM THOSE EXPRESSED IN FORWARD-LOOKINGSTATEMENTS. SOME OF THE FACTORS THAT COULD CAUSE ACTUAL RESULTS TO VARY FROM THOSE EXPRESSED IN FORWARD-LOOKING STATEMENTS, INCLUDE, BUT ARE NOT LIMITED TO: THEFACTORS DESCRIBED IN THIS DOCUMENT AND THE PRESENTATION; THE RATE AT WHICH NBPE DEPLOYS ITS CAPITAL IN INVESTMENTS AND ACHIEVES EXPECTED RATES OF RETURN; NBPE’SAND THE INVESTMENT MANAGER’S ABILITY TO EXECUTE NBPE'S INVESTMENT STRATEGY, INCLUDING THROUGH THE IDENTIFICATION OF A SUFFICIENT NUMBER OF APPROPRIATE INVESTMENTS;THE CONTINUATION OF THE INVESTMENT MANAGER AS MANAGER OF NBPE'S INVESTMENTS, THE CONTINUED AFFILIATION WITH NEUBERGER BERMAN OF ITS KEY INVESTMENT PROFESSIONALS;NBPE’S FINANCIAL CONDITION AND LIQUIDITY; CHANGES IN THE VALUES OF OR RETURNS ON INVESTMENTS THAT THE NBPE MAKES; CHANGES IN FINANCIAL MARKETS, INTEREST RATES ORINDUSTRY, GENERAL ECONOMIC OR POLITICAL CONDITIONS; AND THE GENERAL VOLATILITY OF THE CAPITAL MARKETS AND THE MARKET PRICE OF NBPE’S SHARES.BY THEIR NATURE, FORWARD-LOOKING STATEMENTS INVOLVE KNOWN AND UNKNOWN RISKS AND UNCERTAINTIES BECAUSE THEY RELATE TO EVENTS, AND DEPEND ON CIRCUMSTANCES THATMAY OR MAY NOT OCCUR IN THE FUTURE. FORWARD-LOOKING STATEMENTS ARE NOT GUARANTEES OF FUTURE PERFORMANCE. ANY FORWARD-LOOKING STATEMENTS ARE ONLY MADE AS ATTHE DATE OF THIS DOCUMENT AND THE PRESENTATION, AND NEITHER NBPE NOR THE INVESTMENT MANAGER ASSUMES ANY OBLIGATION TO UPDATE FORWARD-LOOKING STATEMENTS SETFORTH IN THIS DOCUMENT WHETHER AS A RESULT OF NEW INFORMATION, FUTURE EVENTS, OR OTHERWISE, EXCEPT AS REQUIRED BY LAW OR OTHER APPLICABLE REGULATION. IN LIGHT OFTHESE RISKS, UNCERTAINTIES, AND ASSUMPTIONS, THE EVENTS DESCRIBED BY ANY SUCH FORWARD-LOOKING STATEMENTS MIGHT NOT OCCUR. NBPE QUALIFIES ANY AND ALL OF THEIRFORWARD-LOOKING STATEMENTS BY THESE CAUTIONARY FACTORS. PLEASE KEEP THIS CAUTIONARY NOTE IN MIND WHILE READING THIS DOCUMENT.
LEGAL DISCLAIMER - CONTINUED
39

BY ACCEPTING AND READING THIS DOCUMENT AND/OR ATTENDING THE PRESENTATION TO WHICH THIS DOCUMENT RELATES YOU WILL BE DEEMED TO HAVEREPRESENTED, WARRANTED AND UNDERTAKEN FOR THE BENEFIT OF NBPE, THE INVESTMENT MANAGER, NEUBERGER BERMAN AND OTHERS THAT (A) YOU AREOUTSIDE OF THE UNITED STATES AND ARE AN "INVESTMENT PROFESSIONAL" (AS DEFINED ABOVE), (B) YOU HAVE READ AND AGREE TO COMPLY WITH THE CONTENTSOF THIS NOTICE, YOU WILL KEEP THE INFORMATION IN THIS DOCUMENT AND DELIVERED DURING ANY PRESENTATION OR CONTAINTED IN ANY ACCOMPANYINGDOCUMENT AND ALL INFORMATION ABOUT NEUBERGER BERMAN CONFIDENTIAL, AND WILL NOT REPRODUCE OR DISTRIBUTE, IN WHOLE OR IN PART, (DIRECTLY ORINDIRECTLY) ANY SUCH INFORMATION, UNTIL SUCH INFORMATION HAS BEEN MADE PUBLICLY AVAILABLE AND TAKE ALL REASONABLE STEPS TO PRESERVE SUCHCONFIDENTIALITY, AND (C) YOU ARE PERMITTED, IN ACCORDANCE WITH APPLICABLE LAWS, TO RECEIVE SUCH INFORMATION.NBPE IS ESTABLISHED AS A CLOSED-END INVESTMENT COMPANY IN GUERNSEY AND THE COMPANY IS SUBJECT TO THE NETHERLANDS FINANCIAL SUPERVISION ACT(WET OP HET FINANCIEEL TOEZICHT, "WFT"), AS A LISTED ENTITY (UITGEVENDE INSTELLING) AS DEFINED IN SECTION 1:1 OF THE WFT. ALL INVESTMENTS ARE SUBJECTTO RISK. PAST PERFORMANCE IS NO GUARANTEE OF FUTURE RETURNS. PROSPECTIVE INVESTORS ARE ADVISED TO SEEK EXPERT LEGAL, FINANCIAL, TAX AND OTHERPROFESSIONAL ADVICE BEFORE MAKING ANY INVESTMENT DECISION. THE VALUE OF INVESTMENTS MAY FLUCTUATE. RESULTS ACHIEVED IN THE PAST ARE NOGUARANTEE OF FUTURE RESULTS.THIS DOCUMENT IS ISSUED BY NBPE WHOSE REGISTERED ADDRESS IS AT HERITAGE HALL, PO BOX 225, LE MARCHANT STREET, ST. PETER PORT, GUERNSEY GY1 4HY.NB ALTERNATIVES ADVISERS LLC IS A REGISTERED INVESTMENT ADVISER IN THE UNITED STATES. NEUBERGER BERMAN IS A REGISTERED TRADEMARK. ALL RIGHTSRESERVED. ©2017 NB ALTERNATIVES ADVISERS LLC.
LEGAL DISCLAIMER - CONTINUED
40