nber working paper series the effects of … · the effects of taxes on market responses to...
TRANSCRIPT

NBER WORKING PAPER SERIES
THE EFFECTS OF TAXES ON MARKET RESPONSES TODIVIDEND ANNOUNCEMENTS AND PAYMENTS:
WHAT CAN WE LEARN FROM THE2003 DIVIDEND TAX CUT?
Raj ChettyJoseph RosenbergEmmanuel Saez
Working Paper 11452http://www.nber.org/papers/w11452
NATIONAL BUREAU OF ECONOMIC RESEARCH1050 Massachusetts Avenue
Cambridge, MA 02138June 2005
Raj Chetty, [email protected], Joe Rosenberg, [email protected], Emmanuel Saez,[email protected], University of California, Department of Economics, 549 Evans Hall, #3880,Berkeley, CA 94720. We thank Alan Auerbach, Douglas Bernheim, Gustavo Grullon, Francisco Perez-Gonzalez, James Poterba, Douglas Skinner, and Joel Slemrod for helpful comments and discussions.Financial support from NSF Grant SAES-0134946 and the Sloan Foundation is gratefully acknowledged.The views expressed herein are those of the author(s) and do not necessarily reflect the views of the NationalBureau of Economic Research.
©2005 by Raj Chetty, Joseph Rosenberg, and Emmanuel Saez. All rights reserved. Short sections of text,not to exceed two paragraphs, may be quoted without explicit permission provided that full credit, including© notice, is given to the source.
The Effects of Taxes on Market Responses to Dividend Announcements and Payments: WhatCan We Learn from the 2003 Dividend Tax Cut?Raj Chetty, Joseph Rosenberg, and Emmanuel SaezNBER Working Paper No. 11452June 2005JEL No. G1, H3
ABSTRACT
This paper investigates the effects of capital gains and dividend taxes on excess returns around
announcements of dividend increases and ex-dividend days for U.S. corporations. Consistent with
standard no-arbitrage conditions, we find that the ex-dividend day premium increased from 2002
to 2004 when the dividend tax rate was cut. Consistent with the signalling theory of dividends, we
also find that the excess return for dividend increase announcements went down from 2002 to 2004.
However, these findings are very sensitive to the years chosen for the pre-reform control period.
Semi-parametric graphical analysis using data since 1962 shows that the relationship between tax
rates and ex-day and announcement day premia is very fragile and sensitive to sample period
choices. Strong year-to-year fluctuations in the ex-day and announcement day premia greatly reduce
statistical power, making it impossible to credibly detect responses even around large tax reforms.
The important non-tax factors affecting these premia must therefore be understood before progress
can be made in evaluating the role of taxation in market responses.
Raj ChettyDepartment of EconomicsUC Berkeley521 Evans Hall #3880Berkeley, CA 94720and [email protected]
Joseph RosenbergDepartment of EconomicsUC Berkeley521 Evans Hall #3880Berkeley, CA [email protected]
Emmanuel SaezUniversity of California549 Evans Hall #3880Berkeley, CA 94720and [email protected]

1 Introduction
There is a long-standing debate in the finance and public economics literatures about the role
of taxation in corporate dividend payout policies. Starting with Elton and Gruber (1970),
researchers have investigated whether the tax-favored treatment of capital gains relative to
dividends affects excess returns on ex-dividend and announcement dates.1 The answers to
these questions can potentially shed light on the efficiency consequences of dividend taxation as
well as the reasons why corporations pay dividends despite their tax disadvantage, as explained
in greater detail below.2 Despite substantial research, the empirical literature on this topic
remains controversial (see Allen and Michaely, 2003 for a recent survey).
This paper proposes to use the 2003 dividend tax cut in the United States to cast light on
these issues. The 2003 tax cut, part of the Jobs and Growth Tax Relief Reconciliation Act of
2003, eliminated most of the tax disadvantage of dividends relative to capital gains. Blouin
et al. (2004) and Chetty and Saez (2005) have shown that the reform indeed raised dividend
payments significantly, and in particular induced many firms to initiate dividend payments.
Here, we aim to investigate whether this reform had a significant effect on the ex-day and
announcement day price behavior as well. Consistent with the no-arbitrage conditions in
standard models, we find that the ex-dividend day premium increased from 2002 to 2004
when the dividend tax rate was cut. Consistent with the signalling theory of dividends (and in
contradiction with the agency models of dividends), we find that the excess return for dividend
increase announcements went down from 2002 to 2004.
In order to have a broader perspective and assess with greater confidence whether there
was a sharp change after 2003, we construct a time series of ex-day price changes and excess
returns around dividend increase announcements at an annual level since 1962 (the first year
daily price data becomes available) for all companies in the Center for Research in Security
Prices (CRSP) data. To the best of our knowledge, despite the large number of studies on
these issues, such a time series had not been constructed and examined in prior work. A
number of useful findings emerge from this long-run analysis.
First, we find that there is substantial year to year volatility in the annual time series of1The ex-day is the date at which the dividend leaves the share.2Note, however, that ex-dividend day price behavior does not allow us to distinguish the old view from the
new view of dividend payout policies (see Auerbach, 1983).
1

excess returns around both the ex-day and announcement day that is unrelated to tax changes.
The annual variation in the time series is not simply due to idiosyncratic firm level noise, since
this variation should be averaged out given the very large samples we are using. Powerful year
effects (aggregate shocks) unrelated to taxes are responsible for this pattern. Unfortunately,
the time series pattern is non-monotonic and therefore is unlikely to be explained by a single
change (such as the elimination of discrete pricing in the U.S. stock market) or by a gradual
trend (such as the rise of the share of corporate stocks owned by pension funds). Moreover,
we are unable to find a set of covariates that had much explanatory power in smoothing the
aggregate fluctuations. A simple power analysis shows that even the effects of large tax
reforms would be difficult to detect given the aggregate volatility of the series. We conclude
that one should be careful when comparing individual years (e.g. around a reform) to detect
a tax effect. The 2003 tax change illustrates this point well. As mentioned above, the ex-day
premium pattern suggests a strong tax effect if one compares 2002 to 2004, but a placebo test
comparing 2002 to 2000 would produce a false positive.
Second, the long run time pattern of the ex-day price behavior does not follow the long
run reduction in the disadvantage of capital gains versus dividends. Overall, it is therefore
difficult to detect any robust pattern that one could attribute with confidence to a tax effect
along the lines that Elton and Gruber (1970) originally proposed. More work is needed to
test the various theories of ex-day price changes using the full time series evidence rather than
a focus on particular years, as has been the tradition in the literature.
Third, consistent with the empirical results of the influential study by Bernheim and Wantz
(1995), we find that the overall effect of dividend increase announcements on prices has declined
over time while the tax disadvantage of dividends has fallen. This finding supports the
signalling theory of dividend payments, which argues that firms pay dividends despite their tax
disadvantage in order to send a signal to the market about their profitability. However, again
because of the large year to year variation in the time series of price effects, it is impossible
to detect systematic effects around the major tax reforms in the United States since 1962,
including the 2003 dividend tax cut. Therefore, the conclusion supporting the signalling
theory rests on the strong assumption that no other long term trend has driven the price
effects down. It is, however, quite plausible that factors other than tax changes (such as the
increased availability of information about corporate activities) could have caused the secular
2

decline in announcement premia.
Our general assessment is therefore that little knowledge about tax effects can be gained
even from large reforms such as the 2003 tax cut because of the extreme aggregate volatility
in the time series of the data. The estimates of prior studies – which obtain significant results
by making strong assumptions about the functional form or statistical properties of the error
terms in regressions or by focusing on particular windows around tax changes – should therefore
be viewed with caution. To be clear, we are not advocating time-series analysis instead of
focusing on sharp tax experiments. Rather, we argue that credible empirical analysis requires
examination of whether the changes in excess returns around a tax experiment are exceptional
relative to the fluctuations in a long time series.
The remainder of the paper is organized as follows. Section 2 presents the conceptual
framework and discusses previous work. Section 3 describes the data and our methodology.
Sections 4 and 5 present the empirical results on ex-dividend premia and dividend increase
announcements respectively. Section 6 describes the main methodological conclusions that
we draw from this analysis.
2 Conceptual Framework and Previous Work
Dividend payments affect short-term stock price behavior in two ways. First, firms announce
dividend payments about 4 to 6 weeks before the actual payment is made. Announcements of
dividend initiations (a firm starting to pay dividends) or dividend increases (for a firm already
paying dividends) are generally viewed as good news and generate on average a positive excess
return around the announcement date (see Allen and Michaely, 2003 for a survey). This
is because increases in regular dividend payments are perceived by the market as a strong
commitment to pay more dividends in the future. Historically, regular dividend payments (in
general quarterly, but sometimes annual or semi-annual) tend to be very smooth: Firms do
not increase their dividend payments very often, and are extremely reluctant to decrease or
terminate dividend payments.
Second, when the dividend is paid, the book value of the corporation is reduced by the
amount paid out, which generates a negative excess return around the payment event. More
precisely, when a corporation announces a dividend payment, it sets two key dates: the ex-
3

dividend date and the payment date. The payment date is the date when the corporation
effectively pays out the dividend and is in general about 2 weeks after the ex-dividend date.
Dividends, however, are paid out to stockholders according to stock ownership just before the
ex-dividend date (and not according to stock ownership at the time of payment). In other
words, a stockholder is entitled to the dividend payment if and only if he owns the stock just
before the start of the ex-dividend day.3 Therefore, we should expect a drop in price between
the end of day preceding the ex-day (sometimes called the cum-day to mean that the stock is
trading with the dividend on that day) and the beginning of the ex-day because those buying
the stock after the beginning of the ex-day are no longer entitled to the dividend payment.
The effects of dividend announcements and ex-dates on stock prices can be nicely illustrated
with the extremely large special dividend payment of $3 per share made by Microsoft at the end
of 2004. This special dividend (along with a doubling of the regular dividend) was announced
on July 20, 2004.4 One can clearly see on the figure that the share price rose quickly in
the days surrounding the announcement (illustrated with vertical lines in Figure 1). This
jump represents the “excess return” around the announcement date, which we define formally
below. The ex-dividend day for the special dividend was set as November 15, 2004. Hence
all individuals and institutions owning Microsoft shares before the start of November 15, 2004
were entitled to a $3 dividend per share. The sharp drop in the price at this time is consistent
with the negative excess return that we expect around the ex-date. Finally, dividend payments
were made by Microsoft to those shareholders on December 2, 2004 (irrespective of whether
they had sold their stock after November 15).
Our analysis roughly seeks to answer the question: “How would the excess returns around
the announcement and ex-dates in the Microsoft figure have differed if these events had oc-
curred prior to the 2003 tax cut?” We answer this question essentially by averaging excess
returns around the ex-day and announcement dates for many firms and comparing the means
during different tax regimes. Since the timing of the tax changes is quite important for our
analysis, it will be helpful to review the details of the reform here. The Jobs and Growth
Tax Relief Reconciliation Act of 2003 introduced favorable treatment for individual dividend3An individual purchasing the stock between the ex-day and payment day would not receive the dividend,
but the former owner would.4At the same day, Microsoft announced an increase in its regular dividend payment: Microsoft had previously
paid an annual dividend of 16 cents per share and announced that it was switching to quarterly payments of 8cents per share, effectively doubling its regular dividend payments.
4

income whereby dividends are taxed at a rate of 15 percent instead of facing the regular pro-
gressive individual income tax schedule with a top rate of 35 percent.5 The reform was officially
signed into law on May 28, 2003, but was first proposed by the Bush administration on Jan-
uary 7, 2003.6 The tax cut on dividend income was made retroactive to the beginning of 2003.
Therefore, during the first two quarters of 2003, corporations knew that dividends would face
lower taxes with some probability. President Bush initially proposed a full exemption of divi-
dend taxation at the individual level, potentially biasing pre-enactment expectations toward a
larger tax reduction than what actually occurred. The tax rate on long-term realized capital
gains was also reduced by the Jobs and Growth Tax Relief Reconciliation Act of 2003, but the
reduction was smaller from 20% to 15%, and applied only to capital gains realized after May
28, 2003. Thus, this change reduced significantly the tax disadvantage of dividends relative
to capital gains. The tax cut is scheduled to expire by 2009, but could be made permanent
during the second Bush administration.
2.1 Ex-Dividend Day Returns and Taxes
The profit from selling at the end of cum-day (just preceding the ex-day) should equal the
profit from selling at the beginning of the ex-day in order to eliminate arbitrage opportunities.
In a world without taxes, this would mean that the drop in share price around the ex-day
should equal the dividend per share. However, as first recognized by Elton and Gruber
(1970), dividend and capital gains taxation can prevent this equality from holding. Ignoring
overnight interest, the no-arbitrage condition with taxes is:
PB − tg(PB − P0) = PA − tg(PA − P0) + D(1− td), (1)
where5More precisely, taxpayers in the bottom two income tax brackets (facing a regular marginal tax rate of 10 or
15 percent) face a new dividend tax rate of 5 percent, while taxpayers in the top four brackets (facing marginaltax rates of 25, 28, 33, or 35 percent) face a new dividend tax rate of 15 percent. Taxpayers on the AlternativeMinimum Tax schedule (flat rate of 28 percent) benefit from the reduced 15 percent tax rate on their dividendincome as well. Individual dividend income earned through tax-favored accounts such as 401(k)s and dividendincome earned by government agencies, nonprofit organizations, and corporations are not affected by the taxchange.
6Auerbach and Hassett [this volume] discuss the timing of the tax reform legislative process in detail. Theyfind that the reduction of dividend taxation was not discussed seriously before the end of December 2002. Itwas not mentioned in the Bush 2000 campaign platform either, suggesting that there was no anticipation thatsuch a tax change would take place before the very end of 2002.
5

PA is the stock price cum-dividend (just before the ex-dividend day starts),
PB is the expected stock price on the ex-day,
P0 is the stock price at initial purchase (tax base),
D is dividend amount per share,
tg is the tax rate on realized capital gains,
td is the tax rate on dividend income.
Rearranging equation (1), we obtain:
PA − PB
D=
1− td1− tg
≡ ρ. (2)
The left-hand-side of this expression is called the ex-day premium. The right-hand-side variable
captures the differential tax treatment of dividends versus realized capital gains and is called
the ex-day tax preference ratio, which we denote by ρ. Without taxes, the premium is expected
to be equal to one: the price falls by the exact amount of the dividend premium.7
Figure 1 depicts the case of the large $3 special dividend payment from Microsoft. This
special payment represented about 10% of the share price value and hence was large relative
to day to day variation in stock prices, making the ex-dividend day drop in price clearly visible
on the graph.8 The drop in price is $2.58, generating a premium of 0.86. This value is fairly
close to the value of 1 predicted by (2) in 2004, when the statutory rates for dividends and
long-term realized capital gains were equal.9
There is a controversial debate in the literature about whether taxes actually affect the
premium as in (2). Traditionally, the individual tax rate of dividend income has been sub-
stantially higher than the individual tax rate on (long-term) realized capital gains. Elton and
Gruber (1970) estimated premia for US corporations in 1966-7 lower than one and argued that
the differential tax could explain those results. Consistent with this claim, Barclay (1987)
showed that the premium was not significantly different from one in the United States before
the individual income tax was introduced in the United States in 1913 but was significantly7This simple derivation hides complexities which can arise if the marginal investor considers buying (instead
of selling) just before or after the ex-day. If the resulting capital loss incurred at the ex-day can be offset againstcapital gains, the same premium formula applies. The premium formula would be different, however, if thecapital loss could not be offset or was offset against ordinary income.
8Most dividend payments are small relative to day to day price variation making the drop in price impossibleto detect looking at a single firm price series.
9More precisely, the rates were 15% for taxable individuals who had owned the stock at least one year. Hencewe would observe a premium equal to one if only taxable individuals had been trading.
6

below one in 1962-5 when the tax differential was large. However, Michaely (1991) found no
significant increase in the premium around the Tax Reform Act of 1986, which eliminated the
favorable tax treatment of realized capital gains and thereby raised ρ sharply.10
One limitation of (2), which could explain why it fails to explain observe premia well, is that
it assumes that all agents face the same tax rates. In practice, however, there is substantial
heterogeneity in the tax preferences of shareholders, as pointed out by Michaely (1991). Table
1 reports the overall ex-day tax preference ratio weighted by share of stock ownership in the
US economy. The estimates are based on Poterba (2004) as well as unpublished appendix
series kindly made available to us by James Poterba.11 Long-term individual owners in high
income tax brackets have typically faced a tax preference less than one. The tax ratio was
equal to one briefly after TRA 1986 and again after the 2003 dividend tax cut. All non-taxable
institutions such as pension funds and individual pension accounts (IRAs and 401(k)s), non
profit organizations, government agencies, as well as individuals holding stock for the short-
term have faced a tax ratio equal to 1. In contrast, corporations have typically faced a ratio
above one as only a fraction of dividend income received by a corporation is taxable and
realized capital gains made by a corporation are fully taxable at normal rates.
A number of studies (see e.g., Auerbach, 1983 in the public economics literature or more
recently Michaely and Villa, 1995 in the finance literature) have developed models with het-
erogeneous risk averse investors. Those studies show that equation (2) can be generalized. In
that case, the premium equals the average of the tax ratios weighted by risk tolerance. Kalay
(1982), and Eades, Hess, and Kim (1984) point out that discreteness in prices may cause a bias
in measuring the ex-day price drop relative to the dividend (until recently, the minimum tick
size was one-eighth in the U.S.). This bias may cause the average price drop to be less than
the dividend amount. In principle, these other effects should not eliminate the tax effects, but
rather describe other channels that can potentially affect ex-day premia.10Similarly, Lakonishok and Vermaelen (1983) did not find that the premium moved in the expected direction
following a tax change in Canada. Poterba and Summers (1984), however, did find evidence consistent withthe predicted tax effect in the case of the United Kingdom.
11Poterba (2004) includes only 25% of the statutory realized capital gains tax rate because he wants toestimate the effective burden on accrued capital gains. For the ex-dividend date tax ratio, however, the statutorytax rate on realized capital gains is the relevant one and this is what we use for our analysis of ex-day premiums.
7
2.2 Dividend Increase Announcement-Day Returns and Taxes
Corporations distribute profits to shareholders in two main forms: dividends and share re-
purchases. In a world without taxes and with perfect information, share repurchases and
dividends are equivalent. However, the market appears to treat these two forms of payout
very differently in practice. Reducing or terminating regular dividend payments carry a very
negative signal and are heavily penalized by investors. In contrast, share repurchases (or
one time special dividend payments) are not seen as a commitment to continue paying in the
future, and accordingly announcements of repurchases generate far lower excess returns than
announcements of dividends.
One reason that these two forms of payout may not be equivalent in the current equilibrium
is that their tax treatment differs. Under U.S. tax law, realized capital gains have traditionally
been taxed more lightly than dividend income, making share repurchases a more tax efficient
way of distributing profits. The relative tax disadvantage of dividends relative to capital gains
(repurchases) can be measured using the tax preference parameter constructed by Poterba
(2004). This tax ratio is estimated as the average across all types of shareholders in the US
economy and weighted by ownership of (1− td)/(1− tac) where td is the marginal tax rate on
dividend income and tac is the effective tax rate on capital gains. This effective rate measures
the real tax rate on capital gains on an accrual equivalent basis. It should not be confused
with the actual rate on realized capital gains that we used above. Because of tax deferral (or
no tax at all if capital gains are not realized before death), the effective rate is much lower
than the statutory rate. We denote this deferral-adjusted tax preference parameter by θ and
report its time series in Table 2.
Share repurchases became more common following a SEC ruling in 1982 which clarified the
rules under which corporations could legally make share repurchases without being subject
to dividend taxation (Grullon and Michaely, 2002). Despite the rise in share repurchases,
dividends remain an important conduit for distributing profits. The reason why dividends
have not been entirely replaced by share repurchases has been termed the “dividend puzzle.”
The literature has proposed two main theories to resolve this puzzle: the signalling theory
and the agency theory. Bernheim and Wantz (1995) pointed out that the effect of taxes on
announcement premia could be used to test theories of dividend payment. Allen and Michaely
8

(2003) provide an extensive survey of this literature which we summarize briefly below.
Under the signalling theory (see Bernheim and Wantz for a clear exposition), dividends
serve as a costly signal of a firm’s profits prospects. Firms effectively burn money in the form
of dividend payments (as they incur a higher tax burden than if they repurchased shares) to
signal to the market their profitability. Higher profits firms are able to burn more money and
therefore in equilibrium dividends indeed signal profitability. If the relative tax of dividends
versus realized capital gains increases, it is more costly to pay dividends. Therefore, the market
reaction to dividend increases should be stronger when θ is low.
Under the agency theory (see e.g., Jensen and Meckling, 1976), there is a conflict of interest
between management and stockholders. In that context, dividends can be seen as a device to
prevent managers from spending the earnings of the corporation in inefficient projects (such
as pet projects or empire building). Increasing the dividend tax rate relative to realized
capital gains increases the costs of dividends without affecting benefits. Therefore, the market
should react less favorably to dividend increases when θ is low. Thus the signalling theory
and the agency theory generate opposite predictions on the effect of changing the relative tax
of dividends and capital gains on the excess stock price return around announcement dates of
dividend increases.
Bernheim and Wantz (1995), using US data from 1962 to 1988, show that the market
premium for increasing or initiating dividends is larger when the relative tax rate on dividends
is higher. This result supports the signalling theory. However, Bernhardt, Robertson, and
Farrow (1994) using Canadian data and Grullon and Michaely (2001) using US data around
the Tax Reform Act of 1986 investigated the same issue and found that higher tax rates
were actually associated with lower dividend announcement premiums, supporting the agency
theory. Much of the dispute in both the ex-date and announcement date literatures stems from
the lack of sharp, credible variation in tax rates. In this paper we investigate the broader
time series and examine in detail the 2003 dividend tax cut episode to assess whether robust
results on the effects of taxes can be obtained.
9

3 Data and Methods
We use data from the CRSP, which reports all dividend events (announcements, ex-dividend
date, dividends per share) as well as price series at the daily level since 1962 for all companies
listed on the major U.S. exchanges: NYSE, AMEX, and NASDAQ.12 Specifically, we take
all ordinary dividends paid in U.S. dollars (CRSP distribution codes beginning with 12) on
ordinary common shares (CRSP share codes 10, 11, and 12) trading on either the NYSE,
AMEX, or NASDAQ (CRSP exchange codes 1, 2, and 3). We focus our analysis exclusively
on taxable dividend events (CRSP distribution codes ending in 2) and discard all non taxable
events.13
For our ex-dividend day analysis, we consider all events whose ex-date is between 1963
and 2004 and for which the stock was traded on the ex-dividend day and the business day
preceding the ex-dividend day. We also discard events for which CRSP does not report actual
closing prices for either the ex-day or cum-day. As noted by Elton and Gruber (1970), it is
important to discard events during which there was no trading of the stock because in those
cases, regulations require to adjust the stock price mechanically downward by the full value of
the nominal dividend. This mechanical adjustment would produce a premium equal to one.
In addition, we discard a very small number of events with dividend yields of less than 0.1
percent (roughly 1% of the total sample) or ex-day price changes of more than 80 percent (7
events). The annual number of events in the sample is reported on Table 1, col. (2). Annual
times series are always reported according to payment date, which is the relevant date for tax
purposes.
For each of the 256,360 ex-day events in our sample, we compute the ex-day premium as
the beta-adjusted difference between the cum-day closing price and the ex-day closing price
divided by the nominal dividend payment per share. Specifically, the premium for firm i is:
Premi =P cum
i − P exi /(1 + α̂i + β̂ir
m)Di
,
where rm is the value-weighted return on the CRSP NYSE/AMEX/NASDAQ market index,
and α̂i and β̂i are estimated using a firm level regression of the firm return on the market12The NASDAQ was introduced in 1972.13Non-taxable dividends are very rare, making it difficult to use such dividends as a control. See Eades, Hess
and Kim (1984) for such an attempt.
10

return and a constant over a 91 day window centered on the ex-dividend date.14
Columns (3) to (5) on Table 1 report various annual statistics for the premia: the median,
the weighted (by dividend yield) average, and the trimmed unweighted average (events with
dividend yields less than 0.45 percent, roughly 25% of events, are discarded).15
For our announcement analysis, we consider all regular dividend events (CRSP distribution
codes 1222, 1232, 1242, and 1252) which were higher (in nominal terms) than the previous
regular dividend payment of the same firm. We also include all dividend initiations, defined
as a firm paying a regular dividend payment for the first time over the last 6 quarters. A
firm making its first dividend payment will only be classified as an initiator if the firm existed
in the CRSP database for at least 6 quarters prior to announcing the dividend. We exclude
a dividend event if its periodicity (annual, semi-annual, or quarterly) is different from the
previous payment.Similar to the ex-day analysis, we discard a very small number of events
with change in dividend yield of less than 0.001 percent (less than 1% of the total sample) or
three-day excess returns of more than 80 percent in absolute value (1 event). Col. (3) in Table
2 reports the annual number of such dividend increase events.16
For each of the 38,951 dividend increase announcements in our sample, we compute the
announcement premium as the beta adjusted excess return between the closing price on the
day after announcement and the closing price 2 days before announcement divided by the
nominal change in the dividend payment per share (adjusted for splits). The beta adjustment
is estimated using a firm level regression of the firm return on the market return and a constant
over the 91 days centered on the announcement date. Presumably, a annual dividend increase
of x cents should be equivalent to a quarterly dividend increase of x/4 cents. Therefore, in
order to normalize our estimate of ∆P/∆D to quarterly dividend increases (by far the most
common form of regular dividend payments), we divide the premium by 4 for annual payments,
and by 2 for semi-annual payments.
Columns (4) to (6) on Table 2 report various annual statistics for the dividend announce-14Our premium equation considers P cum as the base price and deflates P ex by the market adjusted return.
Alternatively, we could have considered P ex as the base price and inflate P cum by the market adjusted return.As the time window between the cum and ex-days is very short, these two definitions produce extremely similarresults.
15It is necessary to trim an the un-weighted average because for that series, very small dividend paymentswill drive the results and generate substantial noise in the series.
16Again, announcements are classified in the time series according to payment date, which is the relevant datefor tax purposes.
11

ment ratio: the median, the weighted (by the ratio of the change in the nominal dividend per
share to the closing share price 2 days before announcement) average, trimmed unweighted
averages (in that case dividend events in which the change in the dividend per share divided
by the pre-announcement share price is less than 0.045 percent, roughly the bottom 25%, are
discarded).
For our regression analysis, we merge the CRSP data with the annual Compustat database,
losing some firms because not all firms listed in CRSP are covered by Compustat.
4 Empirical Results for Ex-Dividend Days
4.1 The 2003 tax cut experiment
We start by analyzing the 2003 dividend tax cut. Table 3 shows that the 2003 tax cut increased
the ex-day tax ratio ρ significantly from 0.95 (in 2002) to 1.02 (in 2003 and after). Because
the 2003 tax change was enacted only in late May 2003, there was considerable uncertainty
in the first half of 2003 about the tax rates for dividends and capital gains that would apply
then. Therefore, we compare 2002 and 2004, years for which the tax rates were unambiguously
defined throughout.
Table 3a reports the trimmed mean, median, and dividend weighted mean of the ex-day
premium (∆P/D) in the pre-reform (2002) and post-reform (2004) periods, as well as the
change in these three measures between the two periods.17 All three measures increase from
2002 to 2004, consistent with the tax theory described above. All the increases are statistically
significant at the 5% level. Those standard errors are computed assuming iid errors and in
particular no year specific aggregate shocks.18 However, the magnitudes of the changes are
generally far larger than the change in the premium of 0.07, contradicting the 1-1 response
predicted by the simple Elton-Gruber framework described above.19 To assess the robustness
of these findings from a broader perspective, we now analyze the full 1962-2004 period and
examine whether the behavior of ex-day premia the 2003 tax cut is unusual.17All those premia are regression adjusted for market returns as described in the data section.18Obviously, with only two years of data, it is impossible to estimate standard errors if year specific aggregate
shocks are not assumed away.19In addition, the premium measures are lower than the tax ration ρ in each period.
12

4.2 Time series perspective
Figure 2 displays the time series of the trimmed mean, median, and dividend weighted mean
of the ex-day premium along with the average tax preference ratio ρ. All of these series are
taken directly from Table 1. The three measures of the ex-day premia are relatively close in
levels and highly correlated. The mean/median premium is almost always below 1, consistent
with the original Elton-Gruber prediction. However, there is substantial time variation in the
premium: It declines from 1 to 0.7 in the 1960s, then goes back up to 1 in the 1970s. It then
drops again in the 1980s to 0.7. Since 1990, the ratios have generally remained below 0.8, but
year to year variations are even larger. Most notably, the three premium measures dropped
dramatically from about 0.7 in the mid 1990s to less than 0.4 from 1999 to 2000. The premia
increased consistently from their low in 2000 and quickly returned to 0.8 in 2004.
Parametric Regression Estimates
To assess the relationship between taxes and the premium following methods used in the
existing literature, we run dividend-yield weighted regressions of the following form:
∆Pit
Dit= α + δρ + γXit + εit
where X is a set of covariates. Specifications 1-3 of Table 4 run the regression specification
above restricting the sample to particular years around tax events. The covariate set in
these and all subsequent regressions reported in the Tables is each firm’s lagged (prior year)
cash, assets, liabilities, earnings, and investment, and the level and square of the 10 year U.S.
treasury yield. The main results are very similar when the covariates are dropped or the set
of covariates is changed. The table shows that results are very fragile when one examines
specific “natural experiments” using windows around sharp changes in tax rates. Specification
1 examines the period from 1980-1985. The premium fell significantly from 1980-1985 while ρ
increased, yielding a negative and highly significant estimate of δ in this specification. But as
Michaely (1991) found, specification 2 shows that the premium in 1985-89 is relatively stable
while ρ increases sharply because of TRA86 (note that the levels we estimate are different from
Michaely mainly because of differences in sample), yielding an estimate of zero. Finally, as
discussed above, the ex-day premium increases sharply (and significantly) from 2002 to 2004,
coincident with the 2003 tax cut, which increased ρ by 0.07. This yields a positive estimate
of δ (specification 3). Hence, depending on which short-run tax episode one picks, one can
13

obtain a negative, zero, or positive association between ρ and the ex-day premium.
Moreover, “placebo tests” suggest violations of the identification assumptions that there
are no other short-run trends. For instance, the ex-day premium also rose at a significant rate
from 1999 to 2002, a time when ρ was virtually flat. This suggests that it would not be credible
to attribute the increase in the premium around the 2003 dividend tax cut solely to the tax
change. Hence, our initial results using the 2003 tax cut are not robust when examined in
the context of the longer time series. The changes around the 2003 reform, though large and
significant in short-window regressions, are hardly unusual relative to other non-tax related
time series fluctuations.
Power Analysis
The fragility of these estimates arises fundamentally from the very large aggregate volatility
in the excess returns. This point can be seen with a simple power analysis. First, note that
the standard deviation of the trimmed mean premium in the time series is σ = 0.13. Now
suppose there is a one-time, discrete change in ρ of 10 percentage points, a value larger than
any single tax change in our sample. Assume that the true mean change in ∆P/D caused
by this tax change is 10 percentage points (consistent with the Elton-Gruber model). To see
how much data is needed to detect this effect, note that the standard error interval for the
mean premium over n years is σ√n
= 0.13√n
. If observations are independent across years, the
standard error for the change in the premium with n years each of pre-reform and post-reform
data is se =√
2 σ√n. Note that increasing the sample size within any given year is unlikely to
reduce σ drastically because idiosyncratic firm-level shocks are essentially washed out in the
large samples used for each year (see Table 1). Therefore, the primary way to increase the
precision of the estimates is to increase the number of years in the data.
To detect a change in ∆P/D of 0.1 at conventional significance levels, we would need
an se = 0.05, which would require n = 14 years of pre-reform data and 14 years of post-
reform data! Even if there were a sharp change in ρ and ∆P/D of 20 percentage points
(which equals the change in ρ from 1964-2004), we would need 8 years of data (4 pre and 4
post) to pick up the effect. Given the volatility in the data, one needs both a very large
tax change and also a long pre-reform and post-reform period to have a chance of detecting
even large tax effects.20 Of course, these conditions guarantee precision but not necessarily20The pattern of the time series on Figure 2 suggests that the year to year fluctuations are actually positively
14

consistency. Consistency of estimates using this identification strategy requires that there are
no unobservable contemporaneous trends that may make the average premia in the pre and post
periods differ. Unfortunately, this assumption is quite tenuous when one is comparing premia
over long horizons, especially given the apparently non-tax related aggregate fluctuations and
short-term trends (such as the one from 2000-2004) evident in the data. The power analysis
therefore indicates that the ability to make credible inferences about tax effects is quite limited
using raw data on ex-dividend returns.
Attempted Solutions
One way to try to increase power is to control for other factors that may be contributing
to the aggregate volatility. Intuitively, if one can pin down the factors that are driving the
fluctuations, the residuals after controlling for these factors will be much smoother, permitting
more reliable inferences about tax effects. To investigate this approach, we run a dividend-
weighted regression of the ex-day premium on year dummies, the ten-year nominal interest
rate, and a set of observable variables from Compustat data: cash, assets, liabilities, earnings,
and investment. Figure 3 plots the coefficients on the year dummies in this regression, which
correspond to the ex-day premia adjusting for controls, alongside the raw means shown in
Figure 2. The main lesson is that adding controls hardly affects the pattern of the ex-dividend
day premiums, indicating that the main observables are poor predictors of the aggregate
fluctuations. In addition, the lack of monotonicity in the excess premiums suggests that
it is impossible to explain the evolution of the premium with variables such as reductions
in trading transaction costs, the elimination of discrete pricing rules, or the development of
tax-sophisticated arbitrage techniques.
Given our inability to smooth cross-year fluctuations, we now turn to a slightly different
test that exploits the within-year variation in the size of dividend payments. Specifically, we
examine whether larger dividend payments are associated with larger ex-day returns particu-
larly in years with high ρ. The following dividend-weighted regression is estimated for each
year t:
rit = αt + δtDit
Pit+ γXit + εt
where rit denotes the ex-day excess return (∆P/P ), DitPit
is the dividend yield, and δt is the slope
serially correlated. In that situation, our power calculation is too optimistic and even more years of data wouldbe required to detect an effect.
15

coefficient in year t. We then investigate the link between the estimated {δt} time series and
the time series of ρ graphically (to permit a semi-parametric analysis as above). A tax effect
would imply that δt should be larger when ρt is large because larger dividend payments should
generate especially large (negative) excess returns on the ex-date if the dividend payment is
very valuable to investors, i.e. if dividend taxation is low and ρt is high. Figure 4 shows
the evolution of δt first from a specification without additional controls and then from a
specification that includes the standard control set described above. The δt coefficients are
consistently positive, confirming that larger dividend payments generate larger ex-day price
reductions. However, the δt coefficients also vary tremendously from year to year, suggesting
that this approach will not help in our ultimate goal of raising power so that we can detect
tax effects.
Panel B of Table 4 examines whether regression analysis can uncover significant effects in
this within-year test. This panel reports estimates of the following specification:
rit = α + δ0ρ + δ1Dit
Pit+ δ2ρt
Dit
Pit+ γXit + εit
The key coefficient of interest for this test is the interaction term, δ2. The same five
specifications as in Panel A of Table 4 are repeated and results are insignificant and of varied
signs in all short-window regressions. Given the lack of power suggested by Figure 4, it should
not be surprising that the parametric (linear) regression counterparts to this graph yield little
information.
Finally, we explore whether the pattern of premia becomes smoother when one constructs
the sample of firms differently to control for potential changes in the sample over time. First,
we limit the sample to large firms (ranked by market capitalization), for which trading costs
are lower and whose dividends are perhaps more visible to traders. As show in Figure 5,
Panel A, the resulting series is even noisier than that depicted on Figure 2, and is not any
more closely related to the tax parameter ρ. Second, to control for potential noise from entry
and exit effects, we also estimate average premia for a stable set of firms over time (those alive
since 1990). This series also remains as noisy as the original one (Figure 5, Panel B).
Summary.
A graphical (semi-parametric) analysis of the full time series of ex-day premia helps recon-
cile the various ex-day tax effects estimated using regressions that make parametric assump-
16

tions (e.g., linearity) in the literature. Each of the estimates are significant within the specific
event window analyzed in the study, but are not robust to a broader examination that takes
into account the tremendous aggregate volatility in the premia. This point applies to the
2003 tax cut analyzed above as well. The lack of a robust relationship between taxes and the
ex-day premium in the data should not be interpreted as evidence that taxes are not relevant.
Rather, it reveals that one cannot place a reasonable confidence interval on the size of the tax
effect with the methods employed in the existing literature.
5 Empirical Results for Dividend Announcements
We now investigate the relationship between taxes and excess returns on announcement days.
As the methods and basic conclusions are very similar to those in the ex-day analysis, the
discussion below is much briefer.
5.1 The 2003 tax cut experiment
Table 3, Panel B shows that the 2003 tax cut increased the deferred-capital taxation adjusted
tax preference ratio θ from 0.86 (in 2002) to 0.93 (in 2003 and after). As above, we compare
2002 and 2004, years for which the tax rates were unambiguously defined throughout. Table
3, Panel B, reports the trimmed mean, median, and ∆D-weighted mean of the premium ∆P∆D
associated with a dividend increase of ∆D. All three of these measures decrease from 2002
to 2004. The first decline is statistically significant (at the 5% level) while the last two are
only marginally significant. These results are consistent with Bernheim and Wantz (1994).
They support the signalling theory of dividend payments while rejecting the agency theory.
To assess the robustness of this result, we now analyze this event in the context of the full
1963-2004 sample period.
5.2 Time series perspective
Figure 6 shows the times series of the trimmed mean, median, and weighted mean premium.
It also shows the average tax preference ratio θ taken from Poterba (2004) on a separate (right
hand side) scale. All of these series are taken directly from Table 2. The three measures of the
premia are reasonably similar for most years. They are consistently positive, confirming the
well known result that dividend increase announcements generate a positive market reaction
17
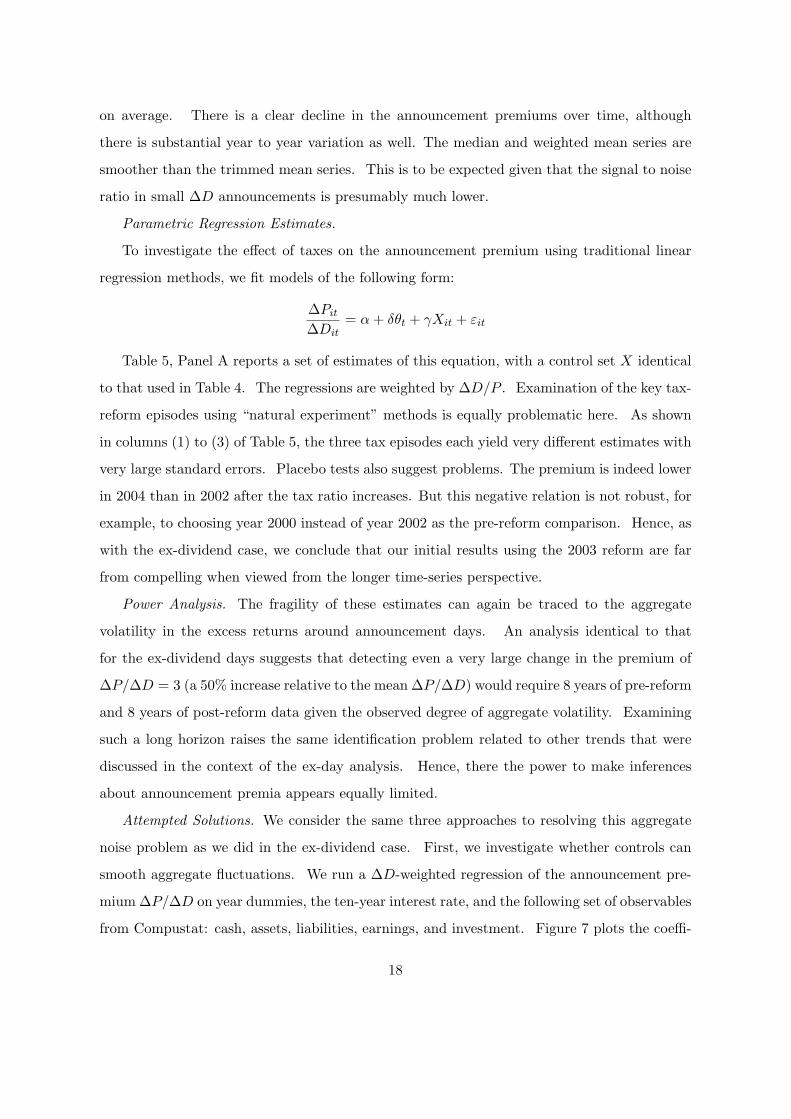
on average. There is a clear decline in the announcement premiums over time, although
there is substantial year to year variation as well. The median and weighted mean series are
smoother than the trimmed mean series. This is to be expected given that the signal to noise
ratio in small ∆D announcements is presumably much lower.
Parametric Regression Estimates.
To investigate the effect of taxes on the announcement premium using traditional linear
regression methods, we fit models of the following form:
∆Pit
∆Dit= α + δθt + γXit + εit
Table 5, Panel A reports a set of estimates of this equation, with a control set X identical
to that used in Table 4. The regressions are weighted by ∆D/P . Examination of the key tax-
reform episodes using “natural experiment” methods is equally problematic here. As shown
in columns (1) to (3) of Table 5, the three tax episodes each yield very different estimates with
very large standard errors. Placebo tests also suggest problems. The premium is indeed lower
in 2004 than in 2002 after the tax ratio increases. But this negative relation is not robust, for
example, to choosing year 2000 instead of year 2002 as the pre-reform comparison. Hence, as
with the ex-dividend case, we conclude that our initial results using the 2003 reform are far
from compelling when viewed from the longer time-series perspective.
Power Analysis. The fragility of these estimates can again be traced to the aggregate
volatility in the excess returns around announcement days. An analysis identical to that
for the ex-dividend days suggests that detecting even a very large change in the premium of
∆P/∆D = 3 (a 50% increase relative to the mean ∆P/∆D) would require 8 years of pre-reform
and 8 years of post-reform data given the observed degree of aggregate volatility. Examining
such a long horizon raises the same identification problem related to other trends that were
discussed in the context of the ex-day analysis. Hence, there the power to make inferences
about announcement premia appears equally limited.
Attempted Solutions. We consider the same three approaches to resolving this aggregate
noise problem as we did in the ex-dividend case. First, we investigate whether controls can
smooth aggregate fluctuations. We run a ∆D-weighted regression of the announcement pre-
mium ∆P/∆D on year dummies, the ten-year interest rate, and the following set of observables
from Compustat: cash, assets, liabilities, earnings, and investment. Figure 7 plots the coeffi-
18

cients on the year dummies in this regression alongside the raw means shown in Figure 2. It
is clear that the addition of controls does little to mitigate the aggregate fluctuations.
Second, we examine whether larger dividend payments are associated with larger announce-
ment returns particularly in years with high or low θt. Specifically, we run the following
∆D/P -weighted regression:
rit = αt + δt∆Dit
Pit+ γXit + εit
where rit denotes the ex-day excess return (∆P/P ), DitPit
is the dividend yield, and δt is the
slope coefficient in year t. We then investigate the link between the estimated {δt} time series
and the time series of θ graphically as in the ex-day analysis. Figure 8 shows the evolution
of δt first from a specification withou additional controls and then from a specification that
includes the standard controls. The δt coefficients are consistently positive, confirming that
larger dividend payments generate larger announcement premia. However, the δt coefficients
also vary tremendously from year to year, suggesting that power is not any greater for this
type of test.
Panel B of Table 5 examines whether regression analysis can uncover significant effects in
this within-year test. This panel reports estimates of the following specification:
rit = α + δ0θ + δ1∆Dit
Pit+ δ2θ
∆Dit
Pit+ γXit + εit
Note that this is precisely the “bang-for-the-buck” specification implemented by Bernheim
and Wantz (1994). The key coefficient of interest for this test is the interaction term, δ2. The
results are insignificant and of varied signs in the short-window regressions that are perhaps
most credible from an identification perspective. Unfortunately, it appears that little is
gained from examining the within-year variation in the size of dividend increase announcements
because of the instability of the relationship over time.
Finally, we explore whether changes in the sample construction affect the smoothness of
the series. The results (not reported) suggest little difference between constant-firm samples
or large-firm samples and the full sample we initially examined.
Summary. Our conclusions for the announcement day tax effects mirror those for the
ex-dividend day analysis. Both time-series and event-study methods yield very unstable
results with wide confidence intervals for the effects of taxation on announcement premia.
19

The problem again is aggregate volatility and the resulting lack of power. Some obvious
attempts to smooth the series fail. The source of the aggregate fluctuations must therefore
be understood before real progress can be made on estimating the tax effects.
6 Conclusion
The original goal of our analysis was to use the sharp change in the tax treatment of dividend
income in 2003 to examine the effect of taxes on dividend announcement and ex-day premia.
The 2003 tax cut is unique in its size and relatively unanticipated nature, and thereby provides
one of the best “natural experiments” to study these issues. Unfortunately, we found that few
robust inferences can be drawn about the effects of taxation on excess returns even using this
large experiment. Analysis of the full time series of excess returns around announcement and
ex-dates reveals a high degree of aggregate volatility that cannot be smoothed using covariates
such as assets or profit rates or by changes in sample construction. Our main conclusions are
therefore methodological:
[1] Existing methods, which generally involve parametric (often linear) regressions and/or
examination of short windows around tax changes, yield unstable and sometimes misleading
results. Looking at the time series from 1962-2004, we found that the results are extremely
sensitive to the window of analysis and the specification used. The contradictory estimates
of prior studies can be explained by the particular event windows and specifications that were
chosen in each study.
[2] Obtaining credible estimates of tax effects requires the use of a long time series of data.
The objective is not to do a time-series analysis, but rather to check whether the changes in
the series around a tax experiment are unusual relative to historical non-tax-related aggregate
fluctuations. Semi-parametric tests showing that changes around a particular reform are very
different from other fluctuations could give the most robust evidence of tax effects.
[3] In the context of ex-day and announcement premia for dividends, the aggregate series
is so volatile that even large tax changes yield very wide confidence intervals on the tax effects.
The statistical power to pick up even large tax effects is limited. Credible estimates of the
effects of dividend taxation on equity returns are likely to remain elusive until we have better
models that explain the non tax-driven fluctuations in the aggregate time series. We view the
20

search for such models as the most promising direction for future research in this area.
Another promising avenue for more research would be to look directly at trading data
(as opposed to only prices, as done here) to uncover the mechanisms of tax arbitrage around
the ex-day dates. Indeed, several studies (see Allen and Michaely, 2003 for a survey) have
started to explore trading volume data around ex-dividend dates. A natural extension of this
work would be to explore whether trading volume, and the nature of traders around ex-days,
correlates with the size of premium over time.
21

References
Allen, Franklin and Roni Michaely, 2003, “Payout Policy,” in Constantinides, George, MiltonHarris and Rene Stulz eds. Handbook of the Economics of Finance (Amsterdam: North-Holland)
Auerbach, Alan, 1983, “Stockholder tax rates and firm attributes,”, Journal of Public Eco-nomics 21(2), 107-127.
Auerbach, Alan, 2003, “Taxation and Corporate Financial Policy,” in Auerbach, Alan andMartin Feldstein eds. Handbook of Public Economics, Volume 3, (Amsterdam: North-Holland)
Auerbach, Alan and Kevin Hassett, 2005, “The Corporate Response to the 2003 Act: Did theOld View or the New View Win Out?,” this volume.
Barclay, Michael (1987), “Dividends, Taxes, and Common Stock Prices: The Ex-Dividend DayBehavior of Common Stock Prices before the Income Tax”, Journal of Financial Economics14, 31-44.
Bernhardt, Dan, J. Fiona Robertson and Ray Farrow, 1994, “Testing Dividend SignalingModels,” Working Paper, Queen’s University.
Bernheim, Douglas and Adam Wantz (1995), “A Tax-Based Test of the Dividend SignallingHypothesis”, American Economic Review 85(3), 532-551.
Blouin, Jennifer, Jana Raedy, and Douglas Shackelford (2004), “The Initial Impact of the 2003Reduction in the Dividend Tax Rate”, University of North-Carolina, Chapel Hill, WorkingPaper.
Chetty, Raj and Emmanuel Saez (2004), “Dividend Taxes and Corporate Behavior: Evidencefrom the 2003 Dividend Tax Cut”, forthcoming Quarterly Journal of Economics, August 2005.
DeAngelo, Harry, Linda DeAngelo, and Doug Skinner, 2000, “Special Dividends and the Evo-lution of Dividend Signaling,” Journal of Financial Economics, pp. 309-354.
Eades, Ken, Pat Hess and Han E. Kim, 1984, “On Interpreting Security Returns During theEx-dividend Period,” Journal of Financial Economics, 13, 3-34.
Elton, Edwin and Martin Gruber (1970), “Marginal Stockholders Tax Rates and the ClienteleEffect,” Review of Economics and Statistics 52, 68-74.
Grullon, Gustavo and Roni Michaely, 2001, “Asymmetric information, agency conflicts andthe impact of taxation on the market reaction to dividend changes,” Working paper, CornellUniversity, Ithaca NY.
Grullon, Gustavo and Roni Michaely, (2002) “Dividends, Share Repurchases, and the Substi-tution Hypothesis”, Journal of Finance, 57(4), 1649-1684.
Jensen, Michael C. and William H. Meckling (1976), “Theory of the Firm: Managerial Behav-ior, Agency Costs and Ownership Structure,” Journal of Financial Economics, 3(4), 305-360.
Kalay, Avner, 1982, “The Ex-dividend Day Behavior of Stock Prices: A Re-examination ofthe Clientele Effect,’ Journal of Finance, 37, 1059-1070.
Lakonishok, J. and T. Vermaelen, (1983), “Tax reform and ex-dividend day behavior” Journalof Finance 38(4), 1157–1179.
22

Michaely, Roni (1991) “Ex-Dividend Day Stock Price Behavior: The Case of the 1986 TaxReform Act”, Journal of Finance, 46(3), 845-859.
Michaely, Roni and Jean-Luc Vila (1995), “Investors’ Heterogeneity, Prices and Volume Aroundthe Ex-Dividend Day,” Journal of Financial and Quantitative Analysis 30, 171-198.
Perez-Gonzalez, Francisco, 2003, “Large shareholders and dividends: Evidence from U.S. taxreforms”, Working paper, Columbia University.
Poterba, James, 2004, “Corporate Payout Policy”, American Economic Review, 94(2), 171-175.
Poterba, James and Lawrence Summers, 1984 “New Evidence that Taxes Affect the Valuationof Dividends”, Journal of Finance 39, 1397-1415.
Poterba, James and Lawrence Summers, 1985 “The Economic Effects of Dividend Taxation”, inE. Altman and M. Subrahmanyam, eds., Recent Advances in Corporation Finance (Homewood,IL: Dow Jones-Irwin), 227-284.
23

Announcementwindow
Ex-div.date
Paymentdate
2526
2728
2930
31S
hare
pric
e
7/1 9/1 11/1 12/31
Microsoft Dividend Announcement and Ex-Day Price EffectsFigure 1
The Figure reports the daily closing prices of Microsoft shares from 7/1/2005 to 12/31/2005from CRSP data. On July 20, Microsoft announced a doubling of its regular dividend paymentsas well as the payment of a very large one time special dividend of $3 per share. The threeday window around the announcement date, which is used to estimate abnormal returns, isdepicted by the first two vertical lines. The ex-day for the $3 special dividend in November 15.The drop in price from the cum-day (November 14) to the ex-day (November 15), is depictedby the next two vertical lines. The payment date, December 2, is also depicted by a dashedline.
1

.2.4
.6.8
11.
2
1960 1970 1980 1990 2000
Mean (trimmed) MedianWeighted mean Ex-day tax preference (rho)
Ex-Dividend Day Premium and Tax Ratio, 1963-2004Figure 2
This figure depicts the tax preference ratio ρ = (1−td)/(1−tc)measuring the tax preferenceof realized capital gains over dividends for US corporate stock (weighted by ownership) from1963 to 2004. The figure also depicts three annual time series measures of the (market adjusted)dividend premium ∆P/D for all taxable regular and special dividend payments from 1963 to2004: 1) the mean (trimmed for the smallest 25% dividend yield events), 2) the dividend-yieldweighted mean, 3) and the median. All four time series are displayed on Table 1.
2

.2.4
.6.8
11.
2
1960 1970 1980 1990 2000
No controls With controlsEx-day tax preference (rho)
Ex-Dividend Day Premium, with and without controls, 1963-2004Figure 3
This figure depicts the ex-dividend tax preference ratio ρ. The figure also depicts thedividend-yield weighted mean of the premium (as in Figure 2) along with dividend-yieldweighted mean of the premium controlling for the ten-year nominal interest rate and observ-able firm-level variables (cash, assets, liabilities, earnings, and investment) from Compustat.The latter series is obtained from a regression of the adjusted premium on a full set of yeardummies and the control variables.
3

.8.8
5.9
.95
1E
x-da
y ta
x pr
efer
ence
(rho
)
.4.6
.81
1.2
1.4
1960 1970 1980 1990 2000
With controls Ex-day tax preference (rho)
Ex-Dividend Day Premium Slopes, with controls, 1963-2004Figure 4
This figure depicts the ex-dividend day tax preference ratio ρ (on the right sca,e). Thefigure also depicts the year dummy coefficients interacted with the dividend yield D/P ofregression equation (X) in the text (with controls): the (adjusted) excess return around theex-day is regressed on a full set of year dummies and year dummies interacted with the dividendyield D/P . The additional control variables (for the second series) are the same as in Figure3.
4

.2.4
.6.8
11.
2
1960 1970 1980 1990 2000
Mean (trimmed) MedianWeighted mean Ex-day tax preference (rho)
A. Largest 1,000 Firms by YearFigure 5
.5.6
.7.8
.91
1990 1995 2000 2005
Mean (trimmed) MedianWeighted Mean Ex-day tax preference (rho)
B. Consistent Sample of Firms, 1990-2004
This figure depicts the tax preference ratio ρ and the three annual time series measures ofthe (market adjusted) dividend premium ∆P/D (mean trimmed, weighted mean, and median)as in Figure 2 for alternative samples. In Panel A, the sample is restricted to the largest 1,000firms (ranked by market capitalization) in each year. In Panel B, the sample consists in thepanel data of all firms present in the CRSP data in every year from 1990 to 2004. The numberof such firms is 1,402.
5

.7.8
.91
Pot
erba
tax
pref
eren
ce (t
heta
)
05
1015
1960 1970 1980 1990 2000
Mean (trimmed) MedianWeighted mean Poterba tax preference (theta)
Dividend Increase Announcement Premium and Tax Ratio, 1963-2004Figure 6
This figure depicts (on the right hand scale) the tax preference ratio θ = (1− td)/(1− tac)from Poterba (2004) which measures the tax preference of accrued capital gains over dividendsfor US corporate stock (weighted by ownership) from 1963 to 2004. The figure also depictsthree annual time series measures of the (market adjusted) dividend increase premium∆P/∆Dfor all regular dividend increases and initiations from 1963 to 2004: 1) the mean (trimmedfor the smallest 25% dividend increase to price ratio events), 2) the weighted mean (weight is∆D/P ), and 3) the median. All four time series are displayed on Table 2.
6

.7.8
.91
Pot
erba
tax
pref
eren
ce (t
heta
)
05
1015
1960 1970 1980 1990 2000
No controls With controlsPoterba tax preference (theta)
Dividend Increase Announcement Premium, with and without controls, 1963-2004Figure 7
This figure depicts the Poterba (2004) tax preference ratio θ (on the right hand scale). Thefigure also depicts the weighted mean of the announcement premium (as in Figure 6) alongwith weighted mean of the announcement premium controlling for the ten-year nominal interestrate and observable firm-level variables (cash, assets, liabilities, earnings, and investment) fromCompustat. The latter series is obtained from a regression of the adjusted premium on a fullset of year dummies and the control variables.
7

.7.8
.91
Pot
erba
tax
pref
eren
ce (t
heta
)
-50
510
1960 1970 1980 1990 2000
With controls Poterba tax preference (theta)
Bang-for-the-Buck for Announcement Premium, with controls, 1963-2004Figure 8
This figure depicts the Poterba (2004) tax preference ratio θ (on the right hand scale).The figure also depicts the year dummy coefficients interacted with the dividend yield increase∆D/P of regression equation (X) in the text (with controls): the (adjusted) excess returnaround the announcement date is regressed on a full set of year dummies and year dummiesinteracted with the change in dividend yield ∆D/P . The additional control variables (for thesecond series) are the same as in Figure 7.
8

(1) (2) (3) (4) (5)Tax-Preference Median Weighted Mean Trimmed Mean
(ρ ) # Events Premium Premium Premium
1963 0.80 4,089 0.95 0.95 0.951964 0.81 4,418 0.95 0.98 0.971965 0.81 4,767 0.91 0.89 0.851966 0.82 5,029 0.89 0.95 0.901967 0.82 5,259 0.85 0.81 0.841968 0.80 4,697 0.88 0.74 0.691969 0.81 5,074 0.74 0.71 0.671970 0.82 4,910 0.71 0.69 0.661971 0.84 4,851 0.81 0.78 0.761972 0.83 4,974 0.85 0.81 0.851973 0.84 5,232 0.84 0.90 0.901974 0.85 5,317 0.87 0.89 0.891975 0.86 5,451 0.96 0.93 0.911976 0.83 5,782 0.97 0.97 0.981977 0.84 6,234 1.02 1.03 1.021978 0.84 6,347 1.03 1.05 1.081979 0.84 6,034 1.00 0.97 0.961980 0.84 6,035 1.05 0.99 0.991981 0.86 5,712 0.94 0.89 0.881982 0.90 5,239 0.85 0.84 0.821983 0.91 5,404 0.83 0.80 0.761984 0.91 5,977 0.76 0.76 0.751985 0.92 6,813 0.67 0.67 0.641986 0.92 7,345 0.79 0.80 0.701987 1.00 7,498 0.83 0.83 0.751988 1.02 7,432 0.81 0.76 0.671989 1.02 7,334 0.76 0.77 0.691990 1.01 6,882 0.75 0.69 0.671991 1.01 6,484 0.88 0.80 0.791992 1.01 6,807 0.80 0.80 0.791993 0.99 7,231 0.87 0.85 0.761994 0.99 7,594 0.83 0.81 0.761995 0.99 8,030 0.69 0.61 0.561996 0.99 8,022 0.74 0.67 0.611997 0.96 7,764 0.68 0.63 0.621998 0.93 6,984 0.66 0.56 0.551999 0.93 7,190 0.70 0.61 0.642000 0.94 6,058 0.46 0.39 0.322001 0.95 5,661 0.47 0.43 0.392002 0.95 5,905 0.61 0.60 0.452003 1.02 6,147 0.69 0.64 0.572004 1.02 6,347 0.74 0.81 0.77
Std Dev 0.08 0.14 0.15 0.17
Total 0.90 256,360 0.81 0.79 0.76
Column (1) reports the tax preference ratio ρ = (1-td)/(1-tc) measuring the tax preference of realized capital gains overdividends for US corporate stock (weighted by ownership) from 1963 to 2004. This ratio is constructed based on the data appendix from Poterba (2004).Column (2) reports the annual number of ex-dividend day in the sample for all taxable regular and special dividends.Columns (3) to (5) report the corresponding time series measures of the (market adjusted) dividend premium ∆P/D. Column (3)reports the median. Column (4) reports the dividend-yield weighted mean. Column (5) reports the mean (trimmed for the smallest 25%dividend yield events).
Table 1Ex-Dividend Day Statistics and Results

(1) (2) (3) (4) (5)Tax-Preference Median Weighted Mean Trimmed Mean
(θ ) # Events Premium Premium Premium
1963 0.68 307 6.05 7.59 6.781964 0.69 531 5.78 5.45 7.471965 0.70 679 6.18 5.83 8.261966 0.71 667 8.31 8.98 11.001967 0.71 490 7.25 8.07 11.251968 0.68 390 6.80 8.11 10.781969 0.70 368 11.71 10.65 15.931970 0.72 293 10.48 7.37 9.041971 0.74 245 5.36 5.95 8.401972 0.74 491 11.84 10.73 13.821973 0.74 1,119 3.98 6.13 9.531974 0.75 932 5.91 7.07 10.511975 0.76 707 5.18 6.43 9.801976 0.73 1,264 6.98 7.53 9.441977 0.74 1,397 6.83 7.21 8.131978 0.74 1,388 6.14 6.68 7.541979 0.73 1,270 5.98 7.27 7.031980 0.73 1,077 5.40 6.17 5.511981 0.75 902 5.57 6.70 7.941982 0.80 645 4.70 7.09 6.511983 0.81 707 6.89 9.61 13.011984 0.82 868 4.24 4.28 5.921985 0.82 1,045 3.16 3.65 4.361986 0.83 1,066 1.64 2.46 8.531987 0.86 1,099 4.17 6.12 7.581988 0.87 1,261 3.83 4.41 6.691989 0.87 1,311 2.06 3.68 4.831990 0.88 1,047 4.61 5.44 7.521991 0.87 825 4.68 6.13 6.991992 0.87 963 4.35 6.56 9.941993 0.86 1,139 5.61 8.10 11.131994 0.86 1,230 3.63 4.75 6.521995 0.86 1,371 3.25 4.23 7.851996 0.86 1,342 5.20 7.82 6.691997 0.85 1,267 5.09 8.91 10.281998 0.84 1,123 2.40 4.45 8.811999 0.83 1,092 1.65 2.08 7.422000 0.85 939 2.35 5.08 8.192001 0.85 801 4.46 5.24 9.362002 0.86 878 8.53 9.46 12.072003 0.93 1,222 4.06 5.04 4.892004 0.93 1,193 4.37 5.63 6.52
Std Dev 0.07 2.34 1.99 2.46
Total 0.80 38,951 5.40 6.43 8.57
Column (1) reports the tax preference ratio θ = (1-td)/(1-tc) measuring the tax preference of accrued capital gains overdividends for US corporate stock (weighted by ownership) from 1963 to 2004. This ratio is from Poterba (2004).Column (2) reports the annual number of regular taxable dividend nominal increases or initiations in the sample.Columns (3) to (5) report the corresponding time series measures of the (market adjusted) dividend increase premium ∆P/∆D. Column (3) reports the median. Column (4) reports the weighted mean (weight is ∆D/P). Column (5) reports the mean (trimmed for the smallest 25% dividend increase to price ratio events).
Dividend Increase Announcements Statistics and ResultsTable 2

(1) (2) (3)Pre-reform Post-reform Change
Ex-day Tax Preference 0.95 1.02 0.07Ratio (ρ )
Median Premium 0.61 0.74 0.13(0.04) (0.03) (0.05)
Weighted Mean Premium 0.60 0.81 0.20(0.06) (0.05) (0.08)
Trimmed Mean Premium 0.45 0.77 0.32(0.06) (0.05) (0.08)
Notes: Pre-reform refers to dividend paid out in 2002 while post reform refers to dividends paidout in 2004. The standard errors in column (3) are estimated from a median, weighted OLS, and simple OLS regressions respectively.
(1) (2) (3)Pre-reform Post-reform Change
Poterba Tax Preference 0.86 0.93 0.07Ratio (θ )
Median Premium 8.53 4.37 -4.16(1.83) (1.11) (2.01)
Weighted Mean Premium 9.46 5.63 -3.83(2.37) (1.29) (2.56)
Trimmed Mean Premium 12.07 6.52 -5.54(2.94) (1.76) (3.22)
Notes: Pre-reform refers to dividend paid out in 2002 while post reform refers to dividends paidout in 2004. The standard errors in column (3) are estimated from a median, weighted OLS, and simple OLS regressions respectively.
2003 Tax Episode Analysis: Ex-dividend Day PremiaTable 3a
Table 3b2003 Tax Episode Analysis: Dividend Increase Announcements

(1) (2) (3)
1980-1985 1985-1989 2000-2004
Tax Preference (ρ ) -2.742 0.666 1.323(0.550) (0.611) (1.477)
R-squared 0.001 0.001 0.001
Notes: All regressions are weighted by dividend yield. Interest rate controls include the level and square of the ten-year U.S. Treasury yield. Firm controls include lagged levels of cash, assets, liabilities, earnings, and investment.
(1) (2) (3)
1980-1985 1985-1989 2000-2004
Tax Preference (ρ ) 0.006 -0.001 0.006(0.009) (0.005) (0.009)
Dividend Yield 3.627 0.382 0.454(0.619) (0.432) (0.453)
Dividend Yield * ρ -3.097 0.578 0.460(0.703) (0.437) (0.461)
R-squared 0.064 0.317 0.346
Notes: Interest rate controls include the level and square of the ten-year U.S. Treasury yield. Firm controlsinclude lagged levels of cash, assets, liabilities, earnings, and investment.
Table 4aEx-Dividend Day Regression Results: Dependent Variable = ∆P/D
Table 4bEx-Dividend Day Regression Results: Dependent Variable = ∆P/P

(1) (2) (3)
1980-1985 1985-1989 2000-2004
Tax Preference (θ ) -16.954 36.993 -61.576(14.515) (27.106) (51.408)
R-squared 0.001 0.003 0.002
Notes: All regressions are weighted by the change in the nominal dividend amount divided by the pre-announcement share price. Interest rate controls include the level and square of the ten-year U.S. Treasuryyield. Firm controls include lagged levels of cash, assets, liabilities, earnings, and investment.
(1) (2) (3)
1980-1985 1985-1989 2000-2004
Tax Preference (θ ) 0.002 -0.081 -0.050(0.022) (0.037) (0.046)
∆Dividend Yield 26.231 -31.405 3.225(6.565) (8.052) (10.557)
∆Dividend Yield * θ -30.754 37.631 -2.376(8.277) (9.529) (11.712)
R-squared 0.020 0.008 0.032
Notes: Interest rate controls include the level and square of the ten-year U.S. Treasury yield. Firm controlsinclude lagged levels of cash, assets, liabilities, earnings, and investment.
Table 5aDividend Increase Announcements Regression Results: Dependent Variable = ∆P/∆D
Table 5bDividend Increase Announcements Regression Results: Dependent Variable = ∆P/P