nbk capital-emaar initiation-04july2011 · our views on the dubai real estate market are globally...
TRANSCRIPT

July 04, 2011
nbkcapi ta l .com
EMAARValue, but not much else
kEy dAtA
Fair Value per Share (AED) 3.67 Closing Price (AED) * 3.13 52-week High/Low (AED) 4.04/ 2.35YTD/12-month Return -11.83% / +4.84%Trailing P/E 7.79 Market Cap (AED Millions) 19,066 Shares Outstanding (Millions) 6,091 Free Float 69%Reuters/Bloomberg EMAR.DU / EMAAR UH
*Price close as of July 03, 2011. Sources: Bloomberg and NBK Capital
kEy MEtRics
2010A 2011F 2012F 2013FEPS 0.40 0.19 0.19 0.15EPS Growth n.s -53% 0% -20%P/E 7.8 16.4 16.5 20.7 Dividend Yield 3.2% 3.2% 3.2% 3.2%EV/EBITDA 8.40 8.79 9.31 12.39
Revenue (Millions) 12,150 7,768 8,335 4,515 Revenue Growth 44% -36% 7% -46%
EBITDA (Millions) 3,804 2,867 2,706 2,033 EBITDA Growth 24% -25% -6% -25%EBITDA Margin 31.3% 36.9% 32.5% 45.0%
Sources: Company and NBK Capital
quARtERly foREcAsts
AED Millions 2Q2010A 1Q2011A 2Q2011F 3Q2011FRevenue 2,652 1,983 1,920 1,910 Gross profit 1,124 1,024 941 898 Attr. Net profit 802 421 151 234
Sources: Company financial statements and NBK Capital
REbAsEd PERfoRMAncE
2
2.5
3
3.5
4
4.5
Jul-10 Oct-10 Jan-11 Apr-11 Jul-11
Emaar MSCI UAE
Sources: Reuters and NBK Capital
HigHligHts
12-Month fair Value: AEd 3.67
Recommendation: Accumulate-Risk level: 4**
Reason for Report: initiation of coverage
• Our fair value for Emaar comes out at AED 3.67 per share, resulting in an upside for the stock of 17%. Our calculation rests entirely on our sum of the parts (SOTP) of discounted cash flow (DCF) of existing projects, as we feel comparative valuation have no merits, and there is not enough visibility for a net asset value (NAV)-based approach. Our assumptions are very conservative on the development side, as we have valued only those developments currently under construction. This is due to a lack of visibility as to the timing and pricing of future developments. As a result of this, the bulk (73%) of our valuation is derived from Emaar’s recurring revenue-generating assets. In addition, our estimates post FY2013 reflect only recurring revenues. Whilst we realize this approach is penalizing, we feel there is not enough visibility to model differently.
• Emaar’s strengths are its success in retail and hospitality, its diversified portfolio and strong track record, all of which can and will be replicated outside Dubai. Main weaknesses are its lack of transparency, a track record of strategic mishaps, and uninspiring news flow.
• We have an overall negative view of the Dubai real estate market, particularly for commercial and residential real estate. We are more positive on hospitality and, particularly, retail. This will prove supportive for Emaar given the profile of the company’s current Dubai exposure.
• Our “Accumulate” recommendation rests on a valuation case only. We do not see any short- or medium-term price triggers to help strongly release this value. In fact, we expect the news flow to remain uninspiring, with issues of political instability, strategic reviews and write-offs potentially limiting the appreciation potential.
** Please refer to page 37 for recommendations and risk ratings.
Analyst
Loic Pelichet
T.+971 4365 2818E. [email protected]

contEnts
ExEcutiVE suMMARy ............................................................................ 3
VAluAtion .............................................................................................. 5
Why we are not using multiple-based valuations. ...................................... 5
SOTP-DCF calculation ............................................................................ 6
EstiMAtEs ............................................................................................. 12
Emaar 1Q2011 results .......................................................................... 12
Estimates for FY2011 and beyond ....................................................... 12
bulls And bEARs ................................................................................ 14
Bulls ..................................................................................................... 14
Bears ................................................................................................... 15
dubAi REAl EstAtE MARkEt oVERViEw .......................................... 17
The Dubai residential market ................................................................ 18
Dubai commercial real estate market .................................................... 22
The hospitality market .......................................................................... 26
The retail market .................................................................................. 28
coMPAny dEscRiPtion ....................................................................... 30
The four phases of Emaar .................................................................... 30
Emaar’s current projects ....................................................................... 31
Strategic review ................................................................................... 35
finAnciAl stAtEMEnts ..................................................................... 36

Real Estate & Construction – EmaarJuly 04, 2011
nbkcapi ta l .com | 3
ExEcutiVE suMMARy
Our 12-month fair value for Emaar stands at AED 3.67 per share. This fair value is entirely derived from our sum of the parts (SOTP) of the DCF valuations of the company’s projects and activities. We have not used comparative valuations, as different business models and development stages make these irrelevant in our view. In addition, we have included Emaar’s NAV calculation for reference only, given the lack of visibility over the methodology and assumptions used by the independent valuers.
The conservatism underpinning our valuation is a direct function of the lack of visibility we have on Emaar’s development activities, particularly outside Dubai. As such, for both Dubai and international developments, we have modeled only the phases currently under construction, as we have little visibility as to the timing and pricing of future phases. Equally, we have modeled only Emaar’s existing hospitality and retail portfolios. This results in a valuation heavily slanted toward the recurring revenue-generating activities (which account for 73% of our valuation). Whilst we recognize this is very penalizing, we feel the lack of visibility gives us little choice. Equally, this results in our estimates post FY2013 being based on hospitality and retail only. As we get more visibility on future developments, both our estimates and valuation are bound to increase.
In our view, Emaar’s strengths are mainly
• A very strong and successful base of recurring revenue-generating assets, which provide increased visibility and a strong base for the share price. The success of Emaar’s forays into retail and hospitality is undoubted and will, in our view, continue;
• The ability and willingness to replicate this success outside Dubai, which should provide considerable valuation leverage once those projects are firmly in place;
• A strong management track record, having adapted the firm’s strategy to its growing maturity over the years. It should be noted also that Emaar never lost money in Dubai, even at the worst points of the city’s real estate crisis;
• A diversified geographical portfolio, unique amongst MENA developers, which tend to be one-country plays. This is particularly important in the context of the maturing of Emaar’s home base of Dubai. Although the lack of visibility means international development accounts for a minute part of our valuation, Emaar’s track record in Dubai shows there is potential for considerable value creation there.
Emaar’s main weak points are
• First and foremost, a lack of disclosure, which in our view precludes the stock from achieving its full value potential. Emaar has consistently traded below its calculated NAV, and more recently below its stated book value, despite the fact that the company has an excellent execution track record and never lost money on its developments (save for its misjudged foray in the USA). Again, this is reflected in our own valuation of the company.
• Emaar is prone to strategy and communication mishaps, with a track record littered with such events (Bawadi land, JL Homes, potential merger with Dubai Properties, and now financial subsidiaries). This constant trickle of negative (though often, it has to be said, not very material) news flow contributes, in our view, to the negative sentiment on the share. Unfortunately, this is bound to continue in the short term.
• Regional uncertainty is taking its toll on the company’s international activities.
• The firm’s strategic review of its international options has created further short-term uncertainty, although this may in the longer run result in increased visibility.
Our views on the Dubai real estate market are globally negative. Commercial real estate stands out as the segment with the weakest outlook, with huge vacancies compounded by continuing addition to capacity. We feel the residential market has yet to reach its nadir, although the rate of decline should slow. We have a more sanguine view on hospitality and particularly retail. As Emaar

Real Estate & Construction – EmaarJuly 04, 2011
nbkcapi ta l .com | 4
has essentially completed its development work in Dubai, we feel the latter two sectors are more important when assessing the stock’s potential.
Our “Accumulate” recommendation on Emaar is based entirely on valuation issues. The current share price can be justified entirely by the value of Emaar’s hospitality and retail businesses, thereby assuming no value whatsoever for the firm’s development activities, which we feel is much too harsh. However, there are not, in our view, many triggers to release value at this point. We expect the news flow for FY2011 to remain broadly unhelpful, with international political issues, Emaar’s on-going strategic review and possible write-offs of financial associates periodically weighing on the stock price.

Real Estate & Construction – EmaarJuly 04, 2011
nbkcapi ta l .com | 5
VAluAtion
Our valuation of Emaar relies entirely on the DCF method. We have valued each project individually, according to the expected cash flows generated. In our view, multiple-based valuations, be they comparative or absolute, make little sense for real estate developers.
why we are not using multiple-based valuations
Comparative multiple-based valuations (e.g. EV/EBITDA, PE) make little sense for real estate developers, given
• The difference in business models: some developers will be more geared toward developing recurring income streams (e.g. Emaar), whilst others will primarily geared toward selling full developments (e.g. Aldar), resulting in significant differentials in margins, earnings visibility and relative financial positions (e.g. full developments tend to be self-financing in the region, but carry a much bigger execution risk);
• Underlying market dynamics vary enormously (thus, for instance, it would make little sense to compare an Egyptian developer to a United Arab Emirates [UAE] one, or a developer focused on a single market, like Sorouh in Abu Dhabi, with an internationally diversified developer like Emaar);
• Real estate development is by essence a bulky business, with revenues and therefore earnings varying significantly from one year to the next, based on the actual delivery of developments.
A P/NAV approach makes little more sense. Most UAE players do publish a NAV calculation; however, this has very little practical value as
• Not all developers choose to have the same assets re-valued. For instance, Sorouh’s NAV revalues only the company’s undeveloped land bank, whilst Emaar’s published NAV includes a revaluation of all its development, investment properties and selected associates;
• More importantly, these NAV calculations are based on independent valuations made by property brokers (CBRE and unspecified others in Emaar’s case). The methodology and assumptions underpinning these valuations are never actually published. Moreover, as different companies use different brokers for their NAV calculation, there is no way to ascertain if the methodology and assumptions used are coherent or similar.
Emaar’s NAV calculation is as follows.
Figure 1 Emaar NAV
Emaar NAV 2011 Book value NAV
Cash and bank balances 5,042 5,042Trade and other receivables 3,757 3,757Development properties 26,492 45,543Investment properties 8,110 13,265Associates 7,592 7,237Securities and loans to associates 2,926 2,926Fixed assets 8,539 9,658Goodwill 46 46Total assets 62,504 87,474Total liabilities -31,435 -33,099
Net Asset Value 31,069 54,375Per share 5.1 8.9
Sources: Emaar and NBK Capital Research
NAV calculation for
reference only, as underlying
assumptions are not disclosed
Differing business models
and market dynamics make
comparative valuations useless
Real Estate & Construction – EmaarJuly 04, 2011
nbkcapi ta l .com | 6
We stress again that we have included this calculation for reference only. We have not taken any account of it in our final absolute valuation of Emaar, as we have no visibility whatsoever as to the underlying assumptions used by the property brokers who have calculated this NAV. For this reason, as well as to account for the differences in the methodology used by different developers, we are also not using this NAV calculation for comparative valuation purposes.
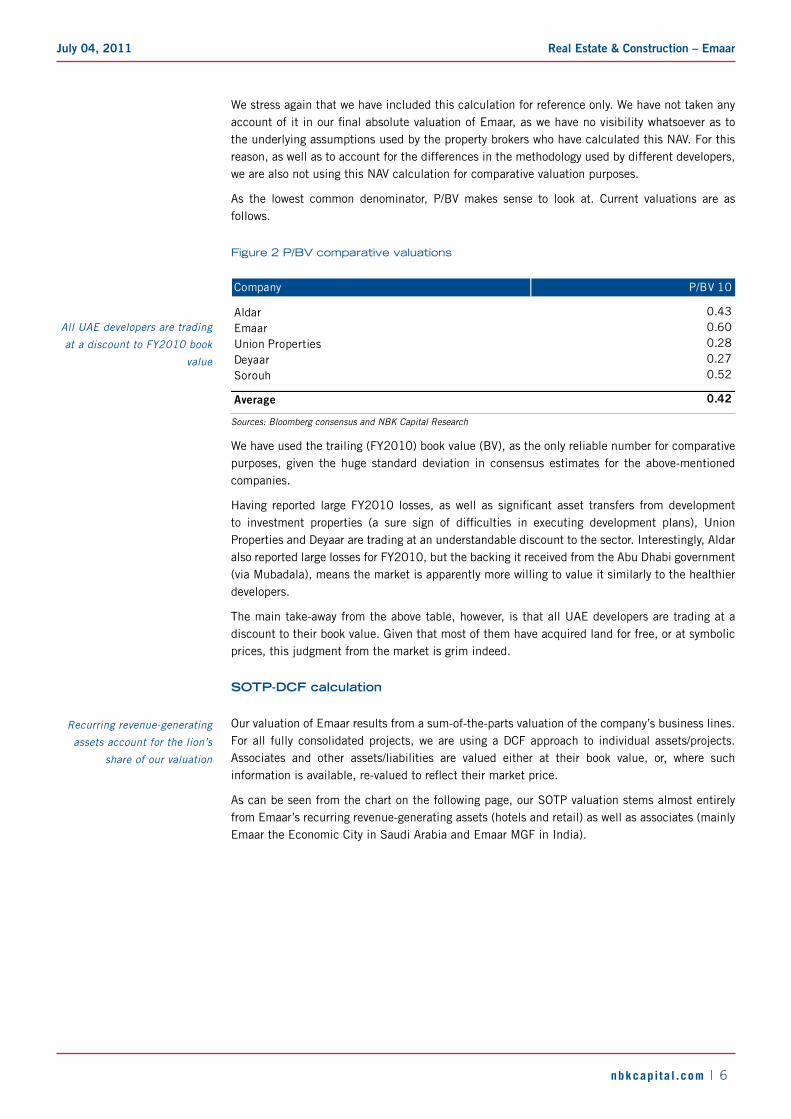
As the lowest common denominator, P/BV makes sense to look at. Current valuations are as follows.
Figure 2 P/BV comparative valuations
Company P/BV 10
Aldar 0.43Emaar 0.60Union Properties 0.28Deyaar 0.27Sorouh 0.52
Average 0.42
Sources: Bloomberg consensus and NBK Capital Research
We have used the trailing (FY2010) book value (BV), as the only reliable number for comparative purposes, given the huge standard deviation in consensus estimates for the above-mentioned companies.
Having reported large FY2010 losses, as well as significant asset transfers from development to investment properties (a sure sign of difficulties in executing development plans), Union Properties and Deyaar are trading at an understandable discount to the sector. Interestingly, Aldar also reported large losses for FY2010, but the backing it received from the Abu Dhabi government (via Mubadala), means the market is apparently more willing to value it similarly to the healthier developers.
The main take-away from the above table, however, is that all UAE developers are trading at a discount to their book value. Given that most of them have acquired land for free, or at symbolic prices, this judgment from the market is grim indeed.
sotP-dcf calculation
Our valuation of Emaar results from a sum-of-the-parts valuation of the company’s business lines. For all fully consolidated projects, we are using a DCF approach to individual assets/projects. Associates and other assets/liabilities are valued either at their book value, or, where such information is available, re-valued to reflect their market price.
As can be seen from the chart on the following page, our SOTP valuation stems almost entirely from Emaar’s recurring revenue-generating assets (hotels and retail) as well as associates (mainly Emaar the Economic City in Saudi Arabia and Emaar MGF in India).
Recurring revenue-generating
assets account for the lion’s
share of our valuation
All UAE developers are trading
at a discount to FY2010 book
value

Real Estate & Construction – EmaarJuly 04, 2011
nbkcapi ta l .com | 7
Figure 3 Breakdown of Emaar SOTP valuation
15%
58%
2%2%
23%
Hotels Retail Development Dubai International Associates
Source: NBK Capital Research
This is mostly the result of the very poor visibility we have currently on the property development side, particularly outside Dubai. It should however also be recognized that Emaar’s stated strategy is to enhance its recurring revenues, and this is rightly reflected in its valuation. However, we would stress the following:
• Dubai developments make up a very limited share of our SOTP, mainly due to the fact that Emaar is almost finished with its Dubai developments and we have taken a very conservative view of the remaining potential developments in the UAE;
• On the international front, the company’s very limited disclosure about exact timing, pricing and cash flows of developments means we have chosen to model only those developments currently being built. This means we have modeled only 3,495 units in total. A further 10,000 units are slated for development by FY2013 (these figures exclude developments at associates, namely Emaar MGF in India, Emaar the Economic City in Saudi Arabia and Emaar Dead Sea in Jordan), and a further sizeable number of units should be developed between FY2013 and FY2020. The general outline of these projects has been announced; however, given the lack of specific information as to their timing, cost and expected pricing/cash flow, we cannot at this stage perform a meaningful analysis of their valuation. We will, of course, be adding those future phases/projects as we get more clarity on them. We acknowledge, thus, that our valuation is very conservative, and potentially contains considerable upside. However, given the lack of visibility, we would rather err on the side of caution.
Our valuation is not actually wildly different from Emaar’s independently made NAV calculation, at least as far as the recurring revenue-generating assets are concerned. We are valuing the retail assets slightly higher than Emaar’s valuators, and the hotel assets slightly lower (no doubt due to our penalizing assumptions on the Armani Hotel, itself due to lack of visibility; please see below). Where we differ strongly is on the development properties assets, unsurprisingly.
We have used an average weighted average cost of capital (WACC) of 12.2%, which reflects our target debt-to-equity ratio for Emaar of 15% and our risk-weighted WACC for each business segment.
Our valuation of hotels and
retail is close to Emaar’s NAV
valuation
This is due to poor visibility on
the development side

Real Estate & Construction – EmaarJuly 04, 2011
nbkcapi ta l .com | 8
Hotels
We have valued each hotel individually, using specific revenue per available room (RevPAR), food and beverage (F&B), and operating costs assumptions.
• For occupancy rates, we have set most hotels at between 70% and 80% in the long run. Although this may appear very low given the 87% occupancy rate observed in 1Q 2011, this explained by
� Current occupancy rates are in our view flattered by the surge in tourism in Dubai due to regional instability. Regional tourism is being re-routed to Dubai, particularly from Bahrain and Egypt. We conservatively take the view that this will prove temporary;
� Occupancy rates are always lower in the summer season, due to the very high temperatures. This is particularly true of city hotels (beach hotels tend to do better in the heat). Emaar has built only city hotels;
� Six of Emaar’s eight current hotels (excluding the Nuran serviced apartments) are within a half-a-mile radius around Dubai Mall in Downtown Burj Khalifah. All are currently benefiting from the novelty effect of Dubai Mall and the neighborhood, but we feel there is a genuine risk of cannibalization of the weaker hotels by the stronger ones, once the dust of novelty settles.
� For this reason, we have assigned higher occupancy rates to the Address Downtown, in line with what can be currently observed.
• We have modeled for gentle declines in average daily rates (ADRs) in line with our general views for the Dubai market. Declines are stronger for the perceived weaker hotels (mainly the smaller 4-star offerings in Downtown (Al Manzil and Qamardeen) and the Address at Dubai Marina, which we feel will struggle to compete with the beach hotels on offer at Dubai Marina.
• Our F&B multiplier is at 1.8x, higher than the international average of 1.5x. This is actually a traditional feature in Dubai, as hotels are the only places allowed to serve alcohol. Alcohol is a very high-margin product in Dubai, and attracts a larger number of diners and drinkers to hotels than in markets where no such restrictions exist. Nuran serviced apartments do not provide F&B.
• For the Armani Hotel at Burj Khalifah, we have raised our discount rate by 200 basis points (bps). This is a reflection of the total lack of information given about occupancy rates and ADRs, a fact apparently due to disclosure restrictions on the part of the Giorgio Armani Group. Unfortunately, this lack of information reduces the visibility we have on this particular asset.
• We have assumed a LT growth rate in revenues of 3%.
Retail
We have modeled each of the existing malls, as well as the community retail spaces owned by Emaar in its developments (Arabian Ranches, Emirates Hills, Dubai Marina) separately. Note that, again due to a lack of full information, we have not modeled the projected malls at New Cairo (Egypt), New Istanbul (Turkey) or Damascus Eighth Gate (Syria).
• For Dubai Mall, we are factoring long-term occupancy of 90%, fairly high by international standards. This mall is clearly Emaar’s crown jewel, and is proving a massive success. Our ERV assumptions reflect management guidance.
• We have been slightly more conservative on Marina Mall, factoring in long-term occupancy of 85% and lower ERVs. Marina Mall has more of a community aspect, and will not in the long-term attract similar tourist foot-fall as Dubai Mall does.
• For the Gold and Diamond Park, we have raised our discount rate by 200 bps to reflect the almost total lack of information about occupancy rates and ERVs;

Real Estate & Construction – EmaarJuly 04, 2011
nbkcapi ta l .com | 9
• Finally, for Souk al Bahar, we have made very conservative assumptions for both ERVs and occupancy rates. The Souk is located literally at the doors of Dubai Mall, and we feel that, despite its different concept and client target, it may well struggle to attract both tenants and footfall, sitting as it does in the shadow of its larger and more successful neighbor.
• For all malls, we have assumed operating costs of 15% of revenues (international standard) and a long-term growth rate of 3%.
dubai developments
These consist in
• 2,016 residential units in Downtown Dubai to be delivered in FY2011-13;
• 1.963m sq. ft. of commercial space in Downtown Dubai and Dubai Marina, to be delivered in FY2011;
• 89 villas in Arabian Ranches to be delivered in FY2011-12;
• 277 residential units in Umm al Quwain (UAQ) Marina, to be delivered in FY2011.
We have not modeled for
• A further 14,872 residential units and 580,325 sq. ft. of commercial space in Downtown Dubai, to be delivered after FY2013, as we have insufficient information about these;
• A further 8,077 residential units in future phases of UAQ Marina, again slated for delivery beyond FY2013. Again, we have little information about these units. Moreover, given the state of the real estate market in the UAE, we feel there is a strong likelihood that this project, in slightly remote Umm al Quwain, may well get delayed/downsized/shelved;
• 29,583 units at L’Usailly. This project currently seems on hold. The L’Usailly plot of land is situated next to the new Al Makhtoum airport, which has started operating successfully as a freight destination. However, it is as of yet unclear whether the airport will be fully developed along the original plan, which could further delay or modify L’Usailly. We do, however, expect this project to be launched eventually;
• 19,000 units at Bawadi, in Dubailand, a project currently on hold, and which we doubt will happen, in the foreseeable future anyway.
Note that, due to strong deliveries (2,839 units) in FY2010, our DCF is penalized by a large retention payment in FY2011 (retentions are traditionally 10% of the total construction cost, paid in the year following delivery).
international developments
As we have mentioned above, we have modeled only those phases of the international developments that are currently being built, resulting in very few units (3,495) actually being valued. This explains why we have such a low valuation for Emaar’s long list of international projects. Remember also that projects developed by associates are not included in this DCF calculation (for instance, Emaar MGF currently has 13,827 units under development). Almost 10,000 units due to be developed between now and FY2013 are also not taken into account in this valuation, due to lack of visibility.
Egypt (projects in Cairo Gate, Marassi and Mivida/New Cairo) forms the bulk of this segment’s value (50%). We are assuming that all the units pre-sold and currently being built will be delivered. Whilst this may seem optimistic given the current political situation in Egypt, it should be remembered that most of these developments started selling in FY2008-09, and that investors have thus already paid the lion’s share of their investment. We acknowledge, however, that our assumption may be optimistic. We are also taking the view, in line with management’s guidance, that Emaar will not have any issues with the land it acquired for its developments. Indeed, none has surfaced to date.
We have modeled only phases
currently under construction

Real Estate & Construction – EmaarJuly 04, 2011
nbkcapi ta l .com | 10
We have not modeled Syria’s Eighth Gate development, due to a lack of complete information about this development, and to most residential units being built on demand (which has two consequences: first, it is impossible to tell the size, cost and timing of these units; second, they are at much greater risk of cancellation, especially given the current developments in Syria). However, given we were talking about 110 units in total, this would not have made a material difference to our valuation.
Associates
We have modeled associates at book value, except for:
• Emaar the Economic City, which is developing part of King Abdullah Economic City in Saudi Arabia. Since this is a listed entity, we are using its market value for valuation purposes;
• Emaar MGF in India. Here we have used a comparative approach, using the average P/BV 2010a and 2011e for the Mumbai Sensex Real Estate index. This is composed of India’s top 14 property developers. This results in applying a P/BV ratio of 1 to Emaar MGF, a valuation coincidentally consistent with the mooted IPO value of Emaar MGF. It should be noted however that:
� Said IPO has been repeatedly postponed since FY2008, and is again looking unlikely given the immediate outlook for the Indian real estate market and investor appetite for the sector;
� Emaar MGF is facing issues that could penalize the valuation. These have mainly to do with the land bank, its acquisition and the condition of part of the land being declared constructible. Fairly much all Indian developers are facing similar issues, so this is already at least partly reflected in our valuation of Emaar MGF. Moreover, we would stress that most of these assertions are rumors, strongly denied by Emaar. However, these rumors as well as the averted problems encountered at the Commonwealth Games Village (partly built by Emaar MGF) could result in a sharply lower valuation for the company;
• We have valued Amlak (Dubai mortgage provider, partly owned by Emaar and currently undergoing financial restructuring) and Dubai Bank (same) at zero, given the parlous state of their financial positions and the lack of visibility on how this will develop. Similarly, loans to Amlak have been deemed irrecoverable and valued at zero. Emaar has actually announced it will write-off its stake in Dubai Bank entirely following its recapitalization.
• All other associates are valued at book value YE2010.
Additionally, we have modeled a valuation of Emaar’s overhead costs (i.e., costs not specifically related to a specific project). We have assumed 7% of Emaar’s recurring revenues normalized to reflect full operation, with a long-term growth rate of 3%.
Finally, we have valued other assets and liabilities at their YE2010 book value.
Overall, thus, our valuation of Emaar is as follows.

Real Estate & Construction – EmaarJuly 04, 2011
nbkcapi ta l .com | 11
Figure 4 Emaar valuation
Value % of SOTP
Hotels 4,934.7 22.0%Retail 15,082.2 67.4%Development Dubai 483.4 2.2%International 526.3 2.4%Associates 6,197.6 27.7%Corporate (3,152.1) -14.1%Other assets 9,538.7 42.6%Other liabilities (11,227.0) -50.2%
Total value 22,383.7 Value per share 3.67
Source: NBK Capital Research
Our total value for Emaar thus stands at AED 3.67 per share, 17% above the current share price.
We would stress that this constitutes a minimal value for Emaar, as we have consistently chosen to model in the most conservative way possible. This is mainly a function of the lack of visibility we feel we have on many of Emaar’s projects.
The share’s past trading, consistently below Emaar’s stated NAV and currently below Emaar’s current book value, seems to indicate that we are not the only ones applying maximum conservatism when it comes to valuing the company. Whilst we see potential upside from our valuation, it will depend on more visibility, especially on the specific timing and pricing of the international projects. In the meantime, we feel the share will continue trading cautiously, although we do feel the share’s current value does not reflect adequately even our most conservative of valuations.
Our valuation is conservative
due to the lack of visibility

Real Estate & Construction – EmaarJuly 04, 2011
nbkcapi ta l .com | 12
EstiMAtEs
Emaar 1q2011 results
Emaar’s 1Q2011 results reflected our expectations of the whole-year business mix.
• Revenues totaled AED 1.98 billion, against AED 2.89 billion in 1Q2010, a drop of 31.5%. As expected, this covered two differing realities. Revenue from real estate sales dropped 48% to AED 1.14 billion, which reflected the high deliveries in Downtown Burj Khalifah in 1Q2010. In 1Q2011, Dubai revenues were much lower, reflecting the fact that Emaar is reaching the end of its Dubai delivery program. Inversely, recurring revenue increased, with hospitality up 41.8% to AED 336 million and retail up 8.5% to AED 507.5 million. We expect this trend to be replicated in coming quarters.
• Gross margin of 51.6%, as against 41.5% in 1Q2010, mainly reflected the change in the business mix.
• SG&A was under control, rising only 2%, whilst other operating revenues and costs declined sharply.
• Below the operating line, the only major variation was in minorities, which stood at 12% of total net profit (as opposed to a small loss in 1Q2010), mainly reflecting strong deliveries in Syria (Eighth Gate, with the delivery of the Damascus Stock Exchange) and the Kingdom of Saudi Arabia (KSA) and lower Dubai deliveries. Losses from associates also increased sharply, from AED 57 million to AED 127 million.
The balance sheet was little changed, with a net debt of AED 6.23 billion as against AED 6.12 billion at YE2010.
Estimates for fy2011 and beyond
Our estimates clearly reflect a similar standing to our valuations, which means we have estimated only the projects on which we currently have sufficient visibility, in terms of both timing and delivery. As is the case with our valuation, this lack of visibility obviously has a negative impact on our international development estimates. Essentially, beyond FY2013, our estimates reflect our expectations for the recurring activities only.
Up to the gross margin line, our assumptions are exactly similar to the ones explained in our valuation section above.
Below this, we have assumed
• Stable SG&A outflows for FY2011, rising 2% in FY2012, as we expect Emaar to maintain strict cost control. Beyond this, the sharp drop in our SG&A assumptions mirrors the lack of visibility on the international development activities.
• Stable other income/cost as a percentage of revenue.
• Losses from associates slowly declining, from a FY2011 base consistent with the numbers achieved in 1Q2011. We have to admit that this is a line we have very little visibility on.
• We have also included in our FY2011 estimates an AED 176.6 million write-off of Emaar’s stake in Dubai Bank, as announced by the company. We have assumed this was taken in 2Q2011. However, our estimates do not include any further write-offs on Amlak, despite the fact we have taken a zero value for Amlak in our valuation. We are not driving this through our P+L assumptions as we have no visibility on the possible timing of this write-off, although we feel fairly secure about its eventual occurrence.
Our balance sheet assumptions reflect our development assumptions until FY2013. Beyond this, we have kept our balance sheet structure essentially unchanged.

Real Estate & Construction – EmaarJuly 04, 2011
nbkcapi ta l .com | 13
We would once again like to insist on the lack of visibility in these estimates. We would point out, however, that a look at the standard deviation in the consensus estimates shows that we are far from being the only ones with this problem. For FY2011 only, the consensus shows
• For revenues, a median estimate of AED 9.08 billion, with a range spanning AED 5.25 billion to AED 12.96 billion;
• For attributable net profit, a median estimate of AED 2.28 billion, with a range of AED 397 million to AED 3.36 billion, or almost 1 to 10.
Visibility on quarterly results is if anything even lower, as the company does not detail delivery schedules within a year. Here again, our estimates should be taken with the proverbial pinch of salt.

Real Estate & Construction – EmaarJuly 04, 2011
nbkcapi ta l .com | 14
bulls And bEARs
bulls
• Emaar’s strategy of developing recurrent revenues from the hospitality and retail businesses is proving an unqualified success, and will continue providing a strong base for the company’s valuation. Emaar has been at the forefront of the development of Dubai as a tourism and retail destination, and is now reaping the rewards. Occupancy rates in the company’s retail malls, and particularly the flagship Dubai Mall, are currently high by international standards. Given the high footfall experienced by the malls, we expect the high rates to continue. Equally, Emaar’s hospitality portfolio is proving very successful. Although this is partly due to temporary factors in our view (regional unrest favoring Dubai as a tourist destination), we believe Emaar’s hotels will be prime contributors to both revenues and valuation in the future. It is worth noting that our valuation of the firm’s recurring revenue-generating assets is equal to the firm’s current market capitalization. As we do not view our assumptions as particularly aggressive, we think these assets provide a strong underpinning for the valuation of the company.
• Emaar’s success in retail and hospitality in Dubai is expected to be replicated internationally. Both the Address and Armani Hotels brands are gaining notoriety internationally and establishing themselves as credible, high-end brands. Emaar has already started deploying these internationally, and we expect this to generate additional value in the medium to long term. Equally, Emaar’s retailing experience in Dubai will be put to further use in the company’s international developments, with projects in the planning stages in India, Egypt and Turkey. Again, we feel these projects will deliver additional, high-visibility value in the medium term. It should be remembered that, due to a lack of visibility on the exact timing and scope of these projects, we have not included them in our valuation.
• Emaar has a very strong track record in property development, having made a strong success of its Dubai operations. The company’s track record throughout the Dubai real estate cycle, including, crucially, during the 2008-to-current downturn, has been spotless. Contrary to almost all of its listed or non-listed main competitors, Emaar has never lost money on real estate development in Dubai. Part of this is of course the result of the favorable conditions under which Emaar has historically operated in Dubai, particularly with the granting of most of the company’s land bank for free. However, it is worth noting that other companies in Dubai have benefited from a similar treatment, with strongly dissimilar results (e.g., Nakheel).
• Emaar’s corporate strategy has been spot-on throughout the development of Dubai’s real estate cycle. The company has navigated in a very timely fashion from a land-sales-based model, to a property development model, before finally morphing toward a sustainable, recurring business model, as the market has matured. This, in our view, bears witness to the quality of Emaar’s management team, and bodes well for the company’s ventures outside its home market. With Emaar’s business in Dubai now largely completed, value in the future will be created outside the home market. Emaar’s track record in Dubai should give investors confidence about the company’s potential to replicate its business model successfully in new markets. Whilst there are short-term issues regarding the visibility over these developments, which are indeed reflected in the company’s current share price, we feel Emaar’s track record amply demonstrates the company’s capabilities in terms of long-term value creation.
• Emaar is and remains one of the very few property developers in the MENA region to have successfully moved from its home base to develop internationally. This is particularly relevant to the share’s future valuation and trading, as
� As we have noted in the Dubai market section, we are not particularly positive on Dubai real estate’s medium-term outlook. In both residential and commercial real estate, Dubai has a significant overhang that will take time to resorb. Emaar, as we have noted, has essentially finished its development plans in Dubai. Its immediate exposure to the city is now almost entirely dependent on the most successful segments of real estate, namely, tourism and retail;

Real Estate & Construction – EmaarJuly 04, 2011
nbkcapi ta l .com | 15
� The company offers a uniquely diversified risk profile. The company is unique among MENA-based real estate players in not being focused exclusively on its home market. Moreover, Emaar has expanded internationally outside even the MENA region, further diversifying its risk profile.
• Given all of the above, Emaar’s current valuation is in itself a strong bull point for the company. As we have noted above, the company’s current market capitalization can be entirely accounted for by its retail and hospitality activities, which are highly successful and provide strong future visibility. The company’s track record in pure development activities provides a good measure of reassurance about Emaar’s potential to create value in its international expansion. This has up to now been hampered by a strong lack of visibility on these developments, which we would attribute mainly to the firm’s concentration on Dubai, and its somewhat cavalier disclosure policy. Emaar’s share price has undoubtedly suffered in recent years from its close association to its city of origin. We feel that, as the company starts moving away from Dubai, increasing visibility on its international projects, as well as the gradual disappearance of the market’s perception of Emaar as a “play on Dubai,” will gradually unlock the value currently present in the international developments.
bears
• Emaar’s biggest drawback historically has undoubtedly been its poor corporate communication, and we feel this is a continuing issue for the company. This is, in our view, clearly demonstrated by the fact that Emaar’s share price has constantly been below the company’s independently calculated NAV, and, more recently, below even its book value. Note that this has happened despite the fact that Emaar has always made significant profits on its main businesses and has avoided all the pitfalls and traps into which its local competitors have fallen headfirst. Whilst the company has undoubtedly suffered from punishment by association, through its correlation with Dubai, we feel this is also the result of Emaar’s rather patchy disclosure about its development projects, both in Dubai in the past, and internationally currently. Again, this issue is reflected in our own valuation of Emaar: the lack of visibility on the timing, scale and costing of the international projects means we are currently valuing only a very tiny fraction of them, resulting in what even we acknowledge is a very conservative valuation of the company. However, it is worth noting again that Emaar’s current and recent-past share price would tend to indicate that the market shares our reticence. Admittedly, the sheer size of Emaar, as well as the number of projects the company is involved in, complicate detailed disclosure. We nevertheless strongly feel that with a more open and complete communication strategy the company could help the market release the share’s potential.
• Emaar has shown an uncanny, and rather regrettable, ability at shooting itself in the foot at regular intervals. The mooted land deal with Bawadi in 2007 was a corporate communication disaster (especially given that the original plan, which would have involved considerable dilution of the minority shareholder, was rapidly shelved). The company’s foray in the USA through its top-of-the-cycle acquisition of JL Homes resulted on both large losses and the complete write-off of the acquisition. Then, Emaar’s mooted merger with troubled Dubai Properties again spooked the market (although again, this never actually took place, and admittedly was not the company’s idea in the first place). Finally, the company is currently facing the issue of the write-off of its stake in Dubai Bank, and the related uncertainty about its (much larger) exposure to Amlak. It should be noted that none of these events proved to be majorly significant for the company in real terms. However, they have added to the general impression of lack of transparency.
• Short-term uncertainties are mounting over the company’s international business. Developments in Egypt and Syria are bound to be impacted by the uncertain climate in these countries, even if Emaar maintains it has been untouched up to now. Equally, the company has not until now been impacted by land acquisitions issues in Egypt, and insists all its land deals in Egypt have

Real Estate & Construction – EmaarJuly 04, 2011
nbkcapi ta l .com | 16
been clean. The company is also facing issues in India, through its Emaar MGF joint venture. This has been involved in one averred corruption case (the Commonwealth Games Village in Delhi was built by Emaar MGF, although Emaar maintains its innocence), and rumors about land acquisition and, crucially, requalification of agricultural land into constructible land abound. We would stress that none of these rumors have up to now been substantiated. In addition, these issues seem to be rather endemic to the whole real estate sector in India. However, we expect them to continue hampering visibility on the share, be it only by delaying yet again the mooted IPO of Emaar MGF. Finally, Emaar’s major development in Saudi Arabia, King Abdullah Economic City, has been dogged by poor visibility and increasing delays. As a result, shares in Emaar the Economic City have underperformed both the Tadawul index and the Saudi real estate sector in the past two and a half years.
• Emaar has recently announced a strategic review of its international developments, to be effected by McKinsey. Whilst the company insists this is just a normal review of its strategy, the fact that Emaar should need to review one of the two main pillars of its future development could be construed as slightly worrying. Parallel to this, Emaar’s Chairman announced the creation of a management committee to “develop and roll-out a five-year corporate strategic action plan for long-term value creation.” This will, in our view, further hamper visibility on the company, at least for as long as the consultant and committee have not reported their conclusions. Since most of the putative upside for the company’s valuation would eventually come from its international operation, uncertainty about the outcome of the review is slightly worrying in the short term.
• Finally, our current valuation of Emaar is heavily slanted toward Dubai, where recurring revenue-generating assets are situated. Any event, political or financial, affecting Dubai’s economy or regional standing would have a disproportionate effect on the stock’s value.
Real Estate & Construction – EmaarJuly 04, 2011
nbkcapi ta l .com | 17
dubAi REAl EstAtE MARkEt oVERViEw
The Dubai real estate market has seen a severe correction in the past two years, from the peak reached in 2008. Both rental and selling prices have crashed across the board, for commercial as well as residential real estate. Hospitality and retail, whilst holding up better, have also softened. Although there are some positive signs, we believe the sheer magnitude of additional supply, across all sectors excluding retail, means there is room for a further deterioration in pricing.
From a general perspective, one element has arisen in recent months that could provide support to Dubai real estate: the Emirate’s safe haven status in view of the developing regional events. Dubai offers very strong political stability, as well as the safest and most investor-friendly environment within the MENA region. As political instability spreads regionally, it is possible we could start witnessing substantial capital inflows into Dubai from the rest of the MENA region, and that this capital will find its way into the real estate market, seen as a safe haven. Whilst there is undoubtedly some evidence of capital moving into Dubai from affected areas, we actually see little fundamental support for the real estate market, mainly for two reasons:
• First and foremost, the dynamics of supply and demand, and of the supply side in particular, make investing in Dubai property at the moment an unattractive proposal. Vacancy rates are already extremely high by international standards in commercial real estate (see below). Whilst there are no reliable vacancy statistics for the residential market, anecdotal evidence (including the sheer number of residential real estate available for rent or sale) suggests high vacancy rates in this segment as well. Moreover, supply is still expected to come on stream in FY2011 and FY2012, particularly so in commercial real estate. We feel that as long as the balance of supply and demand has not stabilized (i.e. as long as new supply continues to arrive in an already over-supplied market), potential investors looking for a safe haven will probably choose other asset classes.
• Real estate investment is by nature geared toward the long term, particularly in the absence of instruments such as exchange-traded REITs, of which none exist for Dubai (or for anywhere else in the MENA region for that matter). Although the UAE is not expected to experience events similar to those seen recently in the region, it will in our view be affected by the general regional context. It is therefore more likely that capital exiting troubled regional countries will find its way to even safer havens (there is strong evidence of regional money flows toward Switzerland or the United Kingdom for instance (Zawya, 24/03/2011)). Moreover, such capital that stays within the Gulf Cooperation Council (GCC) is more likely to be invested in more liquid assets than real estate, given lingering regional uncertainties.
In our view, only the hospitality and retail sectors will benefit from Dubai’s safe haven status. Dubai is and remains a strong tourist destination and will likely benefit from both regional and international tourism shifting away from other regional destinations affected by unrest. This should underpin both hotel occupancy rates and mall footfall in Dubai in the short term, although in our view Dubai’s safe haven status is unlikely to provide much support for capital investment in these segments.
In this section, we will be looking at:
• The residential market: funding, regulatory aspects, supply and demand and prospective pricing;
• The commercial market: investment attractiveness, regulatory environment, supply and demand and future pricing;
• Hospitality: occupation and RevPar trends, supply and demand issues;
• Retail: supply and demand, occupancy rates and expected rental developments.
We do not think regional events
will boost the market in the
long run…
…although retail and
hospitality will benefit in
FY2011

Real Estate & Construction – EmaarJuly 04, 2011
nbkcapi ta l .com | 18
the dubai residential market
Funding
After two difficult years, UAE banks have started restoring healthy liquidity ratios from mid-FY2008.
Figure 5 UAE banks’ liquidity
Dec-06 Jun-07 Dec-07 Jun-08 Dec-08 Jun-09 Dec-09 Jun-10 Dec-10 Mar-11
Total Assets 859,574 1,002,574 1,223,073 1,423,200 1,456,200 1,489,300 1,519,100 1,538,800 1,605,600 1,695,900Bank Credit 502,963 577,265 696,473 867,610 993,700 1,009,000 1,017,700 1,025,600 1,031,300 1,048,100Deposits 518,806 620,692 716,021 833,919 922,500 961,730 982,600 985,400 1,049,600 1,105,100
Loans-to-Deposits 96.9% 93.0% 97.3% 104.0% 107.7% 104.9% 103.6% 104.1% 98.3% 94.8%
Sources: UAE Central Bank and NBK Capital Research
Although on the surface the balance looks finely set, there is still headroom for UAE banks to extend lending. The loan-to-deposit (LTD) ratio does not give the full picture, as most UAE banks also have access to long-term financing options.
UAE banks have markedly reduced their exposure to real estate in the past two years. We think this trend is likely to continue, although for market reasons more than out of deliberate choice. Large residential developments have either been completed or are in the completion phase in Dubai, and commercial real estate deliveries are expected to peak in FY2011 and FY2012. Therefore, we expect a natural decline in credit demand coming from developers and/or contractors, thus freeing up more space for buyers.
We do not therefore expect to see a repeat of the problems last seen in FY2008, when the combination of a high exposure to real estate and over-reliance on short-term financing on the part of the banks led to a strong slowdown in lending. We foresee that liquidity should be available to finance the residential market in Dubai, should it be needed.
The situation on the mortgage front is more complex. Dubai has one of the most advanced mortgaging systems in the region, at least from a regulatory point of view (see regulatory issues below). Aside from the banks, Dubai also counts two specialized mortgage-lending entities, Tamweel and Amlak, set up at the turn of the century.
Yet mortgage penetration remains low in Dubai, even by regional standards. This can be explained in our view by
• Aggressive retrenchment on the part of the banks following the collapse of the real estate market since FY2008;
• The fact that neither Tamweel nor Amlak has been granted bank status: neither entity can thus finance itself from deposits, and understandably given the recent real estate market context, other sources of financing have proved difficult to secure;
• Uncertainty regarding the future of both mortgage lenders: the Dubai government has tried to merge Tamweel and Amlak for the past two years. This project was finally abandoned, and Tamweel, having been recapitalized, is back trading as a stand-alone entity. Amlak is in a difficult financial position;
• The fact that the residential market in Dubai has been primarily geared toward high-end developments, where a larger proportion of purchases are self-financed.
The outlook for the mortgage market, in our view, is increasingly positive. We believe banks are making increasing funding available to the mortgage sector, while Tamweel seems to have restored its financial health (although it still does not have bank status, keeping a question mark over its financing options). Banks have recently lowered rates and increased loan-to-value (some as high as 85%), underpinning our optimism.
All in all, we do not believe that funding will prove a hindrance for the Dubai residential market in the near to medium term.
The funding environment is
becoming more favorable
Wider availability of mortgages

Real Estate & Construction – EmaarJuly 04, 2011
nbkcapi ta l .com | 19
Regulatory environment
This is one area where Dubai possesses a significant competitive advantage in the regional context, at least theoretically.
Major regulatory landmarks include
• Law no. 8 of FY2007, establishing escrow accounts: all monies paid by off-plan buyers to developers have to be put in a project-specific escrow account, managed by a third party, with monies deposited to be used only toward the pre-sold project. This has proved a largely effective mechanism;
• Law no. 13 of 2008 establishing obligatory registration for all real estate developers and brokers, as well as the obligation to register all transactions.;
• Law no. 16 of 2007 establishing the Real Estate Regulatory Agency (RERA), which deals with all registration and regulatory aspects of the real estate market;
• Law no. 9 of 2009, which amongst others regulates situations arising from purchasers’ or developers’ default;
• And finally Circular 1/2010, establishing the registration of owners’ associations and regulating the management of common areas in multi-tenanted buildings.
In theory, thus, Dubai has the most complete and adequate regulatory environment in the MENA region, giving it a competitive advantage over other regional markets. However, the reality has proved somewhat less clear-cut.
In particular, provisions regulating lack of execution or default by developers have largely not been enforced. Regulations, for example, stipulate RERA may force a developer to pay back customers’ advances if construction has not started on an off-plan development one year after the initial sales. In practice, this regulation has never been enforced. There is ample anecdotal evidence of investors having lost their monies without much recourse on abandoned or severely delayed developments.
Supply and demand
Additional supply of residential units peaked in FY2010, with a total of 36,000 units delivered (source: Jones Lang Lassalle). From here on, deliveries of new units are expected to tail-off in the coming two years, with a further slowdown beyond this.
Figure 6 Dubai residential supply
309,301 309,301334,846
25,545
23,360
0
50,000
100,000
150,000
200,000
250,000
300,000
350,000
400,000
2010 2011 2012
Existing stock New supply
Sources: Jones Lang Lasalle and NBK Capital Research
Real Estate & Construction – EmaarJuly 04, 2011
nbkcapi ta l .com | 20
These numbers should, however, be taken with a pinch of salt, as experience has shown when it comes to the Dubai market. There have been numerous past instances of developments delayed, slowed down or stopped altogether, and we would view the above figures as a best-case scenario. Although most on-going projects slated for FY2011 delivery seem to be on track, projects that had been on hold (particularly Nakheel projects in Jumeirah Lake Towers, Jumeirah Village, Jumeirah Park and particularly Dubai Waterfront) and were put back on track in early FY2011 are likely to suffer further delays.
This, however, comes against a backdrop of increasing vacancy rates. Although there are no exact statistics regarding vacancy rates, ample anecdotal evidence exist to confirm the increase, including the following:
• Greater availability of housing for rental, with an average duration on the market (as shown by agents’ websites) often above six months, and still rising. A similar survey shows an increasing flexibility on the part of landlords regarding payment schedules, with four cheques p.a. tending to become the norm (as against the traditional 1 cheque p.a.), and 12 cheques p.a. not unheard of;
• Property re-classified by developers from development properties to investment properties (including at some of the listed players), a clear indication that the completed units are proving difficult to shift;
• Increasing write-downs by both listed and unlisted players of properties under development or investment properties;
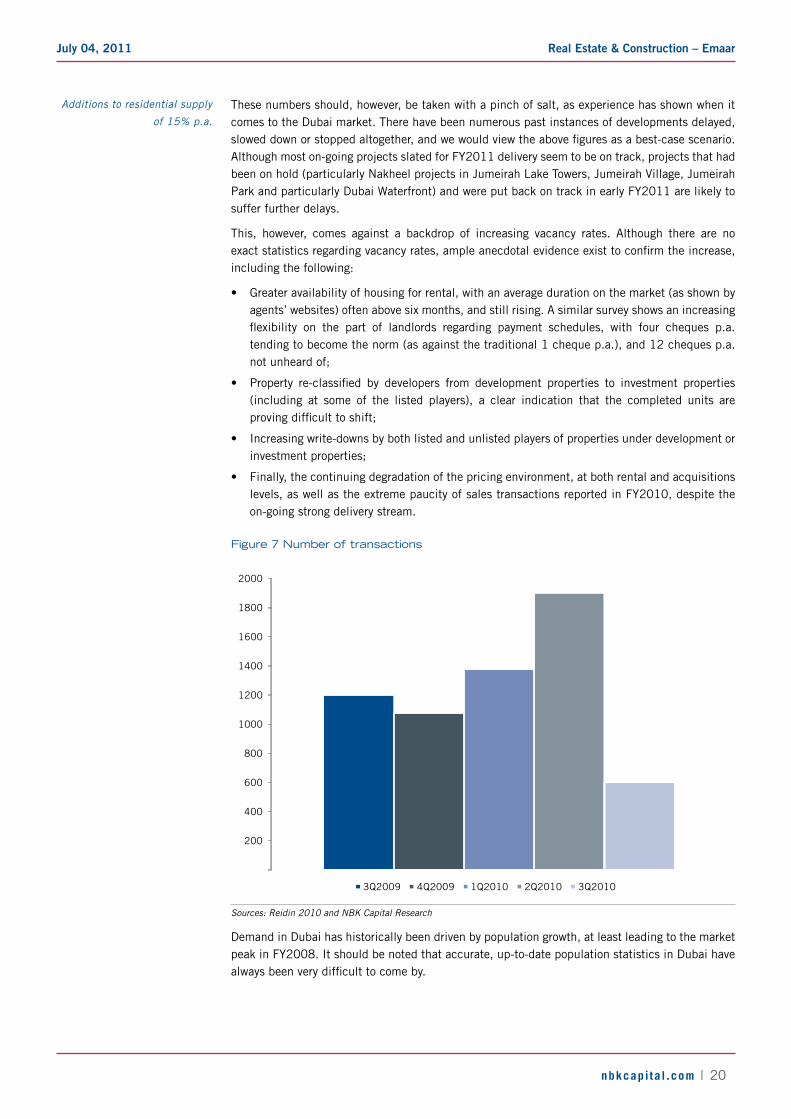
• Finally, the continuing degradation of the pricing environment, at both rental and acquisitions levels, as well as the extreme paucity of sales transactions reported in FY2010, despite the on-going strong delivery stream.
Figure 7 Number of transactions
200
400
600
800
1000
1200
1400
1600
1800
2000
3Q2009 4Q2009 1Q2010 2Q2010 3Q2010
Sources: Reidin 2010 and NBK Capital Research
Demand in Dubai has historically been driven by population growth, at least leading to the market peak in FY2008. It should be noted that accurate, up-to-date population statistics in Dubai have always been very difficult to come by.
Additions to residential supply
of 15% p.a.

Real Estate & Construction – EmaarJuly 04, 2011
nbkcapi ta l .com | 21
Up to 2008, and from the beginning of the century, Dubai’s population compound annual growth rate (CAGR) was recognized to be 7%. Official statistics in fact show that Dubai’s population kept growing throughout the financial crisis, from a base of 1.6 million in FY2008 to 1.77 million in FY2009 and 1.9 million in FY2010. The methodology underpinning those statistics has, however, been called into doubt (by the EIU amongst others), and other studies have shown Dubai’s population declining by as much as 25% between FY2008 and FY2010.
Intuitively (again, there are no reliable statistics), the population targeted by Dubai’s residential developers (high-end, mainly expatriate population) has declined sharply in the last two years, following the contractions in both the financial services and real estate industry, which provided the largest contingents of expatriates in FY2008. Anecdotal evidence shows this trend is continuing, although at a slower pace, in early FY2011, as real estate–related industries continue shedding jobs (or moving them), as Dubai real estate development activity continues slowing. Numbers in the financial services industry seem to be stabilizing.
However, a few mitigating factors are at play:
• As residential prices in Abu Dhabi remain around 20% ahead of those in Dubai, there has been an increasing tendency by people employed in Abu Dhabi to base themselves in Dubai
• In parallel, residents have also been coming in from neighboring Sharjah, as affordability has increased (Dubai has a better quality housing stock).
Nevertheless, we believe the balance of supply and demand will remain a negative factor for the residential market in the next two years, at least until the additional supply of residential units tails off. Population growth is unlikely to be strong, if even existent, barring catastrophic developments in neighboring states, given the continuing decline of at least some of Dubai’s traditional industries. We believe the current rate of additions in the residential markets will, at least initially, aggravate the vacancy situation, thereby pressuring prices further.
Pricing
Unsurprisingly, given the supply/demand balance, prices continued to decline in FY2010, albeit at a much slower rate than the precipitous decline registered in FY2009.
Figure 8 Dubai average rental prices (AED/000/year)
50
100
150
200
250
1H2008 2H2008 1H2009 2H2009 1H2010 2H2010
1BR 2BR 3BR
Sources: CBRE and NBK Capital Research
We expect the supply/demand
balance to remain negative for
the next two years

Real Estate & Construction – EmaarJuly 04, 2011
nbkcapi ta l .com | 22
Average leases declined marginally in 4Q2010 vs. 3Q2010 (-1% according to Jones Lang Lasalle, -4% following CBRE numbers), taking the year-over-year (YoY) decline to anywhere from -8% (JLL) to 17% (CBRE) (JLL’s sample appears more geared toward the high end of the market, which has shown better resilience).
Unsurprisingly, lower-end apartments, smaller units and less desirable locations have dropped at a faster rate than top-end locations (e.g. in 4Q2010, apartments in the Downtown Burj Khaliffa area were relatively unchanged).
Given the paucity of actual transactions taking place, it is more difficult to track selling prices. However, Jones Lang Lasalle reckons average asking prices dropped 6% YoY in 4Q2010, with realized prices dropping 12% YoY. On a comparable basis (i.e. using the JLL sample), this would indicate a slight firming of yields, although again, the paucity of actual transactions taking place makes it difficult to draw definitive conclusions.
Given the supply/demand dynamics, as well as the financing issues, we expect that rents and selling prices will develop along similar lines in FY2011 and FY2012 as in FY2010: on a continuing slow decline. This decline will be more pronounced at the medium to lower end of the market, whilst the higher end may see stabilization in selected developments as soon as 2H2011. We expect the market will probably bottom out by 2H2012, as pressure from the supply side at last starts abating. There could be further, significant pressure on the market should some of the larger projects that have been shelved (e.g. Dubai Waterfront, Palm Jebel Ali, Palm Deira, Dubai World) be re-started. However, we view this as extremely unlikely.
dubai commercial real estate market
The commercial real estate market in Dubai has witnessed the worst performance of all sub-sectors in Dubai, on both rental and transaction bases. Despite this, the significant additional supply expected to come to the market in FY2011-12 means there is little room for an immediate recovery, despite what looks like a more favorable environment for commercial real estate investment.
Investment environment
Theoretically, the international investment environment should currently be favorable for investment in commercial real estate in Dubai, for the following reasons:
• On a global basis, very low bond yields (as a result of both ultra-accommodative monetary policies from developed countries’ central banks and quantitative easing [QE] programs in selected countries) mean that the yield differential has remained very favorable to real estate investment in the past year. Whilst the resurgence of inflation in both developed and emerging markets should result, sooner or later, in rising bond yields and, thus, diminishing the relative attractiveness of real estate investment, this should not have a major impact at least initially: bond yields have been so low that the yield differential is very wide by historical standards, giving some leeway for bond yields to rise before they start affecting expected real estate yields;
• Indeed, this investment environment has led to strong recoveries in commercial real estate markets in Asia, and more recently across some developed markets (e.g., London), whilst the Dubai market has continued dropping;
• MENA economies have recovered strongly on the back of higher oil prices, and Dubai remains the financial and business services hub of the GCC;
• Finally, regional uncertainties have reinforced Dubai as a safe haven, for both international as well as regional investors.
Pricing trends are still negative
We expect further pricing
decline, less so in the high end
Worst-performing sector in
Dubai
Real Estate & Construction – EmaarJuly 04, 2011
nbkcapi ta l .com | 23
Theoretically thus, the Dubai market should be strongly underpinned. However, two very major mitigating factors are at play:
• In spite of the favorable investment environment, transaction analysis in both developed and emerging markets shows investors are still very selective, with transactions concentrated on high-quality, long-term tenancies in Class A offices. Dubai offers few if any such opportunities;
• Even more importantly, all the above factors are being negated in Dubai, in our opinion, by the existing, significant overhang of available property (see below). This issue can only be compounded by the expected additional supply to be delivered in the coming years.
• In conclusion, we believe that, while the investment environment, both globally and regionally, should benefit Dubai commercial real estate, the market’s fundamental and, more importantly, deteriorating imbalance acts as a total break to investment. We believe this is likely to remain the case for the foreseeable future, barring significant cancellation of supply, which currently looks very unlikely.
Regulatory environment
More efforts are currently being deployed to improve regulations and thus transparency in Dubai, which already boasts what is in our view the most favorable regulatory environment in the region.
In particular, regulatory authorities are looking at
• A strata law, which clarifies obligations of both tenants and landlords in shared developments, particularly as to what regards common areas and service charges, areas where transparency was inadequate up to now;
• Increased transparency as to rental costs, with the Dubai International Financial Centre (DIFC) deciding to publish costs to increase transparency and attractiveness.
Whilst both these changes are welcome, it should be noted that tenants’ preferences still go to single-occupancy. Given the ample supply available in Dubai, the strata law, whilst certainly helpful, will likely prove insufficient in itself to provide a significant boost to the market.
Supply and demand
The supply side of the equation in Dubai remains in a clear imbalance.
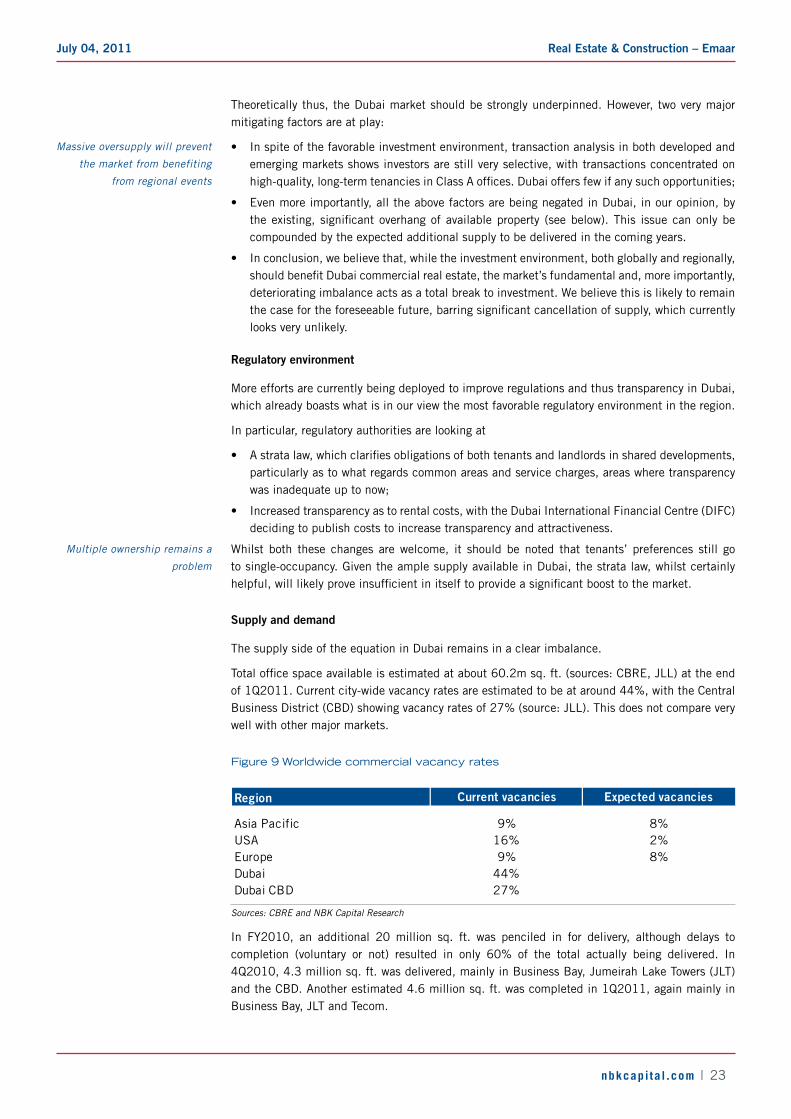
Total office space available is estimated at about 60.2m sq. ft. (sources: CBRE, JLL) at the end of 1Q2011. Current city-wide vacancy rates are estimated to be at around 44%, with the Central Business District (CBD) showing vacancy rates of 27% (source: JLL). This does not compare very well with other major markets.
Figure 9 Worldwide commercial vacancy rates
Region Current vacancies Expected vacancies
Asia Pacific 9% 8%USA 16% 2%Europe 9% 8%Dubai 44%Dubai CBD 27%
Sources: CBRE and NBK Capital Research
In FY2010, an additional 20 million sq. ft. was penciled in for delivery, although delays to completion (voluntary or not) resulted in only 60% of the total actually being delivered. In 4Q2010, 4.3 million sq. ft. was delivered, mainly in Business Bay, Jumeirah Lake Towers (JLT) and the CBD. Another estimated 4.6 million sq. ft. was completed in 1Q2011, again mainly in Business Bay, JLT and Tecom.
Massive oversupply will prevent
the market from benefiting
from regional events
Multiple ownership remains a
problem

Real Estate & Construction – EmaarJuly 04, 2011
nbkcapi ta l .com | 24
The scenario is likely to prove similar in FY2011 and FY2012.
Figure 10 Existing and additional expected supply
44
56 56
68
12
7
10
20
30
40
50
60
70
80
2009 2010 2011 2012
Existing stock Additional supply
Sources: JLL andNBK Capital Research
Again, we would stress that our additional supply figures do not reflect announced deliveries but our expectation of what is actually going to be delivered (for instance, announced deliveries for FY2011 are 20 million sq. ft., equal to what was announced for FY2010).
Most of the deliveries expected for the coming two years revolve around Business Bay and JLT, areas of secondary interest and not considered prime. However, further deliveries are also expected in Downtown Burj Khalifah and, though to a lesser extent, in the DIFC and along Sheikh Zayed Road, both of which are considered prime CBD areas. As we expect demand to remain concentrated around the CBD, vacancy rates and therefore pricing are expected to worsen even more rapidly in outlying areas. However, given the current vacancy rates in the CBD, and the amount of expected deliveries there, the situation here is unlikely to improve either.
We also note that the effect of delayed deliveries, evident in FY2010 and which we expect to continue in FY2011 and FY2012, can be viewed as positive only in the short term, as they decrease the immediate supply coming to the market. However, unless we start seeing outright project cancellations, the long-term effect is to maintain an overhang of supply for longer, thereby hampering an effective market recovery.
According to JLL, demand for office space in Dubai has remained fairly constant, at 2.4 million sq. ft. We believe this could improve gradually, with the on-going economic recovery, high oil prices, as well as the lessened attractiveness of other regional destinations due to the recent events. In addition, as commercial real estate prices continue to decline in Dubai, further migration from neighboring markets, where quality of supply is a major issue (e.g. Abu Dhabi, the Northern Emirates), is likely to continue.
Ongoing additions to supply
despite existing overcapacity
Market imbalance to continue

Real Estate & Construction – EmaarJuly 04, 2011
nbkcapi ta l .com | 25
However, from a supply/demand side, the situation in the Dubai commercial real estate market remains unattractive. With the fundamentals showing
• Around 2.5 million sq. ft. office space demand
• Around 22 million sq. ft. office space currently vacant, and
• 12 million sq. ft. additional supply expected just for FY2011,
The prevalence of a significant market imbalance is very likely to continue.
Pricing
Unsurprisingly given supply/demand fundamentals, prices in the Dubai commercial real estate market have suffered significantly. In FY2010, city-wide rental rates dropped by 30-40% (depending on brokers’ estimates), with CBD rentals down 32%. If anything, rentals decline accelerated in 4Q2010 (21% decline vs. 3Q2010 in the CBD), although that was due in large part to the DIFC’s decision to cut its rentals (something it had resisted doing until now).
Figure 11 Average rents in CBD, ex DIFC (AED/sq. ft.)
400380
315
260
220200 195 190
150
4Q2008 1Q2009 2Q2009 3Q2009 4Q2009 1Q2010 2Q2010 3Q2010 4Q2010
Sources: JLL and NBK Capital Research
Average rental prices are currently below their FY2005 levels.
Yield information is exceedingly difficult to come by for the Dubai market, in part because actual transactions are very few and far between. Average transaction prices are estimated to have declined some 20% YoY in FY2010.
JLL estimates of average city-wide rentals and average city-wide capital values at YE2010 (bearing in mind the paucity of actual transactions recorded) point to a yield of almost precisely 10%.
Pricing pressure to continue
Real Estate & Construction – EmaarJuly 04, 2011
nbkcapi ta l .com | 26
Figure 12 Prime office yield comparison
City Prime office yields (%)
Beiijng 5 to 8Shanghai 4.5 to 5.5HK 2.9Taipei 2.6 to 3.5
New Dehli 7 to 8Mumbai 10 to 12
Singapore 3.3Kuala Lumpur 6 to 7
Dubai 10
Sources: CBRE, JLL and NBK Capital Research
Dubai is clearly on the attractive end of the spectrum, however
• It should be remembered yield statistics in Dubai are far less reliable than in other, more transparent markets;
• The sheer imbalance in supply and demand means that, in our view, Dubai’s yield premium is far from attractive enough.
Given all of the above, we see no reason to expect any recovery in the Dubai commercial property market. On the contrary, we expect a continuing deterioration, in both rental and capital rates, for at least the next two years, and see no reason why the recent rates of decline should not continue prevailing. Only a significant interruption of new supply, still in our view unlikely despite the reigning imbalance, would contribute to restoring some balance in the market.
the hospitality market
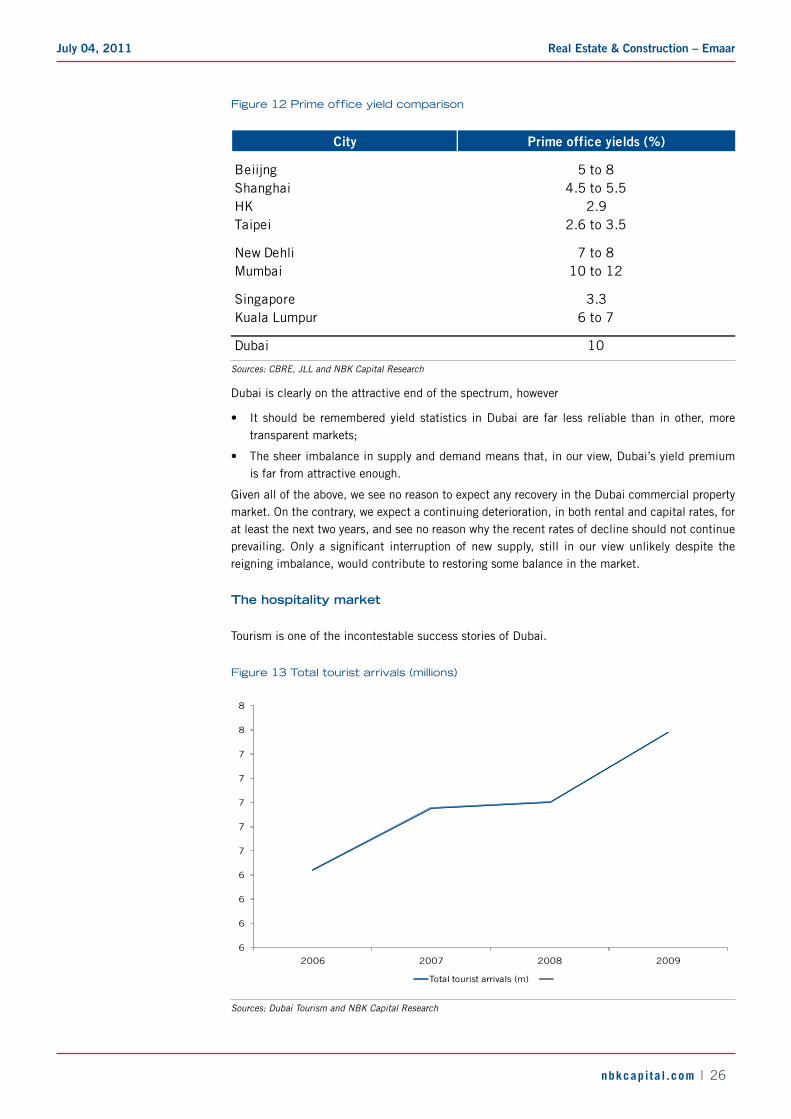
Tourism is one of the incontestable success stories of Dubai.
Figure 13 Total tourist arrivals (millions)
6
6
6
6
7
7
7
7
7
8
8
2006 2007 2008 2009
Total tourist arrivals (m)
Sources: Dubai Tourism and NBK Capital Research

Real Estate & Construction – EmaarJuly 04, 2011
nbkcapi ta l .com | 27
Interestingly, tourist numbers did not see a drop in FY2008, despite the world financial crisis (World Travel & Tourism Council data confirms this). In FY2010, tourist arrivals increased 5.4% in the first three quarters, with particular emphasis on GCC and Asian tourism.
Average hotel occupancy rates, having peaked at 79% in FY2008, have stabilized at around 70% in FY2009-10. It should be noted that occupancy rates are considerably lower in the summer months due to the prevailing temperatures. Average daily rates (ADRs), after a steep decline in FY2009 (-24%), have continued to decline in FY2010, albeit at lower rates (-9%). Supply has increased consistently throughout the recent past (see below).
An interesting development in FY2010 has been the arrival of budget category hotels (Ibis, Centro by Rotana, Easy Hotel and Cytimax). Until now, the hotel offering in Dubai was largely concentrated in the high-end category. The arrival of budget hotels may explain at least a part of the ADR decline in FY2010 (albeit a small part, given the relative sizes of the high-end and budget-end offerings).
In 1Q2011, occupancy rates picked up slightly (82% vs 79% in 1Q2010; remember occupancy rates are highest in Dubai in 1Q and 4Q). We estimate Dubai benefited in no small part from regional uncertainties, particularly as MENA tourism was re-routed from Bahrain and Egypt. Despite this, ADRs continued to decline slightly, down 3% YoY to AED 910.
Supply, demand and pricing trends
Tourism is expected to continue growing strongly in Dubai in coming years. The city’s target for FY2021 is 21 million tourists. In the more immediate future, we expect to see
• A strong increase in regional tourism, especially as some regional alternatives have become less attractive due to current events;
• Continuing strong growth in Asian tourism, driven by the continuing economic expansion in Asia and Dubai’s attractiveness as a shopping and leisure destination;
• Continued growth in European tourism, with Dubai again profiting from its safe haven regional status.
Against this background, supply is expected to continue growing.
Figure 14 Existing and additional hotel room supply
50,218 50,21853,600
58,842
3,882
4,882
4,090
0
10000
20000
30000
40000
50000
60000
70000
2010 2011 2012 2013
Existing supply Additional supply
Sources: JLL and NBK Capital Research
Tourism is one of Dubai’s great
success stories
Strong 1Q2011 occupancy
rates have benefited from
regional events

Real Estate & Construction – EmaarJuly 04, 2011
nbkcapi ta l .com | 28
In FY2010, 7,650 rooms were added in Dubai, mostly at the high end of the spectrum. We expect most of the new room supply to come in the high-end category, although we do expect to see continued development at the budget end as well.
All in all, we expect additional supply to be able to balance out additional demand in coming years, at least as far as occupancy rates are concerned. A level of 70% across the board therefore looks highly achievable to us, and this could even increase in the short term should regional events worsen.
As far as ADRs are concerned, we expect to see stability at the beach hotel and, with possibly some weakness at the city hotel end, given the strong increase in city hotel offerings in the recent past. Overall, however, the hospitality market in Dubai should show good resilience in the near future. We do not see much serious competition coming from regional competitors, given Dubai’s pre-eminence in retail and leisure offerings, as well as the emirate’s relatively liberal attitude.
the retail market
Again, this is one of the unqualified areas of success for Dubai, from an international perspective. Dubai has recently been ranked among the top-five retail destinations worldwide; according to CBRE, the city ranks second only to London in terms of presence of international retailers. The opening of Dubai Mall, at the time the largest retail mall in the world, has certainly helped, but whether Dubai can sustain such performances in the longer term remains to be seen.
Supply and demand
Following whopping additions in FY2008-2010, with mainly Dubai Mall and Dubai Marina Mall coming on stream, supply has stabilized. As of March 31, 2011, total gross leasable area (GLA) stood at 26.5 million sq. ft., with just 535 thousand sq. ft. added in 1Q2011. The current supply is heavily geared toward super-regional and regional malls, which represent 81% of the total GLA.
Refreshingly for Dubai, no major retailing additions are expected in the short to medium term. Total additions for FY2011 are expected to reach 1.3 million sq. ft. (source: Jones Lang Lasalle), but these will stem mainly from small malls and extension of existing large malls. Beyond this, total GLA is expected to stabilize at 27.8 million sq. ft., at least until FY2013.
At that stage, Phase 1 of the Mall of Arabia, with an added 3.8 million sq. ft. of GLA, is expected to come on stream. Beyond this, further phases of Mall of Arabia, which is expected to be even bigger than Dubai Mall, are planned. There are, however, major doubts as to whether this project will indeed happen. Construction on Mall of Arabia (and indeed on the entire surrounding City of Arabia, in Dubailand) has ground to a halt, and, up to now at least, showed no signs of re-starting. There is widespread consensus that Dubai at this point does not need another super-regional mall. The construction of such a big project could seriously destabilize the market. Older, smaller malls (e.g. Burjuman or Wafi) are already experiencing problems, and looking to re-define themselves. The next moves in the retail market are anticipated to be more toward enhancement of community malls, serving local residents rather than tourists. Our view is therefore that Mall of Arabia will in the end not happen. If that were to be the case, it would show a rare dose of realism in the Dubai real estate market.
Current vacancy rates in Dubai are estimated at 15-20%, although this covers widely diverging realities. Flagship mall occupancy rates top 90%, whilst older, smaller malls have significantly higher vacancy rates.
We expect to continue witnessing strong demand, driven by
• Continuing growth in tourism, particularly from the MENA region, South and East Asia;
• The continuing lack, within MENA, of a serious alternative offering;
• Continued support for Dubai as a top retail destination, through festivals and promotions;
• Strong regional economies.
Retail is another Dubai success
story
We expect no significant
additions to supply
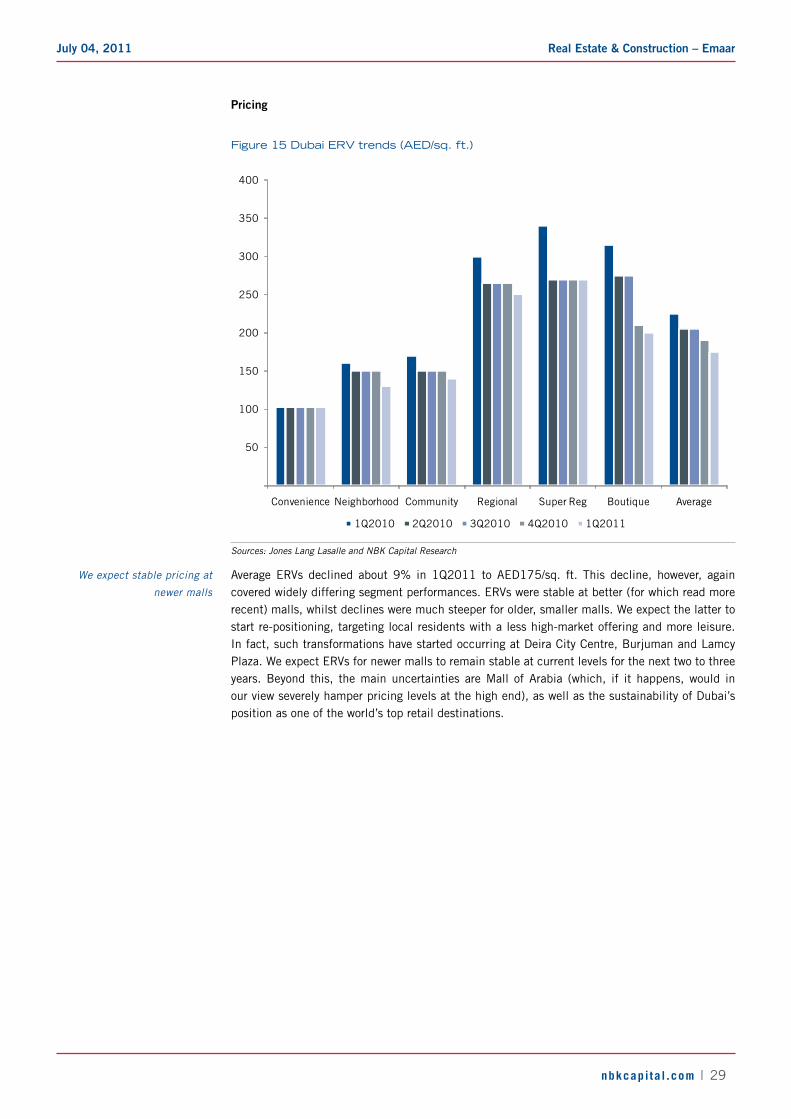
Real Estate & Construction – EmaarJuly 04, 2011
nbkcapi ta l .com | 29
Pricing
Figure 15 Dubai ERV trends (AED/sq. ft.)
50
100
150
200
250
300
350
400
Convenience Neighborhood Community Regional Super Reg Boutique Average
1Q2010 2Q2010 3Q2010 4Q2010 1Q2011
Sources: Jones Lang Lasalle and NBK Capital Research
Average ERVs declined about 9% in 1Q2011 to AED175/sq. ft. This decline, however, again covered widely differing segment performances. ERVs were stable at better (for which read more recent) malls, whilst declines were much steeper for older, smaller malls. We expect the latter to start re-positioning, targeting local residents with a less high-market offering and more leisure. In fact, such transformations have started occurring at Deira City Centre, Burjuman and Lamcy Plaza. We expect ERVs for newer malls to remain stable at current levels for the next two to three years. Beyond this, the main uncertainties are Mall of Arabia (which, if it happens, would in our view severely hamper pricing levels at the high end), as well as the sustainability of Dubai’s position as one of the world’s top retail destinations.
We expect stable pricing at
newer malls
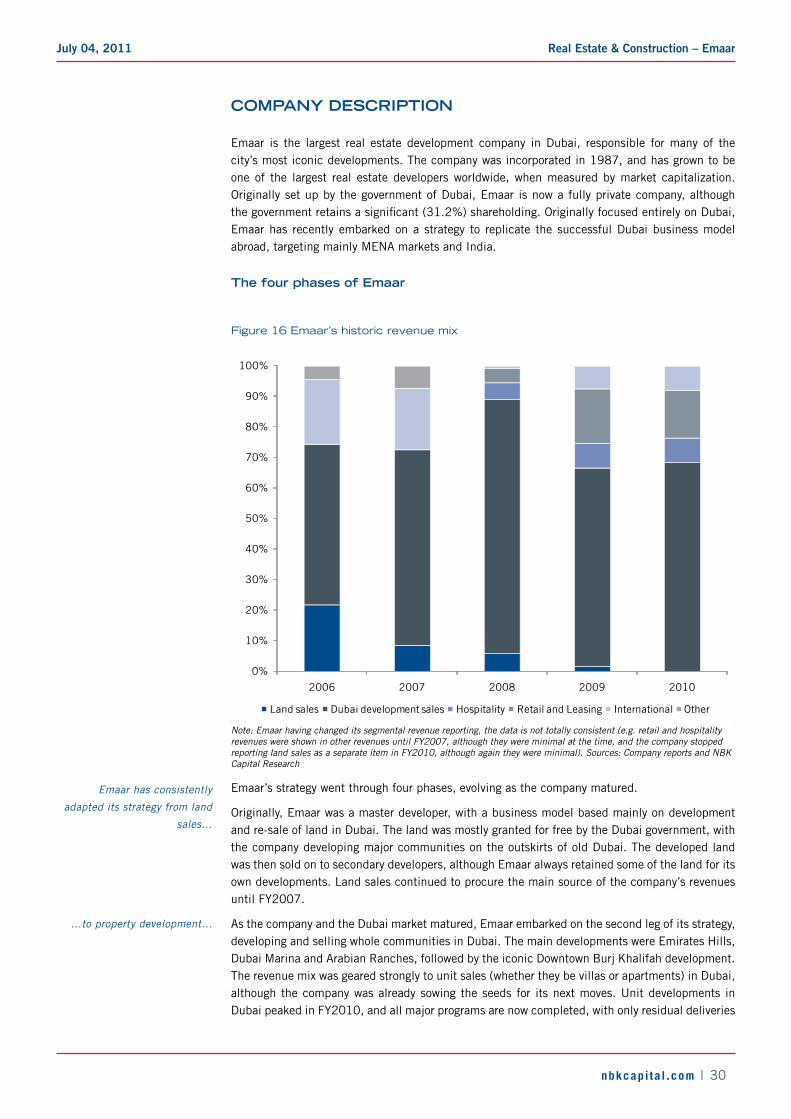
Real Estate & Construction – EmaarJuly 04, 2011
nbkcapi ta l .com | 30
coMPAny dEscRiPtion
Emaar is the largest real estate development company in Dubai, responsible for many of the city’s most iconic developments. The company was incorporated in 1987, and has grown to be one of the largest real estate developers worldwide, when measured by market capitalization. Originally set up by the government of Dubai, Emaar is now a fully private company, although the government retains a significant (31.2%) shareholding. Originally focused entirely on Dubai, Emaar has recently embarked on a strategy to replicate the successful Dubai business model abroad, targeting mainly MENA markets and India.
the four phases of Emaar
Figure 16 Emaar’s historic revenue mix
0%
10%
20%
30%
40%
50%
60%
70%
80%
90%
100%
2006 2007 2008 2009 2010
Land sales Dubai development sales Hospitality Retail and Leasing International Other
Note: Emaar having changed its segmental revenue reporting, the data is not totally consistent (e.g. retail and hospitality revenues were shown in other revenues until FY2007, although they were minimal at the time, and the company stopped reporting land sales as a separate item in FY2010, although again they were minimal). Sources: Company reports and NBK Capital Research
Emaar’s strategy went through four phases, evolving as the company matured.
Originally, Emaar was a master developer, with a business model based mainly on development and re-sale of land in Dubai. The land was mostly granted for free by the Dubai government, with the company developing major communities on the outskirts of old Dubai. The developed land was then sold on to secondary developers, although Emaar always retained some of the land for its own developments. Land sales continued to procure the main source of the company’s revenues until FY2007.
As the company and the Dubai market matured, Emaar embarked on the second leg of its strategy, developing and selling whole communities in Dubai. The main developments were Emirates Hills, Dubai Marina and Arabian Ranches, followed by the iconic Downtown Burj Khalifah development. The revenue mix was geared strongly to unit sales (whether they be villas or apartments) in Dubai, although the company was already sowing the seeds for its next moves. Unit developments in Dubai peaked in FY2010, and all major programs are now completed, with only residual deliveries
Emaar has consistently
adapted its strategy from land
sales…
…to property development…

Real Estate & Construction – EmaarJuly 04, 2011
nbkcapi ta l .com | 31
expected in the next three years, mainly in Downtown Burj Khalifah. It should be noted that other major developments that were planned for Dubai (mainly in Dubailand and around Dubai’s new Al Makhtoum Airport) have been either suspended or shelved, unsurprisingly given the evolution of the Dubai market in the recent past.
The third leg of Emaar’s strategic plan has been the development of a strong recurring revenue-generating asset base. This was done through developing the retail offering (with the major opening of Dubai Mall in FY2009, among others), as well as hospitality, centered on the Address (four Dubai hotels) and Armani brands. Significant revenue generation from this base started in FY2009, and, with the development activity in Dubai starting to tail off from FY2011 onwards, is expected to become a preponderant part of the company’s future revenues.
Finally, the fourth leg of Emaar’s strategy, currently in the development phase, is replicating the company’s successful Dubai strategy in foreign markets. In most markets, the company has skipped the first phase of its Dubai strategy (i.e. land development and sales) to move straight to developing real estate communities. The company also intends to replicate its establishing of recurring revenue-generating assets in most of its target markets, through both retail and hospitality. Emaar currently operates in 10 countries outside the UAE. Most of these are situated in the MENA region, although Emaar has also developed a strong presence in the Indian sub-continent and retains a residual presence in North America.
Current international sales have only come into significance starting FY2009, although at this point in time they are still only a small part of Emaar’s revenues (8% in FY2010). Before FY2008, international sales were almost entirely accounted for by Emaar’s ill-fated foray in the USA (see below).
It should be noted that Emaar has reined in some of its most ambitious expansion plans (such as China or Indonesia), following the deterioration of worldwide real estate markets. The company’s international expansion has not been all plain sailing, with a particularly ill-timed foray into the USA (where Emaar bought JL Homes in FY2007, pretty much at the top of the market, with the company ending up completely written-off in FY2009).
Emaar’s current projects
Emaar currently articulates around three main bases: recurring revenue assets, Dubai and international activities.
Recurring revenue assets
These are divided between hospitality and retail.
Hospitality
Emaar’s hospitality offering is currently situated entirely in Dubai and revolves around
• The Address: this is Emaar’s own hospitality operator. The Address currently operates four 5-star hotels, three around the Burj Khalifah in Downtown Dubai (The Address Downtown, the Palace and the Address Dubai Mall) and one in Dubai Marina. The small hotel adjoining the Montgomery Golf Course in Dubai is also operated by the Address. All are city hotels. Occupancy has been in excess of 80%, except at Dubai Marina. The company plans to use the Address brand for international extension, both within its own international developments, as well as stand-alone hotels.
• The Armani brand: currently one hotel in Downtown Dubai, in the Burj Khalifah Tower. This franchise is operated in conjunction with design house Giorgio Armani. Occupancy performances are not available due to confidentiality issues. Again, this brand will be developed internationally, with one hotel currently under construction in Milan.
…to recurring revenue assets
And this is ready to be
replicated internationally

Real Estate & Construction – EmaarJuly 04, 2011
nbkcapi ta l .com | 32
• Two externally managed hotels in Downtown Dubai (Al Manzil and Qamardeen), as well as the Nuran hotel-apartments in Emirates Living.
As we have noted in the valuation section above, Emaar’s hospitality offering is currently concentrated almost entirely in a one-mile radius within Downtown Burj Khalifah.
Retail
This is based mainly around the crown jewel, Dubai Mall. At the time of opening, Dubai Mall was the world’s largest retail mall (it has since been overtaken by at least one mall in China). With a GLA of 5.9 million sq. ft., Dubai Mall is the centerpiece of Dubai’s retail offering, a domain in which the city has so far excelled. Occupancy rate is more than 90% (although there have been some problems in selected parts of the mall), and footfall has been growing impressively since its opening.
The company also operates the Marina Mall in Dubai Marina. This is a smaller mall (GLA 3.65 million sq. ft.), targeting the local Dubai Marina community more than tourists (which are Dubai Mall’s main target). Unsurprisingly, both occupancy and footfall have been below those of Dubai Mall.
Emaar also owns two smaller malls in Souk al Bahar (a traditional-souk-styled mall adjacent to Dubai Mall, which appears to be struggling with its occupancy, unsurprisingly given its location), as well as the Gold & Diamond Park. This retail and fabrication mall is devoted to jewelry, and is Emaar’s oldest retail offering in Dubai.
Finally, the company also operates small community retail outlets within the residential communities it has developed in Dubai (e.g. Emirates Hills, Arabian Ranches and Dubai Marina).
Emaar plans to extend its retail offering internationally, within the residential communities it is developing. Immediate projects are in Egypt, Turkey and India. Retail will form an integral part of Emaar’s international development.
Dubai real estate
Emaar’s days as a Dubai developer are mostly behind it, as the company has almost completed its major developments in the city. As such, the current activity represents the fag-end of past developments.
The company will finish up its Arabian Ranches and Dubai Marina deliveries in FY2011, with a rump of residential for the former and commercial for the latter. Further deliveries, more significant in scope, are expected in Downtown Burj Khalifah, both in commercial and residential real estate, although the scope of these will be vastly smaller than the peaks attained in 2007-2010.
The remaining three projects are more doubtful:
• Umm al Quwain (UAQ) Marina: the company will deliver Phase 1 (277 units) in FY2011. There are more phases planned for this development, situated in the Northern Emirate of Umm al Quwain, about 50 kms north of Dubai. However, given the general state of the real estate market in the UAE, and UAQ’s slight remoteness, we are unsure as to whether this development will proceed beyond Phase 1, and if so, at what pace;
• L’Usailly: mainly residential, 4.5 million sq. m. development. The land is situated close to Dubai’s new Al Makhtoum Airport. Again, given the uncertainties surrounding the Dubai market and the delays in the full development of the new airport, the exact future of this project is uncertain. It is still in the master planning phase (after at least three years), and although we do think it will eventually be built, there is currently no visibility on the timing.
• Bawadi: this is land held in a 50-50 joint venture in Dubailand. Dubailand is (was?) to be the next major development in Dubai, away from the coastline. However, all development has pretty much stopped in Dubailand, and although there are rumors it will be restarted, we again

Real Estate & Construction – EmaarJuly 04, 2011
nbkcapi ta l .com | 33
have no visibility on this whatsoever. This is, in our view, the development least likely to take place.
Beyond this, we do not think that Emaar will engage in any major developments in Dubai in the medium to long term (although small, opportunistic developments remain a possibility). Previously-shelved major projects, some of which have announced they will re-start, involve almost entirely other state-owned developers, and we think Emaar’s strategy is now firmly fixed on international and revenue-generating assets.
International developments - wholly-owned operations
Egypt
Egypt represents Emaar’s largest wholly-owned international foray, with currently four main developments:
• Uptown Cairo: a 4.5 million sq. m. mixed-use development, comprising residential units, commercial space, retail and hospitality. Launched in 2008, it is expected to be completed by 2017.
• Marassi: a tourist development on Egypt’s Mediterranean coast, the project was launched 6.2 million sq. m.in 2007 and is expected to be completed by 2016.
• Mivida: a California-style, mixed-use development on the outskirts of Cairo, near the airport, this was launched in 2008 and is expected to be completed by 2020.
• Cairo Gate: a 670 thousand sq. m. development at the start of the Cairo to Alexandria road, this mixed-use development is currently in the master planning phase, and the launch date has yet to be specified.
Turkey
• Tuscan Valley: a 1.7 million sq. m. residential development on the European outskirts of Istanbul, this project was launched in 2007 and is expected to be completed by 2016.
• New Istanbul: a 66 thousand sq. m. mixed-use development situated on the Asian side of Istanbul, this project is currently still in the master planning phase, and is expected to launch in 2011.
Morocco
Potentially Emaar’s second-largest wholly-owned international activity, this comprises
• Tinja: a 72 thousand sq. m. mainly residential development, with some hospitality, this is situated close to Tangiers. It is the only development that has so far been launched (2007) and is expected be completed by 2018.
• Sapphira: situated in the capital city of Rabat, this is a 1.34 million sq. m. mixed-use development. Although the master plan appears to have been finalized, this development has yet to be launched.
• Oukmaden: in the Atlas mountain range close to Marrakech, this tourism development is in the master planning phase.
It should be noted that Emaar stated recently that some of these projects might be reviewed. All were undertaken under a memorandum of understanding (MoU) with the Moroccan government.

Real Estate & Construction – EmaarJuly 04, 2011
nbkcapi ta l .com | 34
North America
This mainly covers small, residential units under development in Canada, with currently only 43 units under development. There is also still a project in the USA, following the JL Homes venture, although development has been completed, and only minor residual sales are expected in 2011.
International operations - Non wholly-owned, but fully consolidated
Saudi Arabia
In addition to the major King Abdullah Economic City (KAEC) development (see associates below), Emaar has two main on-going projects in the Kingdom:
• Al Khobbar Lakes: a residential development near the city of Al Khobbar; the first two phases were launched (in 2008 for Phase 1), and the project is expected be completed by 2018.
• Jeddah Gate: located on the outskirts of Jeddah, this mixed-use development was launched in 2007 and will be completed by 2018.
• Emaar is also building one- to three-bedroom apartments on floors 30-53 of the Fairmont Hotel tower in the Holy City of Makkah.
Pakistan
• Crescent Bay: a mixed-use development on Defence Housing Authority land in Karachi (under a long-term lease), this was launched in 2008. Completion of the first residential towers is expected by 2012.
• Canyon Views: a residential development is Islamabad, this was launched in 2007 and is expected to be completed by 2015.
Lebanon
The Beit Mint, a 665 thousand sq.m. residential development to the North of Beirut, was launched in 2010 and is expected to be completed by 2018.
Morocco
Emaar launched one project around the Amelkis Golf Course in Marrakech in 2005. This was mainly based on land development, with customers allowed to design and build their own homes under certain specs. A second phase is apparently in the planning phase.
The company also launched Bahia Bay, a 5.3 million sq. m. residential community based between Rabat and Casablanca, to be completed by 2018.
Syria
Emaar has one project in Syria: Eighth Gate, a 300 thousand sq. m. development just off the Damascus city center. This mixed-use development includes the Damascus Stock Exchange, retail and office space as well as land offered for purpose-built residential units. The commercial part was mostly delivered in 1Q2011.

Real Estate & Construction – EmaarJuly 04, 2011
nbkcapi ta l .com | 35
Associates
Saudi Arabia
The King Abdullah Economic City (KAEC) project is one of the six Economic Cities currently under development in Saudi Arabia. These projects are entirely new cities, usually focused on an economic theme. KAEC is slated to become a major port and industrial city on the Red Sea coast, north of Jeddah. Emaar, through its 30.6%-held subsidiary Emaar the Economic City (listed on Tadawul), is one of the city’s main developers. The project has been mired in various delays, and both progress and expected completion are unclear.
India
Emaar’s biggest international venture to date is a 45/55 joint venture with local developer MGF. Emaar MGF is one of the leading developers in India, developing mainly mixed-use communities all over the country. Major achievements to date include the Commonwealth Games Village in Delhi. Emaar MGF’s land bank currently totals 495 million sq. ft. The company is currently developing nine major residential projects, as well as hospitality, retail and office space. Emaar MGF was due to list on the Indian stock exchange, with the listing first mooted in 2H2008. It is currently back on, although, given the uncertain environment surrounding Indian developers at the moment, the timing of the listing, if it is to happen at all, is unclear.
Jordan
Through the 29.3%-held Samarrah Dead Sea Development subsidiary, Emaar is developing a 1.8 million sq. m. residential project on the Dead Sea coast close to Amman. Construction started in 2008 and completion is expected by 2018.
Other activities
These are very small and include:
• Ancillary services: Emaar bought property agent Hamptons International in 2006, but in 2010 re-sold (at a loss) the non-MENA activities. The company also provides maintenance services through Emrill, building management services through its JV with Turner International and utility management through another JV. Finally, Emaar bought a Singapore-based school operator, but recently exited that business.
• Financial services: Emaar holds a stake in Dubai-based mortgage provider Amlak. The latter has been in severe financial difficulties since 2008 (the trading of its shares has been suspended since then). Following an aborted merger attempt with competitor Tamweel, Amlak’s future is unclear. Emaar also owned a stake in Dubai Bank, which it has announced will be written off entirely, as the company’s stake in Dubai Bank has fallen to 0 following the latter’s recapitalization. Finally, Emaar has a brokerage activity in Emaar Financial Services, although this is now all but dormant.
strategic review
A few weeks ago, Emaar announced it had hired strategic consultancy McKinsey to provide a full strategic review of the company’s international activities. McKinsey is to work in tandem with a specially set-up senior management committee. The exact scope and duration of this review are not entirely clear; however, following increasing rumors about Emaar’s various international developments, a radical restructuring of these operations cannot be excluded. One possibility would be a re-focus on what is emerging as Emaar’s future core activity, revenue-generating assets. Exiting selected countries (here again, India comes to mind) is also a possibility. We would stress, however, that there is no visibility at this time on the outcome of this review.
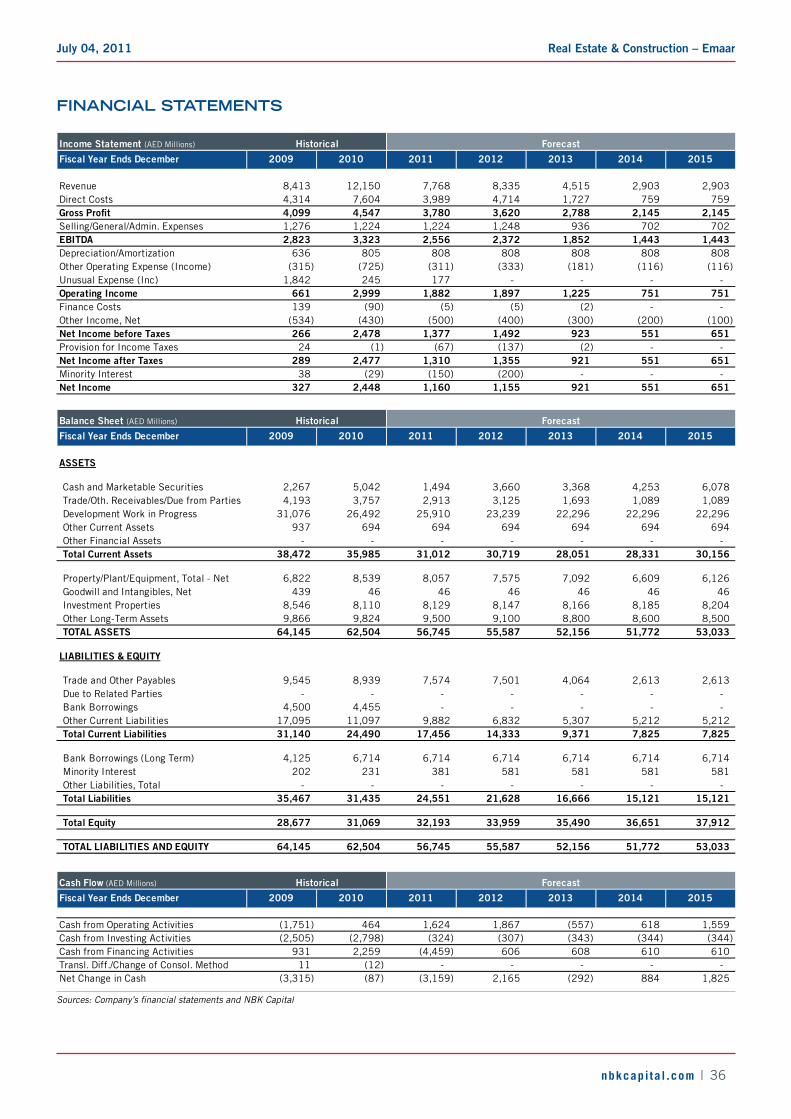
Real Estate & Construction – EmaarJuly 04, 2011
nbkcapi ta l .com | 36
finAnciAl stAtEMEnts
Income Statement (AED Millions)
Fiscal Year Ends December 2009 2010 2011 2012 2013 2014 2015
Revenue 8,413 12,150 7,768 8,335 4,515 2,903 2,903 Direct Costs 4,314 7,604 3,989 4,714 1,727 759 759 Gross Profit 4,099 4,547 3,780 3,620 2,788 2,145 2,145 Selling/General/Admin. Expenses 1,276 1,224 1,224 1,248 936 702 702 EBITDA 2,823 3,323 2,556 2,372 1,852 1,443 1,443 Depreciation/Amortization 636 805 808 808 808 808 808 Other Operating Expense (Income) (315) (725) (311) (333) (181) (116) (116) Unusual Expense (Inc) 1,842 245 177 - - - - Operating Income 661 2,999 1,882 1,897 1,225 751 751 Finance Costs 139 (90) (5) (5) (2) - - Other Income, Net (534) (430) (500) (400) (300) (200) (100) Net Income before Taxes 266 2,478 1,377 1,492 923 551 651 Provision for Income Taxes 24 (1) (67) (137) (2) - - Net Income after Taxes 289 2,477 1,310 1,355 921 551 651 Minority Interest 38 (29) (150) (200) - - - Net Income 327 2,448 1,160 1,155 921 551 651
Historical Forecast
Balance Sheet (AED Millions)
Fiscal Year Ends December 2009 2010 2011 2012 2013 2014 2015
ASSETS
Cash and Marketable Securities 2,267 5,042 1,494 3,660 3,368 4,253 6,078 Trade/Oth. Receivables/Due from Parties 4,193 3,757 2,913 3,125 1,693 1,089 1,089 Development Work in Progress 31,076 26,492 25,910 23,239 22,296 22,296 22,296 Other Current Assets 937 694 694 694 694 694 694 Other Financial Assets - - - - - - - Total Current Assets 38,472 35,985 31,012 30,719 28,051 28,331 30,156
Property/Plant/Equipment, Total - Net 6,822 8,539 8,057 7,575 7,092 6,609 6,126 Goodwill and Intangibles, Net 439 46 46 46 46 46 46 Investment Properties 8,546 8,110 8,129 8,147 8,166 8,185 8,204 Other Long-Term Assets 9,866 9,824 9,500 9,100 8,800 8,600 8,500 TOTAL ASSETS 64,145 62,504 56,745 55,587 52,156 51,772 53,033
LIABILITIES & EQUITY
Trade and Other Payables 9,545 8,939 7,574 7,501 4,064 2,613 2,613 Due to Related Parties - - - - - - - Bank Borrowings 4,500 4,455 - - - - - Other Current Liabilities 17,095 11,097 9,882 6,832 5,307 5,212 5,212 Total Current Liabilities 31,140 24,490 17,456 14,333 9,371 7,825 7,825
Bank Borrowings (Long Term) 4,125 6,714 6,714 6,714 6,714 6,714 6,714 Minority Interest 202 231 381 581 581 581 581 Other Liabilities, Total - - - - - - - Total Liabilities 35,467 31,435 24,551 21,628 16,666 15,121 15,121
Total Equity 28,677 31,069 32,193 33,959 35,490 36,651 37,912
TOTAL LIABILITIES AND EQUITY 64,145 62,504 56,745 55,587 52,156 51,772 53,033
Historical Forecast
Cash Flow (AED Millions)
Fiscal Year Ends December 2009 2010 2011 2012 2013 2014 2015
Cash from Operating Activities (1,751) 464 1,624 1,867 (557) 618 1,559 Cash from Investing Activities (2,505) (2,798) (324) (307) (343) (344) (344) Cash from Financing Activities 931 2,259 (4,459) 606 608 610 610 Transl. Diff./Change of Consol. Method 11 (12) - - - - - Net Change in Cash (3,315) (87) (3,159) 2,165 (292) 884 1,825
Historical Forecast
Sources: Company’s financial statements and NBK Capital

Real Estate & Construction – EmaarJuly 04, 2011
nbkcapi ta l .com | 37
Risk And REcoMMEndAtion guidE
REcoMMEndAtion uPsidE (downsidE) PotEntiAl
BUY MORE THAN 20%
ACCUMULATE BETWEEN 5% AND 20%
HOLD BETWEEN -10% AND 5%
REDUCE BETWEEN -25% AND -10%
SELL LESS THAN -25%
Risk lEVEl
low Risk HigH Risk
1 2 3 4 5
disclAiMER
The information, opinions, tools, and materials contained in this report (the “Content”) are not addressed to, or intended for publication, distribution to, or use by, any individual or legal entity who is a citizen or resident of or domiciled in any jurisdiction where such distribution, publication, availability, or use would constitute a breach of the laws or regulations of such jurisdiction or that would require Watani Investment Company KSCC (“NBK Capital”) or its subsidiaries or its affiliates to obtain licenses, approvals, or permissions from the regulatory bodies or authorities of such jurisdiction. The Content, unless expressly mentioned otherwise, is under copyright to NBK Capital. Neither the Content nor any copy of it may be in any way reproduced, amended, transmitted to, copied, or distributed to any other party without the prior express written consent of NBK Capital. All trademarks, service marks, and logos used in this report are trademarks or service marks or registered trademarks or registered service marks of NBK Capital.
The Content is provided to you for information purposes only and is not to be used, construed, or considered as an offer or the solicitation of an offer to sell or to buy or to subscribe for any investment (including but not limited to securities or other financial instruments). No representation or warranty, express or implied, is given by NBK Capital or any of its respective directors, partners, officers, affiliates, employees, advisors, or representatives that the investment referred to in this report is suitable for you or for any particular investor. Receiving this report shall not mean or be interpreted that NBK Capital will treat you as its customer. If you are in doubt about such investment, we recommend that you consult an independent investment advisor since the investment contained or referred to in this report may not be suitable for you and NBK Capital makes no representation or warranty in this respect.
The Content shall not be considered investment, legal, accounting, or tax advice or a representation that any investment or strategy is suitable or appropriate for your individual circumstances or otherwise constitutes a personal recommendation to you. NBK Capital does not offer advice on the tax consequences of investments, and you are advised to contact an independent tax adviser.
The information and opinions contained in this report have been obtained or derived from sources that NBK Capital believes are reliable without being independently verified as to their accuracy or completeness. NBK Capital believes the information and opinions expressed in this report are accurate and complete; however, NBK Capital gives no representations or warranty, express or implied, as to the accuracy or completeness of the Content. Additional information may be available upon request. NBK Capital accepts no liability for any direct, indirect, or consequential loss arising from the use of the Content. This report is not to be relied upon as a substitution for the exercise of independent judgment. In addition, NBK Capital may have issued, and may in the future issue, other reports that are inconsistent with and reach different conclusions from the information presented in this report. Those reports reflect the different assumptions, views, and analytical methods of the analysts who prepared the reports, and NBK Capital is under no obligation to ensure that such other reports are brought to your attention. NBK Capital may be involved in many businesses that relate to companies mentioned in this report and may engage with them. Past performance should not be taken as an indication or guarantee of future performance, and no representation or warranty, express or implied, is made regarding future performance. Information, opinions, and estimates contained in this report reflect a judgment at the report’s original date of publication by NBK Capital and are subject to change without notice.
The value of any investment or income may fall as well as rise, and you may not get back the full amount invested. Where an investment is denominated in a currency other than the local currency of the recipient of the research report, changes in the exchange rates may have an adverse effect on the value, price, or income of that investment. In the case of investments for which there is no recognized market, it may be difficult for investors to sell their investments or to obtain reliable information about their value or the extent of the risk to which they are exposed.
NBK Capital has not reviewed the addresses of, the hyperlinks to, or the websites referred to in the report and takes no responsibility for the content contained therein. Such address or hyperlink (including addresses or hyperlinks to NBK Capital’s own website material) is provided solely for your convenience and information, and the content of the linked site does not in any way form part of this document. Accessing such websites or following such links through this report or NBK Capital’s website shall be at your own risk.
© coPyRigHt noticE
This is a publication of NBK Capital. No part of this publication may be reproduced or duplicated without the prior consent of NBK Capital.

Real Estate & Construction – EmaarJuly 04, 2011
nbkcapi ta l .com | 38
Kuwait
National Bank of Kuwait SAKAbdullah Al-Ahmed StreetP.O. Box 95, Safat 13001Kuwait City, KuwaitT. +965 2242 2011F. +965 2243 1888Telex: 22043-22451 NATBANK
intERnAtionAl nEtwoRk
Bahrain
National Bank of Kuwait SAKBahrain BranchSeef Tower, Al-Seef DistrictP.O. Box 5290, Manama, BahrainT. +973 17 583 333F. +973 17 587 111
Saudi Arabia
National Bank of Kuwait SAKJeddah BranchAl-Andalus Street, Red Sea PlazaP.O. Box 15385Jeddah 21444, Saudi ArabiaT. +966 2 653 8600F. +966 2 653 8653
United Arab Emirates
National Bank of Kuwait SAKDubai BranchSheikh Rashed Road, Port Saeed Area, ACICO Business ParkP.O. Box 88867, DubaiUnited Arab EmiratesT. +971 4 2929 222F. +971 4 2943 337
Jordan
National Bank of Kuwait SAKHead OfficeAl Hajj Mohd Abdul Rahim StreetHijazi Plaza, Building # 70P.O.Box 941297,Amman -11194, JordanT. +962 6 580 0400F. +962 6 580 0441
Lebanon
National Bank of Kuwait(Lebanon) SALSanayeh Head OfficeBAC Building, Justinian StreetP.O. Box 11-5727, Riyad El Solh1107 2200 Beirut, LebanonT. +961 1 759 700F. +961 1 747 866
Iraq
Credit Bank of IraqStreet 9, Building 187Sadoon Street, District 102P.O.Box 3420, Baghdad, IraqT. +964 1 7182198/7191944 +964 1 7188406/7171673F. +964 1 7170156
Egypt
Al Watany Bank of Egypt13 Al Themar StreetGameat Al Dowal AlArabiaFouad Mohie El Din SquareMohandessin, Giza, EgyptT. +202 333 888 16/17F. +202 333 79302
United States of America
National Bank of Kuwait SAKNew York Branch299 Park Avenue, 17th FloorNew York, NY 10171, USAT. +1 212 303 9800F. +1 212 319 8269
United Kingdom
National Bank of Kuwait (Intl.) PlcHead Office13 George Street,London W1U 3QJ, UKT. +44 20 7224 2277F. +44 20 7224 2101
NBK InvestmentManagement Limited13 George StreetLondon W1U 3QJ, UKT. +44 20 7224 2288F. +44 20 7224 2102
France
National Bank of Kuwait (Intl.) PlcParis Branch90 Avenue des Champs-Elysees75008 Paris, FranceT. +33 1 5659 8600F. +33 1 5659 8623
Singapore
National Bank of Kuwait SAKSingapore Branch9 Raffles Place #51-01/02Republic Plaza, Singapore 048619T. +65 6222 5348F. +65 6224 5438
Vietnam
National Bank of Kuwait SAKVietnam Representative OfficeRoom 2006, Sun Wah Tower115 Nguyen Hue Blvd, District 1Ho Chi Minh City, VietnamT. +84 8 3827 8008F. +84 8 3827 8009
China
National Bank of Kuwait SAKShanghai Representative OfficeSuite 1003, 10th Floor,Azia Center, 1233 Lujiazui Ring Rd.Shanghai 200120, ChinaT. +86 21 6888 1092F. +86 21 5047 1011
AssociAtEs
Qatar
International Bank of Qatar (QSC)Suhaim bin Hamad StreetP.O.Box 2001Doha, QatarT. +974 447 3700F. +974 447 3710
Turkey
Turkish BankHead OfficeValikonagl Avenue No. 1P.O.Box 34371 Nisantasi,Istanbul, TurkeyT. +90 212 373 6373F. +90 212 225 0353
nAtionAl bAnk of kuwAit
Kuwait
Head Office38th Floor, Arraya IIAl Shuhada Street, Block 6, SharqP.O.Box 4950, Safat 13050KuwaitT. +965 2224 6900F. +965 2224 6905
MENA Research35th Floor, Arraya IIAl Shuhada Street, Block 6, SharqP.O.Box 4950, Safat 13050, KuwaitT. +965 2224 6663F. +965 2224 6905E. [email protected]
Brokerage37th Floor, Arraya IIAl Shuhada Street, Block 6, SharqP.O.Box 4950, Safat 13050, KuwaitT. +965 2224 6964F. +965 2224 6978E. [email protected]
United Arab Emirates
NBK Capital LimitedPrecinct Building 3, Office 404Dubai International Financial CenterP.O.Box 506506Dubai, UAET. +971 4 365 2800F. +971 4 365 2805
Turkey
NBK CapitalArastima ve Musavirlik AS,Sun Plaza, 30th Floor,Dereboyu Sk. No.24Maslak 34398, Istanbul, TurkeyT. +90 212 276 5400F. +90 212 276 5401
nbk cAPitAl

KUWAIT DUBAI ISTANBUL CAIRO