nchrp web document 57 (project 11-7): development and
TRANSCRIPT

NCHRP Web Document 57 (Project 11-7): Contractor’s Final Report
Development and Evaluation of a
National Data-Management System for Highway Tort Claims
Prepared for: National Cooperative Highway Research Program
Submitted by: Michael E. Kerchensky
Gary L. Gittings The Pennsylvania Transportation Institute
The Pennsylvania State University University Park, Pennsylvania
And
Luther J. McNeal
MRC Squared Raleigh, North Carolina
August 2003

ACKNOWLEDGMENT This work was sponsored by the American Association of State Highway and Transportation Officials (AASHTO), in cooperation with the Federal Highway Administration, and was conducted in the National Cooperative Highway Research Program (NCHRP), which is administered by the Transportation Research Board (TRB) of the National Academies.
DISCLAIMER The opinion and conclusions expressed or implied in the report are those of the research agency. They are not necessarily those of the TRB, the National Research Council, AASHTO, or the U.S. Government. This report has not been edited by TRB.

CONTENTS
Page
ABSTRACT ................................................................................................................................. 1
SUMMARY OF FINDINGS ........................................................................................................ 2
CHAPTER 1: INTRODUCTION AND IMPLEMENTATION APPROACH ........................... 6
BACKGROUND .............................................................................................................. 6
PHASE I: INTERIM REPORT REVIEW....................................................................... 7
PHASE II: PROBLEM STATEMENT, RESEARCH OBJECTIVES, AND
WORK SCOPE..........................................................................................................13
CHAPTER 2: FINDINGS............................................................................................................21
PILOT STATE SURVEY RESULTS ..............................................................................22
MODEL SYSTEM DESIGN AND CONSTRUCTION ..................................................32
CHAPTER 3: APPRAISAL AND APPLICATION....................................................................39
GENERAL SUMMARY ..................................................................................................39
CHAPTER 4: CONCLUSIONS AND RECOMMENDATIONS...............................................49
CONCLUSIONS...............................................................................................................49
RECOMMENDATIONS..................................................................................................52
REFERENCES .............................................................................................................................62
APPENDIX A: CORE DATA ELEMENTS FOR THE MODEL SYSTEM..............................63
APPENDIX B: SAMPLE GROUPINGS FOR STATE SOLICITATION PROCESS...............72
APPENDIX C: STATE SURVEY LETTERS AND INTERVIEW RESULTS .........................73
APPENDIX D: MRC SQUARED DELIVERABLE REPORT ON DATA ANALYSIS
AND DATABASE DESIGN............................................................................................92
1
ABSTRACT
This report presents the findings of a project conducted to investigate the feasibility of an
automated national data-management system for collecting and disseminating highway
tort claims information. Data items from the American Association of State Highway and
Transportation Officials (AASHTO) Survey on the Status of Sovereign Immunity in the
States were selected for the basis of design and construction of the core data elements
within the model system. Five pilot states were selected to provide a representative
sample of tort claims processing systems in use on a national level.
The findings suggest that a national tort data-management system could be technically
feasible if the following conditions can be met: (1) appropriate time, state personnel
involvement, and access permission to perform a full data audit and assessment on states’
internal information systems; (2) changes to the state systems to include data items not
being recorded, a standard identification code for tracking case information throughout
departments and agencies, and internal initiatives to improve the data entry process
within their own systems; (3) begin with a dynamic data standard designed to become
more unified and common through an evolutionary process; (4) utilize a single contract
agency to perform the data audit and information system assessment and to design and
develop the national data-management system; and (5) commitments of financial
resources by participating state departments of transportation.

2
SUMMARY OF FINDINGS
The purpose of this project was to assess the feasibility of a national data-management
system for information on highway tort claims and lawsuits filed against state departments of
transportation. A principal objective of the feasibility methodology was to develop a model
data-management system that would offer state departments of transportation a secure method
for collecting and manipulating highway tort claims1 information and related statistics, a method
of data processing that does not cause an undue burden on state employees, and a method of
reporting or displaying current information about highway tort claims in a statistical platform.
The model system was not to create and use a fixed, uniform data standard to which all states
would report; most states expressing a willingness to participate in a national system indicated
that their willingness was predicated on not having to significantly modify internal systems or
enter data and information multiple times. Thus, requirements for the model data-management
system included: compatibility with multiple software and hardware platforms used by the
states, capability of processing dissimilar data items supplied by the states, ability to
accommodate multiple formats of exported data, and cost-effectiveness of implementation and
maintenance on a national level.
The work scope called for three basic areas of development: the selection of a specific set
of data items from the AASHTO Survey on the Status of Sovereign Immunity in the States
(AASHTO, 1992) to be used in creating the core data elements for the model system; the on-site
survey and assessment process of tort claims information systems in five states participating in
the model system development; and the construction of a model data-management system that
provides state personnel with a mechanism to enter and retrieve the desired information.
Selection of the data elements to serve as the foundation of the model data-management
system began with a series of on-site state interviews and mailed questionnaires covering the
original AASHTO survey questions. The data content selected for this project is representative
1 Unless otherwise specified, for the remainder of the report, the term “claims” will be used to include both pre-litigation tort actions and torts in litigation.

3
of the needs of legal and risk-management departments expressed in the interviews and
responses to the questionnaire.
The states’ internal data varied greatly in terminology (reference and label), type, amount
of data, consistency of data entry, and timeliness that information was being entered into the
system. Although the establishment of a fixed, uniform data standard was not an objective of this
project, the creation of a uniform standard reporting coding for tort claims information can begin
with the pool of data items obtained during this project to form a dynamic data pool that can
become more unified and fixed over time. However, a more in-depth analysis of the states’ data
and investigation into the usage of terminology is required.
The intent of the five state on-site visits was to review and assess tort claim and risk
management-related information systems for content and data structures, data export and transfer
capabilities, and degree and means of data sharing between departments and agencies. The
planned outcomes from these reviews were the identification of relevant data fields, data
definitions, and the technical means by which data could be exported and transferred to the
model system.
These outcomes were completely met in some states but only partially achieved in others.
The principal constraint in the latter was that state personnel could not precisely define the
content of data fields. In one case, proprietary software was being used and state personnel did
not have sufficient knowledge to access the data field definitions. In another state, accessing the
data field definitions required a third-party contractor that controls the state’s data.
Unfortunately, the contractor’s fees were prohibitively expensive. As a consequence, the
research team, assisted by state personnel, attempted to select the desired data by field label
rather than by field definition. Subsequent analysis of the exported data records indicated that
data field labels vary from state to state. Furthermore, all states have some degree of
unpopulated data fields and in some cases the lack of data in the field is extensive. For these
reasons, the data exported from the state systems did not directly support the output
requirements. In addition, it became apparent that the 3 days given to conduct each site survey
proved to be insufficient to fully identify and verify the data sources and content within each
state’s system.

4
The ability to construct a fully automated data input and retrieval process was restricted
by department policies that prohibited a direct network connection. These policies are intended
to protect the states’ computer systems from accidental introduction of potentially damaging
foreign programs as well as unauthorized intrusion into the systems’ secure segments.
Therefore, the data export process developed for the model system by necessity uses less
automated removable media or FTP transfer, which require slightly more time and effort on the
part of states’ technical staff. A web-based interface was created for entering aggregate data
directly from departmental staff on a yearly basis. This interface was created to offer a means of
entering information that could not be calculated directly from the data retrieved from a state’s
information systems, and also to offer states that still use paper-based information systems a
means of using the model system. The web-based interface will require an encrypted data
transfer mechanism known as VPN (Virtual Private Network), which is readily available and
easily implemented. However, the cost of implementing this level of security was beyond the
project budget. The data entry forms were secured from non-authorized access through the use of
a user account and associated password to gain access to the website.
The model system was constructed with “off-the-shelf” products that offer scalability,
maximum hardware utilization, and ease of management by a minimal compliment of staff. The
following three readily available products were used in this project. The Microsoft Visual Foxpro
relational database program provided efficiency, versatility, speed (Rushmore Engine), and
scalability. The Macromedia Cold Fusion 4.5 Server and Studio package provided a web
application development platform that is scalable, compatible with other web platforms,
integrated with a majority of database programs, and offering a development and administration
environment that requires less technical and human resources than the Microsoft platform. The
Dell Power Edge 2400 is a mid-range computer-server that provided adequate upgrade capability
in both processor and memory and enough hard drive space to serve the potential needs of this
project with the possibility of transitioning to a national implementation of the data-management
system. The operating system was upgraded to a Microsoft Windows 2000 Server for its
increased stability, enhanced security features, and potential for integrating a Virtual Private
Network connection through encrypted transmission.
5
The system required a component for entering aggregate data and component(s) for
searching and displaying the stored tort claims information in a format similar to that of the
AASHTO Survey on the Status of Sovereign Immunity in the States (AASHTO, 1992). A simple
and familiar interface was created to enable state personnel to enter aggregate information into
the system and pull information on tort claims and other related topics. The original construct
called for a somewhat more versatile interface that permitted users to perform more complex
searches and create dynamic reports; however, redesign of the data tables to overcome the
technical issues encountered with the software program has limited this level of functionality in
the model system. The project research team attempted to create the same functionality through
the web application software, but development became program intensive, and again time and
cost became an issue. The research team had to settle on the basic reporting formats similar to
those found in the AASHTO report.
Phase II: Construction of the Model Data-Management System for Highway Tort Claims
has concluded with the completion of these primary objectives: a method of collecting highway
tort claims and related information, a method of data retrieval that does not cause excessive
burden to departmental staff, and a method of reporting on the collected information. The
secondary objectives of creating an “automated” data retrieval process, a uniform standard
coding structure, a fully capable search component, a mechanism for creating presentation-
quality reports, and the highway deficiency component were not realized in this project. The
feasibility of implementing a national data-management system depends on the ability to
optimize the primary objectives and overcome the obstacles encountered with pursuing the
secondary objectives. Administrative concerns, departmental policy restrictions, and technical
implementation issues further hinder the ability to overcome the secondary objectives. The
individual state’s administrative and policy issues are the most restrictive and require motivation
and commitment from the state departments of transportation to be resolved. The technical issues
are not difficult to resolve, but the necessary time and financial resources from state DOTs must
be available to effectively implement such a system. It would be important to have a number of
state DOTs participate in a system not only for the financing of the system, but also to have data
from enough states to make the system useful.

6
CHAPTER ONE
INTRODUCTION AND IMPLEMENTATION APPROACH
BACKGROUND
Prior to the 1960s, the doctrine of sovereign immunity precluded governmental liability for
damages in most states unless the government consented, generally through statute, to suit. Between the
mid-1960s and late 1970s, numerous legal challenges to the doctrine eroded its liability protection in
many states. During and after this period, states experienced a dramatic increase in state tort claim and
lawsuit activity, particularly from injuries associated with highway-related incidents. By 1991,
AASHTO estimated that annual state payments made in settlements or judgments for highway tort-
related incidents were between $135 million and $345 million. The range on such estimates was
necessarily broad, for there was not a reporting system for highway tort claims to which all or even a
large majority of states regularly responded.
During the 1980s risk management programs were implemented by departments of general
administration in many states to combat the rising cost of tort liability. These programs assumed
administrative responsibility for tort claims and created electronic databases to assist in their
management. These database systems served the needs of the overall state claims administration but
lacked the components and versatility to assist either DOT risk management and legal divisions or
Offices of Attorney General in meeting their departmental needs. In response, some DOT and Attorney
General offices created internal database systems to assist in their risk reduction efforts. This trend
resulted in numerous segregated and disjointed pools of tort claims and risk management information
that was neither congruent nor consistent within the states, nor between the states.
An initiative in the mid-1970s by the AASHTO Administrative Subcommittee on Legal Affairs
resulted in the Survey on the Status of Sovereign Immunity in the States (AASHTO, 1992). The first
survey was conducted in 1977 and requested approximately 80 data elements that focused on sovereign
immunity status, legislative policy, claims and lawsuit statistics, and insurance liability policy. By 1992,
the survey grew to more than 400 data elements, but on many elements the response rates was sporadic,
in some cases below 50% of the states. In addition, the validity and reliability of the information being

7
returned in the late 1980s was highly suspect due to terminology differences and internal
inconsistencies. Declining survey responses and an increasing need for information that would provide
a national perspective on tort claims in relation to eroding sovereign immunity sparked interest in
research to explore the feasibility of a national tort data-management system. NCHRP sponsored
Project 11-7 for this purpose; this report presents the findings and recommendations of that research.
PHASE I: INTERIM REPORT REVIEW
The Interim Report (Gittings, 1999) from Phase I provided an overview of the computer
technologies and tort claims information systems for the legal and risk management departments of 40
states. A policy needs assessment determined the most critical tort and risk-management information for
public policy making and highlighted many administrative concerns and technical obstacles to
implementing a model data-management system.
The Interim Report revealed a wide variety of computer hardware, desktop and network
operating systems, and database software being used to manage and store tort claim and related
information. A small number of states reported the use of paper-based systems to manage their
information. A majority of the systems are intradepartmental and have no link to systems in other
departments for information sharing. The systems are primarily used for claim/lawsuit administration,
monitoring trends, and evaluating program or legislative initiatives. Another less-utilized application of
the information included a means to determine premiums based on loss history, analysis for funding to
risk-transfer mechanisms, and the generation of management reports. Overall, state employees rated the
systems above average for accuracy and timeliness and below average for accessibility.
The administrative concerns for pooling tort claims information into a national data-management
system focused primarily on security and risk exposure. The cost and effort to participate in the project
were given as secondary concerns. The technical concerns focused primarily on the diversity of
computer hardware and database software, network and data security, and the ability to export data in a
format compatible to the model system.

8
The data content of the systems varied greatly from state to state and between departments
within the states. The differences in data content between the states and internal departments were most
significant for variations in definition and terminology used to classify data items.
In Phase I, a select list of questions derived from the AASHTO Survey on the Status of
Sovereign Immunity in the States (AASHTO, 1992) was used to determine what highway tort-related
information states would find useful from other states, and how much of this information they would be
willing to share with other states through a data-management system. This survey produced 34 data
items, similar to those in the 1992 AASHTO survey, that were ranked by interest by the respondents.
Tables 1.1 and 1.2 provide a breakdown of the results for this survey.
The data items from this list fell within these nine basic data categories:
• Risk management training and legal defense training material;
• Contractor indemnification information;
• Risk management office organization;
• Types of alleged highway deficiencies;
• Claim and lawsuit statistics;
• Resources for claims administration and lawsuit defense;
• Liability insurance information;
• Sovereign immunity-related information; and
• Claim/lawsuit procedures.
Of the nine categories, risk management training and “legal defense” training received the
highest ranking. The following items received special interest by the survey respondents:
• Expert witness information (e.g., name, expertise, prior testimony);
• Citations for precedent-setting case law;
• Existence of training programs for tort liability/risk management, specifics on training
programs, and any materials used for these trainings; and
• List of state contacts for tort liability/risk management training.

9
Table 1.1: Responses Regarding the Priority of Each Category of Information From Other States
Item Description
Average Response
No. of
Responses1
Percent Indicating High, Very High or Moderate Priority
1. Sovereign Immunity
a. Sovereign immunity statutes 2.94 36 55.56%
b. Type of limitations on immunity 3.42 36 86.11%
2. Claims/Lawsuit Procedures
a. Types of tribunals available for deciding claims 2.72 36 58.33% b. Whether jury trials are allowed
2.44
36
52.78%
c. Details on venue restrictions
2.36
36
44.44%
d. Funding resources for settlement payments
2.94
36
66.67%
3. Claim and Lawsuit Statistics
a. Number of claims filed annually
3.50
36
91.67%
b. Dollar value of claims filed annually
3.42
36
77.78%
c. Number of claims pending (open)
3.22
36
80.56%
d. Dollar value of claims pending (open)
3.17
36
77.78%
e. Number of claims disposed
3.42
36
86.11%
f. Dollar value of claims disposed
3.50
36
86.11%
g. Separate statistics on lawsuits disposed by settlement from lawsuits disposed by judgment
3.56
36
91.67%
4. Types of Alleged Highway Deficiencies
a. Major highway deficiencies by number of claims
3.66
35
94.29%
b. Major highway deficiencies by dollar value
3.68
34
94.12%
c. Major highway deficiencies by severity of injuries associated with each deficiency
3.65
34
91.18%
1Does not include those who indicated that they were uncertain about a given item.

10
Table 1.1: Responses Regarding the Priority of Each Category of Information From Other States (Continued)
Item Description
Average Response
No. of
Responses1
Percent Indicating High, Very High or Moderate Priority
5. Resources for Claims Administration and Lawsuit Defense
a. Annual expenditures on claims/lawsuit defense 3.60 35 94.29% b. Annual defense expenditures by cost category
3.47
34
85.29%
c. Number of attorneys 3.14 36 80.56% d. Number of attorneys by type 3.14 36 80.56% e. Details of cost, experience, etc., by attorney type
3.40
35
85.71%
6. Contractor Indemnification a. Details of third party tort liability
3.75
36
91.67%
7. Risk Management Office and Liability Insurance
a. Whether states have a formal risk management office
3.69
35
88.57%
b. Details about formal risk management offices
3.80
35
94.29%
c. Whether states carry liability insurance for highway claims
3.28
36
80.56%
d. Details on liability insurance coverage
3.24
34
82.35%
e. Whether self-insured state carries fully funded reserves
3.20
35
77.14%
8. Training in Risk Management and Tort Liability
a. Whether states have training for tort liability
3.86
35
100.00%
b. Details on tort liability programs
4.00
35
100.00%
c. List of materials used for tort liability training
4.03
35
100.00%
d. Points of contact for tort liability
3.94
35
100.00%
9. Miscellaneous
a. Information on expert witnesses
4.06
35
97.14%
b. Citations for precedent setting case law
4.00
34
100.00%
c. Average Time for disposition of lawsuit
3.06
35
80.00%
1Does not include those who indicated that they were uncertain about a given item.

11
Table 1.2: Priority of Each Category of Information From Other States in Order of Highest Average Response
Item Description
Average Response
No. of
Responses1
Percent Indicating High, Very High or Moderate Priority
Information on expert witnesses 4.06 35 97.14%
List of materials used for tort liability training 4.03 35 100.00%
Citations for precedent setting case law 4.00 34 100.00%
Details on tort liability programs 4.00 35 100.00%
Points of contact for tort liability 3.94 35 100.00%
Whether states have training for tort liability 3.86 35 100.00%
Details about formal risk management offices 3.80 35 94.29%
Major highway deficiencies by dollar value 3.68 34 94.12%
Major highway deficiencies by number of claims 3.66 35 94.29%
Major highway deficiencies by severity of injuries associated with each deficiency
3.65 34 91.18%
Annual expenditures on claims/lawsuit defense 3.60 35 94.29%
Separate statistics on lawsuits disposed by settlement from lawsuits disposed by judgment
3.56 36 91.67%
Dollar value of claims disposed 3.50 36 86.11%
Number of claims filed annually 3.50 36 91.67%
Annual defense expenditures by cost category 3.47 34 85.29%
Dollar value of claims filed annually 3.42 36 77.78%
Number of claims disposed 3.42 36 86.11%
1Does not include those who indicated that they were uncertain about a given item.

12
Table 1.2: Priority of Each Category of Information From Other States in Order of Highest Average Response (Continued)
Item Description
Average Response
No. of
Responses
Percent Indicating High, Very High or Moderate Priority
Type of limitations on immunity 3.42 36 86.11%
Details of cost, experience, etc., by attorney type 3.40 35 85.71%
Whether states carry liability insurance for highway claims 3.28 36 80.56%
Details on liability insurance coverage 3.24 34 82.35%
Number of claims pending (open) 3.22 36 80.56%
Whether self-insured state carries fully funded reserves 3.20 35 77.14%
Dollar value of claims pending (open) 3.17 36 77.78%
Number of attorneys 3.14 36 80.56%
Number of attorneys by type 3.14 36 80.56%
Average time for disposition of lawsuit 3.06 35 80.00%
Funding resources for settlement payments 2.94 36 66.67%
Sovereign immunity statutes 2.94 36 55.56%
Types of tribunals available for deciding claims 2.72 36 58.33%
Whether jury trials are allowed 2.44 36 52.78%
Details on venue restrictions 2.36 36 44.44%

13
The data categories revealed 106 separate data items or, more specifically, information “bits.”
These information bits were selected as the individual data elements for the model system. The data
elements are grouped into 11 categories of information that legal and risk management departments
might find valuable. Appendix A presents the core data elements as formatted to create the web-based
entry forms for this project.
PHASE II: PROBLEM STATEMENT, RESEARCH OBJECTIVES,
AND WORK SCOPE
Without a means to collect and report tort claims and lawsuit statistics and information from
each of the states, a national picture of highway tort liability cannot be assembled. Thus, the purpose of
this NCHRP research project was to assess the feasibility of a national data-management system for
highway tort claims and lawsuits. The feasibility assessment was based upon evaluation and
recommendations for the following issues:
• The willingness and ability of states to participate in the national system;
• Potential benefits to users and others;
• Potential obstacles to state participation in a national data-management system;
• Requirements for ongoing operation, maintenance, and enhancement of a national
system; and
• Potential costs imposed on the states. The central component of the feasibility methodology was the development of a model data-
management system that would provide useful content, quick data retrieval, intuitive navigation, and a
user-friendly reporting mechanism. The development of such a system is dependent on good design.
The overall design of this database application had to accommodate three important functions: data
collection and normalization, processing, and presentation. A good design can be achieved if the
following is known: (1) the performance and storage capacity of hardware and software, (2) database
performance objectives, (3) the content and format of desired output, and (4) the content and format of
input. The development team acquired equipment of sufficient capacity and utilized the network
infrastructure at Penn State to complete the hardware requirement. The Microsoft Studio Suite

14
development software was used to generate the databases. This software was later supplemented with
web development software from Allaire/Macromedia when the developer experienced difficulty
generating web components with the Microsoft product. The initial output schema (and master list of
data content) was derived from interview and survey responses received from 40 states. Making contact
with state resources and extracting the necessary data would achieve the acquisition of input data, the
final component required to begin the database system design.
On-Site Survey Process
The Interim Report proposed a six-state sample group for pilot testing the model system;
however, budgetary constraints restricted this to a five-state sample. The Phase I research indicated that
technology levels varied from a traditional paper-based system to a highly sophisticated, fully
automated, computer network system that collected, tracked, and shared tort claims information between
multiple departments. The technology levels provided one criterion for dividing the states into sample
groups. To further define the groupings, data access scenarios were constructed that would reflect
potential problems associated with connecting the model system with the states’ computer systems to
create a seamless and automated process for data retrieval. Geographical location and level of tort
activity and experience were also used to help define the sample groups. Thus, the candidates for the
pilot study were reviewed and selected on the basis of four criteria:
• Accessibility – based on the scenarios outlined in Appendix B that describe the
five access methods;
• Technology level – based on the level of computerization and method of data
collection that each state is using to track and store its tort data;
• Geographical location – the intent is to provide a broad representation of
geographical locations; and
• Level of tort activity and experience – the intent is to provide a broad range of tort
activity and experience.
Within each sample grouping, a preferred state was identified along with a first
alternative should the preferred state be unable or unwilling to participate in the project. The
preferred and first alternative states and access scenarios are presented in Appendix B.

15
The on-site interviews were conducted with state representatives of legal, risk
management, engineering, and highway agencies to identify appropriate resources and facilitate
data acquisition. The states’ Attorney General offices were contacted to request and discuss
participation in the project with a follow-up letter that described the project goals, concerns, and
the type of information to be collected. The on-site visits were scheduled with the states that
agreed to participate in the project, and a follow-up document was sent that outlined each state’s
responsibility, visit agenda, and a list of personnel to assist the team (see Appendix C). The on-
site survey required 3 days to complete and all attempts were made to accommodate the
schedules of those being interviewed. The initial meeting provided a detailed presentation of the
project goals, objectives, concerns, obstacles, and needs to all departments involved in the
survey. Representatives from legal and risk management agencies supporting state departments
of transportation were asked to participate in on-site interviews with the research team
concerning the existence, maintenance, and content of pertinent electronic files. The technical
professionals and functional managers for the department were also in attendance. All three
groups made every effort to be helpful.
Data Environment
The total data content for the model system was planned to originate from two sources:
aggregate totals compiled by state personnel and entered into the system via the web-based entry forms,
and the data retrieved from the individual states’ databases. The state data records were planned for
export directly from the individual state systems and sent to the model system in a native, or universal
text-based file format. The analysis process needed to address two questions: “Do the state’s internal
information systems contain the necessary data to produce the desired aggregate totals without the need
for significant human calculation?” and if not, “Can a limited amount of calculations be programmed
into the system that would convert the raw data into the desired aggregate totals?”
The data environment identified 106 data elements, excluding highway and injury
characteristics, as the target content of the database. The 106 data elements were captured in a 52-
question survey targeting 67 policy characteristics and 39 legal and claim-related statistics. Interviews
with functional and technical managers identified the requisite state data files to be retrieved. The
16
development team anticipated differences in the content and format of data from state to state. The
research team collected record layouts of the database structures and data samples from each state. The
developer then matched state data elements to those of the core data list. The data transfer process was
accomplished through Internet transmission or a record download mailed to the research team on a
portable (removable) storage medium such as floppy diskette or zip drive. A translation program was
written to convert the data to a compatible format. Data normalization techniques were applied to
accident files, legal files, and risk management files. The data were collected, normalized, sorted, and
then transferred to a central repository. A single batch program processed the data and generated all of
the reports for access from the web site. A user-friendly search-and-query language (SQL) component
provided a highly flexible and versatile search component. An extensive glossary that defines and
qualifies data elements for the user community would be difficult to construct, since the model system
contains more than 400 searchable elements.
The diversity of references and labels used to code and track tort claims information in each state
will pose a major obstacle to this project, especially with the absence of a national uniform standard for
comparison. The core data elements provide a viable structure for the model system to sort and organize
the state’s internal information for import into the model system. The model system’s data structure and
design were formulated with hope of using the base data pool from the states to calculate the output
required to fill the core data elements.
The Interim Report noted a high interest in having alleged highway deficiencies for tort claims
within the data-management system. The recording of alleged causal factors could be a valuable
resource for directing legal defense, risk management training, and maintenance and operations
programs to proactively address conditions associated with highway tort liability. Phase I revealed that
some states include alleged highway deficiencies in recording highway tort claims information;
however, the level of detail and terminology used to document this information was varied and sporadic.
The ability to create a highway deficiency database that provides a comprehensive overview of the
conditions and detailed circumstances alleged as causal factors is dependent on a standard profile for
identification. A uniform causation coding system was developed based upon causal information
currently being collected by the states and the Standardized Cause of Loss Codes developed in the
Public Risk Database Project (PRDP). The proposed coding system uses four classifications that

17
identify the highway system type, the organizational function responsible for creation or maintenance of
the system type, the component that contained the problem, and the specific activity within the
component that caused the damage. The data retrieved from the state systems were reviewed for
pertinent causal code references.
Model System Environment
A typical web application environment provides for the interconnectivity of the client-side
environment (a computer, web browser, and web pages) and the server-side environment (central
database software, web application software, and computer server) linked via the World Wide Web. The
client-server environment is a widely known architecture for providing resource management and
application processing over a local area network of client (desktop) and server computers. The planned
model tort data-management environment is in principle the same architecture, but uses the World Wide
Web to connect the user to the data-management system for the purpose of entering and viewing
information.
The client-side environment for the planned model system employs a web-based interface that
provides any user with Internet access the ability to interact with the data-management system through
an SQL-based interface from a remote desktop computer. The client does not need a significant amount
of processing power, since the server handles the back-end data processing. The model system’s server
environment differs from this scheme in that the web application has preprogrammed search tools and
does not currently offer an SQL-based search function. The one requirement for the user is that by
design Microsoft’s Internet Explorer browser must be used to perform the secure logon process that is
controlled through the operating system on the server. The logon access control is the most basic form of
web security and does not manage internal data security by state or segment. The ability to encrypt data
transmission exists through the secure sockets layer connection but requires a third-party encryption key
process to be absolutely effective.
The model system structure will provide more automated search functions and rely less on an
SQL function. The SQL function permits a more granular search capability but requires much more
knowledge and action by the user. Since clients of varied technological “know how” will use the model

18
system, pre-programmed search functions made more sense, even if limited. Figure 1.1 demonstrates
the process of a user (client) initiating a session with a data-management system for the purpose of data
submission or retrieval.
Figure 1.1 Scheme of Client Environment for Web-based Interface
The server-side environment consists of a Dell Power Edge 2400 computer server running the
Windows 2000 server operating system, Cold Fusion Web Development Platform, and the Microsoft
Visual Studio Suite. The data-management server was originally set up with the Windows NT4
operating system, but was upgraded to Windows 2000 for improved administrative and security
functions (e.g., increased stability, “plug & play” capability for adding and removing hardware,
encryption of data within the server). The Allaire Cold Fusion Server and Studio provides a web
application development environment that can be more readily managed with a minimum of less
experienced personnel. The Microsoft Visual Studio Suite, which contains a relational database (Visual
Foxpro 6.0) and other development and programming tools, had been represented as a complete
development package for simple creation and deployment of database-driven web applications.

19
Ultimately, the Microsoft suite required more expertise than anticipated, and was available for use as a
sole development environment. Visual Foxpro, Microsoft’s mid-range relational database, did prove to
be an effective environment for database development and offers the scalability of an enterprise-level
database without the cost. The potential transition to a national implementation made Foxpro a viable
choice for its growth potential.
The server environment or “back-end” to the model system is the central database environment
that consists of the database program, data tables, and functional programming and the web application
server software that is integrated with services of the operating system. The database environment is the
workhorse of the whole process and processes information input and output in a standard relational
environment. Figure 1.2 demonstrates the structure and process of a client retrieving information from a
relational database using a horizontal table structure that is linked by key fields.
Figure 1.2 Scheme of Server Environment for Data Processing

20
The user interface can be understood as all components within the site that require or
offer a level of user input to obtain a result. The components that comprise the user interface
include entry forms, reporting functions, index search functions, and a discussion forum. The
user interfaces had to be designed with a varied user community and simplicity in mind.
Additionally, the very nature of a national pilot project dictated that the interfaces be familiar to
the user community to demonstrate the value of the system. This was accomplished by using the
1992 AASHTO report designs as a model for creating the report layouts and the AASHTO
survey as a model for the data entry forms. The report categories followed the nine data
categories identified (e.g., sovereign immunity status, claims and lawsuit statistics) and the data
entry forms were laid out according to organizational structures (e.g., legal, risk management,
and insurance/liability).
In addition to the data entry and reporting functions, strong interest in expert witness
information and a standard tracking mechanism for alleged highway deficiency information
required the construction of separate data-management components. The data of greatest interest
in relation to expert witnesses was the information from depositions and/or court testimony. A
preliminary investigation determined the availability and recording media for these data and the
needs for converting paper-based documents to a computer-based search mechanism. The “key
word” indexing search component was ideal for this function. The indexing technology can
handle nearly all word processing formats, text file formats, portable document file (PDF)
format, spreadsheet formats, and presentation formats. Once the document is indexed, the user
can search content by title, name, state, date, and case identification number. Since the program
looks at characters and not definition or context, the user must make sure to use correct spelling.
Through the use of “operators,” such as “and,” “or,” and a comma “(,)” a user can narrow a
search to target very specific information. The down side of this component is the time and cost
in labor to scan and convert paper documents to one of the many digital formats.

21
CHAPTER TWO
FINDINGS
In an age of powerful and sophisticated electronic systems for recording, tracking, and
manipulating data to help companies and organizations realize the asset value of their internal
information pools, a poorly designed system will yield only nominal results. With the appropriate
expertise, a database system can be constructed that sorts, organizes, manipulates, calculates, and
displays information in nearly any manner conceivable. However, even the most complex and versatile
information system can only give the desired results if the following criteria are met: the information is
available, the information can be entered into the system, and the available information supports the
desired outcome. In accordance with these criteria, a system methodology or design approach can be
formulated in one of two ways, “bottom-up” (typical database design) or “top-down.” The bottom-up
approach looks to the source information or raw data to direct the potential output, which in this case
would be the state’s internal information. The “top-down” approach looks at the desired output and then
attempts to verify the existence of source information that supports the output.
More specifically, the bottom-up approach takes the following form: (1) identify the information
to be collected (data); (2) design the organizational and storage structure (tables); (3) create the input
mechanism (entry forms); (4) populate the tables with data; (5) program statistical calculations and
formulas, if needed; (6) create the output mechanism (report forms); and (7) test the application. The
top-down approach includes the following: (1) identify the desired outcome; (2) discover the existence,
location, and media state of the source data; (3) create the organizational and storage structure to accept
the information; (4) program statistical calculations and formulas, if needed; (5) create the input
mechanism, dependent on the media state (paper, electronic file, etc); (6) create the output mechanism;
and (7) test the application.
The most significant difference in design approach is the locus of control and whether it lies with
the source data or the outcome data. The construction of the model system required that both
approaches be assimilated into one system to achieve the desired outcome, but without the use of a fixed
uniform data standard to which all states would report. Most states expressing a willingness to

22
participate in a national system indicated that their willingness was predicated on not having to
significantly modify internal systems or enter data and information multiple times. In addition,
requirements for the model data-management system included: compatibility with multiple software
and hardware platforms used by the states, capability of processing dissimilar data items supplied by the
states, ability to accommodate multiple formats of exported data, and cost-effectiveness of
implementation and maintenance on a national level.
PILOT STATE SURVEY RESULTS
State Solicitation Process
Each of the five states selected initially responded favorably and without reservations to
the prospect of participating as a pilot state in the feasibility study. The principal concerns were
potential risk exposure and time constraints on state personnel. Two other concerns expressed
but not emphasized during the initial contact phase were the question of value to states’ internal
data needs and decision-making processes and the aversion to making changes to state
information systems in order to accommodate the data needs of the model system. With each of
the five states, the research team spent considerable effort to elaborate clearly on the various
responsibilities and requirements of pilot state participation, discussing each state’s specific
concerns in detail. Subsequent deliberations within the states resulted in two of the original five
states withdrawing from participation in the project. Two other states replaced the two declining
states, which largely met the selection criteria. The five pilot states thus were: California,
Florida, West Virginia, Missouri, and Washington.
State Survey Process
The site survey consisted of a 3-day process of meeting with representatives from each
department for presentation of the project goals, objectives, and needs; conducting the individual
interviews with functional managers and technical staff, and conducting analysis of each

23
department’s information system. Interviews with the functional managers provided the content
currently in the legal and risk management data fields within the model systems’ horizontal table
structure. The expected outcome of the interviews was to identify data resources with content
related to the core data elements and to obtain a record layout that defined the structure and
format of the states’ internal data.
Interviews with functional and technical managers revealed that the management of
requisite state data files was highly decentralized. A variety of state agencies maintain essential
data components with little or no overlap in content. This fact made it impossible to link data
electronically from one agency’s file to those of another. All of the database applications used
by state agencies had the capability to export data in a universally compatible format. There was
not found among the pilot states a single agency that managed a majority share of the necessary
data. The dispersal of data files and the omission of overlapping data content (in the form of key
fields, reference fields, and docket numbers) were obstacles that required more on-site analysis
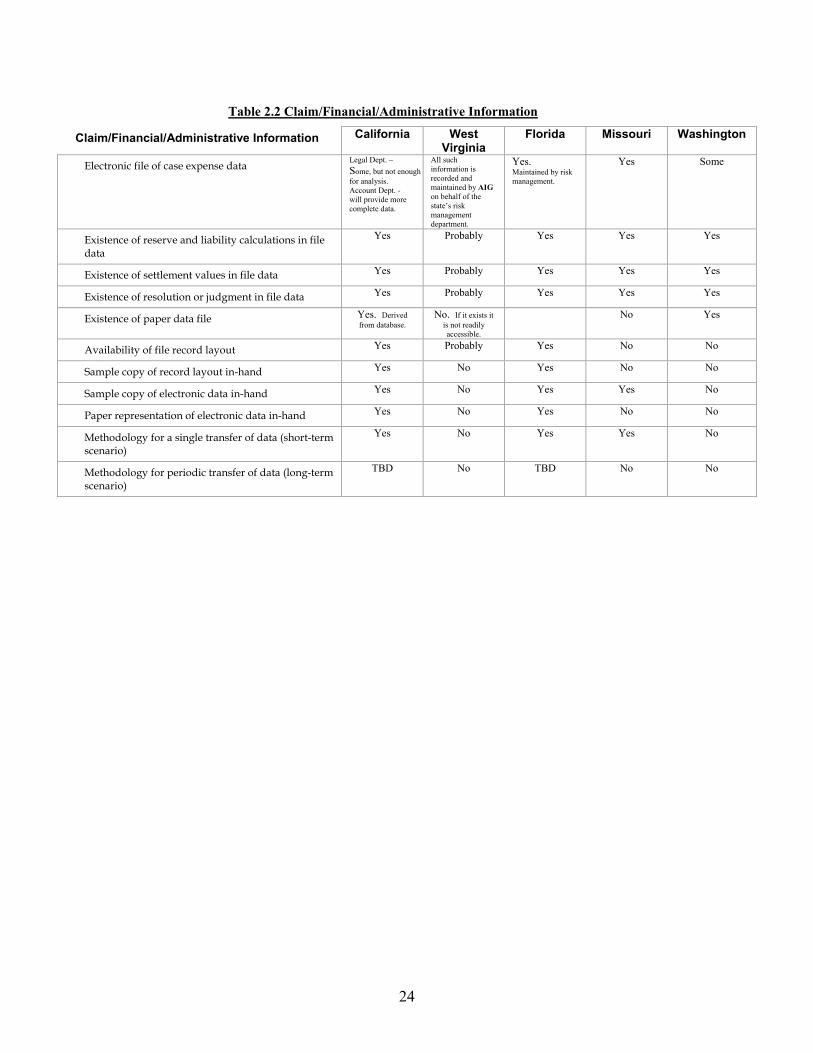
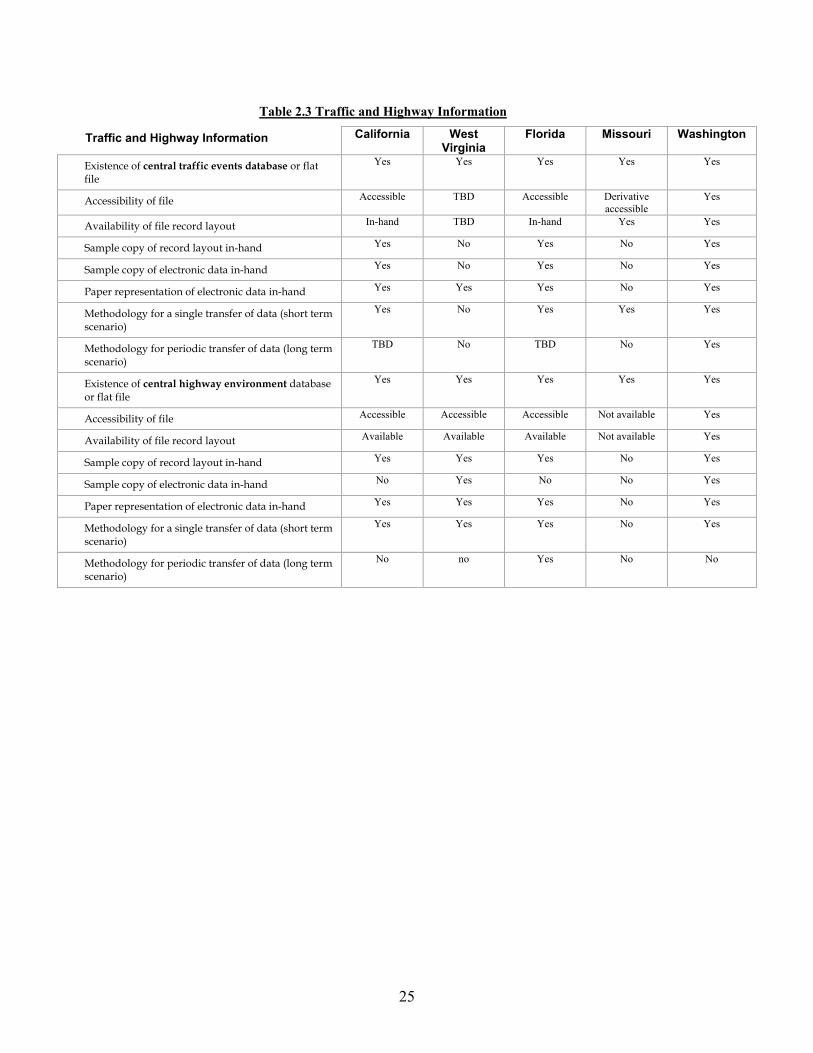
to overcome than was budgeted. Tables 2.1 through 2.3 display the status of data content and
system capability obtained during the interview process.
Table 2.1 Legal Department Information
Legal Department Information California West Virginia
Florida Missouri Washington
Existence of “case status” database or flat file Yes No Yes Yes Yes
Existence of electronic resources from which a “case status” might be derived
Yes. Currently maintained on the state’s behalf by the AIG Insurance Company.
Yes Yes Yes
Existence of “case status” paper data sheet Yes. Derived from database.
No Yes. Derived from database.
No Yes
Availability of file record layout Yes Yes No Yes
Database structure supports target content Yes No No No
Database is populated No Yes No Yes
Sample copy of electronic data in-hand Yes Yes Yes Yes
Paper representation of electronic data in-hand Yes Yes Yes Yes
Methodology for a single transfer of data (short-term scenario)
Yes Yes Yes Yes
Methodology for periodic transfer of data (long-term scenario)
TBD TBD No No
Expert witness compilation Available through another resource.
Yes Yes No
24
Table 2.2 Claim/Financial/Administrative Information
Claim/Financial/Administrative Information California West Virginia
Florida Missouri Washington
Electronic file of case expense data Legal Dept. – Some, but not enoughfor analysis. Account Dept. - will provide more complete data.
All such information is recorded and maintained by AIG on behalf of the state’s risk management department.
Yes. Maintained by risk management.
Yes Some
Existence of reserve and liability calculations in file data
Yes Probably Yes Yes Yes
Existence of settlement values in file data Yes Probably Yes Yes Yes
Existence of resolution or judgment in file data Yes Probably Yes Yes Yes
Existence of paper data file Yes. Derived from database.
No. If it exists it is not readily accessible.
No Yes
Availability of file record layout Yes Probably Yes No No
Sample copy of record layout in-hand Yes No Yes No No
Sample copy of electronic data in-hand Yes No Yes Yes No
Paper representation of electronic data in-hand Yes No Yes No No
Methodology for a single transfer of data (short-term scenario)
Yes No Yes Yes No
Methodology for periodic transfer of data (long-term scenario)
TBD No TBD No No
25
Table 2.3 Traffic and Highway Information
Traffic and Highway Information California West Virginia
Florida Missouri Washington
Existence of central traffic events database or flat file
Yes Yes Yes Yes Yes
Accessibility of file Accessible TBD Accessible Derivative accessible
Yes
Availability of file record layout In-hand TBD In-hand Yes Yes
Sample copy of record layout in-hand Yes No Yes No Yes
Sample copy of electronic data in-hand Yes No Yes No Yes
Paper representation of electronic data in-hand Yes Yes Yes No Yes
Methodology for a single transfer of data (short term scenario)
Yes No Yes Yes Yes
Methodology for periodic transfer of data (long term scenario)
TBD No TBD No Yes
Existence of central highway environment database or flat file
Yes Yes Yes Yes Yes
Accessibility of file Accessible Accessible Accessible Not available Yes
Availability of file record layout Available Available Available Not available Yes
Sample copy of record layout in-hand Yes Yes Yes No Yes
Sample copy of electronic data in-hand No Yes No No Yes
Paper representation of electronic data in-hand Yes Yes Yes No Yes
Methodology for a single transfer of data (short term scenario)
Yes Yes Yes No Yes
Methodology for periodic transfer of data (long term scenario)
No no Yes No
No

26
State Information Systems
A review of hardware and software technology in the states revealed various mainframe, mini-
frame, and client-server environments with a range of operating systems and approximately 13 different
databases being used for hosting and processing tort claims information. A result of the proliferation of
computer-based technologies used to improve the administration of information has been a widening
knowledge and communication gap between functional managers and system technicians. Though each
understands his or her area of expertise, there is little or no common overlap that effectively melds the
two together. Such was the case in the state agencies that were surveyed. The technicians did not fully
comprehend the business process and the functional personnel had only a cursory knowledge of the
technical processes. This circumstance manifested in technicians having complete access to data but
limited knowledge of its content, and functional managers being aware of the existence and content of
data but having no specific knowledge as to how they were generated, maintained, structured, or stored.
The research team found that this knowledge gap was further exacerbated by the limited time
available to conduct the on-site surveys and limitations of the personnel participating in the
interview process. The intended objective of cross-referencing and verifying data labels,
information sources, and functional authority was nearly impossible to achieve in the allotted
time.
The database software used for the information systems in each state varied greatly in
complexity, functionality, and capability. The technical expertise of the personnel responsible for
managing the information systems ranged from secretarial staff with limited input/output knowledge to
systems administrators with a thorough knowledge of the system. The level of expertise that was
available to assist the project team in identifying the content of each system greatly impacted the success
of identifying the appropriate data items for export. Systems built on standard, off-the-shelf brands
posed no real problem for accessing the table structure and exporting the content. Since the applications
of most of these systems were developed internally, accessing the record structure to verify content was
a straightforward exercise.
In contrast, accessing the record structure of proprietary database software, such as Dorn Risk
Master that is used in Missouri, involved insurmountable obstacles for this project. The Risk Master

27
software is constructed from a relational database that uses a parent/child table structure. The software
offers optimal versatility and functionality but has no means of providing a visual display or tree view of
the table structure, which would have allowed the team to easily identify and verify data flow and
content. A search of the child tables revealed that data fields with the same label were found in other
child tables with no means of determining field duplication or reference. The software implemented an
expansive export function via a proprietary reporting mechanism called Report Master. However,
creating a report with the necessary data fields required expert knowledge of the field labels and content
within each field. The state’s central technology personnel were not familiar enough with the internal
structure of the program and had to defer to the clerical person in charge of data entry and reporting. The
clerical person could not retrieve a record or table structure and contacted the technical support
representative for the software vendor, Dorn. The vendor representative provided assistance for creating
a report from the selected data fields, but the software licensing agreement protected access to the
internal structure of the program. This made identifying the specific content of data fields related to tort
claims information a hit-or-miss proposition based on foreknowledge of the data field labels and data
structure set forth by the department. The ability to identify and verify the exact data fields without a full
awareness of the department’s data labeling and reference terminology and cooperation from the
software vendor would require a timely process of on-site analysis. The same issues would probably
apply when dealing with any private, proprietary software programs.
A significant issue expressed in the Interim Report impacting the design approach for
constructing the model data-management system was that states did not want to change their internal
information systems. However, of the four states using computer-based information systems, one or
more of the departments interviewed in three of states reported that they had either recently converted,
were currently involved in a conversion, or were planning to convert to a newer version or completely
different software program. The majority were inclined toward adopting a completely different software
program that offered integration and scalability to include access by multiple departments statewide.
States’ Relevant Data Structures
The states’ data objects required to populate the data-management system consisted of select
information from tort claims records, risk management records, highway deficiency data, expert witness

28
information, and injury/accident statistics. With the exception of Florida and California, legal agencies
did not maintain accident, injury, highway, or judicial statistics as a part of their case file. These
agencies generally managed case information in word processing documents rather than databases. The
rest of the case (legal) statistics were available from risk management in all states except West Virginia.
Accident, driver, injury, and highway statistics were available from a variety of bureaus within
transportation agencies. However, none of them maintained a reference field that linked accident records
with legal records, or risk management records, or highway event (highway maintenance) records.
Through the course of the investigation, it was discovered that linked information was available through
the department of motor vehicles or the states’ electronic information offices. Access to relevant files in
these resources would have required prior knowledge of their existence. Unfortunately, such information
was not available prior to the scheduling of interviews.
The research team was able to collect record layouts of existing data files when available, and
personally inspect the files of target agencies to verify the applicability of data content for this project.
The core data elements that refer to policy issues required multiple-choice or short-answer responses.
Statistics required the compilation of values from legal files and claim files. The content of database
files in the legal and risk management agencies visited were function specific. They did not maintain
information from which the target data could be derived. It was obvious that managers could not have
relied on those files exclusively to generate the statistical data requested in the AASHTO study. None of
the states would have been able to complete the AASHTO survey by exclusive use of the data files that
were made accessible to the interview team.
Table 2.4 provides a complete breakdown of core data elements for the model system by
category and the availability of supporting data from within the state’s internal information systems. A
closer look at the data revealed that a more complete picture of the highway safety and condition
environment in support of the core data elements might be compiled by including data from actual
accident reports and information retrieved from traffic operations departments. However, this option
could not be pursued within the time and monetary constraints of this project.

29
Table 2.4 Distributions of Data Elements and Target Data
Subject Category Total Responses Short Answer Statistics Response derived from accessible legal / claim
files
Sovereign Immunity 9 9 0
Claims Procedures 7 7 0
Claim Statistics 24 24 4
Attorney Statistics 11 11 0
Employment Liability 4 4 NA
Contractor Indemnification
4 4 NA
Insurance 14 14 NA
Training Policy 25 25 NA
Risk Management 2 2 NA
Expert Witness 6 6 0
Totals 106 67 39
Highway Characteristics 320 320
Injury Characteristics 22 22

30
Impact of States’ Data Structures on Model System Development
The process of data analysis began with the first set of exported data from the state systems and
implementing a mapping or translation process to link states’ data items to the associated data elements
in the model system. The mapping process applies a common structure to the cumulative data by
identifying and routing the information to the appropriate data fields within the model system’s data
tables, where statistical functions would calculate the aggregate results for display in the reporting
mechanisms. A traditional database design would have made this process an effective and efficient
method of collecting and processing the states’ information; however, the magnitude of calculated data
variables in claims and highway data records, along with the software development issues, hindered the
use of a traditional horizontal table structure and required an alternate design approach. A vertical table
structure was developed that would allow the aggregate totals for each of the core data elements to be
displayed to the user community in a familiar format. A utility program within the application collects
data from reference data tables and the data table that supports the entry form, performs all necessary
calculations, and performs formatting that is required to prepare the data in the horizontal tables for
conversion to the vertical tables. Displaying the results of this process could not be completed for two
reasons: (1) a majority of the data fields retrieved from the state’s internal systems did not support the
core data elements, and (2) data fields that did appear to support the core data elements were not
populated sufficiently to verify the content.
There were a few additional issues that hindered the use of raw data from the states to calculate
the aggregate totals required by the central database. Maintenance of data required to calculate aggregate
totals was distributed among many more departments than the initial survey responses indicated. The
time lapses for data entry on a case and the actual progress for a case are very broad in some states. The
reasons for this issue varied from state to state, but all states experienced some form of this problem,
such as delays in receiving information from their business or accounting departments to provide certain
cost figures, awaiting information from subordinate database systems that had not been updated, and
failure to obtain the information available for input. There also appears to be some duplication of
information between departments within a state that would make the totals unreliable.

31
The most significant issue that surfaced was that existing state legal and risk management
information systems contain too many data fields that are not populated with data. This situation
severely constrained the ability to construct a model data-management system. Further hampering the
model system’s development were the difficulties encountered in attempting to evaluate the data content
of the existing state systems. As indicated previously, the data field references/labels used to identify
data items during the site survey were often not enough to make an accurate evaluation of the data
content of these systems. Consequently, the data fields of existing systems could not be accurately
mapped into a common coding structure for this project. It became apparent that since the field
identifiers used in each state are often unique to their own organizational, cultural, or legal environment,
a more significant amount of time will be required at each of the states and with state personnel that are
proficient in all aspects of the existing state database systems.
Given the general state of existing legal and risk management electronic data, attempts were
made to find supplemental state and federal transportation information sources to use in the model data
management system. It was determined that highway engineering and technical data (accident files,
highway maintenance files, highway characteristics files) and injury characteristics data maintained by
all of the states are comprehensive and available in database structures. However, these databases are
very large, with complex record layouts (including a description of values) that require much more time
to process than the budget allowed. For these reasons, the core horizontal tables remain populated with
data retrieved from legal and risk management departments during the interview process and readily
available highway and fatality statistics retrieved from the Bureau of Transportation Statistics (BTS)
Fatal Accident Reporting System.
As previously indicated, the states have a keen interest in including alleged highway deficiencies
within the data-management system. A four-level classification and coding system for alleged
deficiencies was developed and proposed for the model system. The data matrix alone for Levels I, II,
and III is approximately 360 discrete fields, which is not unreasonable for mid-level analysis. However,
if Level IV were to be included, the matrix would expand to 20,544 discrete combinations. Construction
of a presentation scheme to deliver a quality search function for dimensions of this magnitude would
require a research initiative of its own, as evidenced by the Public Risk Database Project. The project
team decided that a database constructed from Levels I, II, and III would be sufficient to demonstrate the

32
value and function of this information. The decision was supported by the findings in the Phase I report,
which noted that most states could not provide this level of detail for a national perspective due to varied
geographical and climate features, unique organizational structures, and diverse tort laws.
The data entry and reporting functions for the highway deficiency database pose the most
challenge of all the components in the data-management system due to the linking process between the
levels. The design and construction would be simple for “just” a mutually exclusive perspective or “just”
a relational perspective, but the design and construction of a system that offers a mutually exclusive
perspective “and” a relational perspective within existing time and budget constraints was beyond the
scope of the project.
MODEL SYSTEM DESIGN AND CONSTRUCTION
Database Application Environment
Two principal factors dictated the design and development of the central information system—
the data structures and software programs used to create the model system. The type (state’s data or
aggregate) of data and output needs dictate the design of a table. The horizontal table is a common data
matrix structure that allows for a highly versatile search capability. The vertical table structure has a
more fixed data structure that has less capability for searching the data content of the table. The
traditional horizontal layout and the less common vertical layout dramatically dictate the way
information can be displayed and manipulated.
The central database environment for this project is comprised of both horizontal and vertical
tables due to the incongruence of the data types. The horizontal tables contain the raw data records being
retrieved from the state’s information systems and the vertical tables contain the aggregate information
being collected via the entry forms. The construction of this environment had to be altered dramatically
with the discovery of system design flaws due to the misinterpretation of the database program’s
integration capability with the web application software. A key component to the system that ties the
state’s data to the core data elements is the translation program. The translation program converts states’

33
data structures to meet the requirements of compiling the output dictated by the core data elements and
back to the states’ data structures.
The shared access to a database within a local area network and shared access to a database
within a wide area network that utilizes the World Wide Web for connecting computers pose
fundamental differences. The most significant difference between them is the client capability or
functionality. A shared database application in a local area network splits the responsibility of data
processing between the client and server, with the majority of processing work assigned to the server. A
shared database application via the World Wide Web relies completely on the server for all data
processing needs and the client is programmed to merely transmit requests and receive the output of the
request. Therefore, a significant amount of programming is required to get the functionality of a locally
shared database within a remotely shared environment. The Microsoft Visual Studio Suite was chosen
with the understanding that the functionality of a locally shared database could be achieved without the
extensive programming requirements. This was not the case and the entire design had to be adjusted to
meet the requirements of a traditional web-based database environment. The central database
environment became a collection of segregated data tables that store the content of information received
from the state’s information systems and entry forms. The vertical table structure was implemented, in
part, due to the problems and limitations encountered with the development software. The project team
needed a quick work around to get a reporting component that would display the information in the
desired format. A significant amount of functionality for performing custom data searches was lost in
the vertical table structure.
The state’s exported data are entered into the system via the data input function designed by the
database developer. The initial work scope called for a “fully automated” process for the state’s data to
be retrieved and entered into the model system. The process proved to be a liability to both the states and
the project supporters due to potential security vulnerabilities of linking to a remote network and system
stability issues related to introducing a foreign program into a state’s computer system. The project team
had envisioned a direct link to the state’s computer network with a scripted program that would extract
the required information from the system automatically and store it in an accessible location on the
network for retrieval by the project team. This process was rejected based on department policy and the
legal liability of introducing a non-departmental script program into the system. Therefore, the

34
information was extracted by the state’s technical staff and sent to an FTP site (shared folder on the
Internet that is password protected) or copied to removable media (disk, CD-ROM) and sent via the U.S.
mail. The data were to be extracted and sent to the database developer on a monthly basis. The database
developer was then to verify the data content, map the data to the appropriate fields, and import the data
into the data-management system. The data import process would eventually become more automated
after establishment of the consistency of the data, reliability of the extraction method, and integrity of
the data upon arrival.
The data import process never reached an adequate flow level to test its effectiveness due to
delays in system development. Based on the findings of the site surveys, the schematic in Figure 2.1
diagrams the model for information flow and process that would meet the expressed needs for the model
data-management system and a national implementation. This structure was not completely realized in
the pilot system.

35
Figure 2.1 Proposed Data Environment for Model Data-Management System
Web Application Environment
The Macromedia Cold Fusion 4.5 web application server and Studio 4.5 web development
software proved to be an invaluable asset to the production of the model system, especially in view of
the issues encountered with the Microsoft web development software. As discussed in the Database
Environment portion of this section, integration of the horizontal data tables into the website proved to
be problematic. The original approach to the design and development of the model system was
abandoned for a complete web-based interface that utilized only the data tables and relied on the web
application software to design the user interface. The user interface is comprised of the data entry and
reporting mechanisms. The data entry mechanism is in the form of web-based data entry forms within

36
the data-management system. The data entry forms are used for entering aggregate totals similar to those
prepared for the AASHTO paper survey. The entry forms are organized according to function and
department: Legal, Risk Management, and Insurance and Liability using the core data elements selected
to construct the model system. The table structure contains a record for every state for the years 1992
and 1997-2004. The information is entered into the system by indicating the state, calendar year of
information entered, and entry date. This information is used to track the last time each state record is
updated. A batch program is used to transfer the table content to the vertical tables for access by the
reporting mechanism. Depending on the search criteria, the reporting mechanism pulls the specific table
statistics into the appropriate item field for display and review by the user.
Server and Network Environment
The software and hardware components used to construct the data-management system from
client to server are basic, midrange mechanisms for creating an environment of this type. The server
computer is a mid- to low-range, dual-processor product configured with a single Pentium III (500
MHz) processor and 256 MB of Random Access Memory that provides sufficient processing power to
implement a project of this limited scale. The system was purchased with six 9-GB hard drives that are
integrated in a redundant array of internal drives (hardware-based RAID 5) for data protection and
provides maximum storage space to meet the potential storage needs envisioned in the Interim Report.
The computer has two network interface cards that will allow any entity that might assume temporary or
permanent custody of the server to connect it to a network without creating a security breach by
assigning a public IP address for the website and a private IP address for the local network. The server
was upgraded from Windows NT4 to the Windows 2000 operating system for improved stability,
administrative features, and enhanced security features. The Windows 2000 operating system has proven
to be a more stable operating and processing environment than the Windows NT4. The expanded
administrative functions boast improved integration with web applications, the ability to control hard-
drive space per user, and added components for configuring various connection types via the World
Wide Web, to name a few. A security feature enhancement with this operating system permits data
encryption for transmission (IPSec) and storage (Stored Data Encryption) that offers a built-in capability
for secure implementation of this site by an entity with minimal budgetary resources. The Penn State

37
network provided the level of bandwidth for a large-capacity data transmission rate necessary for
multiple and simultaneous connections to a database-driven website.
Beta Test and Monitoring
The beta testing phase of the model system was impacted greatly by the numerous delays and
technical problems encountered during the development of the project site. The testing period was to
begin in June 2001 and last 6 months, during which time the panel members and participant states were
to explore and experiment with different components within the site. However, the test period did not
begin until October 2001. A site manual that explains the different components was to be provided to
the user community prior to the site coming on-line, but due to insufficient time and resources, it was
replaced with the built-in User’s Guide that is accessible from within the site.
A brief e-mail was forwarded to each panel member with instructions on accessing the site and
user account and password information for secure logon. The logon process did offer some problems
that were easily resolved. The site components are fairly intuitive and each offers some direction and
instruction at the point of interaction with each component. The Discussion Forum contains its own
user’s guide that is accessible once the user is logged into the Discussion Forum component. In addition
to testing the user functions, the beta test period was to monitor the data export and import process of the
state’s data into the model system. The monitoring process was to analyze and verify that the data
content was correct and consistent, the data mappings for the state’s data to the central data elements
were correct, and the integrity of data being sent to the model system was sound. Unfortunately, the
amount of external user activity was not sufficient to allow a conclusive beta test.
The in-house testing process was ongoing throughout the development of the data-management
system. The different components were tested on a non-production web server prior to being
programmed into the central data-management system. This process still did not prevent technical
problems and human error from leading to issues that required significant debugging and, at times,
redesign of entire functions or site components. The following issues remain to be addressed:
• Editing for spelling, grammar, use of terminology, and general content;

38
• Editing for format, color, and overall appearance;
• Correction of alignment problems in report displays;
• Correction of item descriptive/label in report displays;
• Correction of numeric character display for dollar values in report display;
• Completion of the Highway Deficiency component;
• Programming of daily interval for automatic update of entry data to report tables;
• Creation of annual reporting component with Crystal Report software; and
• Verification that the report displays contain the correct data fields.

39
CHAPTER THREE
APPRAISAL AND APPLICATION
GENERAL SUMMARY
The state selection process verified the concerns about security and risk exposure expressed in
the Interim Report by state legal departments. The states that declined participation in the project did so
after assurances that the research team did not want sensitive or confidential information. The process of
field exclusion from data records was explained to them to no avail. After making this argument, the
discussion turned to the potential burden on support staff and the current workload of those asked to
participate in the on-site survey process. It became obvious that the persons involved in the decision
process had determined to exclude themselves without further consideration. The research team believes
that the states perceived a minimal return for the effort that they would have to put forth as a pilot state.
In order to gain the participation of all states in a national data-management system, tangible rewards in
the form of both short-term and long-term benefits will need to be proven and assurance of security will
have to be demonstrated. Representatives from state departments of transportation will need a firsthand
demonstration that the system does not contain overly sensitive information, does not require excessive
involvement from support staff, and can provide relevant data pooling and processing of both internal
(state’s) and external (national) data. The current model system would require additional enhancements
and improvements to bring it to an acceptable level to be effective in a demonstration that was meant to
soften the concerns of risk exposure and convince them of the value in participating in this venture. A
more thorough interview/presentation process with the state agencies to promote a national data-
management system would provide the opportunity to discover what information is of value and
demonstrate the data collection process to relieve concerns of “overburdening” their administrative staff.
The “data bites back” issue discussed in the Interim Report can only be resolved by clarifying the legal
protection rights of states’ data after they are collected in a pooled database.
The on-site survey process proved adequate to complete a general assessment of the state’s data
environment given the time allowed. Each individual department was able to provide enough
information about its data processing to give the research team a general overview of the structure (data

40
fields) and flow of information. Time did not allow a thorough content review of the exported data
records with functional managers in each department; the ramifications were realized during data
analysis. The managers and technical support staff assisting the research were helpful. However, a
knowledge gap between department heads, functional managers, and technical staff became evident as
the survey process progressed. Each individual state demonstrated overlap between management and
support, and users varied widely. Several factors seem to contribute to these problems, including:
• Administrative authority and location of the information system;
• A large and complex organizational structure;
• Limited technical staff supporting multiple agencies in the state;
• A highly centralized technology department that controls the information systems but is
not familiar with the functional needs of the departments;
• Communication gaps between functional managers and technical staff; and
• Decentralization of departments and agencies that share an informal information flow.
The pervasive issue throughout the state survey process was the lack of a single administrative
and operational approach to electronic data handling. Though information was accessible or passed to
the next functional department in the chain, its content often changed to suit only the needs of the
specific department. Often, a gap in content required that extra time and cost be spent to acquire
information that should already have existed in the data record. For instance, specific details such as the
narrative section on an accident report did not get recorded or included in an electronic data file that was
passed through to the legal department for a tort claim. The information had to be retrieved in paper
copy during the discovery phase of case investigation, often without the benefit of a single common
identifier to tag the desired file. An immediate benefit to states participating in a national system would
be the results of a thorough assessment that could direct improvements to their own internal data
processing at no additional cost.
Table 3.1 provides a breakdown by field and value of the information and data obtained from the
on-site survey process. The table offers a perspective of the data analysis and normalization process
required to bring a given state’s data into a common and somewhat standard set of references, such as
the core data elements.

41
Table 3.1 Data Fields and Values
California West Virginia Florida Missouri Washington Dept. Resource Fields Values Fields Values Fields Values Fields Values Fields Values
Legal Department File 81 173 25 39 40 160 Claims File
Risk Management
Department File 21 140 21 N/A 23 70 Insurance Co. 191 400
Engineering
Department File Highway 114 510 100+ 500 100+ 500
Traffic Operations
Department File 330 1,320 State Info Services 56 280 114 392 90 720 Accident File 170 200
Total 581 2,283 361 600 160 571 121+ 500+ 153 1,450 Aggregate 1,255 4,904

42
The plan for site visits and systems analysis was based upon the information gathered in Phase I.
The preliminary research indicated that electronic systems were capturing a nominal amount of
information relevant to the core data elements, when indeed it was coming from subordinate agencies or
systems. Table 3.2 demonstrates the expected resource versus the actual resource where information was
found as it pertained to directly supporting the core data elements. The table provides a list of alternate
resources from which information could be retrieved for primary use or supplemental support.
Table 3.2 Distributions of Target Data by Department
# Information Expected Resource Referred Resource Alternative Resources
1 Sovereign Immunity Issues Legal Agency None
2 Claims Procedures Risk Mgmt. None
3 Lawsuit Procedures Legal Agency None
4 Contractor Indemnification Legal Agency, Risk Mgmt. None
5 Insurance Policies & Issues Legal Agency, Risk Mgmt. None
6 Training Legal Agency, Risk Mgmt. None
7 Risk Mgmt. Structure Risk Mgmt. None
8 Claims Statistics Risk Mgmt. Limited Content: None
9 Lawsuit Statistics Legal Agency Limited Content: Legal Agency None
10 Attorney Statistics Legal Agency Limited Content: Legal Agency None
11 Injury Characteristics Legal Agency Limited Content: Legal Agency State Police Accident Report, DMV
12 Highway Characteristics Legal Agency Limited Content: Legal Agency Hgwy Engineering, BTS
13 Accident Statistics Legal Agency Limited Content: Legal Agency State Police Accident Report, DMV
14 Driver Statistics Legal Agency Limited Content: Legal Agency State Police Accident Report, DMV
15 Vehicle Statistics Legal Agency Limited Content: Legal Agency State Police Accident Report, DMV
16 Highway Statistics Legal Agency Highway Engineering State Police Accident Report, DMV
17 Employee Statistics Risk Mgmt. Risk Mgmt. None
The agendas established for state interviews and system surveys were based upon assumptions
derived from the preliminary research. In the course of conducting the interviews and surveys, it became
apparent that more time and labor than was anticipated was required for identifying relevant content, and
later analysis and normalization.
Legal departments have not been traditionally driven by statistical data, and consequently have
the least experience with and utility for using computer-based systems for more than electronic record

43
keeping. The legal information systems could be compared more to a giant electronic filing cabinet,
rather than an informational tool for manipulating and processing outcome-based statistics. Therefore, it
was not surprising to find that the greatest variation in computer-based tools used to process information
was within legal departments. This variation ranged from simple word processing to full-blown database
implementation. The database structures tended to be narrow and specific to the legal processing of
claims with minimal fields for indirect, but related information. The systems proved to be adequate for
internal needs, even if underutilized. The legal data will require the most significant time and cost to
analyze, normalize, and translate for a national system. Further research will be required to discover all
subordinate agencies that can contribute source information required to calculate the core data elements.
The risk management departments are more dependent upon statistical information, therefore the
systems tend to be more standardized and designed for analysis and decision making. Risk management
departments that serve as the administrative body for tort filings often had the fields for pertinent legal
data built into their own systems. The legal data fields within risk management systems appeared to
have a higher ratio of completed data fields than independent legal systems. Risk management seems to
be the pivotal group for legal and traffic operations departments from an information and management
perspective. The services provided to both departments by risk management could be greatly enhanced
with a functional blending of legal and traffic operations information. The proactive nature of risk
management and the need for response and planning made it a rich environment for software developers,
and it is here that the majority of proprietary software is found. The level of technical expertise and
understanding of the software varied with each state’s support staff, which directly affected the research
team’s ability to perform a thorough data analysis and field identification process. Since risk
management departments were historically more efficient at making use of computer technology for
administering information, they appeared to have stronger technical support. Surprisingly, the risk
management data did not directly support a significant amount of the core data elements in the model
system either.
The standardization issue is not limited to legal and risk management departments. A quick
Internet search of federal highway agencies and organizations reveals a great deal of activity and debate
over standardization in many areas of transportation. Nonetheless, directing this pilot and any future
efforts toward the creation of a uniform standard for data is a must to realize valid and meaningful data

44
comparisons. The research team believes that an evolutionary process of coding and analysis applied to
the cumulative data pool of participant states (dynamic standard) could eventually result in a fixed and
uniform data standard. As new states are added to the system, their information would be added to the
process of identification, verification, and inclusion to the standard coding structure. The process would
require no alterations to the individual state systems. However, as state information systems transition in
functionality, adoption of standardized elements could occur gradually during regularly scheduled
maintenance and upgrade operations. The current process of standardizing information for the model
system relies heavily on manual normalization of data and a mapping process that links the normalized
data to the core data elements. A national implementation of the data-management system should make
every effort to focus on data from traffic operations and state highway patrol departments. Including the
data from these departments and adding a common identifier to data files could provide a complete
picture of a tort claim from accident to litigation, obtained with a few “clicks” of the mouse.
An alternative to developing a uniform standard is to adopt an external standard code tool from a
third-party entity, such as the Public Risk Data Project’s “Cause of Loss Codes” used to code claims by
the alleged causal factors. The PRDP project has gained popularity with about 10-20 proprietary
software vendors, such as Dorn Risk Master, which have incorporated the Cause of Loss Codes into
their software. This is the same tool used to design the structure for the Highway Deficiency component
of this model system. The down side to this initiative is imposing a foreign structure upon the data entry
and processing scheme that would require significant changes to a state’s internal systems if they are not
already using one of the proprietary software vendors. The number of states reporting use of the
proprietary software is minimal. However, PRDP recently made two announcements that may make it a
viable partner for further development of a national system: a new version of the loss code tool that
includes worker’s comp cause codes and permission for vendors to acquire the visual basic source code
and object code at no cost for incorporating it into their software. Based upon the value of being
involved in PRDP’s Data Exchange, there is no reason why these tools could not be assimilated into a
national system.
A key function of the data-management system that has not been addressed is the potential for
states to access and manipulate the collected statistics from each of their departments in a more dynamic
manner. The ability to maintain state statistics separately and in more detail than what would be

45
displayed in the overall reporting mechanism was a topic discussed at the conclusion of Phase I and the
beginning of Phase II. Unfortunately, this level of functionality could not be constructed using the
vertical table structure currently in place. However, reconstruction of the model system’s core data
environment can provide that functionality and even provide a reverse translation process for bi-
directional data transfer from state system to model system and back again. Access to this level of detail
would be secured for the individual state only. In effect, the state could achieve an interdepartmental
database without the disruption and cost of having it done within the state’s information systems.
Design Criteria and Outcome
The proposal to create a direct network connection with each pilot state was quickly abandoned
due to extreme opposition from the states. The primary reason for rejecting a direct connection between
the state’s network and the data-management server was the concern for network security. Many of the
states keep their own internal network systems or individual computers that host claims information
secure from external access, and were not open to any type of linking to their systems. The concerns
were legitimate and warranted, especially with the rise of recreational hackers and the ability to
download intrusion programs from rogue web sites. The use of removable media (CD-recordable disk,
zip disk, tape backup) or an FTP transfer requires minimal time and effort on the part of department staff
and serves the need of data input quite well. It also makes the data easier to verify for content and
validity, since is packaged in its own file. A fully automated process would require that the validity and
integrity of the data be checked programmatically and require more development and programming
time. In the short term, manual conformation and assimilation of a state’s data into the system would be
more cost effective, but long-term operation of a national system would require a programmatic function
to take care of this process.
The technology used for this project was selected on the basis of function, familiarity, support,
and future potential. The operating system and hardware performed exceptionally well and offers long-
term functionality for use of this system in a national system. The database software proved to be
problematic for the type of expertise that was available, since it did not offer the ease of use that it
claimed. The database program was the only component used out of the entire suite of products. The
manner by which the web development software (Cold Fusion) pulls information from a database

46
permits the use of even the simplest relational database program to be used in a database-driven web
site. The Foxpro database was more than adequate for this project. The programming requirements for
functions and processes were accomplished within the program or batch programs written in C+. This
development approach makes the system more “open source” and scalable since it is not strictly limited
to the vendor’s design and internal functions. The costs of programming support are justified by the
utility of the system and minimal restriction of vendor support and licensing agreements. Future
administration will be easier for any entity that might host the system, since basic programmers and a
little training in the web application software should enable them to fully administer the system. Based
on growth of the system, transition to an enterprise-level database system would be simple.
Though the research team was not able to realize the full potential of the model system
envisioned in the work scope within the allocated time and budget, enough of the system was completed
to demonstrate the potential of a web-based information resource and data-management application for
collecting and disseminating tort claims information to serve a host of clients. The current functionality
of the model system offers the ability for states to enter aggregate information directly into a single
horizontal table. The entry forms were originally meant to offer states that depend on a paper
information system a simple way to get their information into the model system. For states that provide
electronic data files, the entry forms would be customized to accept only the information that could not
be retrieved electronically. The model system transfers the data from the horizontal table to the vertical
tables once every 24 hours, so that comparisons can be made with other states that have manually
entered their aggregate information in the same manner. The display function allows users to sample
four different reporting mechanisms: a summary-at-a-glance report for two to five states on one
category, a two-to-five-state comparison of one data category for a single year, a one-state comparison
in one category for three years, and one state in two categories for a single year. The site includes a
component that can collect a state’s expert witness and testimony information as formatted by each state
and make it searchable by “key word,” which includes dates, case number, and any other non-alpha
character description that states include. The search component is very versatile, permitting broad or
very specific searches through the use of operators, such as “and”, “or”, “<” and “>”. The site offers an
information exchange tool called a Discussion Forum or Bulletin Board that users can access to make
announcements, ask questions, post documents, carry on a long-term discussion or debate over any
related topic, etc. There are a number of uses for this component, limited only by the users. Finally, the

47
site offers a component that lists links to other web sites that provide information related to topics
addressed in the overall site. The inclusion of this component demonstrates that the site can provide a
venue of legal, risk management, and highway operations information resources.
The state agencies maintain electronic files that support accident, injury, highway, and
engineering topics addressed in the AASHTO study, but a significant amount of claims and risk
management data fields that support a direct association with the core data elements is either not present
or not being populated. A short-term solution for the lack of data content found in the legal and risk-
management agencies could be the completion of a web-based form once each month. The form would
be customized to supplement the state’s electronic data file and would require no more than 2 person-
hours each month. States operating electronic information systems would have an easy and uniform
method of providing legal and case management statistics. States using predominantly paper-based
systems will use the full-fledged data entry forms within the website to enter all the desired information.
All other data could be accessed from electronic files maintained by the state electronic information
services or the department of motor vehicles. For instance,
• All 50 states prepare information for the Fatality Analysis Reporting System
maintained by the Bureau of Transportation Statistics. These statistics are a
subset of the DMV’s database. The DMV is the central repository for accident
data including highway defect data, vehicle statistics, driver statistics and initial
injury information.
• All 50 states prepare data for the Highway Statistics Report published by the
FHWA. Highway statistics were used in several calculations appearing on the
website.
• All states publish a directory of information services executives.
A number of transportation-related organizations exist that could benefit from an initiative to
capture comparable legal, highway, accident, injury, and driver statistics. Federal and state
policy makers would also benefit from the identification of regional and national trends related to
vehicle performance, highway user behavior, and environmental conditions. Security and

48
flexibility are the keys to state participation: states are more likely to agree to participate in the
project if three conditions are met:
• The data are secure from non-authorized access or review;
• Minimal project support is needed from state personnel; and
• Maintenance of a data system will accommodate transitions in the information
system of that state.
49
CHAPTER FOUR
CONCLUSIONS AND RECOMMENDATIONS
CONCLUSIONS
Primary Issues Confronting a Uniform National Data-Management System
The more significant issues confronting the feasibility of creating a uniform data-management
system for national implementation arise from the financial and emotional current that surrounds the tort
claims environment. The concerns tied to tort claims information have manifested in strict
administrative policies to protect the state from further liability and, together with a genuine desire to
protect overworked staff, present a substantial barrier to moving forward with a national data-
management system. With these and other extraneous factors pressing the daily decision-making process
of department heads, the concept of a national data-management system and its value may not have been
clearly grasped by those to whom it was presented during the initial contact for state participation,
especially with the initial phone contact taking place during regular scheduled work hours. To break
through the concerns about participation in a national model data-management system, an education and
demonstration process is recommended to show key officials and decision makers that the system does
not collect sensitive data such as “award caps” and that the burden to their employees would be minimal.
The burden to administrative and technical staff would be highly focused during the initial 3-4 week
survey and assessment period. Once completed, a data retrieval process/mechanism will be developed
that minimizes the involvement of the state’s personnel.
The AASHTO survey questions offered a guide for the selection of featured information that
provided an immediate value for the model system. The core data elements derived from the survey
provided a meaningful set of target data for assessing the state systems. Though the states’ existing legal
and risk management electronic information systems did not support the core data elements directly,
sufficient data resources exist, although not necessarily in electronic form, to obtain the information
specified in the AASHTO study and more. The initial target content of the project focused on supporting
legal and risk management departments; however, the data content required to answer the AASHTO

50
study could support decision making in a number of other functional areas. Information from traffic
operations and motor vehicle departments could considerably enhance the national data-management
system. The traffic operations information can provide added incentive to participating in the project,
added value to the quality and validity of information, and added functionality to the system by
providing the maintenance and engineering departments with a proactive tool to plan and evaluate the
effect of implementing policy and programs. By offering a total package of transportation information,
the utility of a national data-management system could be even more far-reaching, since other joint
federal and state transportation-related organizations could benefit from the same information.
Additional funding partners could develop, especially if a national accident database were established.
Federal agencies would find components of the data useful. An evolutionary process of creating a
uniform data standard will require a commitment to a long-term implementation process that will
depend on the rate of gaining state participation and data analysis.
The ability to overcome the knowledge gap between functional managers and technical support
staff can be realized by implementing a more thorough and in-depth assessment of all related department
information systems within a participant state. Together with a single entity organizing and directing the
assessment and implementation process, many of the issues related to a knowledge gap could be
resolved. The assessment information could be packaged in a reference document that diagrams the
state’s computer-based information network, data content, and its relevant function and value to each
department. The document would enhance understanding and support the state’s technology staff for
assisting the data-management managers.
An immediate value of a system designed according to the parameters set forth in this evaluation
can be measured against the current data systems being used for federal statistics. A problem with
current database technologies out of the box in many transportation industries is the limitations of the
software to handle large amounts of data (Access is limited to 255 fields in a table). Generally the
statistics produced are derived from aggregate totals from a limited population and manipulated using a
data model that theorizes national statistics. They can show the frequency of a particular kind of event
that is a symptom of weakness in a highway transportation system, but not provide the level of analysis
that can help determine the cause. For instance, federal fatality statistics are derived by obtaining raw
statistics from approximately 20 states, and then amplified using a data model that is based on

51
assumptions. The accuracy of the information is low and it does not reflect variations of annual activity
in regions of the country based on other criteria. However, a system that is capable of collecting and
processing whole data records could create an accident profile that is made up of true values. The
accident profile would include demographics, alleged causal factor, and other contributory factors (i.e.,
fell asleep, type of vehicle, weather conditions) that could map out a tort claim from accident report to
litigation defense. This would provide a complete picture of the state and national tort claims
environment for highway accidents. A national data-management system that could process actual data
records would be a very powerful and valuable tool for any state’s department of transportation,
especially those that do not have the internal ability for electronic information sharing.
Data Summary and Requirements
Not all of the data required to complete the AASHTO study exist in electronic format. State
agencies maintain detailed and consolidated electronic files that support accident, injury, highway, and
engineering issues and related statistics addressed in the AASHTO study. Obtaining permission to
access these files is a comparatively simple and straightforward process. The consolidated file structure
is suitable for immediate analysis. Claim and lawsuit data also exist in electronic files. However, the
files lack the scope and detail necessary to directly support the current model system requirements. They
are typically distributed among several legal, administrative, accounting, and judicial state agencies and
outsourced service providers. Permission to access all of the necessary files will require penetration of
executive and technical layers of several state agencies. The broad dispersal of claim and lawsuit data
will require an analyst to review, assess, and extract state resources to generate a consolidated data file.
This would require more time and increased involvement by state personnel to complete the state on-site
survey, but most importantly the permission to access the necessary information systems.
The major obstacle to collecting appropriate data is obtaining permission to review record
layouts and access pertinent data files from all the agencies managing pertinent data. A second obstacle
of importance is determining the existence of key fields or identifiers in an agency’s data structure.
These identifiers enable the association of related statistics to a single record. If the identifiers exist,
then extraction and consolidation can be a simple process. However, if they do not exist, analytical
techniques would be required to sort data and match them to the appropriate record. A third critical

52
obstacle is that too many data fields are not populated, particularly in the legal data systems. An
organizational and individual commitment to the maintenance of current data in the individual state
databases will be necessary if a national data-management system is to be viable and effective. In other
words, claims files will have to be kept current according to the pre-determined data retrieval schedule.
Converting the data into useful information will require analysts to normalize values, standardize
terms, and design data systems that accommodate bi-directional translation. The analyst must understand
all of the terms and values associated with the collected data from each agency before the normalization
and standardization process begins. After normalization the analyst must develop a dynamic standard
data structure based on the “least common data values” (analogous to “least common factor” or “prime
factors” in mathematics). The analysts must develop a translation process to convert data from their
original form to the standard and back again. The collection process will require constant updating to
accommodate changes to information management practices among state agencies. Bi-directional
translation of the data will enable states to make greater use of the content of each data table. Such a
feature would eliminate the learning curve for analysts in each agency and may promote greater
participation among states.
RECOMMENDATIONS
The current functionality of the model system provides an electronic tool for collecting a portion
of the same aggregate information collected by the 1992 AASHTO paper survey. The information can
be entered via web-based entry forms and displayed in preformatted reports that can be updated with
new information every 24 hours. There are a few significant functions and components that require
completion to bring the system closer to representing a fully functional data-management system. The
potential value of completing the current system can be realized. The following options and
accompanying cost estimates were developed by the research team.
Option 1: Refine the Pilot Model Data-Management System
Refine the Phase II Model Data-Management System for Demonstration Purposes. The
model system could be used to demonstrate the potential for a national data-management system

53
and generate interest to proceed with constructing a national data-management system.
Requirements to complete and refine the Phase II work would include:
• Conduct an in-depth review of Phase II model system construction and
presentation with project panel to gain feedback and direction on current model
system .
• Refine the Phase II system components and features:
o Refine existing data model (content and presentation objectives);
o Include information from traffic operations and related departments;
o Reconstruct site components to comply with refined data model;
o Complete Highway Deficiency component;
o Construct custom data entry forms to supplement state’s data electronic
files;
o Complete custom report mechanism for creating presentation-quality
reports that can be printed; and
o Complete overall editing and clean-up of model system.
Cost estimates for Option 1 (shown in Table 4.1) are based on contracting private consultants to
complete the work at a base hourly rate of $50.00 per hour. The time for each of the following
tasks are estimates based on the level of expertise used to develop the pilot data-management
model.

54
Table 4.1 - Option 1 Cost Estimates
Database Developer:
Complete and refine Phase II system components (175 hrs) $8,750
Systems Administrator:
Complete security, system optimization (100 hrs) $5,000
Project Administration:
Administration and Management of Completion process (160 hrs) $8,000
Web Developer:
Complete and refine web content and components. (150 hrs) $7,500
Overhead Cost:
Overhead rate of 40% $11,700
Total Estimated cost to complete and refine Phase II $40,950
Option 2: Production Level Prototype of a National Tort Data-Management System
Construct a fully functional prototype of a national data-management system based on the
findings of Phase II and solicit the participation of more states. Use this system as a premiere
showcase to demonstrate and market the value of a national data-management system. This
process would include the following:
• Solicit participation of five additional states:
o Broaden data pool for standardization process;
o Demonstrate interest and value; and
o Improve cost analysis for national implementation.
• Broaden data collection to include traffic operations and engineering departments.
• Seek the assistance of state Chief Information Officer:
o Obtain permission to access data resources, record layouts, and data;
o Stress need for statistics rather than personal data;

55
o Stress avoidance of personal identification data; and
o Obtain identification of data resources and managing technicians.
• Conduct on-site interviews (increased assessment time to 2 weeks):
o Explore alternate sources of data within the state (e.g., state judicial data);
o Obtain and review record layout for each potential data source;
o Establish record content list with each data resource;
o Establish a transfer method; and
o Establish a monthly transfer date.
• Develop the database system with a dynamic data standard (the programming entity
should be prepared to accommodate metamorphosis of data structures from state
information systems in transition).
• Extend data resources to include traffic operations and engineering.
• Develop automated data collection and reporting process:
o Design an interactive website;
o Provide a secure file transfer protocol (FTP) area;
o Provide direct access to copies of database files in their entirety;
o Provide preformatted downloading reports; and
o Provide search-and-query language (SQL) area.
• Develop an expert data resource should be the goal of the project.
• Provide a research function to expand relevance of content data.
• Utilize contractors with integrated skills (business model and programming
skills).
• Use industry conferences and regional meetings to demonstrate the model system.
• Seek funding partners after initial site and application are complete.
Option 2 cost estimates are shown in Table 4.2. The research team favors the “Expert
System,” which is reflected in the first column of Table 4.2.

56
Table 4.2 - Option 2 Cost Estimates (should include maintenance for at least a
six-month demonstration period)
Estimated Costs Expert System
Automated System
Start-up (1st year only)
Web site development
Central database application development flow chart, program coding, testing and implementation for specialized user functions, preformatted reports, SQL, summary data tables, detailed data tables, charts, and graphs
Administration and Management of System
$60,000
$100,000
$100,000
$60,000
$100,000
Subtotal $260,000 $160,000 First-time costs (per state)
On-site interviews & data acquisition
Data normalization
Automated converter programming
Per State Total
$15,000
$45,000
$47,000
$107,000
$15,000
$54,000
$47,000
$116,000
Subtotal for Five States $535,000 $580,000 One-time cost to review and process data content of the existing pilot system for assimilation into the prototype
$25,000 $25,000
Subtotal of Development Cost $820,000 $765,000 Overhead Cost (40%) $378,000 $306,000 Total Estimated Cost $1,198,000 $1,071,000
Explanation of Terms
Expert System. Provides the human resources that would assist the novice and expert users in identifying, processing, and retrieving inconspicuous and obscure information quickly and easily. The system should allow simple or complex analysis and provide referent experts to assist all users in addition to the standard user functions. Expert assistance enables expert users to complete analysis on issues outside of their functional expertise. An expert system requires full-time administrative staffing.
Automated System. Provides for an on-line reference library to be developed as a supplement or replacement for the human resource offered in the expert system. It would allow users to access reference information through an automated search function. This includes: definitions of terms, procedural descriptions, and topical discussions. An automated system requires contracted part-time staffing, but no user support would be available. The costs of Option 2 presented in Table 4.2 reflect the assumption of a core
development team consisting of six members (four functional analysts/researchers with
programming skills, one system administrator, and one web developer/webmaster) to coordinate

57
data content, maintain data content, and respond to member support issues during the duration of
the project development, test phase, and a 1-year trial period. The development team could be
utilized on a contract basis following the first year, should the project require it.
Option 3: Implement and Maintain a Full Production Model of a National Data-
Management System
Construct and maintain a fully operational, national data-management system for a 3- or
5-year period beginning with a 10-state sample and adding either 10 or 20 states per year after
the initial year. The first-year cost estimate for Option 3 is shown in Table 4.3a. The estimated
cost per year for subsequent years is shown in Table 4.3b. Option 3 includes the following:
• Proceed with a national system:
o Refine existing data model (content and presentation objectives);
o Provide an input form that all states can use to complete legal and case
management statistics, should any state lack the appropriate information
systems (paper-based);
o AASHTO members should only need to update a short form on the website
annually (see Figure 4.1);
o Provide SQL area; and
o Provide chat room access.
• Develop an expert data resource.
• Provide a research function to expand relevance of content data.
• Utilize contractors with integrated skills (business model and programming skills).
• Seek funding partners after initial site and application are complete.
• Seek the assistance of state Chief Information Officer:
o Obtain permission to access data resources, record layouts, and data;
o Stress need for statistics rather than personal data;
o Stress avoidance of personal identification data; and
o Obtain identification of data resources and managing technicians.
• Establish an FTP site to collect data.

58
• Conduct on-site interviews:
o Obtain and review record layout for each potential data source
o Establish record content list with each data resource;
o Establish a transfer method; and
o Establish a monthly transfer date.
• Develop the database system with a dynamic data standard (the programming entity
should be prepared to accommodate metamorphosis of data structures from state
information systems in transition).
• Develop automated data collection and reporting process:
o Design an interactive website;
o Provide a secure FTP area;
o Provide direct access to copies of database files in their entirety; and
o Provide preformatted downloading reports.

59
Table 4.3a – Option 3 Cost Estimates, 1st Year
Estimated Costs - 1st Year Expert System
Automated System
Start-up (1st year only)
Web site development
Central database application development flow chart, program coding, testing and implementation for specialized user functions, preformatted reports, SQL, summary data tables, detailed data tables, charts, and graphs
Administration and Management of System
$60,000
$100,000
$100,000
$60,000
$100,000
Total $260,000 $160,000 First-Time Costs for State’s Data Retrieval (per state)
On-site interviews & data acquisition
Data normalization
Automated converter programming
Per State Total First Time Cost
$15,000
$45,000
$47,000
$106,000
$15,000
$54,000
$47,000
$117,000
Total First-Time Cost for 10 States $1,060,000 $1,170,000 Sub-Total $1,320,000 $1,330,000 Overhead Cost (40%) $528,000 $532,000 Total Estimated First Year Cost (10 States) $1,873,000 $1,887,000

60
Table 4.3b – Option 3 Cost Estimates, Subsequent Years
Estimated Cost - Subsequent Years Expert System
Automated System
Administrative and Support Cost
Per Year - Total base costs and annual maintenance by core development team (existing states). Cost based on first time start-up + administration and maintenance + $50,000 for contracted programmers and specialists
$310,000
$0
Cost of State’s Data Retrieval for Subsequent States After First Year
10 Additional states per year (cost per state) ***$75,000 $116,000 20 Additional states per year (cost per state) ***$65,000 $116,000 Total Cost for Administrative/ Support Cost + State’s Data Retrieval Cost
Per-Year Cost - (20 states per year after first year) $1,610,000 $2,320,000 Per-Year Cost - (10 states per year after first year) $1,060,000 $1,160,000
Total Cost to Implement and Support a National Data-Management System for all Fifty States with a 40% Overhead Rate (Includes First-Year Costs from Table 4.3a)
3-Year Plan $7,130,200 $9,137,800 5-Year Plan $8,558,200 $9,137,800
Costs represent per-year costs (after initial development) for processing states data and system maintenance.
*** Demonstrates economy of savings per state after first-time development costs. Explanation of Terms Total Base Costs and Annual Maintenance. • Review and update data structures of participating states. • Review and update data transfer methodology per state. • Conduct system analysis. • Update terms to comply with changes in state or professional nomenclature. • Update reporting methodology, topics, and content. • Conduct analysis of national and regional trends.

61
Figure 4.1 Sample Data Format
Recommendations for Service Providers to Implementing a National Data-Management System
The following proposal options are listed in the order the research team believes offers the best possible
outcome for implementing the data-management system on a national level.
Proposal 1: Private Provider
The use of a private provider may be the most expensive of all the options. However, the benefits of
having the broadest knowledge base for melding information technology and business processes into an
effective outcome-based system justify the higher cost. A profit-oriented vision in system construction
would greatly increase the chances of obtaining the outcomes that make information management a
valued asset. There may also be some provision for data security by having the information under the
control of a private service provider. Among private alternatives are existing commercial vendors that
provide legal or general research databases. The interest and capabilities of such vendors to provide and
to operate the required system should be explored.
Internal Case No.
Accident File Ref.
Police Report Ref.
External Case Num
File Date Injury Deficiency No. of Claimants
Withdrwal Date
Settlement Date
Settlement Judgement Award
12345678910
Exported dataDepartmental Information
62
Proposal 2: Bureau of Transportation Statistics (BTS)
The Bureau of Transportation Statistics within the U.S. Department of Transportation has become a
clearinghouse for transportation statistics. However, the limitations of the bureau’s resources to
implement a system of this magnitude are a concern. The cost of conducting the on-site surveys/data
assessment and available human resources may be problematic for the bureau, though the project would
benefit in cost savings from an existing infrastructure and knowledge base for implementing web-based
services. Another alternative that could be explored is AASHTOWare.
Proposal 3: University Research Institute or Center
Though a university-based service provider was offered as an option in the Interim Report, the research
team does not believe this environment is conducive to the effective implementation of the national
project. The project requires a full-time team of professionals that are highly knowledgeable in many
areas to completely understand the information flow and outcome requirements for the system. This
would not be the most optimal choice for obtaining results in a timely and cost-efficient manner.
Sub-Proposal
The researchers believe that every effort should be made to include consultants from the Public Risk
Data Project (PRDP) in the project. The cost analysis and coding tools provided by PRDP could prove to
be invaluable to the system. The tools could not only assist the user community, but also prepare the
data for input into the increasingly popular PRDP Data Exchange.
REFERENCES
American Association of State Highway and Transportation Officials (1992), AASHTO Survey on the Status of Sovereign Immunity in the States. Gittings, G. L. (1999), Interim Report for NCHRP Project 11-7, Pennsylvania Transportation Institute, The Pennsylvania State University.

63
APPENDIX A: CORE DATA ELEMENTS FOR THE MODEL SYSTEM
State Code: Date of information to be entered (year only):
Sovereign Immunity
Indicate the status of sovereign immunity for highway tort actions (claims/lawsuits) in your state: Full or absolute immunity Limited immunity only No immunity protection
What types of award limits, immunities, or restrictions on liability exist in your state? Please select all that apply: Limit or cap on dollar amount of damage award If yes: Ceiling per injured person Ceiling per occurrence or incident Joint and several liability Design Immunity Other (non-design) discretionary immunity Economic or budgetary defense Collateral source of payments Non-economic damage awards permitted Punitive damage awards permitted Contributory negligence standard Comparative negligence standard Legislative approval required on each litigation settlement
In what year did your state first loose or modify sovereign immunity for highway torts? Yr

64
Please cite the applicable constitution, statutes, or case that currently governs sovereign immunity for highway torts in your state: (250 characters or less) Text Information will go here!!! Claims/Lawsuit Procedures Does a “tort claims act” or other legislative scheme for litigating tort actions against the state exists in your state, please provide a brief description Y/N Date that act or scheme was put into effect Please provide brief explanation:
(Text information goes here)
What type of tribunal is used for deciding highway tort litigation brought against your state? Claims Board or Claims Commission State Court of Claims or similar Special Court State Legislature Trial Courts of General Jurisdiction
If your state uses Trial Courts of General Jurisdiction, select the following that apply: Jury trials permitted
Plaintiff is permitted to establish venue in own county (parish) regardless of where accident occurred
Plaintiff is limited to establish venue in county where state defendant agency maintains its headquarters regardless of where accident occurred.
State requires special legislation to pay each tort award

65
Claim & Lawsuit Statistics Enter the number and dollar amount of highway tort claims (pre-litigation) for each of the following categories, for general liability only:
New claims filed (new injured party or incident) Claims disposed without an award Claims disposed by settlement Claims disposed by judgment
Enter the number and dollar amount of highway tort lawsuits, for each of the following categories, for general liability only:
New litigation filings (exclude appeals) Lawsuits disposed by settlement Lawsuits disposed of with a court judgment Lawsuit disposed of without an award
Enter the number and dollar amount for each of the following categories of pending tort actions, general liability only: Highway tort claims Highway tort lawsuits
Attorney Statistics
Enter full time equivalent number and total salaries of types of counsel used to defend highway tort litigation (include salary additive for fringe benefits for in-house staff): Salaried highway agency staff attorneys Attorney General’s Office Attorneys Private Counsel Other

66
Did your state experience an increase in the number of the following attorney types hired in relation to the loss of sovereign immunity?
Staff Counsel Assistant Attorney General Private Counsel
Injury Statistics If your state classifies tort actions by type of physical injury, please enter the number of highway tort claims or lawsuits in each of the following categories (please use the most serious type of injury for each claim or lawsuit) Injury Type:
Amputation Blindness Broken Back Burn Deafness Declaratory relief Emotional distress Fatality Head/Brain Damage Hemiplegia Indemnity Internal Injuries Laceration Loss of Consortium Paraplegia Property Damage Punitive Damages Quadriplegia Soft Tissue Damage Undetermined Worker’s Comp paid Wrongful Death

67
Employee Liability Statistics Please provide number and amounts where appropriate
Total highway tort actions filed against agency’s employees in an individual or personal capacity
Total Number Total Dollar Amount
State has a statutory duty to defend and indemnify state employees in highway tort actions If there is a cap limit, please provide:
State provides employee tort insurance protection? If there is a cap limit, please provide: State provides for judgments against employees acting in the line of duty? If there is a cap limit, please provide: Contractor Indemnification Statistics
Does your state require that contractors furnish liability insurance to pay damages to highway users?
Does your state require its contractors to defend, indemnify and hold harmless your state agency and/or its employees from highway tort actions filed by highway users in your state?
Does your state require that the agency and/or its employees be named as an additional insured in any contractor liability insurance that is required?
Does your state require that the agency and/or its employees be insured by an owners’ and contractors’ protective liability insurance policy (OCP), or a similar type of insurance policy, purchased by the contractor?

68
Insurance Statistics State maintain liability insurance on highway tort actions? Select the type, policy limits, and yearly premium of liability insurance available for highway tort actions in your state: Blanket tort policy Coverage for automobile liability Coverage for construction equipment operation Coverage for maintenance equipment operation The agency’s liability is limited to no greater than the policy limits for: (select all that apply) Blanket tort policy Auto policy Construction/maintenance equipment policy Aircraft policy Agency carries excess coverage or catastrophic coverage?
If yes, provide dollar amount of coverage: State's liability insurance limited to covering agency’s motor vehicle fleet State maintains a self-insurance program for general liability If yes, why (please provide brief explanation under 250 characters) (Enter text information here) State maintains a self-insurance program for highway tort actions: Specify program or liability that is self-insured (under 250 characters) (Enter text information here)

69
General Risk Management Training and Resource Statistics State provides employee training in risk management or highway tort claim liability (Y/N) Training Provided (check all that apply): In-house training Independent consultant Other Level of employee trained (check all that apply)? Executive management Middle management Highway design staff Attorneys Field supervisors Field maintenance employees Highway maintenance and operations staff Highway construction and materials staff Highway safety and traffic engineering staff Others Topics covered in the training (check all that apply)? Introduction or scope of problem Proper highway maintenance Accident reduction Proper signing Documentation at accident site High risk areas Expert witnesses Legal procedures Please, provide your state's contact person for risk management or tort liability training activities or programs: Name

70
Title
Address Telephone # Fax #
Please, provide information about risk management and tort liability training materials and/or trainers that you are aware, what issues were addressed, and its effectiveness in meeting need (poor, satisfactory, good, excellent). Title of Training Trainer Issue that training addresses Rating Expert Witnesses Testimony and Discovery Information Is your state recording this information for expert witnesses in digital form: Name Address Telephone # Area of Expertise Testified for: Plaintiff or Defense Record tag# (associated with documents to be searched) Is Court testimony and/or case research information being stored on digital media.
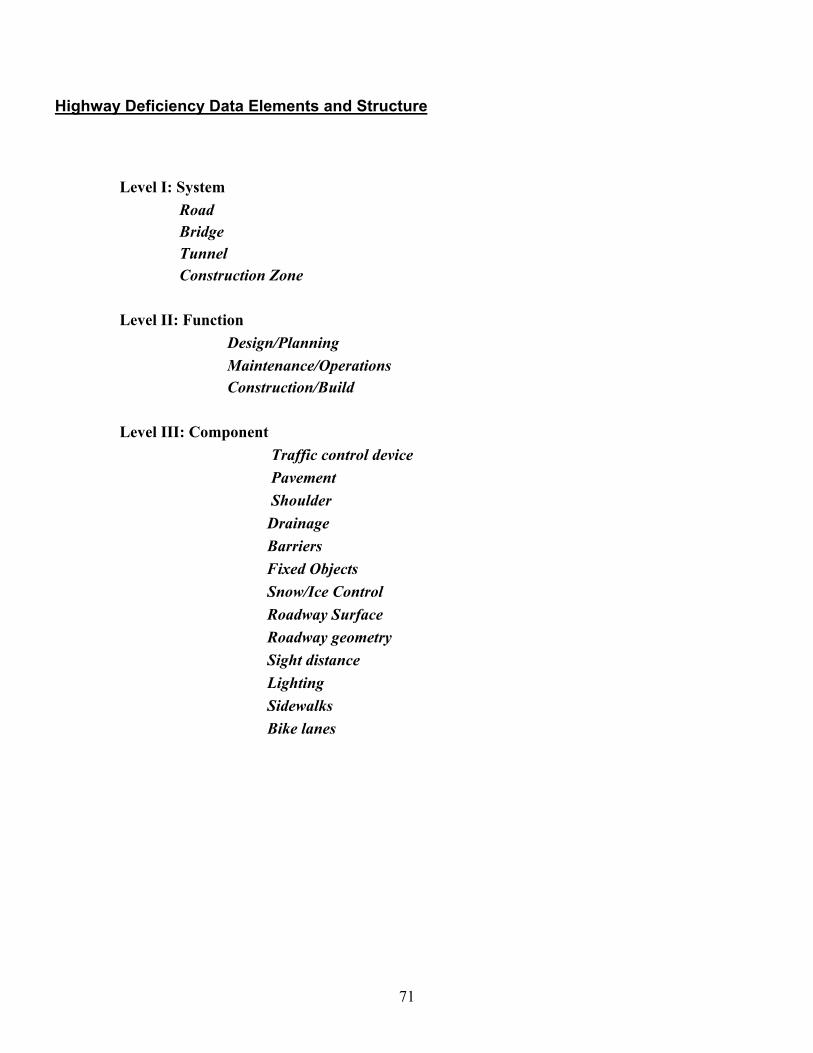
71
Highway Deficiency Data Elements and Structure
Level I: System Road Bridge Tunnel Construction Zone Level II: Function Design/Planning Maintenance/Operations Construction/Build Level III: Component Traffic control device Pavement Shoulder Drainage Barriers Fixed Objects Snow/Ice Control Roadway Surface Roadway geometry Sight distance Lighting Sidewalks Bike lanes

72
APPENDIX B: SAMPLE GROUPINGS FOR STATE SOLICITATION PROCESS
Group 1: California (preferred)/Washington (first alternate) Multi-site connection with restricted access to a highly secure system Commercial data collection software
High level use of technology - Current network and desktop operating system Group 2: Florida (preferred)/South Carolina (first alternate) Multi-site connection with direct access to a medium secure system Industry standard data collection software (compatible) Medium to high level use of technology (network and PC operating system) Group 3: Montana (preferred)/Wyoming (first alternative) Single and multi-site connection with direct access to a medium secure system Industry standard data collection software (non-compatible) Medium to high level use of technology Group 4: Nebraska (preferred)/Illinois (first alternate)/Iowa (second alternative)
Single-site connection with direct access to legacy-type computerized information system Industry or custom data collection software Medium level use of technology Group 5: West Virginia (preferred)/Arkansas (first alternate) Single-site connection with direct access Conventional data collection system (paper) Low level use of technology

73
APPENDIX C: STATE SURVEY LETTERS AND INTERVIEW RESULTS
Invitation Letter
PennState The Pennsylvania Transportation Institute The Pennsylvania State University 201 Research Office Building University Park, PA 16802-4710
July 28, 2000 To: Dear _________, Re: Invitation to participate in the National Cooperative Highway Research Program Pilot Project for a
National Data-Management System for Highway Tort Claims Dear _________,
The purpose of this letter is to request the participation of the state of __________ in Phase II of a pilot project being conducted by the Pennsylvania Transportation Institute of Penn State University for the National Cooperative Highway Research Program (NCHRP). The purpose of the pilot project is to assess the feasibility of a National Tort Data-Management System for highway-related tort claims. The central component of Phase II is a simulation of a full-scale data-management system. The goal of developing the system is to provide state departments of transportation with access to general tort claim information of a regional or national interest, receive periodic reports of national tort claim information, and make specific queries for information pertaining to defined criteria. In essence, the system is an electronic version of a tort data survey and report produced by the American Association of State Highway and Transportation Officials (AASHTO) from the mid-1970s through the early 1990s.
There are many issues to be considered in retrieving and organizing tort-related data and there are many concerns that individual states have for participating in such a project. Foremost among the latter are protecting the confidentiality and integrity of existing state tort database records and minimizing additional burdens on state legal and tort claims personnel. With regard to confidentiality and integrity, the prototype national database has been designed to use only summary information from each state, not individual tort claim records. The challenge for the pilot project is to devise automated means of converting existing state tort information into a standard summary format for input to the national database.
Meeting this challenge requires working with your department personnel in implementing the process of data retrieval and network interface. It will be necessary for the project research staff to meet with state department personnel responsible for the administration of tort data, knowledgeable of the information flow for record keeping and tracking of tort claims, and knowledgeable of the database structure and network system. The assistance of these key personnel will help us to identify and retrieve the data from your tort information system that will make it possible to create a meaningful and accurate collection of summary information.

74
If you agree to participate as a pilot state, the next step is to for me to schedule an on-site visit to your
facilities to meet with the appropriate staff. The purpose of this meeting will be to discuss the details of the project, review your tort information system, set data integrity and security parameters, and determine the best methods of data retrieval.
I would appreciate if you would let me know by _____________, if your state is willing to be a participant in the pilot project. In the interim, if you have any questions, please contact me at 814-863-1896 or [email protected]. If I am not in, Mr. Michael Kerchenksy at 814-863-1086 or [email protected] will also be pleased to answer questions. Our contract manager at NCHRP is now Mr. Harvey Berlin at 202-334-2441 or [email protected] and he too is available to discuss any concerns that you have about the project. I thank you for your consideration of participation in this initiative and look forward to the opportunity to work with you in the future.
AGENDA LETTER
To: From: Michael E. Kerchensky Technical Project Manager Pennsylvania Transportation Institute Date: Dear __________,
Subject: Agreement to on-site visit and participation in the NCHRP 11-7 pilot project for a National Data-Management System for Highway Tort Claims.
I would like to thank you for your willingness to participate in the project and accommodate our schedule for the on-site visit. Included in this memo are a tentative agenda and schedule, plus a list of department personnel that we would like to meet with during the visit. The state of _______________ agreed to participate in PHASE II of a pilot project being conducted by the Pennsylvania Transportation Institute of Penn State University for the National Cooperative Highway Research Program under the Transportation Research Board. The purpose of the pilot project is to assess the feasibility of a National Tort Data-Management System for Highway Tort Claims. The central component of this Phase II proposed work plan is a simulation of a full-scale data-management system. The goal of developing the system is to provide state departments of transportation with the ability to contribute valuable data to the system, access general tort claim information, receive periodic reports of national tort claim information, and make specific queries for information pertaining to defined criteria.

75
You have agreed to a tentative on-site visit by the project team for the dates of _________, 2000. The team would like to meet with those persons responsible for the collection and administration of highway tort information, which includes but not limited to risk management and insurance data, traffic operations and accident data, and tort claims data in paper or electronic form. In addition, we would need to meet with the information technology person responsible for the administration of your database and network systems. As I recall, you identified the personnel that would be able to assist us identify the source, location, and access to the information we are seeking. This document should aide you in identifying any other personnel that you might consider helpful in accomplishing our task. The general purpose of this visit is to review the details and purpose of the project, review your information systems, strategize the best methods for data access and retrieval, and explore the potential framework that you would like the information to be returned to you from the data management system. The following outline is a general guide to what we would like to accomplish during the visit. On-site Visit Agenda: Morning agenda:
• Discuss the goals and objectives of the pilot project • Discuss states concerns of participating in the pilot project • Discuss the required data and information to be retrieved • Discuss methods of data extraction and system interface • Discuss the incorporation of text based documents form court files • Discuss security and protection of information • Present the basic data components of the central tort database • Present concepts for access to the tort database by state departments
Afternoon agenda:
• Interview risk management personnel
• Interview legal division personnel
• Interview traffic operations personnel
• Interview information technology personnel
• Interview person(s) knowledgeable of information flow and tracking
Project team reviews the legal division information system
• Identify required data fields/information
• Identify desired data fields/information
• Identify method of data retrieval/collection

76
• Identify method of data/information transport to database developer
Project team reviews the risk management information system
• Identify required data fields/information
• Identify desired data fields/information
• Identify method of data retrieval/collection
• Identify method of data/information transport to database developer
Project team reviews the traffic operations information system
• Identify required data fields/information
• Identify desired data fields/information
• Identify method of data retrieval/collection
• Identify method of data/information transport to database developer
If needed:
• Follow-up with individual personnel
• Follow-up with information technology personnel
• Explore any items that were not part of original agenda
In order for us to meet our planned schedule for the project, I would very much like to solidify the on-site visit that was tentatively scheduled for ___________,2000. If at all possible, I would like to confirm these dates by _______________, 2000. Your efforts in this matter are greatly appreciated. If you have any questions about participating in the project prior to the site visit, please Feel free to call me at 814-863-1086 or mail me at [email protected]. Thank You. Sincerely, Michael E. Kerchensky Pennsylvania Transportation Institute Penn State University Technical Project Manager NCHRP 11-7

77
California DOT Tort Information System Profile:
Attendees: Brelend Gowan, Chief Deputy Counsel; Richard Wehe, Risk Management and Tort Liability; Marty Cromwell, Business Manager and database manager for legal division; Loren Fanucchi, Database manager for Board of Control; Goeffrey Young, Network Administrator System Environment: Information Network = L.In.C.S (Legal Information Network Claims System)
All legal staff and claims processing can access information from multiple sites over intranet
Topology = MAC OS 9, Power Mac computers, Novel network Database = File Maker Pro 3 (server) and File Maker Pro 5 (client) Legal Div. and BoC data on one server
TASAS (VSAM file system) two databases of custom on Mainframe (Sunmicro System) Expert Witness information
Reviewed current status of pilot project goals and objectives with CalTRANS staff Data categories and extended data objectives:
• 12 base data categories (75 + data elements), data legend, and metafile • TASAS – California accident data from highway patrol • Claims record fields that can be utilized to expand search functions for statistical
and trend analysis • Census and Demographic support information • Expert Witness testimony and discovery information (limited) • Other court document information (limited) • California global information with limited access to specific data of CalTRANS
only (National database recommendation) • Reviewed their system updates from Phase I information
Updated: Filemaker Pro server and client Adding Firewall and VPN (?)
• Discussed Technical Support Group Engineering – Transfer of information from • Engineers to Legal Division for planning, design, analysis, and witness
preparation (Richard Parenti) • Discussed exposure issues of data export and methods of data dissemination in a
protected manner with aggregate totals (Richard Wehe)

78
Available tort claim information and related transportation information:
[Acquired access to all data elements in the tort claims database pending the removal of all identifiers that could permit any user to determine the individual claim or claimant.]
Board of Control (Loren Fanucchi under General Services)– Initial filing of all tort claims. Processes filings under $25,000 using a non-governmental review board made up of two transportation officials, one attorney, and one civilian gubernatorial appointee.
Claim – received and sent to district office for investigation, discovery information is sent back to board of control.
FILED - Claim Types: 02 = Property, 2A = Personal Injury, 2B = Temporary Roadway Hazard (i.e. Construction Zones or Road Blockage), and LateApp = Late file
SETTLED – cases remain on file for one year
DENIED – defendants have 6 mths – 1yr to file a law suit to CalTRANS legal division
L.In.C.S. Legal Information and Contact System (Brelend Gowan under CalTRANS Legal Division) - Primary database containing tort claim and attorney information. Cases are assigned to attorneys from Chief Counsel
• Cases over $25,000 • Archive data for 5 – 6 years. • Data fields completed sporadically before1999 • Approximately 6 weeks for attorneys to enter initial data • Cases tracked by Special Designation # (tag for all related
information to case) • Cases dealt with individually, no current trend analysis on data
Expert Witness – Contains name, field of expertise, and contact information for experts used by CalTRANS. All experts are maintained under a master contract and linked to cases by special designation #.
• Attorneys are scanning expert witness testimony • Courts are keeping witness testimony on e-form

79
T.A.S.A.S – (Kim Nystrum, Janice Benton, Ed Fitzgerald - technician) Traffic Operations - Contains accident and highway information created from C.Hi.P. databases
• Coded information on accident statistics: location, injured
parties, type of vehicle, type of roadway, environmental condition, type of collision, and other details
• 25 years old (Oracle conversion in progress?) • Data exported in ASCII format • Red Flag repeat conditions and locations • Coordinate FTP download schedule with PTI for ongoing
data updates
Time schedule for data updates and site export: (Marty Cromwell) • New case data takes approx. 6 weeks to be initiated • Easy export from File Maker Pro (Tab Delimited) • Export dependent on data input and update intervals by
CalTRANS legal staff • Data export - Initial (1yr. Archive), then monthly or bi-
monthly export • Static – Initial collection by survey (annual update) • Dynamic – Ongoing collection from site DB (updated
monthly) Method of data export appears to be Tab Delimited text file to:
Host server = firewall to internet, timed modem download via FTP
Email transport Media (disk) Transport
Data security and protection during transfer:
MRCsq. (Luther McNeal) - demonstrate how selected fields can be exported from database.
Removal of trace code or record reference to original claims record
• No Name or personal identification information • Remove Special Designation # and replace with
other code • Utilize aggregate totals of Prayer, Reserve, and
Settlement • Separate Route, County, and Milepost

80
L.In.C.S. database elements were reviewed and all determined to be included in pilot project with all case identifiers removed. The following was accomplished during the site visit
• Sample copy of database with data deleted given for review • Dissect database for all fields and identifiers • L. McNeal reviewed data elements field by field • L. McNeal completed verification of security information with R. Wehe
Met with staff attorney to discuss TASAS database structure and ability to export data for inclusion into the model system to support tort information. Explored data utilization beyond basic 12 categories for trend analysis and risk management support = purpose for collecting all data available in system or on record Legal Environment for defense: Common Statistics from survey portion of information 99% of all cases are jury trials by preference
Plaintiff Attorneys must prove that there was a: 1.) Dangerous Condition 2.) CalTRANS had notice of, or in some manner created the condition 3.) Prove that condition caused the injury 4.) Accident itself reasonably foreseeable 5.) Prove damages
If state can prove they acted reasonably to prevent the condition = good chance to be held not liable.
Met with Kim Nystrum, Janice Benton, and Ed Fitzgerald (TASAS technician) to discuss export of accident information for incorporation into the Central DB as support information to contributing factors in accident claim.
Data is in a legacy system that can export data in ASCII text format via FTP transfer. Follow up will be to setup FTP function on TDB server for transfer
West Virginia DOT Tort Information System Profile: Attendees: Administrative Charles R. Lewis; Traffic Engineer, Division of Highways Jeff J. Miller, Legal Division, Division of Highways Robert Paul, Legal Division, Division of Highways

81
Robert A. Fisher; Claim Manager, Board of Risk and Ins. Mgmt Charles Mazingo; Claim Manager, Board of Risk and Ins. Mgmt Technical Michelle and Joann; Information Sciences and Communication for Highway Division Carlin McKendrick; Database Administrator for Engineering Tim Martin; DB admin for Roadway Inventory DB Robert Roberts; IS&C technician for WV, contact for export and transmission process from state system Database/Information Systems: Legal Division: Paper Records only Traffic Operations: Accident Database Roadway Inventory Financial System (attorney’s fees) Authorization System (case related cost) Board of Risk and Insurance Mgmt AIG, Inc. Private proprietary system and individual contract attorney files. Information Sharing: Legal division shares information on a case-by-case basis. No standard or organized information collection process to track significant and precedent setting cases, archive cases, connect case information with other information systems. There is no internal case ID that serves as a common tracking number between departments. (Archive data is primarily memory of senior staff) Traffic Operations maintains data tracking for accident information, property inventory, project scheduling and monitoring, etc. Provide limited internal instruction and education for risk management. Board of Risk and Insurance Management functions as watch dog for expenditures due to loss and liability. Provide minimal to no internal risk management services and education to Division of Highways. Reports that they have No Power to implement policy-changing initiatives within the state system, since policy changes only appear to be altered through legislation resulting from extreme cost lawsuits. Data Access/Retrieval: (High Difficulty)
Legal Division (paper systems) No common summary or tracking sheets that organize case files. Attorney tracks case information that is non-legal document by their own method.

82
Cost of scanning to high, though WV is looking for source to scan archived files. NO way of getting archive data and future collection of data will have to serve an internal benefit for the attorney’s to use it. Traffic Operations (DB2 database on State Mainframe System) Currently custom extraction programs used to query and download information from the program. Can be saved to disk, tape, and FTP file by an IS&C staff person. Board of Risk and Insurance Management (Proprietary System) What we know = the database that AIG, Inc. uses is dumped into the state DB2 format database, since they do monthly audits of the cases and expenditures. The board of risk receives the case and enters information for approximately 6 data fields, then passes the case information on to AIG, who in turn returns the full data records of the case after trial. (will need to contact AIG, Inc. via Board of Risk and Ins. Mgmt in the next couple of weeks)
Information Flow: Paper Filing of a Loss Claim:
Loss claims begin with: Claim files via “process serve” or mail to circuit court or court of claims are given to Bob Paul (circuit Court) or Drew (court of claims) who then decides whether there is:
Insurance: Filed in circuit court = case is transferred to AIG
Jury trial and insurance cap is 1,000,000 (moral obligation to pay)
No insurance: Court of claims = case is defended by legal division
Trial before Panel of three judges with no Cap on settlement, however guidelines for liability are more stringent Claims Investigator investigates all cases filed in court of claims. The Police (ACCIDENT) report is obtained, witness are interviewed, and expert witnesses are retained > Cases are either Dismissed, Tried, or Settled
Expressed needs and desires from a National Database*:
*Expert Witness Testimony Summaries = Highlights of testimony as related to case

83
*Trend information from national perspective = compare West Virginia to other states in regards to contributing factors, injury, and award.
*Risk Management = There is no formal risk management operation for DOT, so any information would be valuable to them.
Internal needs:
District Issues = internal information source that could provide proactive maintenance or construction projects. Currently motivated by law suits
Information on Precedent setting cases = Currently this information is provided by private companies at a premium. Information is difficult to gather in electronic form = cost of man hours to search and scan
Follow-up needed for site visit:
Letter to AIG via Board of Risk for access to information in their database (LJM - content information, MEK – cover letter from PSU)
Talk to GLG about TRB policy and trade agreement with private companies (AIG)?
Contact Rob Roberts and other tech staff of IS&C – WV about data export from mainframe (get Ph # from Ray)
Florida DOT Tort Information System Profile (10/25/01)
Attendees: Pam Leslie, Chief Counsel, and Steven Ferst, Chief Civil Litigation Counsel, Office of the General Counsel; Trilly Lester, Bureau Chief, Office of Insurance and Risk Management; Joyce Edwards, Local Area Network Administrator, Office of the General Counsel; and Eric Larson, P.E., Traffic Management Systems Engineer State System Environment: Information Network = Legal has 60 user private network that is part of the FLA intranet. Insurance and Risk Management network is not connected to intranet due to sensitivity of information on their system. Traffic operations maintains two separate databases: Accident stats and Maintenance Issues Topology = Novell and NT 4 network with mainframe AS/400 and Client/Server environment. Direct connection can be utilized with legal office on NT server RAS connection, email transfer, or FTP site

84
Database = Legal > Time Matters; Risk Management > Corporate Systems on AS/400 mainframe; Traffic Operations (Highway Safety and DMV)> Mainframe database that records law enforcement accident reports Data categories and extended data objectives:
• 12 base data categories (75 + data elements), data legend, and metafile = Legal keeps minimal independent records, but I&R Mgmt. keeps complete database on all claims filed with FLA DOT.
• Legal records cases assigned to them by I&R Mgmt and cases that are appealed under Claims Bill Act (cases that are seeking over the $200,000 cap limit, requires legislative sponsor = low volume of cases. States can appeal claims filed under this act.)
• Discussed issues of risk = High (i.e. Florida Sunshine Act is a very liberal application on public data)
• Expert Witness testimony and discovery information (contact court system for record availability)
• Other court document information (connected to specific case through Time Matters)
• Insurance and Risk Management has more administrative control over case records. Closed cases are a matter of public record, but Open cases are highly confidential > require only basic information for tracking purposes = alleged casual factors (deficiency), alleged injury, damages sought, current status of case, etc. (No identifiers)
Available tort claim information and related transportation information:
[Acquired access to all data elements in the tort claims database pending the removal of all identifiers that could permit any user to determine the individual claim or claimant.]
Claim – filed with both general counsel and I&RM. Claim is investigated by Annette (Office of legal counsel) and then results of investigation are sent to I&RM for assignment to internal general counsel or contracted attorney. Records are maintained by I&RM.
Filing Process- Claim filed, DOT/I&RM have six months to settle or contend claim following investigation by Annette Rogers (DOT Legal) {may be a research application for database}, if deny case goes to jury trial, where legal gathers more information in discovery{key entry for database information}, result is dismiss or award (up to $200,000), with potential for appeal to Claims Bill Act
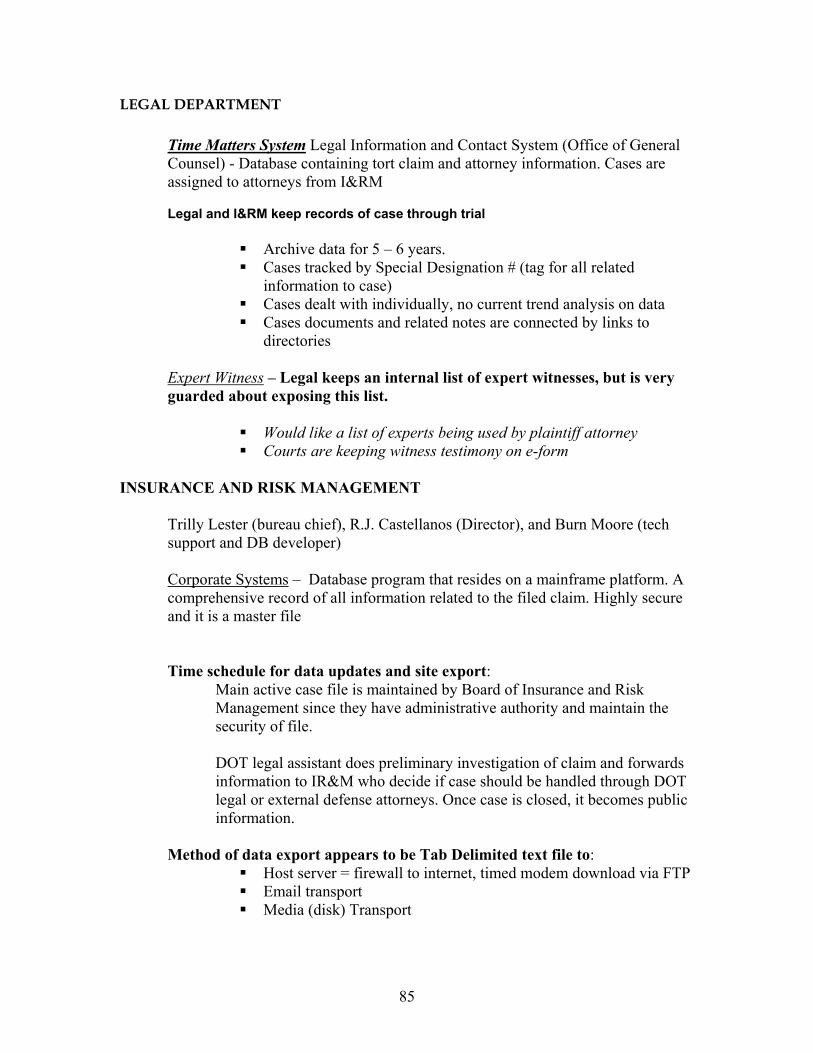
85
LEGAL DEPARTMENT
Time Matters System Legal Information and Contact System (Office of General Counsel) - Database containing tort claim and attorney information. Cases are assigned to attorneys from I&RM
Legal and I&RM keep records of case through trial
Archive data for 5 – 6 years. Cases tracked by Special Designation # (tag for all related
information to case) Cases dealt with individually, no current trend analysis on data Cases documents and related notes are connected by links to
directories
Expert Witness – Legal keeps an internal list of expert witnesses, but is very guarded about exposing this list.
Would like a list of experts being used by plaintiff attorney Courts are keeping witness testimony on e-form
INSURANCE AND RISK MANAGEMENT
Trilly Lester (bureau chief), R.J. Castellanos (Director), and Burn Moore (tech support and DB developer)
Corporate Systems – Database program that resides on a mainframe platform. A comprehensive record of all information related to the filed claim. Highly secure and it is a master file
Time schedule for data updates and site export: Main active case file is maintained by Board of Insurance and Risk Management since they have administrative authority and maintain the security of file. DOT legal assistant does preliminary investigation of claim and forwards information to IR&M who decide if case should be handled through DOT legal or external defense attorneys. Once case is closed, it becomes public information.
Method of data export appears to be Tab Delimited text file to:
Host server = firewall to internet, timed modem download via FTP Email transport Media (disk) Transport

86
Data security and protection during transfer:
MRCsq. (Luther McNeal) - demonstrates how selected fields can be exported from database.
Removal of trace code or record reference to original claims record
• No Name or personal identification information • Remove Special Designation # and replace with
other code • Utilize aggregate totals of Prayer, Reserve, and
Settlement • Separate Route, County, and Milepost
Corporate System database elements reviewed and all determined to be included in pilot project with all case identifiers removed:
• Sample copy of database with identifying data deleted will be provided by Burn
Moore • L. McNeal will review data elements field by field • L. McNeal completed verification of security information with Burn Moore
Explored data utilization beyond basic 12 categories for trend analysis and risk management support = purpose for collecting all data available in system or on record. Insurance and Risk Management ***Insurance and Risk Management felt it would be useful to have accident information to compare legal allegations with the actual accident report. Would like to Bench Mark with other states. Florida I&RM may be able to categorize deficiency codes to Level III. Would like to compare FLA to states with similar Sovereign Immunity Standards (i.e. liability coverage, caps, etc.). Would like training contacts for Risk Management information. Claim Bill attempts and successes Legal Environment for defense: Florida has a Claim Bill Act that provides for potential award higher than the $200,000 cap. This requires a legislative sponsor and new legislature must be written in order for the award to be paid. This process only occurs after jury trial and an appeal has been filed. Low frequency and plaintiff and attorney must have the funds for long case process. Statute of limitations on the amount a plaintiff attorney can charge client. ****Florida would be interested in finding out if other states have similar situation and whether they were ordered to institute act or voluntary. Also very interested in Expert Witness information, but unwilling to provide same information from their state????

87
TRAFFIC OPERATIONS Department of Motor Vehicle and Highway Safety (Millie Seay)
Provides statistical analysis of accident information. They are currently creating a standard, less subjective, accident report form for police officers that will utilize some portable pc device = laptop, palm pilot, mini-pc (Like UPS tracking). Their data would be more of a resource pool for legal and risk management.
Fatal Accidents = (Maintain narrative sections of the accident report that describes the cause of the accident, testimony, eyewitness reports, etc.) = need to tag identifier with filed claim. Currently, can only attach this information after claim has been closed.
Department of Safety and Traffic Engineering Office (Pat Brady, Eric Larson, and David Anderson) Pat Brady Dept. of Safety utilizes the same data that Millie Seay’s office uses.
Highway Safety Improvements > Response Team to crash data
Currently “governors highway safety team” is looking at standardizing accident data code for recording accident reports completed by law enforcement officers. M.U.C.C. via the Dept. of Transportation (ANSI D16 Standard)
Mainframe sequential file, but going to relational database pending funding (StiP)
(Eric and Dave) Traffic Engineering Office has 7 districts, each with a Traffic
Ops Manager that oversees construction and improvements of highways, meets design requirements as set forth by state policy and federal guidelines. Responsible for policy and procedure setting on design/construction for each of the district offices to follow.
****Needs:
Ability to prioritize improvements (i.e. type of design and improvement needed) Reporting process needs to be more objective and qualitative?
Data from other states on truck lanes and aged driver conditions *****Databases: Truck Lane Information Aged Driver Information

88
Missouri DOT – Risk Management Department (1/16/01) Highway Tort claims fall under “general liability” through the chief counsel and are managed by the risk management dept. Interview Attendees: Duane Amos – Director, Gerry Foster – Assistant Director Base Information: 10 districts in state for highway maintenance authority
3 Million loss per year due to damage to state property with no party to pay. Police records have enabled them recover approximately 1million in expenditures (increase pressure to recover more $) Risk Management is investigating a method of tapping into Traffic Ops database
Sovereign Immunity History:
1987 – lost full sovereign immunity
Claims caps of 100,000 per person and 800,000 per incident – 1million aggregate.
Claims liability has risen since loss of sovereign immunity 1990’s - Claims caps of 300,000 per person and 2,000,000 per incident – tied to inflationary index per year
1987 – State became self-insured with Fleet Vehicle and Workers Comp, since private insurance environment was not amenable to outsourcing. State hired Duane Amos to direct internal Risk Management department.
1990 – Risk Management department began using Dorn Risk Master software to handle claims and suite cases for the state.
Legal Division and Risk Management
The legal division for the Missouri Department of Transportation does not administer any of the tort claims information from within their department. They rely upon the department of Risk Management and a software program from Dorn Systems called Risk Master. The department of risk management administers the tort claims file for internal and external legal counsel. All master copies are kept in this database. Internal legal counsel has network access through the state LAN and external legal counsel provides paper documents to the department at regular intervals. Legal offices have the permission to create and print reports, add expenses and legal fees, and process invoices, but cannot change any information.

89
The database is a proprietary system that is contracted to the state with standard output by a mechanism called Report Master. Any additional programming and support is on a fee basis through Dorn. The export functions are flexible, however a field search is by no means intuitive. This makes a identifying the content of data fields related to tort claims information a hit or miss proposition, which adds time to the initial data collection process.
Claims and suite process:
Suites filed with Chief Counsel office through the district were the incident occurred. Chief counsel assigns the case to in-house attorney or out-sourced legal representation, however chief counsel directs the case and settlement approval after reviewing with RM.
(Case entered into Risk Master through risk management department)
Claims filed with directly chief counsel follow same process as suites, however settlement authority lies with Risk Management department.
Expert Witness Information:
Being kept in legal case files by chief counsel (paper), may be recorded by court recorder Creating a training course to educate personnel on testimony and court questioning
Traffic Operations Department
The traffic operations personnel were not aware of our project and information interests. The initial interview included a thorough explanation of the pilot project and out intent for the data. The traffic ops staff agreed to look into the ability to export specific data from their system and the media for transport.
Washington State DOT Interviews Luther J. McNeal, MRC Squared from February 5 – 7, 2001, conducted the Washington Survey.
Electronic information systems supporting the Department of Transportation in the State of Washington are currently undergoing transition. The most significant of these is the Information Systems Division of the Attorney General’s Office. They are migrating from a fairly sophisticated commercially published software package to an internally developed software package that will meet their information needs with greater efficiency, precision, and user friendliness.

90
Information systems that interface with the Attorney Generals’ Office are making adaptive upgrades, though not to the same extent. Since information systems in the State of Washington are in their third or fourth generation of development, all of the information required for this project is available in an electronic file. However, accessibility to information for the purposes of this project is a matter of departmental policy. Therefore, information like the liability “reserve” amounts was available though not accessible.
Legal Data Issues and Meeting Schedule Monday 2/5/01 9:00 a.m. to 10:00 a.m. – Introductory Meeting: Office of the Attorney General for the State of Washington Luther McNeal discussed project issues with Bill Henselman (DOT Risk Mgmt. Office), Michael Kirkpatrick (Dept. General Administration, Risk Mgmt. Office), and Daniel Davis (DOT Transportation Data Office) in a meeting hosted by Mike Tardiff of the Attorney General’s Office. Mike Tardiff introduced the attendees, purpose of the project, and pertinent information disclosure issues. Luther addressed specific issues concerning the project survey, electronic information acquisition, and sources of specific information. The meeting concluded with the establishment of an interview schedule with each of the attendees and their respective information services personnel. Wednesday 2/7/01 8:00 a.m. to 9:30 a.m. – Interview with Larry Hoage, Database Administrator: Office of the Attorney General Larry outlined the function of the Information Services Office of the Attorney Generals Office and the nature of the work that they are doing right now. He was also able to discuss in detail the content of information in the system. Larry and Luther were able to determine a list of characteristics for the information Luther needed. Larry provided a record layout and an electronic file on diskette the following afternoon.
Risk Management Data Issues and Meeting Schedule Monday 2/5/01 10:30 a.m. to 11:30 a.m. – Interview with Bill Henselman, Risk Mgr.: Washington State DOT, Office of Risk Management
Bill Henselman outlined the history, structure, purpose, and daily operation of the risk management office for the state and the department of transportation counterpart. He indicated that Mike Kirkpatrick’s office maintains the risk management files concerning tort liability for the entire state. Further Mike would be familiar with content and data extraction methods.
Tuesday 2/6/01 9:00 a.m. to 10:00 a.m. – Interview with Mike Kirkpatrick, Tort Claims Administrator: Department of Administration, Division of Risk Management
Mike Kirkpatrick and Luther J. McNeal discussed the information needs of the project in detail. Luther requested a record layout. Since none was available, they review the data file from a CRT terminal and established a list of fields to extract from the file.

91
Traffic Operations Data Issues and Meeting Schedule Monday 2/5/01 10:00 a.m. to 10:30 a.m. – Interview with Daniel Davis, Accident Analysis Supervisor: Washington State Department of Transportation, Planning and Programming Service Center
Daniel Davis was able to outline the structure and content of the files his office managed. He indicated that his office was also transitioning to new software, new scope of information services, and interfaces with other information services in the state. Daniel and Luther agreed on a list of specific data fields that Daniel’s office would prepare for Luther’s review on the following day.
Tuesday 2/6/01 3:00 p.m. to 3:30 p.m. – Interview with Daniel Davis, Accident Analysis Supervisor: Washington State Department of Transportation, Planning and Programming Service Center
Reviewed information prepared by Daniel’s team. The team provided an electronic file and record layout of traffic accident information.
Engineering and Planning Offices Data Issues and Meeting Schedule Tuesday 2/6/01 3:30 p.m. to 5:00 p.m. – Telephone interview with John Milton, Senior Engineer: Washington State Department of Transportation, Highway Engineering
John provided Luther with a detailed understanding of the evolution of highway safety policy for the state. He like Bill Henselman referred Luther to Pat Morin for a detailed explanation of the decision making process for project prioritization and planning.
Wednesday 2/7/01 9:45 a.m. to 1:00 p.m. – Interview with Pat Morin, Planning Mgr.: Washington State Department of Transportation, Priority Planning Department
Pat Morin’s discussion of the priority planning process for Washington was extremely help to this researcher in understanding existing influences constraints on the decision making process for this state and others. The discussion will greatly impact the development of screen sets for the final project.

92
APPENDIX D: MRC SQUARED DELIVERABLE REPORT ON DATA ANALYSIS AND DATABASE DESIGN
PTI/NCHRP Final Report: Database Development Project Description and Purpose The overall purpose of the project was to determine the feasibility of creating an electronic application capable of collecting, processing, and reporting information covered in the AASHTO study. In the first phase of the project, preliminary information was gathered to determine if sufficient information technology infrastructure existed to make the prospect plausible. The Phase I research indicated the existence of state agency databases and electronic files having pertinent content. The researchers concluded that the existence of those files warranted an attempt to create a functional database application. MRC Squared was contracted to develop the database application according to the project plan that was developed based upon the findings of the Phase I research. The Phase I research indicated or inferred that: (1) some states were using database applications in legal and risk management agencies; (2) other states relied on paper-based systems; and (3) agencies with electronic information systems relied on automated processes to develop information such as required to complete the AASHTO study. The task of MRC Squared was to:
1. Define data elements. - Develop a master list of data elements according to documentation provided by PTI. - Compile a metafile of standard terms and definitions. - Provide a conceptual design of the master database structure. - Obtain from PTI a record layout of the data to be supplied from each of the states. - Normalize and standardize the data sets from all of the states and the master data element list.
2. Design the data environment and support network connectivity. - Research and identify core data structures and format. - Identify and recommend suitable methods of data transfer.
3. Design central database application and client screen sets. - Develop core database application. - Develop user screen sets. - Develop report structures.
4. Participate in testing procedures.
5. Participate in system installation final implementation.
6. Participate in performance monitoring.

93
Implementation Approach Overview: The mission was to develop a database system that provides useful content, quick data retrieval, intuitive navigation, and a user-friendly reporting presentation. The development of such a system depended on good design. The overall design of this database application had to accommodate three important functions: data collection and normalization, processing, and presentation. Good design can be achieved if the following is known: (1) the performance and storage capacity of hardware and software, (2) database performance objectives, (3) the content and format of desired output, and (4) the content and format of input. The development team acquired equipment of sufficient capacity and utilized the IT network infrastructure at Penn State to complete the hardware requirement. Microsoft Studio 6 development software was used to generate the databases. That was later supplemented with web development software form Allaire when the developer experienced difficulty generating web components with the Microsoft product. The initial output schema (and master list of data content) was derived from survey questions developed by the principal investigator. The acquisition of input data, the final component required to begin database system design, would be achieve by making contact with state resources and extracting needed data. On-site interviews were conducted with state representatives of legal, risk management, engineering, and highway agencies to identify appropriate resources and facilitate data acquisition. Data Collection and Normalization: The development team anticipated differences in the content and format of data from state to state. The team collected record layouts of the database structures and data samples from each state. The developer then matched state data elements to those of the master list. Data transfer was accomplished by Internet transmission or download to a portable (removable) storage medium such as floppy diskette or zip drive. The developer then wrote a program to convert the data to a compatible format. Utilization of data normalization techniques would have been necessary for accident files, legal files, and risk management files. The process was initiated for accident and highway files but was later discontinued to redirect the focus of data content to address legal and risk management statistics. Processing: After the data were collected and normalized, they were sorted and transferred to a central repository. A single program processed the data and generated all of the reports that are available on the web. A user-friendly SQL could not be developed in time for the pilot; neither was there time for the development of an extensive glossary to define and qualify data elements. The database system contains more than 400 searchable elements. Presentation: The original presentation schema was abandoned once the insufficiency of data from legal and risk management agencies was known. Researchers eventually decided to use a combination of real and fictitious data in a simulation to demonstrate the functionality of sample applications. A key feature of the web page is the format of the tables. Side-by-side comparisons of state characteristics are accomplished quickly in a familiar format for most users. Refer to web sites presenting data of similar content and scope for comparison.

94
Data Collection
Data Elements: PTI identified 106 data elements, excluding highway and injury characteristics, as the target content of the database. The 106 data elements were captured in a 52-question survey targeting 67 policy characteristics and 39 legal and claim-related statistics. Interviews with functional and technical managers revealed that the management of requisite state data files was highly decentralized. A variety of state agencies maintain essential data components with little or no overlap in content. This fact made it impossible to link data from one agency’s file to that of another. All of the database applications used by state agencies had the capability to export data in a universally compatible format. There was not found among the pilot states a single agency that managed a majority share of the necessary data. The dispersal of data files and the omission of overlapping data content (in the form of key fields, reference fields, and docket numbers) were obstacles that required more time on site to overcome than was budgeted.
Table D.1 Distribution of Target Content
Subject Category Total Responses Short Answer Statistics Response derived from accessible legal / claim
files
Sovereign Immunity 9 9 0
Claims Procedures 7 7 0
Claim Statistics 24 24 4
Attorney Statistics 11 11 0
Employment Liability 4 4 NA
Contractor Indemnification
4 4 NA
Insurance 14 14 NA
Training Policy 25 25 NA
Risk Management 2 2 NA
Expert Witness 6 6 0
Totals 106 67 39
Highway Characteristics 320 320
Injury Characteristics 22 22
A separate database file and application would be needed to process highway and injury characteristics. This information was known to be available from state agencies in database structures. What was not known was the scope and format of those files. Engineering and technical data (accident files, highway maintenance files, highway characteristics files) maintained by all of the states was comprehensive. Highway, accident, and maintenance databases often required a half ream of paper to display a full record layout (including a description of values). The size and complexity of databases would prove to require much more time to process than the budget allowed.

95
Table D.2
California West Virginia Florida Missouri Washington Dept. Resource Fields Values Fields Values Fields Values Fields Values Fields Values
Legal Department File 81 173 25 39 40 160 Claims File
Risk Management
Department File 21 140 21 N/A 23 70 Insurance Co. 191 400
Engineering
Department File Highway 114 510 100+ 500 100+ 500
Traffic Operations
Department File 330 1,320 State Info Services 56 280 114 392 90 720 Accident File 170 200
Total 581 2,283 361 600 160 571 121+ 500+ 153 1,450 Aggregate 1,255 4,904
Survey questions about policy issues required multiple-choice or short-answer responses. Statistics required the compilation of values from legal files and claim files. The content of database files in the legal and risk management agencies visited were function specific. They did not maintain information from which the target data could be derived. It was obvious that managers could not have relied on those files exclusively to generate the statistical data requested in the AASHTO study.
Onsite Interviews: Representatives from legal agencies supporting state departments of transportation were asked to participate in onsite interviews with the project team concerning the existence, maintenance, and content of pertinent electronic files. IT professionals and functional managers were also in attendance. All three groups made every effort to be helpful. One result of the explosive proliferation of information technologies has been the development of a knowledge and communication gap between functional managers and IT technicians. Each understands his or her area of expertise with little or no common overlap. Such was the case in the agencies visited. Technicians typically didn’t fully understand the business process and functional personnel had only a cursory knowledge of the technical processes. This circumstance manifested in technicians having complete access to data but no knowledge of their content. Functional managers were aware of the existence and content of data, but had

96
no specific knowledge as to how the data were generated, maintained, structured, or stored. Table D.3
# Information Expected Resource Referred Resource Alternative Resources
1 Sovereign Immunity Issues Legal Agency None
2 Claims Procedures Risk Mgmt. None
3 Lawsuit Procedures Legal Agency None
4 Contractor Indemnification Legal Agency, Risk Mgmt. None
5 Insurance Policies & Issues Legal Agency, Risk Mgmt. None
6 Training Legal Agency, Risk Mgmt. None
7 Risk Mgmt. Structure Risk Mgmt. None
8 Claims Statistics Risk Mgmt. Limited Content: None
9 Lawsuit Statistics Legal Agency Limited Content: Legal Agency None
10 Attorney Statistics Legal Agency Limited Content: Legal Agency None
11 Injury Characteristics Legal Agency Limited Content: Legal Agency State Police Accident Report, DMV
12 Highway Characteristics Legal Agency Limited Content: Legal Agency Hgwy Engineering, BTS
13 Accident Statistics Legal Agency Limited Content: Legal Agency State Police Accident Report, DMV
14 Driver Statistics Legal Agency Limited Content: Legal Agency State Police Accident Report, DMV
15 Vehicle Statistics Legal Agency Limited Content: Legal Agency State Police Accident Report, DMV
16 Highway Statistics Legal Agency Highway Engineering State Police Accident Report, DMV
17 Employee Statistics Risk Mgmt. Risk Mgmt. None
Data Availability and Content: The expected result of the interviews was the identification of data resources with content related to the subject data, the acquisition and record layouts that defined the structure and format of the data, and the acquisition of the data sample. With the exception of Florida ad California, the file of legal agencies did not maintain accident, injury, highway or judicial statistics as a part of their case file. These agencies generally managed case information in word processing documents rather than databases. These data were the essential component of the project. This project’s essential legal statistics could be obtained by having a clerk track the few relevant case statistics on a one-page document for submission to the project team each month. Claim statistics were available from risk management in all states except West Virginia. However, the data maintained by these agencies was function-specific and would not support the calculated information required to complete the AASHTO study. It should be noted that in each instance where a database was utilized, a mechanism existed to export data in a compatible format, or the data structure was maintained in a universally compatible format.
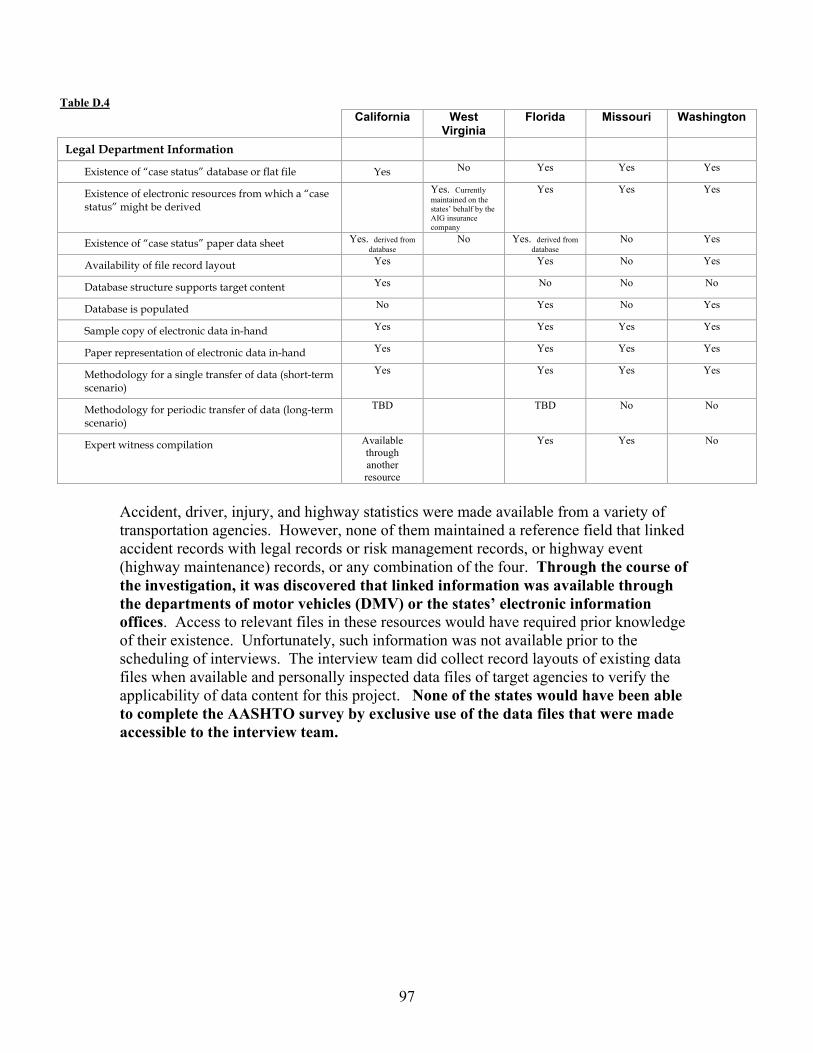
97
Table D.4
California West Virginia
Florida Missouri Washington
Legal Department Information
Existence of “case status” database or flat file Yes No Yes Yes Yes
Existence of electronic resources from which a “case status” might be derived
Yes. Currently maintained on the states’ behalf by the AIG insurance company
Yes Yes Yes
Existence of “case status” paper data sheet Yes. derived from database
No Yes. derived from database
No Yes
Availability of file record layout Yes Yes No Yes
Database structure supports target content Yes No No No
Database is populated No Yes No Yes
Sample copy of electronic data in-hand Yes Yes Yes Yes
Paper representation of electronic data in-hand Yes Yes Yes Yes
Methodology for a single transfer of data (short-term scenario)
Yes Yes Yes Yes
Methodology for periodic transfer of data (long-term scenario)
TBD TBD No No
Expert witness compilation Available through another resource
Yes Yes No
Accident, driver, injury, and highway statistics were made available from a variety of transportation agencies. However, none of them maintained a reference field that linked accident records with legal records or risk management records, or highway event (highway maintenance) records, or any combination of the four. Through the course of the investigation, it was discovered that linked information was available through the departments of motor vehicles (DMV) or the states’ electronic information offices. Access to relevant files in these resources would have required prior knowledge of their existence. Unfortunately, such information was not available prior to the scheduling of interviews. The interview team did collect record layouts of existing data files when available and personally inspected data files of target agencies to verify the applicability of data content for this project. None of the states would have been able to complete the AASHTO survey by exclusive use of the data files that were made accessible to the interview team.

98
Table D.5
California West Virginia
Florida Missouri Washington
Traffic and Highway Information
Existence of central traffic events database or flat file
Yes Yes Yes Yes Yes
Accessibility of file Accessible TBD Accessible Derivative accessible
Yes
Availability of file record layout In-hand TBD In-hand Yes Yes
Sample copy of record layout in-hand Yes No Yes No Yes
Sample copy of electronic data in-hand Yes No Yes No Yes
Paper representation of electronic data in-hand Yes Yes Yes No Yes
Methodology for a single transfer of data (short-term scenario)
Yes No Yes Yes Yes
Methodology for periodic transfer of data (long-term scenario)
TBD No TBD No Yes
Existence of central highway environment database or flat file
Yes Yes Yes Yes Yes
Accessibility of file Accessible Accessible Accessible Not available Yes
Availability of file record layout Available Available Available Not available Yes
Sample copy of record layout in-hand Yes Yes Yes No Yes
Sample copy of electronic data in-hand No Yes No No Yes
Paper representation of electronic data in-hand Yes Yes Yes No Yes
Methodology for a single transfer of data (short term scenario)
Yes Yes Yes No Yes
Methodology for periodic transfer of data (long term scenario)
No No Yes No
No
Research to Identify Alternative Data Sources: Since the data content from legal and risk management agencies proved insufficient to meet reporting requirements set by the principal researcher, a new development schema was required to make use of pertinent data from alternative resources. The developer spent significant time researching alternative legal and claim statistic data resources in an attempt to identify relevant statistics that may have been gathered for another purpose. It was during this process that the researchers became aware of federal and state authorities that maintained the target data. Access to these files would require additional on-site interviews with state electronic information officers and agencies’ directors to explain the research objectives and obtain permission to access record layouts and data. The project budget would not support the additional interviews. While unsuccessful with legal and claim statistics, the developer identified several state and federal resources that provided accident statistics and highway statistics. It should be noted that in each instance where a database was utilized by an agency, a mechanism existed to export data in a compatible format, or the data structure was maintained in a compatible format.

99
Table D.6
California West Virginia
Florida Missouri Washington
Claim / Financial / Adm. Information
Electronic file of case expense data Legal Dept. – Some, but not enough for analysis. Account Dept. - will provide more complete data.
All such information is recorded and maintained by AIG on behalf of the state’s risk management department.
Yes. Maintained by risk management.
Yes Some
Existence of reserve and liability calculations in file data
Yes Probably Yes Yes Yes
Existence of settlement values in file data Yes Probably Yes Yes Yes
Existence of resolution or judgment in file data Yes Probably Yes Yes Yes
Existence of paper data file Yes. Derived from database.
No. If it exists it is not readily accessible.
No Yes
Availability of file record layout Yes Probably Yes No No
Sample copy of record layout in-hand Yes No Yes No No
Sample copy of electronic data in-hand Yes No Yes Yes No
Paper representation of electronic data in-hand Yes No Yes No No
Methodology for a single transfer of data (short-term scenario)
Yes No Yes Yes No
Methodology for periodic transfer of data (long-term scenario)
TBD No TBD No No
Processing Development Process: The researcher/database developer developed the database system from information gained in the interview process and supplemented by alternate state and federal transportation information services. This conserved time that would usually be spent normalizing accident and highway data from each state. Since insufficient legal and risk management statistics were available in a format quickly adaptable for database use, highway and accident statistics grew to become the prominent content of the database. The database program includes a program that generates a central database, topic-specific data tables, and tables that provide the content for preformatted reports. The database can be set to update information instantly or at a predetermined time of the day or week. The following diagram displays the planned data environment scheme of information flow from the states to a central database. The scheme was not fully realized in this project.

100
Figure D.1
Presentation Web Site: Once the central database system was developed, attention focused on the development of a web site. Usability objectives for the web site required extensive redesign of standard database development techniques to simplify the visual presentation and access data quickly. The web site includes an entry form for participants to update state information, preformatted reports organized by topic, and a chat room forum. Conclusions The data required to complete the AASHTO study do exist in electronic format.
• State agencies maintain detailed and consolidated electronic files that support accident, injury, highway, and engineering issues and statistics addressed in the AASHTO study. Securing permission to access these files is a comparatively simple and straightforward process. The consolidated file structure is suitable for immediate analysis.

101
• Claim and lawsuit data also exist in electronic files. However, the files lack scope and detail. They are typically distributed among several legal, administrative, accounting, and judicial state agencies and outsourced service providers. Permission to access all of the necessary files will require penetration of executive and technical layers of several state agencies.
The broad dispersal of claim and lawsuit data will require an analyst to review, assess, and extract state resources to generate a consolidated data file.
• The major obstacle to collecting appropriate data is obtaining permission to review record layouts and access pertinent data files from all the agencies managing pertinent data.
• A second obstacle of importance is the existence of key fields or identifiers in that agency’s data structure. These identifiers enable the association of related statistics to a single record. If the identifiers exist, then extraction and consolidation can be a simple process. However, if they do not exist, analytical techniques would be required to sort data and match them to the appropriate record.
Converting the data into useful information will require analysts to normalize values, standardize terms, and design data systems that accommodate bi-directional translation.
• The analyst must understand all of the terms and values associated with the collected data from each agency before the normalization and standardization process begins.
• After normalization the analyst must develop a dynamic standard data structure based on “least common data values” (analogous to “least common factor” or “prime factors” in mathematics).
• The analyst must develop a translation process to convert data from their original form to the standard and back again.
The collection process will require constant updating to accommodate changes to information management practices among state agencies. A bi-directional translation process will promote greater participation among states.
• Bi-directional translation of the data will enable states to make greater use of the content of each data table.
• Such a feature would eliminate the learning curve for analysts in each agency.
Short-Term Solutions
In the short term, legal and risk management agencies could provide the case statistics addressed in the survey by having an office clerk complete a simple form (Figure D.2) once each month. The form would require no more than 2 person-hours each month. This would allow all states to participate in the AASHTO survey. States operating electronic information systems and paper-based systems would have an easy and uniform method of providing legal and case management statistics. This form could be provided on a web page that clerks with Internet access could complete monthly. All other data could be accessed from electronic files maintained by the state electronic information services or the department of motor vehicles.

102
Recommendations Sufficient data resources exist to obtain the information specified in the AASHTO study and more. The initial target content of the project may focus on risk management. However, the data content required to answer the AASHTO study could support decision-making in a number of other functional areas. The utility of those data could be far reaching, since other joint federal and state transportation-related organizations could benefit from that same information. Additional funding partners could develop, especially if a national accident database were established. Federal agencies would find components of the data useful. The following is a complete list of recommendations.
• Proceed with the national project. - Refine the existing data model (content and presentation objectives). - All states can use the form to complete legal and case management statistics.
Figure D.2
- AASHTO members should only need to update a short form on the web site annually.
• Seek the assistance of state Chief Information Officer. - Obtain permission to access data resources, record layouts, and data. - Stress the need for statistics rather than personal data. - Stress the avoidance of personal identification data. - Obtain identification of data resources and managing technicians.
• Establish an FTP site to collect data. • Conduct on-site interviews.
- Obtain and review record layout for each potential data source. - Establish record content list with each data resource. - Establish a transfer method. - Establish a monthly transfer date.
• Develop the database system with a dynamic data standard (the programming entity should be prepared to accommodate the metamorphosis of data structures from state information systems in transition).
• Develop an automated data collection and reporting process. - Establish an interactive web site. - Provide a secure FTP area.
Internal Case No.
Accident File Ref.
Police Report Ref.
External Case Num
File Date Injury Deficiency No. of Claimants
Withdrwal Date
Settlement Date
Settlement Judgement Award
12345678910
Exported dataDepartmental Information

103
- Provide direct access to copies of database files in their entirety. - Provide for preformatted downloading of reports. - Provide SQL area. - Provide chat room access.
• Development of an expert data resource should be the goal of the project. • Provide a research function to expand relevance of content data. • Utilize contractors with integrated skills (business model and programming skills). • Seek funding partners after initial site and application are complete.