nci budget fact book for fiscal year 1997 · national canceradvisory board appointees expiration of...
TRANSCRIPT


U.S . DEPARTMENT
Public HealthOF HEALTHAND
ServiceHUMAN SERVICES
NationalInstitutes ofHealth

The information set forth in this publication iscompiled and amended annually by the financialmanagement staff of the National Cancer Instituteand is intended primarily for use by members of theInstitute, principal advisory groups to the Instituteand others involved in the administration andmanagement of the National Cancer Program .Questions regarding any of the information containedherein may be directed to the Financial ManagementBranch, National Cancer Institute, 9000 RockvillePike, Bethesda, Maryland, 20892 .
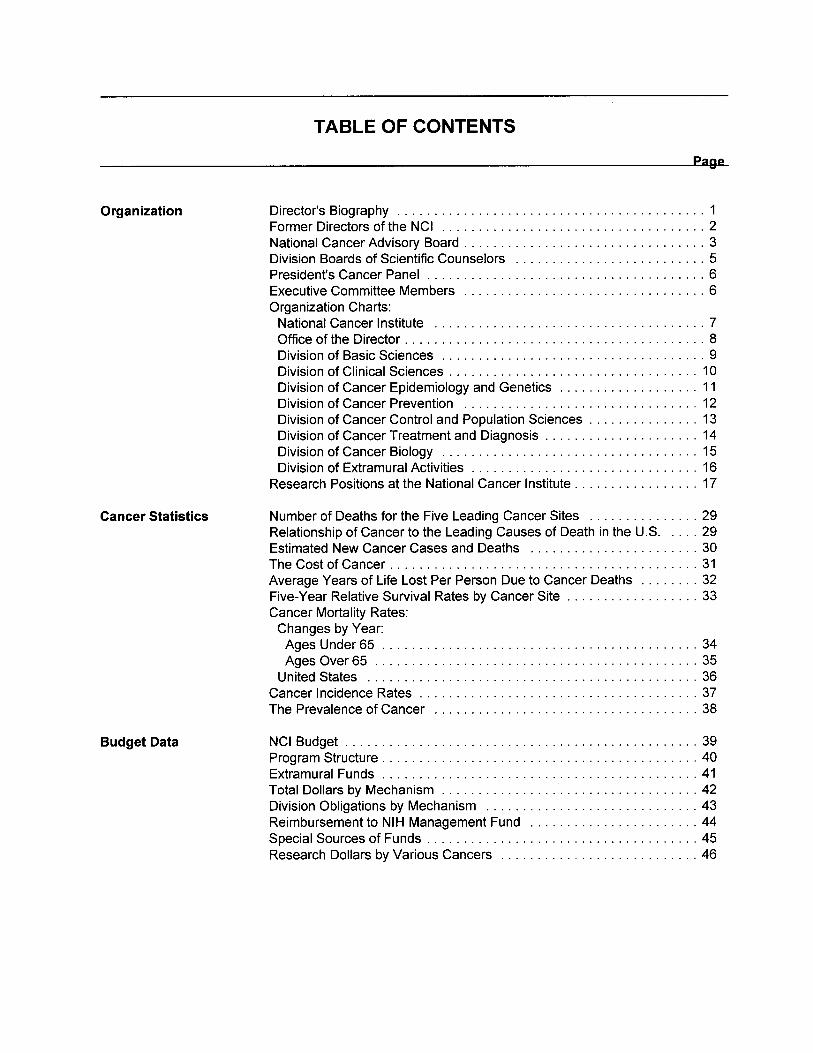
TABLE OF CONTENTS
Panp
Organization
Director's Biography . . . . . . . . . . . . . . . . . . . . . . . . . . . . . . . . . . . . . . . . . . 1Former Directors of the NCI
. . . . . . . . . . . . . . . . . . . . . . . . . . . . . . . . . . . . 2National Cancer Advisory Board . . . . . . . . . . . . . . . . . . . . . . . . . . . . . . . . . 3Division Boards of Scientific Counselors
. . . . . . . . . . . . . . . . . . . . . . . . . . 5President's Cancer Panel . . . . . . . . . . . . . . . . . . . . . . . . . . . . . . . . . . . . . . 6Executive Committee Members . . . . . . . . . . . . . . . . . . . . . . . . . . . . . . . . . 6Organization Charts :National Cancer Institute
. . . . . . . . . . . . . . . . . . . . . . . . . . . . . . . . . . . . . 7Office of the Director. . . . . . . . . . . . . . . . . . . . . . . . . . . . . . . . . . . . . . . . . 8Division of Basic Sciences . . . . . . . . . . . . . . . . . . . . . . . . . . . . . . . . . . . . 9Division of Clinical Sciences . . . . . . . . . . . . . . . . . . . . . . . . . . . . . . . . . . 10Division of Cancer Epidemiology and Genetics . . . . . . . . . . . . . . . . . . . 11Division of Cancer Prevention
. . . . . . . . . . . . . . . . . . . . . . . . . . . . . . . . 12Division of Cancer Control and Population Sciences . . . . . . . . . . . . . . . 13Division of Cancer Treatment and Diagnosis . . . . . . . . . . . . . . . . . . . . . 14Division of Cancer Biology
. . . . . . . . . . . . . . . . . . . . . . . . . . . . . . . . . . . 15Division of Extramural Activities . . . . . . . . . . . . . . . . . . . . . . . . . . . . . . . 16
Research Positions at the National Cancer Institute . . . . . . . . . . . . . . . . . 17
Cancer Statistics
Number of Deaths for the Five Leading Cancer Sites
. . . . . . . . . . . . . . . 29Relationship of Cancer to the Leading Causes of Death in the U .S .
. . . . 29Estimated New Cancer Cases and Deaths
. . . . . . . . . . . . . . . . . . . . . . . 30The Cost of Cancer . . . . . . . . . . . . . . . . . . . . . . . . . . . . . . . . . . . . . . . . . . 31Average Years of Life Lost Per Person Due to Cancer Deaths . . . . . . . . 32Five-Year Relative Survival Rates by Cancer Site . . . . . . . . . . . . . . . . . . 33Cancer Mortality Rates :Changes by Year:Ages Under 65
. . . . . . . . . . . . . . . . . . . . . . . . . . . . . . . . . . . . . . . . . . .34Ages Over 65
. . . . . . . . . . . . . . . . . . . . . . . . . . . . . . . . . . . . . . . . . . . .35United States . . . . . . . . . . . . . . . . . . . . . . . . . . . . . . . . . . . . . . . . . . . . .36
Cancer Incidence Rates . . . . . . . . . . . . . . . . . . . . . . . . . . . . . . . . . . . . . .37The Prevalence of Cancer
. . . . . . . . . . . . . . . . . . . . . . . . . . . . . . . . . . . .38
Budget Data
NCI Budget . . . . . . . . . . . . . . . . . . . . . . . . . . . . . . . . . . . . . . . . . . . . . . . . 39Program Structure . . . . . . . . . . . . . . . . . . . . . . . . . . . . . . . . . . . . . . . . . . . 40Extramural Funds . . . . . . . . . . . . . . . . . . . . . . . . . . . . . . . . . . . . . . . . . . .41Total Dollars by Mechanism . . . . . . . . . . . . . . . . . . . . . . . . . . . . . . . . . . . 42Division Obligations by Mechanism . . . . . . . . . . . . . . . . . . . . . . . . . . . . . 43Reimbursement to NIH Management Fund . . . . . . . . . . . . . . . . . . . . . . . 44Special Sources of Funds . . . . . . . . . . . . . . . . . . . . . . . . . . . . . . . . . . . . . 45Research Dollars by Various Cancers . . . . . . . . . . . . . . . . . . . . . . . . . . . 46
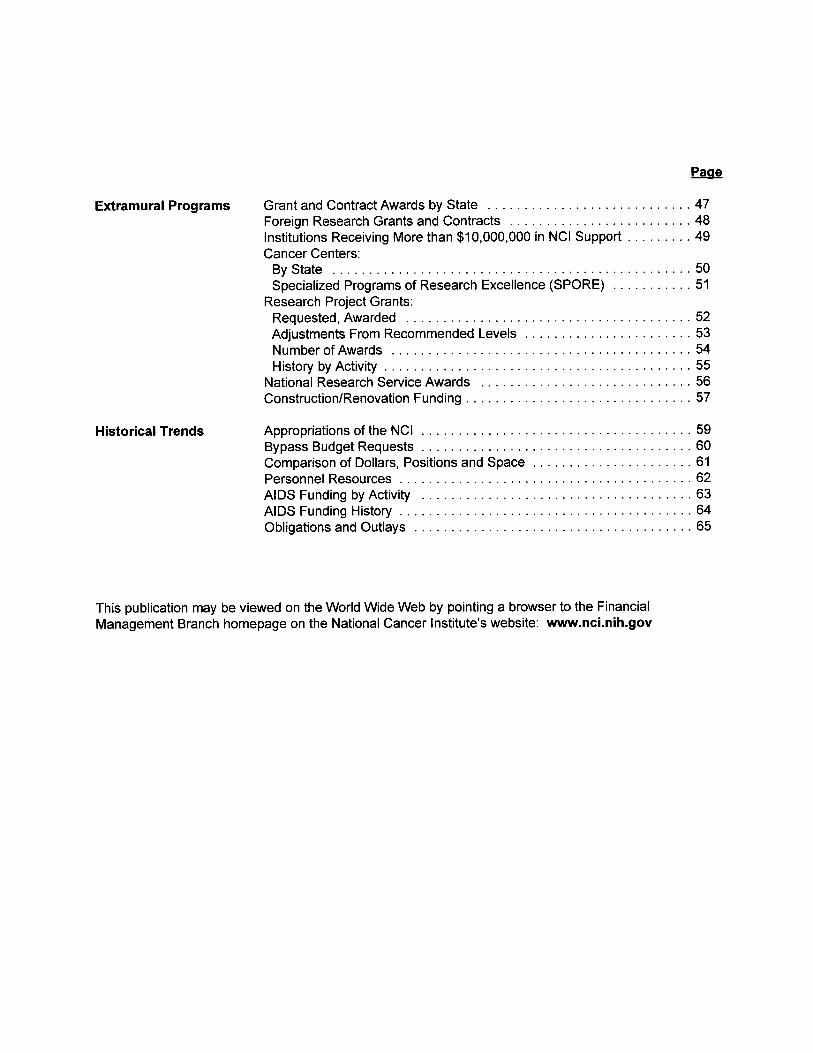
Extramural Programs
Grant and Contract Awards by State
. . . . . . . . . . . . . . . . . . . . . . . . . . . . 47Foreign Research Grants and Contracts . . . . . . . . . . . . . . . . . . . . . . . . . 48Institutions Receiving More than $10,000,000 in NCI Support . . . . . . . . . 49Cancer Centers :By State . . . . . . . . . . . . . . . . . . . . . . . . . . . . . . . . . . . . . . . . . . . . . . . . .50Specialized Programs of Research Excellence (SPORE) . . . . . . . . . . . 51
Research Project Grants :Requested, Awarded . . . . . . . . . . . . . . . . . . . . . . . . . . . . . . . . . . . . . . . 52Adjustments From Recommended Levels . . . . . . . . . . . . . . . . . . . . . . . 53Number of Awards . . . . . . . . . . . . . . . . . . . . . . . . . . . . . . . . . . . . . . . . . 54History by Activity . . . . . . . . . . . . . . . . . . . . . . . . . . . . . . . . . . . . . . . . . . 55
National Research Service Awards
. . . . . . . . . . . . . . . . . . . . . . . . . . . . . 56Construction/Renovation Funding . . . . . . . . . . . . . . . . . . . . . . . . . . . . . . . 57
Historical Trends
Appropriations of the NCI
. . . . . . . . . . . . . . . . . . . . . . . . . . . . . . . . . . . . . 59Bypass Budget Requests . . . . . . . . . . . . . . . . . . . . . . . . . . . . . . . . . . . . .60Comparison of Dollars, Positions and Space . . . . . . . . . . . . . . . . . . . . . . 61Personnel Resources . . . . . . . . . . . . . . . . . . . . . . . . . . . . . . . . . . . . . . . .62AIDS Funding by Activity . . . . . . . . . . . . . . . . . . . . . . . . . . . . . . . . . . . . . 63AIDS Funding History . . . . . . . . . . . . . . . . . . . . . . . . . . . . . . . . . . . . . . . . 64Obligations and Outlays . . . . . . . . . . . . . . . . . . . . . . . . . . . . . . . . . . . . . . 65
This publication may be viewed on the World Wide Web by pointing a browser to the FinancialManagement Branch homepage on the National Cancer Institute's website : www.nci.nih .gov
Page

National Cancer Institute
Director's BiographyRichard D. Klausner, M.D.
Dr . Klausner was appointed as the Director of the National Cancer Institute (NCI) onAugust 1, 1995 . Since 1984, he has been Chief of the Cell Biology and MetabolismBranch of the National Institute of Child Health & Human Development. Dr . Klausnerreceived his undergraduate degree from Yale University and his medical degree fromDuke University . After post-graduate medical training at Harvard, he began hisresearch career at the National Institutes of Health in 1979.
Dr . Klausner is well known for his contributions to multiple aspects of cell andmolecular biology. Over the past six years, he has been recognized as one of the 20most highly cited scientists in the world in this burgeoning area of biology andbiomedical research . Dr. Klausner's research has illuminated the genetics andbiochemistry of metals as essential but toxic nutrients for virtually all forms of life, hasilluminated the pathways by which molecules traffic and speak to each other withinthe cell, and has described novel mechanisms by which genes are regulated .
His work has been recognized with numerous honors and awards including theOutstanding Investigator Award from the American Federation of Clinical Researchand the William Damashek Prize for Major Discoveries in Hematology . In 1993, Dr .Klausner was elected to the National Academy of Sciences and chaired their project,charged with writing standards for science education for the United States fromkindergarten through 12th grade. This project represents the first comprehensiveattempt to describe a vision of scientific literacy for all students and to provide thecriteria for the educational system required to achieve the fulfillment of that vision .
Dr. Klausner is the past President of the American Society for Clinical Investigation .In October 1996 he was elected to the Institute of Medicine . He is the author of over250 scientific articles and several books.
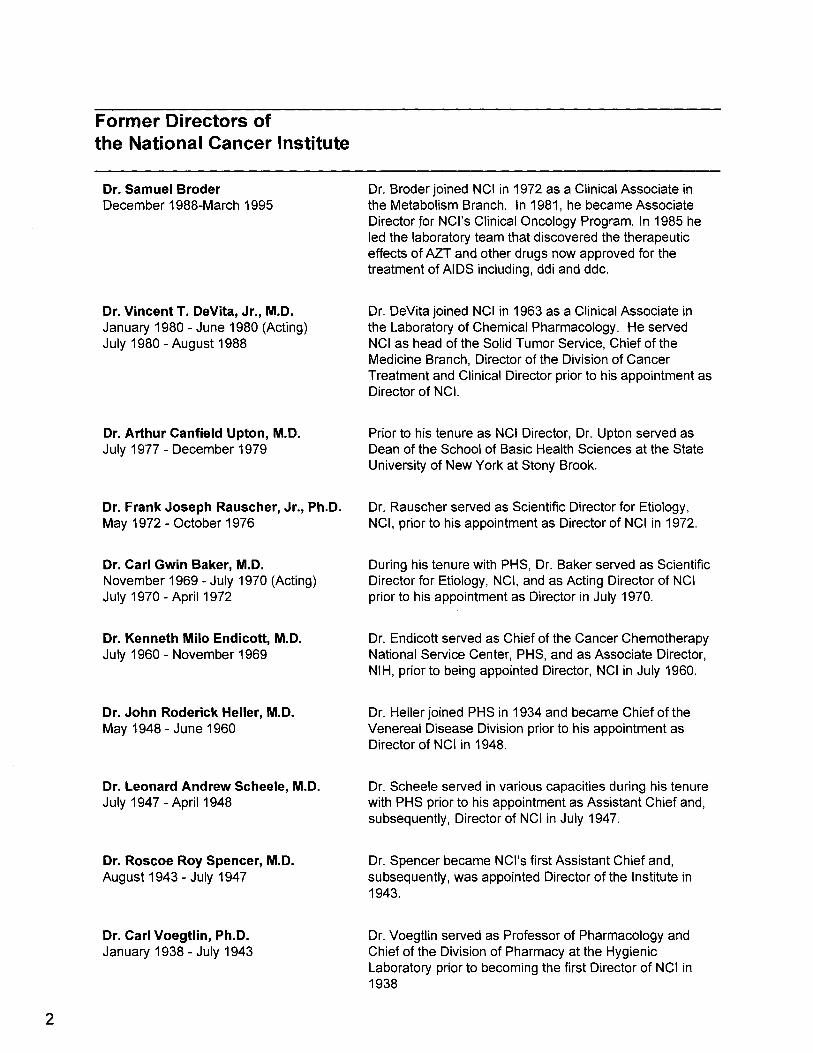
Former Directors ofthe National Cancer Institute
Dr . Samuel Broder Dr . Broder joined NCI in 1972 as a Clinical Associate inDecember 1988-March 1995 the Metabolism Branch . In 1981, he became Associate
Director for NCI's Clinical Oncology Program . In 1985 heled the laboratory team that discovered the therapeuticeffects of AZT and other drugs now approved for thetreatment of AIDS including, ddi and ddc .
Dr. Vincent T . DeVita, Jr., M.D . Dr . DeVita joined NCI in 1963 as a Clinical Associate inJanuary 1980 - June 1980 (Acting) the Laboratory of Chemical Pharmacology . He servedJuly 1980 - August 1988 NCI as head of the Solid Tumor Service, Chief of the
Medicine Branch, Director of the Division of CancerTreatment and Clinical Director prior to his appointment asDirector of NCI .
Dr. Arthur Canfield Upton, M.D. Prior to his tenure as NCI Director, Dr . Upton served asJuly 1977 - December 1979 Dean of the School of Basic Health Sciences at the State
University of New York at Stony Brook .
Dr. Frank Joseph Rauscher, Jr., Ph.D. Dr . Rauscher served as Scientific Director for Etiology,May 1972 - October 1976 NCI, prior to his appointment as Director of NCI in 1972 .
Dr . Carl Gwin Baker, M.D. During his tenure with PHS, Dr. Baker served as ScientificNovember 1969 - July 1970 (Acting) Director for Etiology, NCI, and as Acting Director of NCIJuly 1970 - April 1972 prior to his appointment as Director in July 1970 .
Dr. Kenneth Milo Endicott, M.D. Dr . Endicott served as Chief of the Cancer ChemotherapyJuly 1960 - November 1969 National Service Center, PHS, and as Associate Director,
NI H, prior to being appointed Director, NCI in July 1960 .
Dr. John Roderick Heller, M.D . Dr . Heller joined PHS in 1934 and became Chief of theMay 1948 - June 1960 Venereal Disease Division prior to his appointment as
Director of NCI in 1948 .
Dr. Leonard Andrew Scheele, M.D. Dr . Scheele served in various capacities during his tenureJuly 1947 - April 1948 with PHS prior to his appointment as Assistant Chief and,
subsequently, Director of NCI in July 1947 .
Dr. Roscoe Roy Spencer, M.D . Dr . Spencer became NCI's first Assistant Chief and,August 1943 - July 1947 subsequently, was appointed Director of the Institute in
1943 .
Dr. Carl Voegtlin, Ph.D . Dr . Voegtlin served as Professor of Pharmacology andJanuary 1938 - July 1943 Chief of the Division of Pharmacy at the Hygienic
Laboratory prior to becoming the first Director of NCI in1938
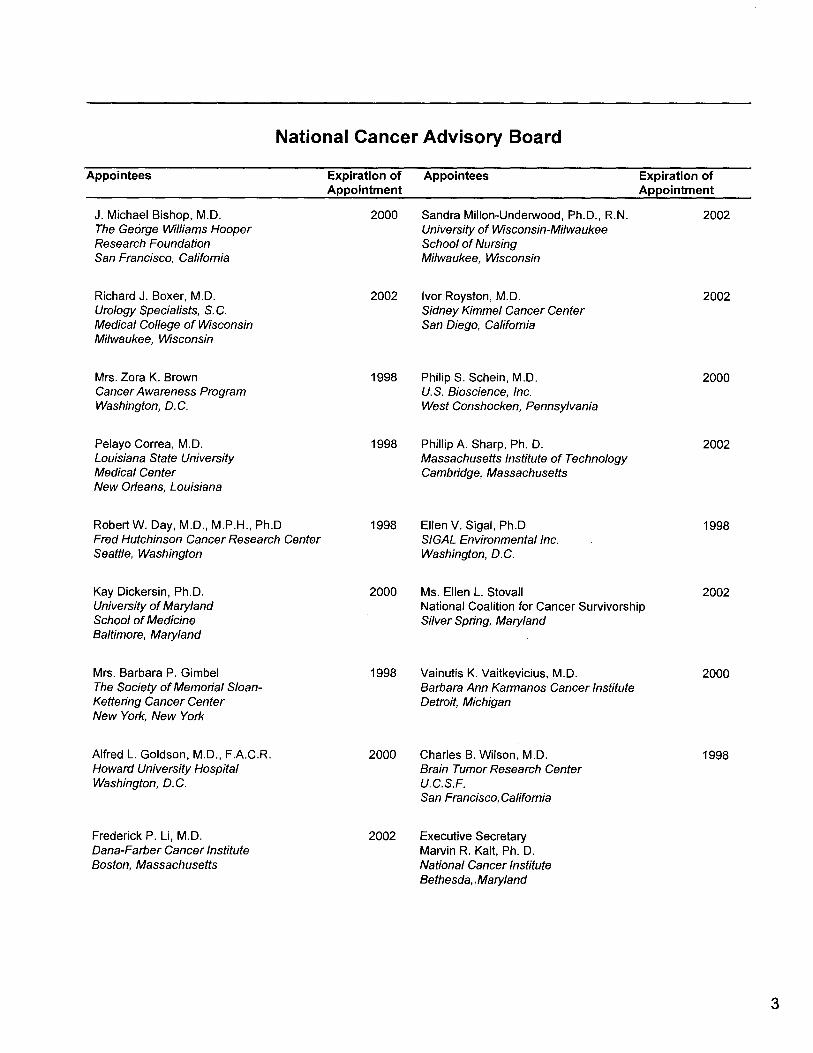
National Cancer Advisory Board
Appointees Expiration ofAppointment
Appointees Expiration ofAppointment
J . Michael Bishop, M.D . 2000 Sandra Millon-Underwood, Ph.D ., R.N . 2002The George Williams Hooper University of Wisconsin-MilwaukeeResearch Foundation School of NursingSan Francisco, California Milwaukee, Wisconsin
Richard J. Boxer, M.D . 2002 Ivor Royston, M.D . 2002Urology Specialists, S. C. Sidney Kimmel Cancer CenterMedical College of Wisconsin San Diego, CaliforniaMilwaukee, Wisconsin
Mrs. Zora K . Brown 1998 Philip S . Schein, M.D . 2000CancerAwareness Program U.S . Bioscience, Inc .Washington, D.C . West Conshocken, Pennsylvania
Pelayo Correa, M.D . 1998 Phillip A. Sharp, Ph . D . 2002Louisiana State University Massachusetts Institute of TechnologyMedical Center Cambridge, MassachusettsNew Orleans, Louisiana
Robert W. Day, M.D ., M .P .H ., Ph .D 1998 Ellen V. Sigal, Ph .D 1998Fred Hutchinson CancerResearch Center SIGAL Environmental Inc.Seattle, Washington Washington, D.C .
Kay Dickersin, Ph.D . 2000 Ms . Ellen L. Stovall 2002University ofMaryland National Coalition for Cancer SurvivorshipSchool of Medicine Silver Spring, MarylandBaltimore, Maryland
Mrs. Barbara P. Gimbel 1998 Vainutis K. Vaitkevicius, M.D . 2000The Society ofMemorial Sloan- Barbara Ann Karmanos Cancer InstituteKettering Cancer Center Detroit, MichiganNew York, New York
Alfred L. Goldson, M.D ., F.A.C.R . 2000 Charles B . Wilson, M.D . 1998Howard University Hospital Brain TumorResearch CenterWashington, D.C. U.C.S.F.
San Francisco, California
Frederick P. Li, M.D . 2002 Executive SecretaryDana-Farber Cancer Institute Marvin R. Kalt, Ph . D.Boston, Massachusetts National Cancer Institute
Bethesda,.Maryland
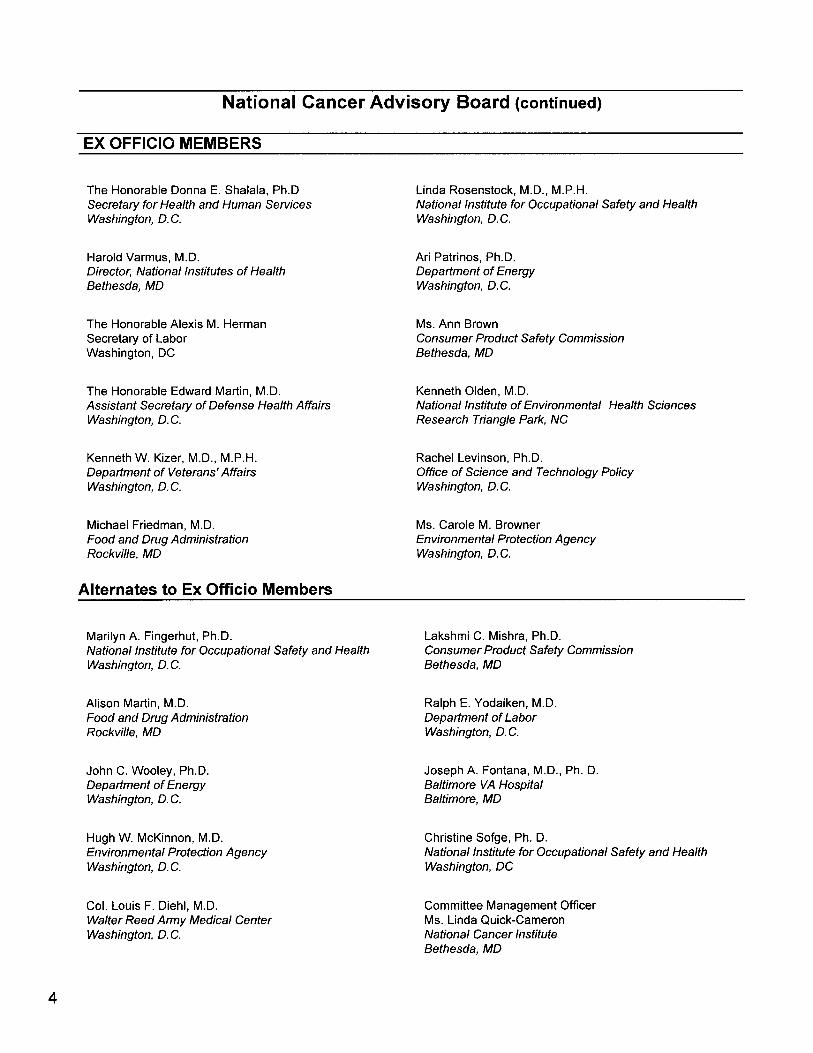
EX OFFICIO MEMBERS
The Honorable Donna E. Shalala, Ph.DSecretary for Health and Human ServicesWashington, D. C.
Harold Varmus, M.D .Director, National Institutes of HealthBethesda, MD
The Honorable Alexis M. HermanSecretary of LaborWashington, DC
The Honorable Edward Martin, M.D .Assistant Secretary ofDefense Health AffairsWashington, D.C.
Kenneth W. Kizer, M.D ., M .P.H .Department of Veterans' AffairsWashington, D.C.
Michael Friedman, M.D .Food and Drug AdministrationRockville, MD
Alternates to Ex Officio Members
Alison Martin, M.D .Food and Drug AdministrationRockville, MD
John C. Wooley, Ph.D .Department ofEnergyWashington, D. C.
Hugh W. McKinnon, M.D .Environmental Protection AgencyWashington, D.C.
Col. Louis F. Diehl, M.D .Walter Reed Army Medical CenterWashington, D. C.
National Cancer Advisory Board (continued)
Marilyn A. Fingerhut, Ph.D .National Institute for Occupational Safety and HealthWashington, D.C.
Linda Rosenstock, M.D ., M.P.H .National Institute for Occupational Safety and HealthWashington, D . C.
Ari Patrinos, Ph .D .Department ofEnergyWashington, D.C.
Ms . Ann BrownConsumer Product Safety CommissionBethesda, MD
Kenneth Olden, M.D .National Institute of Environmental Health SciencesResearch Triangle Park, NC
Rachel Levinson, Ph.D .Office of Science and Technology PolicyWashington, D . C.
Ms . Carole M. BrownerEnvironmental Protection AgencyWashington, D . C.
Lakshmi C . Mishra, Ph.D .Consumer Product Safety CommissionBethesda, MD
Ralph E. Yodaiken, M.D .Department ofLaborWashington, D. C.
Joseph A. Fontana, M.D ., Ph . D.Baltimore VA HospitalBaltimore, MD
Christine Sofge, Ph . D .National Institute for Occupational Safety and HealthWashington, DC
Committee Management OfficerMs . Linda Quick-CameronNational Cancer InstituteBethesda, MD
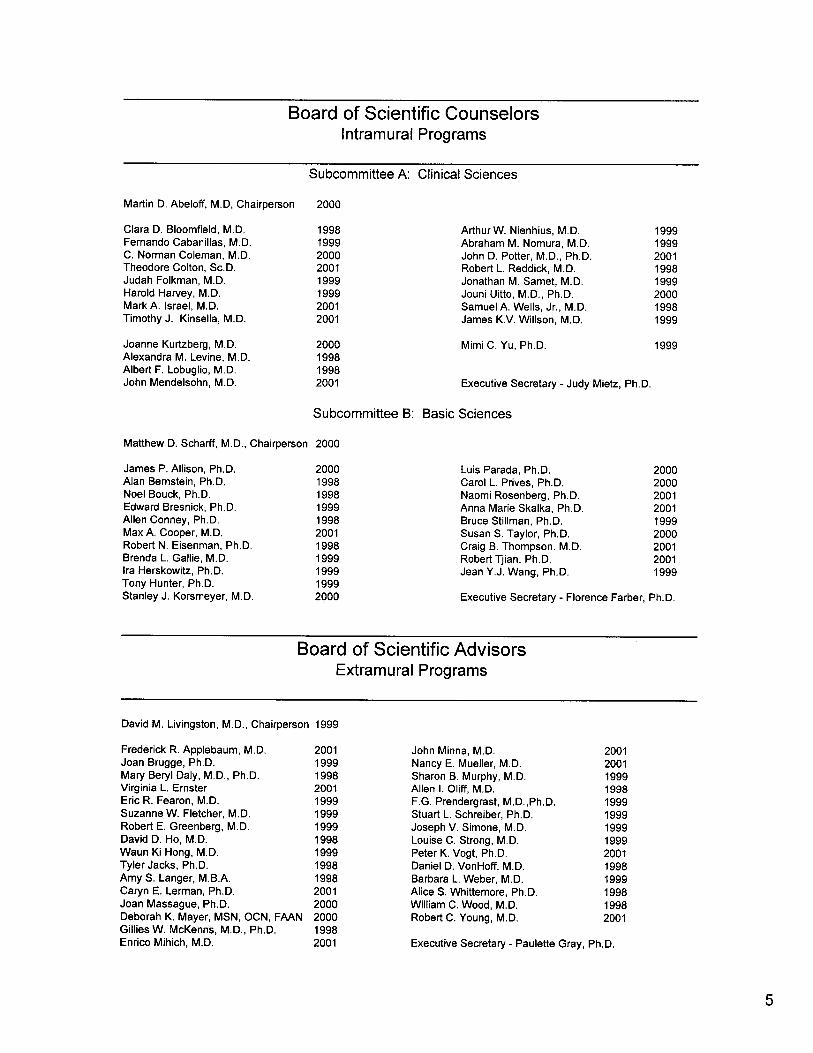
Martin D . Abeloff, M.D, Chairperson
Clara D. Bloomfield, M.D .Fernando Cabanillas, M.D .C . Norman Coleman, M.D.Theodore Colton, Sc.D .Judah Folkman, M.D .Harold Harvey, M.D .Mark A . Israel, M .D .Timothy J . Kinsella, M.D .
Joanne Kurtzberg, M.D .Alexandra M . Levine, M.D.Albert F . Lobuglio, M.D .John Mendelsohn, M.D .
James P . Allison, Ph.D .Alan Bernstein, Ph.D .Noel Bouck, Ph.D.Edward Bresnick, Ph.D .Allen Conney, Ph.D .Max A . Cooper, M .D .Robert N . Eisenman, Ph.D .Brenda L . Gallie, M .D .Ira Herskowitz, Ph.D .Tony Hunter, Ph.D .Stanley J . Korsmeyer, M.D .
David M . Livingston, M.D ., Chairperson
Board of Scientific CounselorsIntramural Programs
Subcommittee A : Clinical Sciences
2000
19981999200020011999199920012001
2000199819982001
Matthew D . Scharff, M.D ., Chairperson 2000
20001998199819991998200119981999199919992000
1999
Arthur W . Nienhius, M.D .Abraham M . Nomura, M.D .John D. Potter, M.D ., Ph.D .Robert L . Reddick, M.D .Jonathan M . Samet, M.D .Jouni Uitto, M.D ., Ph.D.Samuel A . Wells, Jr ., M.D.James K.V . Willson, M.D .
Mimi C . Yu, Ph.D .
Subcommittee B : Basic Sciences
Executive Secretary - Judy Mietz, Ph.D .
Luis Parada, Ph.D .Carol L. Prives, Ph.D .Naomi Rosenberg, Ph.D .Anna Marie Skalka, Ph.D .Bruce Stillman, Ph.D .Susan S . Taylor, Ph .D .Craig B . Thompson . M.D .Robert Tjian, Ph .D .Jean Y.J . Wang, Ph.D .
Board of Scientific AdvisorsExtramural Programs
Executive Secretary - Florence Farber, Ph.D .
19991999200119981999200019981999
1999
200020002001200119992000200120011999
Frederick R . Applebaum, M.D. 2001 John Minna, M.D . 2001Joan Brugge, Ph.D . 1999 Nancy E . Mueller, M.D . 2001Mary Beryl Daly, M.D ., Ph.D . 1998 Sharon B . Murphy, M .D . 1999Virginia L . Ernster 2001 Allen I . Oliff, M.D . 1998Eric R . Fearon, M.D . 1999 F.G . Prendergrast, M.D.,Ph .D . 1999Suzanne W. Fletcher, M.D. 1999 Stuart L . Schreiber, Ph.D . 1999Robert E . Greenberg, M .D . 1999 Joseph V . Simone, M.D . 1999David D . Ho, M.D . 1998 Louise C . Strong, M.D. 1999Waun Ki Hong, M .D . 1999 Peter K. Vogt, Ph.D . 2001Tyler Jacks, Ph.D . 1998 Daniel D . VonHoff, M.D . 1998Amy S . Langer, M.B.A . 1998 Barbara L . Weber, M.D . 1999Caryn E . Lerman, Ph.D . 2001 Alice S . Whittemore, Ph.D. 1998Joan Massague, Ph.D . 2000 William C . Wood, M.D . 1998Deborah K. Mayer, MSN, OCN, FAAN 2000 Robert C . Young, M.D . 2001Gillies W . McKenns, M.D ., Ph.D . 1998Enrico Mihich, M.D . 2001 Executive Secretary - Paulette Gray, Ph.D .

President's Cancer Panel
Harold Freeman, M.D . 2000 Paul Calabresi, M.D. 1998Chairman Professor and Chairman, EmeritusDirector of Surgery Department of MedicineHarlem Hospital Center Brown UniversityNew York, NY Rhode Island Hospital
Providence, RI
Frances M. Visco, Esq. 1997 Executive SecretaryPresident Maureen O. Wilson, Ph.D .National Breast Cancer Coalition Assistant Director & Deputy Ethics CounselorPhiladelphia, PA National Cancer Institute
31 Center Drive, Room 4A48-2473Bethesda, MD 20892
Executive Committee MembersDr. Richard Klausner Dr. Marvin A . KaltDirector Director, Division of Extramural Activities
Dr. Alan Rabson Dr. Alfred KnudsonDeputy Director Special Advisor, Division of Cancer Epidemiology and
Genetics
Dr . Martin Abeloff Dr. Edison LiuCo-Chair, Board of Scientific Counselors Director, Division of Clinical Sciences
Mr. Philip D. Amoruso Dr. David LivingstonAssociate Director for Extramural Management Chair, Extramural Board of Scientific Advisors
Dr. Faye Austin Dr. Sherry MillsDirector, Division of Cancer Biology Chair, NCI Extramural Advisory Board
Mr. Donald Christoferson Ms. Cherie NicholsExecutive Secretary Chief, Evaluation, and Analysis Branch
Ms. MaryAnn Guerra Dr. Matthew ScharffAssociate Director for Intramural Management Co-Chair, Board of Scientific Counselors
Dr. Joseph Fraumeni Dr. Donald SummersDirector, Division of Cancer Epidemiology and Associate Director, NCI Frederick Cancer ResearchGenetics and Development Center
Dr. Peter Greenwald Dr. Margaret TuckerDirector, Division of Cancer Prevention Chair, Intramural Advisory Council
Dr. Joe Harford Dr. George Vande WoudeAssociate Director for Special Projects Special Advisor to the Director, Division of Basic
Sciences
Dr. Edward Harlow Dr. Robert WittesSpecial Advisor, Office of Science Policy Director, Division of Cancer Treatment and Diagnosis
Deputy Director for Extramural Science
Dr. Barbara RimerDirector, Division of Cancer Control and PopulationSciences

Office of ExtramuralManagement
Associate DirectorPhilip Amoruso301-496-5737
Office of the DeputyDirector for Extramural
ScienceDeputy Director
Or . Robert Vfes301-496-4281
PresidenCs CancerPanel
Executive Secretary
Dr . Marvin Kaafi
Division of CancerPrevention
Acting DirectorOr . Peter Greemrald
301-496-6616
Office of CancerCommunicationsAssociate DirectorJ. Paul Van Nevel301-496-6531
Office of Centers, Trainingand Resources
Associate DirectorDr . Brian Kimes301-496-8537
Division of ExtramuralActivitiesDirector
Dr . Marvin Kalt301-496-5147
Division of CancerTreatment and Diagnosis
DirectorOr. Robert VVttes301-496-4291
National Cancer Institute
Office of the Director
301-496-9095
Division of Cancer Controland Population Sciences
DirectorDr . Barbara Rirrrar301-496-5945
Board ofScientific AdvisorsExe,cutive SecretaryDr. Paulette Gray
Board ofScientific CounselorsExecutive SecretariesDr . Florence FarberDr. Robert Hammond
Office of CancerOffice of Special Information, office of Clinical Research
Populations Research Communication and PromotionAssociate Director Education DirectorDr . Otis Brawley Acting Director Or . Mary McCabe301-402-ü362 Or . Susan Hubbard 301-496-6404
Division of Division of Division of CancerBasic Sciences clinical Sciences Epidemiology and GeneticsActing Director Director DirectorOr. Alan Rabson Dr . Edison Uu Or. Joseph Fraurneni301-496-4345 301-496-3251 301-496-1611
Or- Maureen Wilson DirectorDr. Richard Kiausner
Deputy DirectorNational CancerAdvisory Sward Dr . Alan Rabson
Executive Secretary 301-496-5615
Office of Intensa6onal Office of Office of IntramuralAffairs Science Policy Management
Associate Director Associate Director Associate DirectorDr . Federico VIkPSOh Dr . Edward Harlow MaryAnn Guerra
301-496-4761 3111-435-2276 301-435-2455
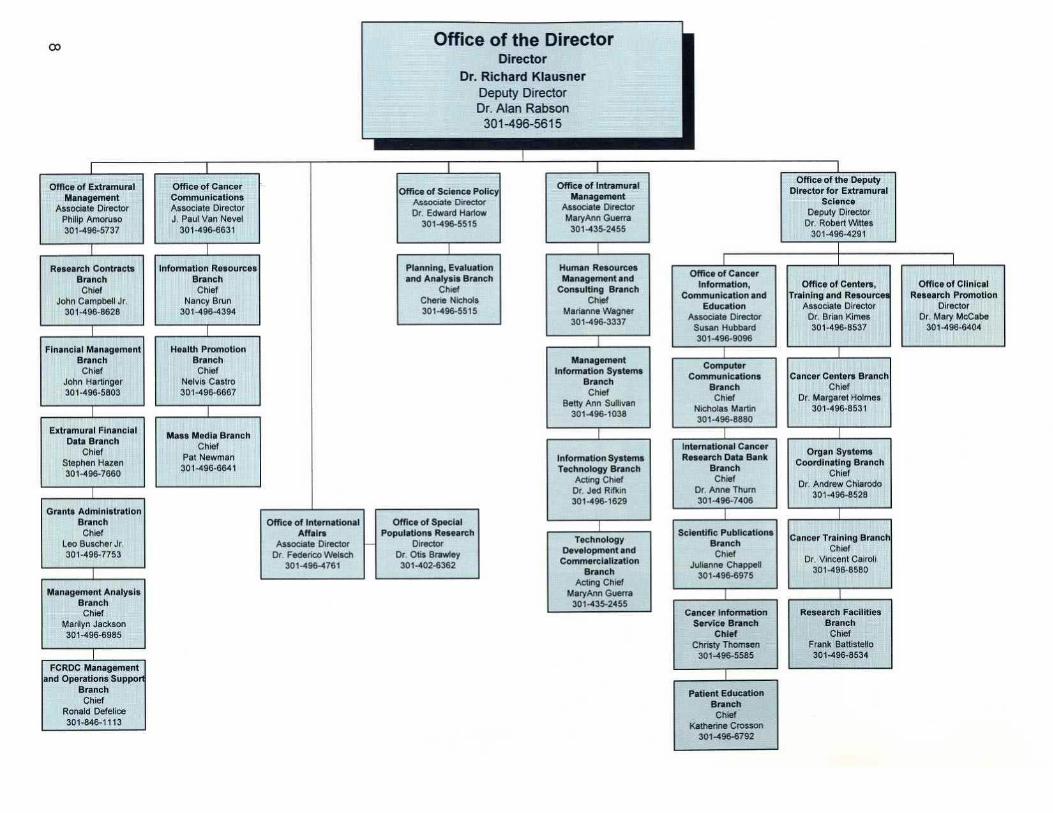
oaDirector
Dr. Richard KlausnerDeputy DirectorDr . Alan Rabson301-496-5615
Office of the DeputyOffice of Extramural Office of Cancer
Office of SciencePolicyOffice of Intramural
Director for ExtramuralManagement Communications Associate Director
ManagementScience
Associate Director Associate DirectorDr . Edward Harlow
Associate DirectorDeputy Director
Philip Amoruso J. Paul Van Nevel 301-496-5515MaryAnn Guerra
Or. Robert Wittes301-496-5737 301-496-6631 301-435-2455 301-496-4291
Research Contracts Information Resources Planning, Evaluation Human Resources
Branch Branch and Analysis Branch Management andOffice ofCancerinformation, Office of Centers, Office of Clinical
Chief Chief Chief Consulting BranchJohn Campbell Jr Nancy Bruit Cherie Nchois Chief Communication an Training and Resource Research Promotion
301-496-8628 301-496-4394 301-496-5515 Marianne WagnerEducation Associate Director Directof
Associate Director Dr. Brian Kirnes Dr . Mary McCabe301-496-3337
Susan Hubbard 301-496-8537 301-496-6404301-496-9086
Financial Management Health PromotionBranch Branch ManagementChief Chief tnforal+ation Systems
Computer
John Hartinger Nelvis Castro BranchCommunications Cancer Centers Branch
301-496-5803 301-49"867 ChiefBranch ChiefChief Dr Margaret Holmes
Betty Ann SullivanNicholas Martin 301-496-6531
301-496-1038301-496-5880
Extramural FinancialMass Media Branch
Data BranchChief International Cancer
Chief Organ SystemsStephen Hazen
Pat Newman Information Systems Research Data BankCoordinating Branch
301-496-7860301-496-6641 Technology Branch Branch
ChiefActing Chief Chie ¬
Dr. Andrew ChiarodoOr . Jed Rifkin Dr . Anne Thum 301-496-8528301-496-1629 301-496-7446
Grants AdministrationBranch Office of International office of SpecialChief Affairs Populations Research
TechnologyScientific Publications Cancer Training Branch
Leo BuscherJr, Associate Director Director BranchChief
301-496-7753 Dr . Federico Welsch Dr Otis Srawley Development and ChiefDr . Vincent Caifoli
301-496-4761 301-402-6362 Commercialization Julranne Chappell301-496-8580Branch 301-49"975
Acting ChiefManagement Analysis MaryAnn Guerra
Branch 301-435-2455Chief Cancer information Research Facilities
Marilyn Jackson Service Branch Branch301-496-6965 Chief Chief
Christy Thomsen Frank Battistello301-496-5565 301-496-8534
FCRDC Managementand Operations Support
Branch Patient EducationChief Branch
Ronald Defelice Chief301-846-1113 Katherine Crosson
301-496-6782
Office of LaboratoryAnimal Resources
DirectorDr, Marjorie Strobel
301-496-1866
ExperimentalImmunology Branch
ChiefDr . Alfred Singer301-496-5461
Laboratory ofImmunabialogy
ChiefDr . Berton Zbar301-846-1557
Varmus LabChief
Dr . Harold Varmus301-496-7940
Lab of TumorImmunologyand Biology
ChiefDr . Jeffrey Schlom301-496-4343
Laboratory ofBiochemistry
ChiefDr . Claude Klee301-496-5957
Laboratory of CellBiologyChief
Dr- Michael Gottesman301-496-1530
Laboratory of CellularOncology
ChiefDr . Douglas Lowy301-495-5913
Laboratory ofGenetics
ChiefDr, Michael Potter301-496-1734
Laboratory ofMolecular
CarcinogenesisChief
Dr . Harry Gelboin301-496-6849
Laboratory of Cellular8
Molecular BiologyChief
Dr . Jacafyn Pierce301-496-9683
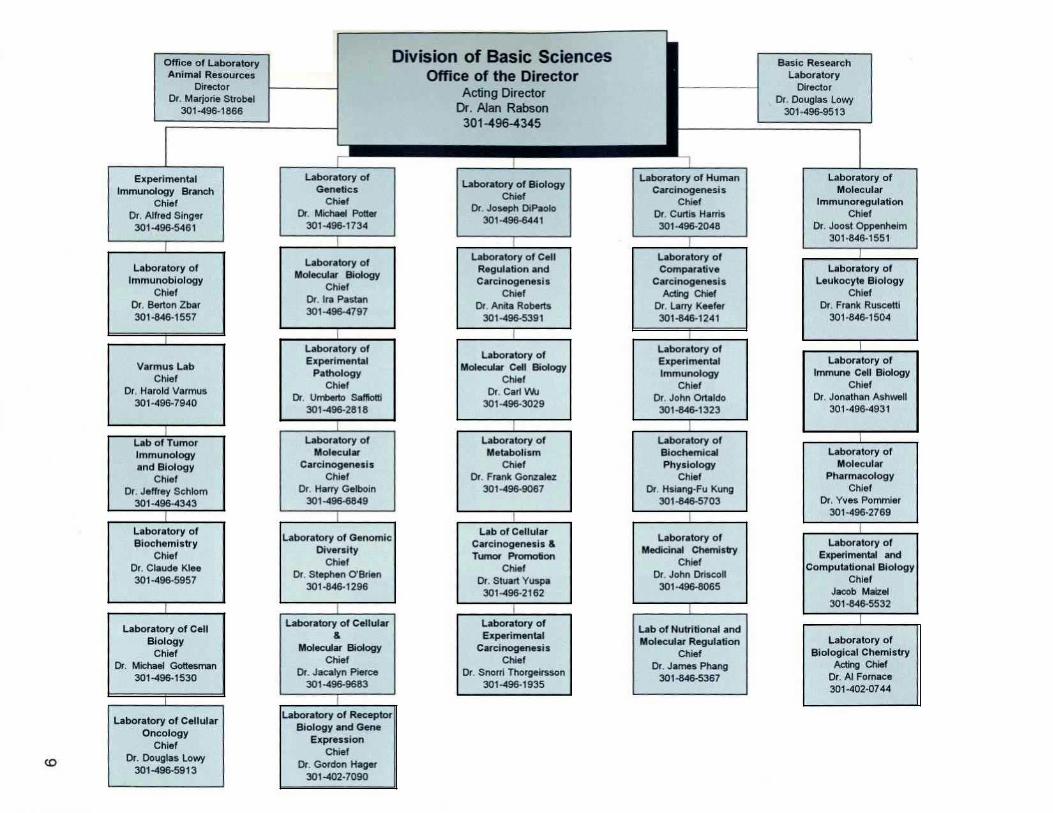
Division of Basic SciencesOffice of the Director
Acting DirectorDr . Alan Rabson301-496-4345
Laboratory ofMolecular Biology
ChiefDr Ira Pastan301-496-4797
Laboratory o¬ExperimentalPathology
ChiefDr . Umberto Saffiotti
301-496-2818
Laboratory of GenomicDiversityChief
Dr . Stephen O'Brien301-846-1296
Laboratory of ReceptorBiology and Gene
ExpressionChief
Dr- Gordon Hager301-402-7090
Laboratory of SlologyChief
Dr . Joseph DiPaolo301-496-6441
Laboratory of CellRegulation andCatcinogenesis
ChiefDr . Anita Roberts301-496-5391
Laboratory ofMolecular Cell Biology
ChiefDr . Carl Wu301-496"3029
Laboratory of HumanCarcinagenesis
ChiefDr . Curtis Harris301-496-20413
Laboratory ofComparative
CarcinogenesisActing Chief
Dr . Larry Keefer301-846-1241
Laboratory ofExperimentalImmunology
ChiefDr- John Ortaldo301-846-1323
Laboratory ofBiochemicalPhysiology
ChiefDr . Hsiang-Fu Kung
301-846-5703
Laboratory ofMedicinal Chemistry
ChiefDr- John Driscoll301-496-8065
Lab of Nutritional andMolecular Regulation
ChiefDr . James Phang301-846-5167
Basic ResearchLaboratory
DirectorDr, Douglas Lowy301-496-9513
Laboratory ofMolecular
ImmunoregulationChief
Dr- Joost Oppenheim301-846-1551
Laboratory ofLeukocyte Biology
ChiefDr. Frank Ruscetti
301-846-1504
Laboratory ofImmune Cell Biology
ChiefDr . Jonathan Ashwell
301-496-4931
Laboratory ofMolecular
PharmacologyChief
Dr. Yves Pommier301-496-2769
Laboratory ofExperimental and
Computational BiologyChief
Jacob Maizel301-846-5532
Laboratory ofBiological Chemistry
Acting ChiefDr- AI Fornace301-402-0744
Laboratory ofMetabolism
ChiefDr- Frank Gonzatea
301-496-9067
ILab of Cellular
Carcinogenesis &Tumor Promotion
ChiefDr . Stuart Yuspa301-496-2162
ILaboratory ofExperimental
CarcinogenesisChief
Dr . Snorri Thorgeirsson301-496-1935

HIV and AIDS MalignancyBranchChief
Dr. Robert Yarchoan301-496-0328
Blostatistics and DataManagement Section
ChiefDr . Seth Steinberg301-496-9502
Division of Clinical Sciences
LJrologic Oncology BranchChief
Dr . W . Marston Linehan301-496-6353
Office of the DirectorDirector
Dr . Edison LiuActing Deputy DirectorDr . Carmen Allegra
301-496-3251
Cancer Prevention StudiesBranchChief
Dr . Phillip Taylor301-594-2932
Dermatology Branch Surgery Branch Pediatric Oncology Branch Radiation Biology BranchChief Chief Chief Chief
Dr . Stephen Kate Dr . Steven Rosenberg Dr . Lee Helman Dr . James Mitchell301-496-2481 301-496-4164 301-496-4257 301-496-7511
Metabolism Branch Medicine Branch Radiation Oncology Laboratory of PathologyChief Acting Chief Branch Chief
Dr. Thomas WaIdmannDr . Carmen Allegra Acting Chief Or . Lance Liotta
301-496-4916 Dr . James Mitchell 301-496-3185301-496-6653 301-496-5457

Human GeneticsProgram
Acting DirectorDr . Alfred Knudson
301-496-4375
Division of Cancer Epidemiologyand Genetics
Office of the DirectorDirector
Dr . Joseph FraumeniDeputy DirectorDr . Susan Sieher
301-496-1611
Office of DivisionOperations and Analysis
ChlefJames Sontag301-496-1611
Epidemiology andBiostatistics Program
ChiefDr . Roben Hoover301496-8153
Genetic Epidemiology Clinical Genetics Environmental BiostatisticsBranch Branch Epidemiology Branch BranchChief Chief Chief Chief
Dr . Margaret Tucker Vacant Dr . Louise Brinton Dr. Mitchell Gail301-496-4375 301-496-4375 301-496-1691 301-496-4153
Laboratory ofPopulation Genetics Nutritional Radiation
Branch Epidemiology Branch Epidemiology Branch
Chief Acting Chief Chief
Vacant Dr . Robert Hoover Dr . Elaine Ran
301-496-4375341-496-8153 301-496-6600
Occupational Viral EpidemiologyEpidemiology Branch Branch
Chief ChiefDr . Aaron Blair Dr . James Goedert301-496-9093 301-496-8115

Biometry BranchActing Chief
Dr . Philip Prorok301-496-8556
Cancer Prevention ResearchProgram
Acting Associate DirectorDr . Carolyn Clifford
301-496-8573
ChemopreventionBranchChief
Lar . Gary J . Kelloff301-4.96-8563
Diet and CancerBranchChief
Dr . Carolyn Clifford307-496-8573
Division of Cancer PreventionOffice of the Director
Acting DirectorDr. Peter GreenwaldDeputy Director
Dr . earned Kramer301-496-9569
Early Detection and CommunityOncology ProgramAssociate DirectorDr . Leslie Ford301-496-0265
Preventive OncologyBranchChief
Dr Douglas L . Weed301-496-8640
Community Oncology andRehabilitation Branch
ChiefDr . Lori Minasian301-496-8541
Early Detection BranchChief
Or John Gohagan301-496-8544

Epidemiology and GeneticsProgram
Associate DirectorDr . G . Iris Qbrams301-496-9600
Division of Cancer Control andPopulation SciencesOffice of the Director
DirectorDr . Barbara Rimer301-594-6776
Behavioral Research ProgramActing Associate Director
Dr. Thomas Glynn301-496-8520
Special Population StudiesBranch
Acting ChiefDr . Sherry L . Mills301-496-8520
Cancer Control ResearchBranch
Acting ChiefDr. Sherry L . Mills301-496-8520
Public Health ApplicationsBranchChief
Dr . Marc VV. Manley301-496-8594
Cancer Surveillance ResearchProgram
Associate DirectorDr . Brenda K. Edwards
301-496-8506
Applied Research BranchActing Chief
Dr . Rachel Bollard-Barbash301-496-8500
Cancer Statistics BranchChief
Dr . Benjamin Hankey301-496-8510

Division of Cancer Treatment and Diagnosis
301-$4&i 5391
Office of the DirectorDirector
Dr . Robert WittesDeputy DirectorDr . Ellen Feigal301-496-6711
/- t - ~~Al1 fl~
Radiation Research Cancer Therapy Developmental Therapeutics Cancer Diagnosis Diagnostic ImagingProgram Evaluation Program Program .1 Program ProgramDirector Associate Director Director - Associate Director Associate Director
Dr. Richard Cumberlin Dr . Michaele Christian Dr . Edward Sausvilie Dr . Sheila Taube Dr . Daniel Sullivan301-496-6111 301-496-6138 301-496-8720 301-X196-8539 301-496-9531
Radiotherapy Investigational Pharmaceutical Information Technology Antiviral Evaluations Diagnostic Research Office of TechnologyDevelopment Branch Drug Branch Management Branch Branch Branch Branch Development
Acting Chief Acting Chief Chief Chief Chief Acting Chief Acting ChiefDr . Francis Mahoney Dr Mario Sznol Alfred Fallavollita Dr . Kenneth Paull Dr . John Bader Dr. Sheila Taupe Dr . Daniel Sullivan
301-496-9360 301-496-5223 301-996-5725 301-496-8747 301496-3246 341-496-1591 301-496-9531
Biometrics Research Regulatory Affairs Biological Testing Natural Products Resources Imaging DiagnosisBranch Branch Branch I Branch Development Branch BranchChief Chief Chief 'Chief Chief Acting Chief
Dr . Richard Simon Dr . Dale Shoemaker Dr . Joseph Maya Dr . Gordon Cragg Dr . Roger Aamodt Dr Daniel Sullivan301-496-4836 301-495-7912 301-845-5665 301-846-5387 301-496-1591 301-496-9531
Clinical Investigations Clinical Trials Grants S contracts Drug Synthesis and Technology Functional ImagingBranch Monitoring Branch Operations Branch Chemistry Branch Development Branch BranchChief Chief Acting Chief Chief Chief Acting Chief
Dr . Richard Ungerieider Dr . Richard Mowery Dr . Mary Wolpert-DeFilippes Dr . Ven Narayanan Dr . James Jacobson Dr . Daniel Sullivan301-49Cr6056 301-496-051D 301-496-8783 301-496-8795 301-402-4185 301-496-9531
Toxicology and Image-GuidedPharmacology Pharmaceutical Resources Diagnosis and Therapy
Branch Branch BranchChief
Chief Acting ChiefDr . Joseph Tomaszewski Dr . Rae Vishnuvajjala Dr . Daniel Sullivan
301-496-8777 301-496-6780 301-496-9531
Laboratory of DrugDiscovery and Research Biological Resources Branch
Development ChiefChief Dr . Stephen Creekmore
Dr Michael Boyd 391-846-1098
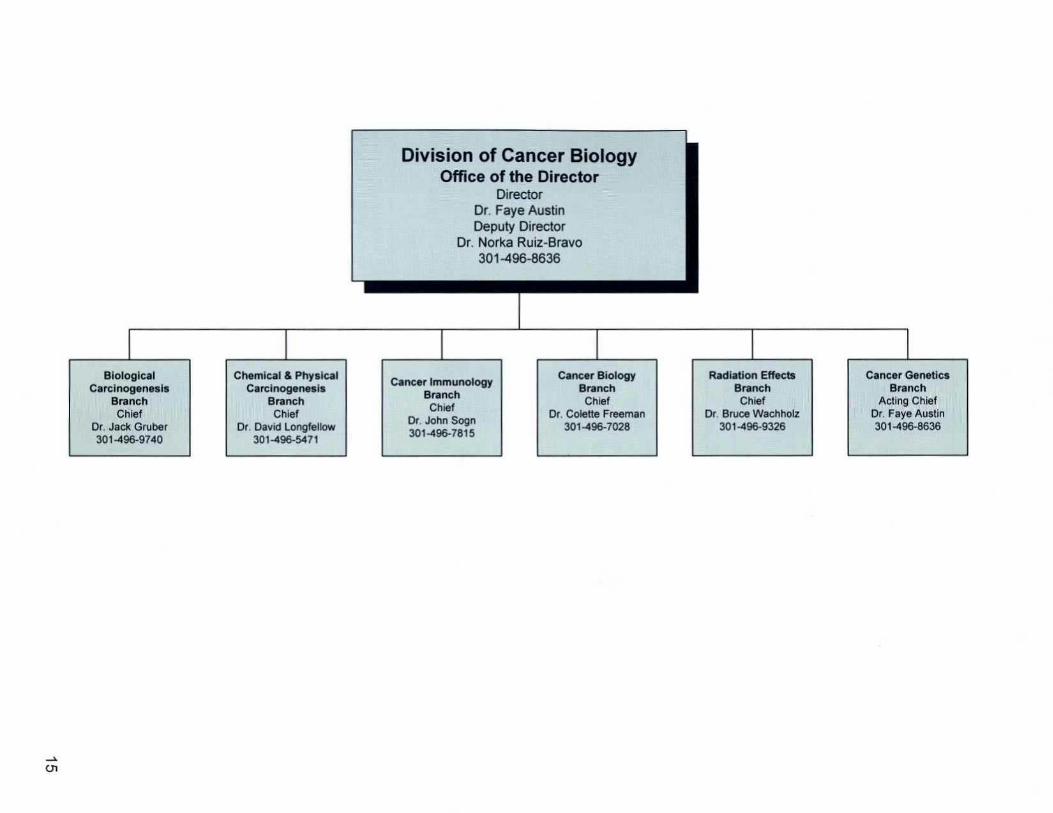
Division of Cancer BiologyOffice of the Director
DirectorDr . Faye AustinDeputy Director
Dr. Norka Ruiz-Bravo301-096-8fi36
Biological Chemical & Physical Cancer Biology Radiation Effects Cancer GeneticsCarcinogenesis Carcinogenesis Cancer Immunology Branch Branch Branch
Branch Branch Branch Chief Chief Acting ChiefChief Chief Chief Dr. Colette Freeman Dr . Bruce wachholz Car. Faye Austin
Dr. Jack Gruber Car . David Longfellow Dr. John Sogn 301-496-7028 301-496-9326 301-496-8636301-496-9740 301-496-5471 301-496-7815

Division of Extramural ActivitiesOffice of the Director
DirectorDr . Marvin KaftDeputy DirectorDr . Paulette Gray301-496-5147
Office of Advisory ActivitiesChief
Dr . Robert Hammond301-496-2378
Research Analysis and Special Review, Referral, andEvaluation Branch Resources Branch Grants Review Branch
Acting ChiefChief Chief Dr . Olivia PrebleRosemary Cuddy Dr . f{irt Vener 301-495-7929301-496-7391 301-495-7173
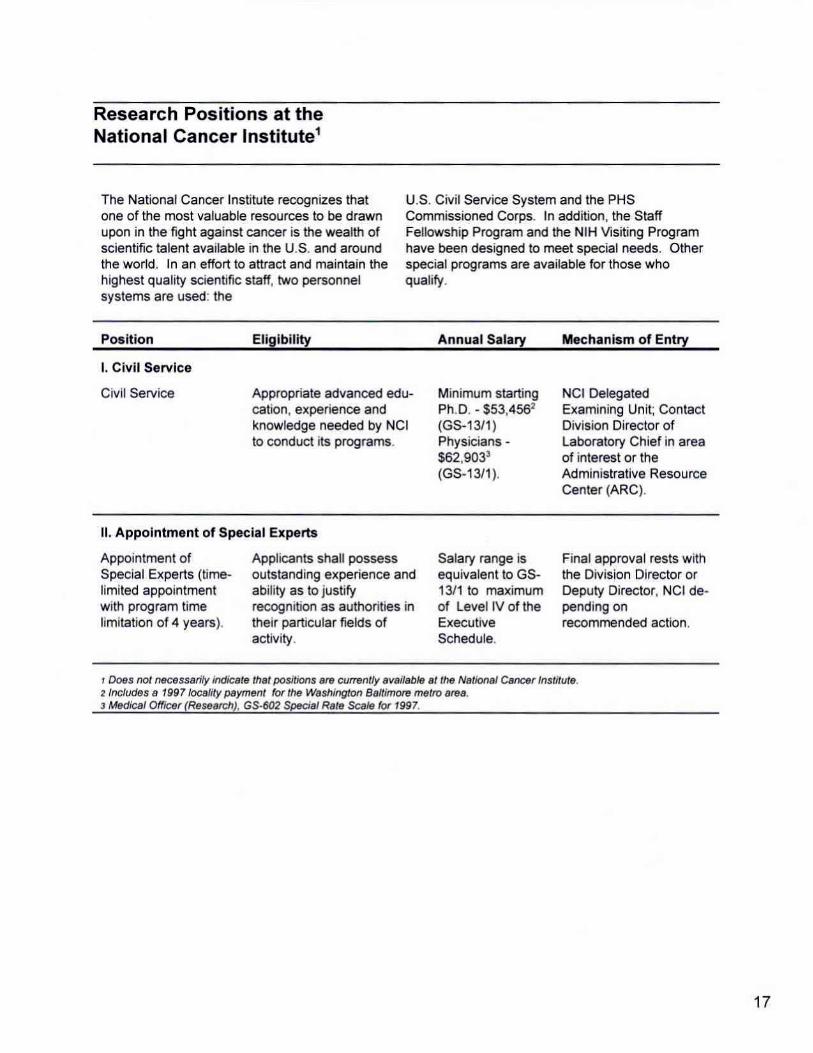
Research Positions at theNational Cancer Institute'
The National Cancer Institute recognizes thatone of the most valuable resources to be drawnupon in the fight against cancer is the wealth ofscientific talent available in the U.S . and aroundthe world. In an effort to attract and maintain thehighest quality scientific staff, two personnelsystems are used : the
Position
I . Civil Service
Civil Service
Appointment ofSpecial Experts (time-limited appointmentwith program timelimitation of 4 years) .
Eligibility
II . Appointment of Special Experts
Appropriate advanced edu-cation, experience andknowledge needed by NCIto conduct its programs.
Applicants shall possessoutstanding experience andability as to justifyrecognition as authorities intheir particular fields ofactivity .
U .S . Civil Service System and the PHSCommissioned Corps. In addition, the StaffFellowship Program and the NIH Visiting Programhave been designed to meet special needs. Otherspecial programs are available for those whoqualify.
Annual Salary
Minimum startingPh.D . - $53,456`(GS-1311)Physicians -$62,903'(GS-1311) .
Salary range isequivalent to GS-1311 to maximumof Level IV of theExecutiveSchedule
i Does not necessarily indicate that positions are currently available at the National Cancer Ins titale .2 Includes a 1997 locality payment for the Washington Baltimore metro area .3 Medical Officer (Research) . GS-602 Special Rate Scale for 199 7.
Mechanism of Entry
NCI DelegatedExamining Unit ; ContactDivision Director ofLaboratory Chief in areaof interest or theAdministrative ResourceCenter (ARC) .
Final approval rests withthe Division Director orDeputy Director, NCI de-pending onrecommended action .
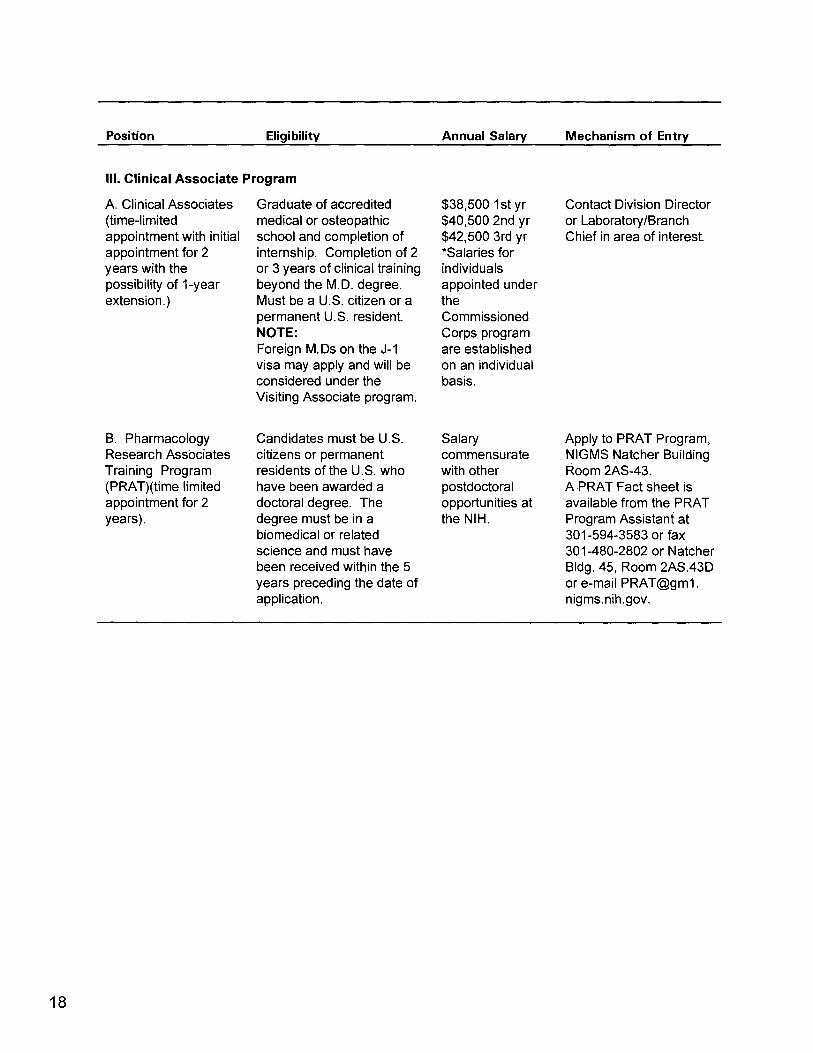
Position
Ill. Clinical Associate Program
A. Clinical Associates(time-limitedappointment with initialappointment for 2years with thepossibility of 1-yearextension.)
B. PharmacologyResearch AssociatesTraining Program(PRAT)(time limitedappointment for 2years) .
Eligibility
Graduate of accreditedmedical or osteopathicschool and completion ofinternship . Completion of 2or 3years of clinical trainingbeyond the M.D . degree .Must be a U.S . citizen or apermanent U.S . resident.NOTE:Foreign M.Ds on the J-1visa may apply and will beconsidered under theVisiting Associate program.
Candidates must be U.S .citizens or permanentresidents of the U.S . whohave been awarded adoctoral degree . Thedegree must be in abiomedical or relatedscience and must havebeen received within the 5years preceding the date ofapplication .
Annual Salary Mechanism of Entry
$38,500 1 st yr Contact Division Director$40,500 2nd yr or Laboratory/Branch$42,500 3rd yr Chief in area of interest .*Salaries forindividualsappointed undertheCommissionedCorps programare establishedon an individualbasis .
Salary Apply to PRAT Program,commensurate NIGMS Natcher Buildingwith other Room 2AS-43 .postdoctoral A PRAT Fact sheet isopportunities at available from the PRATthe NIH. Program Assistant at
301-594-3583 or fax301-480-2802 or NatcherBldg . 45, Room 2AS.43Dor e-mail PRAT@gm1 .nigms.nih .gov .
Position
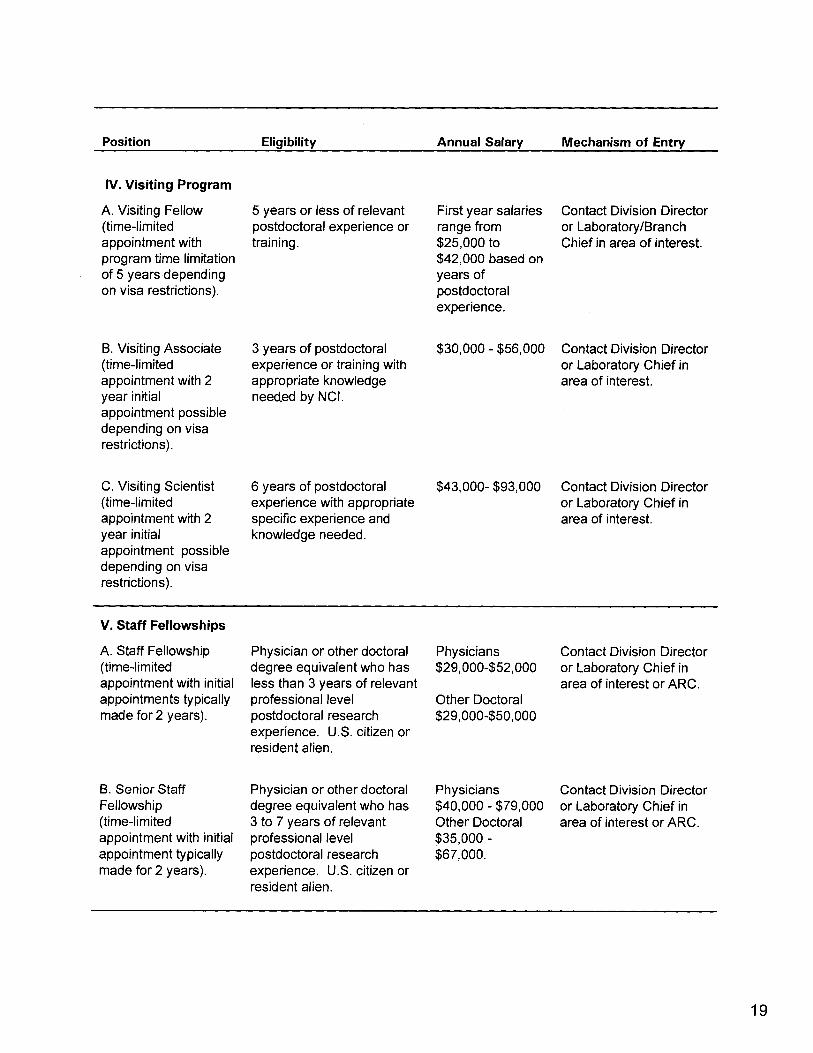
IV . Visiting Program
A . Visiting Fellow(time-limitedappointment withprogram time limitationof 5 years dependingon visa restrictions) .
B . Visiting Associate(time-limitedappointment with 2year initialappointment possibledepending on visarestrictions) .
C . Visiting Scientist(time-limitedappointment with 2year initialappointment possibledepending on visarestrictions) .
V . Staff Fellowships
A. Staff Fellowship(time-limitedappointment with initialappointments typicallymade for 2 years) .
B . Senior StaffFellowship(time-limitedappointment with initialappointment typicallymade for 2 years) .
Eligibility
5 years or less of relevantpostdoctoral experience ortraining .
3 years of postdoctoralexperience or training withappropriate knowledgeneeded by NCI .
6 years of postdoctoralexperience with appropriatespecific experience andknowledge needed .
Physician or other doctoraldegree equivalent who hasless than 3 years of relevantprofessional levelpostdoctoral researchexperience . U.S . citizen orresident alien .
Physician or other doctoraldegree equivalent who has3 to 7 years of relevantprofessional levelpostdoctoral researchexperience . U.S . citizen orresident alien .
Annual Salary
First year salariesrange from$25,000 to$42,000 based onyears ofpostdoctoralexperience .
$30,000 - $56,000
Contact Division Directoror Laboratory Chief inarea of interest .
$43,000- $93,000
Physicians$29,000452,000
Other Doctoral$29,000-$50,000
Physicians$40,000 - $79,000Other Doctoral$35,000-$67,000 .
Mechanism of Entry
Contact Division Directoror Laboratory/BranchChief in area of interest .
Contact Division Directoror Laboratory Chief inarea of interest .
Contact Division Directoror Laboratory Chief inarea of interest or ARC.
Contact Division Directoror Laboratory Chief inarea of interest or ARC .
Position
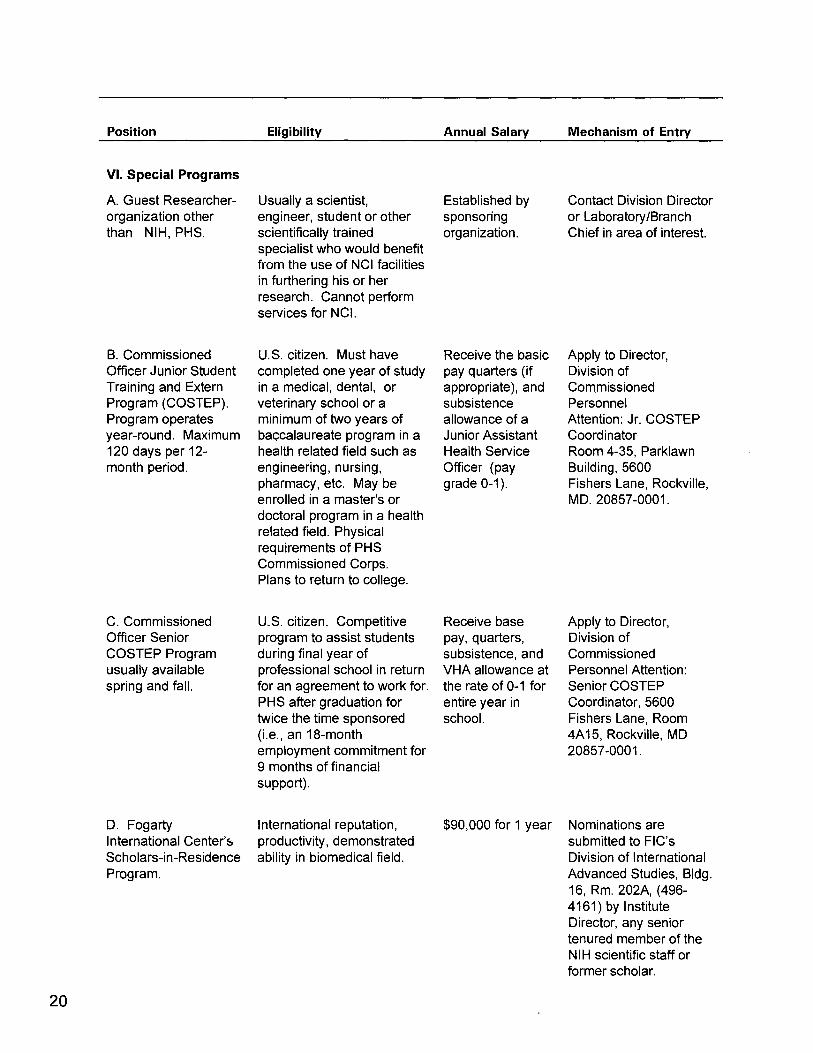
VI. Special Programs
A. Guest Researcher-organization otherthan NIH, PHS.
B. CommissionedOfficer Junior StudentTraining and ExternProgram (COSTEP) .Program operatesyear-round . Maximum120 days per 12-month period .
C. CommissionedOfficer SeniorCOSTEP Programusually availablespring and fall .
D. FogartyInternational Center'sScholars-in-ResidenceProgram.
Eligibility
Annual Salary
Usually a scientist,
Established byengineer, student or other
sponsoringscientifically trained
organization .specialist who would benefitfrom the use of NCI facilitiesin furthering his or herresearch . Cannot performservices for NCI .
U.S . citizen. Must havecompleted one year of studyin a medical, dental, orveterinary school or aminimum of two years ofbaccalaureate program in ahealth related field such asengineering, nursing,pharmacy, etc. May beenrolled in a master's ordoctoral program in a healthrelated field . Physicalrequirements of PHSCommissioned Corps.Plans to return to college.
U-S. citizen . Competitiveprogram to assist studentsduring final year ofprofessional school in returnfor an agreement to work for.PHS after graduation fortwice the time sponsored(i .e ., an 18-monthemployment commitment for9 months of financialsupport) .
International reputation,productivity, demonstratedability in biomedical field .
Receive the basicpay quarters (ifappropriate), andsubsistenceallowance of aJunior AssistantHealth ServiceOfficer (paygrade 0-1) .
Receive basepay, quarters,subsistence, andVHA allowance atthe rate of 0-1 forentire year inschool .
$90,000 for 1 year
Mechanism of Entry
Contact Division Directoror Laboratory/BranchChief in area of interest .
Apply to Director,Division ofCommissionedPersonnelAttention: Jr. COSTEPCoordinatorRoom 4-35, ParklawnBuilding, 5600Fishers Lane, Rockville,MD. 20857-0001 .
Apply to Director,Division ofCommissionedPersonnel Attention:Senior COSTEPCoordinator, 5600Fishers Lane, Room4A15, Rockville, MD20857-0001 .
Nominations aresubmitted to FIC'sDivision of InternationalAdvanced Studies, Bldg .16, Rm. 202A, (496-4161) by InstituteDirector, any seniortenured member of theNIH scientific staff orformer scholar.

Position
E . Student TemporaryEmployment Program
F . Special VolunteerProgram
Eligibility
Provides employmentopportunities for individualswho are enrolled oraccepted for enrollment as adegree seeking student andis taking at least a half-timeacademic/vocational ortechnical course load in anaccredited high school,technical or vocationalschool, 2 year or 4 yearcollege or university,graduate or professionalschool . The individual mustmaintain a good academicstanding and must be atleast 16 years of age . Mustbe a U .S . citizen or a non-citizen lawfully admitted tothe U.S . as a permanentresident or otherwiseauthorized to be employed.
Volunteer service may beaccepted for direct patientcare, clerical assignments,technical assistance, or anyother activities necessary tocarry out the authorizedfunctions of the NCI, withoutcompensation . If under 18volunteers must have awork permit which must beobtained prior toassignment .
Annual Salary Mechanism of Entry
Salary is Apply to NCI Humancommensurate Resources Managementwith duties and Consulting Branch,assigned and Staffing Managementstudent's Section, EPS, Roomeducation and/or 550, 6120 Executiveexperience . Blvd ., Rockville, MD
20892-7211 . Nodeadline required forapplying . Applicationsare maintained for oneyear . Considerationbeyond one yearrequires submission ofan updated application tothe above address .
N/A Contact Division Directoror Laboratory/BranchChief in area of interest .

Position
Eligibility Annual Salary
Mechanism of Entry
G. Student Career
Provides experience that is
Salary is
Contact NCI HumanExperience Program
directly related to the
commensurate
Resources Managementstudent's educational
with duties
and Consulting Branch,program and career goals.
assigned and
EPS, Room 550, 6120Must be 16 years of age or
student's
Executive Blvd .,older, enrolled or accepted
education and/or
Rockville, MD 20892-for enrollment as a degree
experience .
7211seeking student in anaccredited high school,technical or vocationalschool, 2 year or 4 yearcollege or university,graduate, or professionalschool . The individual mustmaintain a good academicstanding . The student mustbe recommended for theassignment by the school'scooperative educationprogram coordinator and beenrolled in the program .Must be enrolled in a field ofstudy related to theassigned work with at leasthalf-time academic/vocational or technicalcourse load . Must be a U.S .citizen or a non-citizenlawfully admitted to the U.S .as a permanent resident orotherwise authorized to beemployed . U.S . citizenshipis required for conversion topermanent employment .
Position
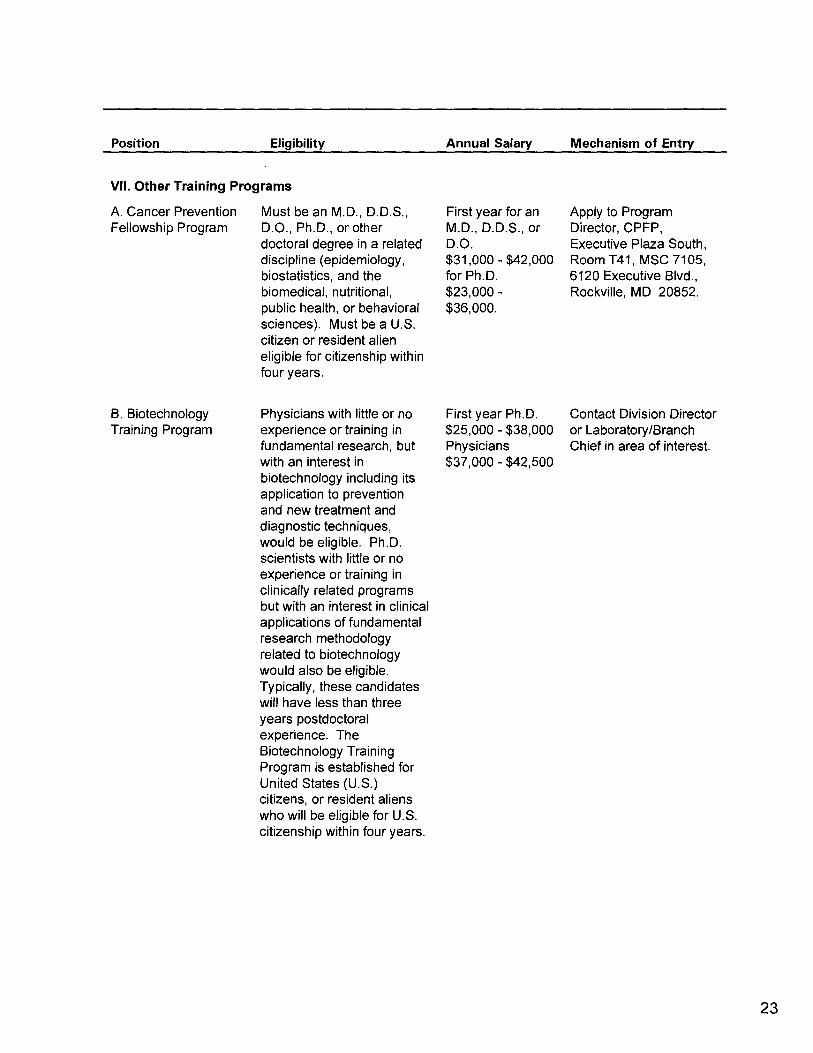
VII . Other Training Programs
Eligibility
Annual Salary
Mechanism of Entry
A. Cancer Prevention
Must be an M.D., D.D .S .,
First year for an
Apply to ProgramFellowship Program
D.O ., Ph.D ., or other
M.D., D.D .S ., or
Director, CPFP,doctoral degree in a related
D.O .
Executive Plaza South,discipline (epidemiology,
$31,000 - $42,000
Room T41, MSC 7105,biostatistics, and the
for Ph.D .
6120 Executive Blvd .,biomedical, nutritional,
$23,000-
Rockville, MD 20852.public health, or behavioral
$36,000.sciences). Must be a U.S .citizen or resident alieneligible for citizenship withinfour years.
B. Biotechnology
Physicians with little or no
First year Ph.D .
Contact Division DirectorTraining Program
experience or training in
$25,000 - $38,000
or Laboratory/Branchfundamental research, but
Physicians
Chief in area of interest .with an interest in
$37,000 - $42,500biotechnology including itsapplication to preventionand new treatment anddiagnostic techniques,would be eligible . Ph .D .scientists with little or noexperience or training inclinically related programsbut with an interest in clinicalapplications of fundamentalresearch methodologyrelated to biotechnologywould also be eligible .Typically, these candidateswill have less than threeyears postdoctoralexperience . TheBiotechnology TrainingProgram is established forUnited States (U.S .)citizens, or resident alienswho will be eligible for U.S .citizenship within four years.
Position
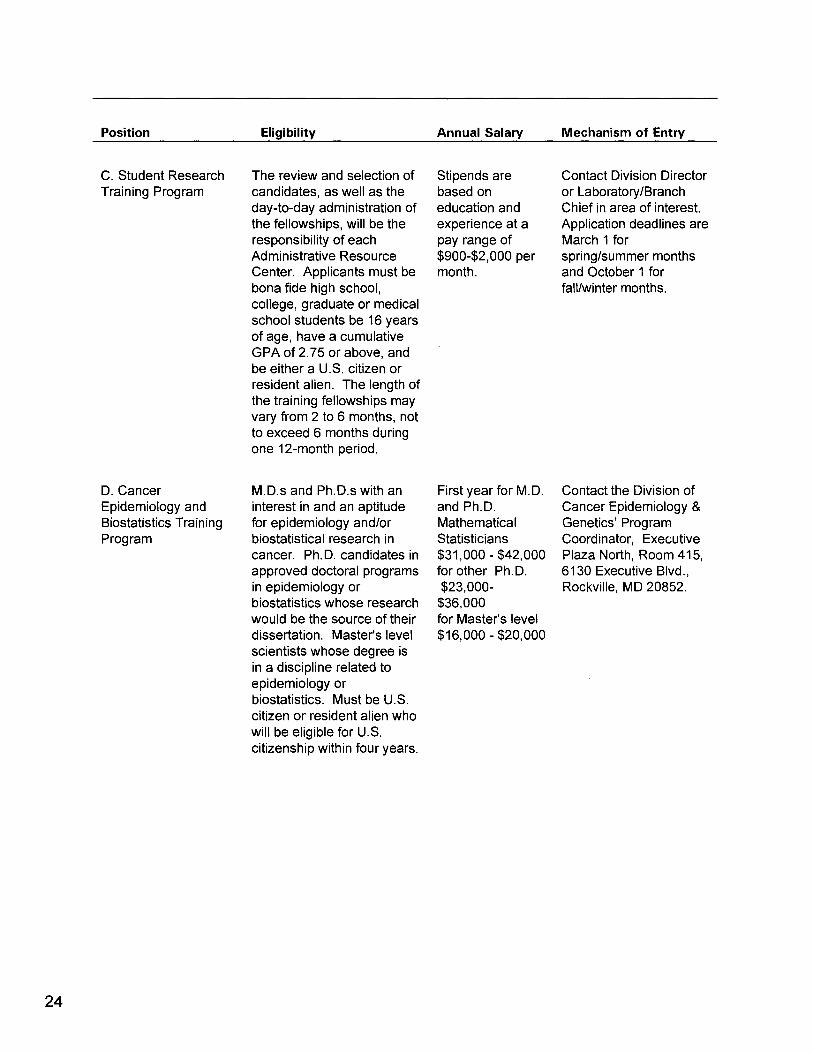
C. Student ResearchTraining Program
D. CancerEpidemiology andBiostatistics TrainingProgram
Eligibility
The review and selection ofcandidates, as well as theday-to-day administration ofthe fellowships, will be theresponsibility of eachAdministrative ResourceCenter . Applicants must bebona fide high school,college, graduate or medicalschool students be 16 yearsof age, have a cumulativeGPA of 2.75 or above, andbe either a U.S . citizen orresident alien. The length ofthe training fellowships mayvary from 2 to 6 months, notto exceed 6 months duringone 12-month period .
M.D.s and Ph .D .s with aninterest in and an aptitudefor epidemiology and/orbiostatistical research incancer . Ph.D . candidates inapproved doctoral programsin epidemiology orbiostatistics whose researchwould be the source of theirdissertation . Master's levelscientists whose degree isin a discipline related toepidemiology orbiostatistics . Must be U.S .citizen or resident alien whowill be eligible for U .S .citizenship within four years.
Annual Salary
Stipends arebased oneducation andexperience at apay range of$900-$2,000 permonth .
First year for M.D .and Ph .D .MathematicalStatisticians$31,000 - $42,000for other Ph.D .$23,000-$36,000for Master's level$16,000 - $20,000
Mechanism of Entry
Contact Division Directoror Laboratory/BranchChief in area of interest .Application deadlines areMarch 1 forspring/summer monthsand October 1 forfall/winter months .
Contact the Division ofCancer Epidemiology &Genetics' ProgramCoordinator, ExecutivePlaza North, Room 415,6130 Executive Blvd .,Rockville, MD 20852 .

Position
E . Cancer Geneticsand EpidemiologyTraining Program
Eligibility
M .D ., D.D.S ., or D.O . or anaccredited doctoral degreein a discipline related tocancer etiology andprevention research (e.g .epidemiology, human ormolecular genetics,biostatistics, or thebiomedical, public health orbehavioral sciences) . Ph.D .typically less than 3 yearspost-doc .
Foreign medical graduatesmust have current USMLEor ECFMG certification andappropriate experience
Must be a U .S . citizen orresident alien eligible forcitizenship within 4 years .
Annual Salary
First year stipendfor M.D . andPh .D .MathematicalStatisticians$31,000-$42,000 ; for otherPh .D . $23,000 -$36,000 .
Mechanism of Entry
Contact the NCI'sDivision of CancerEpidemiology &Genetics, HumanGenetics ProgramCoordinator, ExecutivePlaza North, Room 400,6130 Executive BlvdMSC 7360 Rockville, MD20892-7360 .
Position
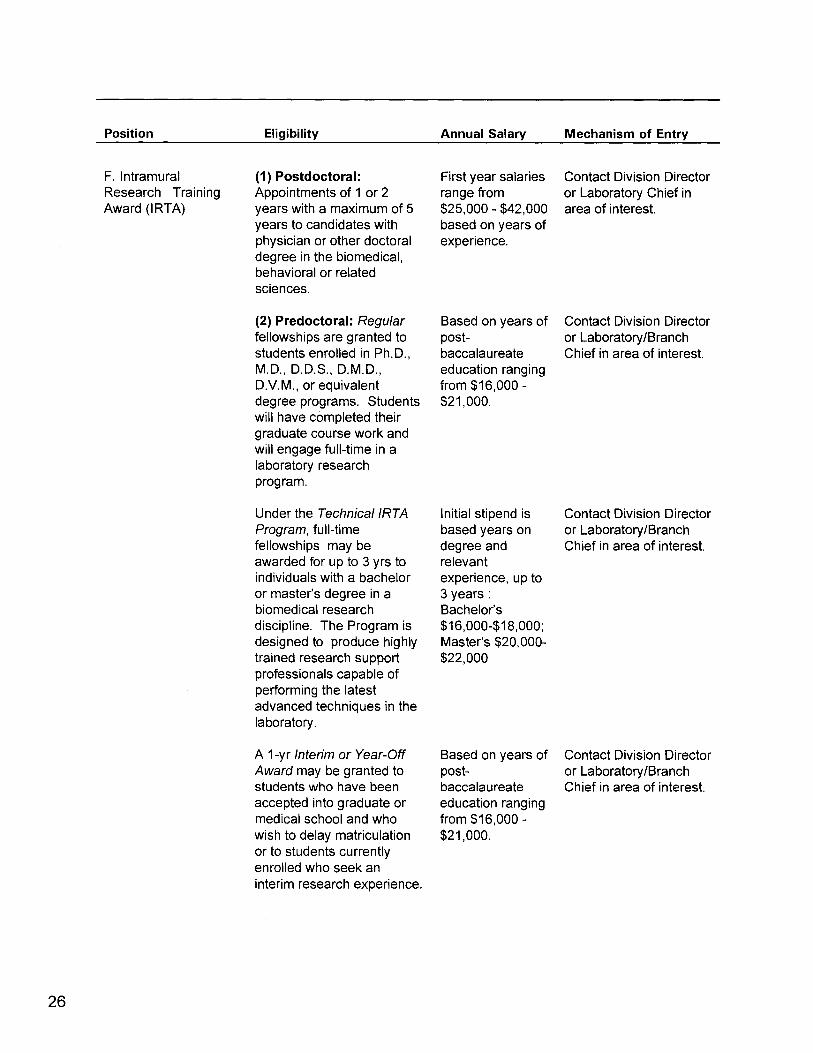
F . IntramuralResearch TrainingAward (IRTA)
Eligibility
(1) Postdoctoral :Appointments of 1 or 2years with a maximum of 5years to candidates withphysician or other doctoraldegree in the biomedical,behavioral or relatedsciences .
(2) Predoctoral : Regularfellowships are granted tostudents enrolled in Ph .D .,M. D., D.D.S ., D.M .D .,D.V.M ., or equivalentdegree programs . Studentswill have completed theirgraduate course work andwill engage full-time in alaboratory researchprogram.
Under the Technical IRTAProgram, full-timefellowships may beawarded for up to 3 yrs toindividuals with a bacheloror master's degree in abiomedical researchdiscipline . The Program isdesigned to produce highlytrained research supportprofessionals capable ofperforming the latestadvanced techniques in thelaboratory .
A 1-yr Interim or Year-OffAward may be granted tostudents who have beenaccepted into graduate ormedical school and whowish to delay matriculationor to students currentlyenrolled who seek aninterim research experience .
Annual Salary
First year salariesrange from$25,000 - $42,000based on years ofexperience .
Based on years ofpost-baccalaureateeducation rangingfrom $16,000 -$21,000.
Initial stipend isbased years ondegree andrelevantexperience, up to3 yearsBachelor's$16,000-$18,000 ;Master's $20,000-$22,000
Based on years ofpost-baccalaureateeducation rangingfrom $16,000 -$21,000.
Mechanism of Entry
Contact Division Directoror Laboratory Chief inarea of interest.
Contact Division Directoror Laboratory/BranchChief in area of interest.
Contact Division Directoror Laboratory/BranchChief in area of interest.
Contact Division Directoror Laboratory/BranchChief in area of interest.

Position
G. TechnologyTransfer FellowshipProgram
Eligibility
Candidates in the RecentCollege Graduate programmust have graduated froman accredited college oruniversity no more than 12months prior to activationand must intend on applyingto graduate or medicalschool within the next year .
The Student SupportProgram is designed toprovide developmentaltraining to promisingdisadvantaged students,enrolled full time in highschool or undergraduatestudies in an accreditedsecondary school,college/university who havean interest in biomedicalresearch and who may nototherwise haveopportunities to work at NIH.
Physicians, Ph.D.'s, J .D.'s,individuals with a master'sdegree in healthcommunications, biomedicalscience, behavioral science,computer science,informatics, library science,health education, marketing,journalism, English, agraduate degree in law, or agraduate degree in anotherdiscipline withlegal/paralegal expertise,with little or no experienceor training in technologytransfer or communicationsresearch but with an interestin these areas.
Annual Salary
Based on years ofpost-baccalaureateeducation rangingfrom $16,000 -$21,000.
Annual stipend isbased oneducational level,ranging from$6,480 for highschool to $9,720for undergraduatestudent.
Based on years of(1) postdoctoralexperiencestarting at$25,000 - $38,000or (2) post-Master's degreestarting at$22,000-$34,000.
Mechanism of Entry
Contact Division Directoror Laboratory/BranchChief in area of interest .
Contact Division Directoror Laboratory/BranchChief in area of interest .
Contact followingprogram in area ofinterest : Office of CancerInformation,Communication andEducation, the Office ofCancerCommunications, theDivision of CancerPrevention, the Divisionof Cancer Treatment andDiagnosis, the Office ofScience Policy, and theTechnology,Development, andCommercializationBranch .

Position
H . Research ScholarsProgram
Eligibility
Individuals up to 5 yearspost-doc may apply forindependent resourcesusing a mechanism whichcombines a K22 awardwith an appointmentthrough an intramuralresearch training award,allowing the PI to bridgetheir intramural researchtraining experience to anacademic institution .
Candidates will respond toan RFA with anindependent researchproposal that will utilize thestandard peer reviewprocess. Selectedcandidates will establishindependent researchprograms with an NCIIntramural Lab/Branch, notto exceed 4 years. At theend of 3 years, upon NCIapproval and identificationof a sponsoring homeinstitution, the K award willbe activated, not to exceedtwo years.
Annual Salary
$150,000-Includes stipendfor scholar & nomore than 2additionalpositions (e.g .postdoc trainee &technician); up to$25,000 perperson for annualoperatingexpenses ; and infirst year up to$50,000additional forequipment.
K22 at outsideinstitution -$125,000 plusfringe benefits indirect costs:Includes up to$50,000 topartially supportpersonnel,supplies,equipment, travel,tuition, and othercosts.
Mechanism of Entry
An annual RPAannouncement will beadvertised formally in theNIH Guide to Grants andContracts as well as inscientific, clinical, andepidemiological journals .
An application kit (398Form) and brochurewould be distributed tointerested scientists .
Inquiries onprogrammatic issuesmay be directed to: Dr .Vincent J. Cairoli(Email :[email protected])Executive Plaza North,Room 520 Rockville, MD20892-7390 ,Telephone :301-496-8580,Fax: 301-402-4472

Source : Mortality tape (1994) from National Center for Health Statistics.
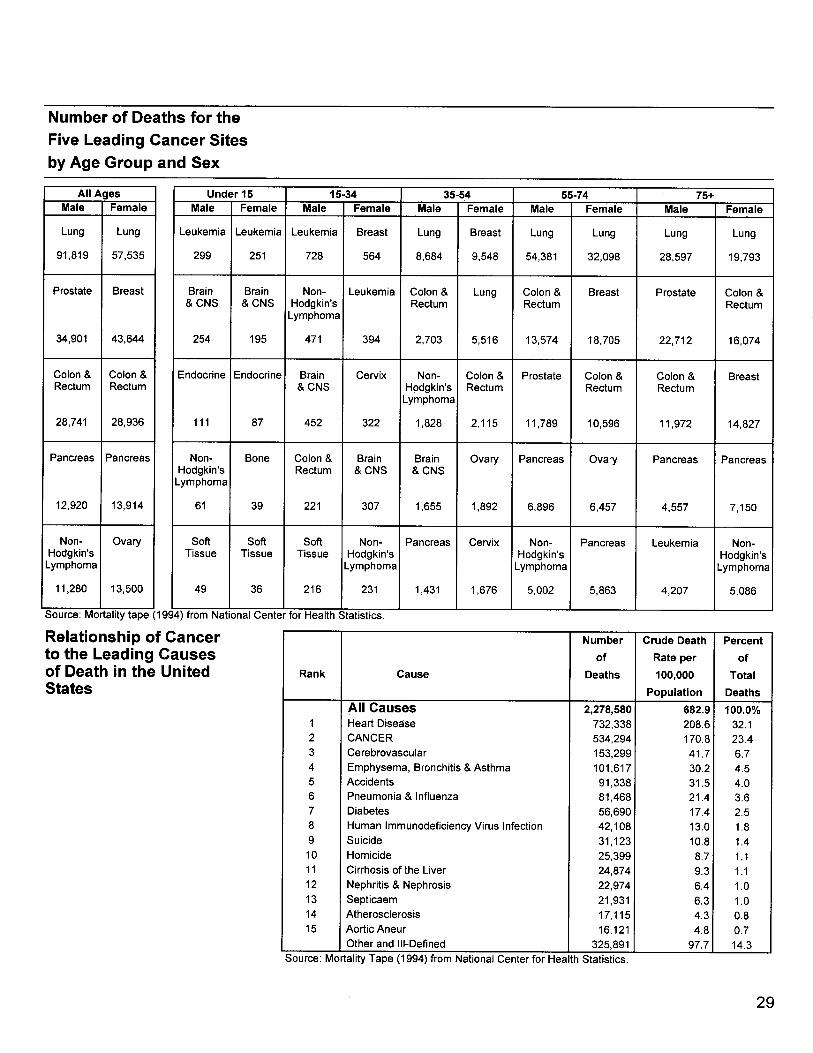
Number of Deaths for theFive Leading Cancer Sitesby Age Group and Sex
Relationship of Cancerto the Leading Causesof Death in the UnitedStates
Source : Mortality Tape (1994) from National Center for Health Statistics .
29
All AgesMale Female
Lung Lung
91,819 57,535
Prostate Breast
34,901 43,644
Colon & Colon &Rectum Rectum
28,741 28,936
Pancreas Pancreas
12,920 13,914
Non- OvaryHodgkin'sLymphoma
11,280 13,500
Under 15 15-34 35-54 55-74 75+Male Female Male Female Male Female Male Female Male Female
Leukemia Leukemia Leukemia Breast Lung Breast Lung Lung Lung Lung
299 251 728 564 8,684 9,548 54,381 32,098 28,597 19,793
Brain Brain Non- Leukemia Colon & Lung Colon & Breast Prostate Colon && CNS & CNS Hodgkin's Rectum Rectum Rectum
Lymphoma
254 195 471 394 2,703 5,516 13,574 18,705 22,712 16,074
Endocrine Endocrine Brain Cervix Non- Colon & Prostate Colon & Colon & Breast& CNS Hodgkin's Rectum Rectum Rectum
Lymphoma
111 87 452 322 1,828 2,115 11,789 10,596 11,972 14,827
Non- Bone Colon & Brain Brain Ovary Pancreas Ovary Pancreas PancreasHodgkin's Rectum & CNS & CNSLymphoma
61 39 221 307 1,655 1,892 6,896 6,457 4,557 7,150
Soft Soft Soft Non- Pancreas Cervix Non- Pancreas Leukemia Non-Tissue Tissue Tissue Hodgkin's Hodgkin's Hodgkin's
Lymphoma Lymphoma Lymphoma
49 36 216 231 1,431 1,676 5,002 5,863 4,207 5,086
Rank Cause
Numberof
Deaths
Crude DeathRate per100,000
Population
Percentof
TotalDeaths
All Causes 2,278,580 682.9 100.0%1 Heart Disease 732,338 208 .6 32 .12 CANCER 534,294 170.8 23 .43 Cerebrovascular 153,299 41 .7 6 .74 Emphysema, Bronchitis & Asthma 101,617 30.2 4 .55 Accidents 91,338 31 .5 4 .06 Pneumonia & Influenza 81,468 21 .4 3 .67 Diabetes 56,690 17.4 2 .58 Human Immunodeficiency Virus Infection 42,108 13.0 1 .89 Suicide 31,123 10.8 1 .410 Homicide 25,399 8.7 1 .111 Cirrhosis of the Liver 24,874 9.3 1 .112 Nephritis & Nephrosis 22,974 6.4 1 .013 Septicaem 21,931 6.3 1 .014 Atherosclerosis 17,115 4.3 0 .815 Aortic Aneur 16,121 4 .8 0 .7
Other and III-Defined 325,891 97 .7 14.3

Estimated New CancerCases and Deathsby Sex for All Sites 1997
Source :
Cancer Facts &Figures-1997, American Cancer Society, Atlanta, Georgia 1997 .Excludes basal and squamous cell skin and in situ carcinomas, except urinary bladder.Incidence projections are based on rates from the NCI SEER Program 1979-92.
* Original ACS prostate cancer estimate may be too high due to the unavailablity of 1994 and preliminary 1995incidence rates at estimation time . With the additional information, NCI and ACSestimate that there will be lessthan 210,000 new cases of prostate cancer in 1997 .
Estimated New Cases Estimated Deaths
Primary Site Total Male Female Total Male FemaleAll Sites ' 1,257,800 661,200 596,600 560,000 294,100 265,900Oral Cavity and Pharynx 30,750 20,900 9,850 8,440 5,600 2,840
Tongue 6,400 4,200 2,200 1,820 1,200 620Mouth 11,000 6,700 4,300 2,500 1,400 1,100Pharynx 8,800 6,400 2,400 2,030 1,500 530Other Oral Cavity 4,550 3,600 950 2,090 1,500 590Digestive System 225,900 120,000 105,900 127,070 67,440 59,630
Esophagus 12,500 9,400 3,100 11,500 8,700 2,800
Stomach 22,400 14,000 8,400 14,000 8,300 5,700Small Intestine 4,900 2,600 2,300 1,140 540 600Colon 94,100 45,500 48,600 46,600 22,600 24,000Rectum 37,100 20,900 16,200 8,300 4,400 3,900Anus, Anal Canal, & Anorectum 3,400 1 ;400 2,000 410 150 260Liver and Intrahepatic Bile Duct 13,600 9,100 4,500 12,400 7,500 4,900Gallbladder &Other Biliary 6,900 2,500 4,400 3,500 1,300 2,200Pancreas 27,600 13,400 14,200 28,100 13,500 14,600
Other Digestive 3,400 1,200 2,200 1,120 450 670Respiratory System 194,600 111,400 83,200 165,920 98,490 67,430Larynx 10,900 8,900 2,000 4,230 3,300 930
Lung and Bronchus 178,100 98,300 79,800 160,400 94,400 66,000Other Respiratory 5,600 4,200 1,400 1,290 790 500
Bones and Joints 2,500 1,300 1,200 1,410 750 660Soft Tissues 6,600 3,700 2,900 4,100 1,900 2,200Melanomas Of Skin 40,300 22,900 17,400 7,300 4,600 2,700Breast 181,600 1,400 180,200 44,190 290 43,900
Genital Organs 300,200 218,400 81,800 68,870 42,370 26,500Cervix Uteri 14,500 14,500 4,800 4,800Corpus and Uterus, NOS 34,900 34,900 6,000 6,000Ovary 26,800 26,800 14,200 14,200Other Female Genital 5,600 5,600 1,500 1,500Prostate ' 209,900 209,900 41,800 41,800
Testis 7,200 7,200 350 350Other Male Genital 1,300 1,300 220 220
Urinary System 85,400 58,000 27,400 23,520 15,060 8,460
Urinary Bladder 54,500 39,500 15,000 11,700 7,800 3,900Kidney and Other Urinary 30,900 18,500 12,400 11,820 7,260 4,560
Eye and Orbit 2,100 1,100 1,000 250 140 110
Brain and Other Nervous System 17,600 10,100 7,500 13,200 7,200 6,000,Endocrine Glands 17,560 5,530 12,030 2,070 870 1,200Thyroid 16,100 4,700 11,400 1,230 450 780Other Endocrine 1,460 830 630 840 420 420
Lymphomas and Myelomas 74,900 42,100 32,800 36,180 18,720 17,460Hodgkin's Disease 7,500 3,900 3,600 1,480 820 660
Non-Hodgkin's Lymphoma 53,600 30,300 23,300 23,800 12,400 11,400
Multiple Myeloma 13,800 7,900 5,900 10,900 5,500 5,400Leukemias 28,300 15,900 12,400 21,310 11,770 9,540Lymphocytic Leukemias 10,400 5,900 4,500 6,310 3,570 2,740Myeloid Leukemias 13,500 7,100 6,400 8,700 4,800 3,900
Other Leukemias 4,400 2,900 1,500 6,300 3,400 2,900
All Other Sites 49,500, 28,500 21,000, 36,190 18,900 17,290

The Cost of Cancer
The direct cost of cancer is derived from the figures for care of patients . It does notinclude the cost of the productivity lost while individuals are away from their work due totreatment of disability or the value of lost productivity due to premature death . Figuresfor the direct cost of cancer and for all health care for 1990 are as follow :
(in Millions)
All Costs
Direct Cost
All Cancers
$35,256
All Health Care
$585,300
Percent Relationship of Cancer to
6%Total
Sources:Brown, M.L . The National Economic Burden of Cancer: An Update.Journal of the National Cancer Institute, 1990, 82:1881-1814 .Office of the Actuary, Health Care Financing Administration .

Average Years of Life LostPer Person Dying of CancerAll Races, Both Sexes, 1994
Childhood (Ages 0-14)
Testis
37.1
Hodgkin's Disease
26'.4
Brain & CNS
22.3
Melanomas of Skin
19.4
Leukemias
17.7
Ovary 17.4
Oral Cavity & Pharynx =6.5
Prostate
0
Non-Hodgkin's Lymphomas
16.0
Kidney & Renal Pelvis
15.5
All Sites -15.3
Esophagus 15.0
Corpus & Uterus, NOS
15.0
Lung & Bronchus =14.9
Stomach 14.2
Pancreas 13.9
Multiple Myeloma
13.7
Colorectal 13.5
Bladder
11 ~2
69.2
15 30 45 60 75Years
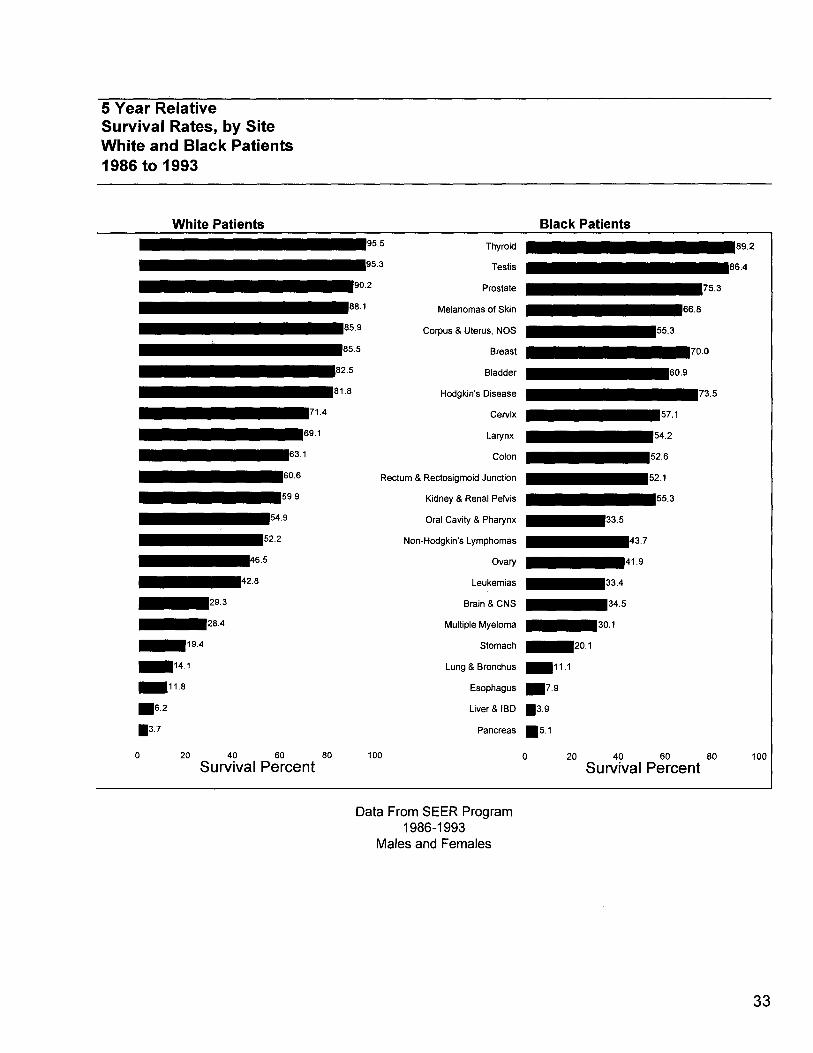
5 Year RelativeSurvival Rates, by SiteWhite and Black Patients1986 to 1993
White Patients
Black Patients
019.4
14 .1
129.3
28.4
-71.4
_69.1
-63.1
"60 .6
.59.9
54 .9
=52.2
.46.5
42 .8
0 20 40 60 80 100
0Survival Percent
E95.5
Thyroid
89.2
"95 .3
Testis
86.4
90 .2
Prostate
75.3
.88.1
Melanomas of Skin
66.8
.85.9
Corpus & Uterus, NOS
55.3
.85.5
Breast
70.0
182.5
Bladder
60.9
81 .8
Hodgkin's Disease
73.5
Cervix
57.1
Larynx
54.2
Colon
52.6
Rectum & Rectosigmoid Junction
52.1
Kidney & Renal Pelvis
55.3
Oral Cavity & Pharynx -33.5
Non-Hodgkin's Lymphomas
43.7
Ovary
41 .9
Leukemias -33.4
Brain &CNS
34.5
Multiple Myeloma -30.1
Stomach -20.1
Lung & Bronchus _11.1
Esophagus -7.9
Liver & IBD
.3.9
Pancreas .5.1
Data From SEER Program1986-1993
Males and Females
20 40 60 80 100Survival Percent

Cancer Mortality RatesChanges from 1973 to 1994(Ages Under 65)
Lung (Females)Liver & Intrahep
Multiple MyelomaNon-Hodgkin's
Melanomas of SkinEsophagus
Kidney/RenalProstate
Brain & ONSAll Cancers
Lung (Males)Pancreas
Breast (Females)All Except Lung
LarynxLeukemias
ThyroidColon/Rectum
Oral Cav & PhynxUrinary Bladder
OvaryStomach
Corpus & Uterus, NOSCervix UteriHodgkin's
Testis
Ages Under 65
-64.3
' -9.2=
-1 o.sr
I
-19.s--23.6--23.8
-29.0--30.0
-30.5-35.6
-39.6-42.7
-66.6
68 .33f .5
-11.513.$
9.95.5
3.010 .8
-80 -60 -40 -20 0 20 40 60 80Percent Change, 1973-1994
Note:
Progress and problems:
This graph illustrates percent changes in the annual death rate fora wide range of cancers. Cancers to the right of the zero axis have hadincreasedcancer mortality
rates, those to the left have haddecreased mortalityrates. If the graph is turned counterclockwise, on its side, the bars pointing down show the majortumors in
which a significantreduction in annual death rate has occurred. Progress is apparent a reduction hasoccurred in the annual death rates since 1973 in both common and
uncommon cancers . This definitely showsprogress in the age group under 65, albeit more progress needs to be made.
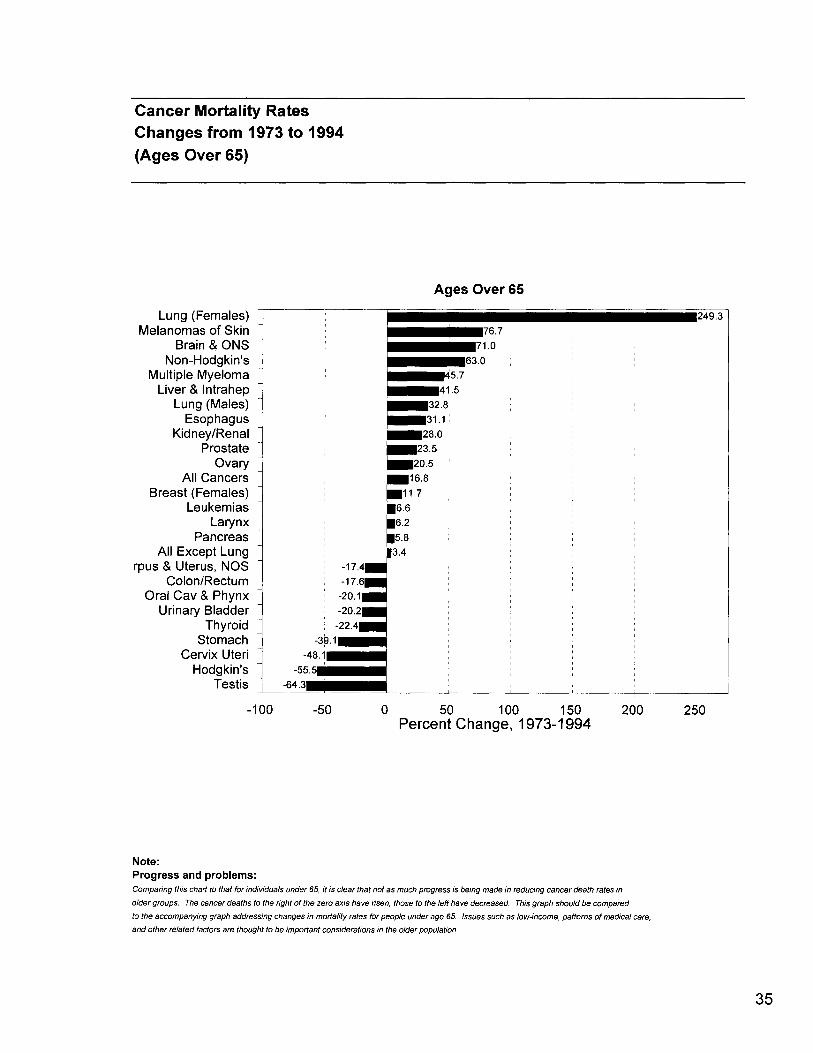
Cancer Mortality RatesChanges from 1973 to 1994(Ages Over 65)
Lung (Females)Melanomas of Skin
Brain & ONSNon-Hodgkin's
Multiple MyelomaLiver & Intrahep
Lung (Males)Esophagus
Kidney/RenalProstateOvary
All CancersBreast (Females)
LeukemiasLarynx
PancreasAll Except Lung
rpus & Uterus, NOSColon/Rectum
Oral Cav & PhynxUrinary Bladder
ThyroidStomach
Cervix UteriHodgkin's
Testis
Ages Over 65
-100 -50 0 50 100 150 200 250Percent Change, 1973-1994
Note :Progress and problems :Comparing this chartto that for individuals under 65, it is clearthat not as much progress is being made in reducing cancer death rates inoldergroups. Thecancer deaths to the right of the zero axis have risen, those to the left have decreased. This graph should be comparedto the accompanying graph addressing changes in mortality ratesforpeople underage 65. Issues such as low-income, patterns of medical care,and other relatedfactors are thought to be important considerations in the older population .

Cancer Mortality RatesUnited States, 1990-1994
NOTE: The annual number ofcancer deaths per 100,000 persons is derived from estimates
of the National Center for Health Statistics, adjusted to the 1970 US population age distribution .
Mortality Rate per 100,000 RatioCancer Site Blacks Whites Blacks/WhitesAll Sites 226.0 168.6 1 .3
Males 314.4 211.2 1 .5Females 168.9 140.2 1 .2
Esophagus 7.9 3.1 2.5Cervix Uteri 6.3 2.5 2.5Larynx 2.8 1 .2 2.3Prostate 55.5 24.3 2.3Multiple Myeloma 6.1 2.8 2 .2Stomach 8.5 4.0 2.1Oral Cavity & Pharynx 5.0 2 .6 1 .9Corpus & Uterus, NOS 5.9 3.2 1 .8Liver & Intrahepatic Bile Duct 4.5 2.9 1 .6Pancreas 12 .1 8 .2 1 .5Thyroid 0.3 0.3 1 .0Colon & Rectum 23.3 17.8 1 .3Lung & Bronchus 61 .3 49.4 1 .2
Males 103.2 71 .3 1 .4Females 33.0 33.3 1 .0
Breast (females) 31 .4 26.2 1 .2<50 years 8.8 5.5 1 .6>50 ears 101 .2 90.0 1 .1
Urinary Bladder 3.2 3.3 1 .0Kidney & Renal Pelvis 3.5 3.5 1 .0Leukemias 6.0 6.4 0 .9Hodgkin's Disease 0 .5 0 .5 1 .0Ovary 6.6 8.0 0 .8Non-Hodgkin's Lymphoma 4.6 6.8 0 .7Brain & Other Nervous 2 .5 4 .5 0 .6Testis 0.1 0 .3 0.3Melanomas of Skin 0.4 2 .5 0 .2All Sites Except Lung & Bronchus 164.6 119.2 1 .4Males 211 .2 139.9 1 .5Females 136.3 106.8 1 .3
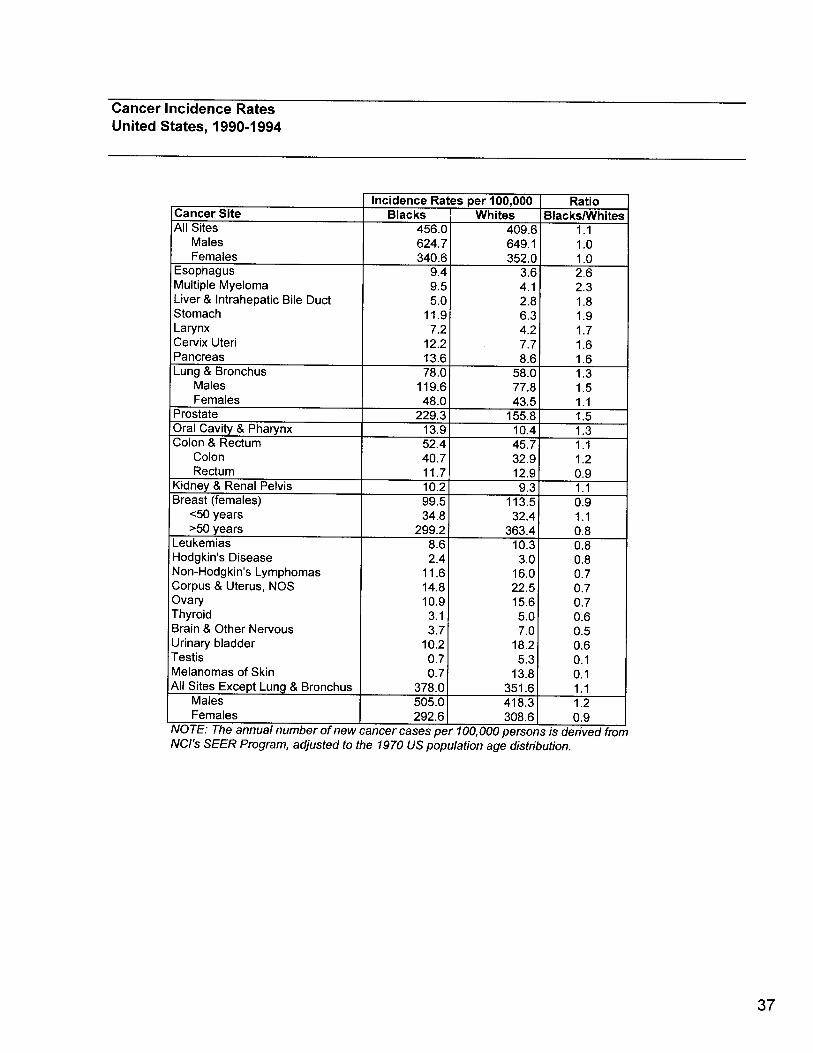
Cancer Incidence RatesUnited States, 1990-1994
NOTE: The annual numberof new cancer cases per 100,000 persons is derived fromNCI's SEER Program, adjusted to the 1970 US population age distribution.
Incidence Rates per 100,000 RatioCancer Site Blacks Whites Blacks/WhitesAll Sites 456.0 409.6 1 .1
Males 624.7 649.1 1 .0Females 340.6 352.0 1 .0
Esophagus 9.4 3.6 2.6Multiple Myeloma 9.5 4.1 2.3Liver & Intrahepatic Bile Duct 5.0 2.8 1 .8Stomach 11 .9 6.3 1 .9Larynx 7.2 4.2 1 .7Cervix Uteri 12 .2 7.7 1 .6Pancreas 13 .6 8.6 1 .6Lung & Bronchus 78.0 58.0 1 .3
Males 119.6 77.8 1 .5Females 48.0 43.5 1 .1
Prostate 229.3 155.8 1 .5Oral Cavity & Pharynx 13.9 10.4 1 .3Colon & Rectum 52.4 45.7 1 .1
Colon 40.7 32 .9 1 .2Rectum 11 .7 12 .9 0.9
Kidney & Renal Pelvis 10.2 9 .3 1 .1Breast (females) 99.5 113 .5 0.9
<50 years 34.8 32.4 1 .1>50 years 299.2 363.4 0.8
Leukemias 8 .6 10.3 0.8Hodgkin's Disease 2 .4 3.0 0.8Non-Hodgkin's Lymphomas 11 .6 16.0 0.7Corpus & Uterus, NOS 14.8 22.5 0.7Ovary 10.9 15.6 0.7Thyroid 3.1 5.0 0.6Brain & Other Nervous 3.7 7.0 0-.5Urinary bladder 10.2 18.2 0 .6Testis 0.7 5.3 0.1Melanomas of Skin 0.7 13.8 0.1All Sites Except Lung & Bronchus 378.0 351 .6 1 .1
Males 505.0 418.3 1 .2Females 292 .6 308.6 0.9

The Prevalence of Cancer:Estimated Number of PersonsDiagnosed With CancerUnited States, 1997
1997 Estimated PrevalenceTotal Males Females
ALL SITES 8,114,000 3,352,000 4,762,000All Sites (Age 0-14) 152,000 77,000 75,000Bladder 582,000 428,000 154,000Brain 89,000 48,000 41,000Buccal 207,000 129,000 78,000Colon 848,000 393,000 455,000Hodgkin's 156,000 83,000 73,000Kidney 198,000 119,000 79,000Larynx 128,000 103,000 25,000Leukemia 140,000 78,000 62,000Lung 386,000 206,000 180,000Melanoma 467,000 225,000 242,000Non Hodgkin's 291,000 145,000 146,000Pancreas 23,000 11,000 12,000Rectum 367,000 195,000 172,000Stomach 74,000 40,000 34,000Thyroid 207,000 51,000 156,000Prostate 984,000 984,000Testis 127,000 127,000Breast 1,993,000 12,000 1,981,000Cervix 205,000 205,000Corpus 516,000 516,000Ovary 186,000 186,000NOTE: Previous published prevalence national estimates of cancer have beenrevised using age-specific cancer rates. There has been no decline inprevalence-the number ofcancer survivors has increased during recentyears. "1
~.a7l1

mca
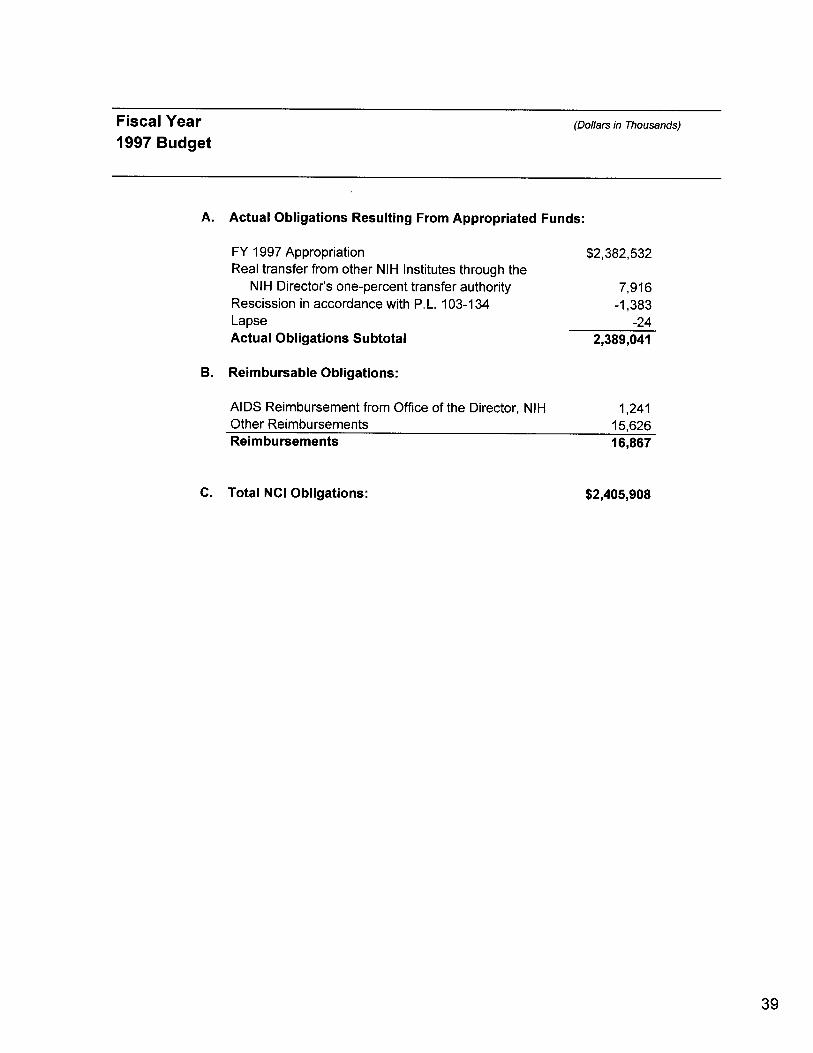
Fiscal Year1997 Budget
(Dollars in Thousands)
A. Actual Obligations Resulting From Appropriated Funds:
FY 1997 Appropriation $2,382,532Real transfer from other NIH Institutes through the
NIH Director's one-percent transfer authority 7,916Rescission in accordance with P.L . 103-134 -1,383Lapse -24Actual Obligations Subtotal 2,389,041
B. Reimbursable Obligations:
AIDS Reimbursement from Office of the Director, NIH 1,241Other Reimbursements 15,626Reimbursements 16,867
C. Total NCI Obligations: $2,405,908
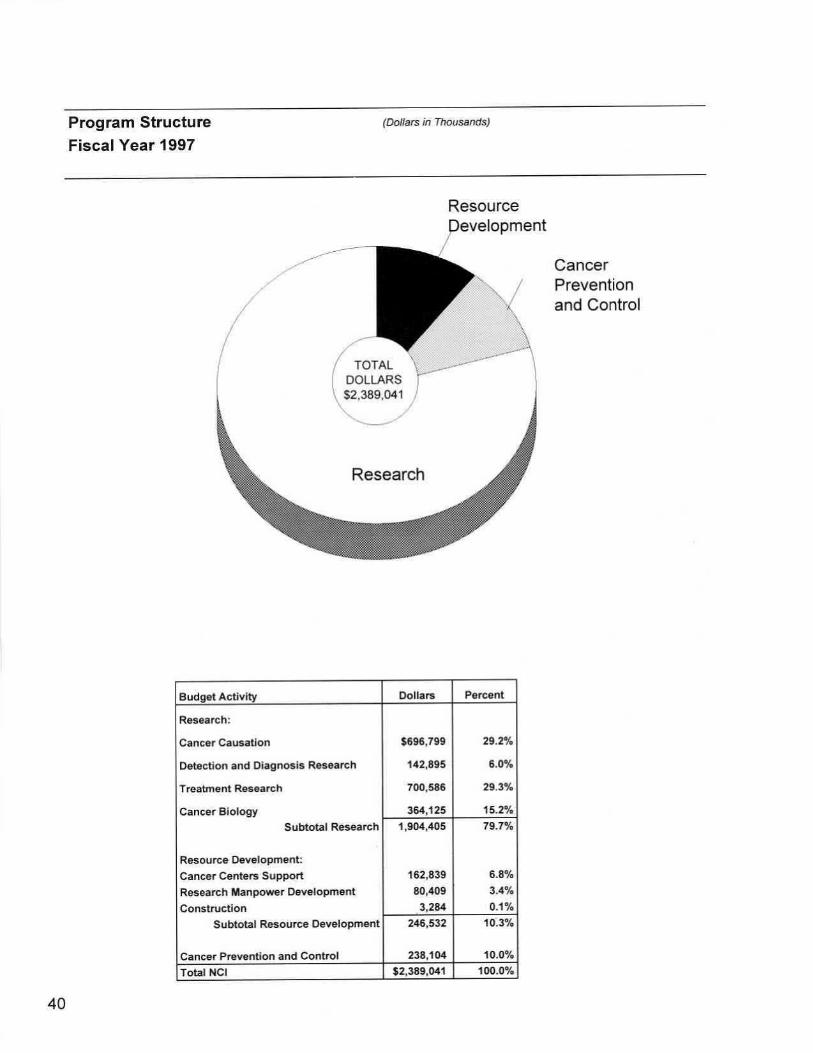
Program StructureFiscal Year 1997
(Dollars in Thousands)
ResourceQevelopment
TOTALDOLLARS
`,. 52,389,041
Research
CancerPreventionand Control
Budget Activity Dollars Percent
Research :
Canter Causation $696,789 29.2%
Detection and Diagnosis Research 142,895 ú .0°1o
Treatment Research 700,586 29.3%
Cancer Biology 364,125 15.2%Subtotal Research 1,904,405 79.7%
Resource Development :Cancer Centers Support 162,839 6.8%Research Manpower Development 80,409 3.4%Construction 3,284 0.1%
Subtotal Resource Development 246,532 10.3%
Cancer Prevention and Control 238,104 10.0%
Total NCI $2,389,041 100.0%

Extramural FundsFiscal Year 1997
(Dollars in Thousands)
Dollars PercentContracts:SBIR Contracts $796 0.1%Research and Development Contracts 183,484 10 .1Cancer Control Contracts 110,420 6.1Construction Contracts 1,590 0.1%
Subtotal Contracts 296,290 16.2%
Grants :Research Project Grants 1,123,315 61 .6%Cancer Centers/SPORES 160,713 8.8%Training Activities 44,559 2.4%Other Research Grants 127,951 7.0%Cancer Control Grants 70,014 3.8%Construction Grants 1,410 0.1%
Subtotal Grants 1,527,962 83.8%Total Extramural Funds 1,824,252 100.0%Total Intramural/RMS/Control/Inhouse 564,789Total NCI $2,389,041

Total NCI Dollars by Mechanism
(Dollars in Thousands)
Fiscal Year 1997
Number AmountPercentof Total
Research Grants :Research Project Grants :
Traditional Awards : 2,194 $577,432 24.2%Program Projects 149 202,317 8.5%FIRST Awards 446 47,413 2 .0%MERIT Awards 90 30,950 1 .3%Outstanding Investigator Grants 63 62,892 2.6%RFAs 195 48,148 2 .0%Cooperative Agreements 169 81,193 3.4%Shannon Awards 21 1,450 0 .1Small Grants 101 6,411 0.3%Exploratory/Developmental Grants 63 12,269 0.5%Program Evaluation Assessment 5,684 0.2%SBIR/STTR Grants 253 47,156 2 .0%Subtotal, Research Project Grants 3,7441 1,123,315, 47%
Cancer Centers Grants 57 131,948 5.5%SPOREs 14 28,765 1 .2%
Subtotal, Centers 71 160,713 6.7%
Other Research Grants :Career Program
RCDA-KO4 10 684 0.0%Clinical Oncology-K12 15 3,999 0.2%Physician Investigator-K11 27 2,411 0.1%Preventive Oncology-KO7 32 2,802 0.1%Clinical Investigator-KO8 103 8,138 0.3%Temin Awards-K01 17 1,627 0.1%Subtotal, Career Program 204 19,661 0.8%
Cancer Education Program 80 12,085 0.5%Clinical Cooperative Groups 146 88,499 3.7%Minority Biomedical Support 2,588 0.1%Scientific Evaluation 2 3,528 0.1%Resource Grants 3 667 0.0%Conference Grants 58 923 0.0%Subtotal, Other Research Grants 493 127,951 574%Subtotal, Research Grants 4,308 1,411,979 59 .1
NRSA Fellowships Trainees : 1,601 44,559 1 .9%
Research and Development Contracts :R&D Contracts 183,484 7.7%SBIR Contracts 796 0.0%Subtotal, Contracts 184,280 7.7%
Intramural Research :Intramural Research FTEs : 1,381 287,607 12.0%NIH Management Fund 124,910 5.2%Subtotal, Intramural Research 1,381 412,517 17.3%
Research Management & Support :Research Management & Support FTEs : 689 86,713 3.6%NIH Management Fund 14,075 0.6%Subtotal, RMS 689 -TOO,788 4.2%
Cancer Prevention and Control :Cancer Control Grants 70,014 2.9%Cancer Control Contracts 110,420 4.6%Inhouse FTEs : 183 49,420 2.1%NIH Management Fund 2,064 0.1%Subtotal, Prevention and Control 183 231,918 9.7%
Construction 3,000 0.1%Total NCI FTEs : 100.0%
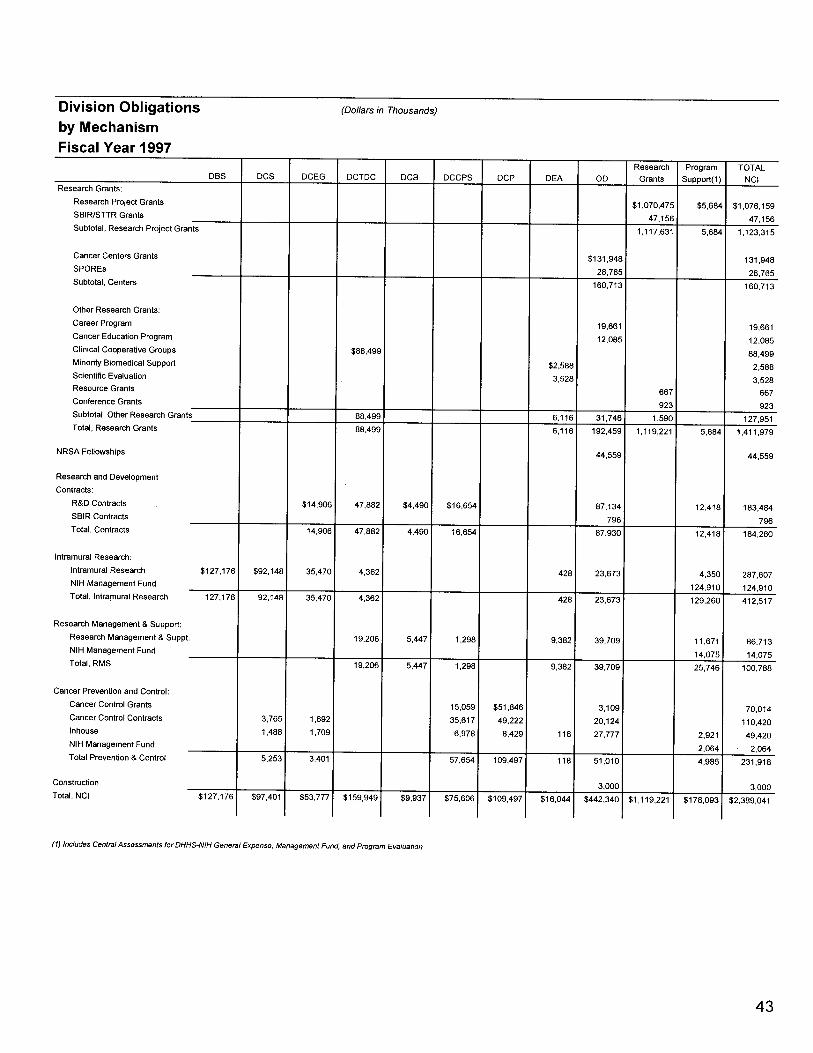
Division Obligationsby MechanismFiscal Year 1997
(Dollars in Thousands)
(1) Includes CentralAssessments for DHHS-NIH GeneralExpense, Management Fund, andProgram Evaluation
Research Program TOTALCBS DCS DCEG DCTDC DCB DCCPS DCP DEA OD Grants Support(1) NCI
Research Grants:Research Project Grants $1,070,475 $5,684 $1,076,159SBIR/STTR Grants 47,156 47,156Subtotal, Research Project Grants 1,117,631 5,684 1,123,315
Cancer Centers Grants $131,948 131,948SPOREs 28,765 28,765Subtotal, Centers 160,713 160,713
Other Research Grants :Career Program 19,661 19,661Cancer Education Program 12,085 12,085Clinical Cooperative Groups $88,499 88,499Minority Biomedical Support $2,588 2,588Scientific Evaluation 3,528 3,528Resource Grants 667 667Conference Grants 923 923Subtotal, Other Research Grants 88,499 6,116 31,746 1,590 127,951Total, Research Grants 88,499 6,116 192,459 1,119,221 5,684 1,411,979
NRSA Fellowships 44,559 44,559
Research and Development
Contracts :
R&D Contracts $14,906 47,882 $4,490 $16,654 87,134 12,418 183,484SBIR Contracts 796 796Total, Contracts 14,906 47,882 4,490 16,654 87,930 12,418 184,280
Intramural Research :Intramural Research $127,176 $92,148 35,470 4,362 428 23,673 4,350 287,607NIH Management Fund 124,910 124,910Total, Intramural Research 127,176 92,148 35,470 4,362 428 23,673 129,260 412,517
Research Management & Support :
Research Management & Suppt . 19,206 5,447 1,298 9,382 39,709 11,671 86,713NIH Management Fund 14,075 14,075Total, RMS 19,206 5,447 1,298 9,382 39,709 25,746 100,788
Cancer Prevention and Control :
Cancer Control Grants 15,059 $51,846 3,109 70,014Cancer Control Contracts 3,765 1,692 35,617 49,222 20,124 110,420Inhouse 1,488 1,709 6,978 8,429 118 27,777 2,921 49,420NIH Management Fund 2,064 2,064Total Prevention & Control 5,253 3,401 57,654 109,497 118 51,010 4,985 231,918
Construction 3,000 3,000rotal, NCI $127,176 $97,401 $53,777 $159,949 $9,937 $75,606 $109,497 $16,044 $442,340 $1,119,221 $178,093 $2,389,041
NIH Management Fund
(Dollars in Thousands)
Reimbursement
Fiscal Year 1997
07
1111
ID
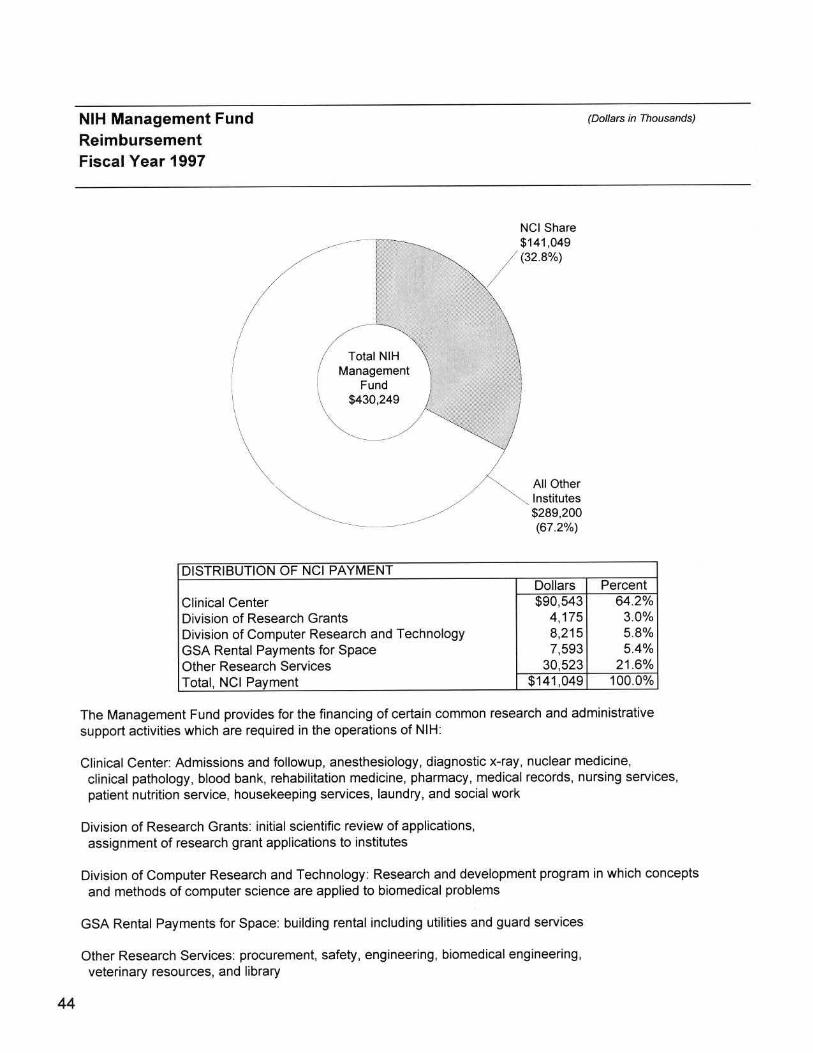
ManagementTotal NIH
Fund$430,249
NCI Share$141,049(32.8%)
All OtherInstitutes$289,200(67 .2%)
The Management Fund provides for the financing of certain common research and administrativesupport activities which are required in the operations of NIH:
Clinical Center: Admissions and followup, anesthesiology, diagnostic x-ray, nuclear medicine,clinical pathology, blood bank, rehabilitation medicine, pharmacy, medical records, nursing services,
Arm
patient nutrition service, housekeeping services, laundry, and social work
Division of Research Grants : initial scientific review of applications,assignment of research grant applications to institutes
DISTRIBUTION OF NCI PAYMENTDollars Percent
Clinical Center $90,543 64.2%Division of Research Grants 4,175 3.0%Division of Computer Research and Technology 8,215 5.8%GSA Rental Payments for Space 7,593 5.4%Other Research Services 30,523 21 .6%Total, NCI Payment $141,049 100.0%1
Division of Computer Research and Technology : Research and development program in which conceptsand methods of computer science are applied to biomedical problems
GSA Rental Payments for Space. building rental including utilities and guard services oilOther Research Services . procurement, safety, engineering, biomedical engineering,veterinary resources, and library
01
Special Sources of Funds
(Dollars in Thousands)
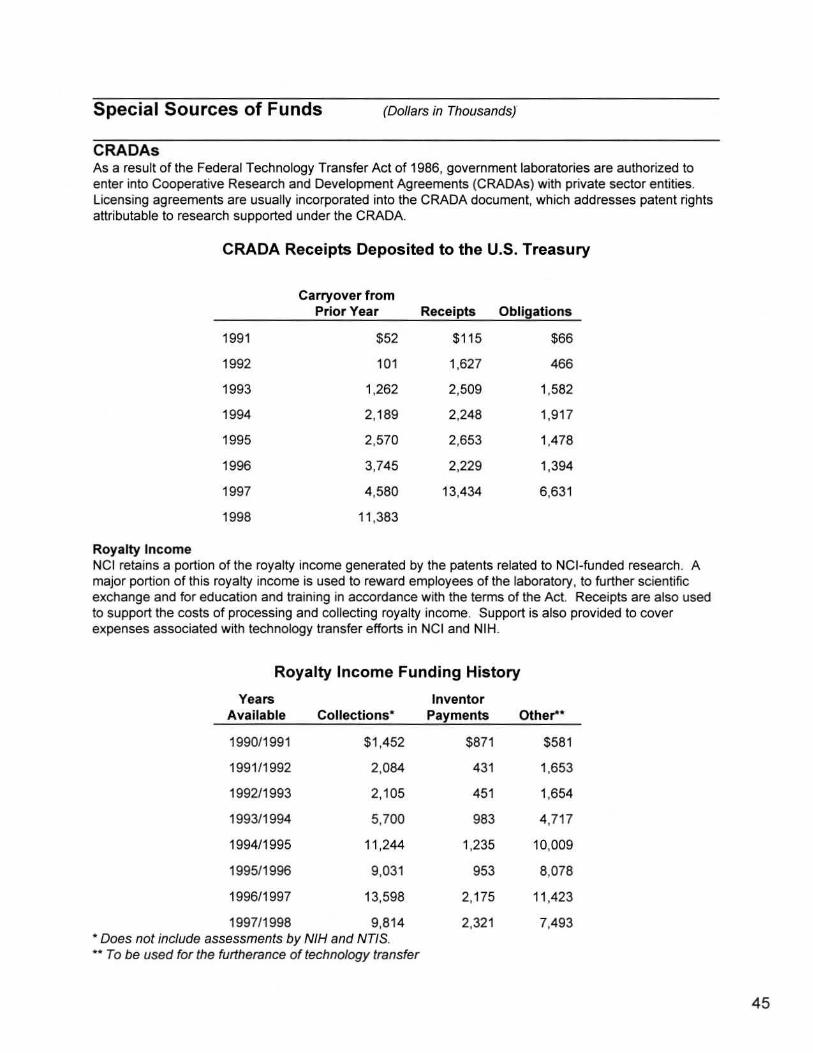
CRADAsAs a result of the Federal Technology Transfer Act of 1986, government laboratories are authorized toenter into Cooperative Research and Development Agreements (CRADs) with private sector entities .Licensing agreements are usually incorporated into the CRADA document, which addresses patent rightsattributable to research supported under the CRADA.
CRADA Receipts Deposited to the U.S . Treasury
Royalty IncomeNCI retains a portion of the royalty income generated by the patents related to NCI-funded research . Amajor portion of this royalty income is used to reward employees of the laboratory, to further scientificexchange and for education and training in accordance with the terms of the Act. Receipts are also usedto support the costs of processing and collecting royalty income . Support is also provided to coverexpenses associated with technology transfer efforts in NCI and NIH .
Royalty Income Funding History
*Does not include assessments by NIH and NTIS .** To be used for the furtherance of technology transfer
Carryover fromPrior Year Receipts Obligations
1991 $52 $115 $66
1992 101 1,627 466
1993 1,262 2,509 1,582
1994 2,189 2,248 1,917
1995 2,570 2,653 1,478
1996 3,745 2,229 1,394
1997 4,580 13,434 6,631
1998 11,383
YearsAvailable Collections*
InventorPayments Other**
1990/1991 $1,452 $871 $581
1991/1992 2,084 431 1,653
1992/1993 2,105 451 1,654
1993/1994 5,700 983 4,717
1994/1995 11,244 1,235 10,009
1995/1996 9,031 953 8,078
1996/1997 13,598 2,175 11,423
1997/1998 9,814 2,321 7,493
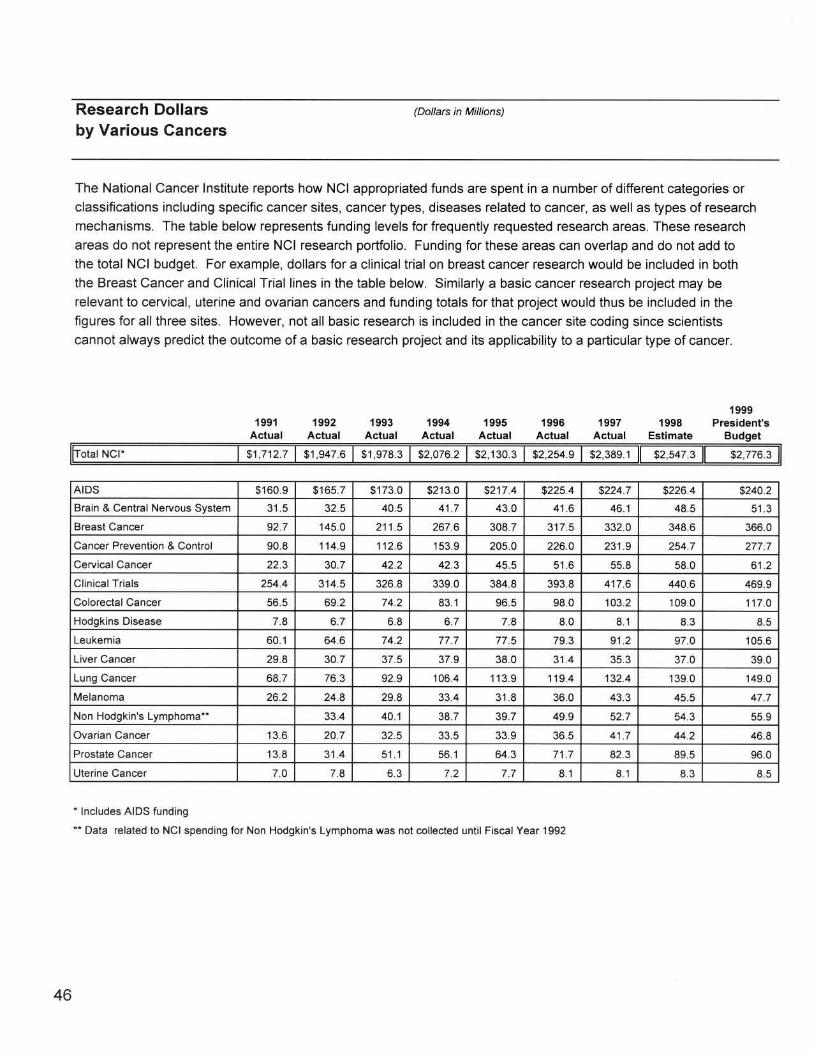
Research Dollarsby Various Cancers
The National Cancer Institute reports how NCI appropriated funds are spent in a number of different categories orclassifications including specific cancer sites, cancer types, diseases related to cancer, as well as types of researchmechanisms . The table below represents funding levels for frequently requested research areas. These researchareas do not represent the entire NCI research portfolio . Funding for these areas can overlap and do not add tothe total NCI budget . For example, dollars for a clinical trial on breast cancer research would be included in boththe Breast Cancer and Clinical Trial lines in the table below. Similarly a basic cancer research project may berelevant to cervical, uterine and ovarian cancers and funding totals for that project would thus be included in thefigures for all three sites. However, not all basic research is included in the cancer site coding since scientistscannot always predict the outcome of a basic research project and its applicability to a particular type of cancer.
* Includes AIDS funding
(Dollars in Millions)
19991991 1992 1993 1994 1995 1996 1997 1998 President's
Actual Actual Actual Actual Actual Actual Actual Estimate Budget
** Data related to NCI spending for Non Hodgkin's Lymphoma was not collected until Fiscal Year 1992
AIDS $160.9 $165.7 $173 .0 $213.0 $217.4 $225 .4 $224.7 $226.4 $240.2
Brain & Central Nervous System 31 .5 32 .5 40 .5 41 .7 43 .0 41 .6 46.1 48.5 51 .3
Breast Cancer 92.7 145.0 211 .5 267.6 308.7 317.5 332.0 348.6 366.0
Cancer Prevention & Control 90.8 114.9 112.6 153.9 205.0 226.0 231 .9 254.7 277.7
Cervical Cancer 22.3 30 .7 42 .2 42 .3 45 .5 51 .6 55 .8 58 .0 61 .2
Clinical Trials 254.4 314.5 326.8 339.0 384.8 393.8 417.6 440.6 469.9
Colorectal Cancer 56.5 69 .2 74 .2 83 .1 96 .5 98 .0 103.2 109.0 117.0
Hodgkins Disease 7.8 6.7 6.8 6.7 7.8 8 .0 8.1 8.3 8.5
Leukemia 60.1 64 .6 74 .2 77 .7 77 .5 79 .3 91 .2 97 .0 105.6
Liver Cancer 29.8 30.7 37 .5 37 .9 38 .0 31 .4 35 .3 37 .0 39 .0
Lung Cancer 68.7 76.3 92 .9 106.4 113.9 119.4 132.4 139.0 149.0
Melanoma 26.2 24.8 29 .8 33 .4 31 .8 36 .0 43 .3 45.5 47 .7
Non Hodgkin's Lymphoma** 33.4 40 .1 38 .7 39 .7 49 .9 52 .7 54.3 55 .9
Ovarian Cancer 13.6 20 .7 32 .5 33 .5 33 .9 36 .5 41 .7 44 .2 46 .8
Prostate Cancer 13.8 31 .4 51 .1 56 .1 64 .3 71 .7 82 .3 89 .5 96 .0
Uterine Cancer 1 7.0 7.8 6.3 7.2 7.7 8.1 8.1 8.3 8.5


Grant and Contract
(Dollars in Thousands)
Awards by StateFiscal Year 1997
State
AlabamaAlaskaArizonaArkansasCaliforniaColoradoConnecticutDelawareDistrict of ColumbiaFloridaGeorgiaHawaiiIdahoIllinoisIndianaIowaKansasKentuckyLouisianaMaineMarylandMassachusettsMichiganMinnesotaMississippiMissouriMontanaNebraskaNevadaNew HampshireNew JerseyNew MexicoNew YorkNorth CarolinaNorth DakotaOhioOklahomaOregonPennsylvaniaRhode IslandSouth CarolinaSouth DakotaTennesseeTexasUtahVermontVirginiaWashingtonWest VirginiaWisconsinWyomingTotalGuamPuerto RicoTotal
Excludes Manpower Development and Foreign grants
Grants Contracts Total NCINumber Amount Number Amount Amount
46 $17,221 12 $7,374 $24,5952 118 118
45 19,314 1 205 19,51913 2,305 2,305
557 221,284 20 93,419 314,70362 17,343 4 2,678 20,02161 18,728 2 1,984 20,7125 917 917
66 25,144 7 2,117 27,26155 12,081 1 1,218 13,29941 11,187 3 1,739 12,92615 7,023 3 2,294 9,317
139 46,635 12 2,210 48,84534 8,385 2 1,309 9,69419 5,302 2 3,372 8,67415 4,480 5 2,346 6,82626 4,567 3 871 5,43819 3,784 3,7849 3,036 1 850 3,886
142 49,038 75 85,811 134,849401 157,491 5 6,104 163,595152 45,106 7 10,079 55,18597 32,577 7 5,974 38,5514 518 51873 16,577 7 3,806 20,3833 492 492
23 8,535 8,5354 705 70533 9,661 1 76 9,73759 18,140 3 1,924 20,06415 4,128 3 4,311 8,439
433 164,598 12 8,383 172,981152 52,272 11 7,204 59,4762 343 343
141 37,382 12 3,952 41,3347 1,160 1 576 1,73633 8,100 8,100
323 121,343 8 6,203 127,54635 9,342 1 819 10,16125 4,290 1 1,013 5,3033 548 548
96 28,877 1 115 28,992297 98,338 8 3,388 101,72633 10,086 3 3,495 13,58112 4,384 1 166 4,55064 21,812 4 1,906 23,718
163 75,638 4 6,853 82,4916 1,163 2 1,568 2,73187 25,307 4 3,605 28,912
4,147 1,436,805 259 291,317 1,728,12269 69
1 254 2544,148 $1,437,128 259 $291,317 $1,728,445
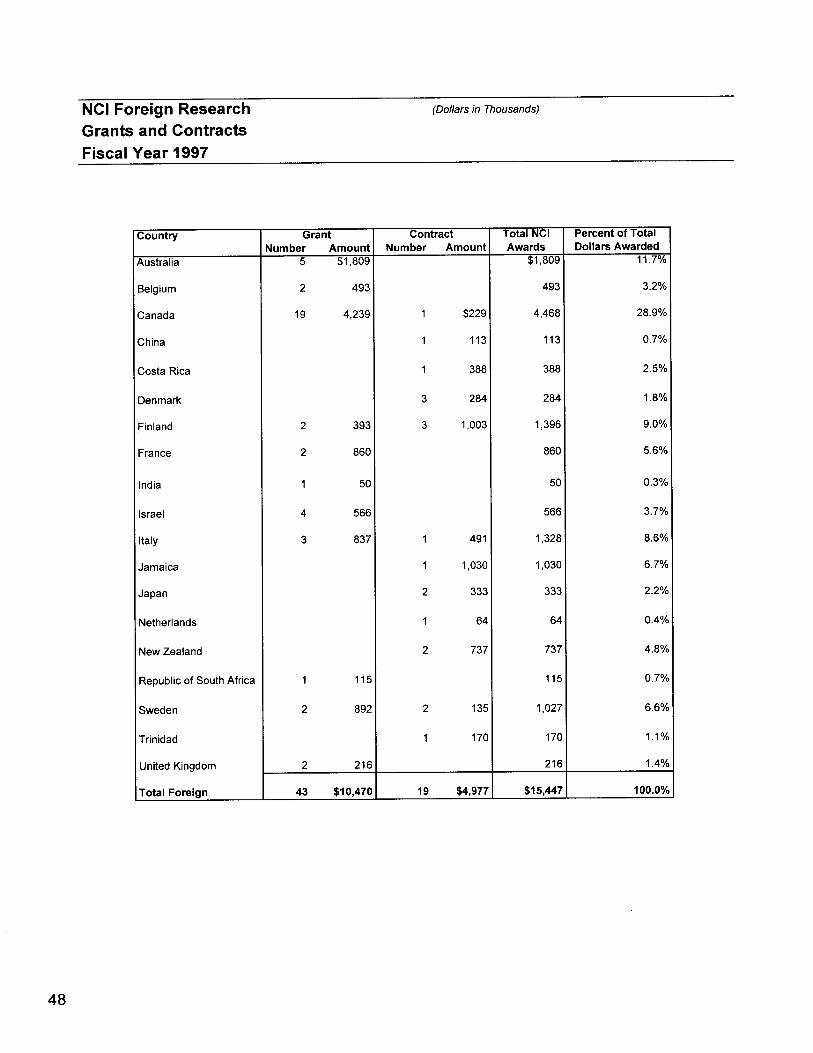
NCI Foreign ResearchGrants and ContractsFiscal Year 1997
(Dollars in Thousands)
Country GrantNumber Amount
ContractNumber Amount
Total NCIAwards
Percent of TotalDollars Awarded
Australia 5 $1,809 $1,809 11 .7%
Belgium 2 493 493 3.2%
Canada 19 4,239 1 $229 4,468 28.9%
China 1 113 113 0.7%
Costa Rica 1 388 388 2 .5%
Denmark 3 284 284 1 .8%
Finland 2 393 3 1,003 1,396 9.0%
France 2 860 860 5.6%
India 1 50 50 0.3%
Israel 4 566 566 3.7%
Italy 3 837 1 491 1,328 8.6%
Jamaica 1 1,030 1,030 6.7%
Japan 2 333 333 2.2%
Netherlands 1 64 64 0.4%
New Zealand 2 737 737 4.8%
Republic of South Africa 1 115 115 0.7%
Sweden 2 892 2 135 1,027 6.6%
Trinidad 1 170 170 1 .1
United Kingdom 2 216 216 1 .4%
Total Foreign 43 $10,470 19 $4,977 $15,447 100.0%

Institutions Receiving More than$10,000,000 in NCI SupportFiscal Year 1997
(Dollars in Thousands)
State Institution Grants Contracts Construction Total NCIAlabama University of Alabama System $15,476 $2,795 $18,271Arizona University of Arizona 17,481 205 17,686California University of California System 91,054 5,063 96,117
City of Hope 10,973 10,973Science Applications International Corporation 75,512 75,512Stanford University 28,444 28,444University of Southern California 22,968 3,145 26,113Burnham Intsitute 11,971 11,971Scripps Research Institute 11,774 11,774
Colorado University of Colorado System 9,293 845 10,138Connecticut Yale University 18,578 429 19,007District ofColumbia Georgetown University 14,087 986 15,073Illinois University ofChicago 20,555 20,555
Northwestern University 11,854 11,854Maryland Johns Hopkins University 39,140 2,531 41,671Massachusetts Dana-Farber Cancer Institute 30,663 30,663
Harvard University 27,001 27,001Massachusetts General Hospital 20,046 20,046Massachusetts Institute of Technology 10,867 10,867Brigham and Women's Hospital 16,484 16,484
Michigan University of Michigan at Ann Arbor 26,746 26,746Wayne State University 11,595 3,207 14,802
Minnesota University of Minnesota 17,427 3,471 20,898Mayo Foundation 13,804 1,385 15,189
Missouri Washington University 13,847 1,561 15,408New York Memorial Sloan-Kettering 39,143 1,581 40,724
Cold Spring Harbor Laboratory 10,660 10,660Columbia University 19,135 573 19,708New York University 16,236 16,236Yeshiva University 15,572 15,572American Health Foundation 9,719 461 10,180New York State Dept . of Health 13,814 2,759 16,573
North Carolina University of North Carolina System 24,816 1,744 26,560Duke University 25,122 895 26,017Organon Teknika Corporation 29 19,965 19,994
Ohio Case Western Reserve University 17,013 1,736 18,749Ohio State University 12,030 757 12,787
Pennsylvania University of Pittsburgh 21,122 2,743 23,865University of Pennsylvania 27,430 27,430Fox Chase Cancer Center 24,673 1,225 $460 26,358Thomas Jefferson University 15,143 15,143Allegheny Health . Education and Research 13,178 13,178
Tennessee St. Jude Children's Research Hospital 14,677 14,677Vanderbilt University 12,103 12,103
Texas University of Texas System 71,408 3,181 74,589Baylor College of Medicine 11,631 136 11,767Cancer Therapy and Research Center 14,439 14,439
Utah Utah State Higher Education System 10,249 3,495 13,744Washington Fred Hutchinson Cancer Research Center 53,755 4,423 950 59,128
University of Washington 14,774 1,175 15,949Wi sconsin University of Wisconsin System 22,494 645 23,139
Total I $1,042,493 $148,6291 $1,4101 $1 192 532

Cancer Centersby State (P30 Core Grants)Fiscal Year 1997StateAlabamaArizonaCalifornia
ColoradoConnecticutDistrict of ColumbiaHawaiiIllinois
IndianaMaineMarylandMassachusetts
Michigan
MinnesotaNebraskaNew HampshireNew JerseyNew York
North Carolina
Ohio
OregonPennsylvania
Tennessee
Texas
UtahVermontVirginia
WashingtonWisconsin
Grantee Institution Type AwardedUniversity of Alabama at Birmingham Comprehensive $4,009,902University ofArizona Comprehensive 1,665,980Beckman Research Institute/City of Hope Clinical 1,973,721Burnham Institute Lab/Basic 1,405,784Salk Institute for Biological Sciences Lab/Basic 1,995,638University of California at Los Angeles Comprehensive 3,163,166University of California at San Diego Clinical 1,455,100University of California, Irvine Clinical Cancer Center Clinical 1,580,614University of Southern California Comprehensive 3,823,014University of Colorado Health Sciences Center Clinical 2,466,647Yale University Comprehensive 1,712,172Georgetown University Comprehensive 2,480,944University of Hawaii at Manoa Clinical 779,345Northwestern University Clinical 1,465,988University of Chicago Clinical 2,334,995Purdue University West Lafayette Lab/Basic 671,019Jackson Laboratory Lab/Basic 1,724,913Johns Hopkins University Comprehensive 4,017,858Dana-Farber Cancer Institute Comprehensive 3,326,816Massachusetts Institute of Technology Lab/Basic 1,272,880University of Michigan at Ann Arbor Comprehensive 2,841,353Barbara Ann Karmanos Cancer Institute/Wayne State University Comprehensive 855,975Mayo Foundation Clinical 2,339,440University of Nebraska Medical Center Lab/Basic 1,083,756Dartmouth College Comprehensive 1,761,984Robert Wood Johnson Medical School Clinical 1,118,853Cold Spring Harbor Laboratory Lab/Basic 2,701,460Columbia University New York Comprehensive 3,334,849Kaplan Cancer Center/NYU Clinical 2,998,218Roswell Park Memorial Institute Comprehensive 1,965,743Memorial Sloan-Kettering Comprehensive 5,883,836University of Rochester Clinical 1,760,991American Health Foundation Lab/Basic 2,918,453Albert Einstein College of Medicine/Yeshiva University Clinical 3,588,047Duke University Comprehensive 3,988,595University of North Carolina Chapel Hill Comprehensive 2,578,741Wake Forest University/Bowman Gray Sch . of Medicine Comprehensive 1,719,782Case Western Reserve University Clinical 1,700,190Ohio State University Comprehensive 2,138,191Oregon Health Sciences University Clinical 941,642Fox Chase Cancer Center Comprehensive 6,235,053Thomas Jefferson University Clinical 1,208,970University of Pennsylvania Comprehensive 3,342,397University of Pittsburgh Comprehensive 2,170,451Wistar Institute of Anatomy and Biology Lab/Basic 2,038,664St . Jude Children's Research Hospital Clinical 3,584,417Vanderbilt University Clinical 1,160,300Cancer Therapy and Research Center Clinical 1,333,478M .D . Anderson Cancer Center/Univ . of Texas Comprehensive 2,502,586Huntsman Cancer Institute/University of Utah Clinical 1,418,011University ofVermont Comprehensive 647,514University of Virginia Clinical 1,064,976Medical College of VirginiaNCU Clinical 824,237Fred Hutchinson Cancer Research Center Comprehensive 5,109,710University ofWisconsin Madison Comprehensive 5,751,023Total P30s 55 129,938,382Planning Grants T 810,000NCI Co-funded Awards with other NIH Institutes 1,200,566Total Cancer Centers $131,948,948
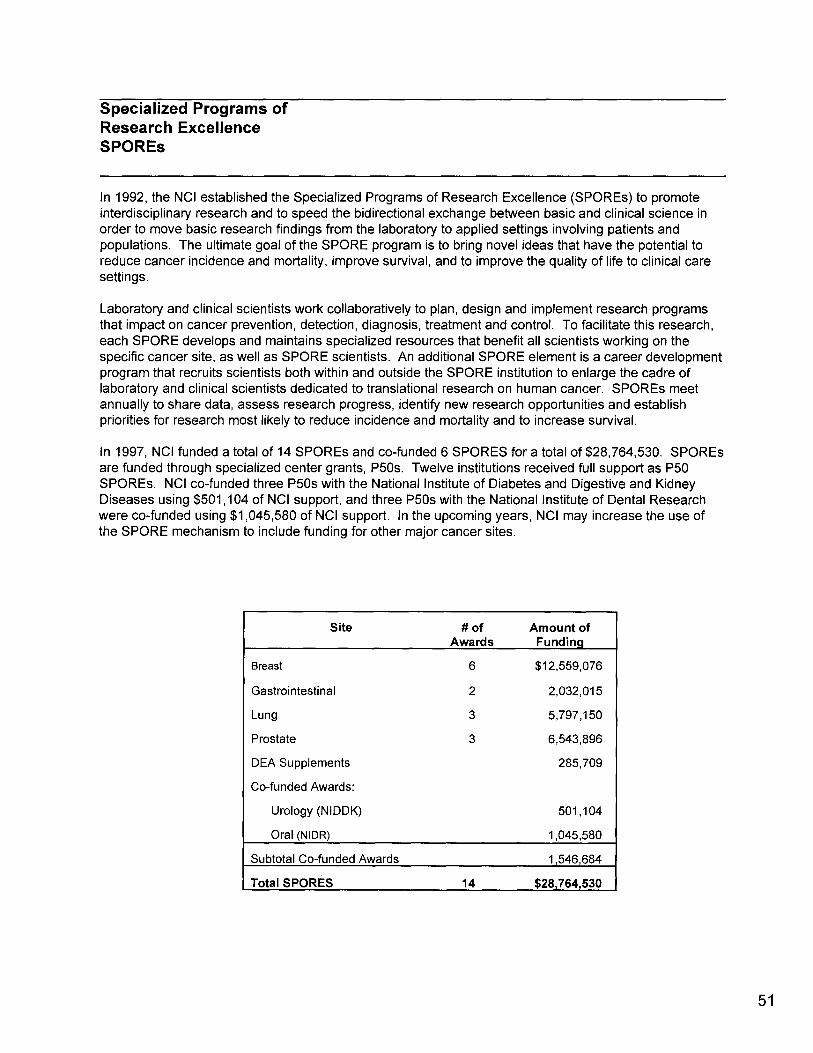
Specialized Programs ofResearch ExcellenceSPOREs
In 1992, the NCI established the Specialized Programs of Research Excellence (SPOREs) to promoteinterdisciplinary research and to speed the bidirectional exchange between basic and clinical science inorder to move basic research findings from the laboratory to applied settings involving patients andpopulations. The ultimate goal of the SPORE program is to bring novel ideas that have the potential toreduce cancer incidence and mortality, improve survival, and to improve the quality of life to clinical caresettings .
Laboratory and clinical scientists work collaboratively to plan, design and implement research programsthat impact on cancer prevention, detection, diagnosis, treatment and control. To facilitate this research,each SPORE develops and maintains specialized resources that benefit all scientists working on thespecific cancer site, as well as SPORE scientists . An additional SPORE element is a career developmentprogram that recruits scientists both within and outside the SPORE institution to enlarge the cadre oflaboratory and clinical scientists dedicated to translational research on human cancer. SPOREs meetannually to share data, assess research progress, identify new research opportunities and establishpriorities for research most likely to reduce incidence and mortality and to increase survival .
In 1997, NCI funded a total of 14 SPOREs and co-funded 6 SPORES for a total of $28,764,530. SPOREsare funded through specialized center grants, P50s . Twelve institutions received full support as P50SPOREs. NCI co-funded three P50s with the National Institute of Diabetes and Digestive and KidneyDiseases using $501,104 of NCI support, and three P50s with the National Institute of Dental Researchwere co-funded using $1,045,580 of NCI support. In the upcoming years, NCI may increase the use ofthe SPORE mechanism to include funding for other major cancer sites.
Site # of Amount ofAwards Funding
Breast 6 $12,559,076
Gastrointestinal 2 2,032,015
Lung 3 5,797,150
Prostate 3 6,543,896
DEA Supplements 285,709
Co-funded Awards :
Urology (NIDDK) 501,104
Oral (NIDR) 1,045,580
Subtotal Co-funded Awards 1,546,684
Total SPORES 14 $28,764,530
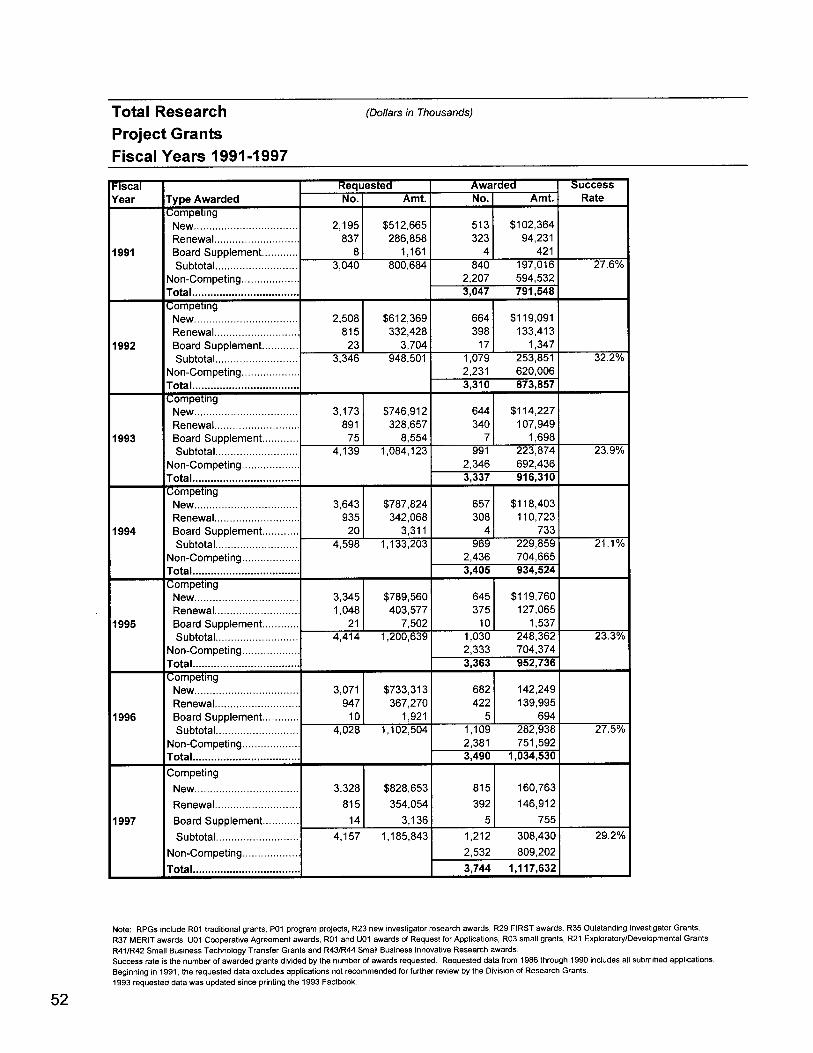
Total Research
(Dollars in Thousands)
Project GrantsFiscal Years 1991-1997
Note: RPGs include R01 traditional grants, P01 program projects, R23 new investigator research awards, R29 FIRST awards, R35 Outstanding Investigator Grants,
R37 MERIT awards, U01 Cooperative Agreement awards, R01 and U01 awards of RequestforApplications, R03 small grants, R21 Exploratory/Developmental Grants
R41/R42 Small Business Technology Transfer Grants and R43/R44 Small Business Innovative Research awards .
Success rate is the number of awarded grants divided by the number of awards requested . Requested data from 1986 through 1990 includes all submitted applications.
Beginning in 1991, the requested data excludes applications not recommended for further review by the Division of Research Grants .
1993 requested data was updated since printing the 1993 Factbook.
Fiscal Requested ware successYear Type Awarded No . Amt. No . Amt. Rate
CompetingNew. . . . . . . . . . . . . . . . . . . . . . . . . . . . . . . . . . 2,195 $512,665 513 $102,364Renewal. . . . . . . . . . . . . . . . . . . . . . . . . . . . 837 286,858 323 94,231
1991 Board Supplement . . . . . . . . . . . . 8 1,161 4 421Subtotal . . . . . . . . . . . . . . . . . . . . . . . . . . . 3,040 800,684 840 197,016 27.6%
Non-Competing . . . . . . . . . . . . . . . . . . . 2,207 594,532Total. . . . . . . . . . . . . . . . . . . . . . . . . . . . . . . . . . . 3,047 791,548CompetingNew. . . . . . . . . . . . . . . . . . . . . . . . . . . . . . . . . . 2,508 $612,369 664 $119,091Renewal. . . . . . . . . . . . . . . . . . . . . . . . . . . . 815 332,428 398 133,413
1992 Board Supplement . . . . . . . . . . . . 23 3,704 17 1,347Subtotal . . . . . . . . . . . . . . . . . . . . . . . . . . . 3,346 948,501 1,079 253,851 32.2%
Non-Competing . . . . . . . . . . . . . . . . . . . 2,231 620,006Total. . . . . . . . . . . . . . . . . . . . . . . . . .. . . . . . . . . 3,310 873,857CompetingNew. . . . . . . . . . . . . . . . . . . . . . . . . . . . . . . . . . 3,173 $746,912 644 $114,227Renewal. . . . . . . . . . . . . . . . . . . . . . . . . . . . 891 328,657 340 107,949
1993 Board Supplement. . . . . . . . . . . . 75 8,554 7 1,698Subtotal . . . . . . . . . . . . . . . . . . . . . . . . . . . 4,139 1,084,123 991 223,874 23.9%
Non-Competing . . . . . . . . . . . . . . . . . . . 2,346 692,436Total. . . . . . . . . . . . .. . . . . . . . . . . . . . . . . . . . . . 3,337 916,310CompetingNew. . . . . . . . . . . . . . . . . . . . . . . . . . . . . . . . . . 3,643 $787,824 657 $118,403Renewal. . . . . . . . . . . . . . . . . . . . . . . . . . . . 935 342,068 308 110,723
1994 Board Supplement. . . . . . . . . . . . 20 3,311 4 733Subtotal . . . . . . . . . . . . . . . . . . . . . . . . . . . 4,598 1,133,203 969 229,859 21 .1%
Non-Competing . . . . . . . . . . . . . . . . . . . 2,436 704,665Total. . . . . . . . . . . . . . . . . . . . . . . . . . . . . . . . . . . 3,405 934,524CompetingNew. . . . . . . . . . . . . . . . . . . . . . . . . . . . . . . . . . 3,345 $789,560 645 $119,760Renewal. . . . . . . . . . . . . . . . . . . . . . . . . . . . 1,048 403,577 375 127,065
1995 Board Supplement . . . . . . . . . . . . 21 7,502 10 1,537Subtotal . . . . . . . . . . . . . . . . . . . . . . . . . . . 4,414 1,200,639 1,030 248,362 23.3%
Non-Competing . . . . . . . . . . . . . . . . . . . 2,333 704,374Total. . . . . . . . . . . . . . . . . . . . . . . . . . . . . . .. . . . 3,363 952,736CompetingNew. . . . . . . . . . . . . . . . . . . . . . . . . . . . . . . . . . 3,071 $733,313 682 142,249Renewal. . . . . . . . . . . . . . . . . . . . . . . . . . . . 947 367,270 422 139,995
1996 Board Supplement . . . . . . . . . . . . 10 1,921 5 694Subtotal . . . . . . . . . . . . . . . . . . . . . . . . . . . 4,028 1,102,504 1,109 282,938 27.5%
Non-Competing . . . . . . . . . . . . . . . . . . . 2,381 751,592Total. . . . . . . . . . . . . . . . . .. . . . . . . . . . . . . . . . . 3,490 1,034,530CompetingNew. . . . . . . . . . . . . . . . . . . . . . . . . . . . . . . . . . 3,328 $828,653 815 160,763Renewal. . . . . . . . . . . . . . . . . . . . . . . . . . . . 815 354,054 392 146,912
1997 Board Supplement . . . . . . . . . . . . 14 3,136 5 755Subtotal . . . . . . . . . . . . . . . . . . . . . . . . . . . 4,157 1,185,843 1,212 308,430 29.2%
Non-Competing . . . . . . . . . . . . . . . . . . . 2,532 809,202
I Total . . . . .. . . . . . . . . . . . .. . . . . . . . . . . . . . . . . ~ 3,744 1,117,6321

Research Project GrantsAdjustments from Recommended LevelsFiscal Years 1991-1997
20%
0% ~'_ _~__L1991 1992 1993 1994 1995 1996 1997
Includes Small Business Innovation Research Awards
. Competing
17 Non-Competing
NOTE: Future year (non-competing) approved amounts are reduced by the average percentagereductions applied during the competing grant cycle . The percent reductions shown are takenagainst this adjusted base.
TYPE 1991 1992 1993 1994 1995 1996 1997
Competing
Non-Competing
10 .0%
3.5%
12.0%
0.0%
15.0%
0.0%
12.5%
2.0%
13.0%
0.0%
6.0%
0.0%
11 .0%
0.0%
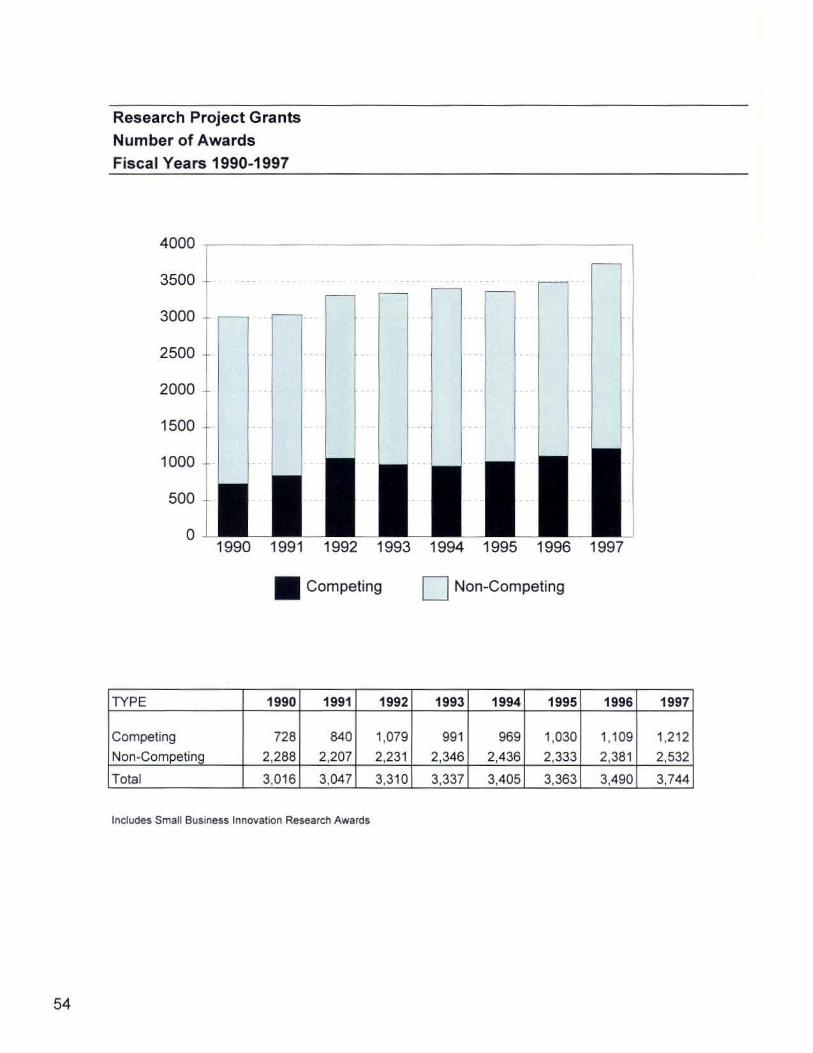
Research Project GrantsNumber of AwardsFiscal Years 1990-1997
4000
1990 1991 1992 1993 1994 1995 1996 1997
Includes Small Business Innovation Research Awards
54
3500 -~
3000 t2500 t2000
1500 -
1000
500 10
. Competing Non-Competing
TYPE 1990 1991 1992 1993 1994 1995 1996 1997
Competing
Non-Competing
728
2,288
840
2,207
1,079
2,231
991
2,346
969
2,436
1,030
2,333
1,109
2,381
1,212
2,532
Total 3,016 3,047 3,310 3,337 3,405 3,363 3,490 3,744
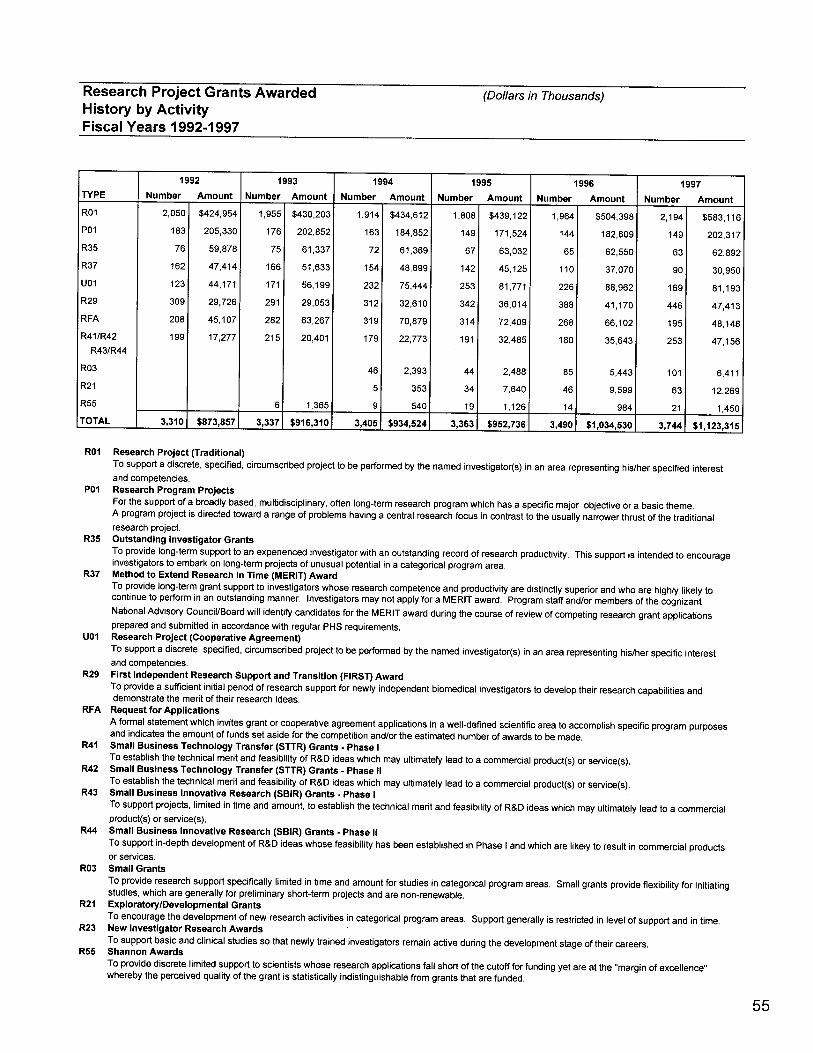
Research Project Grants Awarded
(Dollars in Thousands)History by ActivityFiscal Years 1992-1997
R01
Research Project (Traditional)To support a discrete, specified, circumscribed project to be performed by the named investigator(s) in an area representing his/her specified interestand competencies.
P01
Research Program ProjectsFor the support of a broadly based, multidisciplinary, often long-term research program which has a specific major objective or a basic theme .A program project is directed toward a range of problems having a central research focus in contrast to the usually narrower thrust of the traditionalresearch project.
R35
Outstanding Investigator GrantsTo provide long-term support to an experienced investigator with an outstanding record of research productivity . This support is intended to encourageinvestigators to embark on long-term projects of unusual potential in a categorical program area .
R37
Method to Extend Research in Time (MERIT) AwardTo provide long-term grant support to investigators whose research competence and productivity are distinctly superior and who are highly likely tocontinue to perform in an outstanding manner . Investigators may not apply'for a MERIT award . Program staff and/or members of the cognizantNational Advisory Council/Board will identify candidates for the MERIT award during the course of review of competing research grant applicationsprepared and submitted in accordance with regular PHS requirements .
U01
Research Project (Cooperative Agreement)To support a discrete, specified, circumscribed project to be performed by the named investigator(s) in an area representing his/her specific interestand competencies .
R29
First Independent Research Supportand Transition (FIRST) AwardTo provide a sufficient initial period of research support for newly independent biomedical investigators to develop their research capabilities anddemonstrate the merit of their research ideas .
RFA
Request for ApplicationsA formal statement which invites grant or cooperative agreement applications in a well-defined scientific area to accomplish specific program purposesand indicates the amount of funds set aside for the competition and/or the estimated number of awards to be made .
R41
Small Business Technology Transfer (STTR) Grants - Phase ITo establish the technical merit and feasibility of R&D ideas which may ultimately lead to a commercial product(s) or service(s) .R42
Small Business Technology Transfer (STTR) Grants - Phase 11To establish the technical merit and feasibility of R&D ideas which may ultimately lead to a commercial product(s) or service(s) .R43
Small Business Innovative Research (SBIR) Grants - Phase ITo support projects, limited in time and amount, to establish the technical merit and feasibility of R&D ideas which may ultimately lead to a commercialproduct(s) or service(s) .
R44
Small Business Innovative Research (SBIR) Grants - Phase IITo support in-depth development of R&D ideas whose feasibility has been established in Phase I and which are likely to result in commercial productsor services.
R03
Small GrantsTo provide research support specifically limited in time and amount for studies in categorical program areas . Small grants provide flexibility for initiatingstudies, which are generally for preliminary short-term projects and are non-renewable .
R21
Exploratory/Developmental GrantsTo encourage the development of new research activities in categorical program areas . Support generally is restricted in level of support and in time.R23
New Investigator Research AwardsTo support basic and clinical studies so that newly trained investigators remain active during the development stage of their careers.
R55
Shannon AwardsTo provide discrete limited support to scientists whose research applications fall short of the cutoff for funding yet are at the "margin of excellence"whereby the perceived quality of the grant is statistically indistinguishable from grants that are funded .
TYPE1992
Number Amount1993
Number Amount1994
Number Amount1995
Number Amount1996
Number Amount1997
Number AmountR01 2,050 $424,954 1,955 $430,203 1,914 $434,612 1,808 $439,122 1,964 $504,398 2,194 $583,116P01 183 205,330 176 202,852 163 184,852 149 171,524 144 182,609 149 202,317R35 76 59,878 75 61,337 72 61,369 67 63,032 65 62,550 63 62,892R37 162 47,414 166 51,633 154 48,699 142 45,125 110 37,070 90 30,950U01 123 44,171 171 56,199 232 75,444 253 81,771 226 88,962 169 81,193R29 309 29,726 291 29,053 312 32,610 342 36,014 388 41,170 446 47,413RFA 208 45,107 282 63,267 319 70,879 314 72,409 268 66,102 195 48,148R41/R42 199 17,277 215 20,401 179 22,773 191 32,485 180 35,643 253 47,156
R43/R44R03 46 2,393 44 2,488 85 5,443 101 6,411R21 5 353 34 7,640 46 9,599 63 12,269R55 6 1,365 9 540 19 1,126 14 984 21 1,450TOTAL I 3,310 . $873,8571 3,3371 $916,3101 3,4051 $934,5241 3,363 $952 736 3,4901 $1,034,5301 3,7441 $1,12331 ;

National Research Service AwardsFiscal Years 1990-1997
Number of TraineesIlly2,000
1,500 -
_ .I n
1,000500
rr
56
1990 1991 1992 1993 1994 1995 1996 1997
0 Predoctoral Postdoctoral
TYPE 1990 1991 1992 1993 1994 1995 1996 1997
PredoctoralPostdoctoral
567918
584913
597894
578868
596873
567907
584959
610991
Total 1,485 1,497 1,491 1,446 1,469 1,474 1,543 1,601
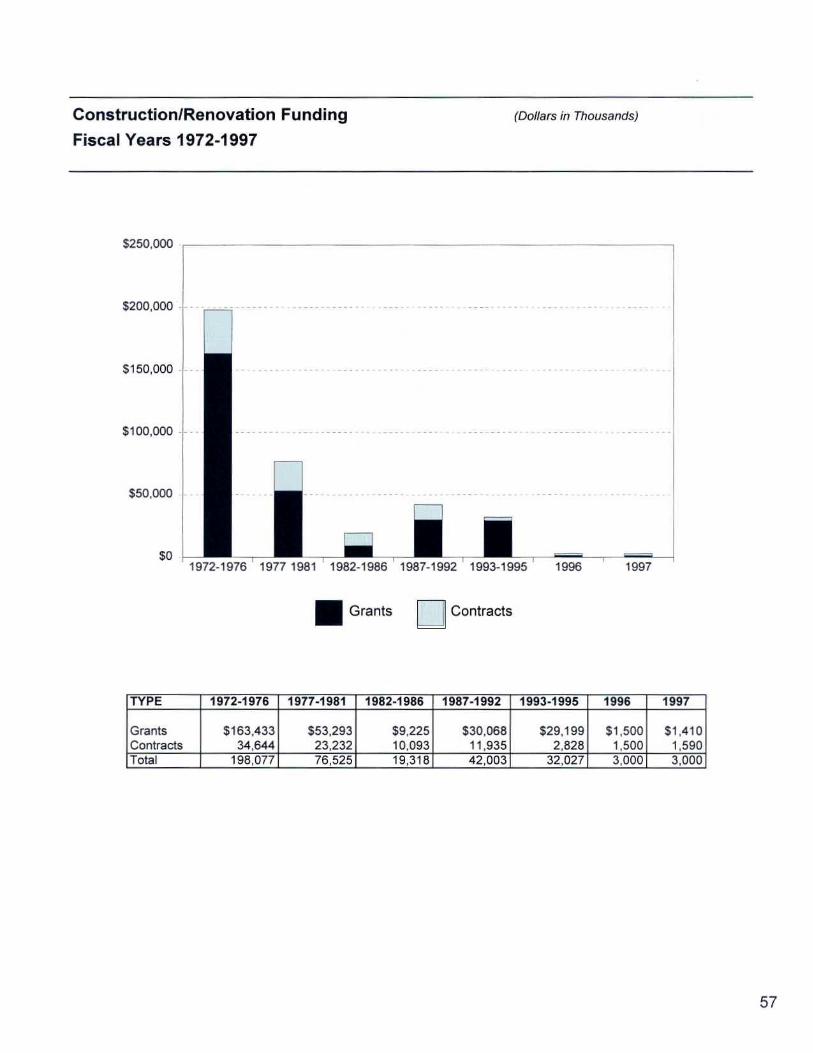
Construction/Renovation Funding
(Dollars in Thousands)
Fiscal Years 1972-1997
$250,000
$200,000 -
1972-1976 1977 1981
1982-1986 1987-1992 1993-1995
1996
1997
. Grants Contracts
TYPE 1972-1976 1977-1981 1982-1986 1987-1992 1993-1995 1996 1997
GrantsContracts
$163,43334,644
$53,29323,232
$9,22510,093
$30,06811,935
$29,1992,828
$1,5001,500
$1,4101,590
Total 198,077 76,525 19,318 42,003 32,027 3,000 3,000

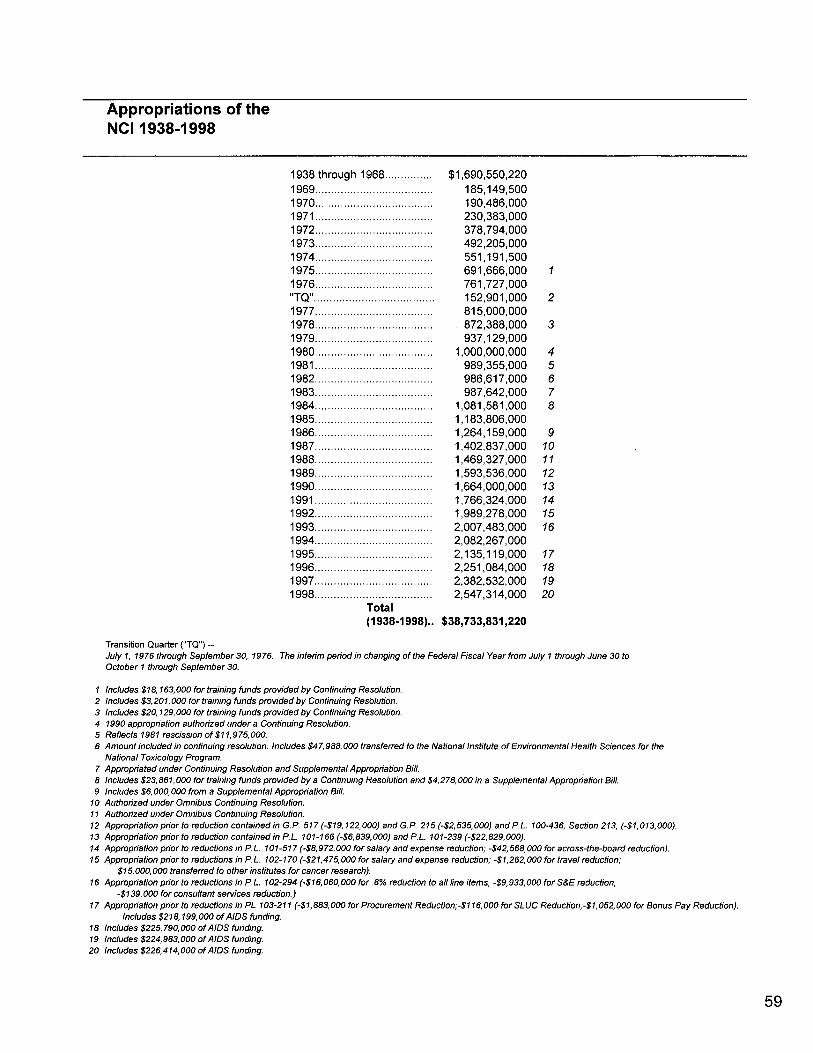
Appropriations of theNCI 1938-1998
1938 through 1968 . . . . . . . . . . . . . . .1969 . . . . . . . . . . . . . . . . . . . . . . . . . . . . . . . . . . . . .1970 . . . . . . . . . . . . . . . . . . . . . . . . . . . . . . . . . . . . .1971 . . . . . . . . . . . . . . . . . . . . . . . . . . . . . . . . . . . . .1972 . . . . . . . . . . . . . . . . . . . . . . . . . . . . . . . . . . . . .1973 . . . . . . . . . . . . . . . . . . . . . . . . . . . . . . . . . . . . .1974 . . . . . . . . . . . . . . . . . . . . . . . . . . . . . . . . . . . . .1975 . . . . . . . . . . . . . . . . . . . . . . . . . . . . . . . . . . . . .1976 . . . . . . . . . . . . . . . . . . . . . . . . . . . . . . . . . . . . ."TQ".......................................1977 . . . . . . . . . . . . . . . . . . . . . . . . . . . . . . . . . . . . .1978 . . . . . . . . . . . . . . . . . . . . . . . . . . . . . . . . . . . . .1979 . . . . . . . . . . . . . . . . . . . . . . . . . . . . . . . . . . . . .1980 . . . . . . . . . . . . . . . . . . . . . . . . . . . . . . . . . . . . .1981 . . . . . . . . . . . . . . . . . . . . . . . . . . . . . . . . . . . . .1982 . . . . . . . . . . . . . . . . . . . . . . . . . . . . . . . . . . . . .1983 . . . . . . . . . . . . . . . . . . . . . . . . . . . . . . . . . . . . .1984 . . . . . . . . . . . . . . . . . . . . . . . . . . . . . . . . . . . . .1985 . . . . . . . . . . . . . . . . . . . . . . . . . . . . . . . . . . . . .1986 . . . . . . . . . . . . . . . . . . . . . . . . . . . . . . . . . . . . .1987 . . . . . . . . . . . . . . . . . . . . . . . . . . . . . . . . . . . . .1988 . . . . . . . . . . . . . . . . . . . . . . . . . . . . . . . . . . . . .1989 . . . . . . . . . . . . . . . . . . . . . . . . . . . . . . . . . . . . .1990 . . . . . . . . . . . . . . . . . . . . . . . . . . . . . . . . . . . . .1991 . . . . . . . . . . . . . . . . . . . . . . . . . . . . . . . . . . . . .1992 . . . . . . . . . . . . . . . . . . . . . . . . . . . . . . . . . . . . .1993 . . . . . . . . . . . . . . . . . . . . . . . . . . . . . . . . . . . . .1994 . . . . . . . . . . . . . . . . . . . . . . . . . . . . . . . . . . . . .1995 . . . . . . . . . . . . . . . . . . . . . . . . . . . . . . . . . . . . .1996 . . . . . . . . . . . . . . . . . . . . . . . . . . . . . . . . . . . . .1997 . . . . . . . . . . . . . . . . . . . . . . . . . . . . . . . . . . . . .1998 . . . . . . . . . . . . . . . . . . . . . . . . . . . . . . . . . . . . .
Total(1938-1998) . .
$1,690,550,220185,149, 500190,486,000230, 383,000378,794,000492,205,000551,191,500691,666,000 1761, 727,000152,901,000 2815, 000,000872,388,000 3937,129,000
1,000,000,000 4989,355,000 5986,617,000 6987,642,000 7
1,081,581,000 81,183,806,0001,264,159,000 91,402,837,000 101,469,327,000 111,593,536,000 121,664,000,000
131,766,324,000 141,989,278,000
152,007,483,000 162,082,267,0002,135,119,000
172,251,084,000 182,382,532,000
192,547,314,000 20
$38,733,831,220
Transition Quarter ("TQ") --July 1, 1976 through September 30, 1976. The interim period in changing of the Federal Fiscal Year from July 1 through June 30 toOctober 1 through September 30.
1 Includes $18,163,000 for training funds provided by Continuing Resolution.2 Includes $3,201, 000 for training funds provided by Continuing Resolution.3 Includes $20,129, 000 for training funds provided by Continuing Resolution .4 1990 appropriation authorized under a Continuing Resolution .5 Reflects 1981 rescission of $11,975,000.6 Amount included in continuing resolution. Includes $47,988,000 transferred to the National Institute of Environmental Health Sciences for the
National Toxicology Program.7 Appropriated under Continuing Resolution and Supplemental Appropriation Bill.8 Includes $23,861, 000 for training funds provided by a Continuing Resolution and $4,278,000 in a Supplemental Appropriation Bill.9 Includes $6, 000, 000 from a Supplemental Appropriation Bill.10 Authorized under Omnibus Continuing Resolution .11 Authorized under Omnibus Continuing Resolution .12 Appropriation prior to reduction contained in G . P. 517 (-$19,122,000) and G . P. 215 (-$2,535,000) and P. L. 100-436, Section 213, (-$1,013,000) .13 Appropriation prior to reduction contained in P.L. 101-166 (-$6,839,000) and P.L . 101-239 (-$22,829,000) .14 Appropriation prior to reductions in P. L. 101-517 (-$8,972,000 for salary and expense reduction; -$42,568, 000 for across-the-board reduction).15 Appropriation prior to reductions in P. L. 102-170 (-$21,475, 000 for salary and expense reduction; -$1,262, 000 for travel reduction;
$15, 000,000 transferred to other institutes for cancer research).16 Appropriation prior to reductions in P. L. 102-294 (-$16,060,000 for . 8% reduction to all line items, -$9,933,000 for S&E reduction,
-$139, 000 for consultant services reduction.)17 Appropriation prior to reductions in PL 103-211 (-$1,883,000 for Procurement Reduction;-$116, 000 for SLUC Reduction; -$1,052,000 forBonus Pay Reduction) .
Includes $218,199, 000 of AIDS funding.18 Includes $225,790,000 ofAIDS funding.19 Includes $224,983,000 ofAIDS funding.20 Includes $226,414,000 ofAIDS funding.

By-Pass Budget RequestsFiscal Years 1973-1999
NOTE : Following the original passage of the National Cancer Act in December, 1971, a provision was included for theDirector of the National Cancer Institute to submit an annual budget request directly to the President; hence it has cometo be called the Bypass Budget . The Budget submitted for 1973 was the initial submission .
FiscalYear Request
1973 . . . . . . . . . . . . . . . . . . . . . . . . . . . . . . . . . . . . . . . . . . . . . . . . . . $550,790,0001974 . . . . . . . . . . . . . . . . . . . . . . . . . . . . . . . . . . . . . . . . . . . . . . . . . . 640,031,0001975 . . . . . . . . . . . . . . . . . . . . . . . . . . . . . . . . . . . . . . . . . . . . . . . . . . 750,000,0001976 . . . . . . . . . . . . . . . . . . . . . . . . . . . . . . . . . . . . . . . . . . . . . . . . . . 898,500,0001977 . . . . . . . . . . . . . . . . . . . . . . . . . . . . . . . . . . . . . . . . . . . . . . . . . . 948,000,0001978 . . . . . . . . . . . . . . . . . . . . . . . . . . . . . . . . . . . . . . . . . . . . . . . . . . 955,000, 0001979 . . . . . . . . . . . . . . . . . . . . . . . . . . . . . . . . . . . . . . . . . . . . . . . . . . 1,036,000,0001980 . . . . . . . . . . . . . . . . . . . . . . . . . . . . . . . . . . . . . . . . . . . . . . . . . . 1, 055,000, 0001981 . . . . . . . . . . . . . . . . . . . . . . . . . . . . . . . . . . . . . . . . . . . . . . . . . . 1,170,000,0001982 . . . . . . . . . . . . . . . . . . . . . . . . . . . . . . . . . . . . . . . . . . . . . . . . . . 1,192,000,0001983 . . . . . . . . . . . . . . . . . . . . . . . . . . . . . . . . . . . . . . . . . . . . . . . . . . 1,197,000, 0001984 . . . . . . . . . . . . . . . . . . . . . . . . . . . . . . . . . . . . . . . . . . . . . . . . . . 1,074,000,0001985 . . . . . . . . . . . . . . . . . . . . . . . . . . . . . . . . . . . . . . . . . . . . . . . . . . 1,189,000,0001986 . . . . . . . . . . . . . . . . . . . . . . . . . . . . . . . . . . . . . . . . . . . . . . . . . . 1,460,000,0001987 . . . . . . . . . . . . . . . . . . . . . . . . . . . . . . . . . . . . . . . . . . . . . . . . . . 1,570,000,0001988 . . . . . . . . . . . . . . . . . . . . . . . . . . . . . . . . . . . . . . . . . . . . . . . . . . 1,700,000,0001989 . . . . . . . . . . . . . . . . . . . . . . . . . . . . . . . . . . . . . . . . . . . . . . . . . . 2, 080,000, 0001990 . . . . . . . . . . . . . . . . . . . . . . . . . . . . . . . . . . . . . . . . . . . . . . . . . . 2,195,000,0001991 . . . . . . . . . . . . . . . . . . . . . . . . . . . . . . . . . . . . . . . . . . . . . . . . . . 2,410,000,0001992 . . . . . . . . . . . . . . . . . . . . . . . . . . . . . . . . . . . . . . . . . . . . . . . . . . 2,612,000,0001993 . . . . . . . . . . . . . . . . . . . . . . . . . . . . . . . . . . . . . . . . . . . . . . . . . . 2,775,000,0001994 . . . . . . . . . . . . . . . . . . . . . . . . . . . . . . . . . . . . . . . . . . . . . . . . . . 3,200,000,0001995 . . . . . . . . . . . . . . . . . . . . . . . . . . . . . . . . . . . . . . . . . . . . . . . . . . 3,600,000, 0001996 . . . . . . . . . . . . . . . . . . . . . . . . . . . . . . . . . . . . . . . . . . . . . . . . . . 3,640,000,0001997 . . . . . . . . . . . . . . . . . . . . . . . . . . . . . . . . . . . . . . . . . . . . . . . . . . 2, 977,000, 0001998 . . . . . . . . . . . . . . . . . . . . . . . . . . . . . . . . . . . . . . . . . . . . . . . . . . 2,702,500,0001999 . . . . . . . . . . . . . . . . . . . . . . . . . . . . . . . . . . . . . . . . . . . . . . . . . . 3,191,000,000

Comparison of Dollars,
(Dollars in Thousands)
Positions and SpaceFiscal Years 1974-1997
1974
1975
1976
1977
1978
1979
1980
1981
1982
1983
1984
1985
1986
1987
1988
1989
1990
1991
1992
1993
1994
1995
1996
1997
* Includes $10,130 which was transferred to NCI from other NIH Institutes to partially fund several grantsresponding to a NIH Construction RFA.
** Does not include space at the Frederick Cancer Research and Development Center .*** Source NIH TDCS 866
Dollars
Obligations($000's)
PercentIncrease OverPrior Year
$581,149
699,320 20.3%
760,751 8.8%
814,957 7.1
872,369 7.0%
936,969 7.4%
998,047 6.5%
989,338 -0.9%
986,564 -0.3%
986,811 0.0%
1,081,460 9.6%
1,177, 853 8 .9%
1,210,284 2 .8%
1,402,790 15 .9%
1,468,435 4.7%
1,570,342 6.9%
1,644,330 * 4.7%
1,712,669 4.2%
1,947,571 13.7%
1,978,340 15.5%
2,076,218 6.6%
2,129,369 7.6%
2,254,940 8.6%
2,389,041-- 1 2 .2%
Positions
ActualFull-TimePermanentEmployees
PercentIncreaseOver Prior
Year
1,805
1,849 2.4%
1,955 5.7%
1,986 1 .6%
1,969 -0.9%
1,973 0.2%
1,837 -6.9%
1,815 -1 .2%
1,703 -6.2%
1,731 1 .6%
1,698 -1 .9%
1,596 -6.0%
1,573 -1 .4%
1,642 4.4%
1,708 4 .0%
1,701 -0.4%
1,837 8 .0%
1,921 4.6%
2,042 *** 6.3%
1,951 *** -4.5%
1,840 *** -5.7%
1,767 *** -4.0%
1,841 *** 4.2%
1,915 *** 4.0%
Space**
AllocatedSpace(SquareFeet)
PercentIncreaseOver Prior
Year
381,436
382,485 0 .3%
387,324 1 .3%
428,285 10 .6%
491,725 14 .8%
493,156 0 .3%
467,730 -5 .2%
472,633 1 .0%
477,782 1 .1
484,093 1 .3%
466,890 -3.6%
466,890 0.0%
465,790 -0.2%
465,790 0.0%
458,556 -1 .6%
483,778 5.5%
489,604 1 .2%
499,396 2.0%
477,067 -4.5%
493,186 3.4%
472,545 -4.2%
510,466 8.0%
544,613 6.7%
590,890 8.5%
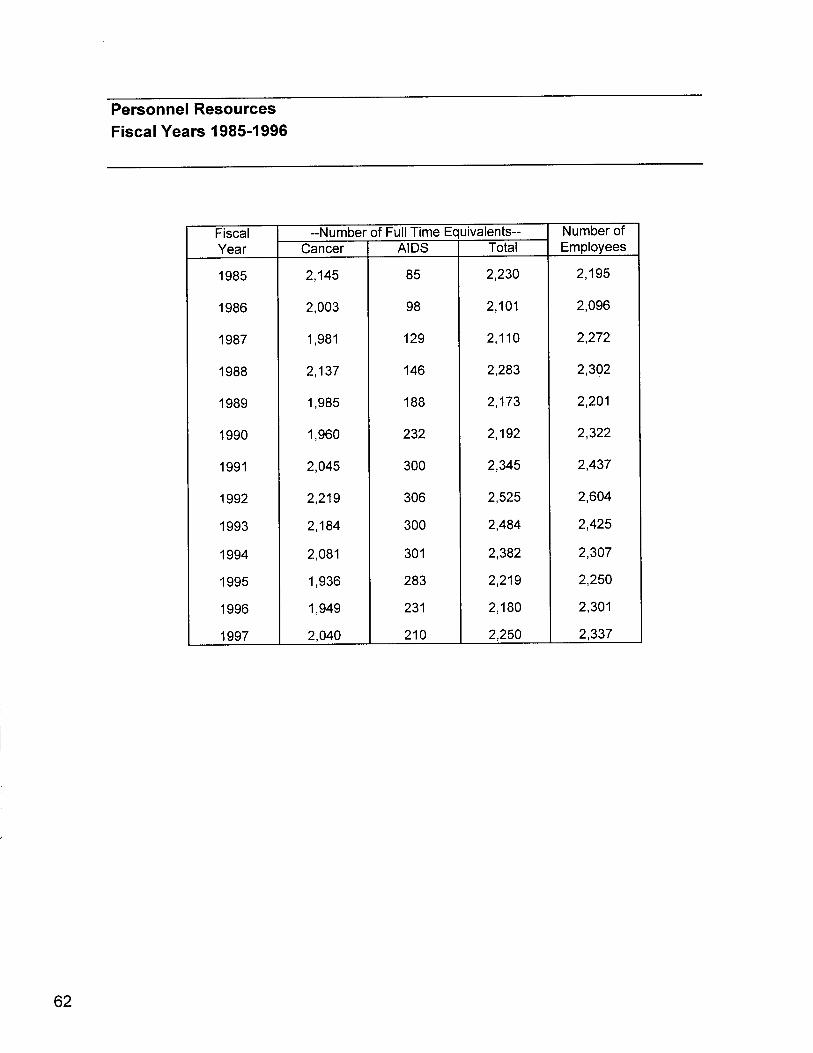
Personnel ResourcesFiscal Years 1985-1996
Fiscal --Number of Full Time Equivalents-- Number ofYear Cancer AIDS Total Employees
1985 2,145 85 2,230 2,195
1986 2,003 98 2,101 2,096
1987 1,981 129 2,110 2,272
1988 2,137 146 2,283 2,302
1989 1,985 188 2,173 2,201
1990 1,960 232 2,192 2,322
1991 2,045 300 2,345 2,437
1992 2,219 306 2,525 2,604
1993 2,184 300 2,484 2,425
1994 2,081 301 2,382 2,307
1995 1,936 283 2,219 2,250
1996 1,949 231 2,180 2,301
1997 2,040 210 2,250 2,337

"Supports common services shared within the NIH; in AIDS the Management Fundisused principally for support costs associated with NCI's activities at the NIH Clinical Center.
Acquired Immunodeficiency Syndrome (AIDS)Funding by ActivityFiscal Year 1997
(Dollars in Thousands)
By Mechanism :Research Project Grants $93,149Cancer Center Grants 7,506Career Grants 304Clin . Ed . Grants 149Cooperative Clinical Groups 314Other Grants 66Training Grants, Indiv . 30Training Grants, Instit . 1,638R&D Contracts 47,995Intramural Research 62,762Research Management and Support 10,820
Total, NCI $224,733
By Research Thrust:Cancer Causation $94,886Detection and Diagnosis Research 1,930Treatment Research 69,515Cancer Biology 48,777Subtotal Research 215,108
Cancer Center Support 7,505Research Manpower Development 2,120
Total, NCI $224,733
By Division :Division of Basic Science $19,812Division of Clinical Science 13,317Division of Cancer Epidemiology & Genetics 11,072Division of Cancer Treatment, Diagnosis & Centers 27,886Frederick Cancer Research and Development Center 31,538Office of the Director/Division of Extramural Activities 8,434'Research Project Grants 93,149Conference Grants 66NIH Management Fund' 19,459
Total, NCI $224,733

Acquired Immunodeficiency Syndrome (AIDS)
(Dollars in Thousands)
Funding HistoryFiscal Years 1983-1997
Note :Effective 1992 funding for the Alcohol, Drug Abuse, and Mental Health Administration (ADAMHA) was included
FiscalYear
NCIAmount
NIHAmount
% NCITo NIH
1983 $9,790 $21,668 45%
1984 16,627 44,121 38%
1985 26,874 63,737 42% Pro
1986 45,050 134,667 33%
1987 63,755 260,907 24%
1988 89,944 473,285 19%
1989 122,247 627,076 19%
1990 150,304 740,509 20%
1991 160,869 799,821 20%
1992 165,668 1,047,294 16%
1993 173,029 1,073,957 16%
1994 212,868 1,298,996 16%
1995 217,430 1,333,600 16%
1996 225,360 1,411,860 16%
1997 224,733 1,501,073 15%

National Cancer InstituteObligations and OutlaysFiscal Year 1990-1997
$2,500
$2,000 -
$1,500
$1,000 --
$500 ~1990 1991
}1992
1993
1994
19951996
1997
Obligations :
Orders placed, grants awarded, contract increments funded, salaries earned and similar financialtransactions which legally utilize or reserve an appropriation for expenditure .
Outlays:
Payments made from appropriations .
(Dollars in Millions)
Total Outlays
I Current Year Obligations
$ in Millions 1990 1991 1992 1993 1994 1995 1996 1997Prior Year OutlaysCurrent Year Outlays
$885759
$856739
$831961
$1,099843
$1,108901
$1,0161,000
$1,0071,003
$1,283865
Total Outlays 1,644 1,595 1,792 1,942 2,009 2,016 2,010 2,148Current Year Obligations 1,570 1,644 1,713 1,948 2,076 2,129 2,255 2,389

ONALCER
TITUTENIH Publication No . 98.512May 1998 T149


