nd:yag laser welding of aerospace grade ze41a magnesium alloy: modeling and experimental...
TRANSCRIPT
A
vpopposm©
K
1
trpsiwmcbdb[ijo
0d
Available online at www.sciencedirect.com
Materials Chemistry and Physics 109 (2008) 61–76
Nd:YAG laser welding of aerospace grade ZE41A magnesium alloy:Modeling and experimental investigations
H. Al-Kazzaz a, M. Medraj a,∗, X. Cao b, M. Jahazi b
a Department of Mechanical Engineering, Concordia University, Montreal, Canadab Aerospace Manufacturing Technology Centre, Institute for Aerospace Research, National Research Council Canada, Montreal, Canada
Received 2 July 2007; received in revised form 25 October 2007; accepted 31 October 2007
bstract
Keyhole formation as well as the geometry of weld profiles during Nd:YAG laser welding of ZE41A-T5 were studied through combiningarious models and concepts. The results indicated that weld width and fusion area decrease with increasing welding speed. In the case of partiallyenetrated welding, penetration depth decreases with increasing welding speed. Also, the model predicted that excessive decrease in laser powerr increase in defocusing distance decreases surface power density, thereby changing the welding mode from fully penetrated keyhole, to partiallyenetrated keyhole, and then to the conduction mode. The predicted conditions for keyhole stability and welding modes as well as the weldrofiles for various processing conditions were validated by some selected welding experiments. These experiments included studying the effects
f welding speed, laser power, joint gap and laser defocusing on the weld geometry of 2- and 6-mm butt joints or bead-on-plates of ZE41A-T5and castings using a continuous wave 4 kW Nd:YAG laser system and 1.6-mm EZ33A-T5 filler wire. Good agreements were found between theodel predictions and experimental results indicating the validity of the assumptions made for the development of the model. 2007 Elsevier B.V. All rights reserved.ode
pda
bt
P
W
fpth
eywords: Laser welding; Modeling; Mg sand casting; Filler wire; Keyhole m
. Introduction
Laser welding is in general a keyhole-mode fusion weldingechnique that provides line-heating source through the mate-ial thickness [1,2]. Compared with conventional fusion weldingrocesses, laser welding produces higher penetration depth in aingle pass [2]. The keyhole can be described as a vapor cap-llary tube surrounded by a molten metal [3] and is formedhen the laser power absorbed by the metal is greater than theaterial specific intensity threshold [3,4]. This means that the
ritical intensity limit for keyhole formation must be overcomey the intensity of the laser beam. The presence of such con-itions results in the creation of a moving keyhole surroundedy a molten metal due to the absorption of incident laser beam5]. Because of the high welding speed [3], the molten metal
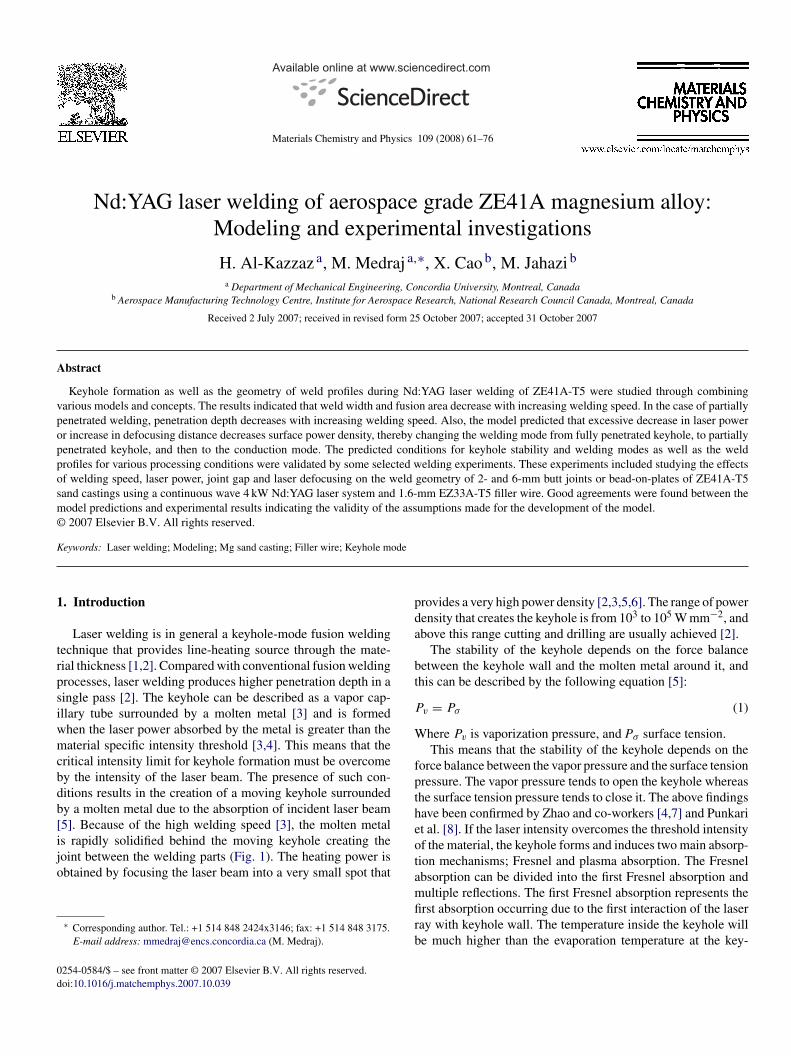
s rapidly solidified behind the moving keyhole creating theoint between the welding parts (Fig. 1). The heating power isbtained by focusing the laser beam into a very small spot that∗ Corresponding author. Tel.: +1 514 848 2424x3146; fax: +1 514 848 3175.E-mail address: [email protected] (M. Medraj).
eotamfirb
254-0584/$ – see front matter © 2007 Elsevier B.V. All rights reserved.oi:10.1016/j.matchemphys.2007.10.039
rovides a very high power density [2,3,5,6]. The range of powerensity that creates the keyhole is from 103 to 105 W mm−2, andbove this range cutting and drilling are usually achieved [2].
The stability of the keyhole depends on the force balanceetween the keyhole wall and the molten metal around it, andhis can be described by the following equation [5]:
v = Pσ (1)
here Pv is vaporization pressure, and Pσ surface tension.This means that the stability of the keyhole depends on the
orce balance between the vapor pressure and the surface tensionressure. The vapor pressure tends to open the keyhole whereashe surface tension pressure tends to close it. The above findingsave been confirmed by Zhao and co-workers [4,7] and Punkarit al. [8]. If the laser intensity overcomes the threshold intensityf the material, the keyhole forms and induces two main absorp-ion mechanisms; Fresnel and plasma absorption. The Fresnelbsorption can be divided into the first Fresnel absorption and
ultiple reflections. The first Fresnel absorption represents therst absorption occurring due to the first interaction of the laseray with keyhole wall. The temperature inside the keyhole wille much higher than the evaporation temperature at the key-
62 H. Al-Kazzaz et al. / Materials Chemistr
habw
piccnwttbdrllwotoottttcbcv
shmmTtp[b
itphc
mothtlailraumtswb
2
2
(ifTjla
4totsftA(0s
dwoobtlo
Fig. 1. Laser welding in the keyhole mode.
ole wall which leads to the formation of ionized gases whichbsorb energy from the reflected laser rays. The energy balanceetween these effects and the heat loss through the keyhole wallill determine the keyhole profile.A useful method to describe the keyhole profile in a plane
arallel to welding direction for the front and rear walls dur-ng CO2 laser welding of steel was proposed by Kaplan [9]. Aonical shape was assumed for the keyhole for the purpose ofalculating the multiple reflections of the laser ray. Also, onlyormal incidence absorption (ray perpendicular to the keyholeall) during multiple reflections was considered in the calcula-
ions. The plasma absorption was estimated using the value ofhe intensity that is left after undergoing multiple reflections andy defining the mean path of the rays as one and half times theepth of a blind keyhole. The intensities obtained for multipleeflections and plasma were both assumed to be for the sameayer at the first Fresnel absorption (the first interaction of theaser ray with the keyhole wall). Lampa et al. [10] modeled theeld pool geometry generated during CO2 blind laser weldingf steel by applying Kaplan’s [9] method. They calculated theop weld width and assumed the bottom weld width to be halff the top weld width for blind keyhole-mode welding basedn the experimental observations. To account for the effect ofhermocapillary (Marangoni) flow, Lampa et al. [10] assumedhat the thermal conductivity on the top is 2.5 times the realhermal conductivity, and they corrected the source strength onhe top of the keyhole accordingly. The penetration depth wasalculated by dividing the total power absorbed by the keyholey the average line source strength, using the artificial thermalonductivity value at the top, and the real thermal conductivityalue at the bottom.
The Fresnel absorption and reflection in the keyhole weretudied by Jin et al. [11]. Glass was used to capture the key-ole profile in a plane parallel to the welding direction, and theultiple reflections and the laser absorption inside the asym-etric keyhole were analyzed using geometrical optics theory.he plasma absorption was avoided in the above study since
he glass GG17 used had very high ionization energy and thuslasma is difficult to form. On the other hand, Solana and Negro12] studied the effect of multiple reflection and plasma on thelind keyhole profile. They developed a numerical model with an
rowbl
y and Physics 109 (2008) 61–76
nitial keyhole having conical shape based on assumed keyholeop radius and penetration depth. It was found that the keyholerofile varies with the Fresnel and plasma absorption values;owever, the energy conservation at the keyhole wall was notonsidered.
In the present work, Kaplan’s [9] and Lampa et al.’s [10]odels were modified and combined with the calculation meth-
ds of the multiple reflection [11] and plasma absorption [12]o calculate the weld geometry profiles. Although the key-ole in the actual process is asymmetric in the plane parallelo welding direction, it is symmetric in the plane perpendicu-ar to welding direction. In addition, the perpendicular planelso reveals the weld geometry profile, and thus it was usedn the calculations of this study. This was achieved by calcu-ating the energy balance at each layer of the keyhole and byegistering the location of each multiple reflection and plasmabsorption in the corresponding layer. A correction factor wassed, instead of artificial thermal conductivity values, to esti-ate the effect of the widening of the weld width due to the
hermocapillary flow. This factor was used to correct the sourcetrengths based on the experimental investigation during laserelding of Mg alloy. Finally, the modeling results were verifiedy experiments.
. Experimental procedures and materials
.1. Materials and equipment
The experimental material was aerospace grade sand cast ZE41A-T5Mg–4.2Zn–1.2Ce–0.7Zr) magnesium alloy. The cast plates had sizes of approx-mately 300 mm × 150 mm × 3–7 mm. The plates were cut into four small piecesor laser welding, each with approximate sizes of 150 mm × 75 mm × 3–7 mm.he magnesium castings were then machined to 2 and 6 mm thicknesses. The
oint faces were also machined along the length for all the specimens. Prior toaser welding the joint faces and their surroundings were carefully cleaned bycetone to remove any contaminations.
The laser welding machine used in this study is a continuous wave (CW)kW HL4006 Nd:YAG (neodymium-doped yttrium aluminum garnet) laser sys-
em equipped with an ABB robotic and magnetic fixture system. A focal lengthf 150 mm and a fiber diameter of 0.6 mm were employed. Helium was usedo shield the top surface and argon for the bottom surface of the workpieces ashown in Fig. 2. The flow rates were 18.9 and 21.2 l min−1 (40 and 45 ft3 h−1)or the top and bottom surfaces, respectively. The shielding gas, He, was directedo the top surface of the workpiece at an angle of 30◦ (with the horizontal) andr was vertically and uniformly directed to the bottom surface. The workpieces
butt joint) were positioned and clamped in a fixture with various gap size fromto 0.6 mm. Defocusing range was between 0 and −4 mm with 0.45 mm focal
pot diameter.A filler wire of EZ33A-T5 (Mg–3Re–2.5Zn–0.6Zr) Mg alloy with 1.6 mm
iameter and 990 mm length was used through a wire feeding mechanism. Laserelding using filler wire is getting more attention since it might solve manyf the problems facing autogenous welding. The most important advantagesf using filler material include improving weld properties, increasing the gapetween the welding parts, and welding thick sections using a multi-passechnique. Compared with other welding techniques laser welding requiresess filler wire per meter of welded seam, underfill and notching effect can bevercome using filler wire, and finally the porosity of the welded joint can be
educed using filler metal [2,3]. The filler wire was positioned at the intersectionf laser beam and top surface of the workpiece. A delivering angle of 60◦as used between the filler and the laser beam axis to reduce the contact areaetween them. During laser welding, the workpieces were stationary while theaser beam scanned at a power value between 2.5 and 4 kW and a speed from 2 to
H. Al-Kazzaz et al. / Materials Chemistry and Physics 109 (2008) 61–76 63
ng co
7
W
olfpTcas
2
tw
3e
wuttllo(ws
3
ttacm
(
I
pb
P
rhadTilrk
ltp
η
Icdasd
η
a
Fig. 2. Experimental setup for laser welding of Mg alloy usi
m min−1. Wire feeding rate was calculated using volume flow rate constancy:
ire feed rate = welding speed × gap area
filler wire area(2)
After welding, a length of approximately 20–30 mm was cut from both endsf each joint to exclude the unstable segments appearing at the start and end ofaser welding. Cross-sectional samples for metallurgical examination were cutrom the weld joints at three locations (start, middle and end). The polished sam-les were then etched in Nital solution (1 ml volume of HNO3 in 100 ml ethanol).he dimensions of the fusion zone (FZ) were measured using an Olympus opti-al microscope equipped with Discover Essential image analyzer software. Theverage values were calculated from the quantitative measurements of the threepecimens (start, middle and end).
.2. Key experiments used for model verification and comparison
Butt joints with 2 and 6 mm thickness, and bead-on-plate welding with 6-mmhickness were used to verify the modeled fusion zone geometries. The samplesere divided into groups as shown in Table 1.
. Calculations of laser efficiencies from thexperimental FZ geometries
In a previous study [13], it was found that the use of fillerire had no significant effect on the FZ area if the wire feed ratesed was calculated from equation 2. In this modeling study,he process of welding using filler wire will be simplified tohe autogenous condition. However, the increase in laser powerosses must be compensated for this setup. For this purpose,aser welding process was specially performed for two joints:ne welded autogenously (sample 29) and one using filler wiresample 30), while the other process parameters (i.e. laser power,elding speed, thickness, focusing parameters) were kept the
ame as summarized in Table 1.
.1. Laser process efficiency
In keyhole-mode laser welding process, the beam passeshrough multiple stages till it is converted to effective power
hat melts the base metal (BM) and produces the weld seams shown in Fig. 3. The keyhole will be created after over-oming the threshold intensity (Is) which is determined byaterial’s vaporization temperature (Tv), thermal conductivityη
e
ntinuous feeding mechanism connected with the laser head.
k) and absorptivity at normal incidence (A) [14]:
s ∝ Tvk
A(3)
Before the laser beam enters the keyhole, part of the laserower (P) will be lost due to reflection (Pref) and the absorptiony plasma plume (Pplume) [10]:
entering the keyhole = P − Pref − Pplume (4)
Before the laser ray reaches the keyhole wall, part of theay will be absorbed by the plasma that exists inside the key-ole. Once the laser ray reaches the keyhole wall, it is partiallybsorbed (first Fresnel absorption). The percentage absorbedepends on the wall angle and material’s physical properties.he reflected intensity will pass through multiple reflections
nside the keyhole. Between each reflection the laser ray willose some of its intensity due to plasma absorption. The laseray finally leaves the keyhole from the top in the case of blindeyholes, or from both the bottom and the top for open keyholes.
The coupling efficiency (ηA) is defined as the portion of theaser power available to the workpiece and is equal to the ratio ofhe absorbed power (Pabs) by the keyhole wall to the total laserower (P) [14]:
A = Pabs
P(5)
t is worth noting that not all the absorbed laser power will beonsumed for the melting but part of it will be lost by heat con-uction through the BM. The thermal efficiency (ηth) is defineds the portion of the absorbed laser power that produced the weldeam and is equal to the ratio of the heat of melting (Pmelting)ivided by the absorbed laser power (Pabs):
th = Pmelting
Pabs(6)
The laser process efficiency (ηP) according to Dausinger etl. [14] can be calculated as:
P = ηAηth (7)
By substituting Eqs. (5) and (6) into Eq. (7), the laser processfficiency (ηP) can be defined as the ratio of the melting power

64 H. Al-Kazzaz et al. / Materials Chemistry and Physics 109 (2008) 61–76
Table 1Key experiments and effective parameters for 2 and 6 mm laser welded plates
Sample # Thickness(mm)
Gap size(mm)
Laser power(kW)
Welding speed(m min−1)
Wire feeding rate(m min−1)
Defocusing(mm)
Welding type
Effect of welding speed on weld geometry1 2 0.4 4 4 2 0 Butt joint (filler wire)2 2 0.4 4 5 2.5 0 Butt joint (filler wire)3 2 0.4 4 6 3 0 Butt joint (filler wire)4 2 0.4 4 7 3.5 0 Butt joint (filler wire)
Effect of gap size on weld geometry5 2 0.1 4 6 0.75 0 Butt joint (filler wire)6 2 0.2 4 6 1.4 0 Butt joint (filler wire)7 2 0.3 4 6 2.1 0 Butt joint (filler wire)8 2 0.4 4 6 3 0 Butt joint (filler wire)9 2 0.5 4 6 3.5 0 Butt joint (filler wire)
10 2 0.6 4 6 4.2 0 Butt joint (filler wire)
Effect of laser power on weld geometry11 2 0.4 2.5 6 3 0 Butt joint (filler wire)12 2 0.4 2.75 6 3 0 Butt joint (filler wire)13 2 0.4 3 6 3 0 Butt joint (filler wire)14 2 0.4 3.5 6 3 0 Butt joint (filler wire)15 2 0.4 3.75 6 3 0 Butt joint (filler wire)16 2 0.4 4 6 3 0 Butt joint (filler wire)
Laser welding of 6 mm plates25 6 – 4 5 – 0 Bead on plate26 6 – 4 5 – −2 Bead on plate27 6 – 4 5 – −4 Bead on plate28 6 0 4 5 0 −4 Butt joint (autogenous)29 6 0 4 3 0 −4 Butt joint (autogenous)30 6 0.2 4 3 2 −4 Butt joint (filler wire)31 6 0.2 4 2 1.35 −4 Butt joint (filler wire)32 6 0.4 4 3 4 −4 Butt joint (filler wire)33 6 0.4 4 2 2.7 −4 Butt joint (filler wire)
Fig. 3. Schematic diagram showing different power sources and losses during keyhole laser welding (based on the concepts presented in Refs. [9,12]).
hemistry and Physics 109 (2008) 61–76 65
t
η
t[
M
wmsPrl
3
pew
T
Waow[
P
dm
k
fcFfmwsb(
P
3
st
pTtriniTmbc
4
ftwtfswi
•
•
•
•
H. Al-Kazzaz et al. / Materials C
o the total laser power:
P = Pmelting
P(8)
The melting ratio (MR) has been defined as the fraction ofotal incident laser power that is used to melt the weld metal8,15]:
R = VAwρ(Cp(Tmp − To) + ΔHf)
P(9)
here Aw is the melted area (i.e. FZ area), ρ density of the moltenetal, Cp specific heat, �Hf latent heat of fusion, V welding
peed, Tmp melting point temperature, To room temperature andincident laser power. Since the numerator represents the power
equired to melt the FZ metal, MR corresponds in reality to theaser process efficiency (ηp).
.2. Laser coupling efficiency
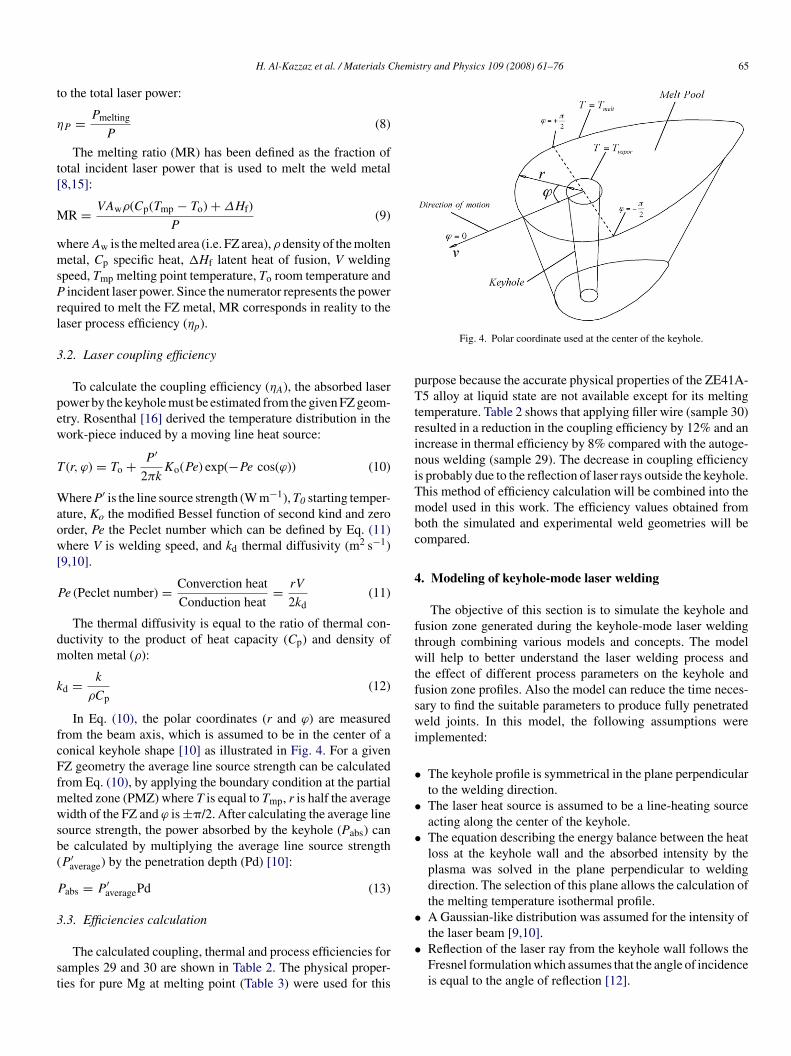
To calculate the coupling efficiency (ηA), the absorbed laserower by the keyhole must be estimated from the given FZ geom-try. Rosenthal [16] derived the temperature distribution in theork-piece induced by a moving line heat source:
(r, ϕ) = To + P ′
2πkKo(Pe) exp(−Pe cos(ϕ)) (10)
here P′ is the line source strength (W m−1), T0 starting temper-ture, Ko the modified Bessel function of second kind and zerorder, Pe the Peclet number which can be defined by Eq. (11)here V is welding speed, and kd thermal diffusivity (m2 s−1)
9,10].
e (Peclet number) = Converction heat
Conduction heat= rV
2kd(11)
The thermal diffusivity is equal to the ratio of thermal con-uctivity to the product of heat capacity (Cp) and density ofolten metal (ρ):
d = k
ρCp(12)
In Eq. (10), the polar coordinates (r and ϕ) are measuredrom the beam axis, which is assumed to be in the center of aonical keyhole shape [10] as illustrated in Fig. 4. For a givenZ geometry the average line source strength can be calculatedrom Eq. (10), by applying the boundary condition at the partialelted zone (PMZ) where T is equal to Tmp, r is half the averageidth of the FZ and ϕ is ±�/2. After calculating the average line
ource strength, the power absorbed by the keyhole (Pabs) cane calculated by multiplying the average line source strengthP ′
average) by the penetration depth (Pd) [10]:
abs = P ′averagePd (13)
.3. Efficiencies calculation
The calculated coupling, thermal and process efficiencies foramples 29 and 30 are shown in Table 2. The physical proper-ies for pure Mg at melting point (Table 3) were used for this
•
Fig. 4. Polar coordinate used at the center of the keyhole.
urpose because the accurate physical properties of the ZE41A-5 alloy at liquid state are not available except for its melting
emperature. Table 2 shows that applying filler wire (sample 30)esulted in a reduction in the coupling efficiency by 12% and anncrease in thermal efficiency by 8% compared with the autoge-ous welding (sample 29). The decrease in coupling efficiencys probably due to the reflection of laser rays outside the keyhole.his method of efficiency calculation will be combined into theodel used in this work. The efficiency values obtained from
oth the simulated and experimental weld geometries will beompared.
. Modeling of keyhole-mode laser welding
The objective of this section is to simulate the keyhole andusion zone generated during the keyhole-mode laser weldinghrough combining various models and concepts. The modelill help to better understand the laser welding process and
he effect of different process parameters on the keyhole andusion zone profiles. Also the model can reduce the time neces-ary to find the suitable parameters to produce fully penetratedeld joints. In this model, the following assumptions were
mplemented:
The keyhole profile is symmetrical in the plane perpendicularto the welding direction.The laser heat source is assumed to be a line-heating sourceacting along the center of the keyhole.The equation describing the energy balance between the heatloss at the keyhole wall and the absorbed intensity by theplasma was solved in the plane perpendicular to weldingdirection. The selection of this plane allows the calculation ofthe melting temperature isothermal profile.A Gaussian-like distribution was assumed for the intensity ofthe laser beam [9,10].
Reflection of the laser ray from the keyhole wall follows theFresnel formulation which assumes that the angle of incidenceis equal to the angle of reflection [12].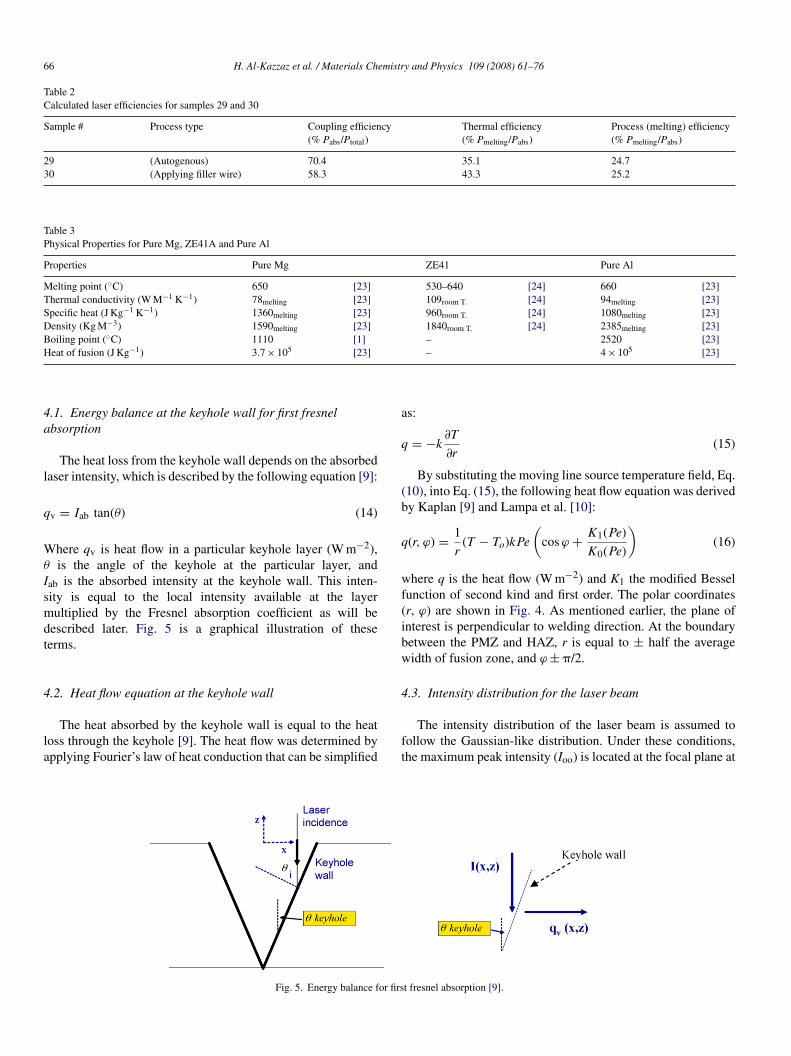
66 H. Al-Kazzaz et al. / Materials Chemistry and Physics 109 (2008) 61–76
Table 2Calculated laser efficiencies for samples 29 and 30
Sample # Process type Coupling efficiency(% Pabs/Ptotal)
Thermal efficiency(% Pmelting/Pabs)
Process (melting) efficiency(% Pmelting/Pabs)
29 (Autogenous) 70.4 35.1 24.730 (Applying filler wire) 58.3 43.3 25.2
Table 3Physical Properties for Pure Mg, ZE41A and Pure Al
Properties Pure Mg ZE41 Pure Al
Melting point (◦C) 650 [23] 530–640 [24] 660 [23]Thermal conductivity (W M−1 K−1) 78melting [23] 109room T. [24] 94melting [23]Specific heat (J Kg−1 K−1) 1360melting [23] 960room T. [24] 1080melting [23]Density (Kg M−3) 1590melting [23] 1840room T. [24] 2385melting [23]Boiling point (◦C) 1110 [1] – 2520 [23]H
4a
l
q
Wθ
Ismdt
4
la
a
q
(b
q
wf(ibw
4
eat of fusion (J Kg−1) 3.7 × 10⁵ [23]
.1. Energy balance at the keyhole wall for first fresnelbsorption
The heat loss from the keyhole wall depends on the absorbedaser intensity, which is described by the following equation [9]:
v = Iab tan(θ) (14)
here qv is heat flow in a particular keyhole layer (W m−2),is the angle of the keyhole at the particular layer, and
ab is the absorbed intensity at the keyhole wall. This inten-ity is equal to the local intensity available at the layerultiplied by the Fresnel absorption coefficient as will be
escribed later. Fig. 5 is a graphical illustration of theseerms.
.2. Heat flow equation at the keyhole wall
The heat absorbed by the keyhole wall is equal to the heatoss through the keyhole [9]. The heat flow was determined bypplying Fourier’s law of heat conduction that can be simplified
ft
Fig. 5. Energy balance for firs
– 4 × 10⁵ [23]
s:
= −k∂T
∂r(15)
By substituting the moving line source temperature field, Eq.10), into Eq. (15), the following heat flow equation was derivedy Kaplan [9] and Lampa et al. [10]:
(r, ϕ) = 1
r(T − To)kPe
(cos ϕ + K1(Pe)
K0(Pe)
)(16)
here q is the heat flow (W m−2) and K1 the modified Besselunction of second kind and first order. The polar coordinatesr, ϕ) are shown in Fig. 4. As mentioned earlier, the plane ofnterest is perpendicular to welding direction. At the boundaryetween the PMZ and HAZ, r is equal to ± half the averageidth of fusion zone, and ϕ ± �/2.
.3. Intensity distribution for the laser beam
The intensity distribution of the laser beam is assumed toollow the Gaussian-like distribution. Under these conditions,he maximum peak intensity (Ioo) is located at the focal plane at
t fresnel absorption [9].

H. Al-Kazzaz et al. / Materials Chemistry and Physics 109 (2008) 61–76 67
zaTt
I
Wre
I
a
r
Wplmb
Z
Wtt2
e
I
W
Fa
4
tdrcp
α
WdiAv0
e
I
4
wasb
Fig. 6. Intensity distribution for the laser beam [17].
ero radius, and the intensity decreases as the laser beam movesway from the focal point in x and z directions as shown in Fig. 6.he intensity of the laser beam at any point can be calculated by
he following equation [9,10,17]:
(x, z) = Ioz exp(−2x2/r2f ) (17)
here Ioz is the peak intensity at any z-plane and rf is the beamadius at any z-plane and can be calculated by the followingquations [9,17]:
oz = Ioo
(ro
rf
)2
(18)
nd,
f = ro
[1 +
(z − z0
zr
)2]1/2
(19)
here Z0 is the defocusing distance (i.e the position of the focallane relative to the plate top surface), and Zr is the Rayleighength where the peak intensity at Zr-plane is equal to half the
aximum intensity at the focal plane (Ioo). Rayleigh length cane calculated by the following equation [9]:
r = ±2ro(f − number) (20)
here f-number is defined as the ratio of a lens focal length tohe diameter of its entrance pupil. In the present investigation,he Rayleigh length for the lens used was measured to be about.33 mm.
The maximum intensity can be computed using the followingquation [9,17]:
2P
oo =r2oπ
(21)
here P is the laser power and ro the beam focal radius.
ae
I
ig. 7. Calculated absorptivity of Al to Nd:YAG laser beam at different incidentngles at room temperature.
.4. Calculation of the fresnel absorption coefficient
The laser ray will experience reflection and absorption byhe keyhole wall. At the liquid–vapor interface the angle of inci-ence of the laser beam is assumed to be equal to the angle ofeflection. The absorption coefficient of the laser ray (αFresnel)an be calculated using Fresnel formula for circular or randomolarized light as follows [12,18,19]:
Fresnel = 1 − 1
2
(1 + (1 − ε cos φ)2
1 + (1 + ε cos φ)2
+ε2 − 2ε cos φ + 2 cos2 φ
ε2 + 2ε cos φ + 2 cos2 φ
)(22)
here φ is the angle of incidence (Fig. 7), and ε is a material-ependant constant. The absorptivity of Mg at perpendicularncidence for Nd:YAG laser is unknown. Therefore, a value forl element (i.e. 4%) at 1.06 �m wavelength was used [14]. Thealue of ε was estimated by substituting (φ = 0, α
perpendicularFresnel =
.04) in Eq. (22) and found to be 0.03.The absorbed intensity can be calculated by the following
quation:
ab = I(x, y)αFresnel (23)
.5. Plasma absorption
The plasma absorption appearing in the keyhole-mode laserelding affects the characteristics of the keyhole by producingwider and less penetrated keyhole [12]. The absorbed inten-
ity in the keyhole by the inverse Bremsstrahlung action wille deposited back to the keyhole wall by radiation [20]. The
bsorbed intensity by plasma can be calculated by the followingquation [9,12]:Plasma = Iincident(1 − exp(−αIBL)) (24)
68 H. Al-Kazzaz et al. / Materials Chemistry and Physics 109 (2008) 61–76
ultip
Witt2wiwptad(wtc
4
fipclbmiamw
tamwptp
t
Wr
4p
wp
S
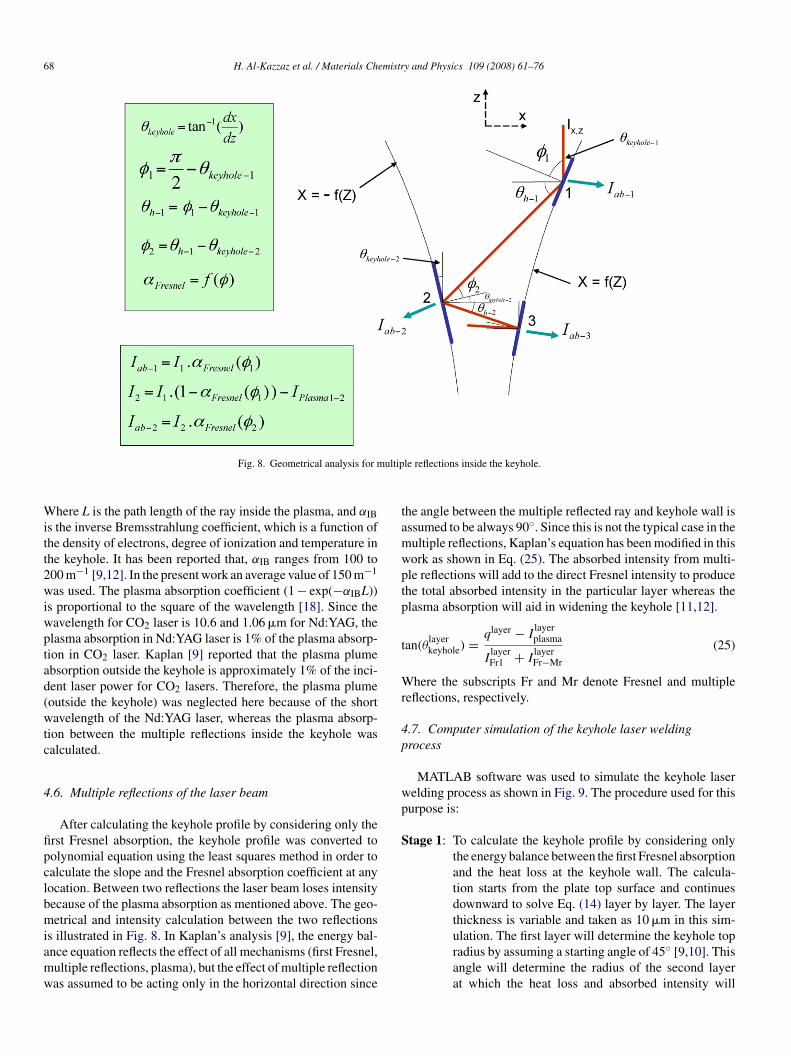
Fig. 8. Geometrical analysis for m
here L is the path length of the ray inside the plasma, and αIBs the inverse Bremsstrahlung coefficient, which is a function ofhe density of electrons, degree of ionization and temperature inhe keyhole. It has been reported that, αIB ranges from 100 to00 m−1 [9,12]. In the present work an average value of 150 m−1
as used. The plasma absorption coefficient (1 − exp(−αIBL))s proportional to the square of the wavelength [18]. Since theavelength for CO2 laser is 10.6 and 1.06 �m for Nd:YAG, thelasma absorption in Nd:YAG laser is 1% of the plasma absorp-ion in CO2 laser. Kaplan [9] reported that the plasma plumebsorption outside the keyhole is approximately 1% of the inci-ent laser power for CO2 lasers. Therefore, the plasma plumeoutside the keyhole) was neglected here because of the shortavelength of the Nd:YAG laser, whereas the plasma absorp-
ion between the multiple reflections inside the keyhole wasalculated.
.6. Multiple reflections of the laser beam
After calculating the keyhole profile by considering only therst Fresnel absorption, the keyhole profile was converted toolynomial equation using the least squares method in order toalculate the slope and the Fresnel absorption coefficient at anyocation. Between two reflections the laser beam loses intensityecause of the plasma absorption as mentioned above. The geo-etrical and intensity calculation between the two reflections
s illustrated in Fig. 8. In Kaplan’s analysis [9], the energy bal-nce equation reflects the effect of all mechanisms (first Fresnel,ultiple reflections, plasma), but the effect of multiple reflectionas assumed to be acting only in the horizontal direction since
le reflections inside the keyhole.
he angle between the multiple reflected ray and keyhole wall isssumed to be always 90◦. Since this is not the typical case in theultiple reflections, Kaplan’s equation has been modified in thisork as shown in Eq. (25). The absorbed intensity from multi-le reflections will add to the direct Fresnel intensity to producehe total absorbed intensity in the particular layer whereas thelasma absorption will aid in widening the keyhole [11,12].
an(θlayerkeyhole) = qlayer − I
layerplasma
IlayerFr1 + I
layerFr−Mr
(25)
here the subscripts Fr and Mr denote Fresnel and multipleeflections, respectively.
.7. Computer simulation of the keyhole laser weldingrocess
MATLAB software was used to simulate the keyhole laserelding process as shown in Fig. 9. The procedure used for thisurpose is:
tage 1: To calculate the keyhole profile by considering onlythe energy balance between the first Fresnel absorptionand the heat loss at the keyhole wall. The calcula-tion starts from the plate top surface and continuesdownward to solve Eq. (14) layer by layer. The layerthickness is variable and taken as 10 �m in this sim-
ulation. The first layer will determine the keyhole topradius by assuming a starting angle of 45◦ [9,10]. Thisangle will determine the radius of the second layerat which the heat loss and absorbed intensity will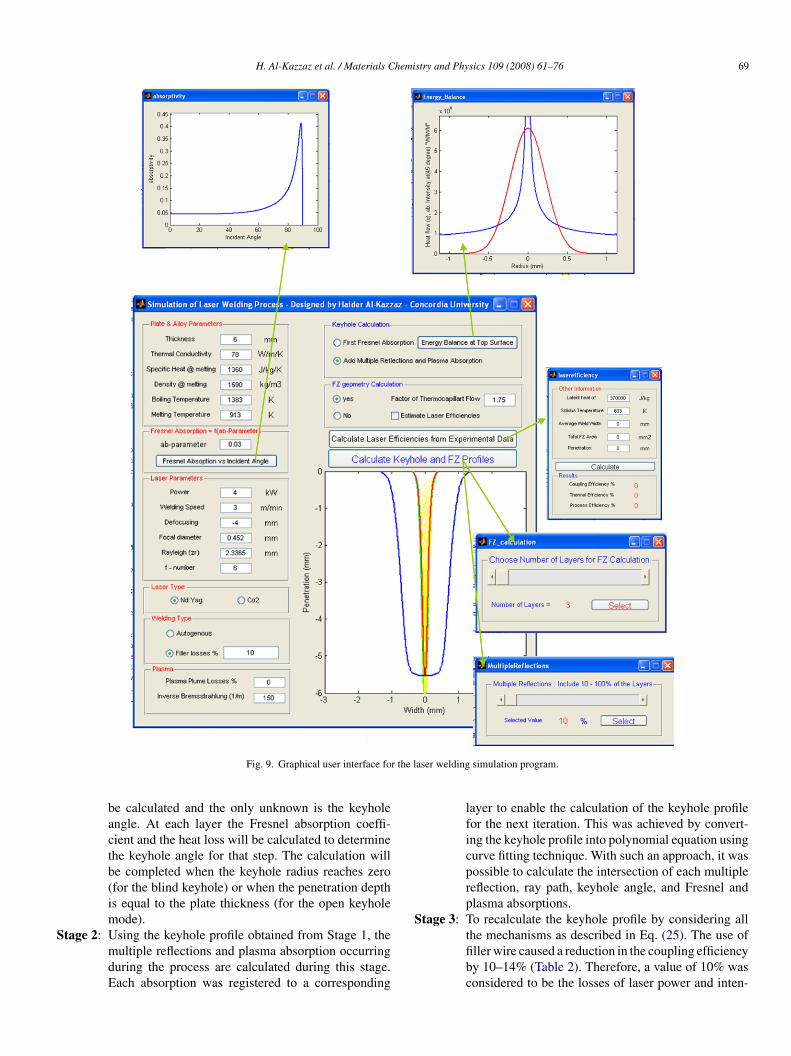
H. Al-Kazzaz et al. / Materials Chemistry and Physics 109 (2008) 61–76 69
r the l
SS
Fig. 9. Graphical user interface fo
be calculated and the only unknown is the keyholeangle. At each layer the Fresnel absorption coeffi-cient and the heat loss will be calculated to determinethe keyhole angle for that step. The calculation willbe completed when the keyhole radius reaches zero(for the blind keyhole) or when the penetration depthis equal to the plate thickness (for the open keyholemode).
tage 2: Using the keyhole profile obtained from Stage 1, themultiple reflections and plasma absorption occurringduring the process are calculated during this stage.Each absorption was registered to a corresponding
aser welding simulation program.
layer to enable the calculation of the keyhole profilefor the next iteration. This was achieved by convert-ing the keyhole profile into polynomial equation usingcurve fitting technique. With such an approach, it waspossible to calculate the intersection of each multiplereflection, ray path, keyhole angle, and Fresnel andplasma absorptions.
tage 3: To recalculate the keyhole profile by considering all
the mechanisms as described in Eq. (25). The use offiller wire caused a reduction in the coupling efficiencyby 10–14% (Table 2). Therefore, a value of 10% wasconsidered to be the losses of laser power and inten-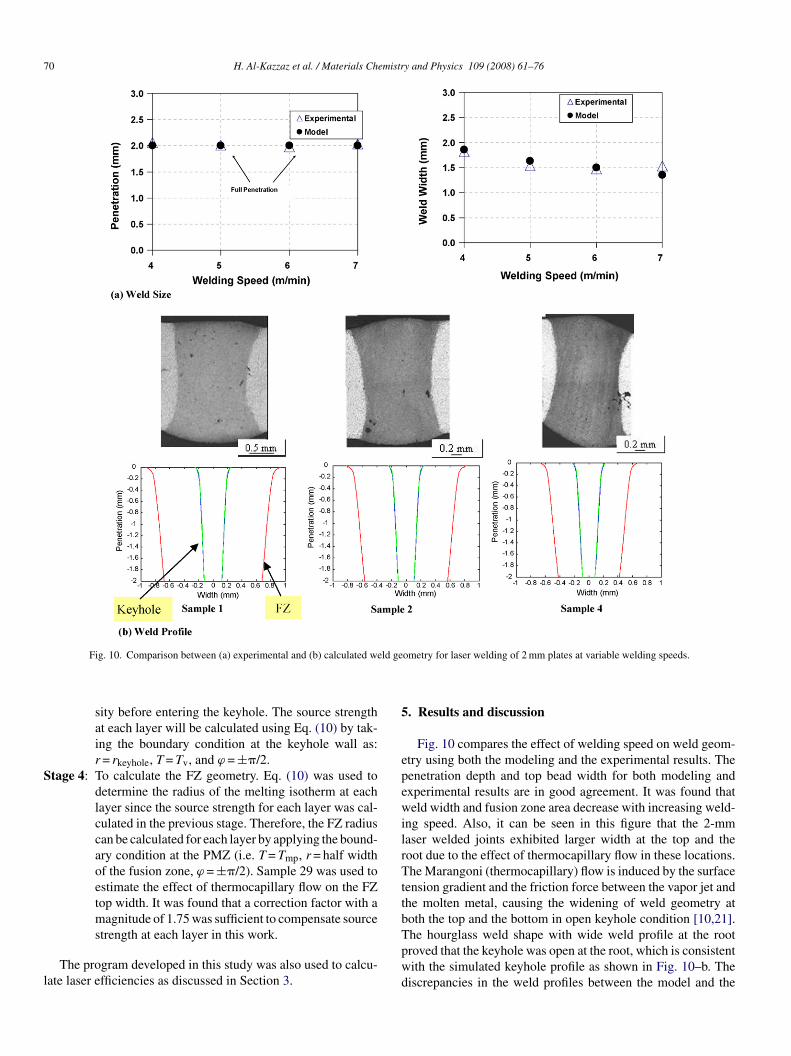
70 H. Al-Kazzaz et al. / Materials Chemistry and Physics 109 (2008) 61–76
ld ge
S
l
5
epewilrTttb
Fig. 10. Comparison between (a) experimental and (b) calculated we
sity before entering the keyhole. The source strengthat each layer will be calculated using Eq. (10) by tak-ing the boundary condition at the keyhole wall as:r = rkeyhole, T = Tv, and ϕ = ±�/2.
tage 4: To calculate the FZ geometry. Eq. (10) was used todetermine the radius of the melting isotherm at eachlayer since the source strength for each layer was cal-culated in the previous stage. Therefore, the FZ radiuscan be calculated for each layer by applying the bound-ary condition at the PMZ (i.e. T = Tmp, r = half widthof the fusion zone, ϕ = ±�/2). Sample 29 was used toestimate the effect of thermocapillary flow on the FZtop width. It was found that a correction factor with amagnitude of 1.75 was sufficient to compensate source
strength at each layer in this work.The program developed in this study was also used to calcu-ate laser efficiencies as discussed in Section 3.
Tpwd
ometry for laser welding of 2 mm plates at variable welding speeds.
. Results and discussion
Fig. 10 compares the effect of welding speed on weld geom-try using both the modeling and the experimental results. Theenetration depth and top bead width for both modeling andxperimental results are in good agreement. It was found thateld width and fusion zone area decrease with increasing weld-
ng speed. Also, it can be seen in this figure that the 2-mmaser welded joints exhibited larger width at the top and theoot due to the effect of thermocapillary flow in these locations.he Marangoni (thermocapillary) flow is induced by the surface
ension gradient and the friction force between the vapor jet andhe molten metal, causing the widening of weld geometry atoth the top and the bottom in open keyhole condition [10,21].
he hourglass weld shape with wide weld profile at the rootroved that the keyhole was open at the root, which is consistentith the simulated keyhole profile as shown in Fig. 10–b. Theiscrepancies in the weld profiles between the model and the
H. Al-Kazzaz et al. / Materials Chemistry and Physics 109 (2008) 61–76 71
F
et
tftawibwsFibalweo
Wiclw
F
esk
psspt4
mtecdtka3i
ig. 11. Effect of welding speed on coupling, thermal and process efficiencies.
xperiments are probably due to the thermocapillary flow insidehe weld pool which was not included in this model.
Fig. 11 shows the effect of welding speed on the coupling,hermal and process efficiencies. As the welding speed increasedrom 4 to 7 m min−1, the coupling efficiency increased from 25o 42%. The effect of welding speed on the average keyholengle was simulated as shown in Fig. 12. The keyhole angleith y-axis was increased from 3.9◦ to 4.5◦ as the welding speed
ncreased from 4 to 6 m min−1, causing the increase in the num-er of multiple reflections (Fig. 12). Thus the coupling efficiencyas improved at higher welding speed. This increase in welding
peed also decreased the root keyhole width (Figs. 10 and 12).ig. 11 also shows that the thermal efficiency dropped with
ncreasing welding speed. This reduction in thermal efficiencyalanced the increase in the coupling efficiency, resulting in anpproximately constant melting or process efficiency. The simu-ation for sample 4 welded at 7 m min−1 shows that the keyholeas open at the root (Fig. 10) but the slight increase in process
fficiency (Fig. 11) can be attributed to the large misalignmentf the workpieces.
The effect of gap size on the efficiencies is shown in Fig. 13.ith increasing gap sizes from 0.1 to 0.6 mm, the correspond-
ng increase in filler wire feed rate did not cause any significanthange in the process efficiency indicating that the reflectionosses due to the interaction of the laser beam with filler wireere almost constant for different feed rates. The coupling
vist
Fig. 12. The Effect of welding speed on the keyhole shape
ig. 13. Effect of gap size on coupling, thermal and process efficiencies.
fficiency was at maximum value at 0.4 mm gap size, whicheems to be a suitable size for molten flow and formation of theeyhole.
The effect of laser power on weld geometry and the com-arison between the modeling and the experimental results arehown in Fig. 14. Both the modeled and experimental sectionshow that the keyhole varied from the closed (blind) to the openrofile at root and the FZ geometry changed from the partial tohe full penetration when the laser power increased from 2.5 tokW.
Fig. 15 shows the effect of laser power on the coupling, ther-al and process efficiencies. Increasing the laser power leads
o increase in fusion area due to the increase in the couplingfficiency, but as indicated in Fig. 15 there was a drop in theoupling efficiency at laser powers between 3 and 3.75 kW. Thisrop in coupling efficiency is probably due to the change fromhe partially penetrated blind keyhole to fully penetrated openeyhole, which ultimately results in the loss of laser intensityt the keyhole root. Further increase in laser power (here above.75 kW) will surpass the loss of laser intensity at the root, caus-ng an increase in the coupling efficiency due to insignificant
ariations in the root size at higher laser powers. This variationn coupling efficiency of laser welding process and the corre-ponding variation in weld geometry during the change fromhe partial to full penetration passing through the transitionaland the multiple reflections (a) 4 and (b) 6 m min−1.

72 H. Al-Kazzaz et al. / Materials Chemistry and Physics 109 (2008) 61–76
for la
rK
i
F
Fig. 14. Comparison between experimental and calculated weld geometry
egion from the blind to the open keyhole was also reported byrasnoperov et al. [21].For the bead-on-plate laser welding (Fig. 16), both the exper-
mental and modeling results indicate that the penetration depth
ig. 15. Effect of laser power on coupling, thermal and process efficiencies.
iHcioiTRap[twatdtde
ser welding of 2 mm plates at variable laser power (a) weld size (b) weld.
ncreased slightly as the defocusing varied from 0 to −2 mm.owever, a further increase in defocusing distance (−4 mm)
aused a reduction in penetration depth compared with defocus-ng at −2 mm. Also as indicated above, the maximum intensityf the laser beam is located at the focal point, and the peakntensity decreases as moving below or above the focal point.he effective intensities of the laser beam are located within ±ayleigh length (in this setup this value is equal to 2.34 mm);t a distance equal to ± one Rayleigh length from the focallane, the peak intensity drops to one half the peak intensity17]. When the defocusing distance varied from 0 to −2 mm,he effective intensities were located inside the material (plate),hich increased the coupling efficiency between the laser beam
nd the plate, but at the same time the laser intensity available onhe top surface was reduced because of the increase in laser beam
iameter. The discrepancies observed between the modeling andhe experimental results especially for sample 26 are probablyue to the variations in the surface condition or physical prop-rties between pure Mg and ZE41A-T5 alloy. Further increase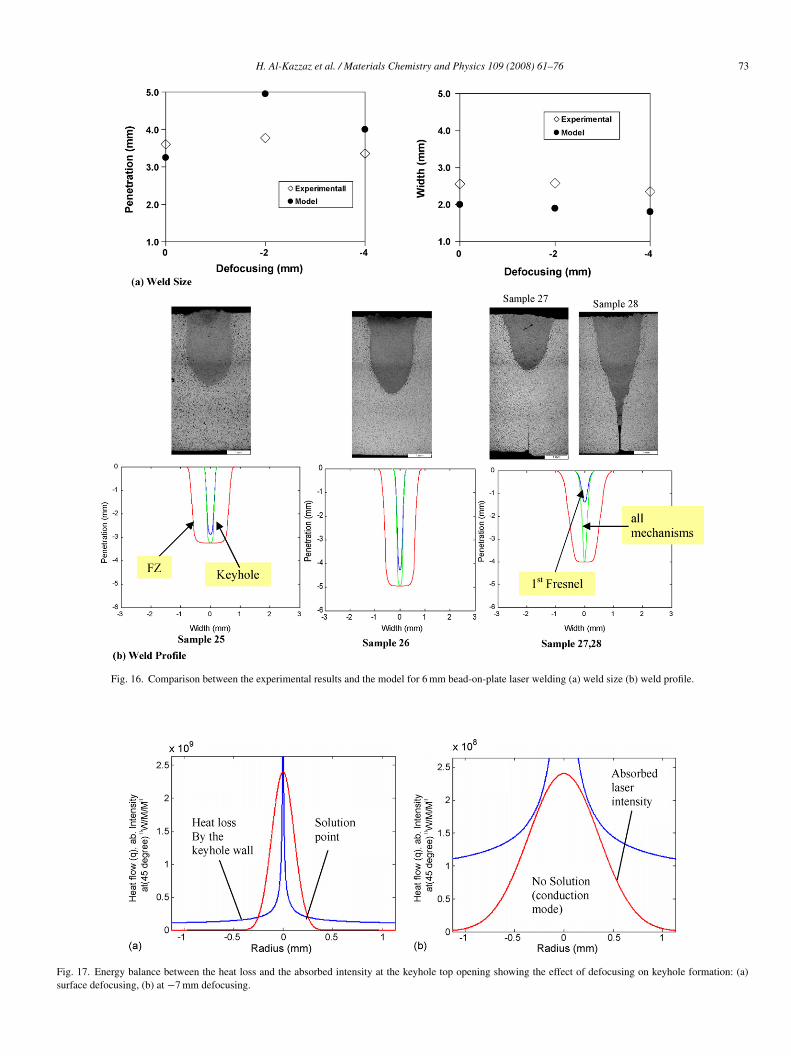
H. Al-Kazzaz et al. / Materials Chemistry and Physics 109 (2008) 61–76 73
Fig. 16. Comparison between the experimental results and the model for 6 mm bead-on-plate laser welding (a) weld size (b) weld profile.
Fig. 17. Energy balance between the heat loss and the absorbed intensity at the keyhole top opening showing the effect of defocusing on keyhole formation: (a)surface defocusing, (b) at −7 mm defocusing.

7 emistr
iskfmwBhcssi2tpk
thtcaa
iewmws
4 H. Al-Kazzaz et al. / Materials Ch
n defocusing distance to −4 mm decreases laser power den-ity around or below the threshold value required to produce theeyhole [14,17]. Therefore, the laser welding process changedrom the keyhole mode (samples 25 and 26) to the conductionode (sample 27) since the aspect ratio (penetration depth/topidth) for keyhole mode should usually be greater than 1.2 [22].oth samples 27 (bead-on-plate) and 28 (butt joint at zero gap)ad the same laser welding parameters. Sample 27 exhibited aonduction or shallow keyhole penetration whereas sample 28howed a deeper keyhole mode welding. Thus, the power den-ity used for samples 27 and 28 is around the threshold value,.e. 6.45 × 10⁵ W cm−2. The obtained results for samples 27 and8 also indicate that the welding mode significantly influences
he penetration depth values obtained with and without multi-le reflections. Fig. 17 illustrates the effect of defocusing on theeyhole formation and top keyhole radius obtained by solvingmtm
Fig. 18. Comparison between the experimental results and the model f
y and Physics 109 (2008) 61–76
he energy balance between the absorbed laser intensity and theeat lost through the keyhole wall. Furthermore, Fig. 17b showshat the excessive increase in defocusing (e.g. −7 mm) leads to aonduction mode since there is no balance between the heat lostnd the absorbed intensity. In other words, the applied intensityt the top plate surface is not high enough to form a keyhole.
Fig. 18 shows a comparison between the modeling and exper-mental results for laser welding of 6-mm thick sheets. Thexperimental results for fully penetrated 6-mm plates shows aidening in the lower half sections of the weld profiles due toultiple reflections and plasma absorption. Multiple reflectionsere highly concentrated in the lower part of the keyhole as
imulated for samples 30 and 32 in Fig. 18. This increase in
ultiple reflections caused an increase in plasma absorption inhat region, resulting in the widening of the weld profile. Theodel also predicts a gradual change and widening in weld pro-
or butt joints (6 mm) laser welded plates: (a) weld size, (b) weld.
H. Al-Kazzaz et al. / Materials Chemi
Fa
fie
ajpkttaie
6
ubefisdafipr
•
•
•
•
•
R
[
[
[
[
[
[
[
[
[
[
ig. 19. Effect of penetration depth and welding type on the coupling, thermalnd process efficiencies.
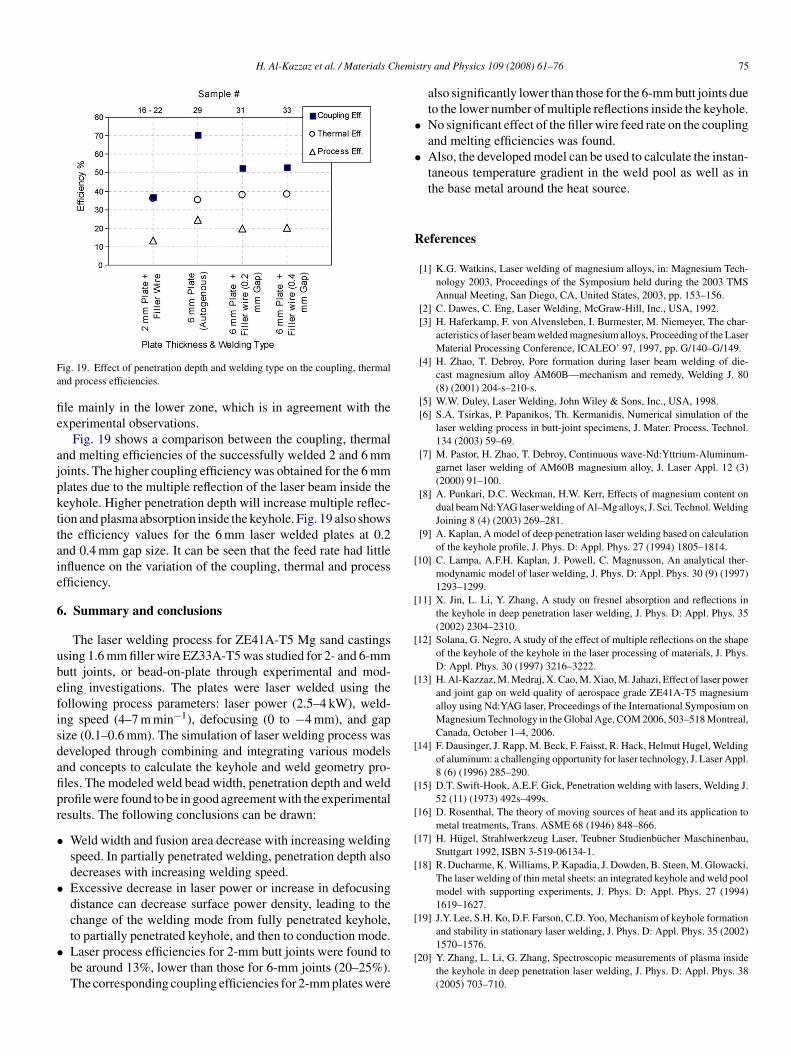
le mainly in the lower zone, which is in agreement with thexperimental observations.
Fig. 19 shows a comparison between the coupling, thermalnd melting efficiencies of the successfully welded 2 and 6 mmoints. The higher coupling efficiency was obtained for the 6 mmlates due to the multiple reflection of the laser beam inside theeyhole. Higher penetration depth will increase multiple reflec-ion and plasma absorption inside the keyhole. Fig. 19 also showshe efficiency values for the 6 mm laser welded plates at 0.2nd 0.4 mm gap size. It can be seen that the feed rate had littlenfluence on the variation of the coupling, thermal and processfficiency.
. Summary and conclusions
The laser welding process for ZE41A-T5 Mg sand castingssing 1.6 mm filler wire EZ33A-T5 was studied for 2- and 6-mmutt joints, or bead-on-plate through experimental and mod-ling investigations. The plates were laser welded using theollowing process parameters: laser power (2.5–4 kW), weld-ng speed (4–7 m min−1), defocusing (0 to −4 mm), and gapize (0.1–0.6 mm). The simulation of laser welding process waseveloped through combining and integrating various modelsnd concepts to calculate the keyhole and weld geometry pro-les. The modeled weld bead width, penetration depth and weldrofile were found to be in good agreement with the experimentalesults. The following conclusions can be drawn:
Weld width and fusion area decrease with increasing weldingspeed. In partially penetrated welding, penetration depth alsodecreases with increasing welding speed.Excessive decrease in laser power or increase in defocusingdistance can decrease surface power density, leading to thechange of the welding mode from fully penetrated keyhole,
to partially penetrated keyhole, and then to conduction mode.Laser process efficiencies for 2-mm butt joints were found tobe around 13%, lower than those for 6-mm joints (20–25%).The corresponding coupling efficiencies for 2-mm plates were[
stry and Physics 109 (2008) 61–76 75
also significantly lower than those for the 6-mm butt joints dueto the lower number of multiple reflections inside the keyhole.No significant effect of the filler wire feed rate on the couplingand melting efficiencies was found.Also, the developed model can be used to calculate the instan-taneous temperature gradient in the weld pool as well as inthe base metal around the heat source.
eferences
[1] K.G. Watkins, Laser welding of magnesium alloys, in: Magnesium Tech-nology 2003, Proceedings of the Symposium held during the 2003 TMSAnnual Meeting, San Diego, CA, United States, 2003, pp. 153–156.
[2] C. Dawes, C. Eng, Laser Welding, McGraw-Hill, Inc., USA, 1992.[3] H. Haferkamp, F. von Alvensleben, I. Burmester, M. Niemeyer, The char-
acteristics of laser beam welded magnesium alloys, Proceeding of the LaserMaterial Processing Conference, ICALEO’ 97, 1997, pp. G/140–G/149.
[4] H. Zhao, T. Debroy, Pore formation during laser beam welding of die-cast magnesium alloy AM60B—mechanism and remedy, Welding J. 80(8) (2001) 204-s–210-s.
[5] W.W. Duley, Laser Welding, John Wiley & Sons, Inc., USA, 1998.[6] S.A. Tsirkas, P. Papanikos, Th. Kermanidis, Numerical simulation of the
laser welding process in butt-joint specimens, J. Mater. Process. Technol.134 (2003) 59–69.
[7] M. Pastor, H. Zhao, T. Debroy, Continuous wave-Nd:Yttrium-Aluminum-garnet laser welding of AM60B magnesium alloy, J. Laser Appl. 12 (3)(2000) 91–100.
[8] A. Punkari, D.C. Weckman, H.W. Kerr, Effects of magnesium content ondual beam Nd:YAG laser welding of Al–Mg alloys, J. Sci. Technol. WeldingJoining 8 (4) (2003) 269–281.
[9] A. Kaplan, A model of deep penetration laser welding based on calculationof the keyhole profile, J. Phys. D: Appl. Phys. 27 (1994) 1805–1814.
10] C. Lampa, A.F.H. Kaplan, J. Powell, C. Magnusson, An analytical ther-modynamic model of laser welding, J. Phys. D: Appl. Phys. 30 (9) (1997)1293–1299.
11] X. Jin, L. Li, Y. Zhang, A study on fresnel absorption and reflections inthe keyhole in deep penetration laser welding, J. Phys. D: Appl. Phys. 35(2002) 2304–2310.
12] Solana, G. Negro, A study of the effect of multiple reflections on the shapeof the keyhole of the keyhole in the laser processing of materials, J. Phys.D: Appl. Phys. 30 (1997) 3216–3222.
13] H. Al-Kazzaz, M. Medraj, X. Cao, M. Xiao, M. Jahazi, Effect of laser powerand joint gap on weld quality of aerospace grade ZE41A-T5 magnesiumalloy using Nd:YAG laser, Proceedings of the International Symposium onMagnesium Technology in the Global Age, COM 2006, 503–518 Montreal,Canada, October 1–4, 2006.
14] F. Dausinger, J. Rapp, M. Beck, F. Faisst, R. Hack, Helmut Hugel, Weldingof aluminum: a challenging opportunity for laser technology, J. Laser Appl.8 (6) (1996) 285–290.
15] D.T. Swift-Hook, A.E.F. Gick, Penetration welding with lasers, Welding J.52 (11) (1973) 492s–499s.
16] D. Rosenthal, The theory of moving sources of heat and its application tometal treatments, Trans. ASME 68 (1946) 848–866.
17] H. Hugel, Strahlwerkzeug Laser, Teubner Studienbucher Maschinenbau,Stuttgart 1992, ISBN 3-519-06134-1.
18] R. Ducharme, K. Williams, P. Kapadia, J. Dowden, B. Steen, M. Glowacki,The laser welding of thin metal sheets: an integrated keyhole and weld poolmodel with supporting experiments, J. Phys. D: Appl. Phys. 27 (1994)1619–1627.
19] J.Y. Lee, S.H. Ko, D.F. Farson, C.D. Yoo, Mechanism of keyhole formation
and stability in stationary laser welding, J. Phys. D: Appl. Phys. 35 (2002)1570–1576.20] Y. Zhang, L. Li, G. Zhang, Spectroscopic measurements of plasma insidethe keyhole in deep penetration laser welding, J. Phys. D: Appl. Phys. 38(2005) 703–710.

7 emistr
[
[
6 H. Al-Kazzaz et al. / Materials Ch
21] M.Y. Krasnoperov, R.R.G.M. Pieters, I.M. Richardson, Weld pool geome-try during keyhole laser welding of thin steel sheets, Sci. Technol. Welding
Joining 9 (6) (2004) 501–506.22] X. Cao, M. Xiao, M. Jahazi, Y.L. Lin, Continuous wave Nd:YAG laserwelding of sand-cast ZE41A-T5 magnesium sand casting: conduction orkeyhole mode, Proceedings of the International Symposium on AerospaceMaterials and Manufacturing: Development, Testing and Life Cycle Issues,
[
[
y and Physics 109 (2008) 61–76
Honoring William Wallace, 2nd, Aerospace Materials and Manufacturing:Development, Hamilton, ON, Canada, Aug. 22–25 2004, pp. 187–197.
23] X. Cao, M. Jahazi, J.P. Immarigeon, W. Wallace, A review of laser weldingtechniques for magnesium alloys, J. Mater. Process. Technol. 171 (2) (2006)188–204.
24] Magnesium Elektron: http://www.magnesium-elektron.com/ (October 5,2006).