near-surface microearthquakes at the geysers geothermal ... · near-surface microearthquakes at the...
TRANSCRIPT
Near-Surface Microearthquakes at The Geysers Geothermal Field, California
James T. RutledgeNambe Geophysical, Inc., Route 1 Box 104F, Santa Fe, NM 87501
email: [email protected], fax: 505-667-8487
Mitchel A. StarkCalpine Corporation, 10350 Socrates Mine Road, Middletown, CA 95461
Thomas D. FairbanksNambe Geophysical, Inc., Route 1 Box 104F, Santa Fe, NM 87501
Timothy D. AndersonSonoma County Water Agency, P.O. Box 11628, Santa Rosa, CA 95406
Submitted to Pure and Applied Geophysics
April, 2000
LAUR# 00-1554
Keywords: Induced seismicity, microearthquake, wellbore deformation, geothermal
-1-
Near-Surface Microearthquakes at The Geysers
7- to
f the
llow
y was
with
rring
y 6 to
rs in
20 to
rallel
r fault
ggest
e of a
n the
below
hat the
re
e
ir
Abstract
A 150-m length, 6-level, 3-component, vertical geophone array was cemented into the 6
219-m depth interval (220 to 720 ft) of Unocal’s well GDCF 63-29 during a plug and
abandonment operation on April 7, 1998. Casing deformation has been observed in wells o
study area including the GDCF 63-29 well. An objective of the study was to determine if sha
deformation at The Geysers is manifested seismically. Near-surface microearthquake activit
monitored for a period of one year; during the latter 4 months, monitoring was supplemented
four surface stations to help constrain locations of shallow seismicity. Event locations occu
within about 750 m of the array bottom have been determined for the 10-week period Januar
March 16, 1999. These events are distinct from surface-monitored seismicity at The Geyse
that they occur predominantly above the producing reservoir, at depths ranging from about 2
1000 m (600 to-180 m elevation). The shallow events tend to be episodic, with relatively
quiescent periods of up to three weeks occurring between swarms. Event locations show a
northeast-striking trend, similar to seismicity trends mapped deeper in the reservoir, and pa
to the strike of a major surface lineaments observed over the productive field. However, clea
or fracture planes are not resolved from the hypocenters. Composite fault-plane solutions su
oblique reverse faulting in the overburden. The shallowest seismicity terminates near the bas
serpentine unit, a contact which is the locus of most of the well casing deformations logged i
area, suggesting that reservoir contraction is accommodated along numerous discrete faults
the serpentine, but as continuous plastic deformation in the serpentine. It is hypothesized t
resulting strain discontinuity at the base of the serpentine explains the prevalence of wellbo
deformation there. The shallow, above-reservoir microseismicity is strongly correlated in tim
with the injection and the deeper injection-induced seismic activity occurring in the reservo
-2-
Near-Surface Microearthquakes at The Geysers
ts, by
and
, the
ulic
et al.,
that
s
icity
o be
rvoir
egall
’s by
-
;
s
), set
ring
).
immediately below. This suggests that deep injection-induced events trigger shallower even
a remote triggering mechanism which has been observed at a larger scale at The Geysers
elsewhere.
Introduction
Since fractures usually dominate the contribution to permeability in geothermal reservoirs
ability to map them at large distance from boreholes has direct applications to reservoir
development and management. It is well known that the gross flow paths affected by hydra
fracturing can be mapped using the microearthquakes induced during the treatment. Barton
(1995) have shown correlations of high permeability along fractures that are oriented such
resolved shear stress is high. If this is generally true, it would imply that any reservoir stres
changes that even weakly promote failure on critically stressed fractures could result in seism
that reveals important or potentially important reservoir flow paths. Stress changes can als
induced outside the reservoir, where no pore-fluid content changes need occur, due to rese
volume changes accompanying pressure and temperature drawdown (e.g., Segall, 1989; S
and Fitzgerald, 1998). Microearthquakes induced above the reservoir could be used for
monitoring and characterizing deformation in the overburden.
Seismic station coverage of The Geysers region was greatly enhanced in the mid-1970
the U.S. Geological Survey, leading to early recognition and characterization of production
induced seismicity (Marks et al., 1978; Majer and McEvilly, 1979; Denlinger and Bufe, 1982
Eberhart-Phillips and Oppenheimer, 1984; Oppenheimer, 1986). Hypocentral resolution wa
improved when steamfield operators, such as the Unocal-NEC-Thermal partnership (U-N-T
up field wide array coverage (Stark, 1990), and was further refined with denser arrays cove
specific areas within the field (Kirkpatrick et al, 1995; Romero et al, 1995; Julian et al, 1993
-3-
Near-Surface Microearthquakes at The Geysers
enter
ero et
by
1993;
at The
in a
atly
997;
hole
3-29
ed in
uction
n
here
st
llbore
allow
Detection thresholds for these arrays ranged as low as M =–1. Data collected on the high-
resolution arrays have been used to help understand the reservoir by: 1) associating hypoc
patterns with fluid movement (Stark, 1990; Kirkpatrick et al., 1995), 2) associating seismic
velocity anomalies with specific lithologies, reservoir processes, and saturation levels (Rom
al., 1995; Kirkpatrick et al., 1997), and 3) inferring reservoir fracture behavior or mechanics
associating extraction/injection operations with seismic source characteristics (Julian et al.,
Kirkpatrick et al., 1995; Ross et al., 1999).
Downhole seismic receivers deployed as deep as 712 m (~280 m above the reservoir)
Geysers lowered the threshold of detection to M =−3, or 2 to 3 magnitude units below the limits
of surface monitoring (Albright et al., 1998). Placing seismic sensors downhole also results
concomitant increase in event detection rate for a given volume of rock and, in general, gre
improves the resolution of mapping active reservoir fractures or faults (e.g., Phillips et al., 1
Rutledge et al., 1998a; Gaucher et al., 1998; Rutledge et al., 1998b; Phillips, 2000).
In this paper, we present microearthquake mapping results from monitoring with a bore
geophone array that was cemented within the upper 220 m (720 ft) of Unocal’s well GDCF 6
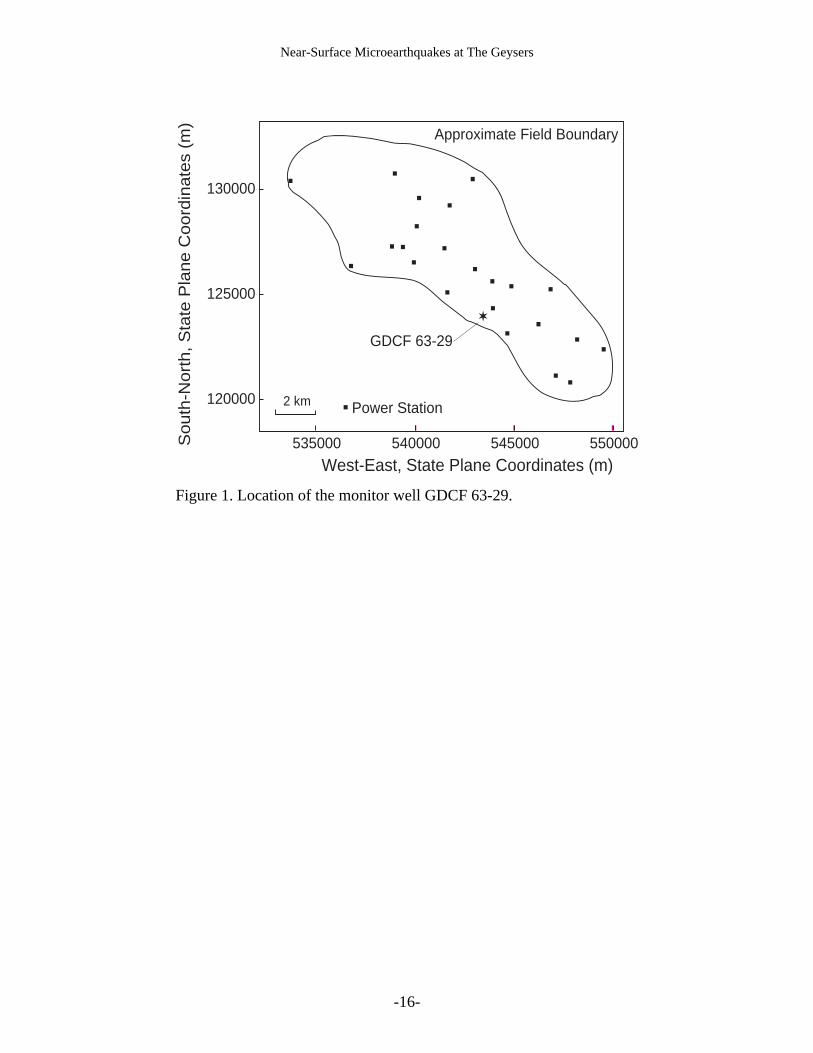
in the southeast Geysers (Figures 1 and 2). Approximately 0.5 m of subsidence has occurr
the immediate study area between 1977 and 1996 and has been attributed to deeper, prod
induced reservoir contraction (Mossop and Segall, 1997). Near-surface strain has also bee
observed as casing deformation in this area of the field, occurring over short depth intervals w
the wells intersect the upper and lower contacts of a serpentine unit dipping to the northea
(Figure 3). In fact, GDCF 63-29 was plugged and abandoned because of the severity of we
collapse concentrated at the base of the serpentine, at 244 m (800 ft) depth. Monitoring sh
microseismicity could potentially provide answers to questions regarding the nature of
-4-
Near-Surface Microearthquakes at The Geysers
pse
with
nt
8
o
ring.
suited
. The
le to
be
ge et
st with
ls on
ns
YO
Mark
utput
deformation affecting borehole integrity, such as: Is the deformation episodic? Are the colla
zones associated with shallow fault zones intersecting the wellbores? and Can intersection
active, shallow faults or deformation zones be avoided?
Data
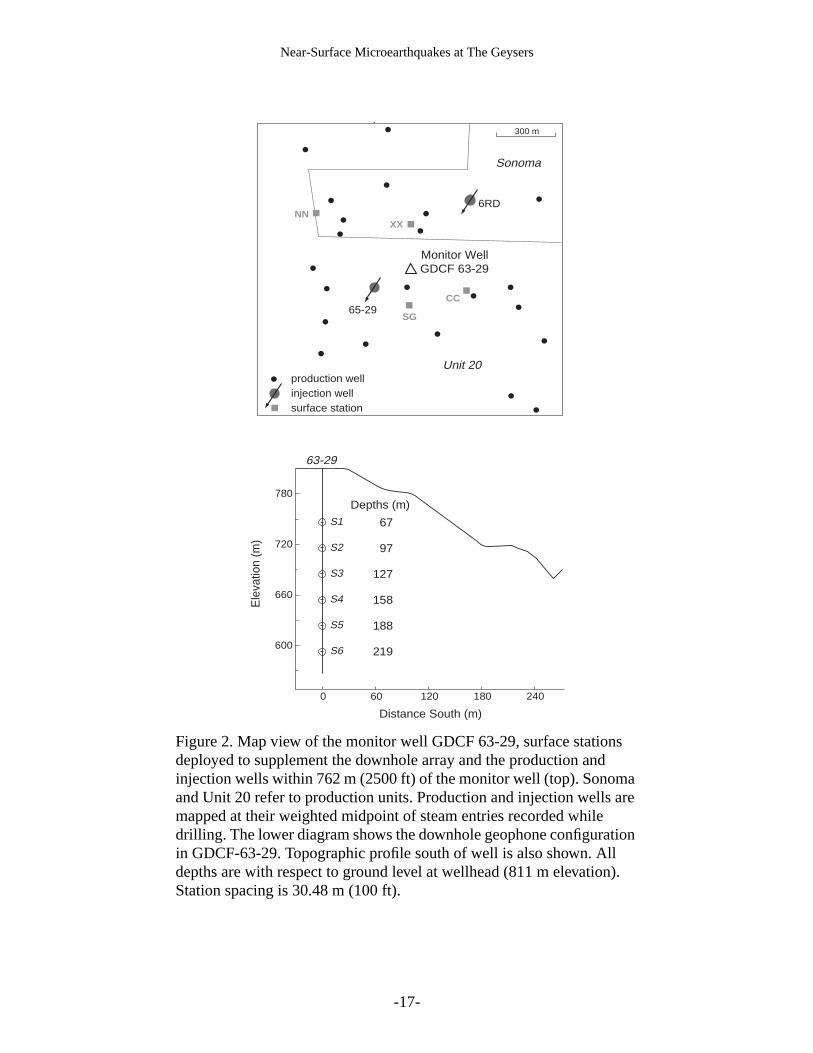
The downhole array installed in GDCF 63-29 is 152 m (500 ft) long with six 3-compone
sondes spaced at 30 m (100 ft) intervals (Figure 2). Deployment took place on April 7, 199
during plug and abandonment of the well; all but the middle sondes S3 and S4 continued t
operate with at least one functional geophone channel after one year of continuous monito
The temperature at the bottom of the array is 146° C. Details of the deployment and array
specifications are given in Albright et al. (1998).
The array’s short length and placement about 750 m above the reservoir makes it best
for detecting and locating small microearthquakes associated with near-surface deformation
downhole array was supplemented with four 3-component, surface-deployed geophones
surrounding the GDCF 63-29 monitor well in late 1998 and early 1999 (Figure 2). It is possib
uniquely determine source locations from a single vertical array if good azimuthal data can
obtained from the horizontal component first-arrival particle-motion trajectories (e.g., Rutled
al., 1998a). All events detected on the borehole array occur beneath the bottom sonde, mo
steep travel paths from source to receiver. This results in low signal-to-noise-ratio first arriva
the horizontal components and hence, unreliable azimuthal data. Adding the surface statio
allowed locations to be determined using only the P and S arrival-time data.
The six downhole receiver levels and three of the surface stations were equipped with O
GS-20DM geophones (28 Hz downhole, 14 Hz at surface); the fourth surface station was a
Products 1-Hz, L4-3C geophone. Using existing telemetry lines in the field, surface station o
-5-
Near-Surface Microearthquakes at The Geysers
eivers.
noise
nly
e
er an
f the
vents
hole
6,
ay
hown
T
y
(
l time
een
ere
ce
were sent directly to the same PC-based data acquisition system used for the downhole rec
Data were sampled at a 0.2 msec interval per channel. Downhole signal bandwidth above
extends from about 20 to 400 Hz.
All data collected from April 7, 1998 to March 16, 1999, have been screened to select o
those events occurring within about 750 m of the array (based on the criteria S-P arrival tim
difference≤ 150 msec at the deepest station (S6, Figure 2)). Details of event occurrence ov
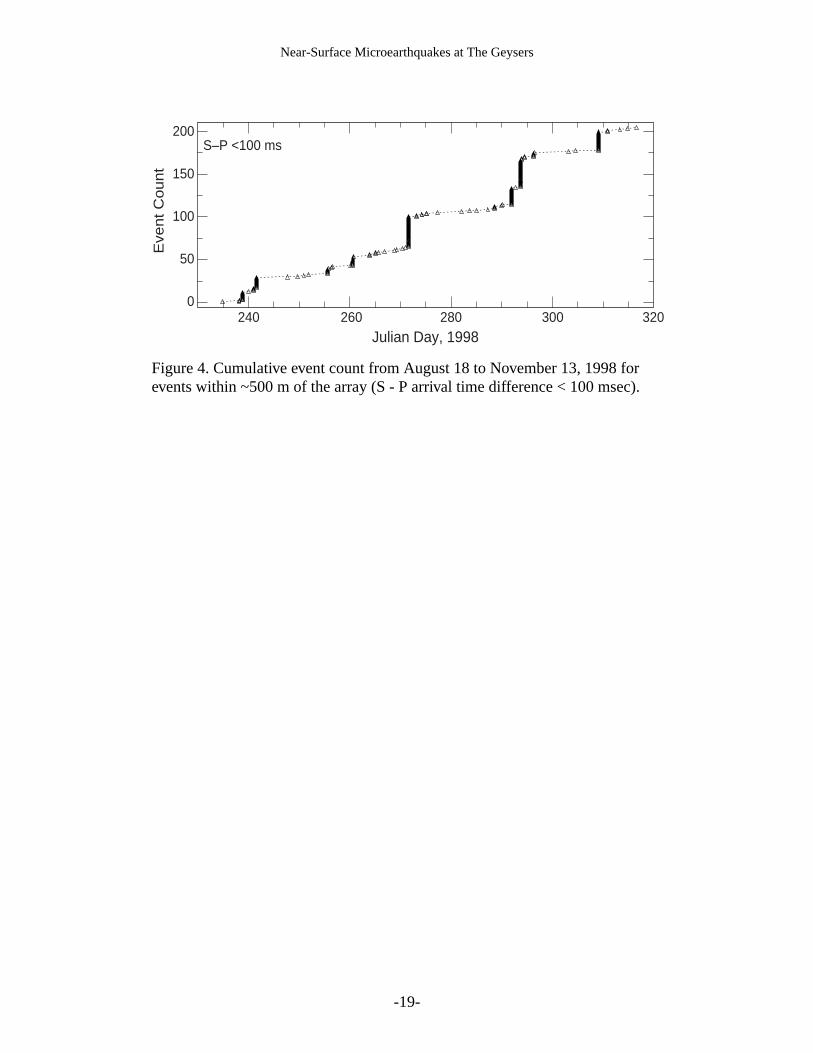
88-day period in 1998 shows that the shallowest seismicity is episodic. Within about 500 m o
array, relatively quiescent periods of up to three weeks are observed between swarms of e
(Figure 4). In this paper we present the locations of near-array events detected on the bore
receivers and at least three of our local surface stations for the period January 6 to March 1
1999. A total of 535 events were detected within ~750 m of the deepest station for this 70-d
period. An example of a high-quality, near-array event recorded on downhole sonde S5 is s
in Figure 5.
The downhole array also detects events occurring field wide, in common with the U-N-
surface array. However, the shallow, local events analyzed are unique to our downhole arra
because they are generally too small for common detection over the wider station spacing ≥ 1
km) of the U-N-T surface array.
Determining Source Locations
Seismic velocities were determined using 1) surface calibration shots, 2) observed trave
differences across the downhole array, and 3) a velocity grid search to find the best fit betw
observed and computed arrival times. P- and S-wave velocities (Vp and Vs, respectively) w
first computed for a shallow serpentine unit from the surface to 244 m depth using the surfa
shots and microearthquakes with travel paths within 10° of the vertical array. With these shallow
-6-
Near-Surface Microearthquakes at The Geysers
that
sense.
he final
s and
ed for
itial
time
and 8
l
is
nds
major
w
re 8
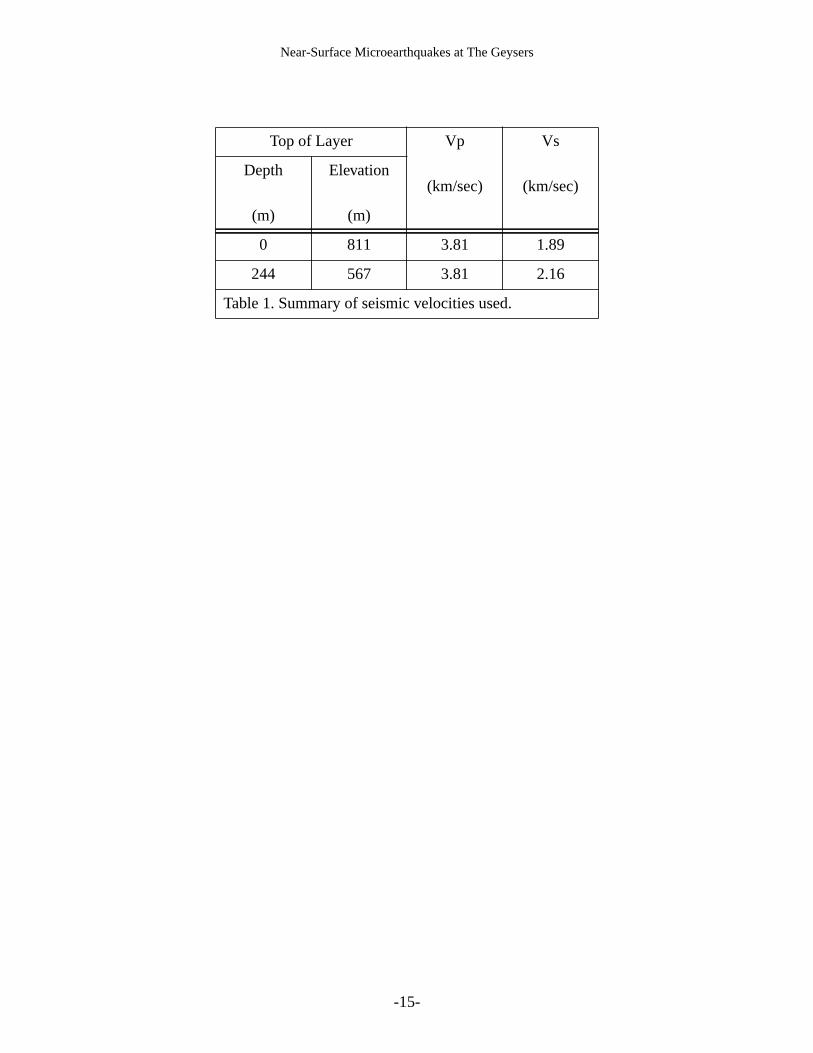
velocities fixed, we then did a grid search for an underlying half-space’s Vp and Vs values
minimized the difference between observed and computed arrival times in a least-squares
The grid search resolved Vs very well but could not constrain Vp. Our top-layer Vp value is
within 2% of the velocity model of Kirkpatrick et al. (1997) for the upper kilometer of the
southeast Geysers. Therefore, we kept Vp constant across the 244 m serpentine contact. T
velocity model is summarized in Table 1. Trial runs to compare the resultant source location
residual misfits with the model interface at 244 m oriented horizontal or dipping 30° to the NE (as
in Figure 3) showed little difference. The results shown are for the flat-layered model.
Of the 535 events, 304 with at least six arrival times identified over the full length of the
downhole array, and three or more arrival time picks on the surface stations, were consider
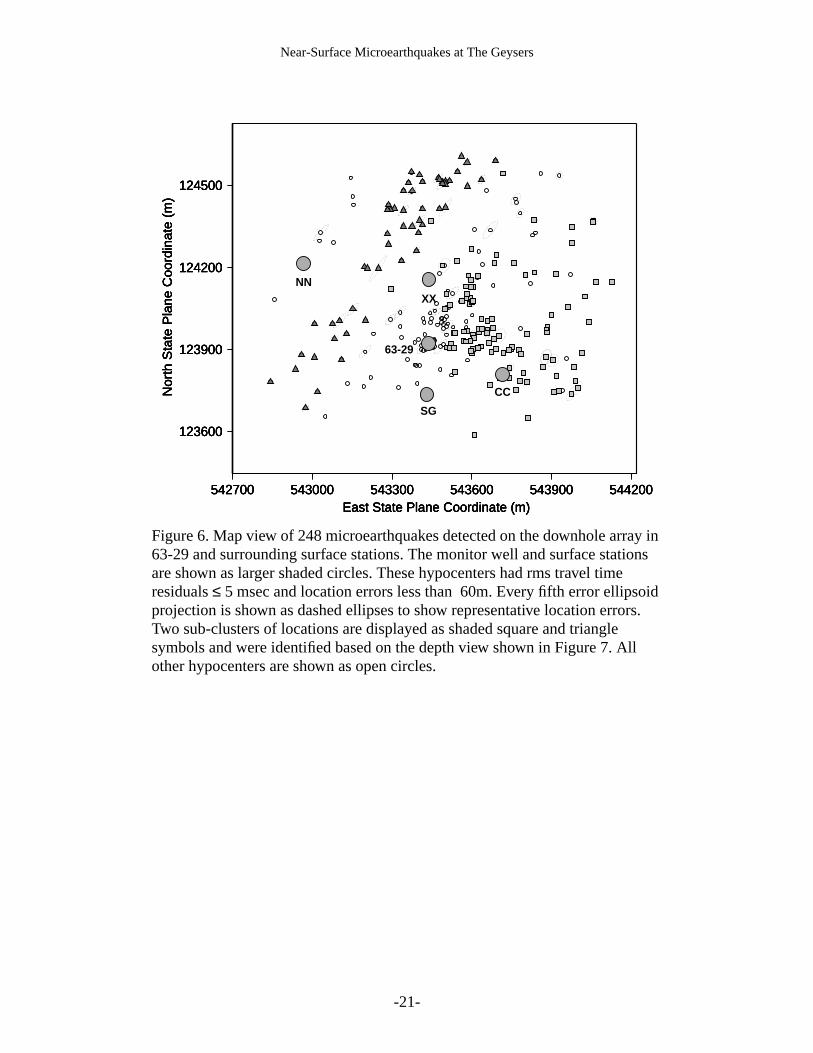
mapping. 297 location solutions converged, of which 248 had root-mean-square travel-time
residuals less than 5 msec and location errors less than±60 m (Figure 6). P and S station
corrections were applied based on the median travel time residuals determined from two in
location runs. Arrival-time errors were estimated from the standard deviations of the travel-
residuals, and ranged from 2 to 5 msec. The location error ellipses displayed in Figures 6, 7
only reflect the arrival-time data errors, data distribution and array geometry; velocity mode
uncertainties are not considered. Median principle error axes for the 248 events displayed ±24
m.
Microearthquake Maps
The map view (Figure 6) shows a gross northeast striking trend, similar to seismicity tre
mapped deeper within the reservoir (e.g., Romero et al., 1995) and parallel to the strike of a
surface lineament observed over the productive field (Nielson and Nash, 1997). A depth vie
projecting the locations onto a plane orthogonal to the map trend is shown in Figure 7. Figu
-7-
Near-Surface Microearthquakes at The Geysers
m
ost
bout
view
tely
sional
the
ll
al
area
he
ur
area.
rger
rate
s
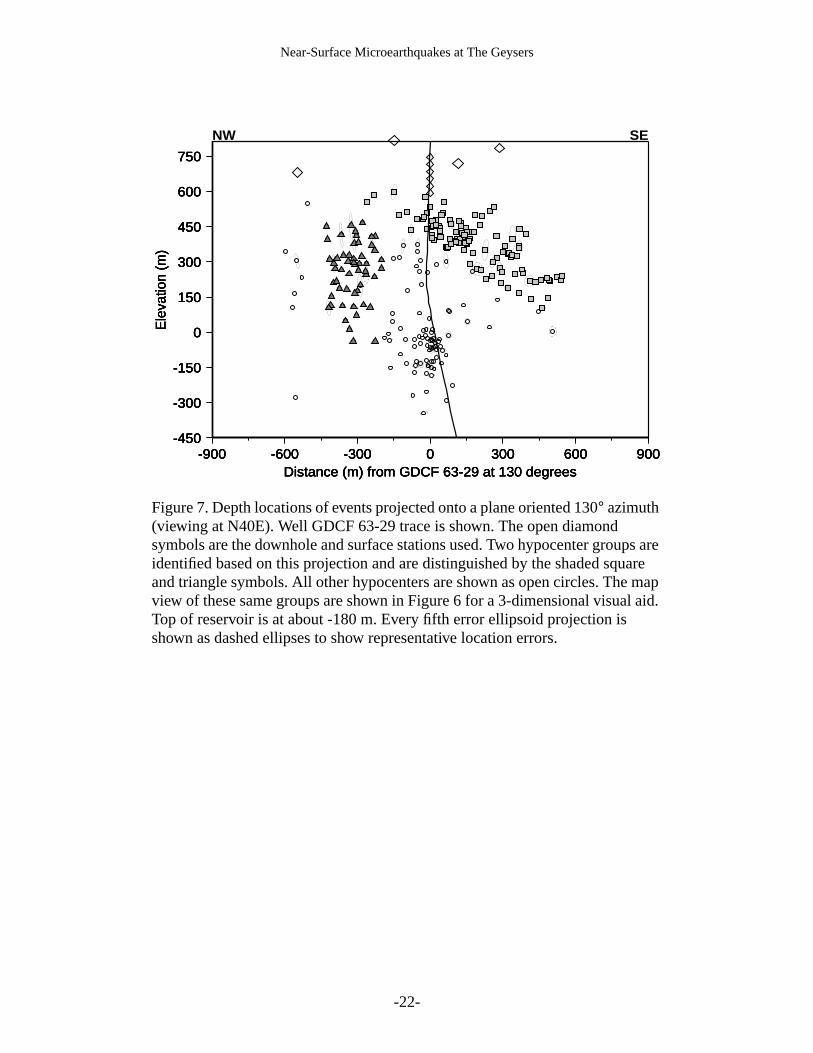
shows a depth projection along the same profile direction as Figure 3. The shallowest stea
entries in this area occur at about -180 m elevation. The events mapped are distinct from m
surface-monitored seismicity in that they lie above the producing reservoir. Preliminary,
downhole monitoring at this site indicated the shallow seismicity magnitudes ranged from a
-3 to 0 (Albright et al., 1998). Two major clusters are identified in the strike-direction depth
(Figure 7). The shaded square-symbol cluster forms a low-angle feature dipping approxima
30° southeast. The same symbols are used in the map view to aid in visualizing the 3-dimen
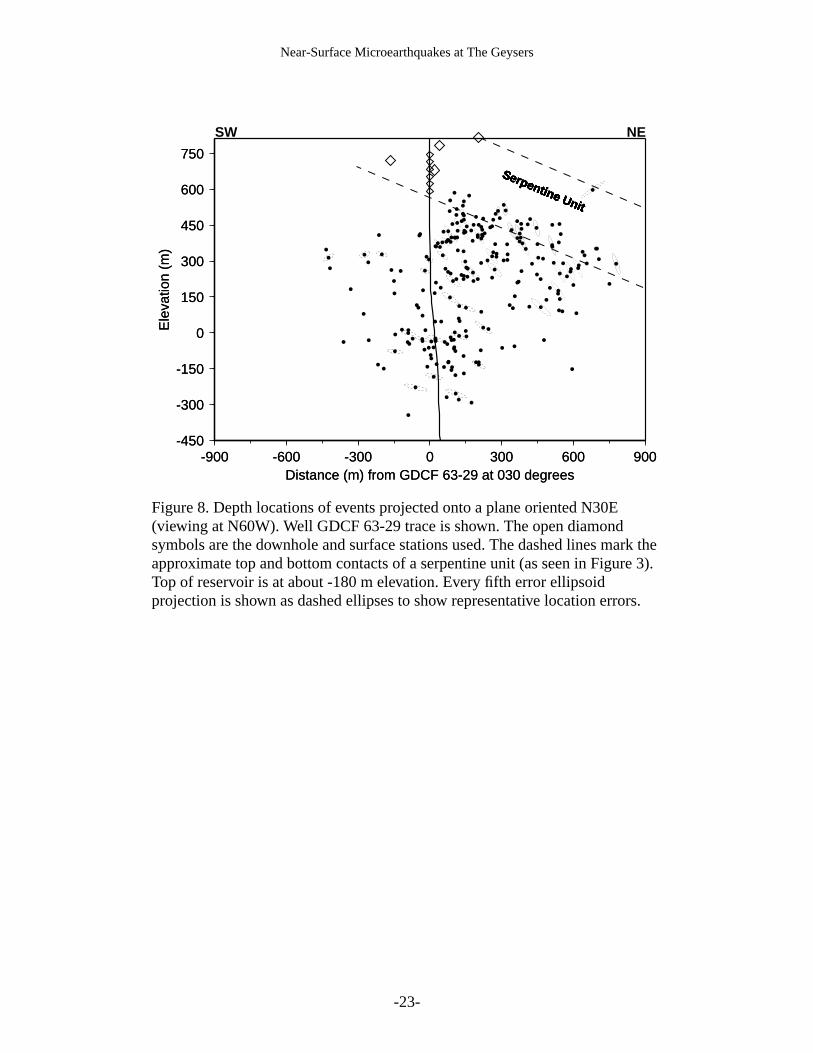
distribution of hypocenters. The depth view looking along strike of the serpentine interface
(Figure 8) shows that the shallowest seismicity terminates near the base of the serpentine,
boundary known to accommodate much of the near-surface strain, as manifest from the we
casing deformations in the area (Figure 3).
Injection and near-surface seismicity
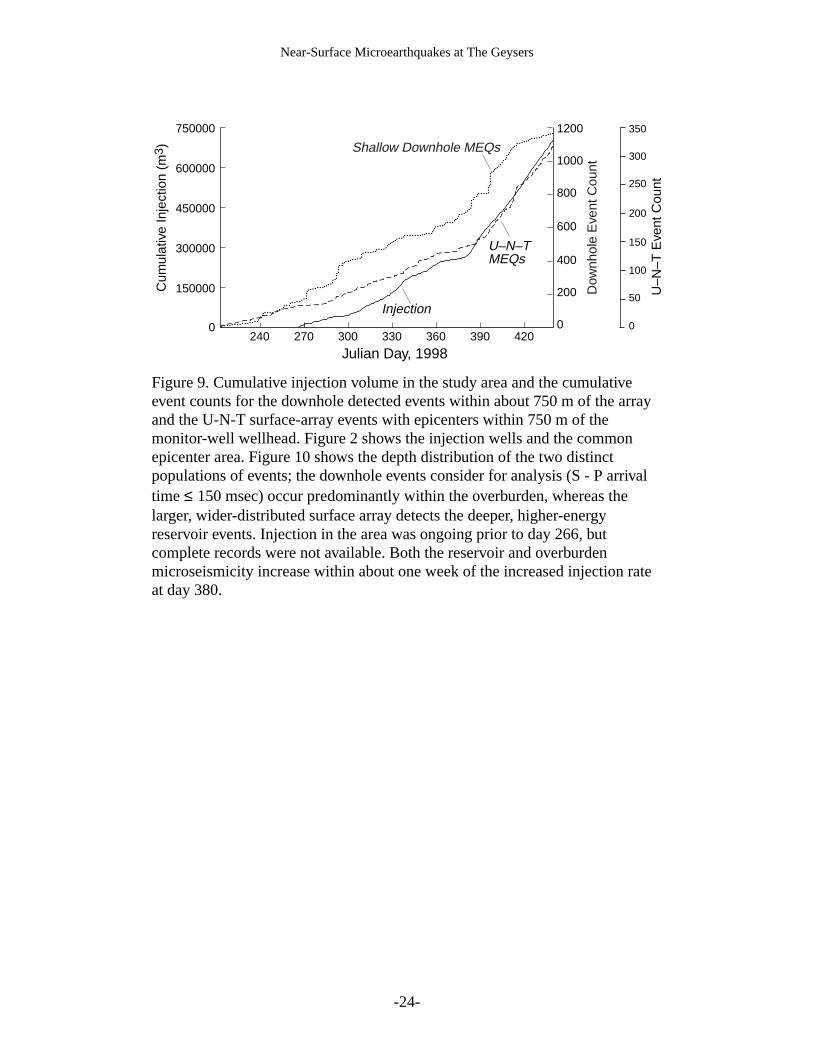
Seismicity and injection activity at the Geysers typically show strong temporal and spati
correlations (Stark, 1990; Beall et al., 1999). Figure 9 shows this to be true in this small study
of The Geysers, for both the overburden (that is, above the shallowest steam entries) and t
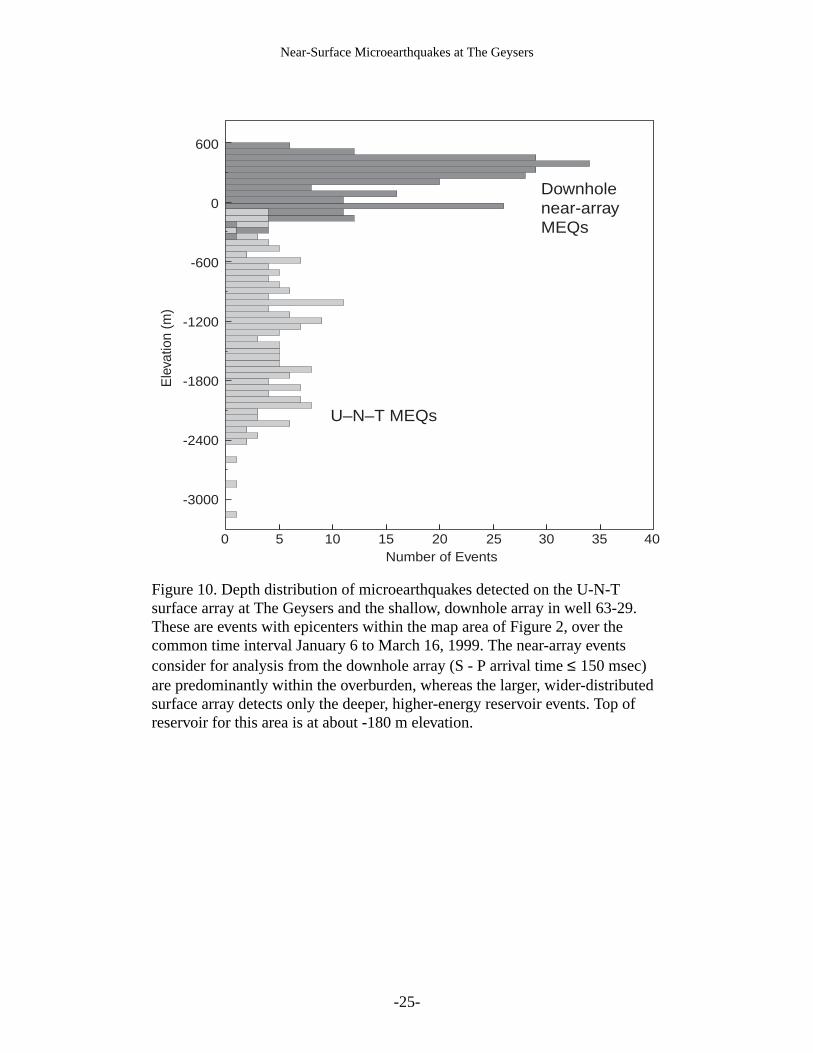
deeper, reservoir microseismicity. Figure 10 shows the difference in depth distribution for o
near-array events and the U-N-T surface-network-detected events for the same epicentral
The shallow, near-array events are not energetic enough for common detection over the la
station spacing (≥ 1 km) of the U-N-T surface array, therefore, the overburden seismicity is a
subset of the total downhole-detected event population unique to our local array. The gross
change in overburden seismicity tracks right along with changes in the deeper, reservoir
seismicity. Both cumulative-event count curves increase in slope within about 1 week of the
increased injection rate, starting at about day 380 (Figure 9). We also looked for correlation
-8-

Near-Surface Microearthquakes at The Geysers
. No
-
rg and
th
bol
ss
. For
ell as
ow
as the
he
ighly
se
ir (<
es no
r the
between production and the shallow seismicity, using the production wells shown in Figure 2
clear temporal correlation between production and event rate was evident.
Focal Mechanisms
Composite fault-plane solutions were computed (Figure 11) for the square- and triangle
symbol hypocenter groups (Figures 6 and 7) using the computer program FPFIT (Reasenbe
Oppenheimer, 1985). Convergence to a single solution was achieved for both cases and bo
indicate a component of reverse faulting (triangle group predominantly so). The square-sym
group solution is better constrained and has fewer discrepant first-motion data.
Discussion
For depths between 1 and 5 km at The Geysers, inversion of focal mechanisms for stre
tensors indicates a normal faulting stress regime that is transitional to strike-slip (i.e., the
maximum horizontal stress is approximately equal to lithostatic load) (Oppenheimer, 1986)
the upper 1 km, focal mechanisms over large areas of the field include reverse faulting as w
normal and strike slip failures. As a result the stress regime is very poorly resolved at shall
depths. The stress regime could very well transition to reverse faulting at the near surface
lithostatic load decreases. Oppenheimer (1986) also noted that the rugged topography at T
Geysers could result in rapid lateral variations in the stress field and may in part explain the h
variable focal mechanisms observed at shallow depths over larger areas of the field. Rever
faulting at shallow depths will further be promoted as a result of reservoir contraction
accompanying pressure and temperature drawdown (Segall and Fitzgerald, 1998).
The first motion data suggest a reverse faulting stress regime locally above the reservo
750 m depth). However, the lack of clear planar distribution of the grouped hypocenters leav
corroborative evidence that the nodal planes are reasonable and leaves in question whethe
-9-
Near-Surface Microearthquakes at The Geysers
-
of
larly-
n the
m
r short
e
rface
e,
tine.
ng the
lls of
not
inter-
n at
k and
compositing of first motion data is justified. The northeast striking nodal plane for the better
constrained, square-symbol-group solution (N37E) closely corresponds to the gross trends
seismicity seen in map view, and could indicate that failure predominantly occurs along simi
oriented, steeply-dipping fractures (Figure 11). The difference in P-axes orientations betwee
two solutions would indicate that the focal mechanisms do not represent planes of maximu
resolved shear and/or that the principle stress axes orientations in the overburden varies ove
distances (~600 m).
Serpentinites are known to be mechanically weak, particularly at the temperatures
encountered for this study (< 150° C) (Moore et al., 1997). The termination of seismicity near th
base of the serpentine (Figure 8) and the concentration of wellbore deformation at that inte
(Figure 3) suggest that strain transitions from brittle to more ductile deformation there.
Volumetric contraction, accumulated on numerous discrete small faults below the serpentin
could be accommodated in the form of continuous plastic deformation in the overlying serpen
This would create a strain discontinuity across the basal contact of the serpentine, subjecti
well casings to stress buildup and eventually failure. Repeated caliper logs from several we
the area shows spotty patterns of deformation rates and magnitudes. The caliper logs are
oriented, so no direction or sense of motion is obtained from these periodic “strain”
measurements. Oriented caliper logs might indicate if a uniform sense of motion occurs at
well scales and may provide insight into the kinematics of strain concentration and transitio
the serpentine boundaries.
The short-term correlation of shallow seismicity with injection is impossible to explain in
terms of pore pressure diffusion or local reservoir volume reduction. Rather, the shallow
seismicity may be triggered by the more energetic reservoir seismicity via dynamic (e.g. Star
-10-

Near-Surface Microearthquakes at The Geysers
ones
nitude
g
ologic
asing
ue to
d in
st
and
able
ent of
Davis, 1996) and/or quasi-static stress transfer.
Conclusions
Our ability to detect and locate the shallow seismicity can be attributed to placing geoph
downhole and deploying surface stations close enough to enable detection of these low-mag
events on multiple sensors. Composite fault-plane solutions suggest oblique reverse faultin
above the reservoir. Seismicity is nearly absent above the base of a serpentine unit. This lith
contact is known to accommodate much of the near-surface strain, as evident from the well c
deformations in the area. The concentration of casing deformation at the contact may be d
strain discontinuity between a plastic deformation regime in the serpentine and a brittle
deformation regime below. The shallow, above-reservoir microseismicity is strongly correlate
time with the reservoir injection and reservoir injection-induced seismic activity occurring ju
below. This correlation is best explained as a small-scale example of remote triggering, as
previously observed on a larger scale at The Geysers and elsewhere.
Acknowledgments
Unocal Corporation and Calpine Corporation granted access to the well and field facilities
provided personnel to assist in the work. We thank Steve Whitt and Mike Woodall for their
assistance in the field work. Baljit Singh, with assistance from Jim Thomson, planned and
supervised the well abandonment and array installation operations. Joe Beall provided valu
discussions on data analysis and interpretation. This work was funded by the U.S. Departm
Energy’s Office of Geothermal Technologies.
-11-
Near-Surface Microearthquakes at The Geysers
98),
.
lts
s., 23,
ity at
s
Rock
.
e
rm.
References
Albright, J. N., Rutledge, J.T., Fairbanks, T.D., Thomson, J.C., and Stevenson, M.A. (19
Vertical Arrays for Fracture Mapping in Geothermal Systems, Geotherm. Resources Counc
Trans., 22, 459-463.
Barton, C.A., Zoback, M.D. and Moos, D. (1995), Fluid Flow Along Potentially Active Fau
in Crystalline Rock, Geology, 23, 683-686.
Beall, J.J., Stark, M.A., Smith, J.L., and Kirkpatrick, A. (1999), Microearthquakes in the
Southeast Geysers Before and After SEGEP Injection, Geotherm. Resources Counc. Tran
253-257.
Denlinger, R.P. and Bufe, C.G. (1982), Reservoir Conditions Related to Induced Seismic
The Geysers Steam Reservoir, Northern California, Bull. Seism. Soc. Am., 72 1317-1327.
Eberhart-Phillips, D. and Oppenheimer, D.H. (1984), Induced Seismicity in The Geyser
Geothermal Area, California, J. Geophys. Res., 89, 1191-1207.
Gaucher, E., Cornet, F.H., Bernard, P. (1998), Induced Seismicity Analysis for Structure
Identification and Stress Field Determination, SPE paper 47324, Soc. Petro. Eng. / Int. Soc.
Mech., Proc. Eurock 98, Trondheim, Norway.
Julian, B.R., Miller, A.D., and Foulger, G.R. (1993), Non-Shear Focal Mechanisms of
Earthquakes at The Geysers, California, and Hengill, Iceland, Geothermal Areas, Geotherm
Resources Counc. Trans., 17, 123-128.
Kirkpatrick, A., Peterson, J.E. and Majer, E.L. (1995), Microearthquake Monitoring at th
Southeast Geysers Using a High-Resolution Digital Array, Proc. 20th Workshop on Geothe
Reservoir Engineering, Stanford University, Stanford, California, 79-89.
-12-
Near-Surface Microearthquakes at The Geysers
al-
,
he
of
fornia
urces
rmal
5-
mal
Kirkpatrick, A., Peterson, J.E., and Majer, E.L. (1997), Three-Dimensional Compression
and Shear-Wave Seismic Velocity Models for the Southeast Geysers Geothermal Field,
California, Proc. 22nd Workshop on Geotherm. Reservoir Engineering, Stanford University
Stanford, California, 399-410.
Majer, E.L., and McEvilly, T.V. (1979), Seismological Investigations at The Geysers
Geothermal Field, Geophysics, 44, 246-269.
Marks, S.M., Ludwin, R.S., Louis, K.B., and Bufe, C.G. (1978), Seismic Monitoring at T
Geysers Geothermal Field, California, U.S. Geol. Surv., Open-File Rept. 78-798.
Moore, D.E., Lockner, D.A., Ma, S., Summers, R., and Byerlee, J.D. (1997), Strengths
Serpentinite Gouges at Elevated Temperatures, J. Geophys. Res., 102, 14787-14801.
Mossop, A., and Segall, P. (1997), Subsidence at The Geysers Geothermal Field, N. Cali
from Comparison of GPS and Leveling Surveys, Geophys. Res. Lett., 24, 1839-1842.
Nielson, D.L., and Nash, G.D. (1997), Structural Fabric of The Geysers, Geotherm. Reso
Counc. Trans., 21, 643-649.
Oppenheimer, D.H. (1986), Extensional Tectonics at The Geysers Geothermal Area,
California, J. Geophys. Res., 91, 11463-11476.
Phillips, W.S., House L.S., and Fehler, M.C. (1997), Detailed Joint Structure in a Geothe
Reservoir from Studies of Induced Microearthquake Clusters, J. Geophys. Res., 102, 1174
11763.
Phillips, W.S. (2000), Precise Microearthquake Locations and Fluid Flow in the Geother
Reservoir at Soultz-sous-Forets, France, Bull. Seism. Soc. Am., 90, 212-228.
-13-

Near-Surface Microearthquakes at The Geysers
.
y and
ed
sing
9-
of a
of
and
ake
sers
Reasenberg, P. and Oppenheimer, D. (1985), FPFIT, FPPLOT and FPPAGE: Fortran
Computer Programs for Calculating and Displaying Earthquake Fault-Plane Solutions, U.S
Geological Survey, Open-File Report 85-0739.
Romero Jr., A.E., McEvilly, T.V., Majer, E.L., Vasco, D. (1995), Characterization of the
Geothermal System Beneath the Northwest Geysers Steam Field, California, from Seismicit
Velocity Patterns, Geothermics, 24, 471-487.
Ross, A., Foulger, G.R., and Julian, B.R. (1999), Source Processes of Industrially-Induc
Earthquakes at The Geysers Geothermal Area, California, Geophysics, 64, 1877-1889.
Rutledge, J.T., Phillips, W.S., and Schuessler, B.K. (1998a), Reservoir Characterization U
Oil-Production Induced Microseismicity, Clinton County, Kentucky, Tectonophysics, 289, 12
152.
Rutledge, J.T., Phillips, W. S., House, L.S., Zinno, R.J. (1998b), Microseismic Mapping
Cotton Valley Hydraulic Fracture Using Decimated Downhole Arrays, 68th Ann. Mtg., Soc.
Explor. Geophys., Expanded Abstracts, 338-341.
Segall, P. (1989), Earthquakes Triggered by Fluid Extraction. Geology, 17, 942-946.
Segall, P. and Fitzgerald, S. (1998), A Note on Induced Stress Changes in Hydrocarbon
Geothermal Reservoirs. Tectonophysics, 289, 117-128.
Stark, M.A. (1990), Imaging Injected Water in The Geysers Reservoir Using Microearthqu
Data, Geotherm. Resources Counc. Trans., 14, 1697-1704.
Stark, M.A., and Davis, S.D. (1996), Remotely Triggered Microearthquakes at The Gey
Geothermal Field, California, Geophys. Res. Lett., 23, 945-948.
-14-
Near-Surface Microearthquakes at The Geysers
Top of Layer Vp
(km/sec)
Vs
(km/sec)Depth
(m)
Elevation
(m)
0 811 3.81 1.89
244 567 3.81 2.16
Table 1. Summary of seismic velocities used.
-15-
Near-Surface Microearthquakes at The Geysers
Figure 1. Location of the monitor well GDCF 63-29.
Power Station2 km
Approximate Field Boundary
GDCF 63-29
120000
125000
130000S
ou
th-N
ort
h,
Sta
te P
lan
e C
oo
rdin
ate
s (m
)
535000 540000 545000 550000
West-East, State Plane Coordinates (m)
-16-
Near-Surface Microearthquakes at The Geysers
Figure 2. Map view of the monitor well GDCF 63-29, surface stationsdeployed to supplement the downhole array and the production andinjection wells within 762 m (2500 ft) of the monitor well (top). Sonomaand Unit 20 refer to production units. Production and injection wells aremapped at their weighted midpoint of steam entries recorded whiledrilling. The lower diagram shows the downhole geophone configurationin GDCF-63-29. Topographic profile south of well is also shown. Alldepths are with respect to ground level at wellhead (811 m elevation).Station spacing is 30.48 m (100 ft).
65-29
Monitor WellGDCF 63-29
6RD
surface stationinjection wellproduction well
Sonoma
Unit 20
300 m
SG
CC
NNXX
S1
S2
S3
S4
S5
S6
67
Depths (m)
97
127
158
188
219
63-29
600
660
720
780
Ele
vatio
n (m
)
0 60 120 180 240
Distance South (m)
-17-

Near-Surface Microearthquakes at The Geysers
Figure 3. Geologic profile showing the well casing deformation zonesassociation with upper and lower contacts of a serpentine unit. Profile is orientedN30E (viewing N60W). Steam entries delineate approximate top of reservoir.
300 m
1862-15BGL-1 1862-13 LC2
1862-9 LC2
63-29
GDCF63-29
LC2Chert
1862-15
Greenstone
GreenstoneSerpentine
Mélange
Casing deformation zones
Steam entry
NESW
300
0
-300
-600
-900
600
900E
leva
tion
(m
)
-18-
Near-Surface Microearthquakes at The Geysers
Figure 4. Cumulative event count from August 18 to November 13, 1998 forevents within ~500 m of the array (S - P arrival time difference < 100 msec).
240
200
150
100
50
0260 280 300 320
Julian Day, 1998
Eve
nt C
ount
S–P <100 ms
-19-

Near-Surface Microearthquakes at The Geysers
Figure 5. Example of a high-quality, shallowmicroearthquake recorded on downhole sonde S5.
-20-
Near-Surface Microearthquakes at The Geysers
Figure 6. Map view of 248 microearthquakes detected on the downhole array in63-29 and surrounding surface stations. The monitor well and surface stationsare shown as larger shaded circles. These hypocenters had rms travel timeresiduals≤ 5 msec and location errors less than 60m. Every fifth error ellipsoidprojection is shown as dashed ellipses to show representative location errors.Two sub-clusters of locations are displayed as shaded square and trianglesymbols and were identified based on the depth view shown in Figure 7. Allother hypocenters are shown as open circles.
123600
123900
124200
124500 N
orth
Sta
te P
lane
Coo
rdin
ate
(m)
542700 543000 543300 543600 543900 544200 East State Plane Coordinate (m)
123600
123900
124200
124500 N
orth
Sta
te P
lane
Coo
rdin
ate
(m)
542700 543000 543300 543600 543900 544200 East State Plane Coordinate (m)
123600
123900
124200
124500 N
orth
Sta
te P
lane
Coo
rdin
ate
(m)
542700 543000 543300 543600 543900 544200 East State Plane Coordinate (m)
123600
123900
124200
124500 N
orth
Sta
te P
lane
Coo
rdin
ate
(m)
542700 543000 543300 543600 543900 544200 East State Plane Coordinate (m)
63-29
SG
CC
NNXX
-21-
Near-Surface Microearthquakes at The Geysers
Figure 7. Depth locations of events projected onto a plane oriented 130° azimuth(viewing at N40E). Well GDCF 63-29 trace is shown. The open diamondsymbols are the downhole and surface stations used. Two hypocenter groups areidentified based on this projection and are distinguished by the shaded squareand triangle symbols. All other hypocenters are shown as open circles. The mapview of these same groups are shown in Figure 6 for a 3-dimensional visual aid.Top of reservoir is at about -180 m. Every fifth error ellipsoid projection isshown as dashed ellipses to show representative location errors.
-450
-300
-150
0
150
300
450
600
750E
leva
tion
(m)
-900 -600 -300 0 300 600 900Distance (m) from GDCF 63-29 at 130 degrees
-450
-300
-150
0
150
300
450
600
750E
leva
tion
(m)
-900 -600 -300 0 300 600 900Distance (m) from GDCF 63-29 at 130 degrees
-450
-300
-150
0
150
300
450
600
750E
leva
tion
(m)
-900 -600 -300 0 300 600 900Distance (m) from GDCF 63-29 at 130 degrees
-450
-300
-150
0
150
300
450
600
750E
leva
tion
(m)
-900 -600 -300 0 300 600 900Distance (m) from GDCF 63-29 at 130 degrees
NW SE
-22-
Near-Surface Microearthquakes at The Geysers
Figure 8. Depth locations of events projected onto a plane oriented N30E(viewing at N60W). Well GDCF 63-29 trace is shown. The open diamondsymbols are the downhole and surface stations used. The dashed lines mark theapproximate top and bottom contacts of a serpentine unit (as seen in Figure 3).Top of reservoir is at about -180 m elevation. Every fifth error ellipsoidprojection is shown as dashed ellipses to show representative location errors.
-450
-300
-150
0
150
300
450
600
750E
leva
tion
(m)
-900 -600 -300 0 300 600 900Distance (m) from GDCF 63-29 at 030 degrees
-450
-300
-150
0
150
300
450
600
750E
leva
tion
(m)
-900 -600 -300 0 300 600 900Distance (m) from GDCF 63-29 at 030 degrees
SW NE
Serpentine Unit
Serpentine Unit
Serpentine Unit
Serpentine Unit
Serpentine Unit
Serpentine Unit
Serpentine Unit
Serpentine Unit
-23-
Near-Surface Microearthquakes at The Geysers
Figure 9. Cumulative injection volume in the study area and the cumulativeevent counts for the downhole detected events within about 750 m of the arrayand the U-N-T surface-array events with epicenters within 750 m of themonitor-well wellhead. Figure 2 shows the injection wells and the commonepicenter area. Figure 10 shows the depth distribution of the two distinctpopulations of events; the downhole events consider for analysis (S - P arrivaltime ≤ 150 msec) occur predominantly within the overburden, whereas thelarger, wider-distributed surface array detects the deeper, higher-energyreservoir events. Injection in the area was ongoing prior to day 266, butcomplete records were not available. Both the reservoir and overburdenmicroseismicity increase within about one week of the increased injection rateat day 380.
150000
0
300000
450000
600000
750000
Cum
ulat
ive
Inje
ctio
n (m
3 )
240 270 300 330 360 390 420
Julian Day, 1998
1200
1000
800
600
400
200
0
U–N
–T E
vent
Cou
nt
Dow
nhol
e E
vent
Cou
nt
350
300
250
200
150
100
50
0
Injection
Shallow Downhole MEQs
U–N–TMEQs
-24-
Near-Surface Microearthquakes at The Geysers
Figure 10. Depth distribution of microearthquakes detected on the U-N-Tsurface array at The Geysers and the shallow, downhole array in well 63-29.These are events with epicenters within the map area of Figure 2, over thecommon time interval January 6 to March 16, 1999. The near-array eventsconsider for analysis from the downhole array (S - P arrival time≤ 150 msec)are predominantly within the overburden, whereas the larger, wider-distributedsurface array detects only the deeper, higher-energy reservoir events. Top ofreservoir for this area is at about-180 m elevation.
Ele
vatio
n (m
)
0 5 10 15 20 25 30 35 40Number of Events
Downholenear-arrayMEQs
U–N–T MEQs
600
0
-600
-1200
-1800
-2400
-3000
-25-
Near-Surface Microearthquakes at The Geysers
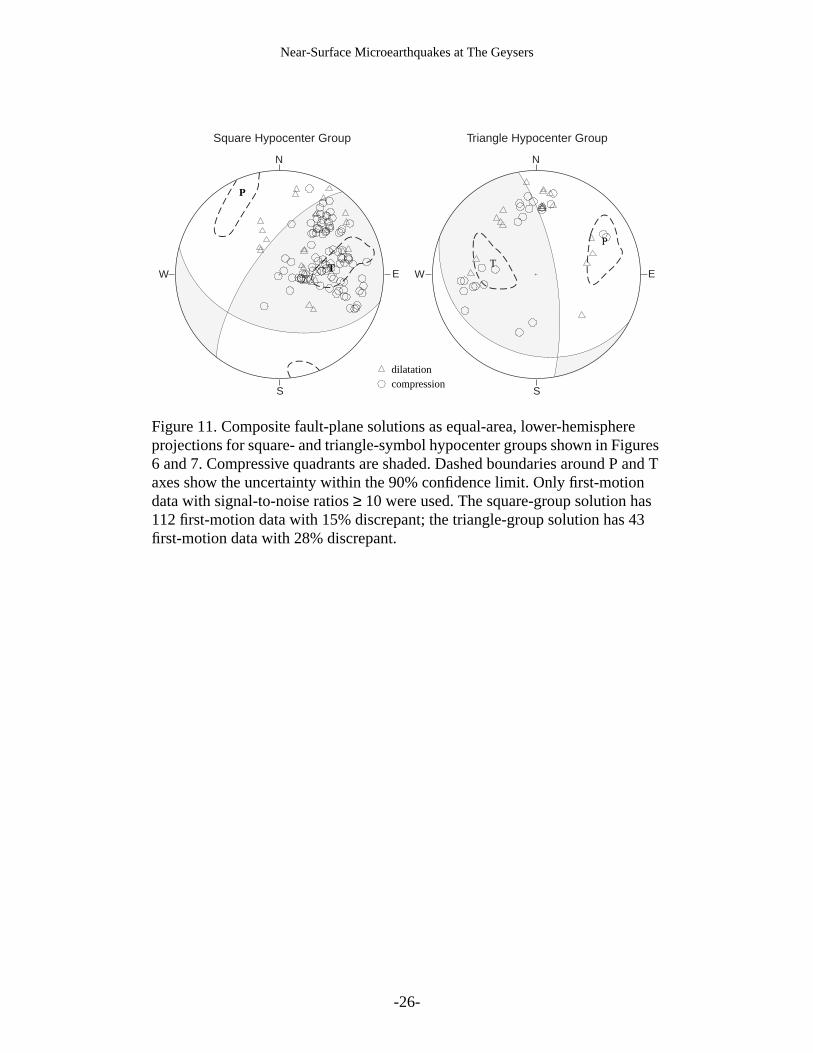
Figure 11. Composite fault-plane solutions as equal-area, lower-hemisphereprojections for square- and triangle-symbol hypocenter groups shown in Figures6 and 7. Compressive quadrants are shaded. Dashed boundaries around P and Taxes show the uncertainty within the 90% confidence limit. Only first-motiondata with signal-to-noise ratios≥ 10 were used. The square-group solution has112 first-motion data with 15% discrepant; the triangle-group solution has 43first-motion data with 28% discrepant.
compressiondilatation
T
P
E
N
W
S
T
P
E
N
W
S
Square Hypocenter Group Triangle Hypocenter Group
-26-