needs assessment reporting template - - adelaide phn€¦ · one example is working collaboratively...
TRANSCRIPT
2017/18 Adelaide PHN Core Flexible Needs Assessment Update
Department of Health PRIMARY HEALTH NETWORKS Needs Assessment reporting template
March 2016 (Updated)
Page 1
Primary Health Network Needs Assessment Reporting Template – Core Flexible
Name of Primary Health Network
Adelaide PHN
When submitting this Needs Assessment Report to the Department of
Health, the PHN must ensure that all internal clearances have been
obtained and the Report has been endorsed by the CEO.
Submitted 15 November 2017
2017/18 Adelaide PHN Core Flexible Needs Assessment Update
Department of Health PRIMARY HEALTH NETWORKS Needs Assessment reporting template
March 2016 (Updated)
Page 2
Section 1 – Narratives This section provides brief narratives on the process and key issues relating to the
update to the Adelaide PHN (APHN) Baseline Needs Assessment (BNA) Update for the
Core & Flexible Funding submitted in November 2016.
Needs Assessment process and issues
The Adelaide Primary Health Network (PHN) acknowledge the Kaurna peoples who are the
Traditional Custodians of the Adelaide Region. We pay tribute to their physical and spiritual
connection to land, waters and community, enduring now as it has been throughout time. We
pay respect to them, their culture and to Elders past, present and future.
The term “Aboriginal” is used respectively in this document as an all -encompassing term for
Aboriginal and Torres Strait Islander people and culture. The term “Indigenous” is used in this
document in line with how the data is presented to Adelaide PHN.
An iterative engagement and consultation process forms the basis to the Adelaide PHN (APHN)
ethos. Our membership group model comprising our geographically aligned clinical and
community advisory councils and seven Health Priority Groups (Mental Health, Aboriginal
Health, Consumers and Carers, Disability, Childhood and Youth, Older People and Aged Care,
and Palliative Care) are essential to this process. Together with our Board, they bring together
a diverse range of experience and knowledge informing our evidence based planning process
to determine the local needs and priorities of our catchment area.
The Baseline Needs Assessments (BNA) Update submitted in November 2016 collated
consultations including dedicated workshops on Mental Health and Alcohol & Other Drugs
(AOD), alongside community workshops and input from our Clinical and Community Advisory
Councils and Health Priority Groups. The November 2016 BNA Update (template) included
both the Mental Health and Suicide Prevention and AOD BNA Updates. The four strategic
priorities identified by the APHN membership groups: (1) Timely Access and Equity, (2) Health
Literacy and Education, (3) Care Coordination, Integration and Navigation, and (4) Mental
Health, Alcohol & Other Drugs and Physical co-morbidities, have been incorporated into the
BNA Updates and as key issues in this reporting template.
Using the BNA Update template as a reference document, Primary Health Networks (PHNs)
have been tasked to develop three separate Needs Assessments; (i) Core Flexible
(Commonwealth Department of Health PHN funding schedule name), (ii) Mental Health and
Suicide Prevention and (iii) AOD, for submission in November 2017. Additionally, PHNs are to
analyse (any new) information and or trends since submitting the November 2016 assessment
and update the identified needs and priorities accordingly.
This template is called the 2017/18 Adelaide PHN Core Flexible Needs Assessment Update.
Any new information in Sections 2 to 4 of the template are highlighted in red front. The APHN
has also taken this opportunity to refine the information, specifically the outcomes of the health
and service needs analysis, by articulating clearly the key issue and identified need to (better)
reflect each Needs Assessments template. Nevertheless, the APHN BNA Update process
(consultations, health and service needs analysis and priorities setting) was extensive and
comprehensive.
The APHN established an internal working group to oversee the methodology and completion
of the Needs Assessment Update (NA Update). The (triangulation) process has identified no
2017/18 Adelaide PHN Core Flexible Needs Assessment Update
Department of Health PRIMARY HEALTH NETWORKS Needs Assessment reporting template
March 2016 (Updated)
Page 3
new priorities for the 2017/18 APHN Core Flexible NA Update. The previously reported twenty-
eight (28) priorities from the BNA Update have been deemed warranted as they encapsulate
new information (both quantitative and qualitative) presented in this NA Update. In addition to
this, the APHN has been actively involved in several State and research institution based
projects and initiatives to understand the health needs of the community and work in partnership
to improve the health and wellbeing of vulnerable population in our region. One example is
working collaboratively with Country SA PHN, SA Health and Health Performance Council in
developing a South Australian version of the Grattan Institute report to identify (potentially
preventable hospitalisations) hotspots of health inequality in both PHNs. Another is being an
active member of the South Australia Aboriginal Chronic Disease Consortium in developing a
common road map in addressing disparities in chronic disease focusing specifically on
diabetes, cancer and heart and stroke in Aboriginal people in South Australia. Finally, in strong
and mutual partnership with Country SA PHN and SA Health, the APHN will be implementing
HealthPathways across South Australia to support consistent care by using a standardised
approach to the management of health conditions to ensure patients receive consistent,
accessible, quality and timely care.
The APHN will be working collaboratively with our stakeholders and partners including
commissioned service providers to refine and improve service delivery to reflect the identified
needs and priorities through our commissioning, monitoring and evaluation processes.
Additional Data Needs and Gaps
Most of the data available on the Commonwealth’s PHN website provided sufficient base
reference for the APHN to analyse the health and service needs of its catchment. Important
for effective commissioning of localised programs and initiatives to meet the needs of identified
vulnerable populations requires a lower level data granularity (geographic and
population/demographic). At a geographic level, Statistical Area Level 2 data is preferred, and
while the Commonwealth provides (MBS/PBS) data by Statistical Area Level 3, for in-depth
service mapping e.g. access to After-hours services, we require MBS (all item numbers
including psychiatry services) and PBS data for both client location and provider location.
Further access to data specific to Aboriginal and Torres Strait Islander people and Culturally
and Linguistically Diverse (CALD) people will provide additional insight into the needs of the
Adelaide metropolitan community.
Access to after-hours deputising service data (e.g. time of visits, type of diagnosis, location of
patients and referral and follow-up pathways to primary and acute health care services) will
provide further insight in understanding the health and service gap to provide targeted services
in our region.
Additional comments or feedback
Nil
2017/18 Adelaide PHN Core Flexible Needs Assessment Update
Department of Health PRIMARY HEALTH NETWORKS Needs Assessment reporting template
March 2016 (Updated)
Page 4
Section 2 – Outcomes of the health needs analysis Since submitting the (Core Flexible Funding) Baseline Needs Assessment (BNA) Update in November 2016, the APHN has analysed relevant
recent quantitative data and undertaken consultations with stakeholders to further investigate and refine the health needs. The following health
needs (in red font) refine and or supplement previously identified needs from the BNA Update.
Outcomes of the health needs analysis
Identified Need Key Issue Description of Evidence Source
Chronic conditions
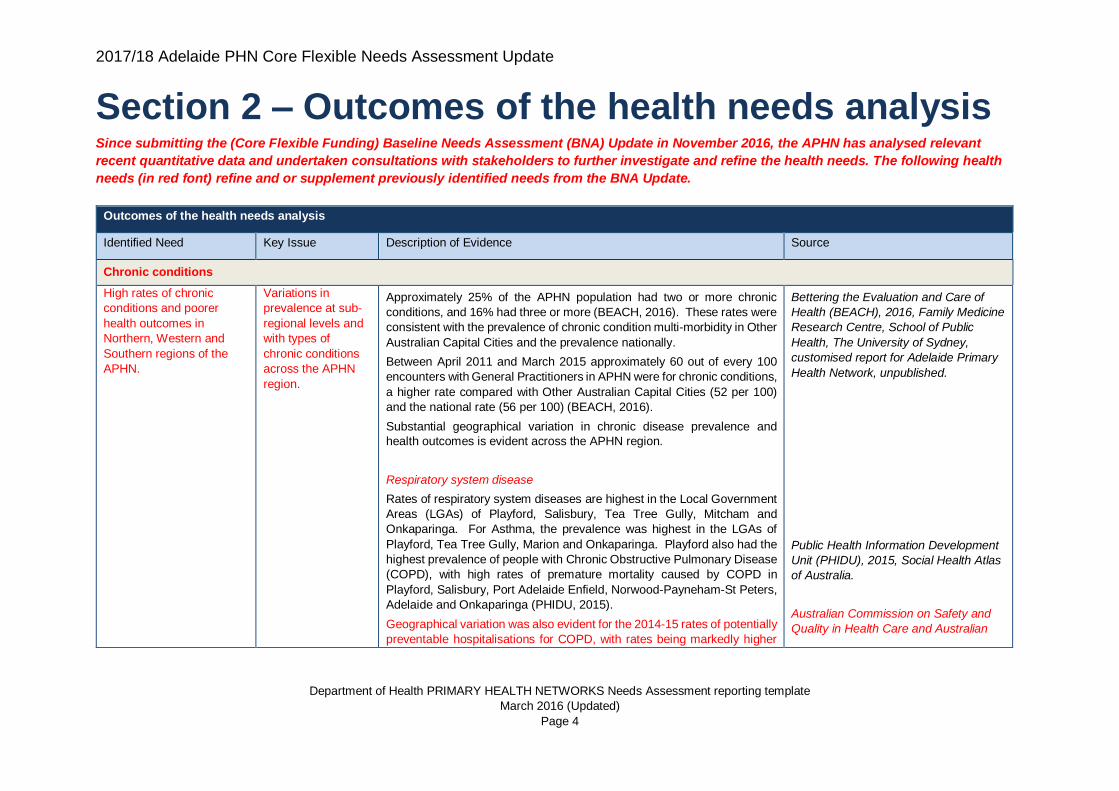
High rates of chronic
conditions and poorer
health outcomes in
Northern, Western and
Southern regions of the
APHN.
Variations in
prevalence at sub-
regional levels and
with types of
chronic conditions
across the APHN
region.
Approximately 25% of the APHN population had two or more chronic
conditions, and 16% had three or more (BEACH, 2016). These rates were
consistent with the prevalence of chronic condition multi-morbidity in Other
Australian Capital Cities and the prevalence nationally.
Between April 2011 and March 2015 approximately 60 out of every 100
encounters with General Practitioners in APHN were for chronic conditions,
a higher rate compared with Other Australian Capital Cities (52 per 100)
and the national rate (56 per 100) (BEACH, 2016).
Substantial geographical variation in chronic disease prevalence and
health outcomes is evident across the APHN region.
Respiratory system disease
Rates of respiratory system diseases are highest in the Local Government
Areas (LGAs) of Playford, Salisbury, Tea Tree Gully, Mitcham and
Onkaparinga. For Asthma, the prevalence was highest in the LGAs of
Playford, Tea Tree Gully, Marion and Onkaparinga. Playford also had the
highest prevalence of people with Chronic Obstructive Pulmonary Disease
(COPD), with high rates of premature mortality caused by COPD in
Playford, Salisbury, Port Adelaide Enfield, Norwood-Payneham-St Peters,
Adelaide and Onkaparinga (PHIDU, 2015).
Geographical variation was also evident for the 2014-15 rates of potentially
preventable hospitalisations for COPD, with rates being markedly higher
Bettering the Evaluation and Care of
Health (BEACH), 2016, Family Medicine
Research Centre, School of Public
Health, The University of Sydney,
customised report for Adelaide Primary
Health Network, unpublished.
Public Health Information Development
Unit (PHIDU), 2015, Social Health Atlas
of Australia.
Australian Commission on Safety and
Quality in Health Care and Australian
2017/18 Adelaide PHN Core Flexible Needs Assessment Update
Department of Health PRIMARY HEALTH NETWORKS Needs Assessment reporting template
March 2016 (Updated)
Page 5
Outcomes of the health needs analysis
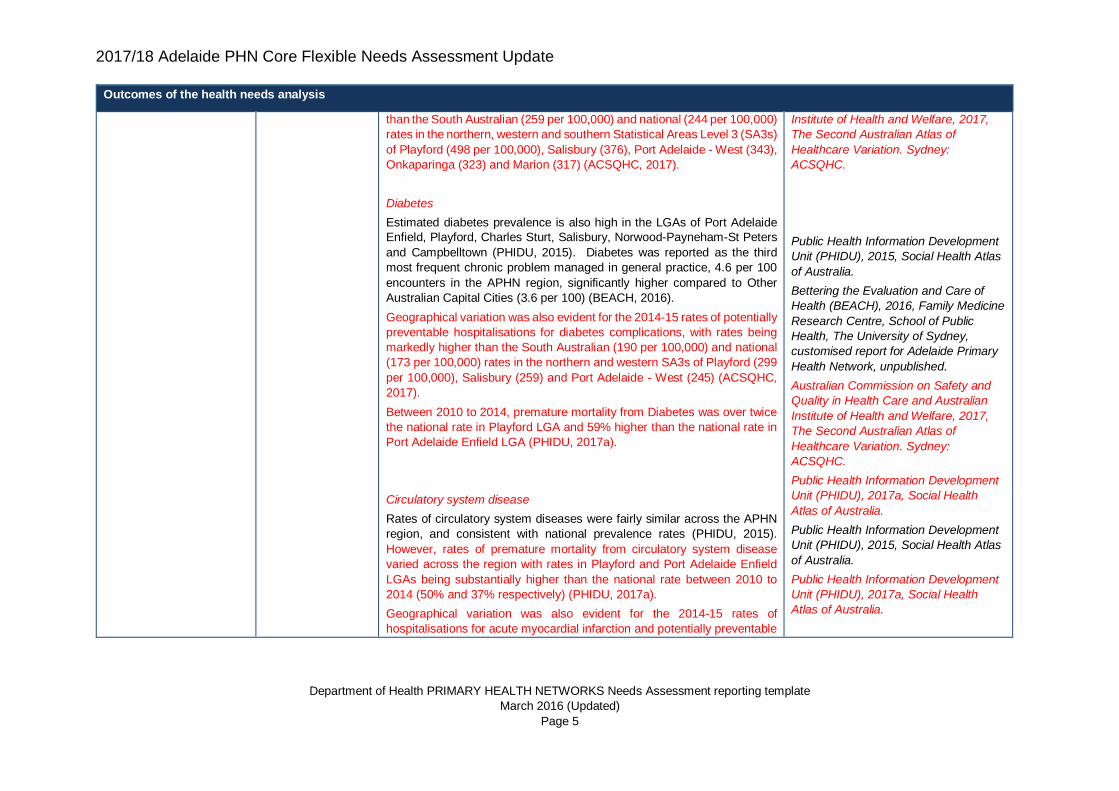
than the South Australian (259 per 100,000) and national (244 per 100,000)
rates in the northern, western and southern Statistical Areas Level 3 (SA3s)
of Playford (498 per 100,000), Salisbury (376), Port Adelaide - West (343),
Onkaparinga (323) and Marion (317) (ACSQHC, 2017).
Diabetes
Estimated diabetes prevalence is also high in the LGAs of Port Adelaide
Enfield, Playford, Charles Sturt, Salisbury, Norwood-Payneham-St Peters
and Campbelltown (PHIDU, 2015). Diabetes was reported as the third
most frequent chronic problem managed in general practice, 4.6 per 100
encounters in the APHN region, significantly higher compared to Other
Australian Capital Cities (3.6 per 100) (BEACH, 2016).
Geographical variation was also evident for the 2014-15 rates of potentially
preventable hospitalisations for diabetes complications, with rates being
markedly higher than the South Australian (190 per 100,000) and national
(173 per 100,000) rates in the northern and western SA3s of Playford (299
per 100,000), Salisbury (259) and Port Adelaide - West (245) (ACSQHC,
2017).
Between 2010 to 2014, premature mortality from Diabetes was over twice
the national rate in Playford LGA and 59% higher than the national rate in
Port Adelaide Enfield LGA (PHIDU, 2017a).
Circulatory system disease
Rates of circulatory system diseases were fairly similar across the APHN
region, and consistent with national prevalence rates (PHIDU, 2015).
However, rates of premature mortality from circulatory system disease
varied across the region with rates in Playford and Port Adelaide Enfield
LGAs being substantially higher than the national rate between 2010 to
2014 (50% and 37% respectively) (PHIDU, 2017a).
Geographical variation was also evident for the 2014-15 rates of
hospitalisations for acute myocardial infarction and potentially preventable
Institute of Health and Welfare, 2017,
The Second Australian Atlas of
Healthcare Variation. Sydney:
ACSQHC.
Public Health Information Development
Unit (PHIDU), 2015, Social Health Atlas
of Australia.
Bettering the Evaluation and Care of
Health (BEACH), 2016, Family Medicine
Research Centre, School of Public
Health, The University of Sydney,
customised report for Adelaide Primary
Health Network, unpublished.
Australian Commission on Safety and
Quality in Health Care and Australian
Institute of Health and Welfare, 2017,
The Second Australian Atlas of
Healthcare Variation. Sydney:
ACSQHC.
Public Health Information Development
Unit (PHIDU), 2017a, Social Health
Atlas of Australia.
Public Health Information Development
Unit (PHIDU), 2015, Social Health Atlas
of Australia.
Public Health Information Development
Unit (PHIDU), 2017a, Social Health
Atlas of Australia.
2017/18 Adelaide PHN Core Flexible Needs Assessment Update
Department of Health PRIMARY HEALTH NETWORKS Needs Assessment reporting template
March 2016 (Updated)
Page 6
Outcomes of the health needs analysis
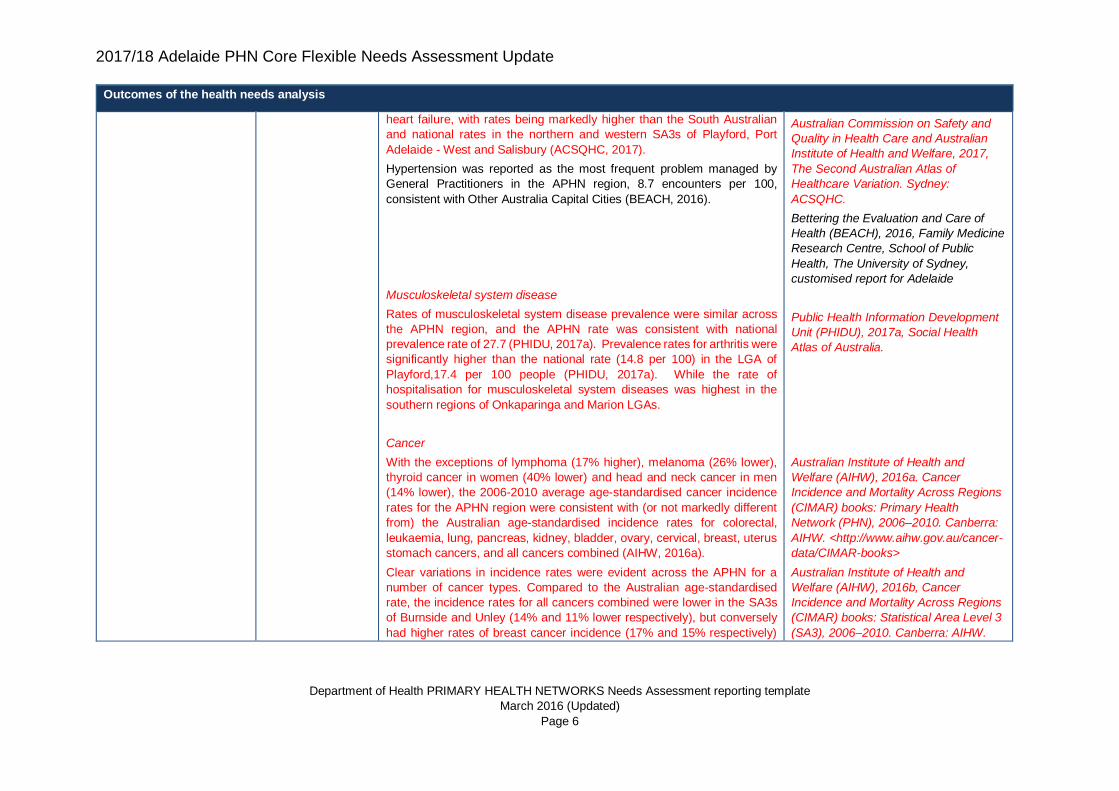
heart failure, with rates being markedly higher than the South Australian
and national rates in the northern and western SA3s of Playford, Port
Adelaide - West and Salisbury (ACSQHC, 2017).
Hypertension was reported as the most frequent problem managed by
General Practitioners in the APHN region, 8.7 encounters per 100,
consistent with Other Australia Capital Cities (BEACH, 2016).
Musculoskeletal system disease
Rates of musculoskeletal system disease prevalence were similar across
the APHN region, and the APHN rate was consistent with national
prevalence rate of 27.7 (PHIDU, 2017a). Prevalence rates for arthritis were
significantly higher than the national rate (14.8 per 100) in the LGA of
Playford,17.4 per 100 people (PHIDU, 2017a). While the rate of
hospitalisation for musculoskeletal system diseases was highest in the
southern regions of Onkaparinga and Marion LGAs.
Cancer
With the exceptions of lymphoma (17% higher), melanoma (26% lower),
thyroid cancer in women (40% lower) and head and neck cancer in men
(14% lower), the 2006-2010 average age-standardised cancer incidence
rates for the APHN region were consistent with (or not markedly different
from) the Australian age-standardised incidence rates for colorectal,
leukaemia, lung, pancreas, kidney, bladder, ovary, cervical, breast, uterus
stomach cancers, and all cancers combined (AIHW, 2016a).
Clear variations in incidence rates were evident across the APHN for a
number of cancer types. Compared to the Australian age-standardised
rate, the incidence rates for all cancers combined were lower in the SA3s
of Burnside and Unley (14% and 11% lower respectively), but conversely
had higher rates of breast cancer incidence (17% and 15% respectively)
Australian Commission on Safety and
Quality in Health Care and Australian
Institute of Health and Welfare, 2017,
The Second Australian Atlas of
Healthcare Variation. Sydney:
ACSQHC.
Bettering the Evaluation and Care of
Health (BEACH), 2016, Family Medicine
Research Centre, School of Public
Health, The University of Sydney,
customised report for Adelaide
Public Health Information Development
Unit (PHIDU), 2017a, Social Health
Atlas of Australia.
Australian Institute of Health and
Welfare (AIHW), 2016a. Cancer
Incidence and Mortality Across Regions
(CIMAR) books: Primary Health
Network (PHN), 2006–2010. Canberra:
AIHW. <http://www.aihw.gov.au/cancer-
data/CIMAR-books>
Australian Institute of Health and
Welfare (AIHW), 2016b, Cancer
Incidence and Mortality Across Regions
(CIMAR) books: Statistical Area Level 3
(SA3), 2006–2010. Canberra: AIHW.
2017/18 Adelaide PHN Core Flexible Needs Assessment Update
Department of Health PRIMARY HEALTH NETWORKS Needs Assessment reporting template
March 2016 (Updated)
Page 7
Outcomes of the health needs analysis
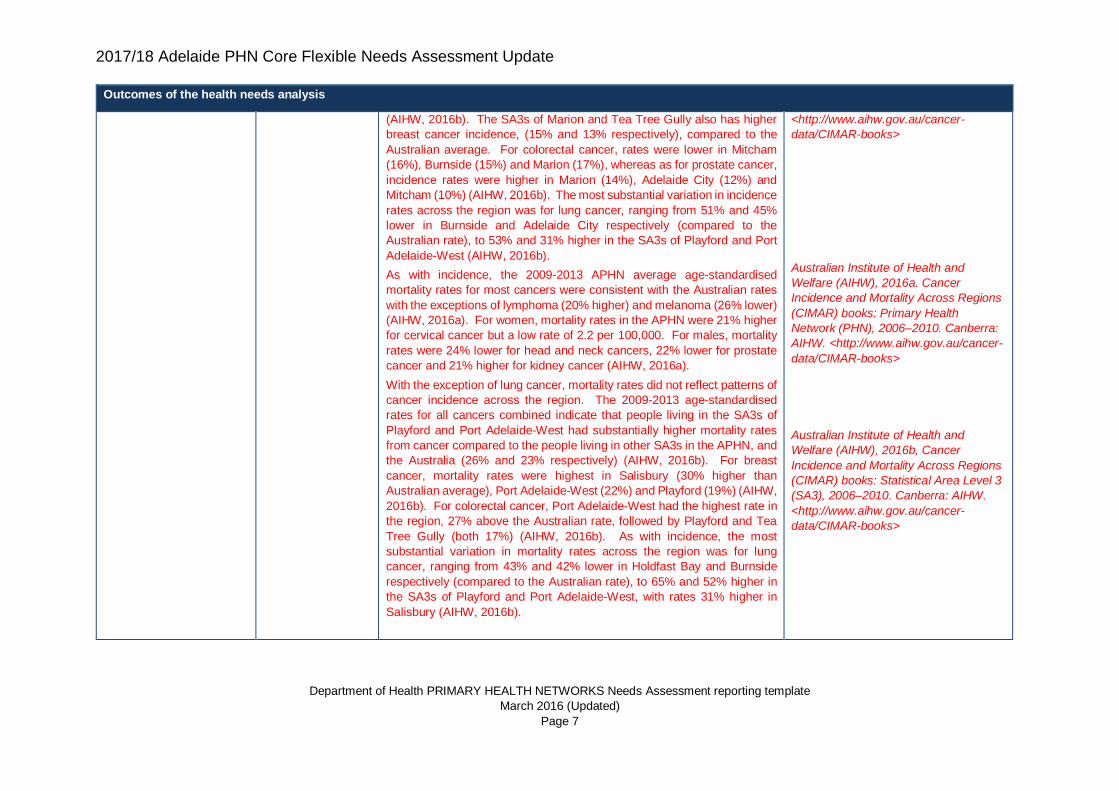
(AIHW, 2016b). The SA3s of Marion and Tea Tree Gully also has higher
breast cancer incidence, (15% and 13% respectively), compared to the
Australian average. For colorectal cancer, rates were lower in Mitcham
(16%), Burnside (15%) and Marion (17%), whereas as for prostate cancer,
incidence rates were higher in Marion (14%), Adelaide City (12%) and
Mitcham (10%) (AIHW, 2016b). The most substantial variation in incidence
rates across the region was for lung cancer, ranging from 51% and 45%
lower in Burnside and Adelaide City respectively (compared to the
Australian rate), to 53% and 31% higher in the SA3s of Playford and Port
Adelaide-West (AIHW, 2016b).
As with incidence, the 2009-2013 APHN average age-standardised
mortality rates for most cancers were consistent with the Australian rates
with the exceptions of lymphoma (20% higher) and melanoma (26% lower)
(AIHW, 2016a). For women, mortality rates in the APHN were 21% higher
for cervical cancer but a low rate of 2.2 per 100,000. For males, mortality
rates were 24% lower for head and neck cancers, 22% lower for prostate
cancer and 21% higher for kidney cancer (AIHW, 2016a).
With the exception of lung cancer, mortality rates did not reflect patterns of
cancer incidence across the region. The 2009-2013 age-standardised
rates for all cancers combined indicate that people living in the SA3s of
Playford and Port Adelaide-West had substantially higher mortality rates
from cancer compared to the people living in other SA3s in the APHN, and
the Australia (26% and 23% respectively) (AIHW, 2016b). For breast
cancer, mortality rates were highest in Salisbury (30% higher than
Australian average), Port Adelaide-West (22%) and Playford (19%) (AIHW,
2016b). For colorectal cancer, Port Adelaide-West had the highest rate in
the region, 27% above the Australian rate, followed by Playford and Tea
Tree Gully (both 17%) (AIHW, 2016b). As with incidence, the most
substantial variation in mortality rates across the region was for lung
cancer, ranging from 43% and 42% lower in Holdfast Bay and Burnside
respectively (compared to the Australian rate), to 65% and 52% higher in
the SA3s of Playford and Port Adelaide-West, with rates 31% higher in
Salisbury (AIHW, 2016b).
<http://www.aihw.gov.au/cancer-
data/CIMAR-books>
Australian Institute of Health and
Welfare (AIHW), 2016a. Cancer
Incidence and Mortality Across Regions
(CIMAR) books: Primary Health
Network (PHN), 2006–2010. Canberra:
AIHW. <http://www.aihw.gov.au/cancer-
data/CIMAR-books>
Australian Institute of Health and
Welfare (AIHW), 2016b, Cancer
Incidence and Mortality Across Regions
(CIMAR) books: Statistical Area Level 3
(SA3), 2006–2010. Canberra: AIHW.
<http://www.aihw.gov.au/cancer-
data/CIMAR-books>
2017/18 Adelaide PHN Core Flexible Needs Assessment Update
Department of Health PRIMARY HEALTH NETWORKS Needs Assessment reporting template
March 2016 (Updated)
Page 8
Outcomes of the health needs analysis
Child & Youth Health
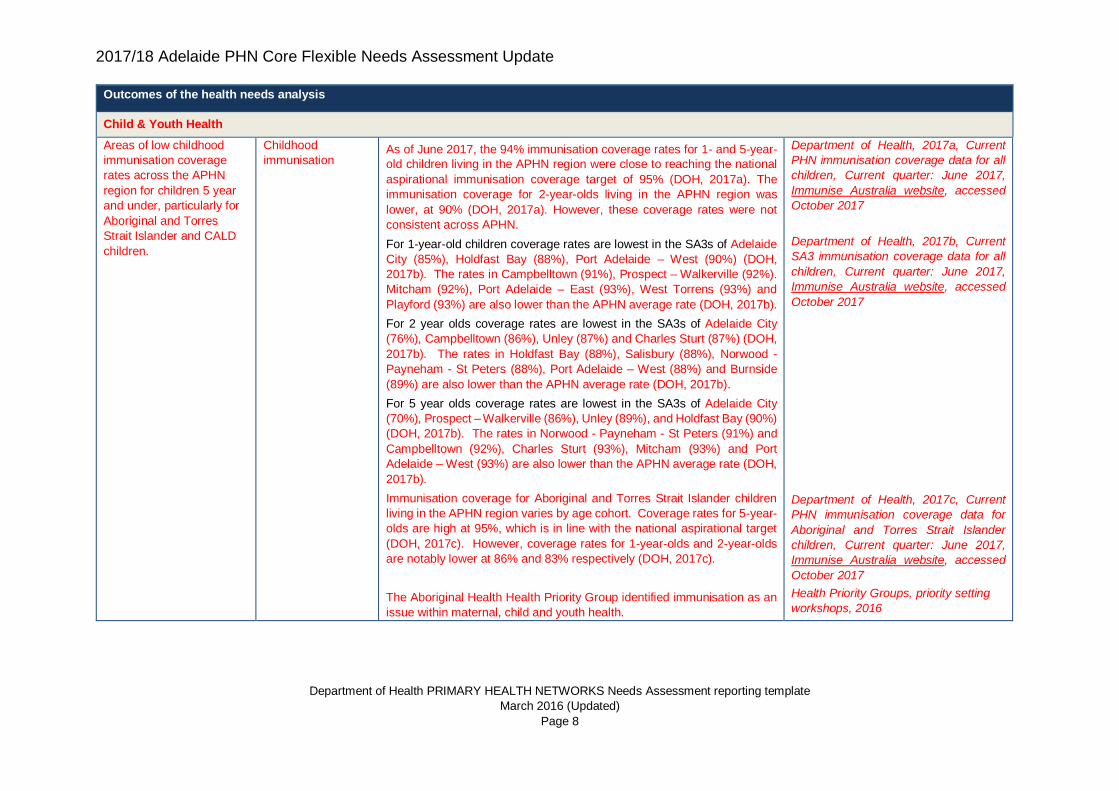
Areas of low childhood
immunisation coverage
rates across the APHN
region for children 5 year
and under, particularly for
Aboriginal and Torres
Strait Islander and CALD
children.
Childhood
immunisation
As of June 2017, the 94% immunisation coverage rates for 1- and 5-year-
old children living in the APHN region were close to reaching the national
aspirational immunisation coverage target of 95% (DOH, 2017a). The
immunisation coverage for 2-year-olds living in the APHN region was
lower, at 90% (DOH, 2017a). However, these coverage rates were not
consistent across APHN.
For 1-year-old children coverage rates are lowest in the SA3s of Adelaide
City (85%), Holdfast Bay (88%), Port Adelaide – West (90%) (DOH,
2017b). The rates in Campbelltown (91%), Prospect – Walkerville (92%).
Mitcham (92%), Port Adelaide – East (93%), West Torrens (93%) and
Playford (93%) are also lower than the APHN average rate (DOH, 2017b).
For 2 year olds coverage rates are lowest in the SA3s of Adelaide City
(76%), Campbelltown (86%), Unley (87%) and Charles Sturt (87%) (DOH,
2017b). The rates in Holdfast Bay (88%), Salisbury (88%), Norwood -
Payneham - St Peters (88%), Port Adelaide – West (88%) and Burnside
(89%) are also lower than the APHN average rate (DOH, 2017b).
For 5 year olds coverage rates are lowest in the SA3s of Adelaide City
(70%), Prospect – Walkerville (86%), Unley (89%), and Holdfast Bay (90%)
(DOH, 2017b). The rates in Norwood - Payneham - St Peters (91%) and
Campbelltown (92%), Charles Sturt (93%), Mitcham (93%) and Port
Adelaide – West (93%) are also lower than the APHN average rate (DOH,
2017b).
Immunisation coverage for Aboriginal and Torres Strait Islander children
living in the APHN region varies by age cohort. Coverage rates for 5-year-
olds are high at 95%, which is in line with the national aspirational target
(DOH, 2017c). However, coverage rates for 1-year-olds and 2-year-olds
are notably lower at 86% and 83% respectively (DOH, 2017c).
The Aboriginal Health Health Priority Group identified immunisation as an
issue within maternal, child and youth health.
Department of Health, 2017a, Current
PHN immunisation coverage data for all
children, Current quarter: June 2017,
Immunise Australia website, accessed
October 2017
Department of Health, 2017b, Current
SA3 immunisation coverage data for all
children, Current quarter: June 2017,
Immunise Australia website, accessed
October 2017
Department of Health, 2017c, Current
PHN immunisation coverage data for
Aboriginal and Torres Strait Islander
children, Current quarter: June 2017,
Immunise Australia website, accessed
October 2017
Health Priority Groups, priority setting
workshops, 2016
2017/18 Adelaide PHN Core Flexible Needs Assessment Update
Department of Health PRIMARY HEALTH NETWORKS Needs Assessment reporting template
March 2016 (Updated)
Page 9
Outcomes of the health needs analysis
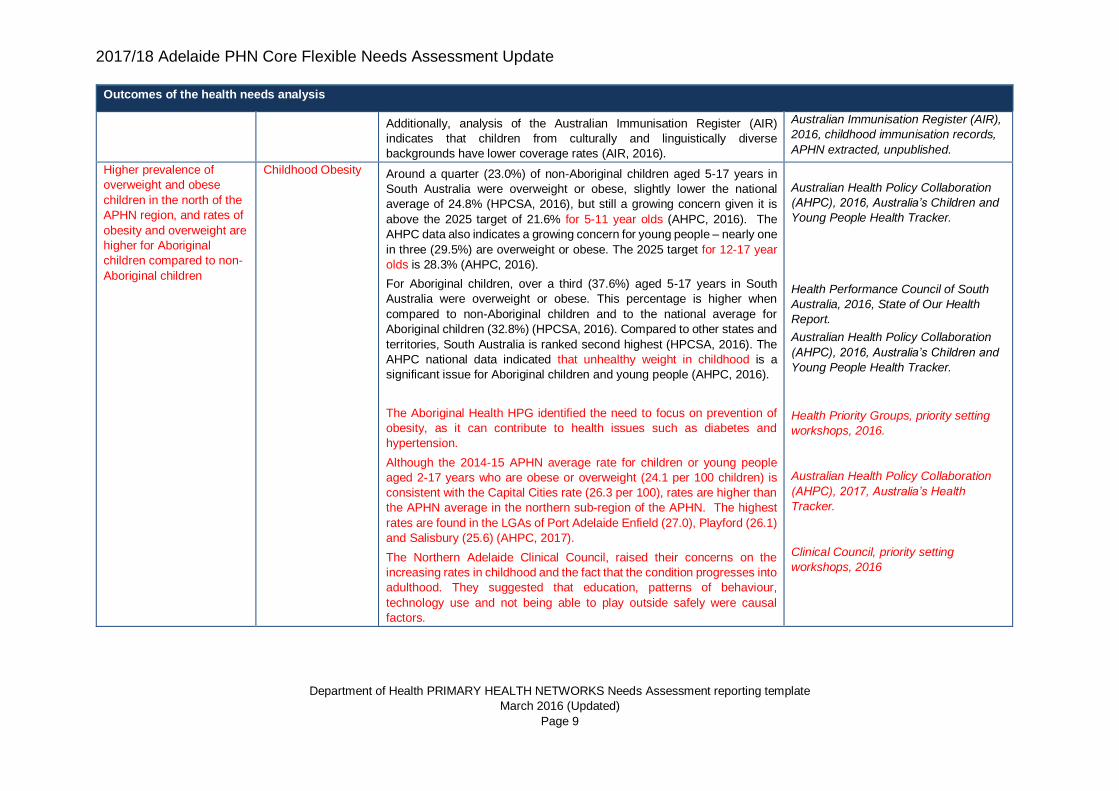
Additionally, analysis of the Australian Immunisation Register (AIR)
indicates that children from culturally and linguistically diverse
backgrounds have lower coverage rates (AIR, 2016).
Australian Immunisation Register (AIR),
2016, childhood immunisation records,
APHN extracted, unpublished.
Higher prevalence of
overweight and obese
children in the north of the
APHN region, and rates of
obesity and overweight are
higher for Aboriginal
children compared to non-
Aboriginal children
Childhood Obesity Around a quarter (23.0%) of non-Aboriginal children aged 5-17 years in
South Australia were overweight or obese, slightly lower the national
average of 24.8% (HPCSA, 2016), but still a growing concern given it is
above the 2025 target of 21.6% for 5-11 year olds (AHPC, 2016). The
AHPC data also indicates a growing concern for young people – nearly one
in three (29.5%) are overweight or obese. The 2025 target for 12-17 year
olds is 28.3% (AHPC, 2016).
For Aboriginal children, over a third (37.6%) aged 5-17 years in South
Australia were overweight or obese. This percentage is higher when
compared to non-Aboriginal children and to the national average for
Aboriginal children (32.8%) (HPCSA, 2016). Compared to other states and
territories, South Australia is ranked second highest (HPCSA, 2016). The
AHPC national data indicated that unhealthy weight in childhood is a
significant issue for Aboriginal children and young people (AHPC, 2016).
The Aboriginal Health HPG identified the need to focus on prevention of
obesity, as it can contribute to health issues such as diabetes and
hypertension.
Although the 2014-15 APHN average rate for children or young people
aged 2-17 years who are obese or overweight (24.1 per 100 children) is
consistent with the Capital Cities rate (26.3 per 100), rates are higher than
the APHN average in the northern sub-region of the APHN. The highest
rates are found in the LGAs of Port Adelaide Enfield (27.0), Playford (26.1)
and Salisbury (25.6) (AHPC, 2017).
The Northern Adelaide Clinical Council, raised their concerns on the
increasing rates in childhood and the fact that the condition progresses into
adulthood. They suggested that education, patterns of behaviour,
technology use and not being able to play outside safely were causal
factors.
Australian Health Policy Collaboration
(AHPC), 2016, Australia’s Children and
Young People Health Tracker.
Health Performance Council of South
Australia, 2016, State of Our Health
Report.
Australian Health Policy Collaboration
(AHPC), 2016, Australia’s Children and
Young People Health Tracker.
Health Priority Groups, priority setting
workshops, 2016.
Australian Health Policy Collaboration
(AHPC), 2017, Australia’s Health
Tracker.
Clinical Council, priority setting
workshops, 2016
2017/18 Adelaide PHN Core Flexible Needs Assessment Update
Department of Health PRIMARY HEALTH NETWORKS Needs Assessment reporting template
March 2016 (Updated)
Page 10
Outcomes of the health needs analysis
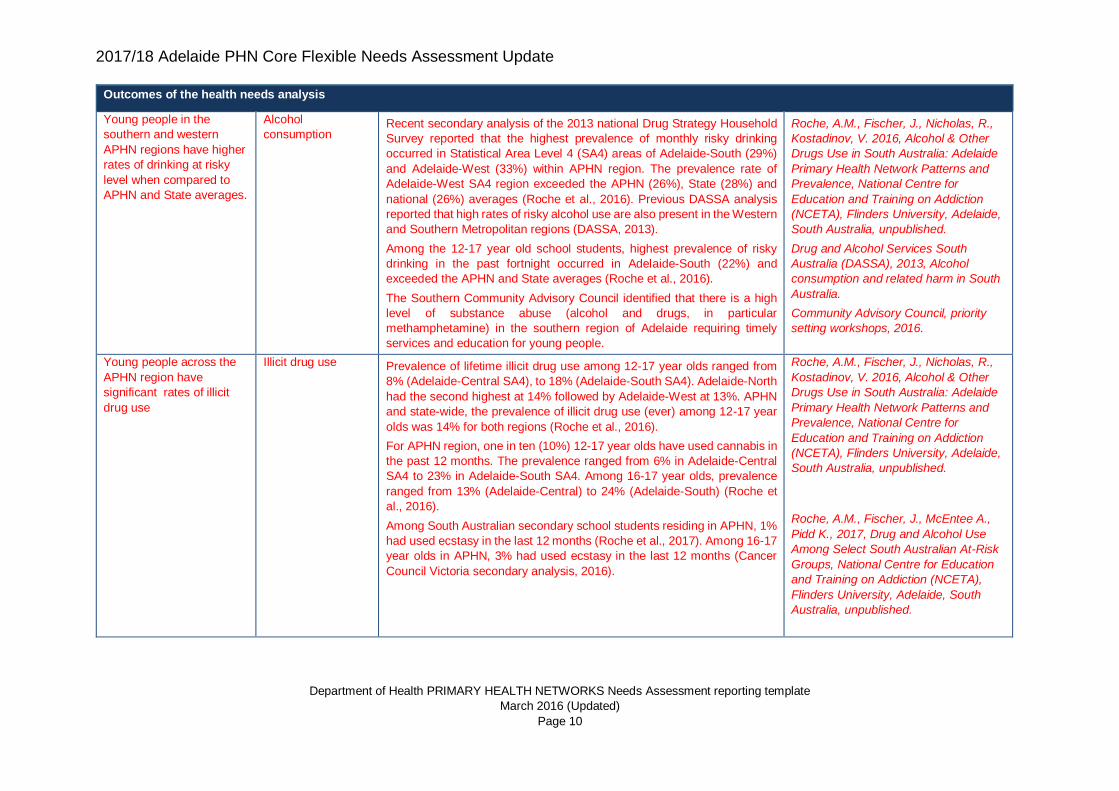
Young people in the
southern and western
APHN regions have higher
rates of drinking at risky
level when compared to
APHN and State averages.
Alcohol
consumption Recent secondary analysis of the 2013 national Drug Strategy Household
Survey reported that the highest prevalence of monthly risky drinking
occurred in Statistical Area Level 4 (SA4) areas of Adelaide-South (29%)
and Adelaide-West (33%) within APHN region. The prevalence rate of
Adelaide-West SA4 region exceeded the APHN (26%), State (28%) and
national (26%) averages (Roche et al., 2016). Previous DASSA analysis
reported that high rates of risky alcohol use are also present in the Western
and Southern Metropolitan regions (DASSA, 2013).
Among the 12-17 year old school students, highest prevalence of risky
drinking in the past fortnight occurred in Adelaide-South (22%) and
exceeded the APHN and State averages (Roche et al., 2016).
The Southern Community Advisory Council identified that there is a high
level of substance abuse (alcohol and drugs, in particular
methamphetamine) in the southern region of Adelaide requiring timely
services and education for young people.
Roche, A.M., Fischer, J., Nicholas, R.,
Kostadinov, V. 2016, Alcohol & Other
Drugs Use in South Australia: Adelaide
Primary Health Network Patterns and
Prevalence, National Centre for
Education and Training on Addiction
(NCETA), Flinders University, Adelaide,
South Australia, unpublished.
Drug and Alcohol Services South
Australia (DASSA), 2013, Alcohol
consumption and related harm in South
Australia.
Community Advisory Council, priority
setting workshops, 2016.
Young people across the
APHN region have
significant rates of illicit
drug use
Illicit drug use Prevalence of lifetime illicit drug use among 12-17 year olds ranged from
8% (Adelaide-Central SA4), to 18% (Adelaide-South SA4). Adelaide-North
had the second highest at 14% followed by Adelaide-West at 13%. APHN
and state-wide, the prevalence of illicit drug use (ever) among 12-17 year
olds was 14% for both regions (Roche et al., 2016).
For APHN region, one in ten (10%) 12-17 year olds have used cannabis in
the past 12 months. The prevalence ranged from 6% in Adelaide-Central
SA4 to 23% in Adelaide-South SA4. Among 16-17 year olds, prevalence
ranged from 13% (Adelaide-Central) to 24% (Adelaide-South) (Roche et
al., 2016).
Among South Australian secondary school students residing in APHN, 1%
had used ecstasy in the last 12 months (Roche et al., 2017). Among 16-17
year olds in APHN, 3% had used ecstasy in the last 12 months (Cancer
Council Victoria secondary analysis, 2016).
Roche, A.M., Fischer, J., Nicholas, R.,
Kostadinov, V. 2016, Alcohol & Other
Drugs Use in South Australia: Adelaide
Primary Health Network Patterns and
Prevalence, National Centre for
Education and Training on Addiction
(NCETA), Flinders University, Adelaide,
South Australia, unpublished.
Roche, A.M., Fischer, J., McEntee A.,
Pidd K., 2017, Drug and Alcohol Use
Among Select South Australian At-Risk
Groups, National Centre for Education
and Training on Addiction (NCETA),
Flinders University, Adelaide, South
Australia, unpublished.
2017/18 Adelaide PHN Core Flexible Needs Assessment Update
Department of Health PRIMARY HEALTH NETWORKS Needs Assessment reporting template
March 2016 (Updated)
Page 11
Outcomes of the health needs analysis
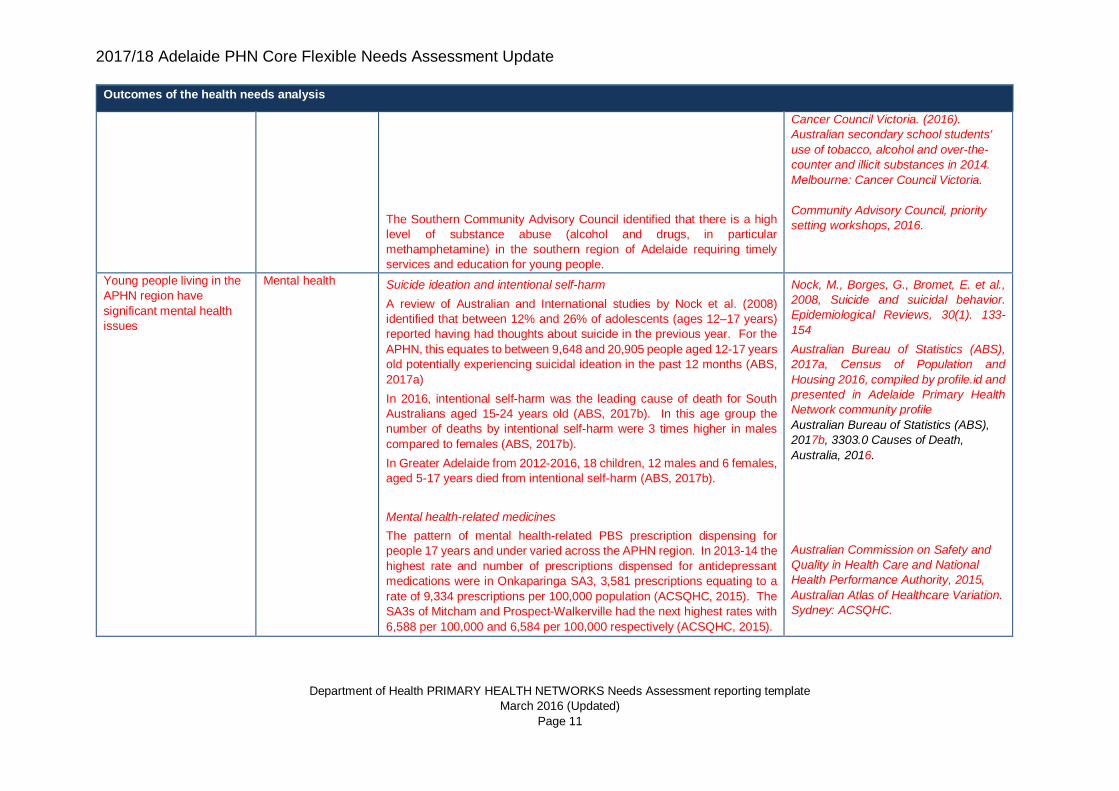
The Southern Community Advisory Council identified that there is a high
level of substance abuse (alcohol and drugs, in particular
methamphetamine) in the southern region of Adelaide requiring timely
services and education for young people.
Cancer Council Victoria. (2016).
Australian secondary school students'
use of tobacco, alcohol and over-the-
counter and illicit substances in 2014.
Melbourne: Cancer Council Victoria.
Community Advisory Council, priority
setting workshops, 2016.
Young people living in the
APHN region have
significant mental health
issues
Mental health Suicide ideation and intentional self-harm
A review of Australian and International studies by Nock et al. (2008)
identified that between 12% and 26% of adolescents (ages 12–17 years)
reported having had thoughts about suicide in the previous year. For the
APHN, this equates to between 9,648 and 20,905 people aged 12-17 years
old potentially experiencing suicidal ideation in the past 12 months (ABS,
2017a)
In 2016, intentional self-harm was the leading cause of death for South
Australians aged 15-24 years old (ABS, 2017b). In this age group the
number of deaths by intentional self-harm were 3 times higher in males
compared to females (ABS, 2017b).
In Greater Adelaide from 2012-2016, 18 children, 12 males and 6 females,
aged 5-17 years died from intentional self-harm (ABS, 2017b).
Mental health-related medicines
The pattern of mental health-related PBS prescription dispensing for
people 17 years and under varied across the APHN region. In 2013-14 the
highest rate and number of prescriptions dispensed for antidepressant
medications were in Onkaparinga SA3, 3,581 prescriptions equating to a
rate of 9,334 prescriptions per 100,000 population (ACSQHC, 2015). The
SA3s of Mitcham and Prospect-Walkerville had the next highest rates with
6,588 per 100,000 and 6,584 per 100,000 respectively (ACSQHC, 2015).
Nock, M., Borges, G., Bromet, E. et al.,
2008, Suicide and suicidal behavior.
Epidemiological Reviews, 30(1). 133-
154
Australian Bureau of Statistics (ABS),
2017a, Census of Population and
Housing 2016, compiled by profile.id and
presented in Adelaide Primary Health
Network community profile
Australian Bureau of Statistics (ABS),
2017b, 3303.0 Causes of Death,
Australia, 2016.
Australian Commission on Safety and
Quality in Health Care and National
Health Performance Authority, 2015,
Australian Atlas of Healthcare Variation.
Sydney: ACSQHC.
2017/18 Adelaide PHN Core Flexible Needs Assessment Update
Department of Health PRIMARY HEALTH NETWORKS Needs Assessment reporting template
March 2016 (Updated)
Page 12
Outcomes of the health needs analysis
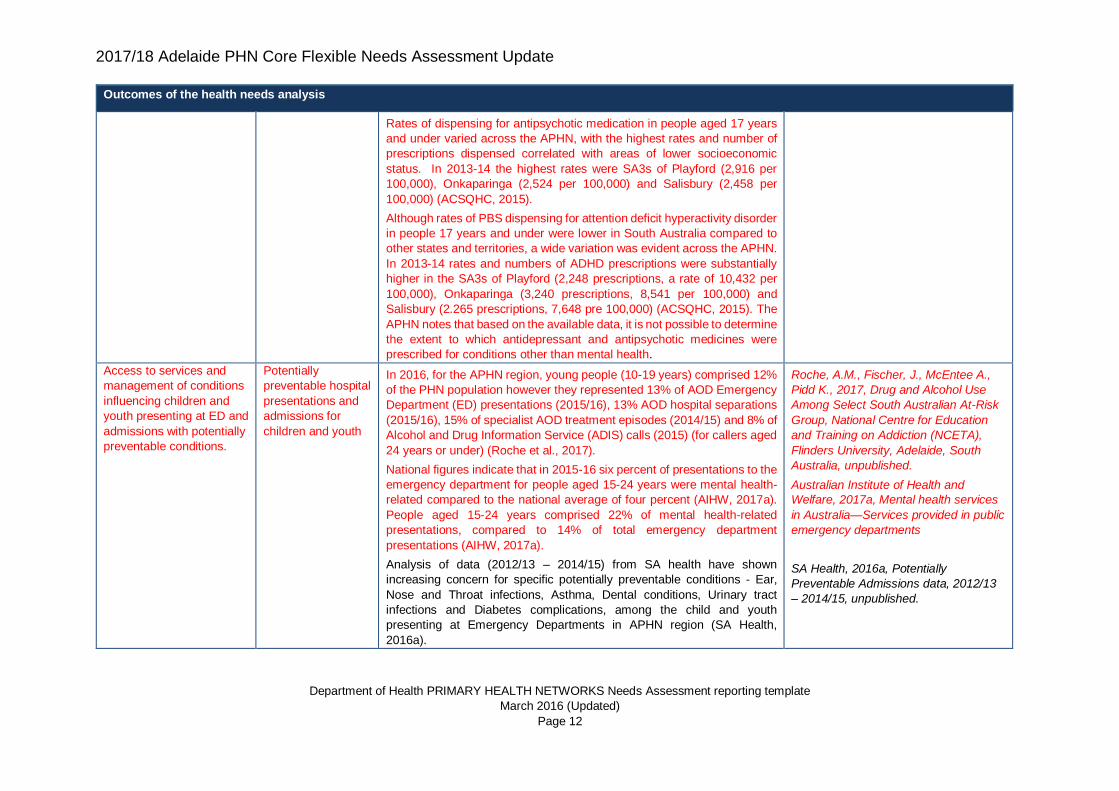
Rates of dispensing for antipsychotic medication in people aged 17 years
and under varied across the APHN, with the highest rates and number of
prescriptions dispensed correlated with areas of lower socioeconomic
status. In 2013-14 the highest rates were SA3s of Playford (2,916 per
100,000), Onkaparinga (2,524 per 100,000) and Salisbury (2,458 per
100,000) (ACSQHC, 2015).
Although rates of PBS dispensing for attention deficit hyperactivity disorder
in people 17 years and under were lower in South Australia compared to
other states and territories, a wide variation was evident across the APHN.
In 2013-14 rates and numbers of ADHD prescriptions were substantially
higher in the SA3s of Playford (2,248 prescriptions, a rate of 10,432 per
100,000), Onkaparinga (3,240 prescriptions, 8,541 per 100,000) and
Salisbury (2.265 prescriptions, 7,648 pre 100,000) (ACSQHC, 2015). The
APHN notes that based on the available data, it is not possible to determine
the extent to which antidepressant and antipsychotic medicines were
prescribed for conditions other than mental health.
Access to services and
management of conditions
influencing children and
youth presenting at ED and
admissions with potentially
preventable conditions.
Potentially
preventable hospital
presentations and
admissions for
children and youth
In 2016, for the APHN region, young people (10-19 years) comprised 12%
of the PHN population however they represented 13% of AOD Emergency
Department (ED) presentations (2015/16), 13% AOD hospital separations
(2015/16), 15% of specialist AOD treatment episodes (2014/15) and 8% of
Alcohol and Drug Information Service (ADIS) calls (2015) (for callers aged
24 years or under) (Roche et al., 2017).
National figures indicate that in 2015-16 six percent of presentations to the
emergency department for people aged 15-24 years were mental health-
related compared to the national average of four percent (AIHW, 2017a).
People aged 15-24 years comprised 22% of mental health-related
presentations, compared to 14% of total emergency department
presentations (AIHW, 2017a).
Analysis of data (2012/13 – 2014/15) from SA health have shown
increasing concern for specific potentially preventable conditions - Ear,
Nose and Throat infections, Asthma, Dental conditions, Urinary tract
infections and Diabetes complications, among the child and youth
presenting at Emergency Departments in APHN region (SA Health,
2016a).
Roche, A.M., Fischer, J., McEntee A.,
Pidd K., 2017, Drug and Alcohol Use
Among Select South Australian At-Risk
Group, National Centre for Education
and Training on Addiction (NCETA),
Flinders University, Adelaide, South
Australia, unpublished.
Australian Institute of Health and
Welfare, 2017a, Mental health services
in Australia—Services provided in public
emergency departments
SA Health, 2016a, Potentially
Preventable Admissions data, 2012/13
– 2014/15, unpublished.
2017/18 Adelaide PHN Core Flexible Needs Assessment Update
Department of Health PRIMARY HEALTH NETWORKS Needs Assessment reporting template
March 2016 (Updated)
Page 13
Outcomes of the health needs analysis
The Aboriginal Health HPG identified ear health and access to screening
and treatment for children as a need.
More than half (52%) of the almost 24,500 Dental Caries potentially
preventable hospitalisations (PPHs) in the past seven years (2007-08 to
2013-14) were for children aged under ten years old (SA Health, 2015a).
Between July 2012 and June 2014, a total of 12,037 South Australians
were admitted to hospital for acute preventable dental conditions, making
dental conditions the leading cause of PPHs. Young children have the
highest rates of preventable hospitalisation due to dental conditions (SA
Health, 2015a).
The burden of poor oral health is not evenly distributed across the
population with Aboriginal children experiencing more than 50 per cent
tooth decay than non-Aboriginal children. Furthermore, children in the
lowest socio-economic areas have 50 to 70 per cent more tooth decay
compared to those in the highest socio-economic areas, and untreated
tooth decay is 70 per cent more prevalent in the most disadvantaged
children. However 18 to 27 per cent of children in the highest socio-
economic groups also had untreated tooth decay (SA Health, 2015a).
Aboriginal Health HPG, priority setting
workshops 2016.
SA Health, 2015a, SA Dental Service,
Understanding possible preventable
hospital separation data for dental,
Evaluation and Research Unit, Service
Quality & Performance Improvement,
August 2015, unpublished.
Healthy Ageing
Older adults living in the
APHN region have wide-
ranging and complex multi-
morbidity, high prevalence
of chronic disease and
associated risk factors.
Healthy ageing South Australia has an ‘aged’ population, with a higher proportion of older
people than the national average (Roche et al, 2017). The Office for the
Ageing states that for South Australia over the next 10 years it is expected
that the percentage of the population living beyond the age of 65 years will
rise from the current figure of 15% to 22% (OFTA, 2014).
Roche, A.M., Fischer, J., McEntee A.,
Pidd K., 2017, Drug and Alcohol Use
Among Select South Australian At-Risk
Group, National Centre for Education
and Training on Addiction (NCETA),
Flinders University, Adelaide, South
Australia, unpublished.
Office for the Ageing (OFTA), 2014,
Prosperity through longevity: South
2017/18 Adelaide PHN Core Flexible Needs Assessment Update
Department of Health PRIMARY HEALTH NETWORKS Needs Assessment reporting template
March 2016 (Updated)
Page 14
Outcomes of the health needs analysis
In 2013 there were 190,842 people aged 65 years and over, including
29,921 people aged 85 years and over, living in the APHN region (PHIDU,
2014). In 2016, this has increased to 205,706 people aged 65 years and
over (17.3% of the APHN population) including 32,128 people aged 85
years and over (ABS, 2017a).
A South Australian survey of older people found that 92% of survey
respondents selected health and wellbeing as an important aspect of
growing older. The results also indicated a decline in self-rated health with
age, with approximately 40% of those aged 70-79 years, and more than
50% of those aged over 80 years rated their health as fair or poor. The
health issues that most affected daily activities were vision (22%) and
mobility (19%) (OFTA, 2014).
In the APHN region, there were 23,430 people (14%) aged 65 years and
over living in the community with a profound or severe disability, which was
consistent with the national rate of 14% for other capital cities (PHIDU,
2014).
The risk of developing dementia increases with age (CAHML, 2015). In
South Australia, the 2016 estimate of dementia prevalence is 30,500
people (11,400 males, 19,100 females). This is expected to increase to
33,500 people by 2020. (AIHW, 2012). The most common type of dementia
is Alzheimer’s disease, which accounts for around 75% of all dementia
diagnoses.
Multimorbidity of chronic conditions increases with age. In South Australia
in 2014, 29% of males and 35% of females aged 65-74 years old, and 39%
of males and 47% of females aged 75 years and over lived with two or
more chronic health conditions (diabetes, asthma, cardiovascular disease,
arthritis, osteoporosis and/or a mental health condition). These proportions
were double the state averages of 16% for males and 19% females aged
16 years and over (HPCSA, 2016).
Australia’s ageing plan, our vision 2014-
2019.
Public Health Information Development
Unit (PHIDU), 2014, Social Health Atlas
of Australia.
Australian Bureau of Statistics (ABS),
2017a, Census of Population and
Housing 2016, compiled by profile.id and
presented in Adelaide Primary Health
Network community profile
Office for the Ageing (OFTA), 2014,
Prosperity through longevity: South
Australia’s ageing plan, our vision 2014-
2019.
Public Health Information Development
Unit (PHIDU), 2014, Social Health Atlas
of Australia.
Central Adelaide and Hills Medicare
Local (CAHML), 2015, Health Profile: a
population health needs assessment of
the Central Adelaide and Hills region,
2015.
Australian Institute of Health and
Welfare (AIHW), 2012, Dementia in
Australia. Cat. no. AGE 70. Canberra:
AIHW.
Health Performance Council of South
Australia (HPCSA), 2016, State of Our
Health (online report), accessed April
2016.
2017/18 Adelaide PHN Core Flexible Needs Assessment Update
Department of Health PRIMARY HEALTH NETWORKS Needs Assessment reporting template
March 2016 (Updated)
Page 15
Outcomes of the health needs analysis
In 2014, more than half of all South Australian males (55%) and females
(58%) aged 75 years and over were living with two or more of the following
health risk factors: high blood pressure, high cholesterol, no physical
activity, obesity, smoking, alcohol risk, and/or insufficient consumption of
fruit and vegetables. For 65-74 year olds, 44% of both males and females
were living with two or more of the health risk factors. (HPCSA, 2016)
Falls represent a significant health issue among older people, with 2011-
12 data showing that across Australia, 96,385 people aged 65 years and
over required hospitalisation as a result of a fall. Twice as many women
as men were hospitalised for a fall, and the number of falls cases increased
with age (CAHML, 2015). People aged 85 years and over comprised 42.8%
of falls cases requiring hospitalisation. The most commonly recorded
cause of fall injury was falling on the same level from slipping, tripping and
stumbling, which accounted for 33% of falls (CAHML, 2015).
In 2012-13, the estimated number of serious injuries due to falls in people
aged 65 and older was 98,704. Females accounted for most of these fall
injury cases, and rates of cases were higher for females than for males for
all age groups (AIHW, 2017b).
Age-standardised rates of hospitalised fall injury cases increased over the
11 years to June 2013 (3% per year). There were more than 24,000 extra
fall injury cases for people aged 65 and older in 2012–13 than there would
have been if the rate of falls had remained stable since 2002–03 (AIHW,
2017b).
The largest proportion (26%) of fall injury cases for people aged 65 and
older in 2012–13 were Injuries to the hip and thigh. Fractures of the neck
of the femur (also commonly called hip fractures) accounted for the majority
of these injuries (74%). Injuries to the head were the second most common
outcome of a fall (22%). There was a decrease in the rate of hip fractures
due to falls (–2% per year) between 2002–03 and 2012–13. In contrast,
falls resulting in head injuries increased at a particularly high rate (7% per
year) (AIHW, 2017b).
Health Performance Council of South
Australia (HPCSA), 2016, State of Our
Health (online report), accessed April
2016.
Central Adelaide and Hills Medicare
Local (CAHML), 2015, Health Profile: a
population health needs assessment of
the Central Adelaide and Hills region,
2015.
Australian Institute of Health and
Welfare (AHIW), 2017b, Trends in
hospitalisations due to falls by older
people, Australia 2002–03 to 2012–13.
Injury research and statistics series no.
106. Cat. no. INJCAT 182. Canberra:
AIHW.
Ibid.
2017/18 Adelaide PHN Core Flexible Needs Assessment Update
Department of Health PRIMARY HEALTH NETWORKS Needs Assessment reporting template
March 2016 (Updated)
Page 16
Outcomes of the health needs analysis
Increases in the rate of fall injury cases and fall-related head injury were
most apparent for residents of Major cities (4% and 8% per year,
respectively). Around 72% of fall injury cases in 2012–13 were recorded as
having occurred in either the home or a residential aged care facility. The
age-standardised rate of falls in the home for older people living in the
community was 1,655 per 100,000 population while the rate of falls for
older people living in residential aged care was 9,037 per 100,000
population. These rates are likely to be underestimated because of missing
information on the places in which falls occurred (AIHW, 2017b).
In 2012-13, there were more than 120,000 other fall-related hospital
separations (mainly for rehabilitation care) for people aged 65 and older.
The length of stay in hospital as a result of an injurious fall takes into
account time spent in hospital following transfers after the initial
hospitalisation and for fall-related rehabilitation and related care. In total,
there were 1.4 million days of patient care over the year, with the average
total length of stay per fall injury case estimated to be 14.0 days. Overall,
one in every 10 days spent in hospital by a person aged 65 or older in
2012–13 was attributable to an injurious fall. The days of patient care
attributable to fall-related injury rose from 0.8 million patient days in 2002–
03 to 1.4 million patient days in 2012–13 (AIHW, 2017b).
Ibid.
Ibid.
Aboriginal Health
Aboriginal and Torres
Strait Islander South
Australians higher
prevalence of nearly all
health conditions,
compared to non-
Aboriginal South
Australians.
Health inequalities
in health and
wellbeing of
Aboriginal people
The recently released Aboriginal and Torres Strait Islander Health
Performance Framework 2017 report for South Australia lists the following
concerns for the State:
• The age-standardised proportion of Indigenous women that smoked during pregnancy was 48%, this was 3 times the rate for non-Indigenous women (15%) in 2014;
• A smaller proportion of Indigenous women accessed antenatal care services in the first trimester of pregnancy (53%) compared with for non-Indigenous women (78%) in 2014;
• Age-standardised death rates for some chronic diseases in 2011–2015 were higher for Indigenous Australians than for non-Indigenous Australians: more than 4 times as high for diabetes (74 compared
Australian Institute of Health and
Welfare (AIHW), 2017c, Aboriginal and
Torres Strait Islander Health Framework
2017 report: South Australia, AIHW,
Canberra.
2017/18 Adelaide PHN Core Flexible Needs Assessment Update
Department of Health PRIMARY HEALTH NETWORKS Needs Assessment reporting template
March 2016 (Updated)
Page 17
Outcomes of the health needs analysis
with 18 per 100,000); and twice as high for digestive diseases (46 compared with 21 per 100,000);
• The incidence rate for Indigenous Australians with end-stage kidney disease increased from 24 per 100,000 in 1997, to 40 per 100,000 in 2014; and
• Indigenous Australians had a higher age-standardised rate of hospitalisation for injury from July 2013 to June 2015 compared with non-Indigenous Australians (47 compared with 24 per 1,000). The most common injuries resulting in hospitalisation were: assaults (22%), falls (19%), and complications of medical and surgical care (14%) of all hospitalisations (AHIW, 2017c).
Recent analysis of health conditions, health-related behaviours and social
determinants undertaken by Gibson et al. (2017) identified that Aboriginal
and Torres Strait Islander South Australians have higher prevalence of
nearly all health conditions, compared to non-Aboriginal South Australians.
The Aboriginal Health HPG reported that people are presenting late with
cancer, leading to high mortality rates and there is a lack of early detection
of cancer. The HPG also reported that social determinants of health such
as affordable housing, available transport, financial barriers as impacting
on health outcomes.
The Northern Adelaide Clinical Council reported that accessible services
and transport were issues for the delivery of effective Aboriginal health
services in the north. The Council also raised the importance of delivering
services in a manner that is culturally safe. The Southern Adelaide Clinical
Council reported that health services in its area were limited in their cultural
sensitivity. The Southern Council also reported that transport was an issue
for their communities with the nearest clinic being in the city.
Children & young people
Although the immunisation rates for Aboriginal and Torres Strait Islander
children living in the APHN region have significantly increased since 2013-
14, Aboriginal and/or Torres Strait Islander children still have a lower rates
Gibson O, Peterson K, McBride K,
Shtangey V, Xiang J, Eltridge F, Keech
W. 2017. South Australian Aboriginal
Health Needs and Gaps Report:
Women’s and Children’s Health
Network, 2017. Wardliparingga
Aboriginal Research Unit, SAHMRI,
Adelaide, unpublished.
Health Priority Group priority setting
workshops, 2016.
Clinical Council priority setting
workshops, 2016.
National Health Performance Authority
(NHPA), 2015a, Australian Childhood
2017/18 Adelaide PHN Core Flexible Needs Assessment Update
Department of Health PRIMARY HEALTH NETWORKS Needs Assessment reporting template
March 2016 (Updated)
Page 18
Outcomes of the health needs analysis
of fully immunised children at 1-, and 2-years of age, compared to non-
Aboriginal and/or Torres Strait Islander children in the region (NHPA,
2015a). As of June 2017, immunisation coverage rates for 5-year old for
Aboriginal and Torres Strait Islander children living in the APHN region
were at 95%, which is in line with the national target (DOH, 2017c).
The prevalence of self-reported asthma among Aboriginal children aged 0-
14 years was 1.8 times higher than among non-Aboriginal 0-14 year olds;
Aboriginal children were also more likely to be hospitalised (Gibson et al,
2017).
Infant mortality rates were also substantially higher, with 7.6 deaths per
1,000 live births from 2012-2014 for Aboriginal and Torres Strait Islander
populations in South Australia, compared to 2.6 deaths per 1,000 live births
for the state as a whole (ABS, 2015).
Health risk factors, health status & outcomes
Aboriginal and Torres Strait Islander population smoking rates in
metropolitan Adelaide are three times those of the non-Indigenous
residents, 37% compared to 12% in 2014-15 (ABS, 2016a).
Rates of high or very high psychological distress in Aboriginal and Torres
Strait Islander population are 2.5 times those of non-Indigenous South
Australians, 34% compared to 14% (HPCSA, 2016).
The prevalence rates for a number of chronic conditions are substantially
higher for Aboriginal and Torres Strait Islander people in South Australia
compared to the prevalence for all persons. For example, in 2012-13,
asthma rates were almost double (19.7% compared to 10.8%), as were
rates of diabetes (8.9% compared to 4.6%). Cardiovascular disease rates
were also substantially higher, 12.5% compared to 4.5% (HPCSA, 2016).
The all-cause mortality rate was also higher for Aboriginal and Torres Strait
Islander populations in South Australia compared to the population as a
whole, 8.3 deaths per 1,000 population compared to a rate of 5.7 deaths
Immunisation Register statistics 2014–
15.
Department of Health, 2017c, Current
PHN immunisation coverage data for
Aboriginal and Torres Strait Islander
children, Current quarter: June 2017,
Immunise Australia website, accessed
October 2017
Gibson O, Peterson K, McBride K,
Shtangey V, Xiang J, Eltridge F, Keech
W. 2017. South Australian Aboriginal
Health Needs and Gaps Report:
Women’s and Children’s Health
Network, 2017. Wardliparingga
Aboriginal Research Unit, SAHMRI,
Adelaide, unpublished.
Australian Bureau of Statistics (ABS),
2015, Infant mortality rates, Indigenous
status, Selected states and territories-
2002-2004 to 2012-2014.
Australian Bureau of Statistics (ABS),
2016a, National Aboriginal and Torres
Strait Islander Social Survey, 2014–15.
Health Performance Council of South
Australia (HPCSA), 2016, State of Our
Health Report, (based on ABS 2013,
Australian Aboriginal and Torres Strait
Islander health survey: 2012-13).
2017/18 Adelaide PHN Core Flexible Needs Assessment Update
Department of Health PRIMARY HEALTH NETWORKS Needs Assessment reporting template
March 2016 (Updated)
Page 19
Outcomes of the health needs analysis
per 1,000 from 2010-2014 (PC-ROGS, 2016). Data on the underlying
causes of death for Aboriginal and Torres Strait Islander populations in
APHN are currently not available; however, in 2016 the leading causes of
death at the state level were ischaemic heart diseases, diabetes, chronic
lower respiratory diseases, malignant neoplasm of trachea, bronchus and
lung, cirrhosis and other diseases of liver, and intentional self-harm
(suicide) (ABS, 2017b). Age-standardised rates for diabetes were almost
six times the non-Indigenous rate, chronic lower respiratory was three
times, and intentional self-harm was twice the non-Indigenous rate (ABS,
2016b).
Age standardised rates of hospitalisations for Aboriginal and Torres Strait
Islander people living in Greater Adelaide were substantially higher in
2012/13 compared the annual average rate for all-persons in Greater
Adelaide. Per 100,000 population rates were 43% higher for all
admissions, 174% higher for mental health related conditions, 36% higher
for respiratory system diseases, and 25% higher for injuries, poisoning and
other external causes (PHIDU, 2016).
Productivity Commission – Report on
Government Services (PC-ROGS),
2016, Volume E: Health, Overview, Age
standardised all-cause mortality rate
and rate ratios, by Indigenous status,
2010-2014.
Australian Bureau of Statistics (ABS),
2017b, Causes of Death, Australia,
2016.
Public Health Information Development
Unit (PHIDU), 2016, Aboriginal and
Torres Strait Islander Social Health
Atlas of Australia.
Early Intervention and Prevention through Primary Health Care
Limited understanding of
health conditions and
navigating the primary
health care system
Low levels of health
literacy skills
Consultations facilitated with the membership groups of the APHN
identified that health literacy was a main issue for community members that
required addressing in a coordinated manner.
The APHN Clinical Councils identified the need to provide better education
to consumers and professionals across the health sector to improve and
encourage the take-up and application of preventative measures and
reduce unwarranted variation in care by improving health literacy and
education.
The Community Advisory Councils prioritised the need for:
• Better education for consumers and professionals across the
health sector to improve and encourage the take-up and
application of preventative measures.
• Consumers to be empowered and involved in their own care.
Membership Groups Priority Setting
workshops 2016.
2017/18 Adelaide PHN Core Flexible Needs Assessment Update
Department of Health PRIMARY HEALTH NETWORKS Needs Assessment reporting template
March 2016 (Updated)
Page 20
Outcomes of the health needs analysis
• Community members and service providers to better inform
themselves about services available throughout the primary
health care sector and how to access those services, by
improving health literacy and education.
The Health Priority Groups overall prioritised the need to invest in early
intervention; prevention and education strategies for community and
primary health care providers. This will enable community members to
make informed decisions; understand health conditions and have
awareness where to access appropriate services.
Australian research indicates that health literacy is limited in a significant
proportion of the general Australian population is limited (Barber et al.,
2009). In 2006, 59% of South Australians aged 15-74 years had low health
literacy levels indicating they may not have the health literacy skills needed
to navigate and understand health information and services (ABS, 2006).
While dated, this is the latest health literacy data from the ABS. More
recent research by Adams et al. (2009) suggest that 45% of South
Australians were ‘at risk’ or ‘of high likelihood’ of having low functional
health literacy.
Barber MN, Staples M, Osborne RH,
Clerehan R, Elder C, Buchbinder, R.
(2009). Up to a quarter of the Australian
population may have suboptimal health
literacy depending upon the
measurement tool: Results from a
population-based survey. Health
Promotion International, 24(3), 252-261.
Australian Bureau of Statistics (ABS),
2006, Adult Literacy and Life Skills
Survey, accessed October 2017.
Adams RJ, Appleton SL, Hill CL, Dodd
M, Findlay C, Wilson DH. (2009). Risks
associated with low functional health
literacy in an Australian population.
Medical Journal of Australia, 191(10),
530-534.
High prevalence of health
risk factors (including poor
nutrition, physical inactivity
and smoking) at sub-
regional levels, particularly
Management of risk
factors
The APHN membership groups recognise the link between behavioural
and lifestyle factors and the effect of these on health. The Southern
Community Advisory Council identified that the following lifestyle factors
which may impact a person’s health: smoking; inadequate nutrition;
unemployment; lack of exercise; lack of skills to cook health foods;
Community Advisory Council, Results
Based Accountability workshops, 2017.
2017/18 Adelaide PHN Core Flexible Needs Assessment Update
Department of Health PRIMARY HEALTH NETWORKS Needs Assessment reporting template
March 2016 (Updated)
Page 21
Outcomes of the health needs analysis
in Local Government Areas
(LGAs) of Playford,
Salisbury, Port Adelaide
Enfield and Onkaparinga.
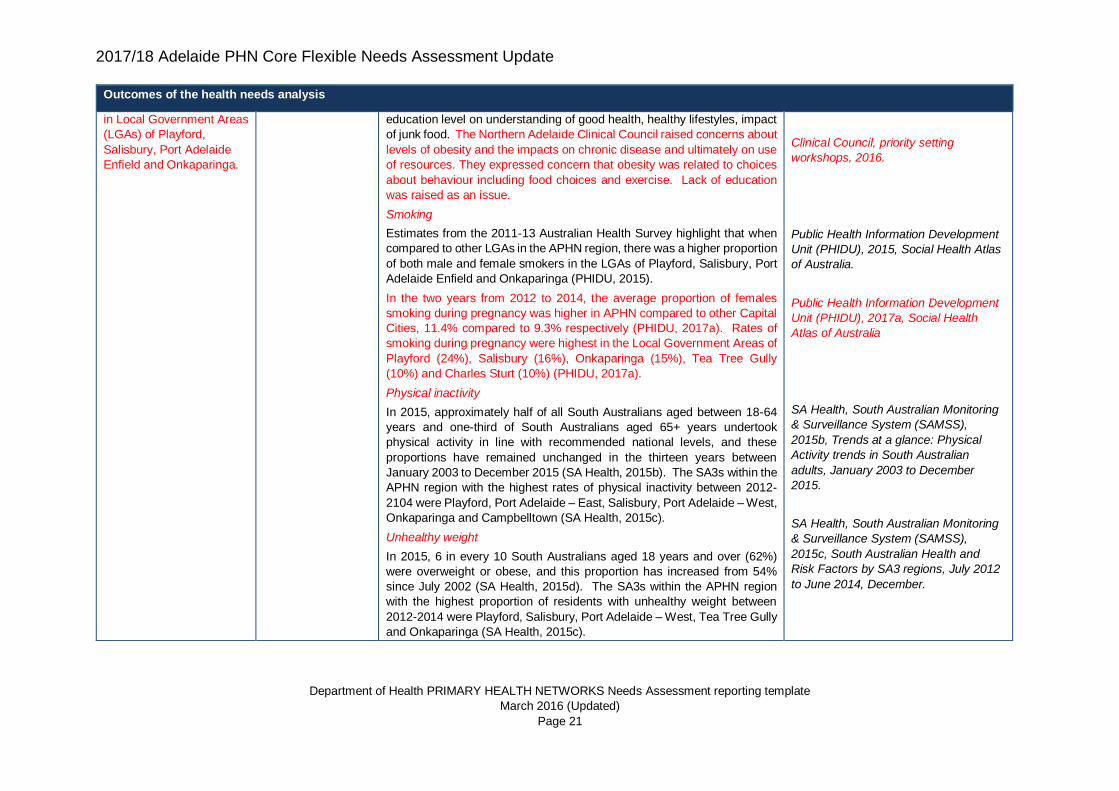
education level on understanding of good health, healthy lifestyles, impact
of junk food. The Northern Adelaide Clinical Council raised concerns about
levels of obesity and the impacts on chronic disease and ultimately on use
of resources. They expressed concern that obesity was related to choices
about behaviour including food choices and exercise. Lack of education
was raised as an issue.
Smoking
Estimates from the 2011-13 Australian Health Survey highlight that when
compared to other LGAs in the APHN region, there was a higher proportion
of both male and female smokers in the LGAs of Playford, Salisbury, Port
Adelaide Enfield and Onkaparinga (PHIDU, 2015).
In the two years from 2012 to 2014, the average proportion of females
smoking during pregnancy was higher in APHN compared to other Capital
Cities, 11.4% compared to 9.3% respectively (PHIDU, 2017a). Rates of
smoking during pregnancy were highest in the Local Government Areas of
Playford (24%), Salisbury (16%), Onkaparinga (15%), Tea Tree Gully
(10%) and Charles Sturt (10%) (PHIDU, 2017a).
Physical inactivity
In 2015, approximately half of all South Australians aged between 18-64
years and one-third of South Australians aged 65+ years undertook
physical activity in line with recommended national levels, and these
proportions have remained unchanged in the thirteen years between
January 2003 to December 2015 (SA Health, 2015b). The SA3s within the
APHN region with the highest rates of physical inactivity between 2012-
2104 were Playford, Port Adelaide – East, Salisbury, Port Adelaide – West,
Onkaparinga and Campbelltown (SA Health, 2015c).
Unhealthy weight
In 2015, 6 in every 10 South Australians aged 18 years and over (62%)
were overweight or obese, and this proportion has increased from 54%
since July 2002 (SA Health, 2015d). The SA3s within the APHN region
with the highest proportion of residents with unhealthy weight between
2012-2014 were Playford, Salisbury, Port Adelaide – West, Tea Tree Gully
and Onkaparinga (SA Health, 2015c).
Clinical Council, priority setting
workshops, 2016.
Public Health Information Development
Unit (PHIDU), 2015, Social Health Atlas
of Australia.
Public Health Information Development
Unit (PHIDU), 2017a, Social Health
Atlas of Australia
SA Health, South Australian Monitoring
& Surveillance System (SAMSS),
2015b, Trends at a glance: Physical
Activity trends in South Australian
adults, January 2003 to December
2015.
SA Health, South Australian Monitoring
& Surveillance System (SAMSS),
2015c, South Australian Health and
Risk Factors by SA3 regions, July 2012
to June 2014, December.
2017/18 Adelaide PHN Core Flexible Needs Assessment Update
Department of Health PRIMARY HEALTH NETWORKS Needs Assessment reporting template
March 2016 (Updated)
Page 22
Outcomes of the health needs analysis
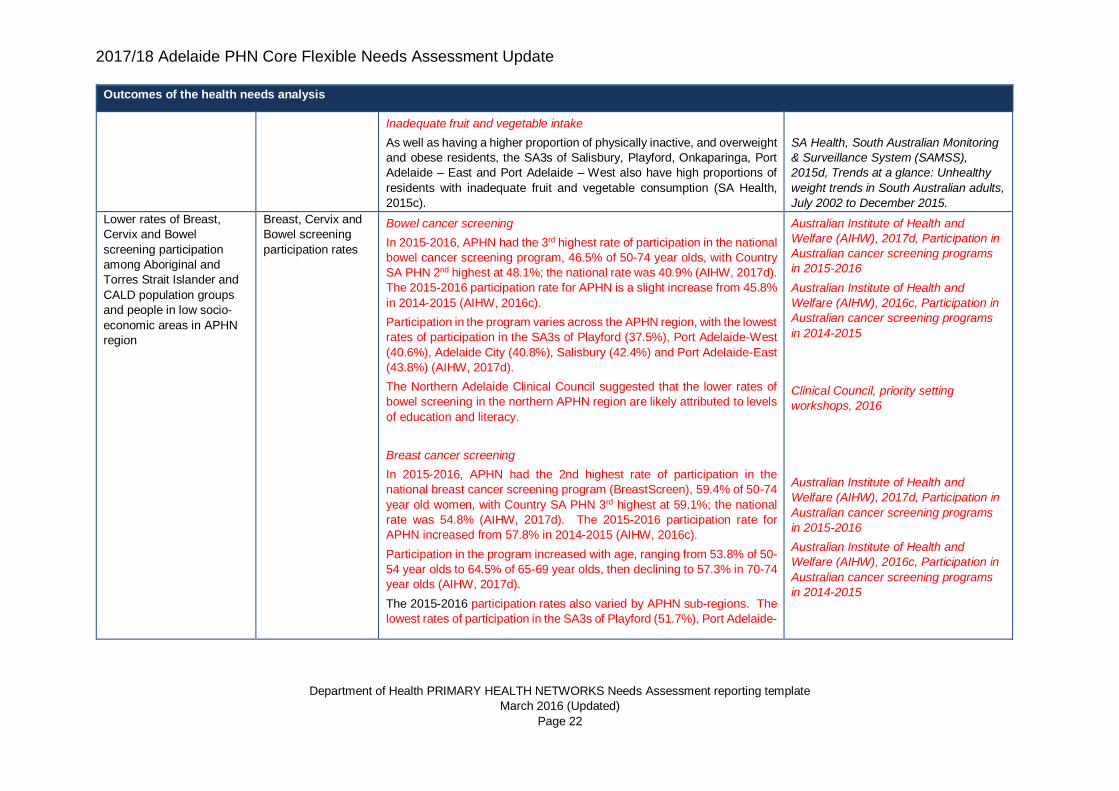
Inadequate fruit and vegetable intake
As well as having a higher proportion of physically inactive, and overweight
and obese residents, the SA3s of Salisbury, Playford, Onkaparinga, Port
Adelaide – East and Port Adelaide – West also have high proportions of
residents with inadequate fruit and vegetable consumption (SA Health,
2015c).
SA Health, South Australian Monitoring
& Surveillance System (SAMSS),
2015d, Trends at a glance: Unhealthy
weight trends in South Australian adults,
July 2002 to December 2015.
Lower rates of Breast,
Cervix and Bowel
screening participation
among Aboriginal and
Torres Strait Islander and
CALD population groups
and people in low socio-
economic areas in APHN
region
Breast, Cervix and
Bowel screening
participation rates
Bowel cancer screening
In 2015-2016, APHN had the 3rd highest rate of participation in the national
bowel cancer screening program, 46.5% of 50-74 year olds, with Country
SA PHN 2nd highest at 48.1%; the national rate was 40.9% (AIHW, 2017d).
The 2015-2016 participation rate for APHN is a slight increase from 45.8%
in 2014-2015 (AIHW, 2016c).
Participation in the program varies across the APHN region, with the lowest
rates of participation in the SA3s of Playford (37.5%), Port Adelaide-West
(40.6%), Adelaide City (40.8%), Salisbury (42.4%) and Port Adelaide-East
(43.8%) (AIHW, 2017d).
The Northern Adelaide Clinical Council suggested that the lower rates of
bowel screening in the northern APHN region are likely attributed to levels
of education and literacy.
Breast cancer screening
In 2015-2016, APHN had the 2nd highest rate of participation in the
national breast cancer screening program (BreastScreen), 59.4% of 50-74
year old women, with Country SA PHN 3rd highest at 59.1%; the national
rate was 54.8% (AIHW, 2017d). The 2015-2016 participation rate for
APHN increased from 57.8% in 2014-2015 (AIHW, 2016c).
Participation in the program increased with age, ranging from 53.8% of 50-
54 year olds to 64.5% of 65-69 year olds, then declining to 57.3% in 70-74
year olds (AIHW, 2017d).
The 2015-2016 participation rates also varied by APHN sub-regions. The
lowest rates of participation in the SA3s of Playford (51.7%), Port Adelaide-
Australian Institute of Health and
Welfare (AIHW), 2017d, Participation in
Australian cancer screening programs
in 2015-2016
Australian Institute of Health and
Welfare (AIHW), 2016c, Participation in
Australian cancer screening programs
in 2014-2015
Clinical Council, priority setting
workshops, 2016
Australian Institute of Health and
Welfare (AIHW), 2017d, Participation in
Australian cancer screening programs
in 2015-2016
Australian Institute of Health and
Welfare (AIHW), 2016c, Participation in
Australian cancer screening programs
in 2014-2015
2017/18 Adelaide PHN Core Flexible Needs Assessment Update
Department of Health PRIMARY HEALTH NETWORKS Needs Assessment reporting template
March 2016 (Updated)
Page 23
Outcomes of the health needs analysis
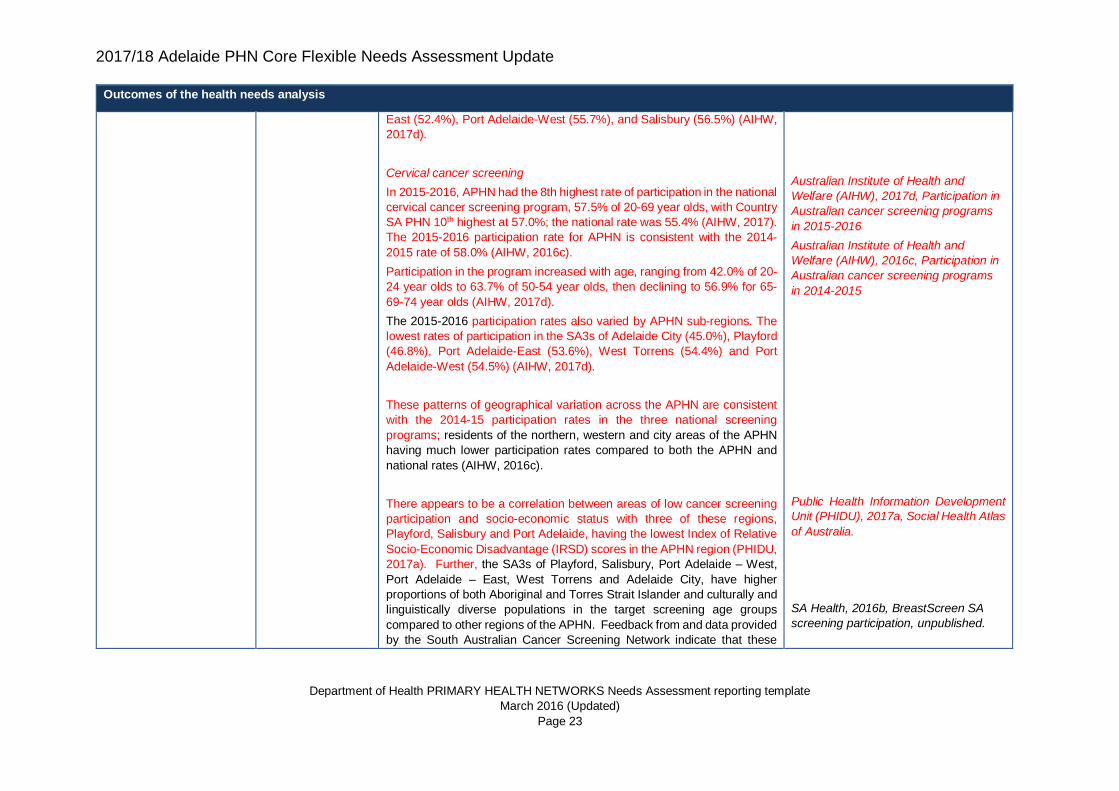
East (52.4%), Port Adelaide-West (55.7%), and Salisbury (56.5%) (AIHW,
2017d).
Cervical cancer screening
In 2015-2016, APHN had the 8th highest rate of participation in the national
cervical cancer screening program, 57.5% of 20-69 year olds, with Country
SA PHN 10th highest at 57.0%; the national rate was 55.4% (AIHW, 2017).
The 2015-2016 participation rate for APHN is consistent with the 2014-
2015 rate of 58.0% (AIHW, 2016c).
Participation in the program increased with age, ranging from 42.0% of 20-
24 year olds to 63.7% of 50-54 year olds, then declining to 56.9% for 65-
69-74 year olds (AIHW, 2017d).
The 2015-2016 participation rates also varied by APHN sub-regions. The
lowest rates of participation in the SA3s of Adelaide City (45.0%), Playford
(46.8%), Port Adelaide-East (53.6%), West Torrens (54.4%) and Port
Adelaide-West (54.5%) (AIHW, 2017d).
These patterns of geographical variation across the APHN are consistent
with the 2014-15 participation rates in the three national screening
programs; residents of the northern, western and city areas of the APHN
having much lower participation rates compared to both the APHN and
national rates (AIHW, 2016c).
There appears to be a correlation between areas of low cancer screening
participation and socio-economic status with three of these regions,
Playford, Salisbury and Port Adelaide, having the lowest Index of Relative
Socio-Economic Disadvantage (IRSD) scores in the APHN region (PHIDU,
2017a). Further, the SA3s of Playford, Salisbury, Port Adelaide – West,
Port Adelaide – East, West Torrens and Adelaide City, have higher
proportions of both Aboriginal and Torres Strait Islander and culturally and
linguistically diverse populations in the target screening age groups
compared to other regions of the APHN. Feedback from and data provided
by the South Australian Cancer Screening Network indicate that these
Australian Institute of Health and
Welfare (AIHW), 2017d, Participation in
Australian cancer screening programs
in 2015-2016
Australian Institute of Health and
Welfare (AIHW), 2016c, Participation in
Australian cancer screening programs
in 2014-2015
Public Health Information Development
Unit (PHIDU), 2017a, Social Health Atlas
of Australia.
SA Health, 2016b, BreastScreen SA
screening participation, unpublished.
2017/18 Adelaide PHN Core Flexible Needs Assessment Update
Department of Health PRIMARY HEALTH NETWORKS Needs Assessment reporting template
March 2016 (Updated)
Page 24
Outcomes of the health needs analysis
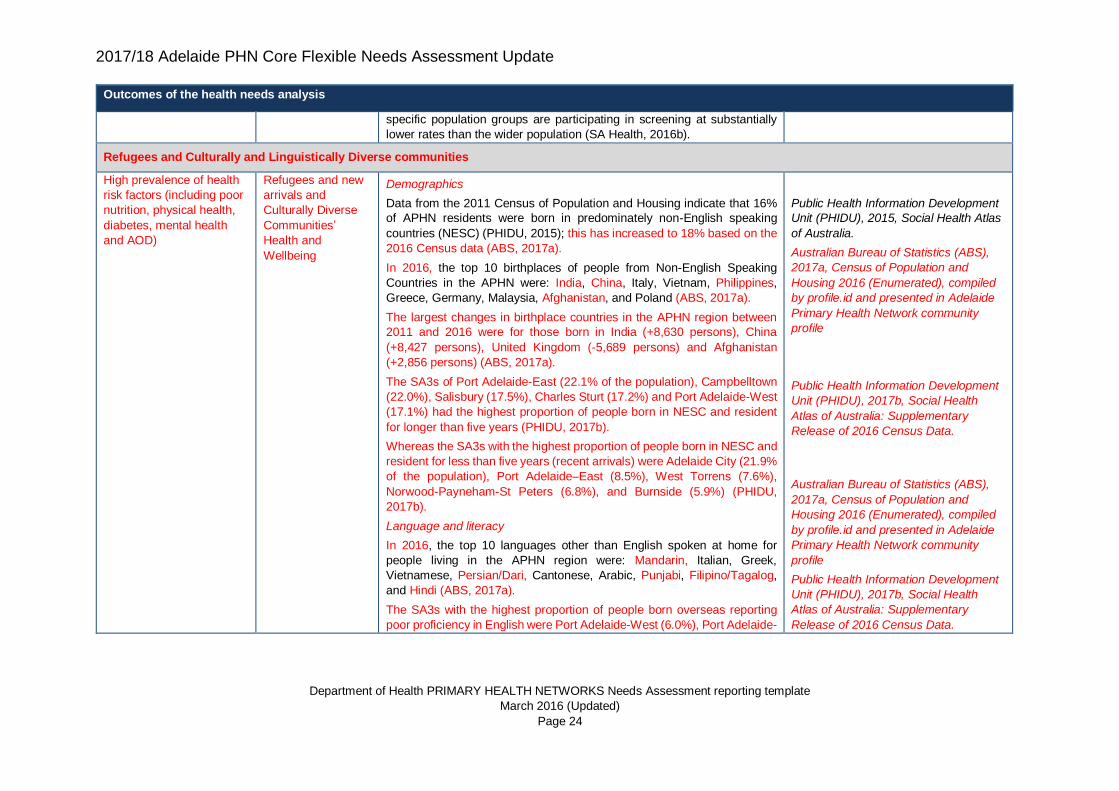
specific population groups are participating in screening at substantially
lower rates than the wider population (SA Health, 2016b).
Refugees and Culturally and Linguistically Diverse communities
High prevalence of health
risk factors (including poor
nutrition, physical health,
diabetes, mental health
and AOD)
Refugees and new
arrivals and
Culturally Diverse
Communities’
Health and
Wellbeing
Demographics
Data from the 2011 Census of Population and Housing indicate that 16%
of APHN residents were born in predominately non-English speaking
countries (NESC) (PHIDU, 2015); this has increased to 18% based on the
2016 Census data (ABS, 2017a).
In 2016, the top 10 birthplaces of people from Non-English Speaking
Countries in the APHN were: India, China, Italy, Vietnam, Philippines,
Greece, Germany, Malaysia, Afghanistan, and Poland (ABS, 2017a).
The largest changes in birthplace countries in the APHN region between
2011 and 2016 were for those born in India (+8,630 persons), China
(+8,427 persons), United Kingdom (-5,689 persons) and Afghanistan
(+2,856 persons) (ABS, 2017a).
The SA3s of Port Adelaide-East (22.1% of the population), Campbelltown
(22.0%), Salisbury (17.5%), Charles Sturt (17.2%) and Port Adelaide-West
(17.1%) had the highest proportion of people born in NESC and resident
for longer than five years (PHIDU, 2017b).
Whereas the SA3s with the highest proportion of people born in NESC and
resident for less than five years (recent arrivals) were Adelaide City (21.9%
of the population), Port Adelaide–East (8.5%), West Torrens (7.6%),
Norwood-Payneham-St Peters (6.8%), and Burnside (5.9%) (PHIDU,
2017b).
Language and literacy
In 2016, the top 10 languages other than English spoken at home for
people living in the APHN region were: Mandarin, Italian, Greek,
Vietnamese, Persian/Dari, Cantonese, Arabic, Punjabi, Filipino/Tagalog,
and Hindi (ABS, 2017a).
The SA3s with the highest proportion of people born overseas reporting
poor proficiency in English were Port Adelaide-West (6.0%), Port Adelaide-
Public Health Information Development
Unit (PHIDU), 2015, Social Health Atlas
of Australia.
Australian Bureau of Statistics (ABS),
2017a, Census of Population and
Housing 2016 (Enumerated), compiled
by profile.id and presented in Adelaide
Primary Health Network community
profile
Public Health Information Development
Unit (PHIDU), 2017b, Social Health
Atlas of Australia: Supplementary
Release of 2016 Census Data.
2017/18 Adelaide PHN Core Flexible Needs Assessment Update
Department of Health PRIMARY HEALTH NETWORKS Needs Assessment reporting template
March 2016 (Updated)
Page 25
Outcomes of the health needs analysis
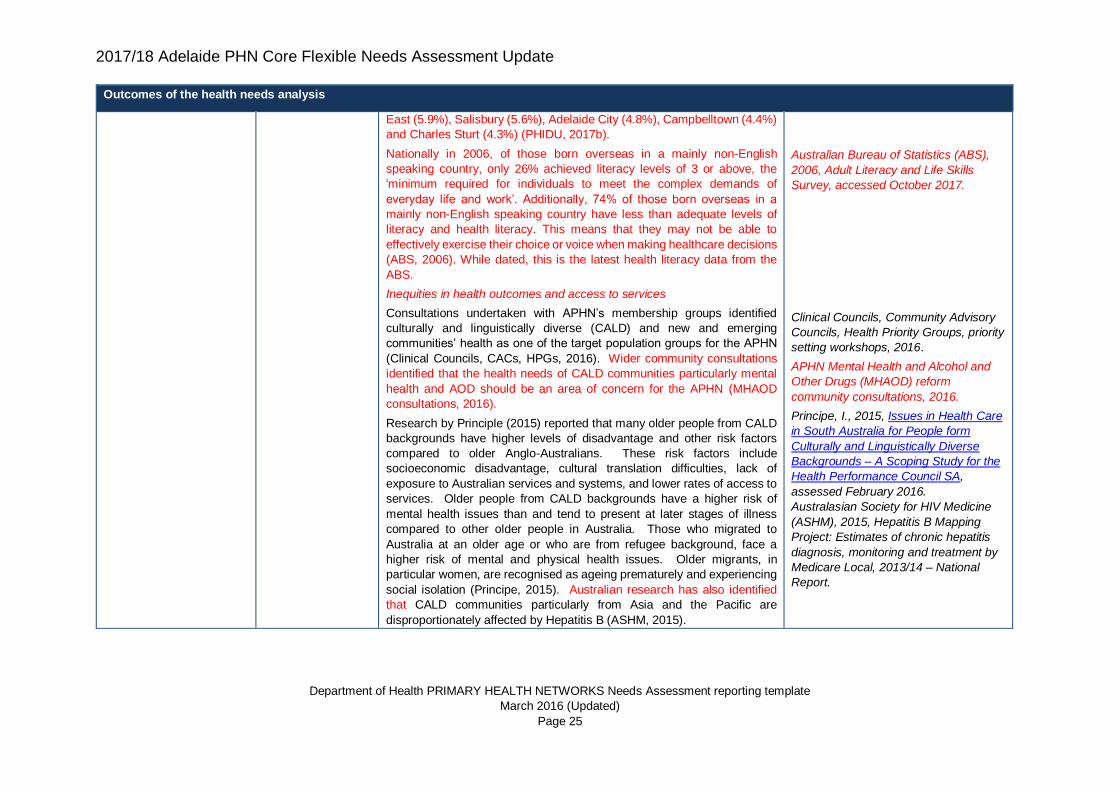
East (5.9%), Salisbury (5.6%), Adelaide City (4.8%), Campbelltown (4.4%)
and Charles Sturt (4.3%) (PHIDU, 2017b).
Nationally in 2006, of those born overseas in a mainly non-English
speaking country, only 26% achieved literacy levels of 3 or above, the
'minimum required for individuals to meet the complex demands of
everyday life and work’. Additionally, 74% of those born overseas in a
mainly non-English speaking country have less than adequate levels of
literacy and health literacy. This means that they may not be able to
effectively exercise their choice or voice when making healthcare decisions
(ABS, 2006). While dated, this is the latest health literacy data from the
ABS.
Inequities in health outcomes and access to services
Consultations undertaken with APHN’s membership groups identified
culturally and linguistically diverse (CALD) and new and emerging
communities’ health as one of the target population groups for the APHN
(Clinical Councils, CACs, HPGs, 2016). Wider community consultations
identified that the health needs of CALD communities particularly mental
health and AOD should be an area of concern for the APHN (MHAOD
consultations, 2016).
Research by Principle (2015) reported that many older people from CALD
backgrounds have higher levels of disadvantage and other risk factors
compared to older Anglo-Australians. These risk factors include
socioeconomic disadvantage, cultural translation difficulties, lack of
exposure to Australian services and systems, and lower rates of access to
services. Older people from CALD backgrounds have a higher risk of
mental health issues than and tend to present at later stages of illness
compared to other older people in Australia. Those who migrated to
Australia at an older age or who are from refugee background, face a
higher risk of mental and physical health issues. Older migrants, in
particular women, are recognised as ageing prematurely and experiencing
social isolation (Principe, 2015). Australian research has also identified
that CALD communities particularly from Asia and the Pacific are
disproportionately affected by Hepatitis B (ASHM, 2015).
Australian Bureau of Statistics (ABS),
2006, Adult Literacy and Life Skills
Survey, accessed October 2017.
Clinical Councils, Community Advisory
Councils, Health Priority Groups, priority
setting workshops, 2016.
APHN Mental Health and Alcohol and
Other Drugs (MHAOD) reform
community consultations, 2016.
Principe, I., 2015, Issues in Health Care
in South Australia for People form
Culturally and Linguistically Diverse
Backgrounds – A Scoping Study for the
Health Performance Council SA,
assessed February 2016.
Australasian Society for HIV Medicine
(ASHM), 2015, Hepatitis B Mapping
Project: Estimates of chronic hepatitis
diagnosis, monitoring and treatment by
Medicare Local, 2013/14 – National
Report.
2017/18 Adelaide PHN Core Flexible Needs Assessment Update
Department of Health PRIMARY HEALTH NETWORKS Needs Assessment reporting template
March 2016 (Updated)
Page 26
Outcomes of the health needs analysis
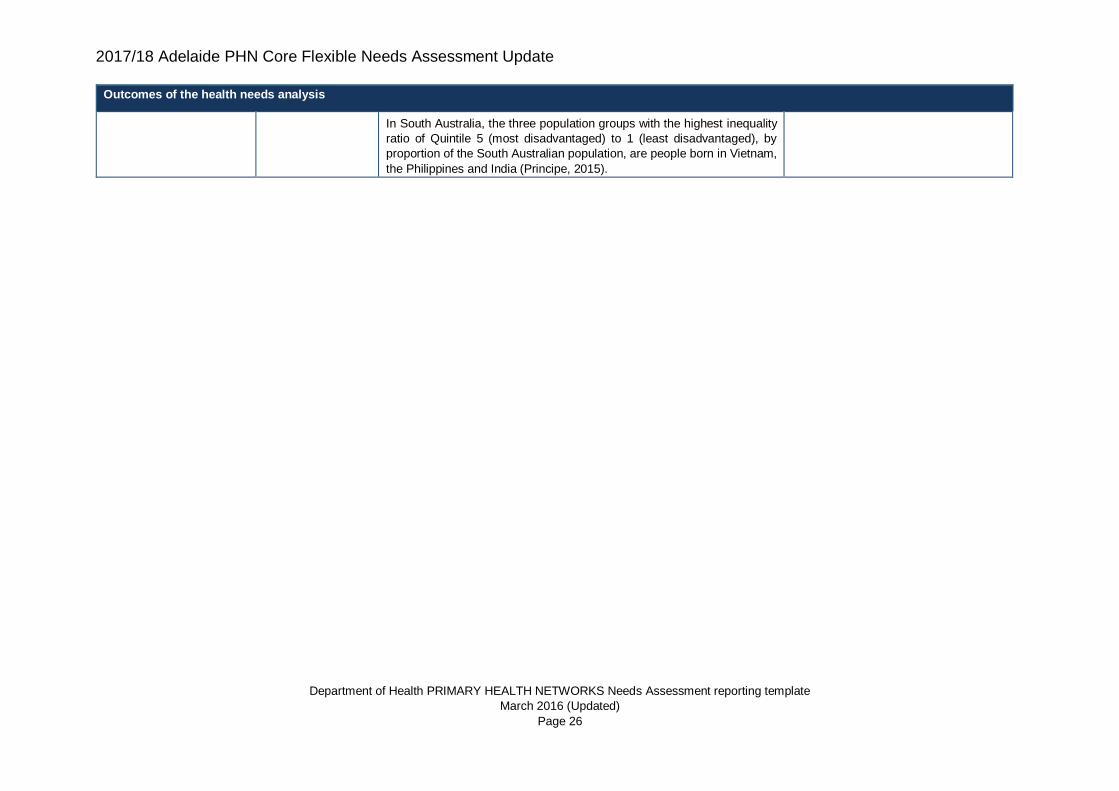
In South Australia, the three population groups with the highest inequality
ratio of Quintile 5 (most disadvantaged) to 1 (least disadvantaged), by
proportion of the South Australian population, are people born in Vietnam,
the Philippines and India (Principe, 2015).
2017/18 Adelaide PHN Core Flexible Needs Assessment Update
Department of Health PRIMARY HEALTH NETWORKS Needs Assessment reporting template
March 2016 (Updated)
Page 27
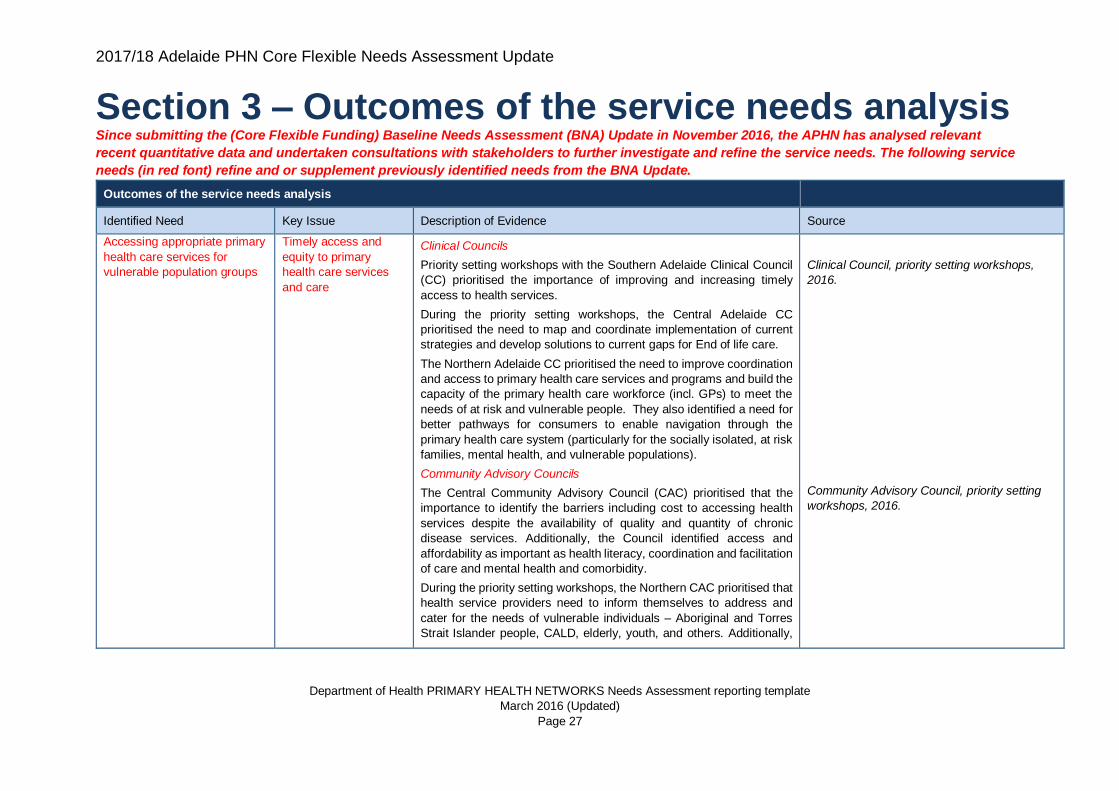
Section 3 – Outcomes of the service needs analysis Since submitting the (Core Flexible Funding) Baseline Needs Assessment (BNA) Update in November 2016, the APHN has analysed relevant
recent quantitative data and undertaken consultations with stakeholders to further investigate and refine the service needs. The following service
needs (in red font) refine and or supplement previously identified needs from the BNA Update.
Outcomes of the service needs analysis
Identified Need Key Issue Description of Evidence Source
Accessing appropriate primary
health care services for
vulnerable population groups
Timely access and
equity to primary
health care services
and care
Clinical Councils
Priority setting workshops with the Southern Adelaide Clinical Council
(CC) prioritised the importance of improving and increasing timely
access to health services.
During the priority setting workshops, the Central Adelaide CC
prioritised the need to map and coordinate implementation of current
strategies and develop solutions to current gaps for End of life care.
The Northern Adelaide CC prioritised the need to improve coordination
and access to primary health care services and programs and build the
capacity of the primary health care workforce (incl. GPs) to meet the
needs of at risk and vulnerable people. They also identified a need for
better pathways for consumers to enable navigation through the
primary health care system (particularly for the socially isolated, at risk
families, mental health, and vulnerable populations).
Community Advisory Councils
The Central Community Advisory Council (CAC) prioritised that the
importance to identify the barriers including cost to accessing health
services despite the availability of quality and quantity of chronic
disease services. Additionally, the Council identified access and
affordability as important as health literacy, coordination and facilitation
of care and mental health and comorbidity.
During the priority setting workshops, the Northern CAC prioritised that
health service providers need to inform themselves to address and
cater for the needs of vulnerable individuals – Aboriginal and Torres
Strait Islander people, CALD, elderly, youth, and others. Additionally,
Clinical Council, priority setting workshops,
2016.
Community Advisory Council, priority setting
workshops, 2016.
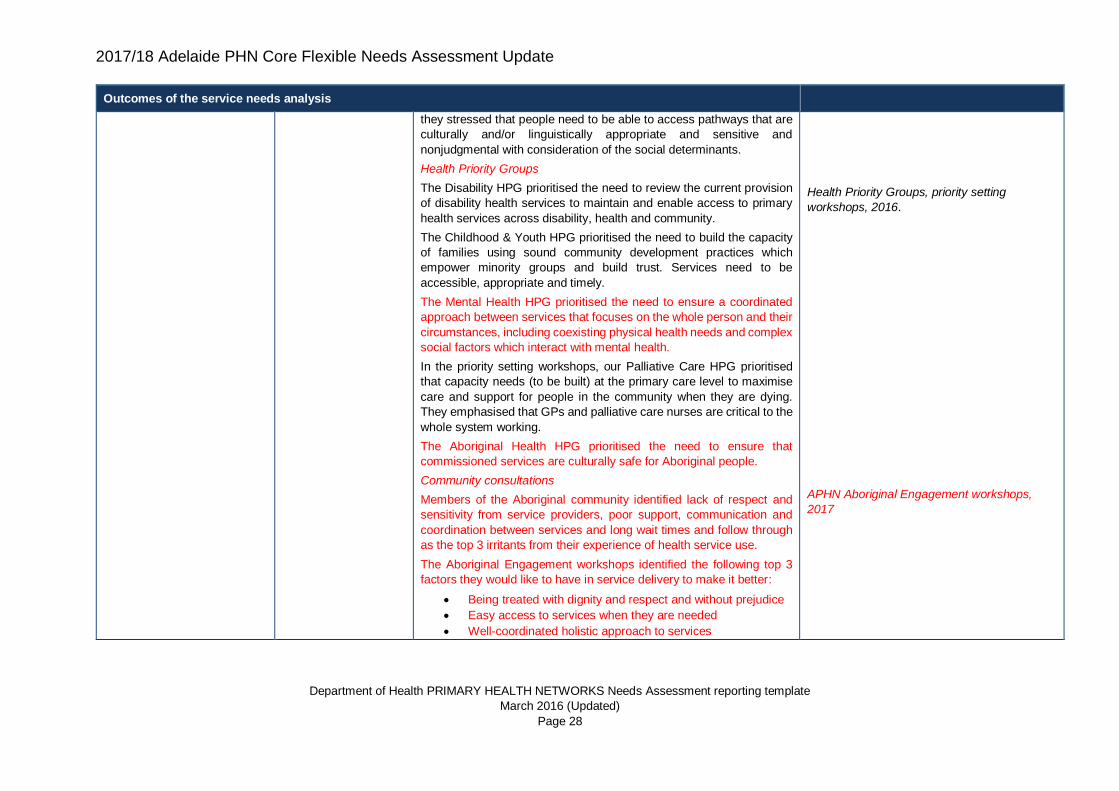
2017/18 Adelaide PHN Core Flexible Needs Assessment Update
Department of Health PRIMARY HEALTH NETWORKS Needs Assessment reporting template
March 2016 (Updated)
Page 28
Outcomes of the service needs analysis
they stressed that people need to be able to access pathways that are
culturally and/or linguistically appropriate and sensitive and
nonjudgmental with consideration of the social determinants.
Health Priority Groups
The Disability HPG prioritised the need to review the current provision
of disability health services to maintain and enable access to primary
health services across disability, health and community.
The Childhood & Youth HPG prioritised the need to build the capacity
of families using sound community development practices which
empower minority groups and build trust. Services need to be
accessible, appropriate and timely.
The Mental Health HPG prioritised the need to ensure a coordinated
approach between services that focuses on the whole person and their
circumstances, including coexisting physical health needs and complex
social factors which interact with mental health.
In the priority setting workshops, our Palliative Care HPG prioritised
that capacity needs (to be built) at the primary care level to maximise
care and support for people in the community when they are dying.
They emphasised that GPs and palliative care nurses are critical to the
whole system working.
The Aboriginal Health HPG prioritised the need to ensure that
commissioned services are culturally safe for Aboriginal people.
Community consultations
Members of the Aboriginal community identified lack of respect and
sensitivity from service providers, poor support, communication and
coordination between services and long wait times and follow through
as the top 3 irritants from their experience of health service use.
The Aboriginal Engagement workshops identified the following top 3
factors they would like to have in service delivery to make it better:
• Being treated with dignity and respect and without prejudice
• Easy access to services when they are needed
• Well-coordinated holistic approach to services
Health Priority Groups, priority setting
workshops, 2016.
APHN Aboriginal Engagement workshops,
2017
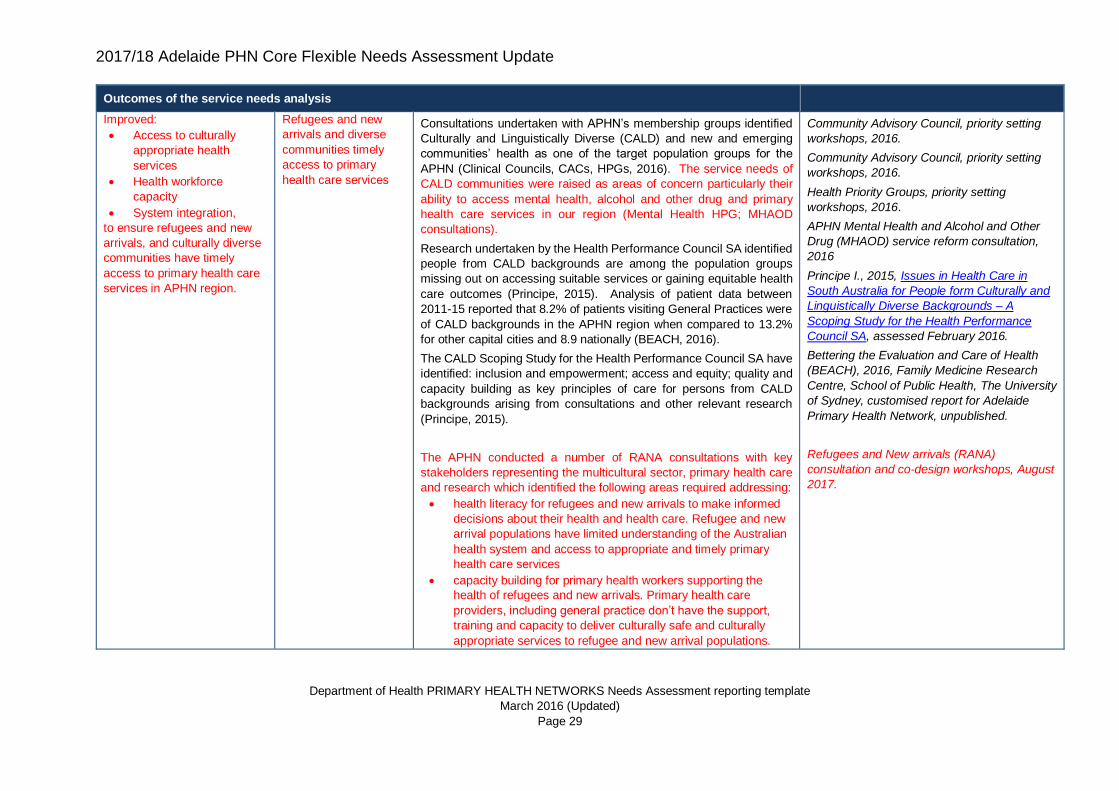
2017/18 Adelaide PHN Core Flexible Needs Assessment Update
Department of Health PRIMARY HEALTH NETWORKS Needs Assessment reporting template
March 2016 (Updated)
Page 29
Outcomes of the service needs analysis
Improved:
• Access to culturally
appropriate health
services
• Health workforce
capacity
• System integration,
to ensure refugees and new
arrivals, and culturally diverse
communities have timely
access to primary health care
services in APHN region.
Refugees and new
arrivals and diverse
communities timely
access to primary
health care services
Consultations undertaken with APHN’s membership groups identified
Culturally and Linguistically Diverse (CALD) and new and emerging
communities’ health as one of the target population groups for the
APHN (Clinical Councils, CACs, HPGs, 2016). The service needs of
CALD communities were raised as areas of concern particularly their
ability to access mental health, alcohol and other drug and primary
health care services in our region (Mental Health HPG; MHAOD
consultations).
Research undertaken by the Health Performance Council SA identified
people from CALD backgrounds are among the population groups
missing out on accessing suitable services or gaining equitable health
care outcomes (Principe, 2015). Analysis of patient data between
2011-15 reported that 8.2% of patients visiting General Practices were
of CALD backgrounds in the APHN region when compared to 13.2%
for other capital cities and 8.9 nationally (BEACH, 2016).
The CALD Scoping Study for the Health Performance Council SA have
identified: inclusion and empowerment; access and equity; quality and
capacity building as key principles of care for persons from CALD
backgrounds arising from consultations and other relevant research
(Principe, 2015).
The APHN conducted a number of RANA consultations with key
stakeholders representing the multicultural sector, primary health care
and research which identified the following areas required addressing:
• health literacy for refugees and new arrivals to make informed
decisions about their health and health care. Refugee and new
arrival populations have limited understanding of the Australian
health system and access to appropriate and timely primary
health care services
• capacity building for primary health workers supporting the
health of refugees and new arrivals. Primary health care
providers, including general practice don’t have the support,
training and capacity to deliver culturally safe and culturally
appropriate services to refugee and new arrival populations.
Community Advisory Council, priority setting
workshops, 2016.
Community Advisory Council, priority setting
workshops, 2016.
Health Priority Groups, priority setting
workshops, 2016.
APHN Mental Health and Alcohol and Other
Drug (MHAOD) service reform consultation,
2016
Principe I., 2015, Issues in Health Care in
South Australia for People form Culturally and
Linguistically Diverse Backgrounds – A
Scoping Study for the Health Performance
Council SA, assessed February 2016.
Bettering the Evaluation and Care of Health
(BEACH), 2016, Family Medicine Research
Centre, School of Public Health, The University
of Sydney, customised report for Adelaide
Primary Health Network, unpublished.
Refugees and New arrivals (RANA)
consultation and co-design workshops, August
2017.
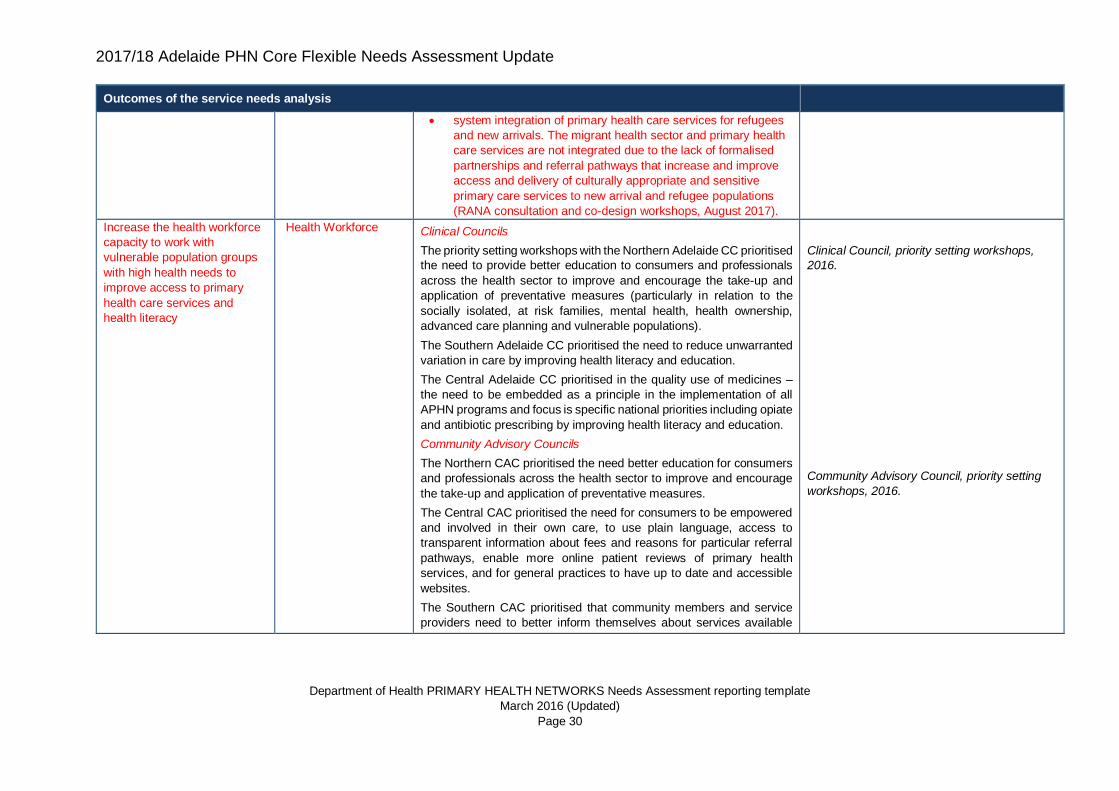
2017/18 Adelaide PHN Core Flexible Needs Assessment Update
Department of Health PRIMARY HEALTH NETWORKS Needs Assessment reporting template
March 2016 (Updated)
Page 30
Outcomes of the service needs analysis
• system integration of primary health care services for refugees
and new arrivals. The migrant health sector and primary health
care services are not integrated due to the lack of formalised
partnerships and referral pathways that increase and improve
access and delivery of culturally appropriate and sensitive
primary care services to new arrival and refugee populations
(RANA consultation and co-design workshops, August 2017).
Increase the health workforce
capacity to work with
vulnerable population groups
with high health needs to
improve access to primary
health care services and
health literacy
Health Workforce
Clinical Councils
The priority setting workshops with the Northern Adelaide CC prioritised
the need to provide better education to consumers and professionals
across the health sector to improve and encourage the take-up and
application of preventative measures (particularly in relation to the
socially isolated, at risk families, mental health, health ownership,
advanced care planning and vulnerable populations).
The Southern Adelaide CC prioritised the need to reduce unwarranted
variation in care by improving health literacy and education.
The Central Adelaide CC prioritised in the quality use of medicines –
the need to be embedded as a principle in the implementation of all
APHN programs and focus is specific national priorities including opiate
and antibiotic prescribing by improving health literacy and education.
Community Advisory Councils
The Northern CAC prioritised the need better education for consumers
and professionals across the health sector to improve and encourage
the take-up and application of preventative measures.
The Central CAC prioritised the need for consumers to be empowered
and involved in their own care, to use plain language, access to
transparent information about fees and reasons for particular referral
pathways, enable more online patient reviews of primary health
services, and for general practices to have up to date and accessible
websites.
The Southern CAC prioritised that community members and service
providers need to better inform themselves about services available
Clinical Council, priority setting workshops,
2016.
Community Advisory Council, priority setting
workshops, 2016.
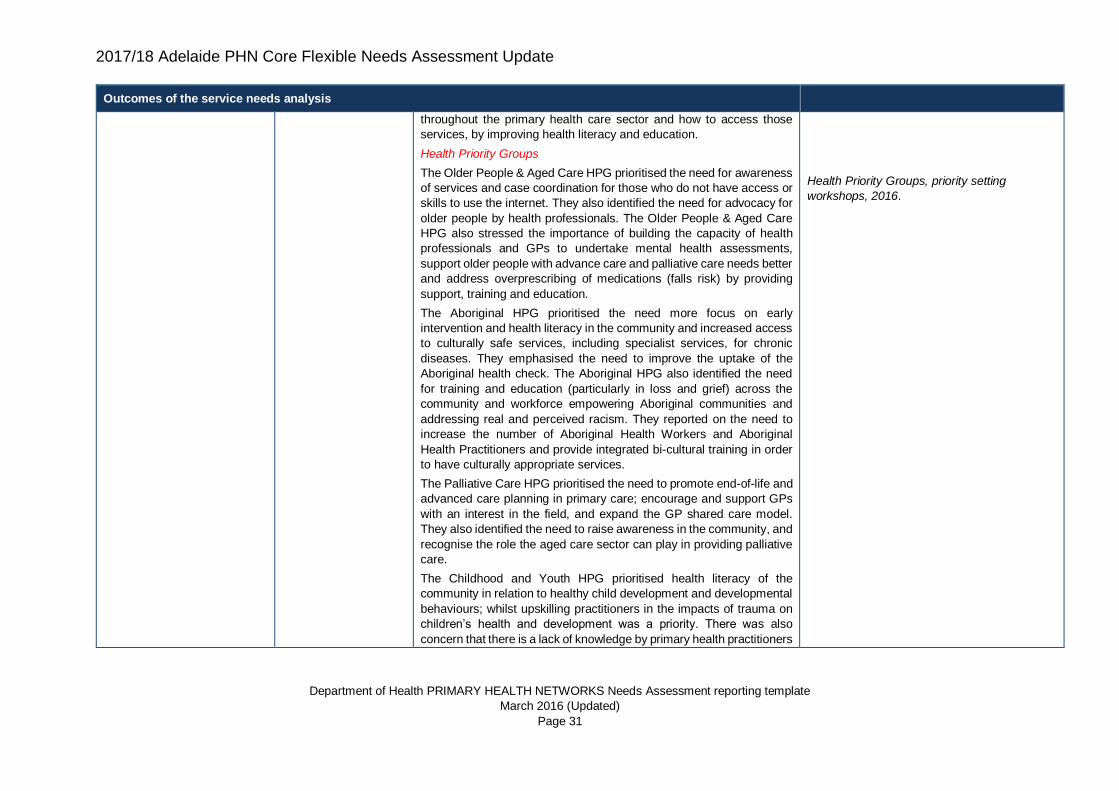
2017/18 Adelaide PHN Core Flexible Needs Assessment Update
Department of Health PRIMARY HEALTH NETWORKS Needs Assessment reporting template
March 2016 (Updated)
Page 31
Outcomes of the service needs analysis
throughout the primary health care sector and how to access those
services, by improving health literacy and education.
Health Priority Groups
The Older People & Aged Care HPG prioritised the need for awareness
of services and case coordination for those who do not have access or
skills to use the internet. They also identified the need for advocacy for
older people by health professionals. The Older People & Aged Care
HPG also stressed the importance of building the capacity of health
professionals and GPs to undertake mental health assessments,
support older people with advance care and palliative care needs better
and address overprescribing of medications (falls risk) by providing
support, training and education.
The Aboriginal HPG prioritised the need more focus on early
intervention and health literacy in the community and increased access
to culturally safe services, including specialist services, for chronic
diseases. They emphasised the need to improve the uptake of the
Aboriginal health check. The Aboriginal HPG also identified the need
for training and education (particularly in loss and grief) across the
community and workforce empowering Aboriginal communities and
addressing real and perceived racism. They reported on the need to
increase the number of Aboriginal Health Workers and Aboriginal
Health Practitioners and provide integrated bi-cultural training in order
to have culturally appropriate services.
The Palliative Care HPG prioritised the need to promote end-of-life and
advanced care planning in primary care; encourage and support GPs
with an interest in the field, and expand the GP shared care model.
They also identified the need to raise awareness in the community, and
recognise the role the aged care sector can play in providing palliative
care.
The Childhood and Youth HPG prioritised health literacy of the
community in relation to healthy child development and developmental
behaviours; whilst upskilling practitioners in the impacts of trauma on
children’s health and development was a priority. There was also
concern that there is a lack of knowledge by primary health practitioners
Health Priority Groups, priority setting
workshops, 2016.
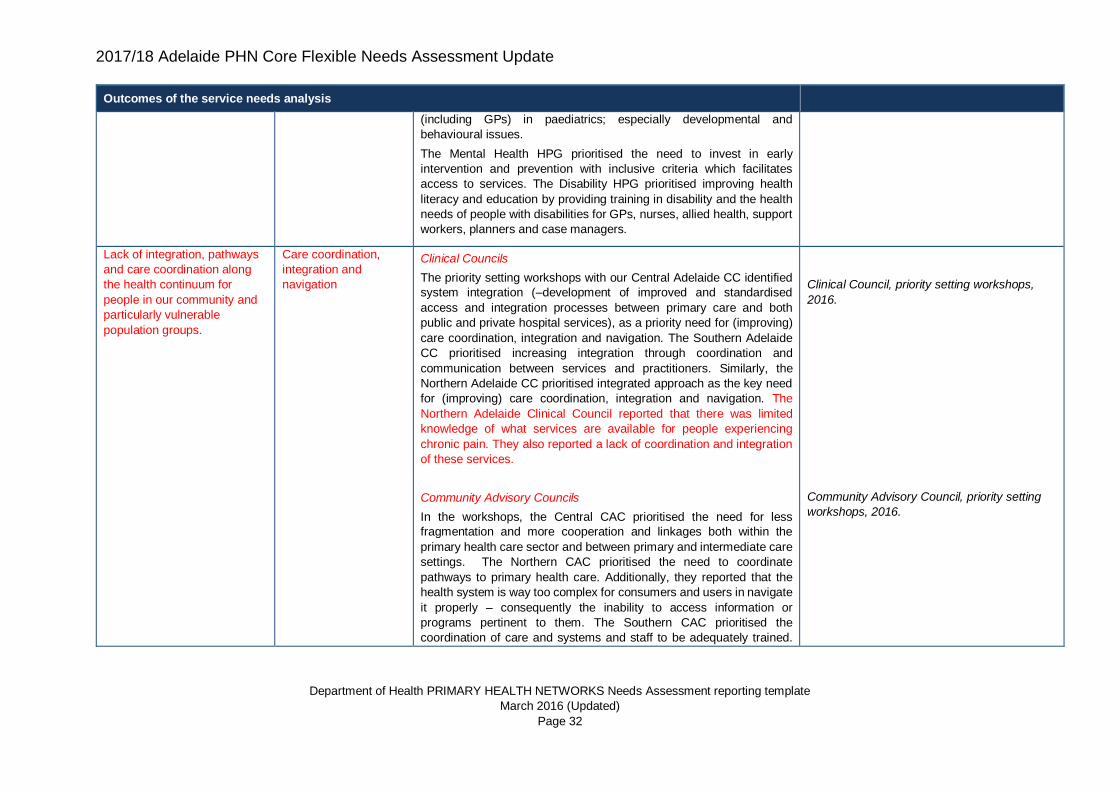
2017/18 Adelaide PHN Core Flexible Needs Assessment Update
Department of Health PRIMARY HEALTH NETWORKS Needs Assessment reporting template
March 2016 (Updated)
Page 32
Outcomes of the service needs analysis
(including GPs) in paediatrics; especially developmental and
behavioural issues.
The Mental Health HPG prioritised the need to invest in early
intervention and prevention with inclusive criteria which facilitates
access to services. The Disability HPG prioritised improving health
literacy and education by providing training in disability and the health
needs of people with disabilities for GPs, nurses, allied health, support
workers, planners and case managers.
Lack of integration, pathways
and care coordination along
the health continuum for
people in our community and
particularly vulnerable
population groups.
Care coordination,
integration and
navigation
Clinical Councils
The priority setting workshops with our Central Adelaide CC identified
system integration (–development of improved and standardised
access and integration processes between primary care and both
public and private hospital services), as a priority need for (improving)
care coordination, integration and navigation. The Southern Adelaide
CC prioritised increasing integration through coordination and
communication between services and practitioners. Similarly, the
Northern Adelaide CC prioritised integrated approach as the key need
for (improving) care coordination, integration and navigation. The
Northern Adelaide Clinical Council reported that there was limited
knowledge of what services are available for people experiencing
chronic pain. They also reported a lack of coordination and integration
of these services.
Community Advisory Councils
In the workshops, the Central CAC prioritised the need for less
fragmentation and more cooperation and linkages both within the
primary health care sector and between primary and intermediate care
settings. The Northern CAC prioritised the need to coordinate
pathways to primary health care. Additionally, they reported that the
health system is way too complex for consumers and users in navigate
it properly – consequently the inability to access information or
programs pertinent to them. The Southern CAC prioritised the
coordination of care and systems and staff to be adequately trained.
Clinical Council, priority setting workshops,
2016.
Community Advisory Council, priority setting
workshops, 2016.
2017/18 Adelaide PHN Core Flexible Needs Assessment Update
Department of Health PRIMARY HEALTH NETWORKS Needs Assessment reporting template
March 2016 (Updated)
Page 33
Outcomes of the service needs analysis
This will enable timely, affordable and accessible services where health
providers communicate and share information about patients in
minimising the duplication of information.
Health Priority Groups
The Disability HPG prioritised the need for a primary health care service
model for people with disabilities which is interagency and
interdisciplinary.
During the priority setting workshops, the Palliative Care HPG
prioritised the need to shift focus from the acute system to the role of
GPs and the navigation issues from the perspective of consumer,
clinician and service provider. Additionally, they identified that
pathways need to be simple and easy to access – a stepped model of
care that is responsive and timely with one person, a case manager /
coordinator, to help sort care when needed will improve care
coordination, integration and navigation.
The Consumers & Carers HPG prioritised that the (health) system
needs to be inclusive of and supportive of formalised carers and care
coordinators. They reported that there is a lack of a unified / interfacing
communication system and culture of care coordination. The
Consumers & Carers HPG also stressed the importance of consumers
and carers knowing about services and how to access them. The HPG
reported that the primary health system is not responsive – conditions
need to escalate before able to access services, and currently there is
a lack of holistic discharge planning and limited availability of primary
health services and community-based after- hours services.
The Childhood & Youth HPG prioritised the need to improve the
(current) disjointed service delivery models which present multiple
barriers to the provision of services being child-focussed. The HPG also
reported there is a lack of identified care coordinators for families with
complex needs and a lack of funding / workforce/ quality which affects
the level of care coordination and collaboration.
Health Priority Groups, priority setting
workshops, 2016.
2017/18 Adelaide PHN Core Flexible Needs Assessment Update
Department of Health PRIMARY HEALTH NETWORKS Needs Assessment reporting template
March 2016 (Updated)
Page 34
Outcomes of the service needs analysis
The Older People & Aged Care HPG prioritised the need to improve
case management, care coordination and advocacy on behalf of
consumers by health professionals, and increase incentives to
encourage collaboration and integration across aged care, acute and
primary care sectors.
The Mental Health HPG prioritised the need to improve the experience
of entry to and navigation of the stepped care and broader service
system.
Community workshops
The Aboriginal Engagement workshops identified poor support,
communication and coordination between services, long wait times and
poor follow through as top irritants experienced in health service use.
APHN Aboriginal Engagement Workshops,
2017.
Access to appropriate and
timely services are pivotal in
reducing avoidable
Emergency Department
presentations and hospital
(re)admissions.
High rates of
preventable
hospitalisations by
sub-regional levels and
age groups in APHN
region
In 2013-14 the age-standardised rate of potentially preventable
hospitalisations (PPH) in the APHN was 2,446 hospitalisations per
100,000 people, consistent with the Australian average rate (NPHA,
2015b).
Approximately six percent of hospitalisations were for vaccine
preventable conditions. Acute conditions, primarily dental conditions,
kidney and urinary tract infections, cellulitis and ear, nose and throat
infections, accounted for 47% of PPH. Chronic conditions also
accounted for 47% of PPH, with the highest rates for chronic
obstructive pulmonary disease (COPD), congestive heart failure,
diabetes complications, iron deficiency anaemia and angina (NHPA,
2015b).
The top five conditions (out of 22 conditions) contributed to
approximately half of the total PPH in the region and almost two-thirds
of total bed days. Heart failure contributed to the highest proportion of
bed days with 16.3% (and 9.1% of PPH), followed by COPD, 14.8%
bed days (10.7% of PPH), kidney and urinary tract infections 13.1%
(11.7% of PPH), diabetes complications 10.1% bed days (7.2% of PPH)
and cellulitis 9.7% of bed days (8.9% of PPH) (NHPA, 2015b).
Age-standardised rates of PPH varied across the APHN region (NHPA,
2015b). Rates for Total PPH were highest in the north and north-west
National Health Performance Authority 2015b,
Healthy Communities: Potentially preventable
hospitalisations in 2013–14.
National Health Performance Authority 2015b,
Healthy Communities: Potentially preventable
hospitalisations in 2013–14.
National Health Performance Authority 2015b,
Healthy Communities: Potentially preventable
hospitalisations in 2013–14.
2017/18 Adelaide PHN Core Flexible Needs Assessment Update
Department of Health PRIMARY HEALTH NETWORKS Needs Assessment reporting template
March 2016 (Updated)
Page 35
Outcomes of the service needs analysis
areas of the APHN, specifically the Statistical Area Level 3s of Playford,
Port Adelaide – West, Salisbury and Port Adelaide – East. Rates were
lowest in Burnside, Unley and Prospect – Walkerville.
The same four SA3s (Playford, Port Adelaide – West, Salisbury and
Port Adelaide – East) as well as Onkaparinga in APHN’s south, had the
highest rates of PPH for Chronic conditions (NHPA, 2015b).
There was less variation in the PPH rates for Acute and Vaccine-
preventable across the region, but they were highest in the SA3s of
Playford, Adelaide City, Port Adelaide – East, Salisbury, Tea Tree
Gully, Marion and West Torrens (NHPA, 2015b).
The rates of PPH in the region generally increased with age, with
people 85 years and older with the highest rates. The exception to this
is the 0-4 year olds and 5-9 year olds, who for total, vaccine-
preventable, and acute conditions had PPH rates comparable to people
aged 60 to 69 years old (SA Health 2016c).
National Health Performance Authority 2015b,
Healthy Communities: Potentially preventable
hospitalisations in 2013–14.
National Health Performance Authority 2015b,
Healthy Communities: Potentially preventable
hospitalisations in 2013–14.
National Health Performance Authority 2015b,
Healthy Communities: Potentially preventable
hospitalisations in 2013–14.
SA Health, 2016c, PPA Data for Adelaide
Primary Health Network (PHN), unpublished.
Increase utilisation of specific
MBS item numbers by General
Practitioners for Aboriginal and
Torres Strait Islander
people/patients.
Primary health care for
Aboriginal and Torres
Strait Islanders
Analysis of Medicare Benefits Statistics on item number 715 by PHN
(AHIW, 2016d) and analysis of Medicare Benefits Statistics by PHN
and by SA3 highlighted that Aboriginal Health Assessments are lower
in the APHN when compared to other PHNs, and at sub-regional levels
particularly in Statistical Area Level 3 (SA3) of Playford, Port Adelaide-
East and West, Salisbury, Onkaparinga, and Charles Sturt (DoH,
2016).
During the Priority setting workshops, the Aboriginal HPG emphasised
the need to improve the uptake of the Aboriginal (children and adult)
health check.
Australian Institute of Health and Welfare
(AIHW), 2016d, analysis of Department of
Human Services Medicare Benefits Statistics,
2011/12 to 2013/14.
Department of Health (DoH), 2016, Medicare
Benefits Schedule, 2013/14 – 2014/15,
unpublished.
Health Priority Groups, priority setting
workshops, 2016.
Improving access to and
effectiveness of primary health
care services for older persons
Healthy ageing
The Older Persons & Aged Care HPG identified the following issues as
priority needs for the HPG:
• loneliness (social isolation),
• quality use of medications leading to increased mortality,
morbidity and falls,
• lack of access to primary mental health care services (for older
people),
Health Priority Group, priority setting
workshops, 2016.
2017/18 Adelaide PHN Core Flexible Needs Assessment Update
Department of Health PRIMARY HEALTH NETWORKS Needs Assessment reporting template
March 2016 (Updated)
Page 36
Outcomes of the service needs analysis
• Lack of care coordination and pathways between acute,
primary health care and aged/social care services,
• raising awareness of health professionals to the early warning
signs of dementia , and
• palliative care (e.g. communication of end of life transition,
knowledge in workforce about palliative care referral
pathways, use of Advanced Care Plans).
The Aboriginal Health HPG identified access to services for older
people as an issue, including support for activities such as equipment
provision, transport (including transport back home for people requiring
palliative care.) Perceptions about aged care can also be a barrier to
access as is a lack of knowledge of available services.
The Central Adelaide Clinical Council reported that there are currently
no palliative care beds in the South Australian community. They
reported a lack of standardised documentation of clinical instructions,
a lack of knowledge of health care providers available, poor
understanding and lack of access to palliative medicines and a lack of
out-of-hours continuity of care.
The Northern Adelaide Clinical Council also reported that there was a
need for good palliative care for people with comorbidities and mental
health support.
Mental health-related medication
In 2013-14, for people aged 65+ years, the highest rates of dispensing
of antidepressant medications in the APHN region was in the Statistical
Area Level 3 (SA3) of Playford with 244,017 prescriptions per 100,000
people; the South Australian rate was 206,606 per 100,000 (ACSQHC,
2015). Rates for antidepressant dispensing were also high in
Onkaparinga (217,803), Tea Tree Gully (217,739), Salisbury (216,313),
and Norwood-Payneham-St Peters (216,138) (ACSQHC, 2015).
Clinical Councils, priority setting workshops,
2016.
Australian Commission of Safety and Quality in
Health Care (ACSQHC) and the National
Health Performance Authority, 2015,
Australian Atlas of Healthcare Variation.
2017/18 Adelaide PHN Core Flexible Needs Assessment Update
Department of Health PRIMARY HEALTH NETWORKS Needs Assessment reporting template
March 2016 (Updated)
Page 37
Outcomes of the service needs analysis
Playford SA3 had the 2nd highest rate of PBS prescriptions dispensed
for anxiolytic (anti-anxiety) medicines in Australia for people aged 65
years and over with 74,380 per 100,000 people, twice the Australian
rate (ACSQHC, 2015). Rates for anxiolytic dispensing were also high
in Port Adelaide - West (59,011), Salisbury (58,342), Tea Tree Gully
(54,215), and Marion (52,324) (ACSQHC, 2015).
The highest rates of antipsychotic medicines dispensing for people
aged 65 years and over occurred in the SA3s of Port Adelaide - West
(33,404), Norwood-Payneham-St Peters (32,932), Adelaide City
(31,730), Playford (31,364), and Unley (31,002) (ACSQHC, 2015).
Rates of PBS prescriptions dispensed for anticholinesterase
medicines, which are used to treat Alzheimer’s, in people aged 65
years and over were notably higher in the SA3s of Charles Sturt
(21,369), Port Adelaide - West (19,923), Adelaide City (18,004), and
Playford (17,666) compared to the Australian rate, 12,650 prescriptions
per 100,000 people (ACSQHC, 2015).
While there is a correlation between areas of lower socioeconomic
status particularly in the north of the APHN region, and higher rates of
mental health-related PBS prescriptions dispensing to people aged 65
years, the patterns may also reflect the distribution of older residents
and the density of aged care facilities across the APHN region. The
APHN also notes that based on the available data, it is not possible to
determine the extent to which antidepressant and antipsychotic
medicines were prescribed for conditions other than mental health.
Hospitalisations
In South Australia, people aged 65 years and over take up a
disproportionately large amount of overnight stays in hospital, with
people aged between 65-75 years of age twice as likely as the rest of
the population to be admitted to hospital. In particular, despite being
only 4.9% of the population, people aged 80 and over take up more
than 25% of overnights stays, with those aged over 85 years are more
than five times as likely to be admitted to hospital (OFTA, 2014).
Office for the Ageing (OFTA), 2014, Prosperity
through longevity: South Australia’s ageing
plan, our vision 2014-2019.
2017/18 Adelaide PHN Core Flexible Needs Assessment Update
Department of Health PRIMARY HEALTH NETWORKS Needs Assessment reporting template
March 2016 (Updated)
Page 38
Outcomes of the service needs analysis
In 2015-16 people aged 65+ years and living in the APHN region made
up 48% of potentially preventable hospitalisations in South Australian
hospitals; people aged 85 years and over made up 14% (SA Health,
2017). The rates of potentially preventable hospitalisations in the
region generally increased with age, with people 80 years and older
with the highest rates. In 2015/16 the four most common conditions
leading to a ‘potentially preventable’ hospitalisation in people aged 65
years and older were chronic obstructive pulmonary disease,
congestive cardiac failure, urinary tract infections, and diabetes
complications (SA Health, 2017).
Feedback from the Central Adelaide Clinical Council reported that one
in four people over age 75 have an unplanned hospital admission due
to a medication related problem.
At the APHN level, older people residing in APHN accounted for 9% of
AOD-related hospital separations. However, they comprised higher
proportions of separations for alcohol (15%) and opioids (16%) (Roche
et al., 2017).
The number of fentanyl-related deaths in Australia increased between
2002/03 and 2010/11. While fentanyl prescriptions were most prevalent
among females over 80 years, fentanyl-related deaths most commonly
occurred among males aged 30-49 years (Roxburgh et al., 2011).
Primary health care services
Community consultations conducted by the former Medicare Locals in
the APHN region reported a number of issues for older adults including
access to transport, social isolation, coordination of health and social
services, capacity to navigate the health system and coordination of
end of life and palliative care (CAHML, 2015; SAFKIML 2015; NAML
2015). Barriers to access, particularly for older CALD communities
SA Health, 2017, PPA Data for Adelaide
Primary Health Network (PHN), unpublished
Central Adelaide Clinical Council priority
setting workshops, 2016
Roche, A.M., Fischer, J., McEntee A., Pidd K.,
2017, Drug and Alcohol Use Among Select
South Australian At-Risk Group, National
Centre for Education and Training on Addiction
(NCETA), Flinders University, Adelaide, South
Australia, unpublished.
Roxburgh, A., Bruno, R., Larance, B., & Burns,
L. (2011). Prescription of opioid analgesics and
related harms in Australia. Medical Journal of
Australia, 195(5), 280-284.
Central Adelaide and Hills Medicare Local
(CAHML), 2015, Health Profile: a population
health needs assessment of the Central
Adelaide and Hills region, 2015; Southern
Adelaide Fleurieu Kangaroo Island Medicare
Local (SAFKIML), 2015, Comprehensive
2017/18 Adelaide PHN Core Flexible Needs Assessment Update
Department of Health PRIMARY HEALTH NETWORKS Needs Assessment reporting template
March 2016 (Updated)
Page 39
Outcomes of the service needs analysis
include language, the reliance on online information and registration for
services, and changes to and within community support agencies
(Principe, 2015).
Needs Assessment Report; Northern Adelaide
Medical Local (NAML), 2015, Comprehensive
Needs Assessment Report.
Principe, I., 2015, Issues in Health Care in
South Australia for People form Culturally and
Linguistically Diverse Backgrounds – A
Scoping Study for the Health Performance
Council SA, assessed February 2016.
After-Hours
Lack of awareness amongst
both the community and
healthcare providers about the
after-hours services available
in their regions, and a lack of
access to appropriated after-
hours services
A possible after-hours service
gap exists in the northern
fringes (Angle Vale) and
south-eastern areas (McLaren
Vale and Willunga) of the
APHN region.
After-hours services
The Southern Adelaide Clinical Council reported during a planning
workshop that young people in crisis do not always receive help in a
timely manner. The Central Adelaide Clinical Council also reported that
there is a lack of available psychiatric services and the Northern
Adelaide Clinical Council raised the issue that mental health services
were 9 to 5 and an extended hour ‘walk in clinic’ was needed in the
North.
APHN analysis of SA Health data indicated that approximately two-
fifths of all unplanned Emergency Department (ED) presentations in the
2013/14 and 2014/15 financial years occurred in the after-hours period,
and two-fifths of these presentations were triaged as semi-urgent or
non-urgent (SA Health, 2015d). Approximately two-thirds of these
presentation were self-, relative- or friend-referrals. The Local
Government Areas of Playford, Onkaparinga, Adelaide and Walkerville
had the highest presentation rates in this period. Approximately 1 out
of every 10 presentations was for a potentially preventable-type
condition. Ear, Nose, Throat infections, Cellulitis, Urinary Tract
infections, Dental conditions and Asthma are potentially preventable
conditions presenting at EDs in the after-hours period in APHN region
especially the LGAs of Playford and Onkaparinga.
Clinical Council, priority setting workshops,
2016.
SA Health, 2015d, Emergency Department
Presentations, 2013/14 – 2014/15,
unpublished analysis undertaken by APHN.
2017/18 Adelaide PHN Core Flexible Needs Assessment Update
Department of Health PRIMARY HEALTH NETWORKS Needs Assessment reporting template
March 2016 (Updated)
Page 40
Outcomes of the service needs analysis
Approximately 16,000 episodes were triaged to the healthdirect After-
Hours GP Helpline in the 2014/15 financial year; approximately 20% of
all calls made by APHN residents to the healthdirect Nurse Triage
Helpline (HealthDirect Australia 2016).
While there are currently a number of Medical Deputising Services
operating in the after-hours period across the APHN, analysis of their
service boundaries show that there are pockets within in the north of
the Playford LGA, and south-eastern region of the Onkaparinga LGA
that are not being serviced (APHN, 2016).
Between 2012/13 and 2014/15, non-urgent after-hours attendances by
general practitioners increased by 23%, and urgent after-hours
attendances by 26% in the same period (DOH, 2015). Data provided
by the National Health Performance Agency (NHPA, 2016) indicated
that in the 2013/14 financial year the average number of after-hours GP
attendances per person (age-standardised) was highest in the SA3 of
Playford (0.98 attendances), followed by Adelaide City and Port
Adelaide – West (both 0.71), all higher than the PHN average of 0.55
attendances per person (NHPA 2016).
Data provided by the National Health Performance Agency (NHPA,
2016) indicate that in the 2013/14 financial year, the SA3s with the
highest average number of unplanned, non-urgent, semi-urgent and
urgent after-hours ED attendances in the APHN region were Playford
(137 attendances per 1,000 people), Onkaparinga (126 attendances)
and Adelaide City (117 attendances). These rates are markedly higher
than the APHN average of 93 attendances per 1,000 people (NHPA,
2016).
Community consultations conducted by the former Medicare Locals in
the APHN region raised a number of issues including limited
understanding of the available after-hours services in the metropolitan
HealthDirect Australia, 2016, HealthMap data
2014/15, unpublished, assessed September
2016.
Adelaide Primary Health Network (APHN),
2016, analysis of Medical deputising service
provider websites (National Home Doctor
Service, MedVisit, Australian Family Home
Doctor, Doctor To You, Call The Doctor,
Western Suburbs After Hours, My Doctor
Now), unpublished, assessed August 2016.
Department of Health (DOH), 2015, Medicare
Benefits Schedule, 2013/14 – 2014/15,
analysis undertaken by APHN, unpublished.
National Health Performance Authority
(NHPA), 2016, Healthy Communities: Use of
emergency department and GP services in
2013-14.
National Health Performance Authority
(NHPA), 2016, Healthy Communities: Use of
emergency department and GP services in
2013-14.
Central Adelaide and Hills Medicare Local
(CAHML), 2015, Health Profile: a population
health needs assessment of the Central
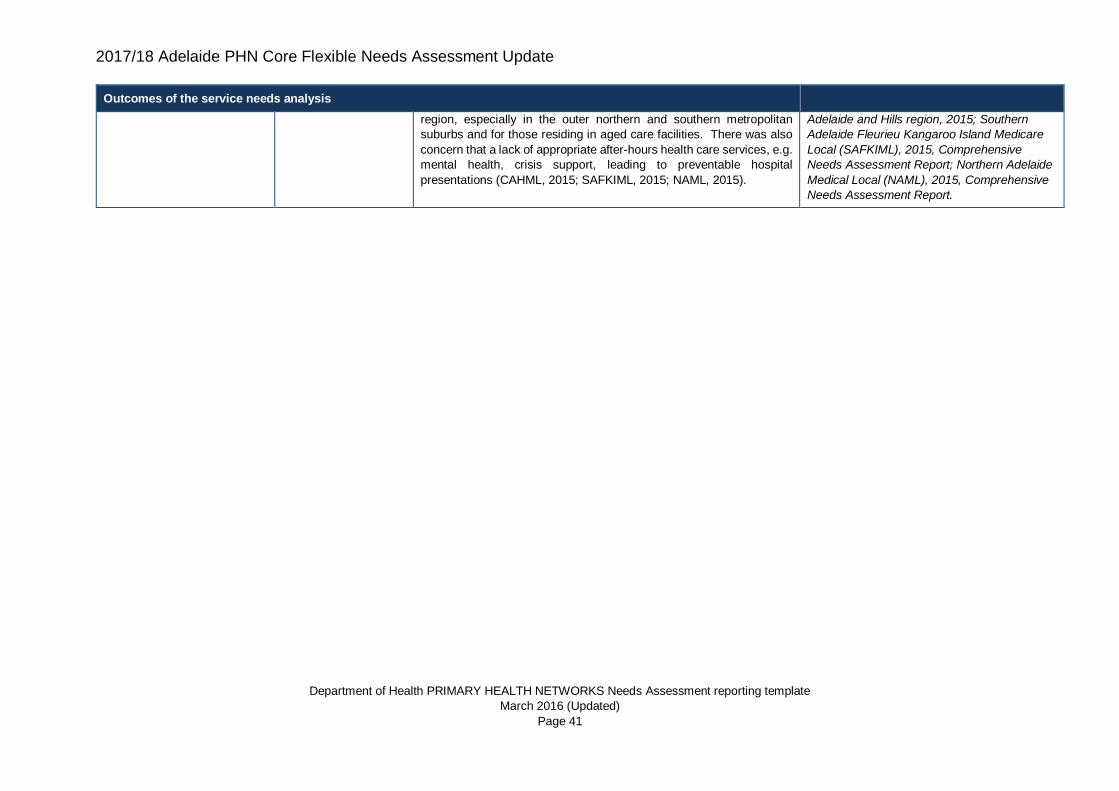
2017/18 Adelaide PHN Core Flexible Needs Assessment Update
Department of Health PRIMARY HEALTH NETWORKS Needs Assessment reporting template
March 2016 (Updated)
Page 41
Outcomes of the service needs analysis
region, especially in the outer northern and southern metropolitan
suburbs and for those residing in aged care facilities. There was also
concern that a lack of appropriate after-hours health care services, e.g.
mental health, crisis support, leading to preventable hospital
presentations (CAHML, 2015; SAFKIML, 2015; NAML, 2015).
Adelaide and Hills region, 2015; Southern
Adelaide Fleurieu Kangaroo Island Medicare
Local (SAFKIML), 2015, Comprehensive
Needs Assessment Report; Northern Adelaide
Medical Local (NAML), 2015, Comprehensive
Needs Assessment Report.
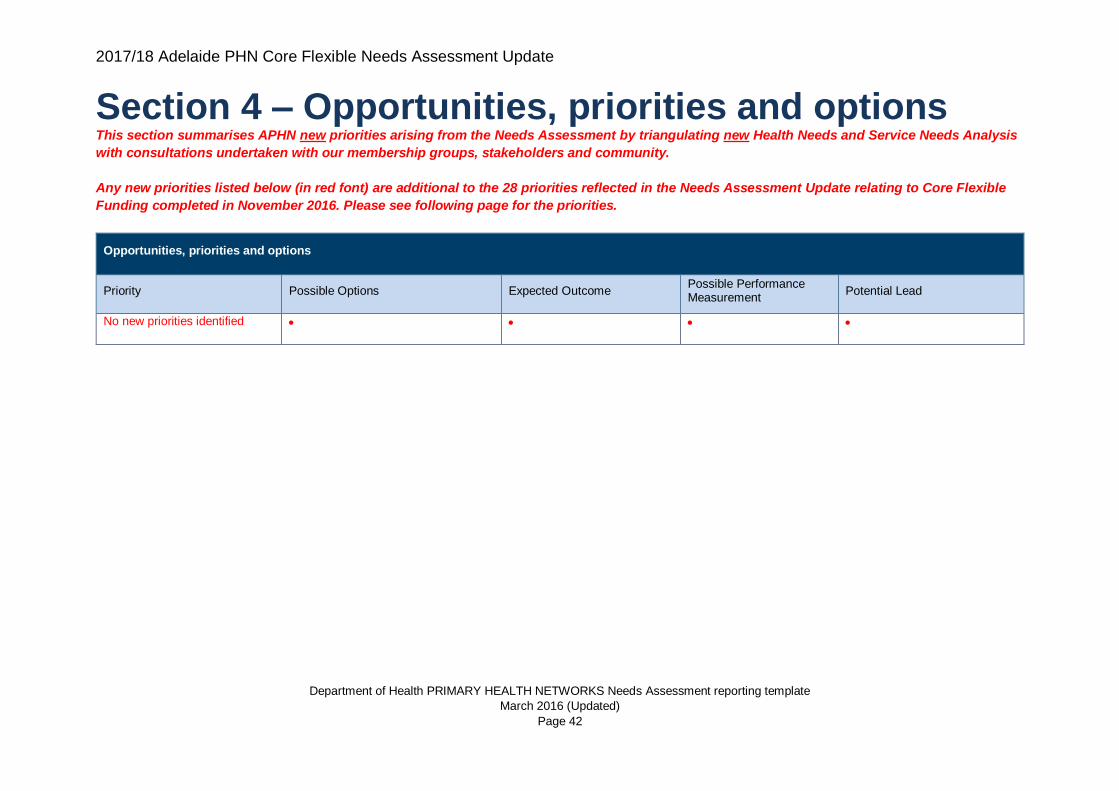
2017/18 Adelaide PHN Core Flexible Needs Assessment Update
Department of Health PRIMARY HEALTH NETWORKS Needs Assessment reporting template
March 2016 (Updated)
Page 42
Section 4 – Opportunities, priorities and options This section summarises APHN new priorities arising from the Needs Assessment by triangulating new Health Needs and Service Needs Analysis
with consultations undertaken with our membership groups, stakeholders and community.
Any new priorities listed below (in red font) are additional to the 28 priorities reflected in the Needs Assessment Update relating to Core Flexible
Funding completed in November 2016. Please see following page for the priorities.
Opportunities, priorities and options
Priority Possible Options Expected Outcome Possible Performance Measurement
Potential Lead
No new priorities identified
• • • •
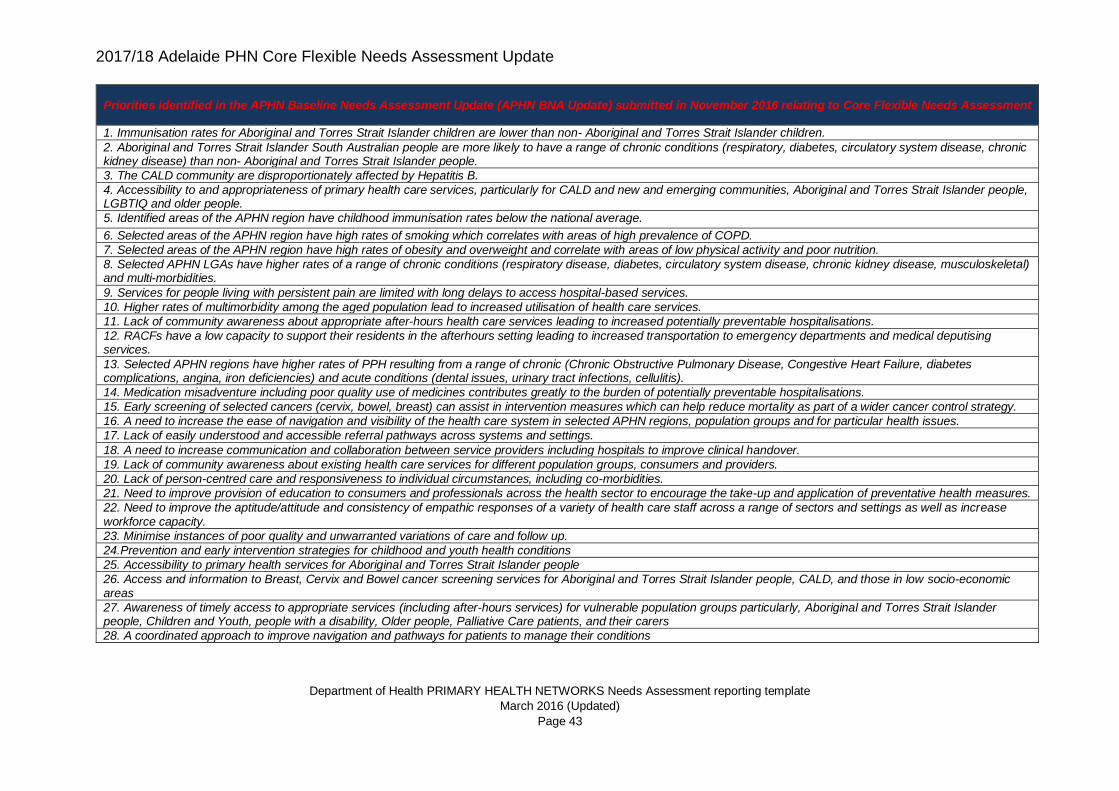
2017/18 Adelaide PHN Core Flexible Needs Assessment Update
Department of Health PRIMARY HEALTH NETWORKS Needs Assessment reporting template
March 2016 (Updated)
Page 43
Priorities identified in the APHN Baseline Needs Assessment Update (APHN BNA Update) submitted in November 2016 relating to Core Flexible Needs Assessment
1. Immunisation rates for Aboriginal and Torres Strait Islander children are lower than non- Aboriginal and Torres Strait Islander children.
2. Aboriginal and Torres Strait Islander South Australian people are more likely to have a range of chronic conditions (respiratory, diabetes, circulatory system disease, chronic kidney disease) than non- Aboriginal and Torres Strait Islander people.
3. The CALD community are disproportionately affected by Hepatitis B.
4. Accessibility to and appropriateness of primary health care services, particularly for CALD and new and emerging communities, Aboriginal and Torres Strait Islander people, LGBTIQ and older people.
5. Identified areas of the APHN region have childhood immunisation rates below the national average.
6. Selected areas of the APHN region have high rates of smoking which correlates with areas of high prevalence of COPD.
7. Selected areas of the APHN region have high rates of obesity and overweight and correlate with areas of low physical activity and poor nutrition.
8. Selected APHN LGAs have higher rates of a range of chronic conditions (respiratory disease, diabetes, circulatory system disease, chronic kidney disease, musculoskeletal) and multi-morbidities.
9. Services for people living with persistent pain are limited with long delays to access hospital-based services.
10. Higher rates of multimorbidity among the aged population lead to increased utilisation of health care services.
11. Lack of community awareness about appropriate after-hours health care services leading to increased potentially preventable hospitalisations.
12. RACFs have a low capacity to support their residents in the afterhours setting leading to increased transportation to emergency departments and medical deputising services.
13. Selected APHN regions have higher rates of PPH resulting from a range of chronic (Chronic Obstructive Pulmonary Disease, Congestive Heart Failure, diabetes complications, angina, iron deficiencies) and acute conditions (dental issues, urinary tract infections, cellulitis).
14. Medication misadventure including poor quality use of medicines contributes greatly to the burden of potentially preventable hospitalisations.
15. Early screening of selected cancers (cervix, bowel, breast) can assist in intervention measures which can help reduce mortality as part of a wider cancer control strategy.
16. A need to increase the ease of navigation and visibility of the health care system in selected APHN regions, population groups and for particular health issues.
17. Lack of easily understood and accessible referral pathways across systems and settings.
18. A need to increase communication and collaboration between service providers including hospitals to improve clinical handover.
19. Lack of community awareness about existing health care services for different population groups, consumers and providers.
20. Lack of person-centred care and responsiveness to individual circumstances, including co-morbidities.
21. Need to improve provision of education to consumers and professionals across the health sector to encourage the take-up and application of preventative health measures.
22. Need to improve the aptitude/attitude and consistency of empathic responses of a variety of health care staff across a range of sectors and settings as well as increase workforce capacity.
23. Minimise instances of poor quality and unwarranted variations of care and follow up.
24.Prevention and early intervention strategies for childhood and youth health conditions
25. Accessibility to primary health services for Aboriginal and Torres Strait Islander people
26. Access and information to Breast, Cervix and Bowel cancer screening services for Aboriginal and Torres Strait Islander people, CALD, and those in low socio-economic areas
27. Awareness of timely access to appropriate services (including after-hours services) for vulnerable population groups particularly, Aboriginal and Torres Strait Islander people, Children and Youth, people with a disability, Older people, Palliative Care patients, and their carers
28. A coordinated approach to improve navigation and pathways for patients to manage their conditions
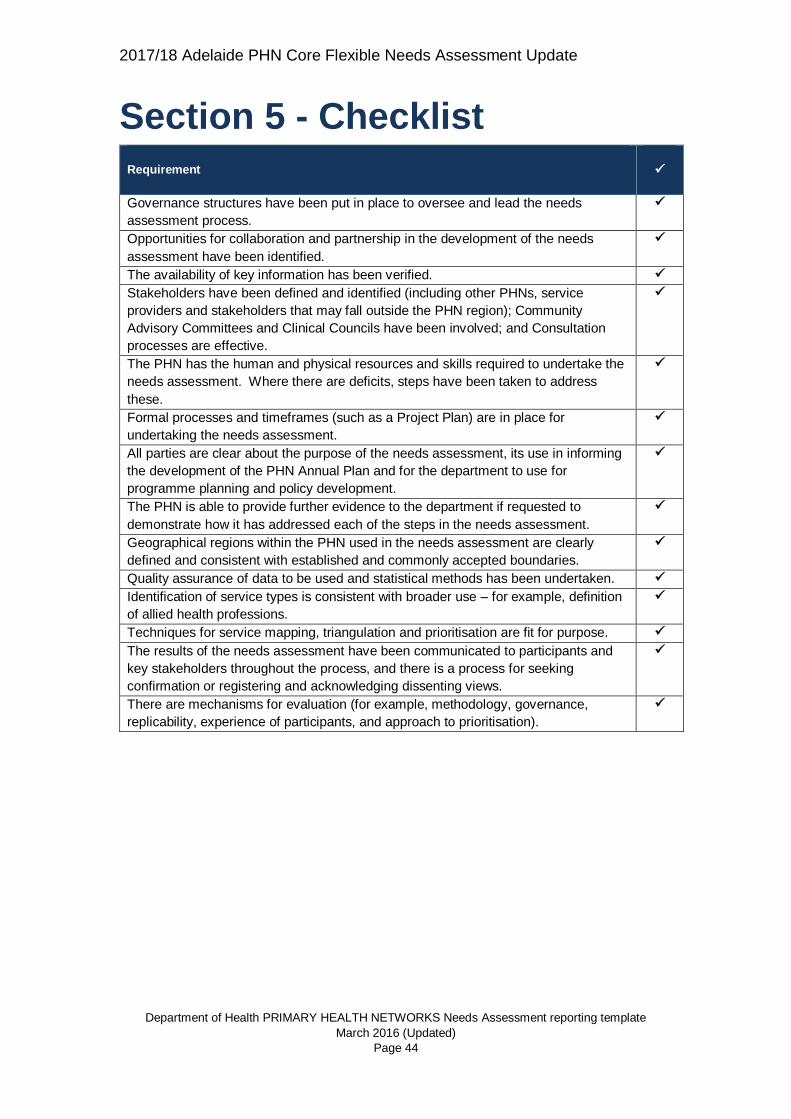
2017/18 Adelaide PHN Core Flexible Needs Assessment Update
Department of Health PRIMARY HEALTH NETWORKS Needs Assessment reporting template
March 2016 (Updated)
Page 44
Section 5 - Checklist Requirement
✓
Governance structures have been put in place to oversee and lead the needs
assessment process.
✓
Opportunities for collaboration and partnership in the development of the needs
assessment have been identified.
✓
The availability of key information has been verified. ✓
Stakeholders have been defined and identified (including other PHNs, service
providers and stakeholders that may fall outside the PHN region); Community
Advisory Committees and Clinical Councils have been involved; and Consultation
processes are effective.
✓
The PHN has the human and physical resources and skills required to undertake the
needs assessment. Where there are deficits, steps have been taken to address
these.
✓
Formal processes and timeframes (such as a Project Plan) are in place for
undertaking the needs assessment.
✓
All parties are clear about the purpose of the needs assessment, its use in informing
the development of the PHN Annual Plan and for the department to use for
programme planning and policy development.
✓
The PHN is able to provide further evidence to the department if requested to
demonstrate how it has addressed each of the steps in the needs assessment.
✓
Geographical regions within the PHN used in the needs assessment are clearly
defined and consistent with established and commonly accepted boundaries.
✓
Quality assurance of data to be used and statistical methods has been undertaken. ✓
Identification of service types is consistent with broader use – for example, definition
of allied health professions.
✓
Techniques for service mapping, triangulation and prioritisation are fit for purpose. ✓
The results of the needs assessment have been communicated to participants and
key stakeholders throughout the process, and there is a process for seeking
confirmation or registering and acknowledging dissenting views.
✓
There are mechanisms for evaluation (for example, methodology, governance,
replicability, experience of participants, and approach to prioritisation).
✓