neighborhood and individual effects of housing production ... · university of chicago ....
TRANSCRIPT
Occasional Studies
Jose Elias Serrania Bravo University of Chicago
Neighborhood and Individual Effects of Housing Production Trust Fund (HPTF) Buildings and Residents
Additional Benefits of the City’s Primary Affordable Housing Policy Tool
Office of Revenue Analysis Office of the Chief Financial Officer
District of Columbia Government
Issued November 2019
2
I. Introduction
In this study, we analyzed the individual and the neighborhood effects of affordable housing units funded by the Housing Production Trust Fund (HPTF). The HPTF is a special revenue fund administered by the District of Columbia Department of Housing and Community Development (DHCD) that provides gap financing for residential projects affordable to low- and moderate-income households. 1 Since 2001, over 9,000 affordable housing units have been produced using the HPTF.2 Via a series of difference-in-differences econometric models, this study compares city individual income tax filers that moved into HPTF financed buildings in 2014 (the treatment group) to socio- and demographically similar individual income tax filers residing in comparable nonsubsidized multifamily buildings (the control group). We found individual income tax filers that moved into HPTF buildings had a higher likelihood of receiving the Child Care Tax Credit and claimed higher values for the credit compared to the control group. And using a cross sectional analysis at the census tract level, we found additional HPTF residential units and residents in a neighborhood had positive effects on median neighborhood wages and median neighborhood single-family home values. II. Policy Background
The HPTF was created by the Housing Production Trust Fund Act of 1988, and first received regular funding in 2001. This legislation requires for each fiscal year:
• At least 40 percent of HPTF spending serves households with incomes below 30 percent of the area median family income (MFI),
• At least another 40 percent serves households with incomes between 30 and 50 percent MFI, and
• The balance of funds serves households with up to 80 percent MFI.
Income limits and rents for HPTF buildings are shown in tables below:3
1 The HPTF is funded through dedicated tax revenue equal to 15 percent of all deed recordation and transfer taxes as well as periodic special revenue dedications from the city’s General Fund. Most HPTF funds are for rental housing. 2 District of Columbia Department of Housing and Community Development. Housing Production Trust Fund. https://dhcd.dc.gov/page/housing-production-trust-fund 3 District of Columbia Department of Housing and Community Development. (2019). Housing Production Trust Fund (HPTF) Program Limits. Washington, DC. https://dhcd.dc.gov/sites/default/files/dc/sites/dhcd/publication/attachments/HPTF%20Program%20Limits%20of%20July%201%202018.formatted%20a.pdf
3
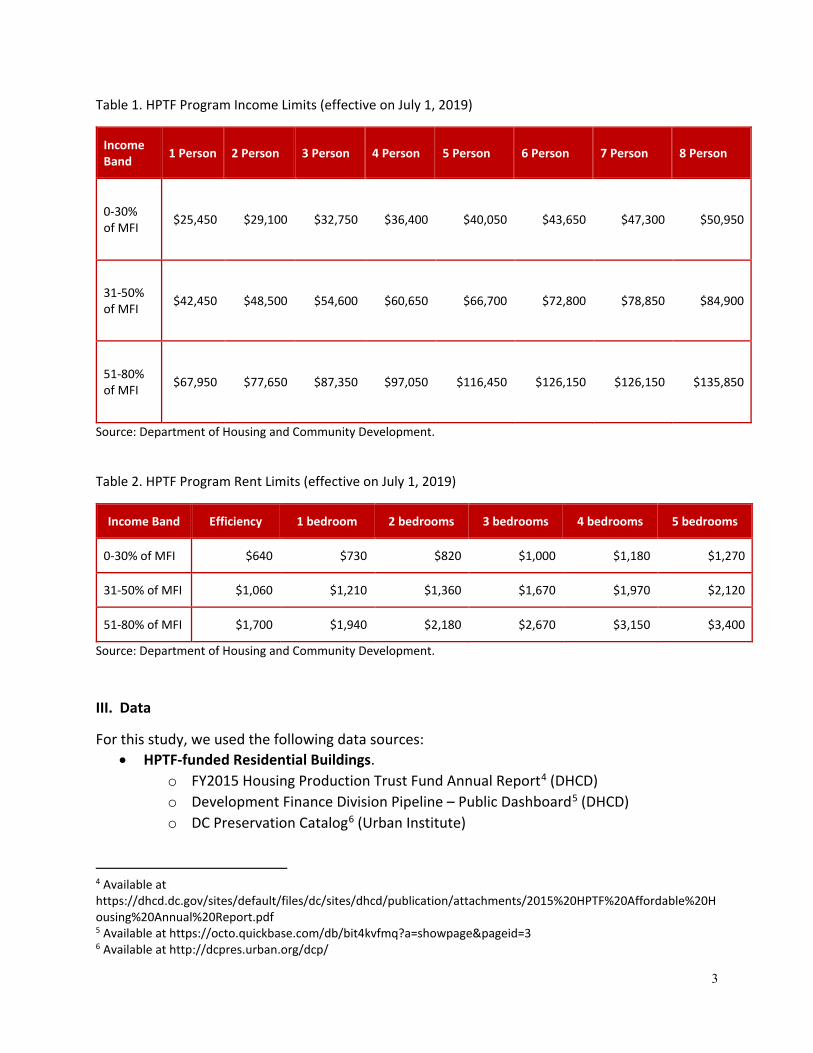
Table 1. HPTF Program Income Limits (effective on July 1, 2019)
Income Band 1 Person 2 Person 3 Person 4 Person 5 Person 6 Person 7 Person 8 Person
0-30% of MFI $25,450 $29,100 $32,750 $36,400 $40,050 $43,650 $47,300 $50,950
31-50% of MFI $42,450 $48,500 $54,600 $60,650 $66,700 $72,800 $78,850 $84,900
51-80% of MFI $67,950 $77,650 $87,350 $97,050 $116,450 $126,150 $126,150 $135,850
Source: Department of Housing and Community Development. Table 2. HPTF Program Rent Limits (effective on July 1, 2019)
Income Band Efficiency 1 bedroom 2 bedrooms 3 bedrooms 4 bedrooms 5 bedrooms
0-30% of MFI $640 $730 $820 $1,000 $1,180 $1,270
31-50% of MFI $1,060 $1,210 $1,360 $1,670 $1,970 $2,120
51-80% of MFI $1,700 $1,940 $2,180 $2,670 $3,150 $3,400
Source: Department of Housing and Community Development. III. Data
For this study, we used the following data sources: • HPTF-funded Residential Buildings.
o FY2015 Housing Production Trust Fund Annual Report4 (DHCD) o Development Finance Division Pipeline – Public Dashboard5 (DHCD) o DC Preservation Catalog6 (Urban Institute)
4 Available at https://dhcd.dc.gov/sites/default/files/dc/sites/dhcd/publication/attachments/2015%20HPTF%20Affordable%20Housing%20Annual%20Report.pdf 5 Available at https://octo.quickbase.com/db/bit4kvfmq?a=showpage&pageid=3 6 Available at http://dcpres.urban.org/dcp/
4
• Individual Income Tax Data. This data was geocoded and includes information on income, filing status, addresses and tax credits for all city income tax filers. (District of Columbia Office of Revenue Analysis)
• Property Tax Data. Contains information related to each property’s assessment value. (District of Columbia Office of Revenue Analysis)
• American Community Survey 5-Year estimate. Contains socioeconomic information at the census tract level. (U.S. Census Bureau)
• Master Address Repository. Dataset that contains locations and attributes of all the District’s address points.7 (District of Columbia Office of the Chief Technology Officer)
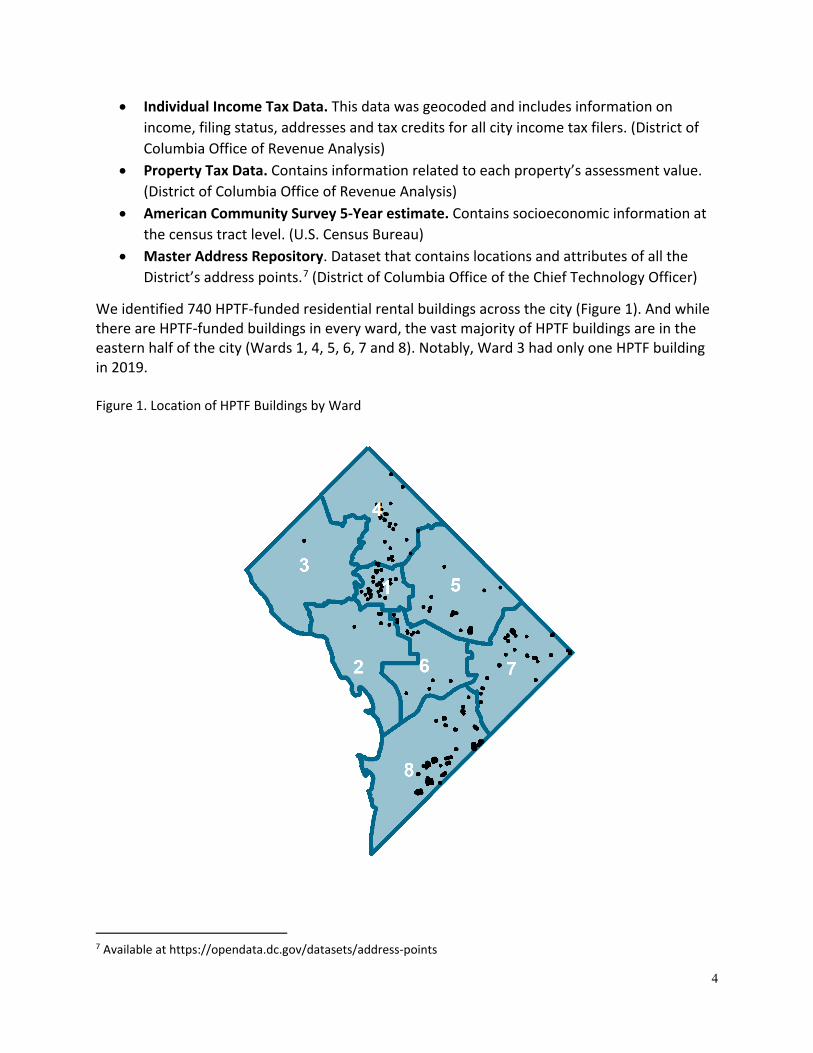
We identified 740 HPTF-funded residential rental buildings across the city (Figure 1). And while there are HPTF-funded buildings in every ward, the vast majority of HPTF buildings are in the eastern half of the city (Wards 1, 4, 5, 6, 7 and 8). Notably, Ward 3 had only one HPTF building in 2019. Figure 1. Location of HPTF Buildings by Ward
7 Available at https://opendata.dc.gov/datasets/address-points
5
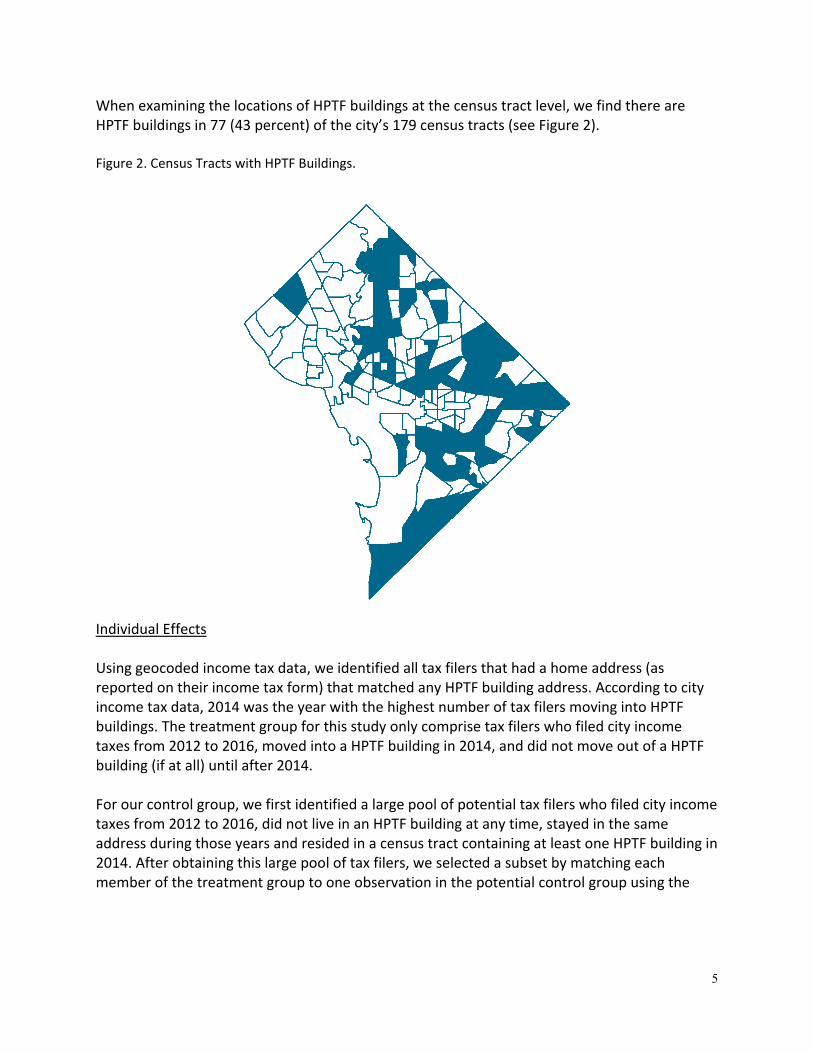
When examining the locations of HPTF buildings at the census tract level, we find there are HPTF buildings in 77 (43 percent) of the city’s 179 census tracts (see Figure 2). Figure 2. Census Tracts with HPTF Buildings.
Individual Effects Using geocoded income tax data, we identified all tax filers that had a home address (as reported on their income tax form) that matched any HPTF building address. According to city income tax data, 2014 was the year with the highest number of tax filers moving into HPTF buildings. The treatment group for this study only comprise tax filers who filed city income taxes from 2012 to 2016, moved into a HPTF building in 2014, and did not move out of a HPTF building (if at all) until after 2014. For our control group, we first identified a large pool of potential tax filers who filed city income taxes from 2012 to 2016, did not live in an HPTF building at any time, stayed in the same address during those years and resided in a census tract containing at least one HPTF building in 2014. After obtaining this large pool of tax filers, we selected a subset by matching each member of the treatment group to one observation in the potential control group using the

6
MatchIt R package.8 Specifically, we identified our control group using the method of nearest neighbor matching9 based on the following variables: number of dependents in 2012, federal adjusted gross income (FAGI) in 2012, being an Earned Income Tax Credit (EITC) beneficiary in 2012, wages and salaries in 2012, number of dependents in 2013, FAGI in 2013, being an EITC beneficiary in 2013, wages and salaries in 2013, filing status, age in 2012 and census tract. Descriptive statistics of the treatment and control groups can be seen in Table 3. Table 3. Control and treatment groups descriptive variables
Variable Control Treatment Number of observations 442 442 Mean number of dependents (2012) 1.17 1.18 Mean age (2012) 38.55 38.64 Percentage filed as single (2012) 43% 40% Percentage filed as married (2012) 5% 7% Percentage filed as head of household (2012) 51% 51% Mean FAGI (2012) $35,028 $28,574 Percentage EITC beneficiary (2012) 61% 60% Mean wages (2012) $27,783 $27,358 Mean FAGI (2013) $37,496 $30,056 Percentage EITC beneficiary (2013) 60% 58% Mean wages (2013) $29,468 $28,873 Mean Child Care Tax Credit Value $45 $50
Neighborhood Effects In order to identify the effects of HPTF funded projects on neighborhoods, we identified individual income tax filers that filed from HPTF buildings in 2016. We aggregated all income tax information at the census tract level. We used the property tax data to obtain each census
8 Matchit is an R program that selects matched samples of the original treated groups based on similar covariate distributions, propensity scores and a variety of other matching procedures. It allows for a reduce dependence of causal inferences on hard-to-justify, but commonly made, statistical modeling assumptions. Matchit essentially creates matched samples by pruning away individuals in the control group that are dissimilar from units in the treated group. That is, reducing selection bias. (Ho, D. E., Imai, K., King, G., & Stuart, E. A. (2011). MatchIt: Nonparametric preprocessing for parametric causal inference. Journal of Statistical Software, 42(8), 1-28.).
9 Nearest neighbor matching is a statistical technique that involves pairing a given point with another, ‘closest’ point. Setting up a nearest neighbor analysis involves choosing the criteria for ‘closeness’—this could be a list of properties, the value of one particular property, or a propensity score.
7
tract’s median property value for single-family homes and the American Community Survey 5-year estimates to obtain each socioeconomic information for each census tract in the analysis. IV. Methodology
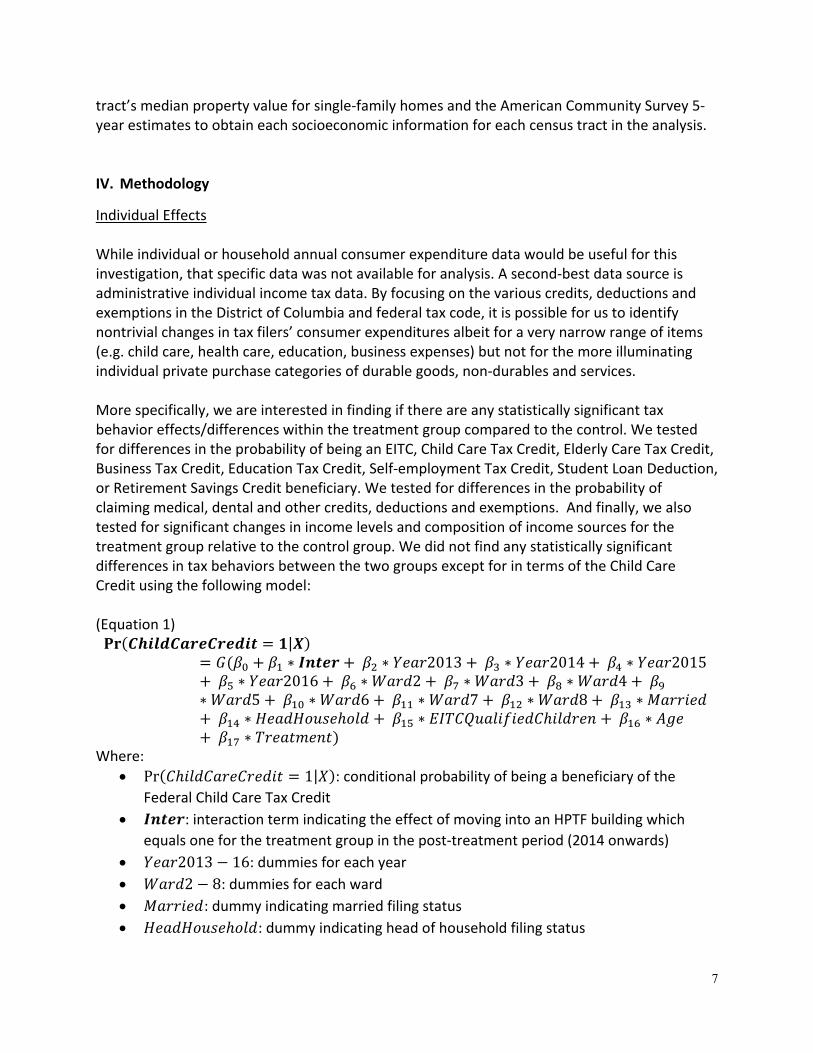
Individual Effects While individual or household annual consumer expenditure data would be useful for this investigation, that specific data was not available for analysis. A second-best data source is administrative individual income tax data. By focusing on the various credits, deductions and exemptions in the District of Columbia and federal tax code, it is possible for us to identify nontrivial changes in tax filers’ consumer expenditures albeit for a very narrow range of items (e.g. child care, health care, education, business expenses) but not for the more illuminating individual private purchase categories of durable goods, non-durables and services. More specifically, we are interested in finding if there are any statistically significant tax behavior effects/differences within the treatment group compared to the control. We tested for differences in the probability of being an EITC, Child Care Tax Credit, Elderly Care Tax Credit, Business Tax Credit, Education Tax Credit, Self-employment Tax Credit, Student Loan Deduction, or Retirement Savings Credit beneficiary. We tested for differences in the probability of claiming medical, dental and other credits, deductions and exemptions. And finally, we also tested for significant changes in income levels and composition of income sources for the treatment group relative to the control group. We did not find any statistically significant differences in tax behaviors between the two groups except for in terms of the Child Care Credit using the following model: (Equation 1) 𝐏𝐏𝐫𝐫(𝑪𝑪𝑪𝑪𝑪𝑪𝑪𝑪𝑪𝑪𝑪𝑪𝑪𝑪𝑪𝑪𝑪𝑪𝑪𝑪𝑪𝑪𝑪𝑪𝑪𝑪𝑪𝑪𝑪𝑪 = 𝟏𝟏|𝑿𝑿)
= 𝐺𝐺(𝛽𝛽0 + 𝛽𝛽1 ∗ 𝑰𝑰𝑰𝑰𝑪𝑪𝑪𝑪𝑪𝑪 + 𝛽𝛽2 ∗ 𝑌𝑌𝑌𝑌𝑌𝑌𝑌𝑌2013 + 𝛽𝛽3 ∗ 𝑌𝑌𝑌𝑌𝑌𝑌𝑌𝑌2014 + 𝛽𝛽4 ∗ 𝑌𝑌𝑌𝑌𝑌𝑌𝑌𝑌2015 + 𝛽𝛽5 ∗ 𝑌𝑌𝑌𝑌𝑌𝑌𝑌𝑌2016 + 𝛽𝛽6 ∗ 𝑊𝑊𝑌𝑌𝑌𝑌𝑊𝑊2 + 𝛽𝛽7 ∗ 𝑊𝑊𝑌𝑌𝑌𝑌𝑊𝑊3 + 𝛽𝛽8 ∗ 𝑊𝑊𝑌𝑌𝑌𝑌𝑊𝑊4 + 𝛽𝛽9∗ 𝑊𝑊𝑌𝑌𝑌𝑌𝑊𝑊5 + 𝛽𝛽10 ∗ 𝑊𝑊𝑌𝑌𝑌𝑌𝑊𝑊6 + 𝛽𝛽11 ∗ 𝑊𝑊𝑌𝑌𝑌𝑌𝑊𝑊7 + 𝛽𝛽12 ∗ 𝑊𝑊𝑌𝑌𝑌𝑌𝑊𝑊8 + 𝛽𝛽13 ∗ 𝑀𝑀𝑌𝑌𝑌𝑌𝑌𝑌𝑖𝑖𝑌𝑌𝑊𝑊+ 𝛽𝛽14 ∗ 𝐻𝐻𝑌𝑌𝑌𝑌𝑊𝑊𝐻𝐻𝐻𝐻𝐻𝐻𝐻𝐻𝑌𝑌ℎ𝐻𝐻𝑜𝑜𝑊𝑊 + 𝛽𝛽15 ∗ 𝐸𝐸𝐸𝐸𝐸𝐸𝐸𝐸𝐸𝐸𝐻𝐻𝑌𝑌𝑜𝑜𝑖𝑖𝐸𝐸𝑖𝑖𝑌𝑌𝑊𝑊𝐸𝐸ℎ𝑖𝑖𝑜𝑜𝑊𝑊𝑌𝑌𝑌𝑌𝑖𝑖 + 𝛽𝛽16 ∗ 𝐴𝐴𝐴𝐴𝑌𝑌+ 𝛽𝛽17 ∗ 𝐸𝐸𝑌𝑌𝑌𝑌𝑌𝑌𝑇𝑇𝑇𝑇𝑌𝑌𝑖𝑖𝑇𝑇)
Where: • Pr(𝐸𝐸ℎ𝑖𝑖𝑜𝑜𝑊𝑊𝐸𝐸𝑌𝑌𝑌𝑌𝑌𝑌𝐸𝐸𝑌𝑌𝑌𝑌𝑊𝑊𝑖𝑖𝑇𝑇 = 1|𝑋𝑋): conditional probability of being a beneficiary of the
Federal Child Care Tax Credit • 𝑰𝑰𝑰𝑰𝑪𝑪𝑪𝑪𝑪𝑪: interaction term indicating the effect of moving into an HPTF building which
equals one for the treatment group in the post-treatment period (2014 onwards) • 𝑌𝑌𝑌𝑌𝑌𝑌𝑌𝑌2013 − 16: dummies for each year • 𝑊𝑊𝑌𝑌𝑌𝑌𝑊𝑊2 − 8: dummies for each ward • 𝑀𝑀𝑌𝑌𝑌𝑌𝑌𝑌𝑖𝑖𝑌𝑌𝑊𝑊: dummy indicating married filing status • 𝐻𝐻𝑌𝑌𝑌𝑌𝑊𝑊𝐻𝐻𝐻𝐻𝐻𝐻𝐻𝐻𝑌𝑌ℎ𝐻𝐻𝑜𝑜𝑊𝑊: dummy indicating head of household filing status
8
• 𝐸𝐸𝐸𝐸𝐸𝐸𝐸𝐸𝐸𝐸𝐻𝐻𝑌𝑌𝑜𝑜𝑖𝑖𝐸𝐸𝑖𝑖𝑌𝑌𝑊𝑊𝐸𝐸ℎ𝑖𝑖𝑜𝑜𝑊𝑊𝑌𝑌𝑌𝑌𝑖𝑖: Number of EITC qualified children • 𝐴𝐴𝐴𝐴𝑌𝑌: age of tax filer in 2012 • 𝐸𝐸𝑌𝑌𝑌𝑌𝑌𝑌𝑇𝑇𝑇𝑇𝑌𝑌𝑖𝑖𝑇𝑇: dummy for the treatment group
• 𝐺𝐺(𝑤𝑤): logistic function 𝐺𝐺(𝑤𝑤) = exp (𝑤𝑤)1+exp (𝑤𝑤)
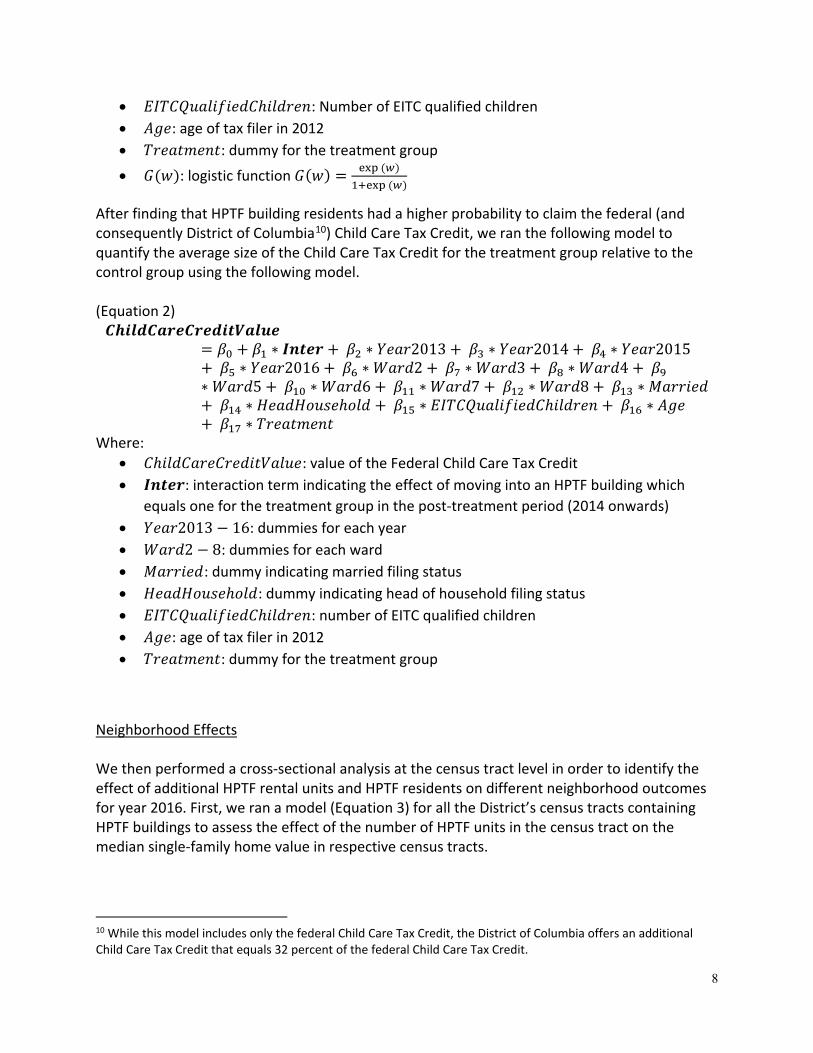
After finding that HPTF building residents had a higher probability to claim the federal (and consequently District of Columbia10) Child Care Tax Credit, we ran the following model to quantify the average size of the Child Care Tax Credit for the treatment group relative to the control group using the following model. (Equation 2) 𝑪𝑪𝑪𝑪𝑪𝑪𝑪𝑪𝑪𝑪𝑪𝑪𝑪𝑪𝑪𝑪𝑪𝑪𝑪𝑪𝑪𝑪𝑪𝑪𝑪𝑪𝑪𝑪𝑪𝑪𝑪𝑪𝑪𝑪𝑪𝑪𝑪𝑪𝑪𝑪
= 𝛽𝛽0 + 𝛽𝛽1 ∗ 𝑰𝑰𝑰𝑰𝑪𝑪𝑪𝑪𝑪𝑪 + 𝛽𝛽2 ∗ 𝑌𝑌𝑌𝑌𝑌𝑌𝑌𝑌2013 + 𝛽𝛽3 ∗ 𝑌𝑌𝑌𝑌𝑌𝑌𝑌𝑌2014 + 𝛽𝛽4 ∗ 𝑌𝑌𝑌𝑌𝑌𝑌𝑌𝑌2015 + 𝛽𝛽5 ∗ 𝑌𝑌𝑌𝑌𝑌𝑌𝑌𝑌2016 + 𝛽𝛽6 ∗ 𝑊𝑊𝑌𝑌𝑌𝑌𝑊𝑊2 + 𝛽𝛽7 ∗ 𝑊𝑊𝑌𝑌𝑌𝑌𝑊𝑊3 + 𝛽𝛽8 ∗ 𝑊𝑊𝑌𝑌𝑌𝑌𝑊𝑊4 + 𝛽𝛽9∗ 𝑊𝑊𝑌𝑌𝑌𝑌𝑊𝑊5 + 𝛽𝛽10 ∗ 𝑊𝑊𝑌𝑌𝑌𝑌𝑊𝑊6 + 𝛽𝛽11 ∗ 𝑊𝑊𝑌𝑌𝑌𝑌𝑊𝑊7 + 𝛽𝛽12 ∗ 𝑊𝑊𝑌𝑌𝑌𝑌𝑊𝑊8 + 𝛽𝛽13 ∗ 𝑀𝑀𝑌𝑌𝑌𝑌𝑌𝑌𝑖𝑖𝑌𝑌𝑊𝑊+ 𝛽𝛽14 ∗ 𝐻𝐻𝑌𝑌𝑌𝑌𝑊𝑊𝐻𝐻𝐻𝐻𝐻𝐻𝐻𝐻𝑌𝑌ℎ𝐻𝐻𝑜𝑜𝑊𝑊 + 𝛽𝛽15 ∗ 𝐸𝐸𝐸𝐸𝐸𝐸𝐸𝐸𝐸𝐸𝐻𝐻𝑌𝑌𝑜𝑜𝑖𝑖𝐸𝐸𝑖𝑖𝑌𝑌𝑊𝑊𝐸𝐸ℎ𝑖𝑖𝑜𝑜𝑊𝑊𝑌𝑌𝑌𝑌𝑖𝑖 + 𝛽𝛽16 ∗ 𝐴𝐴𝐴𝐴𝑌𝑌+ 𝛽𝛽17 ∗ 𝐸𝐸𝑌𝑌𝑌𝑌𝑌𝑌𝑇𝑇𝑇𝑇𝑌𝑌𝑖𝑖𝑇𝑇
Where: • 𝐸𝐸ℎ𝑖𝑖𝑜𝑜𝑊𝑊𝐸𝐸𝑌𝑌𝑌𝑌𝑌𝑌𝐸𝐸𝑌𝑌𝑌𝑌𝑊𝑊𝑖𝑖𝑇𝑇𝑖𝑖𝑌𝑌𝑜𝑜𝐻𝐻𝑌𝑌: value of the Federal Child Care Tax Credit • 𝑰𝑰𝑰𝑰𝑪𝑪𝑪𝑪𝑪𝑪: interaction term indicating the effect of moving into an HPTF building which
equals one for the treatment group in the post-treatment period (2014 onwards) • 𝑌𝑌𝑌𝑌𝑌𝑌𝑌𝑌2013 − 16: dummies for each year • 𝑊𝑊𝑌𝑌𝑌𝑌𝑊𝑊2 − 8: dummies for each ward • 𝑀𝑀𝑌𝑌𝑌𝑌𝑌𝑌𝑖𝑖𝑌𝑌𝑊𝑊: dummy indicating married filing status • 𝐻𝐻𝑌𝑌𝑌𝑌𝑊𝑊𝐻𝐻𝐻𝐻𝐻𝐻𝐻𝐻𝑌𝑌ℎ𝐻𝐻𝑜𝑜𝑊𝑊: dummy indicating head of household filing status • 𝐸𝐸𝐸𝐸𝐸𝐸𝐸𝐸𝐸𝐸𝐻𝐻𝑌𝑌𝑜𝑜𝑖𝑖𝐸𝐸𝑖𝑖𝑌𝑌𝑊𝑊𝐸𝐸ℎ𝑖𝑖𝑜𝑜𝑊𝑊𝑌𝑌𝑌𝑌𝑖𝑖: number of EITC qualified children • 𝐴𝐴𝐴𝐴𝑌𝑌: age of tax filer in 2012 • 𝐸𝐸𝑌𝑌𝑌𝑌𝑌𝑌𝑇𝑇𝑇𝑇𝑌𝑌𝑖𝑖𝑇𝑇: dummy for the treatment group
Neighborhood Effects We then performed a cross-sectional analysis at the census tract level in order to identify the effect of additional HPTF rental units and HPTF residents on different neighborhood outcomes for year 2016. First, we ran a model (Equation 3) for all the District’s census tracts containing HPTF buildings to assess the effect of the number of HPTF units in the census tract on the median single-family home value in respective census tracts.
10 While this model includes only the federal Child Care Tax Credit, the District of Columbia offers an additional Child Care Tax Credit that equals 32 percent of the federal Child Care Tax Credit.

9
(Equation 3) 𝑴𝑴𝑪𝑪𝑪𝑪𝑪𝑪𝑪𝑪𝑰𝑰𝑴𝑴𝑪𝑪𝑴𝑴𝑴𝑴𝑪𝑪𝑪𝑪𝑪𝑪𝑴𝑴𝑪𝑪𝑪𝑪𝑪𝑪𝑪𝑪𝑪𝑪𝑴𝑴
= 𝛽𝛽0 + 𝛽𝛽1 ∗ 𝑯𝑯𝑴𝑴𝑯𝑯𝑯𝑯𝑯𝑯𝑰𝑰𝑪𝑪𝑪𝑪𝑴𝑴 + 𝛽𝛽2 ∗ 𝑃𝑃𝑌𝑌𝑌𝑌𝑃𝑃𝑌𝑌𝑖𝑖𝑇𝑇𝑌𝑌𝐴𝐴𝑌𝑌𝑊𝑊ℎ𝑖𝑖𝑇𝑇𝑌𝑌 + 𝛽𝛽3∗ 𝑃𝑃𝑌𝑌𝑌𝑌𝑃𝑃𝑌𝑌𝑖𝑖𝑇𝑇𝑌𝑌𝐴𝐴𝑌𝑌𝑃𝑃𝐻𝐻𝑃𝑃𝑌𝑌𝑌𝑌𝑇𝑇𝑃𝑃 + 𝛽𝛽4 ∗ 𝑀𝑀𝑌𝑌𝑊𝑊𝑖𝑖𝑌𝑌𝑖𝑖𝐴𝐴𝐴𝐴𝑌𝑌 + 𝛽𝛽5 ∗ 𝑊𝑊𝑌𝑌𝑌𝑌𝑊𝑊2 + 𝛽𝛽6 ∗ 𝑊𝑊𝑌𝑌𝑌𝑌𝑊𝑊3+ 𝛽𝛽7 ∗ 𝑊𝑊𝑌𝑌𝑌𝑌𝑊𝑊4 + 𝛽𝛽8 ∗ 𝑊𝑊𝑌𝑌𝑌𝑌𝑊𝑊5 + 𝛽𝛽9 ∗ 𝑊𝑊𝑌𝑌𝑌𝑌𝑊𝑊6 + 𝛽𝛽10 ∗ 𝑊𝑊𝑌𝑌𝑌𝑌𝑊𝑊7 + 𝛽𝛽11 ∗ 𝑊𝑊𝑌𝑌𝑌𝑌𝑊𝑊8
Where:
• 𝑴𝑴𝑪𝑪𝑪𝑪𝑪𝑪𝑪𝑪𝑰𝑰𝑴𝑴𝑪𝑪𝑴𝑴𝑴𝑴𝑪𝑪𝑪𝑪𝑪𝑪𝑴𝑴𝑪𝑪𝑪𝑪𝑪𝑪𝑪𝑪𝑪𝑪𝑴𝑴: median property value for single-family homes and condos in the census tract.
• 𝑯𝑯𝑴𝑴𝑯𝑯𝑯𝑯𝑯𝑯𝑰𝑰𝑪𝑪𝑪𝑪𝑴𝑴: the number of HPTF residential rental units in the census tract • 𝑃𝑃𝑌𝑌𝑌𝑌𝑃𝑃𝑌𝑌𝑖𝑖𝑇𝑇𝑌𝑌𝐴𝐴𝑌𝑌𝑊𝑊ℎ𝑖𝑖𝑇𝑇𝑌𝑌: proportion of white population in the census tract • 𝑃𝑃𝑌𝑌𝑌𝑌𝑃𝑃𝑌𝑌𝑖𝑖𝑇𝑇𝑌𝑌𝐴𝐴𝑌𝑌𝑃𝑃𝐻𝐻𝑃𝑃𝑌𝑌𝑌𝑌𝑇𝑇𝑃𝑃: proportion of population below 100% of the poverty line • 𝑀𝑀𝑌𝑌𝑊𝑊𝑖𝑖𝑌𝑌𝑖𝑖𝐴𝐴𝐴𝐴𝑌𝑌: Median age of the census tract • 𝑊𝑊𝑌𝑌𝑌𝑌𝑊𝑊2 − 8: dummies for each ward
Next, we ran a model (Equation 4) for all the District’s census tracts containing HPTF buildings to assess the effect of the number of HPTF units in the census tract on the median income in respective census tracts. (Equation 4) 𝑴𝑴𝑪𝑪𝑪𝑪𝑪𝑪𝑪𝑪𝑰𝑰𝑰𝑰𝑰𝑰𝑴𝑴𝑴𝑴𝑴𝑴𝑪𝑪
= 𝛽𝛽0 + 𝛽𝛽1 ∗ 𝑯𝑯𝑴𝑴𝑯𝑯𝑯𝑯𝑯𝑯𝑰𝑰𝑪𝑪𝑪𝑪𝑴𝑴 + 𝛽𝛽2 ∗ 𝑃𝑃𝑌𝑌𝑌𝑌𝑃𝑃𝑌𝑌𝑖𝑖𝑇𝑇𝑌𝑌𝐴𝐴𝑌𝑌𝑊𝑊ℎ𝑖𝑖𝑇𝑇𝑌𝑌 + 𝛽𝛽3∗ 𝑃𝑃𝑌𝑌𝑌𝑌𝑃𝑃𝑌𝑌𝑖𝑖𝑇𝑇𝑌𝑌𝐴𝐴𝑌𝑌𝑃𝑃𝐻𝐻𝑃𝑃𝑌𝑌𝑌𝑌𝑇𝑇𝑃𝑃 + 𝛽𝛽4 ∗ 𝑀𝑀𝑌𝑌𝑊𝑊𝑖𝑖𝑌𝑌𝑖𝑖𝐴𝐴𝐴𝐴𝑌𝑌 + 𝛽𝛽5 ∗ 𝑊𝑊𝑌𝑌𝑌𝑌𝑊𝑊2 + 𝛽𝛽6 ∗ 𝑊𝑊𝑌𝑌𝑌𝑌𝑊𝑊3+ 𝛽𝛽7 ∗ 𝑊𝑊𝑌𝑌𝑌𝑌𝑊𝑊4 + 𝛽𝛽8 ∗ 𝑊𝑊𝑌𝑌𝑌𝑌𝑊𝑊5 + 𝛽𝛽9 ∗ 𝑊𝑊𝑌𝑌𝑌𝑌𝑊𝑊6 + 𝛽𝛽10 ∗ 𝑊𝑊𝑌𝑌𝑌𝑌𝑊𝑊7 + 𝛽𝛽11 ∗ 𝑊𝑊𝑌𝑌𝑌𝑌𝑊𝑊8
Where:
• 𝑴𝑴𝑪𝑪𝑪𝑪𝑪𝑪𝑪𝑪𝑰𝑰𝑰𝑰𝑰𝑰𝑴𝑴𝑴𝑴𝑴𝑴𝑪𝑪: median federal adjusted gross income for all tax filers in the census tract.
• 𝑯𝑯𝑴𝑴𝑯𝑯𝑯𝑯𝑯𝑯𝑰𝑰𝑪𝑪𝑪𝑪𝑴𝑴: the number of HPTF residential rental units in the census tract • 𝑃𝑃𝑌𝑌𝑌𝑌𝑃𝑃𝑌𝑌𝑖𝑖𝑇𝑇𝑌𝑌𝐴𝐴𝑌𝑌𝑊𝑊ℎ𝑖𝑖𝑇𝑇𝑌𝑌: proportion of white population in the census tract • 𝑃𝑃𝑌𝑌𝑌𝑌𝑃𝑃𝑌𝑌𝑖𝑖𝑇𝑇𝑌𝑌𝐴𝐴𝑌𝑌𝑃𝑃𝐻𝐻𝑃𝑃𝑌𝑌𝑌𝑌𝑇𝑇𝑃𝑃: proportion of population below 100% of the poverty line • 𝑀𝑀𝑌𝑌𝑊𝑊𝑖𝑖𝑌𝑌𝑖𝑖𝐴𝐴𝐴𝐴𝑌𝑌: Median age of the census tract • 𝑊𝑊𝑌𝑌𝑌𝑌𝑊𝑊2 − 8: dummies for each ward
10
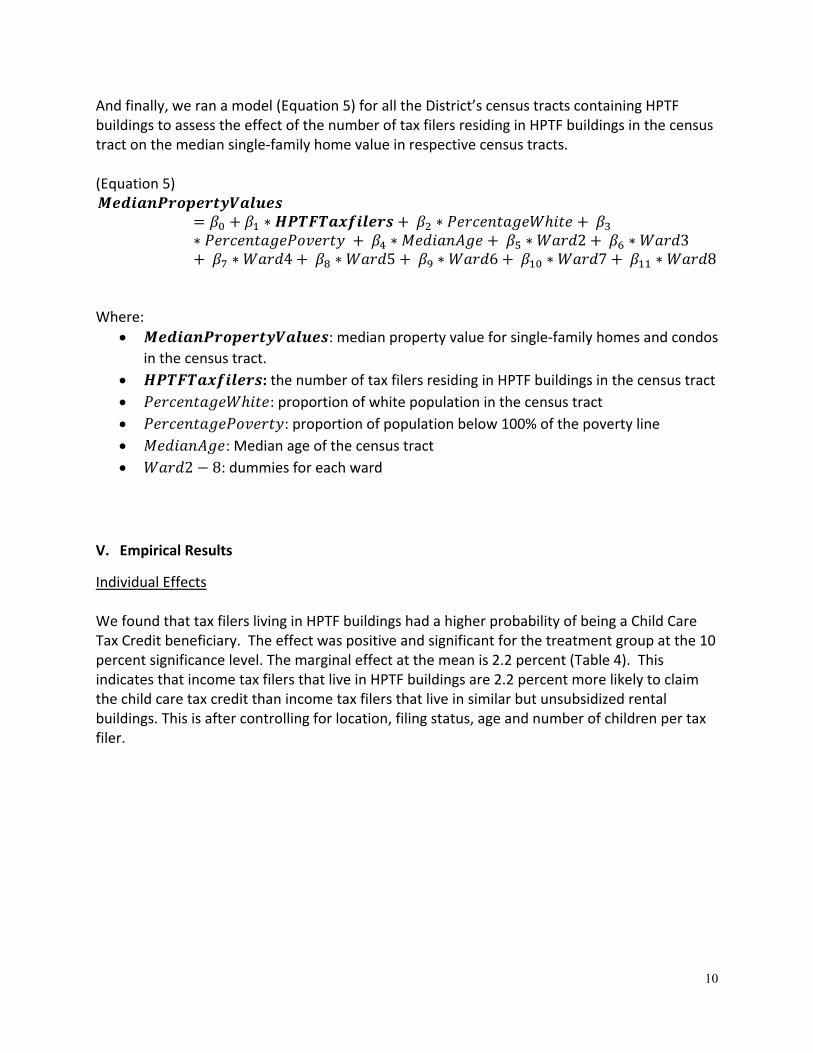
And finally, we ran a model (Equation 5) for all the District’s census tracts containing HPTF buildings to assess the effect of the number of tax filers residing in HPTF buildings in the census tract on the median single-family home value in respective census tracts. (Equation 5) 𝑴𝑴𝑪𝑪𝑪𝑪𝑪𝑪𝑪𝑪𝑰𝑰𝑴𝑴𝑪𝑪𝑴𝑴𝑴𝑴𝑪𝑪𝑪𝑪𝑪𝑪𝑴𝑴𝑪𝑪𝑪𝑪𝑪𝑪𝑪𝑪𝑪𝑪𝑴𝑴
= 𝛽𝛽0 + 𝛽𝛽1 ∗ 𝑯𝑯𝑴𝑴𝑯𝑯𝑯𝑯𝑯𝑯𝑪𝑪𝑯𝑯𝑯𝑯𝑪𝑪𝑪𝑪𝑪𝑪𝑪𝑪𝑴𝑴 + 𝛽𝛽2 ∗ 𝑃𝑃𝑌𝑌𝑌𝑌𝑃𝑃𝑌𝑌𝑖𝑖𝑇𝑇𝑌𝑌𝐴𝐴𝑌𝑌𝑊𝑊ℎ𝑖𝑖𝑇𝑇𝑌𝑌 + 𝛽𝛽3∗ 𝑃𝑃𝑌𝑌𝑌𝑌𝑃𝑃𝑌𝑌𝑖𝑖𝑇𝑇𝑌𝑌𝐴𝐴𝑌𝑌𝑃𝑃𝐻𝐻𝑃𝑃𝑌𝑌𝑌𝑌𝑇𝑇𝑃𝑃 + 𝛽𝛽4 ∗ 𝑀𝑀𝑌𝑌𝑊𝑊𝑖𝑖𝑌𝑌𝑖𝑖𝐴𝐴𝐴𝐴𝑌𝑌 + 𝛽𝛽5 ∗ 𝑊𝑊𝑌𝑌𝑌𝑌𝑊𝑊2 + 𝛽𝛽6 ∗ 𝑊𝑊𝑌𝑌𝑌𝑌𝑊𝑊3+ 𝛽𝛽7 ∗ 𝑊𝑊𝑌𝑌𝑌𝑌𝑊𝑊4 + 𝛽𝛽8 ∗ 𝑊𝑊𝑌𝑌𝑌𝑌𝑊𝑊5 + 𝛽𝛽9 ∗ 𝑊𝑊𝑌𝑌𝑌𝑌𝑊𝑊6 + 𝛽𝛽10 ∗ 𝑊𝑊𝑌𝑌𝑌𝑌𝑊𝑊7 + 𝛽𝛽11 ∗ 𝑊𝑊𝑌𝑌𝑌𝑌𝑊𝑊8
Where:
• 𝑴𝑴𝑪𝑪𝑪𝑪𝑪𝑪𝑪𝑪𝑰𝑰𝑴𝑴𝑪𝑪𝑴𝑴𝑴𝑴𝑪𝑪𝑪𝑪𝑪𝑪𝑴𝑴𝑪𝑪𝑪𝑪𝑪𝑪𝑪𝑪𝑪𝑪𝑴𝑴: median property value for single-family homes and condos in the census tract.
• 𝑯𝑯𝑴𝑴𝑯𝑯𝑯𝑯𝑯𝑯𝑪𝑪𝑯𝑯𝑯𝑯𝑪𝑪𝑪𝑪𝑪𝑪𝑪𝑪𝑴𝑴: the number of tax filers residing in HPTF buildings in the census tract • 𝑃𝑃𝑌𝑌𝑌𝑌𝑃𝑃𝑌𝑌𝑖𝑖𝑇𝑇𝑌𝑌𝐴𝐴𝑌𝑌𝑊𝑊ℎ𝑖𝑖𝑇𝑇𝑌𝑌: proportion of white population in the census tract • 𝑃𝑃𝑌𝑌𝑌𝑌𝑃𝑃𝑌𝑌𝑖𝑖𝑇𝑇𝑌𝑌𝐴𝐴𝑌𝑌𝑃𝑃𝐻𝐻𝑃𝑃𝑌𝑌𝑌𝑌𝑇𝑇𝑃𝑃: proportion of population below 100% of the poverty line • 𝑀𝑀𝑌𝑌𝑊𝑊𝑖𝑖𝑌𝑌𝑖𝑖𝐴𝐴𝐴𝐴𝑌𝑌: Median age of the census tract • 𝑊𝑊𝑌𝑌𝑌𝑌𝑊𝑊2 − 8: dummies for each ward
V. Empirical Results
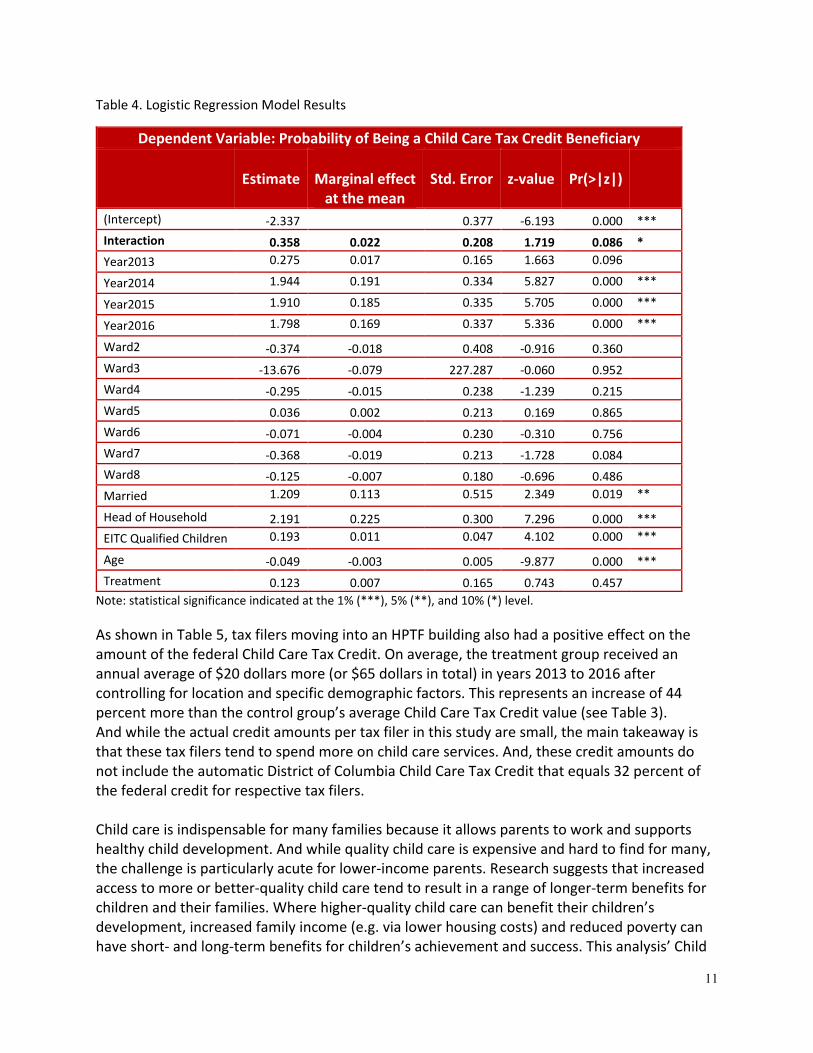
Individual Effects We found that tax filers living in HPTF buildings had a higher probability of being a Child Care Tax Credit beneficiary. The effect was positive and significant for the treatment group at the 10 percent significance level. The marginal effect at the mean is 2.2 percent (Table 4). This indicates that income tax filers that live in HPTF buildings are 2.2 percent more likely to claim the child care tax credit than income tax filers that live in similar but unsubsidized rental buildings. This is after controlling for location, filing status, age and number of children per tax filer.
11
Table 4. Logistic Regression Model Results
Dependent Variable: Probability of Being a Child Care Tax Credit Beneficiary
Estimate
Marginal effect at the mean
Std. Error z-value Pr(>|z|)
(Intercept) -2.337 0.377 -6.193 0.000 *** Interaction 0.358 0.022 0.208 1.719 0.086 * Year2013 0.275 0.017 0.165 1.663 0.096
Year2014 1.944 0.191 0.334 5.827 0.000 ***
Year2015 1.910 0.185 0.335 5.705 0.000 ***
Year2016 1.798 0.169 0.337 5.336 0.000 ***
Ward2 -0.374 -0.018 0.408 -0.916 0.360 Ward3 -13.676 -0.079 227.287 -0.060 0.952 Ward4 -0.295 -0.015 0.238 -1.239 0.215 Ward5 0.036 0.002 0.213 0.169 0.865 Ward6 -0.071 -0.004 0.230 -0.310 0.756 Ward7 -0.368 -0.019 0.213 -1.728 0.084 Ward8 -0.125 -0.007 0.180 -0.696 0.486 Married 1.209 0.113 0.515 2.349 0.019 **
Head of Household 2.191 0.225 0.300 7.296 0.000 *** EITC Qualified Children 0.193 0.011 0.047 4.102 0.000 ***
Age -0.049 -0.003 0.005 -9.877 0.000 *** Treatment 0.123 0.007 0.165 0.743 0.457
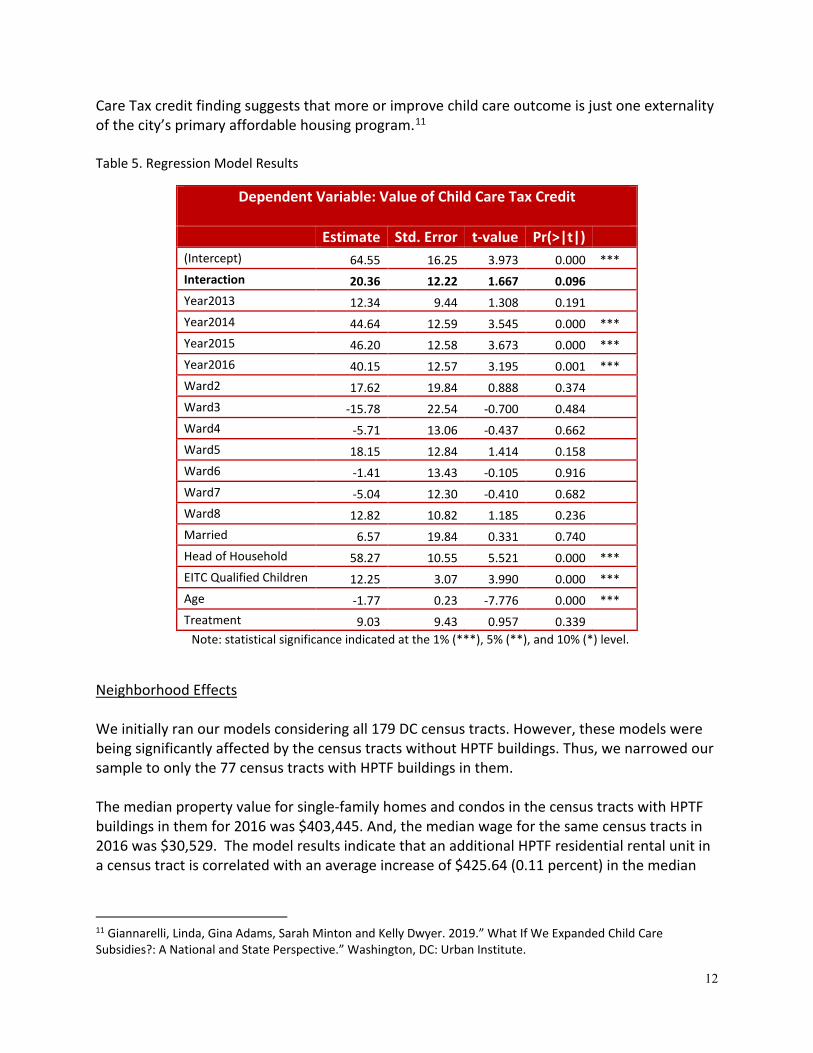
Note: statistical significance indicated at the 1% (***), 5% (**), and 10% (*) level. As shown in Table 5, tax filers moving into an HPTF building also had a positive effect on the amount of the federal Child Care Tax Credit. On average, the treatment group received an annual average of $20 dollars more (or $65 dollars in total) in years 2013 to 2016 after controlling for location and specific demographic factors. This represents an increase of 44 percent more than the control group’s average Child Care Tax Credit value (see Table 3). And while the actual credit amounts per tax filer in this study are small, the main takeaway is that these tax filers tend to spend more on child care services. And, these credit amounts do not include the automatic District of Columbia Child Care Tax Credit that equals 32 percent of the federal credit for respective tax filers. Child care is indispensable for many families because it allows parents to work and supports healthy child development. And while quality child care is expensive and hard to find for many, the challenge is particularly acute for lower-income parents. Research suggests that increased access to more or better-quality child care tend to result in a range of longer-term benefits for children and their families. Where higher-quality child care can benefit their children’s development, increased family income (e.g. via lower housing costs) and reduced poverty can have short- and long-term benefits for children’s achievement and success. This analysis’ Child
12
Care Tax credit finding suggests that more or improve child care outcome is just one externality of the city’s primary affordable housing program.11 Table 5. Regression Model Results
Dependent Variable: Value of Child Care Tax Credit
Estimate Std. Error t-value Pr(>|t|)
(Intercept) 64.55 16.25 3.973 0.000 *** Interaction 20.36 12.22 1.667 0.096 Year2013 12.34 9.44 1.308 0.191 Year2014 44.64 12.59 3.545 0.000 *** Year2015 46.20 12.58 3.673 0.000 *** Year2016 40.15 12.57 3.195 0.001 *** Ward2 17.62 19.84 0.888 0.374 Ward3 -15.78 22.54 -0.700 0.484 Ward4 -5.71 13.06 -0.437 0.662 Ward5 18.15 12.84 1.414 0.158 Ward6 -1.41 13.43 -0.105 0.916 Ward7 -5.04 12.30 -0.410 0.682 Ward8 12.82 10.82 1.185 0.236 Married 6.57 19.84 0.331 0.740 Head of Household 58.27 10.55 5.521 0.000 *** EITC Qualified Children 12.25 3.07 3.990 0.000 *** Age -1.77 0.23 -7.776 0.000 *** Treatment 9.03 9.43 0.957 0.339
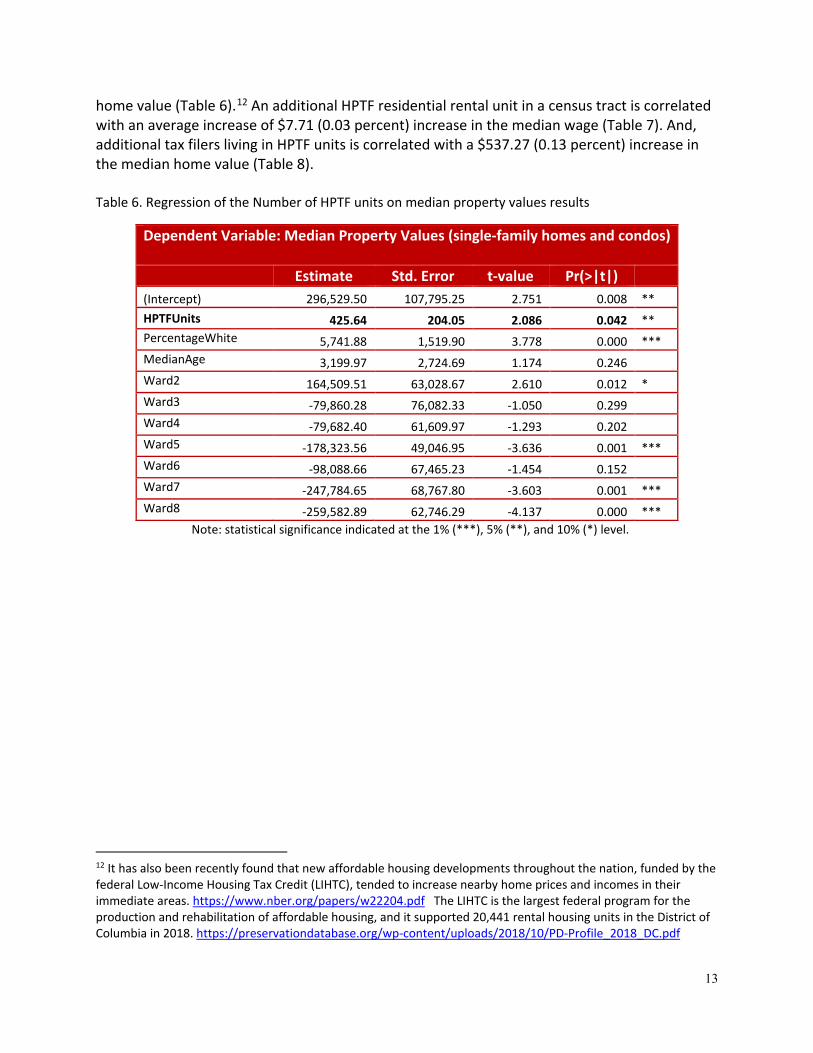
Note: statistical significance indicated at the 1% (***), 5% (**), and 10% (*) level. Neighborhood Effects We initially ran our models considering all 179 DC census tracts. However, these models were being significantly affected by the census tracts without HPTF buildings. Thus, we narrowed our sample to only the 77 census tracts with HPTF buildings in them. The median property value for single-family homes and condos in the census tracts with HPTF buildings in them for 2016 was $403,445. And, the median wage for the same census tracts in 2016 was $30,529. The model results indicate that an additional HPTF residential rental unit in a census tract is correlated with an average increase of $425.64 (0.11 percent) in the median
11 Giannarelli, Linda, Gina Adams, Sarah Minton and Kelly Dwyer. 2019.” What If We Expanded Child Care Subsidies?: A National and State Perspective.” Washington, DC: Urban Institute.
13
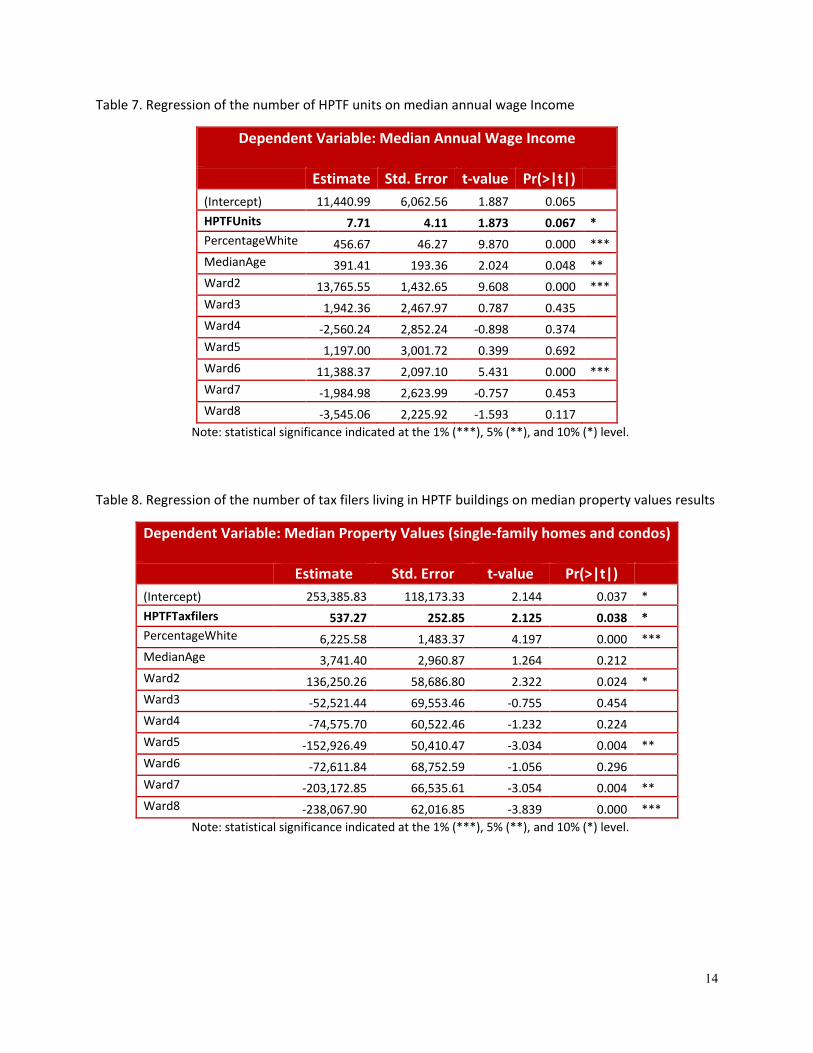
home value (Table 6).12 An additional HPTF residential rental unit in a census tract is correlated with an average increase of $7.71 (0.03 percent) increase in the median wage (Table 7). And, additional tax filers living in HPTF units is correlated with a $537.27 (0.13 percent) increase in the median home value (Table 8). Table 6. Regression of the Number of HPTF units on median property values results
Dependent Variable: Median Property Values (single-family homes and condos)
Estimate Std. Error t-value Pr(>|t|)
(Intercept) 296,529.50 107,795.25 2.751 0.008 ** HPTFUnits 425.64 204.05 2.086 0.042 ** PercentageWhite 5,741.88 1,519.90 3.778 0.000 *** MedianAge 3,199.97 2,724.69 1.174 0.246 Ward2 164,509.51 63,028.67 2.610 0.012 * Ward3 -79,860.28 76,082.33 -1.050 0.299 Ward4 -79,682.40 61,609.97 -1.293 0.202 Ward5 -178,323.56 49,046.95 -3.636 0.001 *** Ward6 -98,088.66 67,465.23 -1.454 0.152 Ward7 -247,784.65 68,767.80 -3.603 0.001 *** Ward8 -259,582.89 62,746.29 -4.137 0.000 ***
Note: statistical significance indicated at the 1% (***), 5% (**), and 10% (*) level.
12 It has also been recently found that new affordable housing developments throughout the nation, funded by the federal Low-Income Housing Tax Credit (LIHTC), tended to increase nearby home prices and incomes in their immediate areas. https://www.nber.org/papers/w22204.pdf The LIHTC is the largest federal program for the production and rehabilitation of affordable housing, and it supported 20,441 rental housing units in the District of Columbia in 2018. https://preservationdatabase.org/wp-content/uploads/2018/10/PD-Profile_2018_DC.pdf
14
Table 7. Regression of the number of HPTF units on median annual wage Income
Dependent Variable: Median Annual Wage Income
Estimate Std. Error t-value Pr(>|t|)
(Intercept) 11,440.99 6,062.56 1.887 0.065 HPTFUnits 7.71 4.11 1.873 0.067 * PercentageWhite 456.67 46.27 9.870 0.000 *** MedianAge 391.41 193.36 2.024 0.048 ** Ward2 13,765.55 1,432.65 9.608 0.000 *** Ward3 1,942.36 2,467.97 0.787 0.435 Ward4 -2,560.24 2,852.24 -0.898 0.374 Ward5 1,197.00 3,001.72 0.399 0.692 Ward6 11,388.37 2,097.10 5.431 0.000 *** Ward7 -1,984.98 2,623.99 -0.757 0.453 Ward8 -3,545.06 2,225.92 -1.593 0.117
Note: statistical significance indicated at the 1% (***), 5% (**), and 10% (*) level.
Table 8. Regression of the number of tax filers living in HPTF buildings on median property values results
Dependent Variable: Median Property Values (single-family homes and condos)
Estimate Std. Error t-value Pr(>|t|)
(Intercept) 253,385.83 118,173.33 2.144 0.037 * HPTFTaxfilers 537.27 252.85 2.125 0.038 * PercentageWhite 6,225.58 1,483.37 4.197 0.000 *** MedianAge 3,741.40 2,960.87 1.264 0.212 Ward2 136,250.26 58,686.80 2.322 0.024 * Ward3 -52,521.44 69,553.46 -0.755 0.454 Ward4 -74,575.70 60,522.46 -1.232 0.224 Ward5 -152,926.49 50,410.47 -3.034 0.004 ** Ward6 -72,611.84 68,752.59 -1.056 0.296 Ward7 -203,172.85 66,535.61 -3.054 0.004 ** Ward8 -238,067.90 62,016.85 -3.839 0.000 ***
Note: statistical significance indicated at the 1% (***), 5% (**), and 10% (*) level.
15
VI. Conclusions
The Housing Production Trust Fund is the District’s primary affordable housing policy tools. The fund supports the construction, rehabilitation, and/or acquisition of housing affordable to low-and moderate-income households. Since 2001, over 9,000 affordable housing units have been produced using the HPTF. However, this study finds that the benefits of this important program extends beyond merely providing affordable housing to low-and moderate-income households residents. We tested for differences in the probability of being an EITC, Child Care Tax Credit, Elderly Care Tax Credit, Business Tax Credit, Education Tax Credit, Self-employment Tax Credit, Student Loan Deduction, or Retirement Savings Credit beneficiary. We also tested for differences in the probability of claiming medical, dental and other credits, deductions and exemptions. And finally, we also tested for significant changes in income levels and composition of income sources for the treatment group relative to the control group. We did not find any statistically significant differences in tax behaviors between the two groups except for in terms of the Child Care Credit. This study finds tax filers that reside in HPTF buildings have a higher probability of taking the Child Care Tax Credit after controlling for the number of children, age, filing status and location of these tax filers. We also found that these tax filers receive a federal Child Care Tax credit that is on average $20 dollars higher (44 percent more) than those in the control group. And, this does not include the automatic District of Columbia Child Tax Credit that equals 32 percent of the federal credit for respective tax filers. These results provide an indication to a change in expenditure behavior of these tax filers as a result of the change of residency to a rent-subsidized housing unit. This finding suggest that these tax filers could be using their savings from lower housing expenditures to purchase more and/or better-quality child care for their school age children. Or, the finding might be the result of an endogeneity problem where tax filers who tend to spend more on child care may be more likely to choose HPTF housing (i.e. maximizing public benefits). In terms of neighborhood effects, we find that an additional HPTF residential rental unit in a neighborhood is correlated with a 0.11 percent increase in the median home value and a 0.03 percent increase in the area’s median wage. We also find an additional tax filer living in an HPTF building is correlated with a 0.14 percent increase in the median home value. HPTF buildings tend to be in neighborhoods with relatively higher poverty rates and lower employment rates. And since new affordable housing tenants are working adults that meet specified income requirements, it might be that new or newly renovated HPTF buildings help to increase the share working adults (tenants) in respective neighborhoods which in turn might mitigate some poverty-related characteristics of the neighborhood. Also, the new or newly renovated HPTF buildings represent an upgrading/modernizing of a neighborhood’s housing stock in that HPTF projects replace or help outnumber much-older or even blighted residential buildings in respective neighborhoods. To some, this may be considered neighborhood revitalization which in turn attract higher-income residents to the broader low-income
16
neighborhood. In essence, the current drive of using the HPTF to help build and renovate affordable housing developments in low-income area appears to be running parallel to the gentrification trends also taking place in many of the same neighborhoods. This may be one explanation for the positive effects on neighborhood income. Nevertheless, this study has identified several important positive externalities related to the city’s largest program to increase the stock of affordable housing.