neighborhood sustainability- a comprehensive multi-criteria sustainability indicator analysis
TRANSCRIPT

NEIGHBORHOODSUSTAINABILITY:ACOMPREHENSIVEMULTI-CRITERIASUSTAINABILITYINDICATORANALYSIS
ASeniorThesisPresentedBy
EmilyAnneKern
SubmittedtotheDepartmentofEarthandEnvironmentalSciencesFurmanUniversity
InFulfillmentoftheRequirementsfortheDegreeofBachelorofScience

Keywords: neighborhood sustainability, homeowner's association covenants, sustainable development, sustainability indicators Abstract: Increasing urban flight in the United States has led to widespread, rapid, unsustainable suburban development and sprawl. Suburban areas make up the majority of urban America, and therefore play an integral role in the development of sustainable cities. Unfortunately, architects and developers typically do not consider sustainability in the design and construction of subdivisions, creating neighborhood layouts, home designs, and homeowner association's covenants that create significant barriers to sustainable living. While there are multiple actions homeowners can take to contribute to neighborhood sustainability on the plot-by-plot level, these lifestyle choices are not always adopted or supported by greater neighborhood norms. The current literature provides assessments of individual sustainability indicators at the homeowner and neighborhood level as well as multi-indicator sustainability assessments of cities and larger metropolitan areas, but lacks such multi-indicator analyses at the homeowner and neighborhood level. This study aims to address this gap by comprehensively assessing neighborhood sustainability of twelve neighborhoods in Greenville, South Carolina from a development and homeowner behavior perspective through a variety of different sustainability indicators including recycling habits, lawn care, tree planting, renewable energy use, home gardening, sidewalks, public space, and home orientation, which address both the development and behavioral components of neighborhood sustainability. Necessary data were collected by on site observation from June - July 2015, analysis of aerial images from Google Earth, and qualitative assessment of homeowner's association covenants. The results revealed that overall, 70% of the sample population recycled, 58% artificially cared for their lawn, 41% of the homes were oriented to optimize solar potential, 9% had home gardens, and 55% had more than two trees planted. Neighborhoods with homeowners associations were found to have more barriers to sustainability than homes in neighborhoods without an association. The multi-criteria correlation analysis showed significant positive correlations between recycling and natural lawn management and recycling and home gardens, and a significant negative correlation between prevalence of trees and natural lawn management. From the analysis, these barriers were identified and used to make recommendations for improved neighborhood sustainability. 1. Introduction
Increasing urban growth in the United States has led to widespread, rapid, unsustainable suburban development and sprawl. Suburban areas make up the vast majority of urban America, and therefore play an integral role in the development and establishment of sustainable cities. However, architects and developers typically do not consider sustainability in the design and construction of subdivisions, creating neighborhood layouts, home designs, and covenants that create significant physical, social, and economic challenges and barriers to sustainability and sustainable living. Homeowners enter these neighborhoods with often little to no say about the development or design of the subdivision, resulting in lifestyle choices that are products of where they live and the communities that surround them. Although there are many actions a homeowner can take to live more sustainably, such as recycling, natural lawn management, gardening, installation of solar panels and planting trees, neighborhood norms enforced by restrictive covenants and the placement of the homes (both in proximity and access to amenities and in orientation of the home in a North/South direction) can hinder a homeowner from adopting these behaviors (figure 1). A thorough review of existing and planned neighborhoods from both a development and behavioral perspective is needed to identify neighborhood sustainability barriers and provide recommendations to overcome them.

This vast urban growth has led to increasing interest in sustainable cities and sustainable urban forms, resulting in many studies that show well-documented negative environmental and social impacts of our current model of suburbanization. Environmental impacts of suburbanization include overconsumption and pollution of water, biodiversity and habitat loss, loss of carbon storage potential, along with pollution and natural resource consumption. The introduction of high input turf lawns is a key component of suburban development that causes many of these negative environmental effects. The lawn maintenance involved in suburban yard care results in high energy and water demands and high chemical inputs. Studies have shown that lawn irrigation can account for 75% of total household water consumption in arid regions of the United States, and chemical use on urban lawns is so prevalent that lawn chemicals were found in 99% of all urban stormwater samples in the US (Robbins and Birkenholtz 2003, Smetana and Crittenden 2014). Residential land use also introduces new plant species that may invade existing habitats, and pets can invade habitats and prey on wildlife, resulting in overall biodiversity loss (Nassaur et al. 2009). These inputs and changes in biodiversity have been shown to disturb wetlands and other vulnerable ecosystems (Robbins and Birkenholtz, 2003). When trees are clear-cut to implement these turf grass lawns, the plot also loses carbon storage potential (Visscher et al. 2014). Another aspect of suburban development that results in environmental degradation is the inability for many homes to optimize solar potential. Furthermore, the traditional urban planning process has been deemed by past scholars to be inadequate in providing solar urban potential, which yields higher energy use from nonrenewable sources, leading to pollution and natural resource consumption (Amado and Poggi 2012).
Due to its sprawling nature, suburbanization also harms the environment in how it leads to pollution and congestion problems when proper access and connectivity are not provided by the developer. This creates a host of social issues as well, such as job-housing location imbalance, longer commuting times, diminishing open space and agricultural lands, and absence of community life (Randall and Baetz 2001). When land use is not distributed efficiently throughout urban and suburban development and communities lack public spaces or a means to travel safely around the neighborhoods, residents cannot participate fully in society, which can undermine economic and social sustainability (Yigitcanlar et al. 2015).
Poor land use distribution harms environmental sustainability as well, since lack of local opportunities or safe connections to them encourages motorized travel and thereby results in local noise, habitat fragmentation, increased impervious surface and consequent damages in water quality and the formation of urban heat islands, along with global air pollution and climate change (Yigitcanlar et al. 2015).
Furthermore, the institutions implemented with suburban development have been researched, and previous studies have suggested that they too have negative environmental impacts. Homeowners associations (HOA) can be formed (usually by the developer of the subdivision) and serve as the governing body of the development. HOA membership is mandatory for all property owners in the development. The HOA enforces rules set forth in the
Figure1.Neighborhoodsustainabilityindicatorsdividedbydevelopmentandhomeownerbehavior.Linesconnectingindicatorsshowshowdeveloperdecisionscaninfluencehomeownerbehavior.

developments covenants, codes, and restrictions (CC&Rs) and can take legal action to ensure the rules are followed. CC&Rs vary from development to development, but usually restrict home and yard appearance from the street facing side of the home. Previous research has shown that households who belong to a homeowners association (HOA) apply more fertilizer than those who do not, since HOAs oblige people to maintain a high esthetic standard (Fraser et al. 2013). Landscapes in neighborhoods with covenants, codes and restrictions also had fewer trees than those without (Martin et al. 2003). Both of these studies suggest that governing institutions that control homeowner behavior in many neighborhoods have negative environmental impacts due to the types of lawns they promote and enforce.
These impacts have fueled a recent interest in more sustainable neighborhood design and sustainable homeowner behaviors. Many previous studies have looked at urban sustainability for large metropolitan areas using a wide range of different indicators and dimensions to assess the development of cities and suggest public municipal policies for any further growth (Porta and Renne 2005, Jabareen 2006, Shen et al. 2011, Braulio-Gonzalo et al. 2015).
While these studies are integral to urban sustainability, residential development and the neighborhoods that make up the periphery of cities are largely excluded from assessment under similar indicators. Much less research has focused on suburbia or has been done at the neighborhood scale. Studies that do have typically focused on a single sustainability indicator like recycling practices (Seacat and Northrup 2010; Saphores and Nixon, 2014; Crociata et al. 2015), homeowner lawn care (Robbins and Birkenholtz, 2003; Helfand et al. 2006; Nassauer et al. 2009; Zheng et al. 2011; Blaine et al. 2012; Martin et al. 2013; Kirkpatrick et al. 2014; Visscher et al. 2014; Martini et al. 2015), tree cover (Anderson and Cordell 1988), home gardens (Clayton 2007, Cameron et al. 2012; Calvet-Mir et al. 2012; Hunter and Brown 2012), and pedestrian connectivity (Randall and Baetz 2001). The current literature is lacking holistic, comprehensive, multi-indicator analyses at the neighborhood and individual homeowner scale. This more thorough and comprehensive analysis of neighborhoods and residential development must be done in conjunction with assessments of cities to wholly understand urban development and sustainability.
In an effort to address this gap, this study provides a comprehensive, multi-indicator sustainability analysis at the household and community level of twelve neighborhoods in Greenville, South Carolina in order to characterize current homeowner habits and practices, and to identify the barriers to sustainability in order to provide recommendations to overcome them. The study considers neighborhood sustainability from a development, design, policy, and behavioral perspective and looks at a combination of variety of different sustainability indicators including individual behaviors like recycling, lawn care, and tree planting; neighborhood amenities such as sidewalks, public space; and building design features and home orientation. From this analysis, a number of barriers to sustainability can be identified and used to provide recommendations for improved neighborhood sustainability. 2. Methods 2.1 Study Area
Greenville County, South Carolina is located in the Northwestern corner of the state at the foothills of the Appalachian Mountains. The City of Greenville, which lies at the center of the county, is one of the ten fastest growing cities in the United States (Christie 2012). With an estimated population of 482,752 in 2014, Greenville County is South Carolina's largest county. The County’s population has increased by 103,136 since 2000 or 1.9% per year. This rapid and

continued growth has prompted expansive suburbanization and construction of new subdivisions and homes.
Twelve residential neighborhoods just north of the city of Greenville were selected for inclusion in this study following a methodology similar to that of Anderson and Cordell (1987) (Figure 2). Neighborhoods were selected with a similar set of socioeconomic and demographic criteria in order to reduce demographic variability and ensure that the two groups could be objectively compared in order to determine if the presence of a HOA inhibits sustainable living. All twelve neighborhoods were located north of the city within close proximity of each other. They were comprised of 3 – 4 bedroom single-family homes, and had an average fair market value of $150,000-$250,000. Greenville County’s Real Property Search was used to collect specifics about the homes within each neighborhood including the 2015 assessed value of the home, the square footage of heated space, the number of bedrooms and baths, and the size of the lot. Six of the neighborhoods selected had a homeowners association, and the other six did not.
A small number of lots were eliminated from the study because of inability to acquire complete data due to lack of visibility from the street caused by high fences, set-back lots, or other visual impairments.
Figure2.Mapshowingthelocationofthetwelveneighborhoodsincludedinthisstudy.AlltwelveneighborhoodsarelocatedinGreenvilleCounty.
2.2 Sustainability indicators
There have been a number of previous studies (Shen et al. 2011, Sharifi and Murayma 2013, Visscher 2014, Ygitcanlar et al. 2015, Braulio-Gonzalo et al. 2015,) that have developed, applied, and assessed different sustainability indicators for suburban and urban areas. For this study, a selection of these sustainability indicators was chosen to reflect and quantify individual homeowner practices (recycling, lawn care, tree planting, gardening, use of solar energy),
29
29
25
123
276
276
276
25
385
N
3
385
N
3
Greenville
TravelersRest
A B C
DE
F
GH I
JKL
Neighborhood IncludedinStudy

neighborhood amenities (sidewalks, public space), and building design features (home orientation) at the lot scale within each neighborhood. All of these indicators can be readily assessed by a combination of visual inspection from the street and analysis of aerial images from Google Earth. The indicators were evaluated individually as well as through a correlation matrix in SPSS software to assess any connections between indicators. 2.3 Homeowner Behavior 2.3.1 Recycling
Recycling has long been recognized as a principle tenet for sustainability and sustainable living (Crociata et al. 2015). Residential recycling reduces the amount of waste sent to landfills and incinerators, conserves natural resources such as timber, water, and minerals, prevents pollution by reducing the need to collect new raw materials, saves energy, reduces greenhouse gas emissions that contribute to global climate change, and helps sustain the environment for future generations. Recycling was included in this study as it is one indicator of a homeowner’s level of sustainable behavior. Most neighborhoods in Greenville County are serviced by a single waste hauler that collects both trash and curbside recycling once a week. Some neighborhoods (Brownstone Crossing, Glastonbury Village, and Fox Springs) are more complex with multiple waste haulers servicing select residences in the neighborhoods on different days of the week. For these few neighborhoods, complete data collection on recycling was too difficult to gather consistently and as such recycling behavior was not assessed.
The presence of a recycling container curbside on trash day in front of a home was used to indicate if the homeowner recycled for that week. Each neighborhood was assessed visually on foot on a lot-by-lot basis for four different weeks, with at least two of the visits on consecutive weeks, during June - August 2015. Each house was assigned a recycling value (2 if both a recycling bin and trash bin were present, 1 if only a trash can was present, and 0 if no cans were present). Homeowners who recycled at least one time over the course of the data collection were categorized as “recyclers”. Any house that did not have trashcans or recycling containers curbside over the four visits was excluded from this portion of the study. 2.3.2 Landscape
With suburban growth comes the widespread conversion of land cover to urban lawn. Residential lawn care typically includes significant chemical input (Robbins and Birkenholtz
1
42
22
2 2 22
2222
2
2
22
2
2
2
11
1
1 1
1
1 1 1
111
1
2
333
3
3
3
3
3 3
4
444
444
4
4
4
444
44
4
4
44
4
Figure 3. Data for each sustainabilityindicator were assessed visually andrecorded manually on a plot-by-plotbasis.Thismapasanexampleshowsthelawn care assessment for Edgewood atParisMountain.

2003). Widespread lawn chemical use contaminates underlying groundwater, storm runoff, and stream systems; 99% of all urban storm water samples in the USA were found to contain measurable concentrations of lawn care chemicals (Smetana and Crittenden 2014). Due to these negative environmental impacts, lawn care practices are a useful indicator of homeowner sustainability behavior.
A visual walking assessment of lawn care practices was conducted on a lot-by-lot basis for the front yards of each neighborhood between June and July of 2015 similar to the methods of Martin et al. (2003). Front yards were defined as all pervious landscape surface areas that were in front of the house.
Lawn care was evaluated based on a scale from 1-4, with 1 being highly, artificially managed with excessive chemicals to 4 being naturally managed. Values were assigned based on a visual assessment of turf density, lawn greenness, and lack of weeds, all indicators of chemical input and level of care (fig. 3). Lawns without conventional turf or lawns that were mostly land cover types that were not visibly maintained (unmaintained understory and unmown herbaceous areas) were labeled as “no conventional turf” (Visscher 2014). To help validate the visual assessment ratings, scores were cross-referenced with service data provided by lawn care companies that operate within these neighborhoods. The cross referencing showed that the visual observations were accurate 96% of the time. Aside from lawn care practices, tree planting is another potential for homeowners to make beneficial environmental choices in their yard. Beautification, shade, wildlife habitat, noise abatement, wind reduction, soil protection, and carbon storage are all benefits of tree cover (Anderson and Cordell 1988, Nassuer 2014, Visscher 2014). Urban trees are considered a major factor in providing cooling, via shade and evapotranspiration, and are estimated to offer over 950 MJ (almost 270 kWh) cooling per day, per tree, due to evapotranspiration effects alone (Cameron et al. 2012). Due to their great environmental benefits, number of trees in a homeowner’s front lawn was also included as a sustainability indicator. Considering that developers typically plant two trees in a yard while building, more trees would suggest an intentional decision by the homeowner to plant.
For each lot the number of trees in the front yard was visually observed and recorded. Trees that grew on property lines were not counted if it was unclear which lot they were on. Lots with yards that were not visibly maintained (unmaintained understory and unmown herbaceous areas) were labeled “wooded” (Visscher 2014). 2.3.3 Gardens
Homeowners have the ability to plant home gardens, which provide a wide range of ecosystem services beyond simply the production of food (Calvet-Mir et al. 2012). Not only do home gardens provide better tasting and more nutritional food that can help achieve food sovereignty and economic independence from markets, home gardens preserve traditional ecological knowledge, provide pleasing aesthetics, preserve cultural heritage, and bring people a better understanding of their environment. Home gardens also provide habitat, cultural, and regulating services, such as maintenance of soil fertility, regulation of pests and pathogens, wildlife protection, water quality supply, carbon sequestration, along with opportunities for homeowners to compost, which reduces food waste headed to the landfill and eliminates the need for chemical fertilizers which helps minimize groundwater and surface water pollution (Calvet-Mir et al. 2012). Growing food also provides environmental benefits by increasing the

share of local foods in the homeowners’ diet, therefore cutting back on the distance that foods travel from production to consumption sources, which is a contributor to carbon emissions and fossil fuel consumption.
Since CC&Rs restrict homeowner behavior that is visible from the street, vegetable gardens are typically located in homeowner’s backyards in areas under CC&R regulation. Lack of visual access from the street to the backyards necessitated a manual analysis of images in Google Earth (similar to the methodology of Taylor and Lovell (2012)) to identify the presence of a backyard garden. Gardens were identified on the imagery by a square or rectangular garden layout, vegetation planted in rows or in beds separated by paths, bare earth or mulch between individual plants or rows of plants, and fencing or presence of raised beds separating the garden from the rest of the lawn (fig. 4.) Observations were verified by ground analysis when visible from the street and through homeowner confirmation when possible (Taylor and Lovell 2012). 2.3.4 Energy Production
Solar panels provide homeowners with the opportunity to generate some of their own alternative energy. This results in less energy used form coal, oil, and natural gas, resulting in less emissions and environmental degradation. This indicator is included in the study to determine which homes are using alternative energy.
The presence of solar panels were identified through a manual visual analysis of images in Google Earth. Solar panels are easily identified when looking at the images, as they appear as black/blue rectangles on the roofs of the homes. Their presence confirmed by visual analysis when visible from the street. 2.4 Neighborhood amenities and design features 2.4.1 Home Orientation
Home orientation plays an important role in determining if homes are conducive to producing their own solar energy in order to reduce consumption of nonrenewable energy sources. For a rooftop solar photovoltaic array to be effective the roof should be oriented between SW (45º West) to SE (45º East) (Amado and Poggi 2012). Roof areas facing SW and SE are 95% efficient, while those facing directly south are 100% efficient. Within each neighborhood, the orientation of each home’s roofline was measured and used to assign the solar potential of the home. Rooflines oriented between SW (45º West) and SE (45º East), were considered to have high solar potential. 2.4.2 Sidewalks
Many planners and scholars, including Jabareen (2006), suggest that sustainable urban development must be at a form and scale appropriate to walking, cycling, and social interaction. Walkable neighborhoods promote community sustainability while reducing the prevalence of
Figure 4. Examples of gardens from Google Earth images

motor vehicle use, therefore contributing to environmental sustainability as well. Comprehensive, continuous sidewalks across a neighborhood allow for residents to walk or bike through the neighborhood safely. Their presence encourages biking and walking, more sustainable modes of transport, and increased social interaction and community.
Sidewalks were mapped within each neighborhood through a manual analysis of images in Google Earth. The communities were classified as “complete”, “partial”, or “none”. “Complete” required complete and connecting sidewalk coverage throughout the neighborhood without any inconsistencies or spatial gaps. “Partial” included neighborhoods with some, but not completely continuous sidewalk coverage, and “none” meant that there was no sidewalk present in the neighborhood at all. The neighborhoods were visited and walked in June and July 2015 for visual verification. 2.4.3 Public Space
In his analysis of sustainable urban forms, Jabareen (2006) identifies the importance of providing amenities within the community. Therefore, this study chose public space as neighborhood sustainability indicators. Public space was considered as any lot owned by the HOA or any public entity that was developed for community use. These included neighborhood community areas such as swimming pools, playgrounds, lakes or ponds, and athletic courts. These were identified through visual observation and analysis of aerial images from Google Earth. 2.5 Homeowners association covenant analysis
In order to assess if homeowners association’s covenants presented any barriers to sustainable living, a thematic qualitative analysis of the convents was performed, and any phrasing or clauses that seemed to inhibit any aspect of sustainability were manually flagged.
These flagged clauses were compiled (see appendix A) and grouped into the area of sustainability which they potentially inhibited. Table 2 provides some examples of the type of rhetoric that was considered to be a barrier to sustainability.
Table 2. HOA Covenant Analysis Barrier Example Inhibits mixed land use
o Lot shall be used exclusively for single family residential dwellings o No number lot, or any part thereof, shall be used for any business or commercial
purpose or for any public purpose Inhibits gardens o All fencing erected and/or planting of trees and/or planting of scrubs [sic] on the lots
herein above referred to shall be approved by the committee o A landscape development plan must be submitted to and approved by the ARC
before work commences Inhibits trees o Furthermore, to guarantee the preservation of a particular view for adjoining and
nearby land owners there shall not be erected or placed a fence, wall, tree, or shrub that may at present or in future obstruct the view from any other lot unless and except as approved by the Architectural Control Committee
Promotes artificial lawn care
o All yards and vacant lots shall be maintained and kept in a neat, clean, and orderly manner. If a dwelling is completed on a lot, the yard must be grassed and the grass must be cut at reasonable intervals.
Inhibits solar o Any such building shall face toward the front line of the lot.

3. Results The overall quantitative results of the multi-criteria sustainability analysis of the twelve
Greenville County neighborhoods from a development, design, policy, and behavioral perspective are displayed in table 3. Data for each sustainability indicator are shown for the individual neighborhoods as well as a summary comparison between HOA neighborhoods and non-HOA neighborhoods and the average for all twelve neighborhoods.
3.1 Sustainability Indicators 3.1.1 Homeowner Behavior
After all of the indicators were assessed, overall, 70% of homeowners recycled at least once over the course of the four weeks that they were observed. Neighborhood recycling rates ranged from 86% in Windermere to 0% in Edgewood at Paris Mountain.
The assessment showed that overall 58% of homeowners had visibly artificially managed lawns (rating of 1 or 2 - lawns characterized by dense, green turf with little or no weeds).
Table 3. All Indicators.
Neighborhood Recycling (%)
Orientat-ion (%)
Solar panels (%)
Lawn care (%)
Gardens (%)
Trees (%)
Side-walks Public space
HOA Brownstone Crossing - 39 0 63 9 21 None Playground
Edgewood at Paris Mt. 0 25 0 53 6 32 None None
Glastonbury Village - 63 0 64 17 22 None Pond with benches
Half Mile Lake 78 41 1 61 7 63 None Lake, pool, athletic
courts, walking paths Northcliff 74 44 0 61 6 31 Partial Pool, playground,
athletic courts Partridge Ridge 71 20 0 50 5 64 Partial Pool
Non-HOA Buxton 76 38 0 59 10 96 None None Croftstone Acres 73 52 0 49 10 70 None Park
Fox Springs - 45 0 48 15 18 None None Liberty Park 61 33 1 64 9 84 None None Timberlake 64 33 0 53 9 78 None None Windermere 86 16 0 70 5 64 None None Total HOA 70 40 0 60 8 46 2 5 Total Non-HOA 71 42 0 55 10 75 0 1
Total 70 41 0 58 9 55 2 6
Artificial lawn management rates ranged from 70% in Windermere to 45% in Croftstone Acres. Table 3 shows the distribution of lawn care levels within each neighborhood.
Only 9% of all homes had residential gardens. Windermere and Partridge Ridge had the least amount of gardens with 5% in each neighborhood, while Glastonbury Village had the highest rates of home gardens at 17%.
55% percent of homes included in the study had more than two trees in the front yard, but these rates varied greatly from neighborhood to neighborhood. Rates were as high as 96% in Buxton and as low as 18% in Fox Springs. 2% of all homes included in the study had wooded landscapes.
3.1.2 Neighborhood amenities and design features
While examining home orientation, 41% of homes included in this study were oriented between SW (45º West) and SE (45º East), and therefore ideally situated to effectively utilize solar energy from photovoltaic panels if installed. However in all twelve neighborhoods, despite some homes being oriented in a way that would allow them to utilize solar, no homes had installed solar panels, except for a few in Liberty Park and Half Mile Lake.
10 of the 12 neighborhoods included in the study did not have any sidewalks in the subdivision. Of the two neighborhoods that did, they both were only partial coverage, without complete sidewalks on both sides of road, incomplete coverage to access neighborhood public spaces, and some roads in the neighborhoods were lacking sidewalks completely.
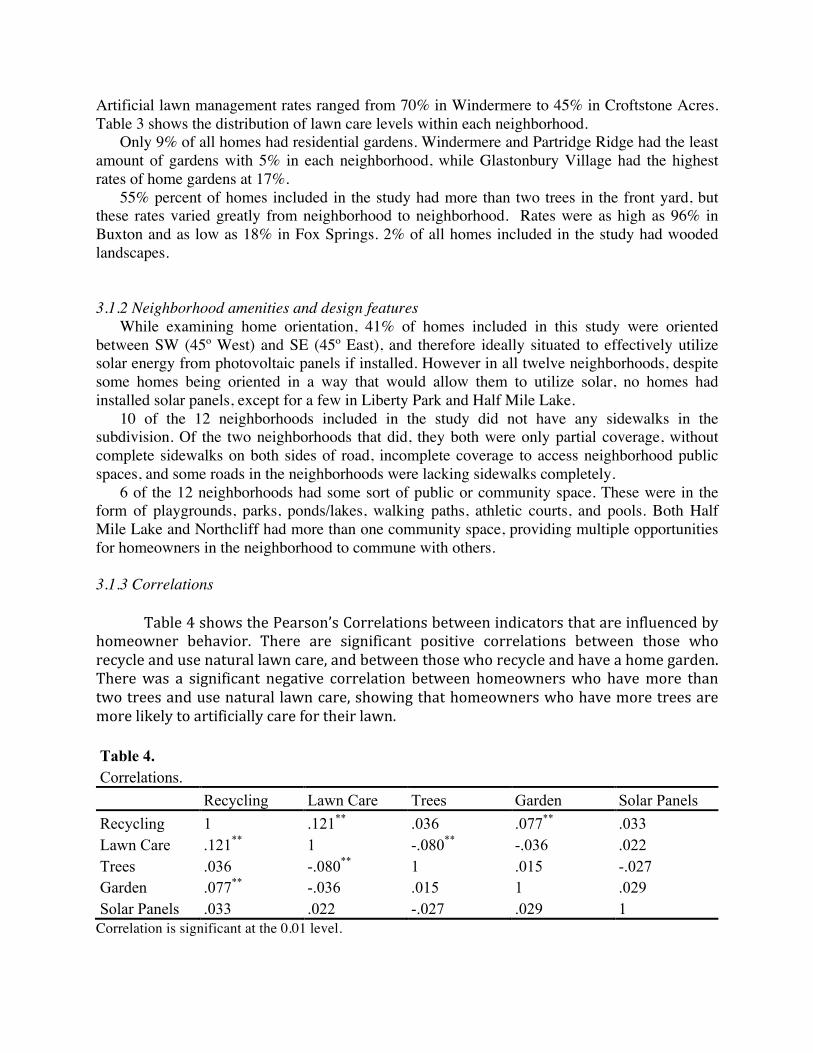
6 of the 12 neighborhoods had some sort of public or community space. These were in the form of playgrounds, parks, ponds/lakes, walking paths, athletic courts, and pools. Both Half Mile Lake and Northcliff had more than one community space, providing multiple opportunities for homeowners in the neighborhood to commune with others. 3.1.3 Correlations
Table4showsthePearson’sCorrelationsbetweenindicatorsthatareinfluencedbyhomeowner behavior. There are significant positive correlations between those whorecycleandusenaturallawncare,andbetweenthosewhorecycleandhaveahomegarden.Therewas a significant negative correlation between homeownerswho havemore thantwotreesandusenaturallawncare,showingthathomeownerswhohavemoretreesaremorelikelytoartificiallycarefortheirlawn.Table 4. Correlations. Recycling Lawn Care Trees Garden Solar Panels Recycling 1 .121** .036 .077** .033 Lawn Care .121** 1 -.080** -.036 .022 Trees .036 -.080** 1 .015 -.027 Garden .077** -.036 .015 1 .029 Solar Panels .033 .022 -.027 .029 1
Correlation is significant at the 0.01 level.

3.2 Presence of Homeowners Association
Few significant differences existed between the homes in neighborhoods with homeowners associations and those in neighborhoods without (fig 5). The largest gap existed in number of trees on the homeowner’s property.
As further explained in table 5, only 46% of homes in HOA neighborhoods had more than two trees while 75% of homes in neighborhoods without a HOA had more than two trees. Only 2% of homes in HOA neighborhoods had more than 10 trees, compared to 16% of homes in non-HOA neighborhoods. On the lower end of the spectrum, 33% of homes in HOA neighborhoods had one tree or less, compared to 15% of homes in non-HOA neighborhoods. 0% of homes in neighborhoods with HOAs were wooded, and 6% of homes in neighborhoods without HOAs were wooded. The neighborhood with the largest amount of homes with wooded landscaped was Buxton at 16%.
The second most significant difference was in lawn care. There was a 5% difference between homes in neighborhoods with HOAs who artificially cared for their lawn (60%) and homes in neighborhoods without HOAs that artificially cared for their lawns (55%). The total percentage of homes in neighborhoods with HOAs that were highly, artificially managed with excessive chemicals was 36%, compared to only 19% of homes in neighborhoods without HOAs. Table 6 compares the difference between percentage of homes in HOA neighborhoods and in non-HOA neighborhoods that fall into each category (1-4), or do not have conventional turf lawns.
Although there was only a 2% difference between HOA and non-HOA neighborhoods in percentage of homes with gardens, it is notable that, as Table 7 summarizes, of the 10% of homes with residential gardens in non-HOA neighborhoods, 2% of those gardens were in the front yard. Comparatively, no gardens were found in the front yards of homes in neighborhoods with homeowners associations.
There was no significant difference between the HOA and non-HOA neighborhoods in recycling rate, solar orientation, or solar panels.
Both of the neighborhoods that did have sidewalks, Northcliff and Partridge Ridge, are both HOA neighborhoods. No neighborhoods without HOAs have sidewalks.
Of the 6 neighborhoods with a community space, all but one had homeowners associations.
Figure 5. Indicator comparison between homes with homeowners associations and those without. A comparison between HOA neighborhoods and non-HOA neighborhoods for each of the neighborhood sustainability indicators.
0%10%20%30%40%50%60%70%80%
HOA
NonHOA
Orientation

Table 5.
Trees. Neighborhood 0-1 2 3-5 6-9 ≥10 Wooded HOA Brownstone Crossing 56% 23% 14% 5% 2% 0% Edgewood@Paris Mt. 52% 16% 25% 6% 0% 0% Glastonbury Village 59% 18% 17% 5% 1% 0% Half Mile Lake 19% 18% 43% 17% 3% 1% Northcliff 38% 31% 26% 5% 1% 0% Partridge Ridge 18% 18% 47% 11% 6% 0% Non-HOA Buxton 1% 3% 17% 32% 31% 16% Croftstone Acres 18% 12% 38% 18% 11% 2% Fox Springs 58% 24% 15% 0% 3% 0% Liberty Park 9% 6% 39% 30% 10% 5% Timberlake 12% 11% 34% 21% 19% 3% Windermere 20% 16% 32% 23% 9% 0% Total HOA 33% 22% 33% 10% 2% 0% Total Non-HOA 15% 10% 31% 23% 16% 6%
Table 7.
Gardens. Neighborhood Back Front None HOA Brownstone Crossing 9% 0% 91% Edgewood at Paris Mt. 6% 0% 94% Glastonbury Village 17% 0% 83% Half Mile Lake 7% 0% 93% Northcliff 6% 0% 94% Partridge Ridge 5% 0% 95% Non-HOA Buxton 9% 1% 90% Croftstone Acres 6% 4% 90% Fox Springs 15% 0% 85% Liberty Park 6% 3% 91% Timberlake 9% 0% 91% Windermere 11% 0% 89% Total HOA 8% 0% 92% Total Non-HOA 8% 2% 90%
Table 6. Lawn Care. Neighborhood 1 2 3 4 No turf
HOA Brownstone Crossing 51% 12% 19% 18% 0% Edgewood@Paris Mt. 21% 32% 14% 33% 0% Glastonbury Village 34% 30% 12% 25% 0% Half Mile Lake 34% 27% 25% 14% 0% Northcliff 41% 20% 15% 24% 0% Partridge Ridge 32% 18% 14% 35% 0% Non-HOA Buxton 25% 34% 25% 13% 4% Croftstone Acres 14% 36% 38% 11% 2% Fox Springs 30% 18% 30% 21% 0% Liberty Park 17% 47% 32% 4% 0% Timberlake 21% 32% 33% 13% 0% Windermere 27% 43% 30% 0% 0% Total HOA 36% 24% 18% 22% 0% Total Non-HOA 19% 36% 33% 10% 1%

3.3 Covenant Analysis
All six neighborhoods with homeowners associations had sections in their covenants that restricted mixed land use in neighborhoods. This was most prevalent in statements prohibiting the use of each lot for anything other than single-family residential purposes, and prohibiting any business or business activity. All of the covenants also had statements that could inhibit the implementation of home gardens through requiring fencing and landscape changes to be submitted to the architectural review board for approval. Artificial lawn care was promoted in the covenants through articles requiring homeowners to keep lawns neat, clean, orderly, and weed free. Many require the mowing, either explicitly or implicitly, and empower the association to maintain the lawn to proper standards at the homeowner’s expense if they do not do it themselves. Barriers to tree planting is less prevalent, but present in Glastonbury Village and Northcliff. Both of these covenants require homeowners to get permission of the association before planting trees. Partridge Ridge requires homeowners to get approval for any landscape improvements. Edgewood at Paris Mountain, Glastonbury Village, and Partridge Ridge all inhibited the use of solar energy through restricting building orientation by requiring homes to face the front line of the lot. Other restrictions, while less prevalent, included requiring minimum one car garages, requiring minimum floor space, and restricting materials that can be used to pave driveways. 4. Discussion 4.1 Sustainability Indicators 4.1.1 Recycling
70% of all homeowners included in the study recycled. Previous literature on recycling rates vary, with recycling rates as high as 93% and 81% in communities with curbside recycling in western Massachusetts (Seacat and Northrup 2012), and as low as 29% in Claremont, California, where residents are also provided with curbside recycling programs (Burn 1991). A study by Oskamp et al. (1998) more closely mirrored the findings of this analysis, as their study found recycling rates around 77% in La Verne, California.
Previous research has found that the most important determinants of household recycling are people’s attitudes toward recycling, and that higher levels of recycling can be achieved through providing curbside recycling, information, and motivation to residents and helping them develop the necessary skills to recycle (Seacat and Northrup 2012; Saphores and Nixon 2014). The neighborhoods that were analyzed in this study all already have access to curbside recycling programs, so previous literature suggests that the next step to increasing recycling levels would be to focus on informing and motivating homeowners. A number of empirical studies conclude that public education and information campaigns are effective approaches to promote recycling, and face-to-face interactions in sharing information on recycling is an important component of education (Saphores and Nixon 2014). By informing communities about what to recycle, where, and how, and the negative impacts from dumping trash, recycling rates can be increased. 4.1.2 Solar
0-1% rates of solar use in the assessed neighborhoods is clearly indicative of the influence of past solar policies in South Carolina, which have made the state one of the least friendly states in

the United States for solar power use. There was historically little to no incentives for South Carolina homeowners to install solar panels, since homeowners did not have tax incentives or financial mechanisms to help pay for costly solar arrays, nor did they have the option to utilize net metering, which is a billing mechanism that allows residential customers who generate their own electricity from solar power to feed electricity they do not use back into the grid (SEIA). Positive action had not been taken until Summer 2014, when Gov. Nikki Haley signed a bill loosening restrictions on solar energy, which is expected to expand solar drastically in the state (Fretwell 2014). Now, net metering, along with federal and state tax credits worth 55% of the cost of a solar system, are finally making solar a more viable option for homeowners. Even though the federal tax credits are set to expire at the end of 2016, solar leasing is yet another new opportunity for South Carolina homeowners that is making solar a more attractive option. Solar leasing is when a company bears the upfront costs of solar panels, and structure a deal so that they make money on the solar panels over the term of the lease while the customer saves money on power bills. Instead of big costs upfront and big savings later, the homeowner typically gets more modest savings every year (Slade 2015). Additionally, Duke Power is offering rebates of $1 per watt for homeowners who use solar. These new opportunities for South Carolina homeowners are increasing the affordability and attractiveness of installing solar arrays, and will likely lead to an increase in solar on homes due to these positive policy changes.
However, although solar is becoming more attractive, 59% of homeowners in Greenville will not be able to optimize their solar potential due to the inopportune orientation of their home. Unfortunately, this is a barrier to sustainability imposed by the developers and is something that the homeowner is not able to easily change. This portrays a key issue where it is essential that developers take sustainability and sustainable lifestyle choices into consideration while planning and building subdivisions.
4.1.3 Lawn Care
The finding that just over half of homes included in the study (58%) use artificial lawn care is consistent with similar findings from other studies (Fraser et al. 2013). This is widely due to the common practice of re-grading by developers before building a new subdivision, which removes all of the topsoil. The developers then roll out a monoculture set of sod. Homeowners inherit these lawns when they purchase the homes, and due to the lack of soil, are forced to irrigate and fertilize in order to keep the lawn alive. Developers also frequently install irrigation systems during this process, further strengthening the pressure to maintain the lawn as they inherited it. The pressure to keep lawns up to par with neighbors also leads to increased maintenance of lawns with pesticides designed to kill weeds and insects and fertilizers to promote the growth of plants and grass (Blaine et al. 2012). The prevalence of artificial lawn care is likely because homeowners fear that “wild” lawns may lower their property values, feel pressured to uphold community standards, view the lawn as a reflection of personal character, and value landscape aesthetics as one of the most important traits in maintaining their lawns (Blaine et al. 2012, Martin et al. 2003). These factors lead homeowners to use chemical inputs on their lawn. 4.1.4 Comprehensive analysis/Correlations
The correlation table shows strong positive correlations between recycling and lawn care, and recycling and gardens. This suggests that homeowners who recycle are more likely to have gardens and to use natural lawn care than homeowners who do not. The table also showed a

significant negative correlation between trees and lawn care, suggesting that if a homeowner has more trees, they are less likely to use natural lawn management practices. The negative correlation was surprising, since we hypothesized that homeowners who have more trees in their lawn are more environmentally minded and would not use artificial lawn care. However this correlation may suggest that homeowners who have more trees care more about the maintenance and appearance of their lawns, therefore leading them to artificially care for their turf. 4.2 Homeowners Association Covenants
It is clear that homeowners associations subject homeowners to multiple sustainability barriers due to the prohibitive sections in their adopted covenants. These barriers are most salient in how they affect number of trees in homeowners’ front yards, the number of homeowners that artificially care for their yards, and the presence of domestic gardens in street view.
The finding that homes in neighborhoods without HOAs had more trees than homes in neighborhoods with HOAs was consistent with previous findings from Martin et al. (2003), whose analysis found that in the Phoenix metropolitan area, landscapes in neighborhood communities with covenants had fewer trees. Although the frequency of statements in the covenants that would inhibit tree planting was far less than those inhibiting other aspects of the landscape, this difference was the most significant out of all the sustainability indicators included in the study. The lack of HOA lawns with wooded landscapes is unsurprising since the majority of covenants require that homeowners maintain “neat” landscapes. The wooded design is widely considered “wild” as opposed to “neat” by various scholars and would therefore violate this covenant requirement.
The presence of statements that promote artificial lawn care in HOA covenants was also reflected in homeowner behaviors in the surveyed neighborhoods, which was the second most significant difference between homes in neighborhoods with HOAs and those in neighborhoods without. Again, this is consistent with previous literature that has found that HOAs, which create neighborhood expectations for a green, well-manicured lawn informed by clauses in HOA covenants lead to increased chemical inputs onto lawns and higher overall fertilization rates (Blaine et al. 2012, Fraser et al. 2013). The HOAs provide more than just cultural pressure; these neighborhood policies have legal power over the homeowners, and failure to uphold the laws enforcing certain standards of lawn care may lead to complaints from the neighbors followed by fines or other legal action (Clayton 2007). Policies such as these restrict the use of sustainable landscape designs, which are typically naturally managed, and thus stand as institutional barriers to sustainably managed lawn (Helfand et al 2006). Furthermore, since many covenants mandate the maintenance of neat, grassed lawns, it logically follows that 0% of homes in HOA neighborhoods has lawns without conventional turf.
Although there was only a 2% difference between HOA and non-HOA neighborhoods in percentage of homes with gardens, which is more or less consistent with previous literature which found that homeowners in neighborhood communities with or without covenants are equally likely to have a vegetable garden (Martin et al. 2003), it is notable that of the 10% of homes with residential gardens in non-HOA neighborhoods, 2% of those gardens were in the front yard. Comparatively, no gardens were found in the front yards of homes in neighborhoods with homeowners associations. This is likely due to the reach of HOA covenant policy. Most covenants only mandate homeowner behavior visible from the street, or that in the front yard. Therefore, it is easier for homeowners to act against their HOA covenants when it is not visible

from the street, and thus are able to avoid any barriers to planting a home garden by placing it in the back yard.
There was no significant difference between the HOA and non-HOA neighborhoods in recycling rate, solar orientation, or solar panels. This is expected, as things other than the presence of a HOA most likely influence these indicators. Recycling rate is greatly improved by presence of curbside recycling, which is present in all included neighborhoods, regardless of HOA presence or not (Seacat and Northrup 2012). Solar orientation is purely determined by the developer and is not easily changed by the homeowner. Solar panel installation is greatly influenced by the policies and incentives relating to solar energy, which is implemented at the state level and affects all homes both in and out of HOA agreements.
Of the 6 neighborhoods with a community space, all but one had homeowners associations. This is likely because homeowners in HOAs must pay HOA fees, and this money can be used to create and manage community spaces such as pools, playgrounds, or athletic courts which require money for installation and upkeep. Without funding, nonHOA neighborhoods might not have the resources to provide such spaces in their communities. 4.3 Recommendations
Although HOA covenants have the potential to implement barriers to sustainable homeowner behaviors, they also provide opportunities to promote sustainability through removing or revising clauses that currently inhibit sustainability, introducing clauses that promote sustainable behavior, and educating homeowners. Homeowners associations have the ability to impose on private property rights unlike any other form of governance (Robbins and Birkenholtz 2003). This is indicative of the power of the barriers that they impose, but also highlights the power that HOAs have to promote more sustainable lawn care practices if they are revised. Previous literature has concluded that a revision to any clause that dictates that homeowners keep a “neat and kept” lawn would be helpful in achieving less chemical inputs onto lawns (Blane et al. 2012). Rather, if HOA covenants promote the adoption of alternative, environmentally friendly landscapes that don’t require heavy chemical inputs, they have the potential to create a new neighborhood norm of sustainability.
Policy change alone is not enough to tackle issues such as changing neighborhood norms, including high fertilizer rates. These changes must be coupled with education (Kirkpatrick et al. 2014). One of the HOA’s greatest potential strengths is in its ability to educate and provide information on how to make sustainable lifestyle choices through meetings, HOA websites/ social media pages, and newsletters. These mediums can be used to increase the percentage of residents who utilize solar energy by providing information about new solar policies and incentives to encourage homeowners to take advantage of them.
HOAs can also inform about sustainable lawn management practices and the environmental harm of chemical inputs. They can promote landscape designs that make “wildness” look “neat” to ensure that the lawns have less impact on the environment while maintaining an appealing aesthetic allowed by the neighborhood HOA. For example, HOAs can suggest using a white stone fence as a “cue to care” that separates the “wild” portion of the lawn from smaller manicured areas. This makes the wild portion of the lawn seem more intentional, and thus more “neat” and attractive (Zheng et al. 2011). They could also provide homeowners with information about tree planting and maintenance, along with native plants that could be integrated into the landscape.

HOAs could also be used to inform homeowners about recycling information that could improve neighborhood participation rates by increasing recycling knowledge, motivation and skills of residents (Seacat and Northrup 2010). HOAs can inform residents about the details of how to recycle, including what can and cannot be recycled, provide information specific to the recycling process, and give feedback to residents about the changing rates of community recycling and waste production, all of which may serve to enhance individual motivation and increase neighborhood recycling rates (Seacat and Northrup 2010). Furthermore, the HOA is an institution that can implement mandatory recycling programs, as exemplified in Woodbury, New Jersey, where mandatory recycling programs have been highly successful. There, officials randomly select homes to check for compliance, giving non-compliers first a warning, then refusal to collect their trash for several weeks, then up to a $300 fine. Woodbury has a participation rate of 98% and diverts 50% of its waste stream through recycling (Burn 1991). If the HOA covenants required recycling, and these institutions enforced it, rates would likely be significantly higher than the rates that were observed.
5. Areas for Future Work
This study was limited by indicators that could be assessed visually without homeowner interaction or access onto the homeowners property. Future work could include other indicators that are obtainable from a survey or include facets that are determined by surveys and discussions with the homeowners.
In order to assess clustering effects of homeowners who lead particularly sustainable (or unsustainable) lifestyles, or to see if there is a spatial component to any of the indicators, a GIS analysis could be completed. Due to time constraints, we were not able to complete this analysis, but this could be a future step for analysis with the data collected from this study.
Furthermore, in order to address socioeconomic differences, neighborhoods with higher and lower fair market values could also be assessed to see if this causes any difference in sustainable homeowner behaviors. 6. Conclusion
Suburban development has lead to widespread negative environmental and social impacts that have lead to sustainability indicator studies at the urban and neighborhood level. However, the previous literature lacks any multi indicator studies at the neighborhood level. This study fills this gap by taking a holistic view of neighborhood sustainability by looking at homeowner behaviors in the context of social systems to look at the functioning of neighborhoods through a sustainability lens. Through the analysis of 12, single family, $150,000- $250,000 residential neighborhoods in Greenville, South Carolina, HOAs impact of sustainable living, correlations between sustainability indicators, and the overall levels of residential sustainability in Greenville were assessed. Nine sustainability indicators that encompassed both development of neighborhoods (HOA’s and their covenants, sidewalks, public space, and home orientation) and homeowner behavior (lawn care, recycling, gardens, solar panels, and tree planting) were chosen. The results from these indicators allowed for a quantification of the sustainability of neighborhoods in Greenville County. 70% of the sample population recycled, 58% artificially cared for their lawn, 0% had photovoltaic arrays, 41% of homes were oriented in a direction to utilize solar power, 9% had home gardens, and 55% had more than two trees in their front lawn.

When correlations were run between the indicators, there were significant positive correlations between recycle and natural lawn care (.121) and recycle and garden (.077), and significant negative correlations between trees and natural lawn care (-.080). After assessing HOA covenants, clauses that inhibit mixed land use, tree planting, gardening, solar, and natural lawn care were all present. It was evident that these clauses influenced homeowner behavior when the indicators of HOA neighborhoods were compared to non-HOA neighborhoods. The community space indicator revealed that HOAs could encourage neighborhood sustainability; 5 of the 6 neighborhoods with HOAs had some sort of community space, while only one non-HOA neighborhood had such amenities. Overall, this study reveals the influence of governing bodies and developers on individual behaviors that can have great impacts on communities and the natural environment. In order to overcome the negative impacts of HOAs and use them as promoters of sustainable lifestyles and neighborhoods, we recommend that all clauses that currently inhibit sustainability be removed or revised, that HOAs use their connectivity and influence to educate homeowners about sustainable behaviors, and implement mandatory recycling programs. Appendix A.
• Inhibits mixed use: o Lot shall be used exclusively for single family residential dwellings (I.1 EPM) o No number lot, or any part thereof, shall be used for any business or commercial
purpose or for any public purpose (I.4 EPM) o No more than one family shall occupy a dwelling on any lot (II.5 BC) o Each lot… shall only be used as a single family residence, and for no other
purpose (VIII.a GV) o No industry, business, trade, occupation, or profession or [sic] any kind… shall
be… permitted on the property (VIII.f GV) o Lots shall be used exclusively for single family residential dwellings (Article 5
PR) o All Lots shall be used for single-family, residential purposes only, and no
business or business activity shall be carried on or upon any lot at any time, except with the written approval of the Architectural Control Committee (VII.1 NC)
o Each lot… shall only be used as a single-family residence and for no other purpose (VII.2.a HML)
o No industry, business, trade, occupation, or profession of any kind, whether commercial or otherwise, shall be conducted, maintained, or permitted on any part of the property (VII.2.f HML)
• Inhibits gardens:
o No fencing of any type shall be allowed or erected that extends past the frontal line of any residence (I.8 EPM)
o All fencing erected on the lots hereinabove referred to shall be approved by the Committee in the same fashion as set out in paragraph III (4) of this covenant. (III.6 EPM)

o No improvements of any kind, including modifications to existing structures, shall take place on any lot before building plans and specifications have been approved in writing by the architectural control committee. (IV BC)
o All fencing erected and/or planting of trees and/or planting of scrubs [sic] on the lots herein above referred to shall be approved by the committee (VII.6 GV)
o No fencing of any type shall be allowed or erected that extends past the rear drip line of any residence, and subject to Article VII (6)(a)-(c) (VIII.n)
o **Better option- PR 6.3: no wall, fence, or hedge having a height of more than three feet shall be erected: (1) across or along the front of any lot; (2) along any front side line; or (3) along the front building setback line running to the front edge of the house.
o A landscape development plan must be submitted to and approved by the ARC before work commences (10.2 PR)
o No building, fence, wall or other structure or planting or landscaping shall be commenced, erected or maintained upon any lot, nor shall any exterior addition to or change or alteration therein including without limitation any plantings or landscape be made until the plans and specifications showing the nature, kind, shape, height, materials and location of the same shall have been submitted to and approved in writing as to harmony of external design and location in relation to surrounding structures and topography by the Board of Directors of the Association (V.1 NC)
o No fencing shall be allowed in the front yard nor shall fencing be allowed past the rear house corner toward the front yard except when the Architectural Control Committee gives written approval. (VII.3 NC)
o No building, fence, wall… shall be commenced, erected, or maintained upon the Property (VI.2 HML)
• Inhibits trees: o All fencing erected and/or planting of trees and/or planting of scrubs [sic] on the
lots herein above referred to shall be approved by the committee (VII.6 GV) o Furthermore, to guarantee the preservation of a particular view for adjoining and
nearby land owners there shall not be erected or placed a fence, wall, tree, or shrub that may at present or in future obstruct the view from any other lot unless and except as approved by the Architectural Control Committee (VII.3 NC)
o ** Better option NC: Trees which have a diameter in excess of six (6") inches measured two (2') feet above ground level, and distinctive flora, shall not be intentionally destroyed or removed except with the prior approval, in writing, of the Architectural Control Committee (VII.14)
• Promotes artificial lawn care
o The Association shall be empowered to… remov[e] grass and weeds… to keep such property neat and in good order for the general benefit of the owners (VI.4 EPM)
o All yards and vacant lots shall be maintained and kept in a neat, clean, and orderly manner. If a dwelling is completed on a lot, the yard must be grassed and the grass must be cut at reasonable intervals. (II.14 BC)

o Each owner shall keep and maintain…any landscaping, in good condition and repair, including, but not limited to…the seeding, watering, trimming, and mowing of all lawns. (Article 5.12 PR)
o Each Owner shall be responsible for the exterior maintenance of his or her dwelling and lot, as follows… lawn, trees, shrubs. … In the event that the Owner neglects or fails to maintain his or her lot and/or the exterior of his or her dwelling in a manner consistent with other Lots and dwellings in Northcliff, the Association may provide such exterior maintenance as provided above… In the event the Association performs such exterior maintenance, repair or replacement. The cost of such maintenance, replacement or repairs shall be added to and become a part of the assessment to which such lot is subject. (VI NC)
o The Owner of each numbered lot, improved and unimproved, shall keep the same free of all tall grass, undergrowth, dead trees, dangerous and dead tree limbs, weeds… Association shall have the right (but not the obligation) to go upon such numbered lot and to cut and remove tall grass, undergrowth, weed… all at the expense of the Owner of such numbered lot (VII.27)
• Inhibits solar o Any such building shall face toward the front line of the lot (II.1EPM) o Any such building shall face toward the front line of the lot (VI.1 GV) o Building shall face toward the front line of the lot (6.1 PR) o No numbered lot in this subdivision shall be recut so as to face any direction other
than as shown on the recorded plat (6.4 PR) • Other
o Minimum one car garage (EPM II) (VII.2.a HML) o Min floor space (BC II) (GV VI.3) (PR 6.6) (VII.6 NC) (VII.3 HML) (EPM II) o No permeable pavements (II.12 BC) (Article 5.7 PR) (VII.23 NC)
7. References Amado, M., Poggi, F., 2012. Towards solar urban planning: A new step for better energy
performance. Energy Procedia 30, 1261–1273. Anderson, L.M., Cordell, H.K., 1988. Influence of trees on residential property values in Athens,
Georgia (U.S.A.): A survey based on actual sales prices. Landscape and Urban Planning 15, 153- 164.
Blaine, T.W., Clayton, S., Robbins, P., Grewal, P.S., 2012. Homeowner attitudes and practices towards residential landscape management in Ohio, USA. Environmental Management 50, 257–271.
Braulio-Gonzalo, M., Bovea, M.D., Ruá, M.J., 2015. Sustainability on the urban scale: Proposal of a structure of indicators for the Spanish context. Environmental Impact Assessment Review 53, 16–30.
Burn, S.M., 1991. Social Psychology and the Stimulation of Recycling Behaviors: The Block Leader Approach. Journal od Applied Social Psychology 21, 611-629.
Calvet-Mir, L., Gomez-Baggethun, E., Reyes-Garcia, V., 2012, Beyond food production: Ecosystem services provided by home gardens. A case study in Vall Fosca, Catalan Pyrenees, Northeastern Spain. Ecological Economics 74, 153—160.

Cameron, R.W.F., Blanusa, T., Taylor, J.E., Salisbury, A., Halstead, A.J., Henricot, B., Thompson, K., 2012. The domestic garden— its contribution to urban green infrastructure. Urban Forestry & Urban Greening 11, 129– 137.
Christie, L., 2012. 10 Fastest Growing Cities in the US. CNN Money. Clayton, S., 2007. Domesticated nature: Motivations for gardening and perceptions of
environmental impact. Journal of Environmental Psychology 27, 215–224. Crociata, A., Agovino, M., Sacco, P.L., 2015. Recycling waste: Does culture matter?. Journal of
Behavioral and Experimental Economics 55, 40–47. Fraser, J. C., Bazuin, J.T., Band, L. E., Grove, J. M., 2013. Covenants, cohesion, and
community: The effects of neighborhood governance on lawn fertilization: Landscape and Urban Planning, v. 115, p. 30– 38.
Fretwell, S., 2014. Haley signs bill to ease restriction on solar energy. The State. Helfand, G.E., Park, J.S., Nassauer, J.I., Kosek, S., 2006, The economics of native plants in
residential landscape designs. Landscape and Urban Planning 78, 229—240. Jabareen, Y., 2006. Sustainable urban forms: Their typologies, models, and concepts. Journal of
Planning Education and Research 26, 38-52. Kirkpatrick, B., Kohler, K., Bryne, M., Fleming, L.E., Scheller, K., Reich, A., Hitchcock, G.
Kirkpatrick, G., Ullmann, S., Hoagland, P., 2014. Human responses to Florida red tides: Policy awareness and adherence to local fertilizer ordinances. Science of the Total Environment 493, 898–909.
Martin, C.A., Peterson, K.S., Stabler, L.B., 2003. Residential landscaping in Phoenix, Arizona, U.S.: Practices and preferences relative to covenants, codes, and restrictions. Journal of Arboriculture 29, 9-17.
Martini, N.F., Nelson, K.C., Hobbie, S.E., and Baker, L.A., 2015. Why “Feed the Lawn?” Exploring the influences on residential turf grass fertilization in the Minneapolis- Saint Paul metropolitan area. Environment and Behavior 47, 158-183.
Nassauer, J.I., Wang, Z., Dayrell, E., 2009. What will the neighbors think? Cultural norms and ecological design. Landscape and Urban Planning 92, 282–292.
Oskamp, S., Burkhardt, R.L., Schultz P.W., Hurin, S., and Zelezny, L., 1998. Predicting Three Dimensions of Residential Curbside Recycling: An Observational Study. The Journal of Environmental Education 29, 37-42.
Porta, S., Renne, J.L., 2005. Linking urban design to sustainability: formal indicators of social urban sustainability field research in Perth, Western Australia. Urban Design International 10, 51-64.
Randall, T.A., Baetz, B.W., 2001. Evaluating pedestrian connectivity for suburban sustainability. Journal of Urban Planning and Development 127, 1-15.
Robbins, P., Birkenholtz, T., 2003. Turfgrass revolution: measuring the expansion of the American lawn. Land Use Policy 20, 181–194.
Saphores J.M., Nixon, H., 2014. How effective are current household recycling policies? Results from a national survey of U.S. households. Resources, Conservation and Recycling 92, 1–10.
Seacat, J.D., Northrup, D., 2010, An information–motivation–behavioral skills assessment of curbside recycling behavior: Journal of Environmental Psychology v.30 p. 393–401.
Sharifi, A., Murayama, A., 2013. A critical review of seven selected neighborhood sustainability assessment tools, Environmental Impact Assessment Review 38, 73–87.

Shen, L., Ochoa, J.J., Shah, M.N., Zhang, X., 2011. The application of urban sustainability indicators- a comparison between various practices. Habitat International 35, 17-29.
Slade, D., 2015. Residential solar power options expanding in South Carolina, The Post and Courier.
Smetana, S.M., Crittendena, J.C., 2014. Sustainable plants in urban parks: A life cycle analysis of traditional and alternative lawns in Georgia, USA. Landscape and Urban Planning 122, 140-151.
Solar Industries Energy Association, n.d.. South Carolina Solar. Retrieved November 16, 2015, from http://www.seia.org/state-solar-policy/south-carolina
Taylor, J.R., Lovell, S.T., 2012. Mapping public and private spaces of urban agriculture in Chicago through the analysis of high-resolution aerial images in Google Earth. Landscape and Urban Planning 108, 57-70.
Visscher, R.S., Nassauer, J.I., Brown, D.G., Currie, W.S., Parker, D.C., 2014. Exurban residential household behaviors and values: Influence of parcel size and neighbors on carbon storage potential. Landscape and Urban Planning 132, 37–46.
Yigitcanlar, T., Kamruzzaman, M.D., Teriman, S., 2015. Neighborhood sustainability assessment: Evaluating residential development sustainability in a developing country context. Sustainability 7, 2570-2602.
Zheng, B., Zhang Y., Chen, J., 2011. Preference to home landscape: wildness or neatness?. Landscape and Urban Planning 99, 1–8.