nema strategic initiative increasing energy efficiency in
TRANSCRIPT
NEMA Strategic Initiative
Increasing Energy Efficiency in
Urban Water Supply Systems
Submitted to:
National Electrical Manufacturers Association
1300 North 17th Street, Suite 900
Arlington, VA 22209
Submitted by:
GEI Consultants, Inc.
2868 Prospect Park Drive, Suite 400
Rancho Cordova, CA 95670
916.631.4500
March 2016
Project 1512760
M. Lorraine White, ENV SP
Water-Energy Program Manager
Increasing Energy Efficiency in Urban Water Supply March 2016
GEI Consultants, Inc. i
Preface
The National Electrical Manufacturers Association (NEMA) is the association of electrical
equipment and medical imaging manufacturers, founded in 1926 and headquartered in
Rosslyn, Virginia. Nearly 400 members strong, its companies manufacture a diverse set of
products including power transmission and distribution equipment, lighting systems, factory
automation and control systems, and medical diagnostic imaging systems. Total U.S.
shipments for electro-industry products exceed $100 billion annually.
NEMA provides a forum for the development of technical standards that are in the best
interests of the industry and users, advocacy of industry policies on legislative and regulatory
matters, and collection, analysis, and dissemination of industry data. NEMA supports these
actions through strategic initiatives that advance knowledge and understanding to identify
strategies and actions that advance their memberships’ goals.
To support NEMA’s strategic initiative related to the relationship of electricity and water in
urban water systems, NEMA selected GEI Consultants and its partners, the Alliance for
Water Efficiency and M.Cubed, to assist in analysis of issues. This initiative seeks to:
Quantify the effectiveness and efficiency of equipment in facilities representative of
the U.S. urban water supply’s delivery and treatment systems.
Analyze the market potential to improve performance by using NEMA member
products.
Reevaluate the viability of applying energy savings performance contract practices to
finance modernization upgrades. This report presents the results of the project team’s
analysis and conclusions.

Increasing Energy Efficiency in Urban Water Supply March 2016
GEI Consultants, Inc. ii
Abstract
Urban water systems throughout the country rely on energy consuming technologies to
develop, transport, treat, and deliver billions of gallons of water to end users. Over the years,
the energy efficiency and performance of these technologies has improved significantly,
potentially reducing costs, improving reliability, and providing operational flexibility for
system managers. Despite these potential benefits, the water sector has been slow to adopt
these new and innovative devices. In response, the National Electrical Manufacturers
Association (NEMA) selected GEI Consultants, Inc. (GEI) and its partners (the Alliance for
Water Efficiency and M.Cubed) to assess and identify new strategies and approaches to
support the advancement of energy efficiency in urban water supply systems. To accomplish
this, the study team analyzed available information regarding the application of energy
efficient technologies in water systems and the financing mechanisms used to fund these
improvements. The team also engaged industry and water agency representatives through
interviews and surveys to obtain more agency specific information. Responses and available
literature were analyzed to determine the extent of the current market penetration and the
potential for further adoption. GEI’s team also evaluated the viability of energy savings
performance contract practices, other financing mechanisms, and government grants to
finance modernization system upgrades.
The literature review resulted in the compilation of a significant amount of information and
data produced from numerous studies and projects over more than 20 years of efforts. The
studies identified how systems operate, where energy is used most and where opportunity
exist to apply best management strategies to improve energy performance of these systems.
The survey was distributed to more than 3,000 agency representatives nationwide but for a
variety of reasons had limited response. These respondents, however, represented a
regionally diverse set of water agencies and provided meaningful insights into the level of
interest in energy efficiency, institutional, and financial challenges to advancing efficiency in
these water systems, and possible steps that can be taken to overcome them. The study team
determined that significant energy efficiency savings potential exists within the urban water
systems and that Energy Savings Performance Contracts are a viable business model to
secure available funds to implement improvement projects.
Results from this study will inform future collaborations between NEMA members and water
utilities, and the development of plans with measureable outcomes that advance the energy
efficiency of urban water supply systems.
Increasing Energy Efficiency in Urban Water Supply March 2016
GEI Consultants, Inc. iii
Table of Contents
1. Introduction 1
1.1 Study Approach 2 1.1.1 Literature and Information Review 2 1.1.2 Urban Water Supplier Survey 4 1.1.3 Assessing Energy Efficiency Potential 5
1.1.4 Evaluating the Viability of Energy Service Companies in the Water
Utility Sector 5
2. Urban Water Supply Systems 7
2.1 Energy Intensity of Water Systems 10 2.2 Best Energy Management Practices for Water Systems 14
2.3 Available Funding 18 2.3.1 New Funding Opportunities 19
3. Urban Water System Efficiency Survey 20
3.1 Advance Survey Preparation 20 3.1.1 Input for Survey Development 20
3.2 Urban Water Supplier Survey Instrument 23 3.2.1 Respondents’ Informal Feedback 25 3.2.2 Utility Survey Responses 26
3.2.3 Approval Barrier to Utility Procurement of Energy Efficient
Equipment 35
4. Market Potential for Electricity Efficiency in Urban Water Systems 38
4.1 Market Potential Estimates for Energy Savings Measures 38 4.1.1 Potential Energy Savings in Typical Water Utility Operations 38
4.1.2 Net Present Value of Energy Efficiency Savings 42
4.1.3 Savings as a Proportion of Overall Costs and Ratepayer Bills 42
5. Use of Performance Contracts for Advancing Efficiency in Water Infrastructure 44
5.1 Institutional Understanding of the Target Market 44
5.2 Considerations in Designing Successful Energy Service Performance
Programs 45
5.3 Financing Methods 47
6. Conclusions and Recommendations 51
Tables
Table 1 Size Categories of Community Water Systems 8
Table 2 Energy Management Opportunities 16
Increasing Energy Efficiency in Urban Water Supply March 2016
GEI Consultants, Inc. iv
Table 3 Summary of Water Treatment Facility Examples 38
Table 4 Energy Use by Process, Source: EPRI/WRF 39
Table 5 Net Present Values of Energy Efficiency Savings 42
Table D-1 Top 10 States by ESCO Activity 66
Table D-2 Net Benefits and Benefit-Cost Ratios Summary 70
Table D-3 Median Payback Time and Benefit-cost Ratio Summary 71
Figures
Figure 1 Water Withdrawals to Meet US Demand. Source- USGS 2014. 7
Figure 2 Example Urban Water Supply System 9
Figure 3 DWR Water and Energy Connection 13
Figure 4 Distribution of Survey Respondents 25
Figure D-1 ESCO Contract Types 61
Figure D-2 ESCO Contractual Relationships 62
Figure D-3 ESCO Contract Terms 64
Figure D-4 Project Activity by State 65
Figure D-5 Electricity Savings 68
Figure D-6 Accuracy of ESCP Saving Predictions 69
Appendices
Appendix A 53
Appendix B 56
Appendix C 58
Appendix D 60
Appendix E 73
Appendix F 75
MLW:admin initials
C:\Users\lwhite\Desktop\NEMA Working\Report Working\NEMA Report DRT 03282016 Final.docx

Increasing Energy Efficiency in Urban Water Supply March 2016
GEI Consultants, Inc. 1
1. Introduction
Americans rely on extensive infrastructure systems to develop, treat, and deliver water
supplies for their various needs. Operators of these water supply systems are facing an
increasing number of challenges in the United States (U.S.) to supply reliability, quality, and
costs, including:
More stringent drinking water standards and treatment requirements.
Rising energy demands associated with the development, treatment and overall
system operation associated with various water suppliers.
Aging infrastructure that impacts operational reliability and flexibility.
Non-technical barriers such as lack of funding to optimize energy use and achieve
energy efficiency.
Significant reductions in operating revenue from declining customer sales, which
impact a water supplier’s ability to be progressive.
In its 2013 Report Card for American Infrastructure, the American Society of Civil Engineers
(ASCE) assessed drinking water systems in our country at a “D” grade, stating that “(a)t the
dawn of the 21st century, much of our drinking water infrastructure is nearing the end of its
useful life.”1 Although the quality of drinking water in the U.S. remains high, the American
Water Works Association (AWWA) estimates that $1 trillion in infrastructure investments is
needed to ensure continued reliability and quality over the coming decades. Much of this
investment is required to replace pipes and mains, but with the cost of energy a significant
portion of a utility’s operational budget, investing in more energy efficient technology can
help to lower ongoing costs.
As part of its strategic initiative to advance energy efficiency in urban water supply systems,
the National Electrical Manufacturers Association (NEMA), supported by GEI Consultants,
Inc. (GEI), seeks to understand the current conditions and opportunities to facilitate this
advancement. This initiative has three primary goals:
Assess the current effectiveness and efficiency of equipment in facilities
representative of the U.S. urban water supply’s delivery and treatment systems.
Analyze the market potential to improve performance by using more energy efficient
products.
1 American Society of Civil Engineers (2013) “2013 Report Card for America's Infrastructure,” ISBN (PDF): 978-
0-7844-7883-7.
Increasing Energy Efficiency in Urban Water Supply March 2016
GEI Consultants, Inc. 2
Evaluate the viability of applying energy savings performance contract (ESPC)2
practices to finance modernization upgrades.
The study team conducted three primary tasks as part of this project: 1) an extensive
investigation of available information and literature on the status of energy efficiency efforts
and best practices by urban water suppliers in the U.S., 2) a survey of water supply utilities
regarding their past efforts to improve the efficiency of their systems and level of current
interest in increased energy efficiency opportunities, and 3) an analysis of the use of ESCOs
to advance energy efficiency and ways in which this model is or can be used by water
utilities. Additionally, the study team compiled available information on current water
infrastructure funding needs and programs available to water utilities to support system
improvements, repairs, expansions, and retrofits, including those for improved energy
efficiency. We also interviewed a number of NEMA members to gain an understanding of
the current level of engagement and information exchange between manufacturers of energy
efficient equipment and the water utilities that use it. The results of this work are presented in
this report.
1.1 Study Approach
1.1.1 Literature and Information Review
A literature review was conducted as part of this project to obtain a critical understanding of
the current level of energy efficiency in the urban water supply systems and the extent to
which emerging advanced efficiency technologies have been applied. The compiled literature
provides an extensive bibliography of resources available to the study team to support
NEMA’s strategic initiative. Relevant literature included peer-reviewed publications,
research reports, white papers, technical conference presentations, agency fact sheets, and
case studies. Using the defined strategic goals and objectives of the initiative, the research
team applied the following methodology to identify and compile relevant resources:
Identified key search terms related to urban water supply systems and designs,
optimization and energy efficiency, water infrastructure financing, and energy service
providers.
Used standard internet search engines.
Considered documents that were in English, readily available electronically via
internet, and at no cost.
Revisited terms and revise periodically, refine, and update as needed.
2 Energy Savings Performance Contracts are a financing mechanism used by Energy Service Companies (ESCO)
to make energy efficiency upgrades to facilities on behalf of the owner which are then paid for using money resulting from the energy savings. For more information see: http://energy.gov/eere/slsc/energy-savings-performance-contracting.
Increasing Energy Efficiency in Urban Water Supply March 2016
GEI Consultants, Inc. 3
Critically reviewed/analyzed materials to determine relevance to the defined goal and
objective:
o Focus of the documents
o Scope of the study or analyses
o Findings/Results
Compiled the results in an Excel spreadsheet
Literature collected had to be publicly available, supplemented by contributions from the
NEMA Working Group and internal knowledge of the research team. In this case, “publicly
available research” was interpreted to mean that the research can be easily accessed by the
public and is not confidential. These constraints ensure that research that is obscure, too
narrowly focused or overly technical, or purely in the conceptual phases of research are not
included in this effort.
The scope of the investigation was primarily focused on research conducted within the U.S.
This criterion ensures that the research collected captures the issues that are relevant to the
country’s urban water supply systems. When appropriate, the study team determined that
information contained within a non-U.S. resource provide information applicable to U.S.
systems and thus was included it in the compiled literature. In addition, several relevant
reports and documents included address energy efficiency in both water and wastewater
systems because these systems use similar equipment such as pumps, motors, and meters.
The study team also included guidebooks and compilations that summarize case studies and
information on best practices. Finally, the database was catalogued by paper title; author(s);
sponsoring or authoring organization; date of publication; primary subjects discussed; the
area of study relevance; a summary of results or key points; and links to the internet source
of the document.
Several informative sites were identified as part of this task and include:
Alliance for Water Efficiency (http://www.allianceforwaterefficiency.org )
Alliance to Save Energy (http://www.ase.org)
American Council for an Energy-Efficient Economy (ACEEE)
(http://aceee.org/topics/water-and-wastewater)
ASCE (http://www.asce.org/ )
AWWA (http://www.awwa.org)
Consortium for Energy Efficiency (http://www.cee1.org )
Electric Power Research Institute (EPRI) (http://my.epri.com/portal/server.pt)
New York State Energy Research and Develop Authority (NYSERDA)
(http://www.nyserda.org )
U.S. Department of Energy, Office of Energy Efficiency & Renewable Energy
(http://energy.gov/eere/office-energy-efficiency-renewable-energy)
U.S. Environmental Protection Agency (EPA) (http://www3.epa.gov/ )
Increasing Energy Efficiency in Urban Water Supply March 2016
GEI Consultants, Inc. 4
Water Research Foundation (WRF) (http://www.waterrf.org/Pages/Index3.aspx )
1.1.2 Urban Water Supplier Survey
The project team sought to compile a comprehensive list of qualified prospective respondents
for the survey. Specifically, the team looked to target urban water utility professionals who
would be adequately informed about the system’s energy-related costs, and have an interest
in increasing system efficiency. These individuals would likely be in upper management
roles in the Operations department of the utility, but may also hold positions including the
following, depending on the size of the system:
General Manager
Engineer
Distribution System Manager
Water Loss Control Supervisor
Maintenance Supervisor
Environmental Services Manager
Water Conservation Manager
Starting with the list of the Alliance for Water Efficiency’s 219 member water utilities,
contact information was requested for the right individuals to respond to the survey. The
project team also conducted research to compile a list of all the medium to large systems
throughout the U.S. to capture the major water suppliers from each state and to ensure
geographic diversity. Where contact information was not available, the project team made
calls to each utility to request an appropriate contact to complete the survey, assembling a list
of 92 individuals. To this growing list of potential respondents, the project team added
approximately 2,800 utility managers and consultants working on utility distribution systems
and water loss control.3 These individuals manage plants and distribution infrastructure for
urban water systems or consult for water systems, and are therefore very interested in energy
efficiency investments that can optimize operations and reduce costs. Finally, the project
team worked with the AWWA California-Nevada Section to inform their membership of the
survey and encourage participation. Through this research, the project team assembled a
potential respondent pool of more than 3,000 utility managers or consultants from throughout
the U.S.
1.1.2.1 Survey Design
The project team put careful thought into designing a survey that would be user-friendly and
easy to complete within a short timeframe, despite the complexity of the data requested.
After evaluating available options, the team selected Survey Monkey® as the platform in
which to build the survey. Survey Monkey® allowed the team easy assembly and revisions,
3 Contact information for these individuals was obtained from a previously purchased list.
Increasing Energy Efficiency in Urban Water Supply March 2016
GEI Consultants, Inc. 5
and presented the survey in an attractive and inviting format that does not intimidate the
respondent. Survey Monkey® also allows for various analytical methods to process results
and present insights.
The survey was also deliberately designed into three distinct sections (General Agency,
Water, and Energy) to guide the respondent, with three to five questions per page. Once
assembled, the survey was reviewed in preview mode by the full project team and amended
several times to enhance the user experience and to ensure that responses would enable the
analysis needed.
1.1.3 Assessing Energy Efficiency Potential
The assessment of energy efficiency potential is a quantitative analysis of the amount of
energy savings that may exist, is cost–effective, or could be realized by implementing energy
efficiency policies and programs in a state, sector, or region. Energy efficiency potential
studies can be an effective tool for building the policy case for energy efficiency, evaluating
efficiency as an alternative to supply side resources, and formulating detailed program design
plans. For this study, determining the potential for advancing energy efficiency among the
urban water supply sector is specifically needed to determine beneficial investments and
potential funding mechanisms for these improvements.
The approach used by the study team included the following steps:
1. Extract known information regarding electrical usage of urban water suppliers
collected during the review of available literature, interviews with NEMA Working
Group Members4, and the Survey of Urban Water Suppliers.
2. Using available rate information and water usage data, the study team computed the
average water cost for the largest 50 cities.
3. From data developed in steps 1 and 2, determined a reasonable average cost for
overall water service and compared that to energy savings from the example systems
to identify the most promising locations and measures.
4. Considering information obtained through water supplier survey responses and other
case studies, determined the cost effectiveness and energy savings potential.
1.1.4 Evaluating the Viability of Energy Service Companies in the
Water Utility Sector
Energy service companies (ESCOs) are an existing market mechanism to deliver increased
energy savings within various market segments, most popularly used in the building
4 The NEMA Working Group consisted of a subset of NEMA members that develop equipment used by the
water sector.

Increasing Energy Efficiency in Urban Water Supply March 2016
GEI Consultants, Inc. 6
management sector. ESCOs can be a fruitful means of promoting adoption of advanced
electricity technologies among water utilities. This study sought information regarding and
assessed the viability of ESCOs, and to the extent possible, other financing mechanisms and
government grants to finance modernization upgrades. Although some NEMA member
companies offer ESCO type services to water utilities, little information is available on
specific outcomes associated with the application of these mechanisms to urban water supply
systems.5 Rather, the study team looked to how these contract practices have performed in
other markets to gauge the potential opportunities for expansions in this market. In addition,
the team assessed the unique organizational structures of water utilities that may have
impeded the ESCO market in this sector. From this information, input from NEMA Working
Group Members, and Water Utility Survey results, the study team assessed the viability of
ESCOs to achieve modernization upgrades in urban water supply systems, and provided
recommendations on possible actions NEMA may want to consider to capitalize on this
opportunity.
5 We are aware of several firms, including NEMA members Itron and Siemens, providing energy service
performance contracts to water suppliers; however, the ESCO industry generally serves the building management sector, as discussed below. The National Association of Energy Service Companies (NAESCO) has over three dozen members.

Increasing Energy Efficiency in Urban Water Supply March 2016
GEI Consultants, Inc. 7
2. Urban Water Supply Systems
In 2010, the water use in the United States was estimated at approximately 355 billion
gallons of water a day. This demand is the lowest level since before 1970 and 13 percent
below 2005 levels based on analyses conducted by the U.S. Geological Service (USGS).6
Sources of this supply are both surface and groundwater, including saline water resources.
Figure 1 Water Withdrawals to Meet US Demand. Source- USGS 2014.
Twelve percent of this total use, or 42 billion gallons per day (47.1 million acre-feet per year
[AFY]), is provided by water suppliers to nearly 300 million people. In 2014, the U.S. EPA
reported that 93 percent of U.S. residents are served by community water systems (CWS),
the remaining seven percent are small private systems. Of the more than 51,000 CWS that
exist today, the large and very large systems provide drinking water to 82 percent of the
country’s population.7 To ensure that this water meets standards for safe clean drinking
water, the U.S. EPA conservatively estimates that over the next 20 years more than $380
billion will need to be invested in US water systems.8 Others, such as AWWA, project this
amount to be much higher.
6 Maupin, M.A., et al. (2014) Estimated Use of Water in the United States in 2010: U.S. Geological Survey,
Maupin, M.A., Kenny, J.F., Hutson, S.S., Lovelace, J.K., Barber, N.L., and Linsey, K.S., Circular 1405, 56 p., http://dx.doi.org/10.3133/cir1405. 7 U.S. EPA (2015) National Water Program Best Practices and End of Year Performance Report, Fiscal Year
2014, published June 2015. 8 U.S. EPA (2013) Drinking Water Infrastructure Needs Survey and Assessment –Fifth Report.

Increasing Energy Efficiency in Urban Water Supply March 2016
GEI Consultants, Inc. 8
Table 1 Size Categories of Community Water Systems
9
The infrastructure needed to develop, collect, treat, and deliver our water supplies includes
reservoirs, pipes, storage tanks, treatment plants, pumping facilities, meters, sensors,
electrical controls, buildings, and a variety of devices. Water systems vary in terms of design,
size, treatment approach, and distribution for a variety of reasons. Two primary conditions
dictate a water systems design - the quality and location of the source water, and the
geographic conditions in which the system must operate. During the literature review, many
diagrams and schematics depicting water supply systems were found. Figure 2 shows just
two examples: the Kenneth B. Rollins Water Treatment Plant in the City of Leesburg,
Virginia10
and the Hutchinson Water Plant in Minnesota.11
These examples show major
elements of the water supply systems, but only on a general level.
This literature review revealed a significant data gap regarding specific information sought
through this project: 1) urban water supply systems and subsystems (Goal 1a) sufficient to
estimate electrical needs of components, and 2) energy consumption information, age and
efficiency of discrete components and details sufficient to estimate energy reduction potential
(Goal 1d). Even though case studies were identified, these did not provide adequate
inventories of system components or analytical detail to estimate energy intensities of
individual or groups of components within the subsystems, including controls (extraction and
production, conveyance and delivery, and treatment).
9 Center for Sustainable Systems, University of Michigan (2015) “U.S. Water Supply and Distribution
Factsheet.” Pub. No. CSS05-17. October 2015. See http://css.snre.umich.edu/css_doc/CSS05-17.pdf 10
See http://www.leesburgva.gov/government/departments/utilities-water-sewer/about-us/water-supply/water-supply-operations#WaterSystem 11
http://www.health.state.mn.us/divs/eh/water/com/waterline/waterline_spring2007.pdf

Increasing Energy Efficiency in Urban Water Supply March 2016
GEI Consultants, Inc. 9
Kenneth B. Rollins Water Treatment Plant
Hutchinson Water Plant
Figure 2 Example Urban Water Supply System
Despite the lack of details, it is important to recognize that urban water supply systems are
not the same. Each system is designed and operated to meet the requirements of its
community and geography. It is also important to note that the primary responsibility of
Increasing Energy Efficiency in Urban Water Supply March 2016
GEI Consultants, Inc. 10
water suppliers is to produce and deliver water; energy efficiency is subordinate to this
priority. As a result, any effort to improve energy efficiency must not compromise water
quality or reliability. Opportunities for enhancements and improvements are also based on
local priorities, system conditions, available resources, and level of flexibility within a
system.
What is the same among urban water systems is the types of equipment relied upon to move
and treat water – pumps, motors, meters, controls, and other energy consuming devices. In
addition, buildings used by these water suppliers for administration services and system
operation have similar energy consuming equipment as other office and service buildings. It
is the nature of this equipment that affords these suppliers the opportunities to collectively
improve the energy efficiency of their systems, and what provides NEMA the opportunity to
support such improvements. Using an approach that focused on these common elements, the
Electric Power Research Institute (EPRI) developed a “typical” treatment system to estimate
the distribution of energy use in these systems. According to its study, EPRI estimated that
between 55 - 90 percent of overall electricity use by water supply systems is associated with
pumping.12
The EPRI team then developed energy use intensity values (total kWh/day) for
different water supply processes, using several assumptions about how these processes
operated. In communities with significant elevation changes throughout their service area, or
where water supplies are conveyed over long distances, the electricity used for pumping can
be orders of magnitude higher than the average utility use.
In their 2013 study, EPRI and Water Research Foundation (WRF) estimated that U.S. public
drinking water systems used roughly 39.2 billion kWh per year, which corresponds to about
one percent of total electricity use in the country. Even when taking into account the
emphasis on energy efficiency over the last several decades, this demand represents a 39
percent increase from 1996 where demand was approximately 28.3 billion kWh/yr. Thus,
these utilities represent clear opportunities for energy efficiency improvement and
investment.
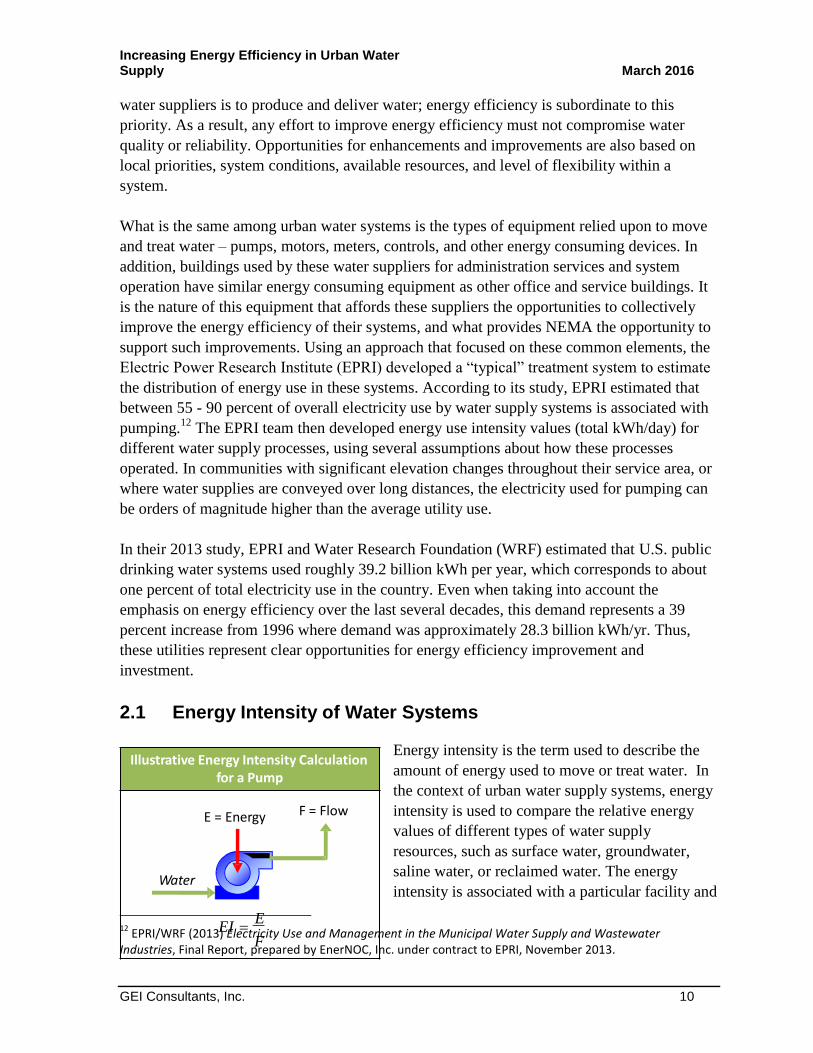
2.1 Energy Intensity of Water Systems
Energy intensity is the term used to describe the
amount of energy used to move or treat water. In
the context of urban water supply systems, energy
intensity is used to compare the relative energy
values of different types of water supply
resources, such as surface water, groundwater,
saline water, or reclaimed water. The energy
intensity is associated with a particular facility and
12
EPRI/WRF (2013) Electricity Use and Management in the Municipal Water Supply and Wastewater Industries, Final Report, prepared by EnerNOC, Inc. under contract to EPRI, November 2013.
Illustrative Energy Intensity Calculationfor a Pump
F = FlowE = Energy
Water
EI E
F
Increasing Energy Efficiency in Urban Water Supply March 2016
GEI Consultants, Inc. 11
is similar to a measure of efficiency. Energy efficiency is improved when a given level of
service is provided with reduced amounts of energy inputs - using less energy to produce a
product reduces the intensity.13
The energy intensities of individual facilities within a water
agency can be aggregated to represent the energy intensity of water supply.
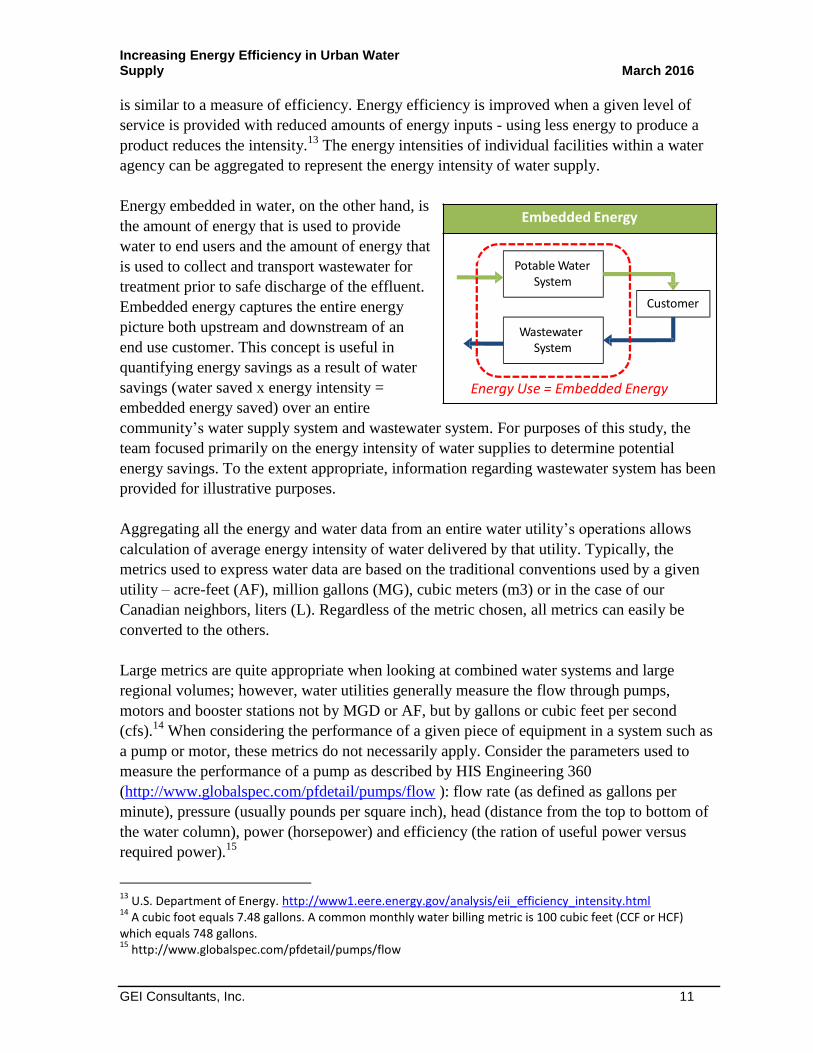
Energy embedded in water, on the other hand, is
the amount of energy that is used to provide
water to end users and the amount of energy that
is used to collect and transport wastewater for
treatment prior to safe discharge of the effluent.
Embedded energy captures the entire energy
picture both upstream and downstream of an
end use customer. This concept is useful in
quantifying energy savings as a result of water
savings (water saved x energy intensity =
embedded energy saved) over an entire
community’s water supply system and wastewater system. For purposes of this study, the
team focused primarily on the energy intensity of water supplies to determine potential
energy savings. To the extent appropriate, information regarding wastewater system has been
provided for illustrative purposes.
Aggregating all the energy and water data from an entire water utility’s operations allows
calculation of average energy intensity of water delivered by that utility. Typically, the
metrics used to express water data are based on the traditional conventions used by a given
utility – acre-feet (AF), million gallons (MG), cubic meters (m3) or in the case of our
Canadian neighbors, liters (L). Regardless of the metric chosen, all metrics can easily be
converted to the others.
Large metrics are quite appropriate when looking at combined water systems and large
regional volumes; however, water utilities generally measure the flow through pumps,
motors and booster stations not by MGD or AF, but by gallons or cubic feet per second
(cfs).14
When considering the performance of a given piece of equipment in a system such as
a pump or motor, these metrics do not necessarily apply. Consider the parameters used to
measure the performance of a pump as described by HIS Engineering 360
(http://www.globalspec.com/pfdetail/pumps/flow ): flow rate (as defined as gallons per
minute), pressure (usually pounds per square inch), head (distance from the top to bottom of
the water column), power (horsepower) and efficiency (the ration of useful power versus
required power).15
13
U.S. Department of Energy. http://www1.eere.energy.gov/analysis/eii_efficiency_intensity.html 14
A cubic foot equals 7.48 gallons. A common monthly water billing metric is 100 cubic feet (CCF or HCF) which equals 748 gallons. 15
http://www.globalspec.com/pfdetail/pumps/flow
Embedded Energy
WastewaterSystem
Customer
Potable WaterSystem
Energy Use = Embedded Energy
Increasing Energy Efficiency in Urban Water Supply March 2016
GEI Consultants, Inc. 12
When the electricity-related metric is added, the relationship is expressed as either kilowatt
hours per million gallons (kWh/MG) or kilowatt hours per acre foot (kWh/AF).16
Frequently,
a duration metric is also included such as MG per day (MGD) or AF per year (AFY). All
energy consuming devices used in by a utility to provide services can be included:
production, treatment and delivery of water to the end user, as well as lighting, air
conditioning, security systems, meters and other controls. Most U.S. survey respondents
reported using MGD as their primary metric, the remainder reported in AFY.
In its 2013 California Water Plan Update, the Department of Water Resources (DWR)
showed how much this energy intensity can vary depending on water source, geography,
system design and end use (see Figure 3). DWR assessed the intensity of each region in the
state finding it ranged from near zero to as much as 2,000 kWh/AF.17
Energy demands
associated with water treatment varied considerably based on the treatment technologies used
and the quality of the incoming water supplies; whereas demands associated with water
delivery varied based on distance traveled and geography. Treatment alone can add energy
demands between 50 and 650 kilowatt-hours per acre-foot (kWh/AF) of water over demands
associated with delivery.18
16
Since the focus of this study was electric products, metrics typical used in reference to natural gas products, such as BTUs, were not considered. 17
DWR’s water energy nexus pages: http://www.water.ca.gov/climatechange/RegionalEnergyIntensity_test.cfm 18
http://www.water.ca.gov/climatechange/RegionalEnergyIntensity_test.cfm
Increasing Energy Efficiency in Urban Water Supply March 2016
GEI Consultants, Inc. 13
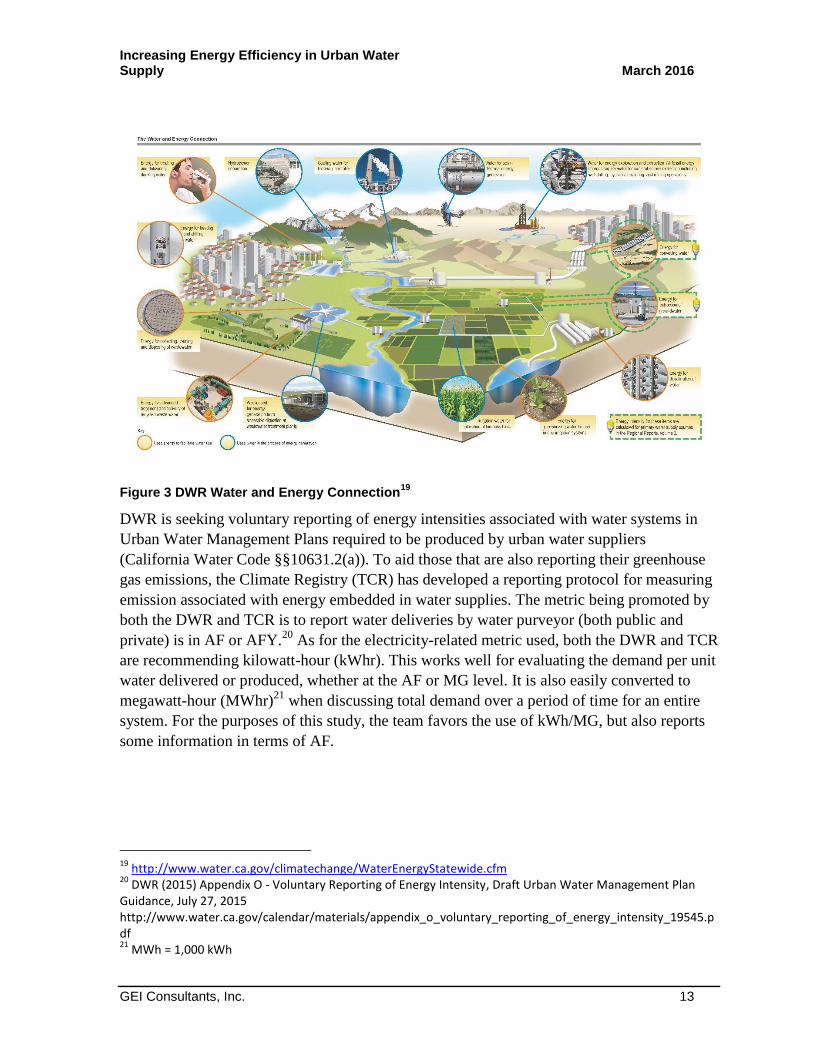
Figure 3 DWR Water and Energy Connection
19
DWR is seeking voluntary reporting of energy intensities associated with water systems in
Urban Water Management Plans required to be produced by urban water suppliers
(California Water Code §§10631.2(a)). To aid those that are also reporting their greenhouse
gas emissions, the Climate Registry (TCR) has developed a reporting protocol for measuring
emission associated with energy embedded in water supplies. The metric being promoted by
both the DWR and TCR is to report water deliveries by water purveyor (both public and
private) is in AF or AFY.20
As for the electricity-related metric used, both the DWR and TCR
are recommending kilowatt-hour (kWhr). This works well for evaluating the demand per unit
water delivered or produced, whether at the AF or MG level. It is also easily converted to
megawatt-hour (MWhr)21
when discussing total demand over a period of time for an entire
system. For the purposes of this study, the team favors the use of kWh/MG, but also reports
some information in terms of AF.
19
http://www.water.ca.gov/climatechange/WaterEnergyStatewide.cfm 20
DWR (2015) Appendix O - Voluntary Reporting of Energy Intensity, Draft Urban Water Management Plan Guidance, July 27, 2015 http://www.water.ca.gov/calendar/materials/appendix_o_voluntary_reporting_of_energy_intensity_19545.pdf 21
MWh = 1,000 kWh

Increasing Energy Efficiency in Urban Water Supply March 2016
GEI Consultants, Inc. 14
2.2 Best Energy Management Practices for Water Systems
Managing the energy demands of water systems is one of the most controllable operating
costs incurred by these utilities. The U.S. EPA has identified and is implementing its best
practices to improve water systems throughout the country. They define a best practice “as a
process or methodology that consistently produces superior or innovative results.” These
best practices include:
Using the Performance Based Training (PBT) approach, U.S. EPA is training water
treatment plant operators to address programmatic drinking water resiliency rather
than just technical water optimization.
To improve the performance of their grant program, U.S. EPA’s Region 3 is working
with other regional offices through one-on-one assistance and training to share
expertise on grants-related issues and processes.
Several documents have been prepared and published that seek to assist the water sector to
better manage their energy use and control associated costs. U.S. EPA22
uses a Plan-Do-
Check-Act approach that includes:
1. Benchmarking and tracking monthly and annual energy use.
2. Identifying and prioritizing energy operations and issues that can increase efficiency.
3. Identifying energy efficiency objectives and targets.
4. Defining the performance indicator(s) to use to measure progress towards your energy
targets.
5. Establishing energy management programs (i.e., action plans to meet your goals).
6. Monitoring and measuring the performance of your established target(s).
7. Documenting and communicating success.
8. Reviewing your progress periodically and making adjustments as necessary.
U.S. EPA has created a guidebook, supported by various tools it recommends using,
including Portfolio Manager, EPA Performance Track and Cash Flow Opportunity
Calculator, all of which are publicly available on its website. Water purveyors can also find
tools through the U.S. EPA’s ENERGY STAR program which are likewise designed to help
them lower the costs associated with assessing beneficial investments for energy efficiency
improvements. These tools include guidelines for energy management, benchmarking
resources, and resources to help measure and track progress. The Energy and Environment
Guide to Action: State Policies and Best Practices for Advancing Energy Efficiency,
Renewable Energy, and Combined Heat and Power (2015 Edition) provides in-depth
22
U.S. EPA (2008) Ensuring a sustainable Future: An Energy Management Guidebook for Wastewater and Water Utilities. Publication EPA 832-R-08-002. January 2008.
Increasing Energy Efficiency in Urban Water Supply March 2016
GEI Consultants, Inc. 15
information about over a dozen policies and programs that States are using to meet their
energy, environmental, and economic objectives.23
The New York State Energy Research and Development Authority (NYSERDA) has focused
a great deal of support on improvements for water and wastewater systems because this
sector reportedly consumes more than 3 billion kilowatts of electricity per year. 24
Priority
areas of action for NYSERDA include:
Working closely with the consulting engineering firms to promote innovative and
energy-efficient technologies in New York.
Helping municipalities address regulatory pressures to decrease nutrients in
wastewater.
Developing innovative ways to disinfect water.
Optimizing performance to improve efficiency and increase water-and wastewater-
treatment capacity.
NYSERDA has conducted several case studies and from these has developed a variety of
tools and materials offered through its Municipal Water and Wastewater Program to assist
operators and municipal officials with understanding energy efficiency. 25
In collaboration
with WRF, NYSERDA prepared the Efficiency Best Practices for North American Drinking
Water Utilities which exhaustively discuss energy efficiency best practices in several areas
critical to water systems and lists actions that can be taken in each of these areas.26
With pumping representing the largest percentage of energy demand for water systems, EPRI
in collaboration with WRF examined cases that showed significant savings opportunities of
as much as 30 percent.27
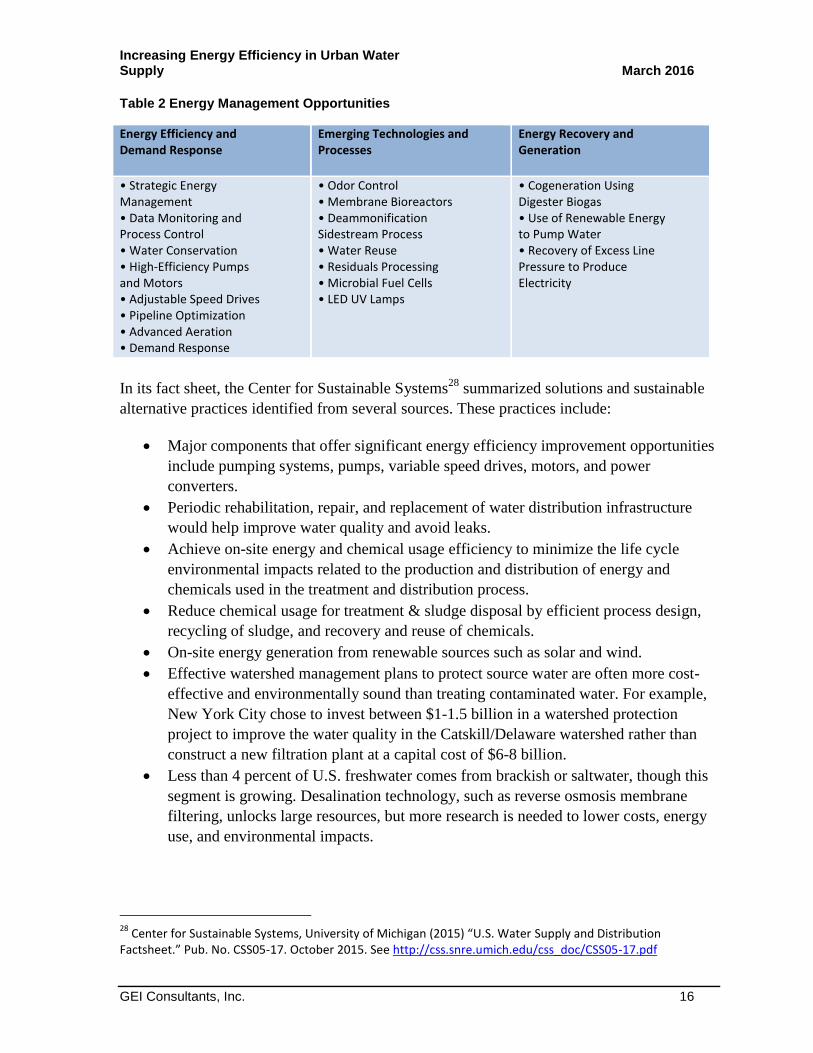
As part of the EPRI/WRF study, several energy management
opportunities were listed that the EPRI team determined to provide significant energy savings
potential, including several for electro-technologies as seen in Table 2.
23
http://www3.epa.gov/statelocalclimate/documents/pdf/guide_action_full.pdf (downloaded February 9, 2016) http://www3.epa.gov/statelocalclimate/documents/pdf/guide_action_chapter3.pdf http://www3.epa.gov/statelocalclimate/documents/pdf/GTA_Chapter_4.2_508.pdf 24
http://www.nyserda.ny.gov/Communities-and-Governments/Communities/Municipal-Water-and-Wastewater 25
http://www.nyserda.ny.gov/Communities-and-Governments/Communities/Municipal-Water-and-Wastewater/MWWT-Tools-and-Materials 26
Leiby, Vanessa and Michael Burke (2011) Energy Efficiency Best Practices for North American Drinking Water Utilities, Water Research Foundation and New York State Energy Research and Development Authority, ISBN 978-1-60573-159-9, 2011. 27
WRF (2010) Energy Efficiency in the Water Industry: a Compendium of Best Practices and Case Studies. Web Report #4270. Prepared for the UK Water Industry Research Limited. 2010.
Increasing Energy Efficiency in Urban Water Supply March 2016
GEI Consultants, Inc. 16
Table 2 Energy Management Opportunities
Energy Efficiency and Demand Response
Emerging Technologies and Processes
Energy Recovery and Generation
• Strategic Energy Management • Data Monitoring and Process Control • Water Conservation • High-Efficiency Pumps and Motors • Adjustable Speed Drives • Pipeline Optimization • Advanced Aeration • Demand Response
• Odor Control • Membrane Bioreactors • Deammonification Sidestream Process • Water Reuse • Residuals Processing • Microbial Fuel Cells • LED UV Lamps
• Cogeneration Using Digester Biogas • Use of Renewable Energy to Pump Water • Recovery of Excess Line Pressure to Produce Electricity
In its fact sheet, the Center for Sustainable Systems28
summarized solutions and sustainable
alternative practices identified from several sources. These practices include:
Major components that offer significant energy efficiency improvement opportunities
include pumping systems, pumps, variable speed drives, motors, and power
converters.
Periodic rehabilitation, repair, and replacement of water distribution infrastructure
would help improve water quality and avoid leaks.
Achieve on-site energy and chemical usage efficiency to minimize the life cycle
environmental impacts related to the production and distribution of energy and
chemicals used in the treatment and distribution process.
Reduce chemical usage for treatment & sludge disposal by efficient process design,
recycling of sludge, and recovery and reuse of chemicals.
On-site energy generation from renewable sources such as solar and wind.
Effective watershed management plans to protect source water are often more cost-
effective and environmentally sound than treating contaminated water. For example,
New York City chose to invest between $1-1.5 billion in a watershed protection
project to improve the water quality in the Catskill/Delaware watershed rather than
construct a new filtration plant at a capital cost of $6-8 billion.
Less than 4 percent of U.S. freshwater comes from brackish or saltwater, though this
segment is growing. Desalination technology, such as reverse osmosis membrane
filtering, unlocks large resources, but more research is needed to lower costs, energy
use, and environmental impacts.
28
Center for Sustainable Systems, University of Michigan (2015) “U.S. Water Supply and Distribution Factsheet.” Pub. No. CSS05-17. October 2015. See http://css.snre.umich.edu/css_doc/CSS05-17.pdf

Increasing Energy Efficiency in Urban Water Supply March 2016
GEI Consultants, Inc. 17
Other viable strategies can include using process waste heat, excess system pressure or
biowaste products to generate onsite electricity. This opportunity may be particularly
attractive for combined water/wastewater utilities. Another option emerging with the
decentralization of electricity grid management is to use the ability to store and release water
and to manage pump load levels and timing to provide energy storage to the grid. This
service will become more valuable as the amount of
residential and on-site renewable power which requires
smoothing of power output increases on the local network.
Many of the reports produced by U.S. DOE have contributed
to the development of their strategic pillars regarding the
Water-Energy Climate Nexus29
:
Optimize the freshwater efficiency of energy
production, electricity generation, and end use
systems
Optimize the energy efficiency of water management,
treatment, distribution, and end use systems
Enhance the reliability and resilience of energy and
water systems
Increase safe and productive use of nontraditional water sources
Promote responsible energy operations with respect to water quality, ecosystem, and
seismic impacts
Exploit productive synergies among water and energy systems
According to the 2014 report, the decision-making landscape is characterized by market
drivers and institutional factors:
Market Drivers
• Water prices and development costs
• Fuel prices and operational costs
• Financial Incentives & funding
mechanisms
Institutional Factors
• Water rights and quality
• Regulatory requirements and mandates
• Increasing demands
• System conditions (including age)
To address these and many other issues examined in this report, U.S. DOE recommended
several steps; some are noted here that should be of interest to NEMA because of their ability
to participate in these activities and have an influence on their success.
Pursue R&D priorities in technology and modeling.
Develop in-depth roadmaps and/or technical specifications.
29
U.S. DOE. 2014 – The Water-Energy Nexus: Challenges and Opportunities, June 2014. Downloaded from http://energy.gov/sites/prod/files/2014/07/f17/Water%20Energy%20Nexus%20Full%20Report%20July%202014.pdf. See also Bauer, Diane. 2014. “Water-Energy Nexus: Challenges and Opportunities” Water-Energy Tech Team, Office of Energy Policy and Systems Analysis, U.S. Department of Energy, September 5, 2014.

Increasing Energy Efficiency in Urban Water Supply March 2016
GEI Consultants, Inc. 18
Develop systems analyses that bridge between policy and technology opportunity.
Incorporate regionality into identification of needs and delivery of tools and
resources.
Pursue productive collaborative relationships across the federal government, states,
local entities, tribes, the private sector, etc.
2.3 Available Funding
After labor, energy is the highest operating cost for water and wastewater service providers.30
The study team primarily investigated current estimates for investment needs and available
funding for water supply, but also found information regarding wastewater infrastructure that
we chose to include. Most of this information was collected from reports and technical
papers developed by the EPA and ASCE and compiled into a database. The team also
included information on the major funding programs that exist to support projects that would
address these needs. Funding opportunities were compiled based on information available
from state, federal, and local government websites and press releases as of the end of 2015.
Additional information on available funding specifically available for water and wastewater
utilities can also be found at EPA's Water Infrastructure and Resiliency Finance Center
located at: http://www.epa.gov/waterfinancecenter.
Commonly identified funding resources used by urban water utilities to finance infrastructure
projects include:
Financial incentives – rebates, performance based funds.
Loan programs – revolving loans, energy performance contracts.
Bonds – municipal, tax exempt, and green.
Utility Operating Funds derived from Rates Revenues.
Reviewing this information clearly shows the gap between investment needs and available
funding resources. It is estimated that more than $600 billion dollars is needed over the next
20 years to bring America’s drinking water and wastewater systems simply to address current
issues with these systems. In July 2014, the Obama Administration launched “Build
American Investment Initiative” to find new ways to increase investment in American’s
infrastructure, including water supply systems.31
Through this initiative, the administration
intends to facilitate partnerships between federal, state, local agencies and the private sector.
In addition, the Water Infrastructure and Resiliency Finance Center32
was launched at the
30
WRF (2011) Energy Efficiency in the Water Industry: A Compendium of Best Practices and Case Studies, Published by WRF for Global Water Research Coalition, Web Report #4270. March 2011. 31
“FACT SHEET: Increasing Investment in U.S. Roads, Ports and Drinking Water Systems through Innovative Financing”, The White House Press Release dated January 16, 2015. Downloaded February 2016: https://www.whitehouse.gov/the-press-office/2015/01/16/fact-sheet-increasing-investment-us-roads-ports-and-drinking-water-syste 32
http://www.epa.gov/waterfinancecenter
Increasing Energy Efficiency in Urban Water Supply March 2016
GEI Consultants, Inc. 19
U.S. EPA. Using federal grants to attract private capital, this center is promoting public
private partnerships to support more effective investments in water systems and water quality
improvements. Ensuring that these investments do not simply build what existed before,
decision makers and investors need to understand technology advances that can move our
water infrastructure into the 21st century.
2.3.1 New Funding Opportunities
To bridge this gap, the federal government, private organizations, state agencies and utilities
(both energy and water) are seeking permanent fixes to our infrastructure funding problem.
Recent efforts have focused on innovative public-private partnerships, and creating new
opportunities for investors interested in building resiliency and adapting to climate change
(Green Bonds). For example, Southern California Edison (SCE) in collaboration with the
AWWA is offering at least $1 million in 2016 to water utilities in its service territory to
defray the cost of leak detection, leak repair, and other water system improvement projects.33
This program goes beyond traditional utility programs that tended to focus incentives on the
purchase of specific equipment or changing customer behavior. To encourage participation
and obtain needed information, SCE is hosting a series of technical workshops with AWWA
California Nevada Section to design the funding program. Depending on the results of
funded projects, SCE may be able to make more funding available in the future.
As mentioned earlier, NYSERDA has collaborated with several utilities to implement
projects to advance energy efficiency best practices at water and wastewater facilities. The
DWR implements a Water-Energy Grant Program to provide funds to implement water
efficiency programs or projects that reduce greenhouse gas emissions, and reduce water and
energy use.34
For 2016, this program has approximately $19 million to fund:
Commercial Water Efficiency or Institutional Water Efficiency Programs.
Projects that reduce greenhouse gas, reduce water and reduce energy use.
Only projects with water conservation measures that also save energy.
The funding for this program is appropriated from the Greenhouse Gas Reduction Fund to
the DWR to establish a grant program. AWWA is also exploring opportunities to leverage
U.S. EPA’s Clean Power Plan Rule to obtain infrastructure enhancement funding through
their Energy Initiative.35
For more discussion of available funding mechanisms, see Section 5
of this report.
33
CA-NV Section AWWA - SCE Funding for Water Utility Improvements Webinar, February 24, 2016. 34
http://www.water.ca.gov/waterenergygrant/index.cfm 35
Carpenter, Adam (2016) EPA’s Clean Power Plan Rule: A Catalyst for AWWA’s Energy Initiative, and what it means for the water sector, Presentation by Adam T. Carpenter, CA-NV Section AWWA, February 24, 2016.

Increasing Energy Efficiency in Urban Water Supply March 2016
GEI Consultants, Inc. 20
3. Urban Water System Efficiency Survey
The project team’s approach to the development and implementation of the urban water
supplier survey relied on input from NEMA members, AWWA leadership, and initial
findings associated with the literature review. The survey sought direct input from water
supplier representatives about the status of their systems, system operations and energy
usage, history of energy efficiency efforts and the level of interest in energy efficiency.
Information derived from this survey was subsequently used in gauging the possible national
energy savings that could be obtained by advancing the use of energy efficient equipment
and controls.
3.1 Advance Survey Preparation
Prior to preparing the survey questions, the project team sought input from the NEMA
Working Group through targeted interviews. These interviews assisted the project team to
understand information and resources the manufactures have regarding the known level of
technology market penetration, customer adoption issues, level of interaction between the
manufacturers and the ultimate user of their products, what studies they have already
conducted, and what known barriers they are working to overcome in the water sector.
In addition, the project team also conducted outreach with AWWA representatives promoting
new programs, including: credentialing programs; training and educations; outreach and
communications; improving website and engaging more members to identify needed
services; and programs of its members. Members of the team participated in an annual
conference to identify partnering opportunities, level of interest in energy efficiency, and
mechanisms available to facilitate increased interactions between NEMA members and end
use customers.
3.1.1 Input for Survey Development
3.1.1.1 NEMA Working Group
NEMA and the Hydraulic Institute have worked closely with regulators and
manufacturers on efficiency standards related to a variety of equipment used by the
water sector.
Some NEMA members find it difficult to market to the water sector because even if
the operator knows the manufacturer or pump is an efficient product, the process of
purchase decisions must still go to bid, be subject to cost comparisons, and be
evaluated against other factors.

Increasing Energy Efficiency in Urban Water Supply March 2016
GEI Consultants, Inc. 21
Customers do not always obtain expected savings of retrofitted systems because new
devices are not properly integrated into the existing system through recommended
retooling and calibration of the components together.
Focus groups, communication and outreach, technology demonstrations, public
private collaboratives, and utility networking activities provide opportunities to
overcome the challenge with the current mind set regarding performance, and offers
an opportunity for educating consumers about how best to obtain efficient product
performance.
Some NEMA members interviewed are advocating a “systems” approach with their
customers that captures the duty cycle, establishes a baseline for loss, and then
implements ways to reduce losses. By considering the full train, including motor,
drive, and pump, the system can be properly synced and tuned together, producing
more efficiency than achieved by only looking at the efficiency of individual
components within a system.
The current market structure poses challenges to advancing system energy efficiency.
For example, some NEMA members make parts for other manufacturers or original
equipment manufacturers (OEM). Rarely do the component manufacturers ever
interact directly with an end use customer. In addition, these OEMs -- those that make
equipment from component parts manufacturers -- tend to focus on lowest price, then
reliability and then lowest energy usage, in that priority order. In addition, water
utilities tend to work with consultants on system designs, modifications and
equipment decisions, rather than directly with manufacturers and OEMs.
Procurement mechanisms can result in significant time between decisions to initiate a
project with defined goals and the ultimate equipment purchasing decisions. If the
value engineering is not supported and re-enforced throughout the entire process,
which can take years, other factors (budgets, staff biases, project modifications) can
overwhelm efficiency goals.
User friendly, on-line tools need to be made available to allow operators and others to
explore various technologies and their application.
Training operators and other staff can build greater understanding of various
technologies and their use. These tools need to be technology focused, put in the
context of issues the operators are facing, and be brand agnostic.
Some advocate going beyond current marketing methods (trade shows, magazine ads,
vendor catalogues) to create a water forum that connects manufacturers with end
users or supporting studies and research that demonstrates technologies and advances.
Increasing Energy Efficiency in Urban Water Supply March 2016
GEI Consultants, Inc. 22
Others have held their own user events to address customer needs and experiences in
order to help them to achieve their production, financial, conservation, etc. goals.
Three NEMA members interviewed are providing ESCO services to water sector
clients with success.
Known barriers include cost of advanced energy efficient equipment, meters and
control systems, procurement processes.
Level of interaction among those interviewed varies from those that have no direct
contact with water utilities to those that have extensive and varied interactions such as
one-on-one meetings, participating in planning efforts and demonstration projects,
conducting research in collaboration with water utilities, and conducting technical
training.
Although some of the companies interviewed had performed studies or had done market
research, the study team was unable to obtain copies of associated reports for consideration
in this project as those reports were deemed proprietary.
AWWA Representatives
Early in this study, the study team engaged AWWA leadership directly about their efforts to
advance energy management and efficiency within the water sector, interest they may have in
engaging equipment manufacturers more fully, and the role that these manufacturers can play
in addressing challenges being faced by operators and decision-makers. During the course of
this study, the team continued to monitor and engage AWWA on their efforts and to the
extent possible, include that information in this report.
Those contacted stated that the water suppliers have little interaction directly with product
manufacturers, confirming what NEMA representatives had stated. Rather, the water industry
tends to rely on consultants and distributors or vendors for product information. Exceptions
to this may be very large system operators such as the Metropolitan Water District of
Southern California, a large wholesaler serving 17 million residents in southern California.
With few exceptions, AWWA representatives have little direct interaction with manufactures
of products used in water systems and are not aware of any with NEMA representatives.36
According to the AWWA immediate Past-President, John Donahue, and CA-NV Section
Executive Director, Tim Worley, greater involvement by NEMA would be welcomed.37
Information on performance and possible applications of different technologies within water
systems is welcomed directly from manufacturers and would be especially beneficial when it
is put in the context of current issues being faced by water utilities and is brand neutral. This
36
Adam Carpenter, March 2016. 37
John Donahue and Tom Worley, November 2015.

Increasing Energy Efficiency in Urban Water Supply March 2016
GEI Consultants, Inc. 23
involvement will in turn provide direct feedback to manufacturers on challenges and issues
faced by this industry that they may be able to address. Areas where NEMA members can
contribute their knowledge and expertise are:
Participation in their Technical and Educational Program (i.e. development of training
materials and guidebooks.
Contributions of articles and technical papers to their publications.
Presenting results of demonstrations and research at conferences and through
webinars.
Involvement in their standards programs.
3.2 Urban Water Supplier Survey Instrument
In early January 2016, a survey was sent to more than 3,000 utility contacts throughout the
U.S. and 19 utility contacts in Canada. Responses were requested back by January 15 and
several electronic reminders were sent. The survey request was also forwarded to
representatives of AWWA seeking their assistance in promoting participation.
After January 15, when it was clear that survey responses were not coming in as expected,
follow-up emails and personal calls were made to attempt to increase the response rate. The
study team also conducted a raffle for those that participated in an effort to incentive
responses. General feedback from survey participants indicated that the energy data being
sought in the survey was largely not available to them, and thus the survey represented much
more of a research project for the respondents than is usual for a survey of this type. High
response rates to surveys generally occur when the surveys are short and simple, asking for
opinions or readily available information. This was not the case here. The information being
requested could only be obtained by the respondent seeking out multiple staff members in
different departments of the utility. We knew that this effort would certainly not be exerted
during the Thanksgiving to Christmas holiday season (and thus waited to issue the survey
until after the holidays).
When we still did not receive the response that was hoped for, additional follow-up calls
were made to urge participants to fill out the survey. In addition to the general contact
follow-up made to all 235 utilities, specific emails and calls were made to the following
utilities in an attempt to get them to respond and to discuss with them any concerns that they
had. These utilities were singled out because of their size, geographic location, relationship
to AWE, and perceived importance to the survey:
Completed After Targeted Outreach:
San Francisco Public Utilities Commission (CA)
Tampa Bay Water (FL)
City of Phoenix (AZ)
Increasing Energy Efficiency in Urban Water Supply March 2016
GEI Consultants, Inc. 24
City of Bozeman (MT)
Cobb County Water System (GA)
City of Plano (TX)
City of Elgin (IL)
Valencia Water Company (CA)
City of Bremerton (WA)
City of Sacramento (CA)
Not Completed After Targeted Outreach:
San Antonio Water System (TX)
Denver Water (CO)
Albuquerque (NM)
DC Water (DC)
Massachusetts Water Resources Authority (MA)
Town of Acton (MA)
In all, we received responses or partial responses from 65 utilities spread all across the
United States and Canada (see the map showing their locations in Figure 4). All sizes of
systems responded, from small systems of less than 1,000 connections to large utility systems
of half a million or more. Ultimately the study team was able to work with utilities across the
country to obtain 49 responses that were complete or nearly complete. In eight cases, the
respondent refused to give us their utility name, although they did fill out parts of the survey.
The summary of responses below tallies the number of number of responses to each question.

Increasing Energy Efficiency in Urban Water Supply March 2016
GEI Consultants, Inc. 25
Figure 4 Distribution of Survey Respondents
3.2.1 Respondents’ Informal Feedback
During the study team’s conversations with utilities, we received some informal feedback
from the respondents about the survey. This feedback from the respondents fell into the
following categories:
1. The information requested was detailed and not readily available in one place.
Anytime that a utility employee has to cross departments for information, the chances
of obtaining complete data dwindles appreciably. Utilities receive dozens of requests
for surveys every year from a wide variety of sources, and thus only the easiest to fill
out surveys get good responses rates. Those surveys that require significant research
across utility departments are often not responded to.
2. Many respondents did not have easy access to the requested information and were not
able to obtain it within the time frame provided. Many utilities are not regularly
paying attention to disaggregated energy data in their utility and are not compiling or
otherwise using energy information in any meaningful way for analysis, particularly
in small utilities with limited resources. Even where this data is collected, it is not
generally known throughout the utility where that information might be.
3. Many utilities are reluctant to release specific information for public viewing or for
attribution. This is generally an issue, not just for the eight utilities who refused to

Increasing Energy Efficiency in Urban Water Supply March 2016
GEI Consultants, Inc. 26
give us their name. Utilities are very sensitive about the amount of system
information that they release to unidentified sources. Although the Alliance for
Water Efficiency has a high degree of trust with its member utilities, there were still
numerous questions about the intent of the project and whether their utility’s
information would show up in public documents or on product sales call sheets.
Generally speaking, utilities are more comfortable in supplying data if they are
assured that their data are anonymized. While we promised this openly right from the
start, there was still skepticism.
4. The survey was too long and not all the questions could be answered easily in the
time provided. We received a number of comments that the survey asked for too
much information that required unbudgeted research time. To encourage a greater
response rate, we urged respondents to fill out as much of the survey as they could,
rather than not filling out the survey at all. Thus, a number of the energy questions
were answered by less than half of the respondents since it was too difficult for them
to expeditiously get the answers (see point #1 above).
3.2.2 Utility Survey Responses
Q1. Name of Utility. 65 utilities responded to this question. 8 utilities refused to give their
name and entered dummy values in this field.
Q2. Total Number of Service Connections. 65 utilities responded to this question. Size
ranges varied, from a low of 623 connections to a high of 870,000 connections. The majority
of the responses were from small to medium sized systems.
Q3. Population Served. 65 utilities responded to this question. Size ranges varied, from a
low of 1,336 to a high of 40 million. The majority of the responses were from small to
medium sized systems.
Q4. Unit of Measurement. 65 utilities responded to this question. 72 percent of the
systems use MGD; the rest largely use AFY or a combination of both. The Canadian utilities
used Cubic Meters or Megaliters.
Q5. Total Current Daily Capacity. 56 utilities responded to this question. Capacity
ranged from small systems (less than 1 MGD) to very large systems of 800 MGD or higher.
Q6. Type of Water System. 62 utilities responded to this question. 84 percent of the
respondents served municipal customers; only 3 percent served agricultural customers. 11
percent served both.
Q7. Water Production Data. 51 utilities responded to this question. 88 percent of the
respondents reported being able to readily supply annual metered water production data, 80
percent could provide it on a seasonal basis, 73 percent could provide monthly metered data.
Interestingly 43 percent of respondents have hourly metered data available.

Increasing Energy Efficiency in Urban Water Supply March 2016
GEI Consultants, Inc. 27
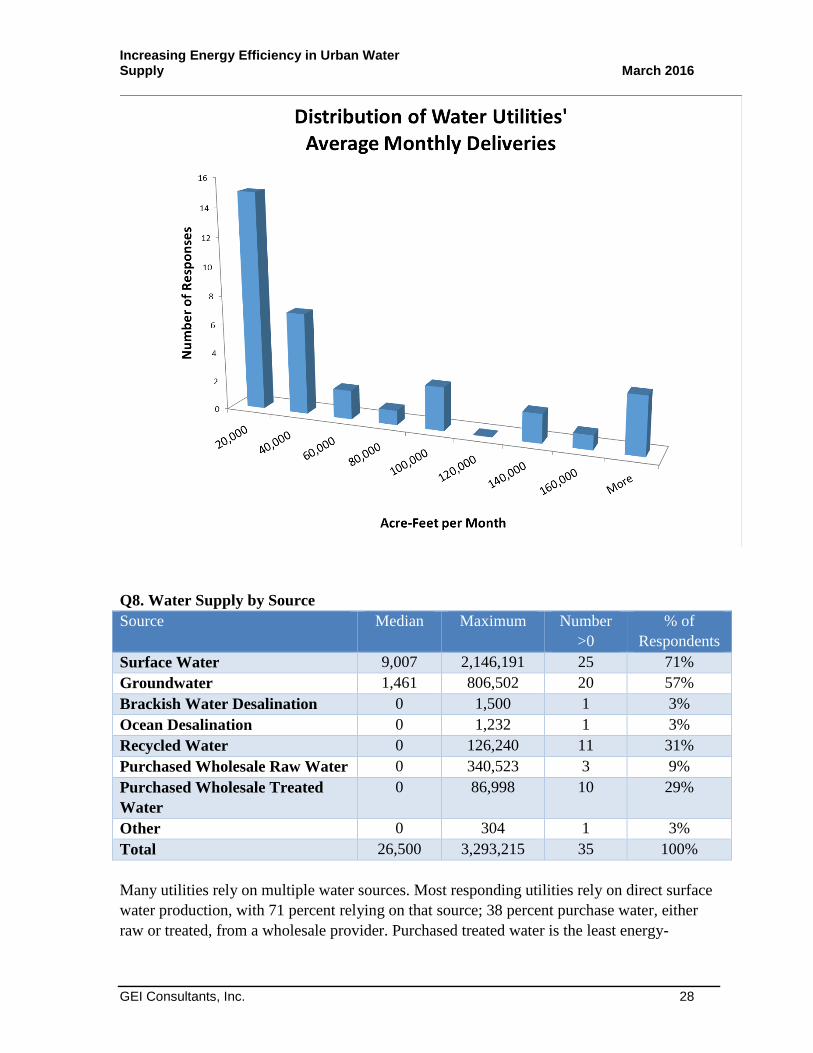
Q8. Total Annual Average Water Production Volume by Supply Source. 35 utilities
responded to this question. Most respondents have smaller utility systems, with 43 percent
delivering less than 20,000 acre-feet per year; however, the distribution is bi-modal, with
four of the responding utilities producing more than 160,000 acre-feet per year, with the
largest at 430,000 acre-feet.
Increasing Energy Efficiency in Urban Water Supply March 2016
GEI Consultants, Inc. 28
Q8. Water Supply by Source
Source Median Maximum Number
>0
% of
Respondents
Surface Water 9,007 2,146,191 25 71%
Groundwater 1,461 806,502 20 57%
Brackish Water Desalination 0 1,500 1 3%
Ocean Desalination 0 1,232 1 3%
Recycled Water 0 126,240 11 31%
Purchased Wholesale Raw Water 0 340,523 3 9%
Purchased Wholesale Treated
Water
0 86,998 10 29%
Other 0 304 1 3%
Total 26,500 3,293,215 35 100%
Many utilities rely on multiple water sources. Most responding utilities rely on direct surface
water production, with 71 percent relying on that source; 38 percent purchase water, either
raw or treated, from a wholesale provider. Purchased treated water is the least energy-

Increasing Energy Efficiency in Urban Water Supply March 2016
GEI Consultants, Inc. 29
intensive source as most of the pumping and processing is done by another party. Fifty-seven
percent use groundwater sources that require pumping before water treatment. Desalination is
energy intensive in water production, but only one utility each are using these sources;
however, 31 percent are relying on energy-intensive recycled water sources.
Q9. Highest monthly production for each of your supply sources in the past year? 33
utilities responded to this question.
The median peak monthly production is 27 percent above the annual average among
respondents. This indicates that the typical utility must maintain significant excess capacity;
the system capacity factor akin to that typically reported by electric utilities is 79 percent.
Note in some cases, the peak monthly production can be more than double the annual
average rate.
Q10. Does your utility maintain its own plants? 41 utilities responded to this question.
Nearly 83 percent of the respondents maintain their own water treatment plants.
Q11. Total Reservoir and Water Tank Storage. 41 utilities responded to this question
with their varying storage capacities. Responses were variable, ranging from a low of 1
million gallons to a high of 500 trillion acre-feet.

Increasing Energy Efficiency in Urban Water Supply March 2016
GEI Consultants, Inc. 30
Q12. Total Reservoir Storage Capacity Used for Seasonal Carryover or Conveyance
from an Outside Source (such as upstream or bulk storage). 41 utilities answered this
question, again with widely varying responses. 58 percent of the answers were zero value or
otherwise of no numerical response.
Q13. Age of the Bulk and Source Water Meters on Average across the System. 40
utilities answered this question. 30 percent of the meters are less than 10 years old; 25
percent of the meters are between 10 and 20 years old; 12.5 percent of the meters are
between 20 and 30 years old, and 2.5 percent are greater than 30 years old. 10 percent of the
respondents indicated that they did not know the age of their meters. Another 10 percent
responded that the meter age stretched across all age groups or that they were not metered at
all.
Q14. Age of the Wells, Pumps, Aerators, Boosters, Controls, etc. on Average across the
System. 40 utilities answered this question. 7.5 percent of the equipment is less than 10
years old; 37.5 percent is between t ad 20 years old; 27.5 percent is between 20 and 30 years
old, ad 17.5 percent is great than 30 years old. 7.5 percent of the respondents indicated that
they did not know the age of this equipment. One respondent said it varied across all of
those time periods.
Q15. How does your utility get its energy? 21 utilities answered this question.
Electricity is the dominant energy source for water utilities; however 48 percent used other
fuel sources. Four utilities get more than 10 percent of their energy from sources such as
natural gas for water pumps. Ten percent buy electricity from another water provider rather
than an electric utility.

Increasing Energy Efficiency in Urban Water Supply March 2016
GEI Consultants, Inc. 31
The median electricity use per acre-foot is 564 kWh or 1,731 kWh per MG. This is consistent
with the estimates for typical water-supply systems derived from the EPRI/WRF study.
Usage ranges from less than 100 kWh per AF or 300 kWh per MG on a gravity-fed system to
one system exceeding 1,500 kWh per AF or 4,600 kWh per MG.
Q16. Highest Monthly Use for Each Energy Option. 33 utilities responded to this
question. Electricity was the highest selected energy option (nearly 79 percent of the
respondents). 30 percent of the respondents reported natural gas, 27 percent diesel, and 21
percent biofuels. 42 percent did not know this information.
Q17. Who is the serving electric utility? Rather surprisingly, only 27 utilities responded to
this question, with two of the answers being false values rather than utility names.
Q18. What is your total annual expenditure for electricity to provide drinking water to
your customers? 33 utilities responded to this question, with responses ranging from a low
of $108,600 to a high of $21 million. 8 answers were false values or “I don’t know.”
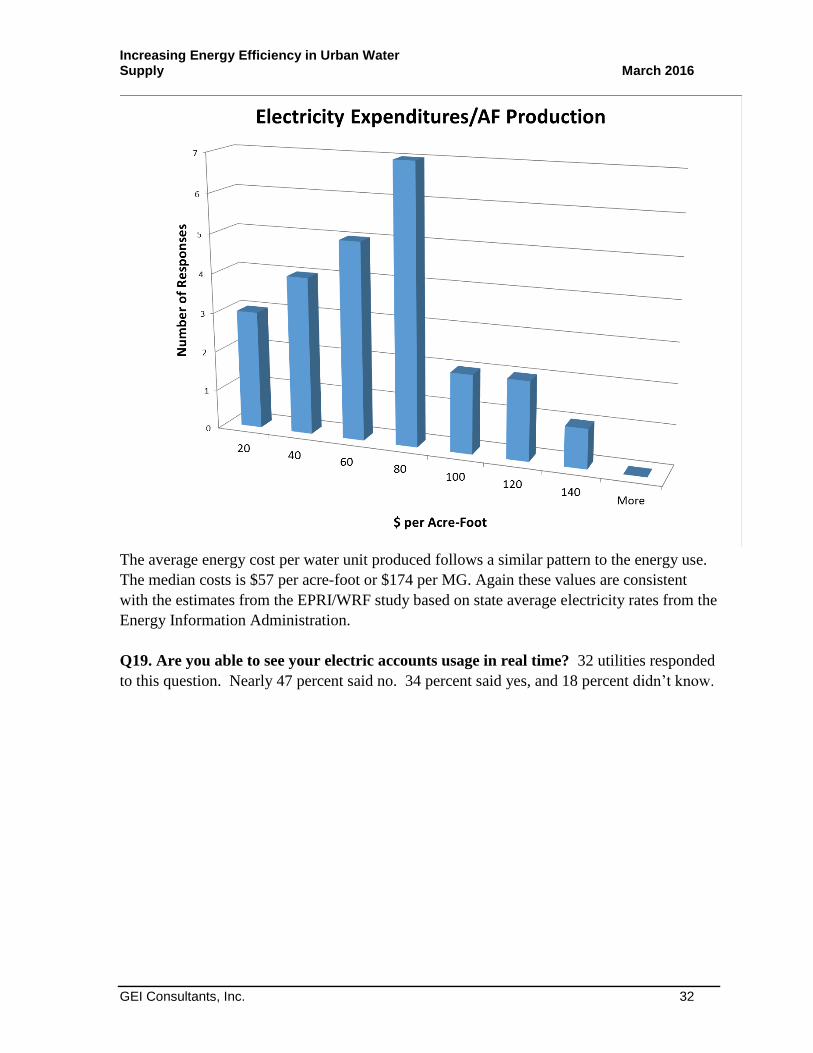
Increasing Energy Efficiency in Urban Water Supply March 2016
GEI Consultants, Inc. 32
The average energy cost per water unit produced follows a similar pattern to the energy use.
The median costs is $57 per acre-foot or $174 per MG. Again these values are consistent
with the estimates from the EPRI/WRF study based on state average electricity rates from the
Energy Information Administration.
Q19. Are you able to see your electric accounts usage in real time? 32 utilities responded
to this question. Nearly 47 percent said no. 34 percent said yes, and 18 percent didn’t know.
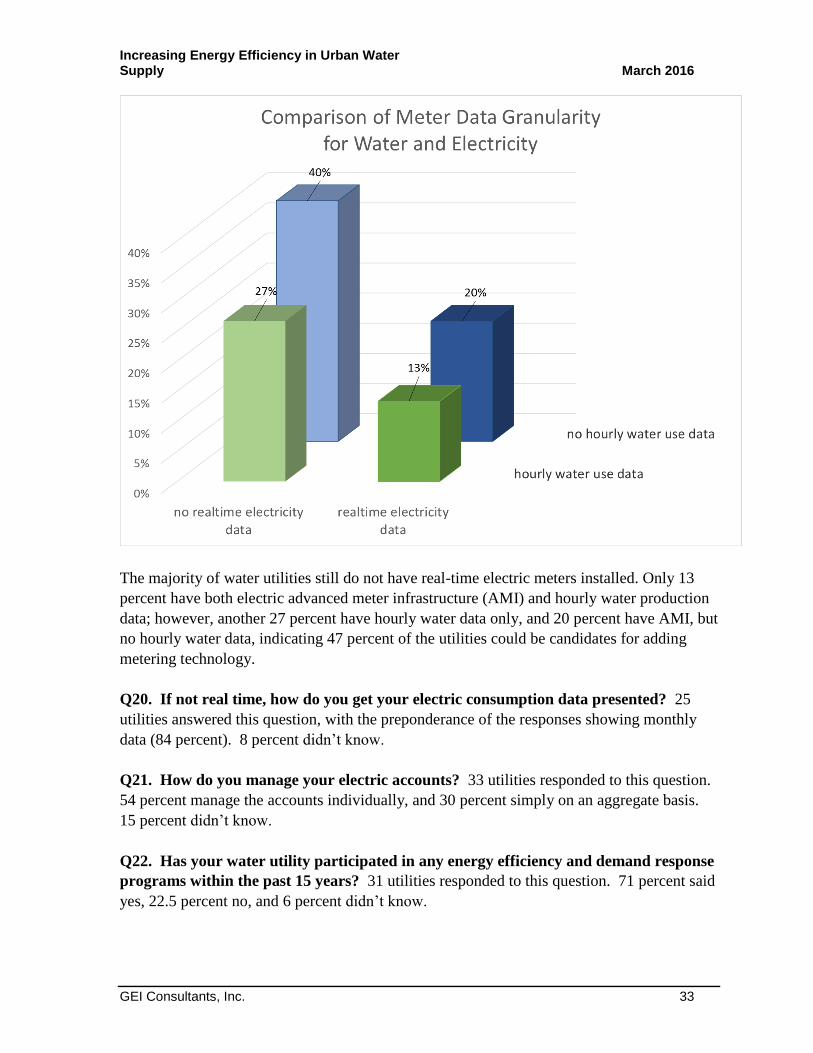
Increasing Energy Efficiency in Urban Water Supply March 2016
GEI Consultants, Inc. 33
The majority of water utilities still do not have real-time electric meters installed. Only 13
percent have both electric advanced meter infrastructure (AMI) and hourly water production
data; however, another 27 percent have hourly water data only, and 20 percent have AMI, but
no hourly water data, indicating 47 percent of the utilities could be candidates for adding
metering technology.
Q20. If not real time, how do you get your electric consumption data presented? 25
utilities answered this question, with the preponderance of the responses showing monthly
data (84 percent). 8 percent didn’t know.
Q21. How do you manage your electric accounts? 33 utilities responded to this question.
54 percent manage the accounts individually, and 30 percent simply on an aggregate basis.
15 percent didn’t know.
Q22. Has your water utility participated in any energy efficiency and demand response
programs within the past 15 years? 31 utilities responded to this question. 71 percent said
yes, 22.5 percent no, and 6 percent didn’t know.

Increasing Energy Efficiency in Urban Water Supply March 2016
GEI Consultants, Inc. 34
Q23. If yes, did the programs incentivize action? 21 utilities responded to this question.
The most common action was replacing inefficient pumps or motors (76 percent of the
respondents). Other high actions were: adding variable speed drives to existing pumps (71
percent); site audits (66 percent); and installing energy efficient lighting, HVAC or other
building improvements (66 percent).
Q24. Inventory or Assessment of Equipment for Pumping and Processing, with specific
years and energy pump ratings for various pump and motor sizes? 31 utilities responded
to this question. Nearly 55 percent of the respondents said yes, 32 percent said no, and
nearly 13 percent didn’t know.
Q25. Willing to Share this inventory for the purposes of the study? 29 utilities answered
this question. 35 percent said no. 24 percent said yes. 41 percent did not know if they
could.
Q26. What is the minimum payback period for your utility that would enable retrofit
of your utility’s pumps and other electrical equipment? 24 utilities answered this
question. 45 percent of the respondents indicated 4 years or more; 41 percent indicated 2-4
years. Thus 86 percent of the respondents require a payback period of two or more years.
Only 12.5 percent of the respondents require a 6 month or less payback period.
Q27. Do you have sole authority to be able to retrofit your utility’s pumps and other
electrical equipment if the payback period meets your requirements? 28 utilities
responded to this question. Reflecting that most water utilities are municipally-owned and
answerable to elected officials, 78 percent said no and only 21 percent said yes.
Q28. Who has the decision-making authority? 24 utilities answered this question. 33
percent of the respondents indicated that these matters are decided by their board. Only 12
percent indicated that either the Distribution System Manager or the Direction of Operations
has that authority, 54 percent chose “other” and wrote detailed comments. This is an
important finding, addressed in the section below.
Q29. Interested in learning more? 28 utilities responded to this question. 57 percent said
yes, 43 percent said no. Within the “yes” responses, high interest was expressed in VFDs
and high efficiency motors and pumps. Interest was also expressed for in-line Hydro, and
analytical data packages.
Q30. Contact Information. Twenty-six utilities responded with their contact information
(name and email). Twenty-three utilities provided a phone number.

Increasing Energy Efficiency in Urban Water Supply March 2016
GEI Consultants, Inc. 35
3.2.3 Approval Barrier to Utility Procurement of Energy Efficient
Equipment
Question 28 of the survey asked utilities who within their utility had the decision-making
authority to purchase energy-efficient pumps and other equipment, provided that the payback
period was satisfactory. Only 12 percent of the respondents indicated that the Distribution
System Manager or Director of Operations in the utility had that authority. That is an
important finding, but not a particularly surprising one.
According to the U.S. EPA, there are approximately 155,000 public water supply systems in
the U.S. with 15 or more service connections.38
The drinking water industry is thus highly
fragmented and largely supplied through publicly-managed entities on either a municipal or
regional basis. This is unlike the energy industry, which is served primarily by larger
investor-owned companies in the electric and natural gas sectors and often have state
oversight agencies.
The governance model of municipal and regional water suppliers is that of an elected Board
of Directors overseeing the employees of the utility. In some cases, the water board directors
are appointed by the local mayor or city council; in other cases, the city council itself serves
as the governing body for the utility.
The effect of this governance model is political. Elected officials are inherently responsive
to the voters they serve; in the case of water utilities the voters and the utility system
ratepayers are usually the same people. Thus, purchasing decisions of any magnitude are
made in full public view with the opportunity for public involvement. And large purchases
for approval on the agenda do bring out the public.
A general manager of a utility typically has signature authority for a certain dollar amount.
Budgeted line items within that signature authority are certainly within his or her jurisdiction
and don’t need to go again before the board. Often $25,000 is the ceiling beyond which
separate purchase approval must be obtained from the board, and vendor bids are usually
required before that purchase approval can finally be granted. For small utilities, the
signature authority limit may be even lower.
Consequently, large purchases over the signature authority show up on water board meeting
agendas as a matter of law. Often these purchases become controversial to the ratepayers
because of the size of the investment and the perceived lack of immediate benefit. Here are
some of the reasons why energy efficient pump purchases may drop to the bottom of a board
priority list:
38
http://www.epa.gov/dwreginfo/information-about-public-water-systems
Increasing Energy Efficiency in Urban Water Supply March 2016
GEI Consultants, Inc. 36
1. Operating fund revenues are declining across the country because of reduced water
consumption, thus resulting in reduced water sales and a loss in revenue to the utility
system. To compensate for this revenue loss, rates must be raised, to the
consternation of the rate-paying public. Attempts are then made to reduce operating
expenses to possibly reduce the magnitude of the rate increase, or perhaps eliminate it
altogether.
2. Most publicly-elected water board officials are reluctant to approve continual
increases in consumer rates for fear of voter reprisal. As a result, needed revenue for
investments in the system are often not approved. The Black & Veatch 2015
Strategic Directions: U.S. Water Industry report documents that 64 percent of the
utilities in the United States are not able to recover in their customer rates the full cost
of service and utility financial obligations.39
This means that for these utilities, major
expenses to improve the system get deferred year after year in an attempt to reduce
the magnitude of the needed rate increase.
3. With a limited operating budget, projects compete for board member approval. We
received comments from survey respondents that suggested that energy-efficient
pumps would likely not be attractive enough for board member approval, even if clear
long-term financial benefit could be proven. And while general managers may wish
to reduce their energy consumption and thus their operating bill by purchasing this
equipment, they too have to prioritize what their critical needs are for the system as to
what they take to the board for approval. Water quality needs will trump everything
else, as compliance with the Safe Drinking Water Act must legally be a first priority.
4. The availability of federal, state, or regional financial incentives can change this
picture dramatically. Incentive funding is usually short term, and under the “use it or
lose it” view, this funding can often tip the scales favorably because the board will
always want to take advantage of free money being offered to the utility. A good
example of this is grant funding for smart meters. Replacing existing outdated meters
with smart meters is often an investment considered too costly on its own; the
availability of grant funding to offset the cost usually propels the decision forward
into a time frame that can take advantage of the available incentive funds. The utility
is thus seen as proactive and saving its ratepayers money (a good political position for
publicly-elected board members).
5. The business case for positive energy efficiency benefits is much hard to make for a
water utility considering other priorities. The board member does not perceive it as
the same because 100 percent of the funds for the energy efficiency improvement will
have to come from the utility. And if the payback period is four years or longer, it
goes beyond the elected term of the board member and thus none of the benefit will
be visible to offset the high purchase cost out of the operating budget. Even though
replacing the inefficient equipment may be a staff recommendation and a priority for
utility system managers, it may not be a shared priority with the board.
39
http://bv.com/reports/2015/water/financial-resilience
Increasing Energy Efficiency in Urban Water Supply March 2016
GEI Consultants, Inc. 37
6. Purchasing energy efficient equipment through an operating budget poses challenges
not faced with debt-financed investments. This equipment acquisition should be
debt-financed, and that is much easier to do in a large utility than in a smaller one that
may not have immediate access to municipal bonds or other investment funding.
Regardless of utility size, the benefits of long term debt financing are clear.
Capitalizing the purchase expense removes from the balance sheet the liability of the
large up-front purchase cost. Spreading the cost over the benefit period of the
investment would greatly improve the accounting balance sheet for the utility, and
thus the chances for board member approval.
7. Asset Management is not well funded in many small to medium sized utilities. A
good asset management inventory would identify the need to replace old meters and
inefficient energy-using equipment, but many small to medium-sized utilities are not
able to fund a comprehensive asset management program, largely because the needed
revenue for it may not be forthcoming in the unapproved rate increases.
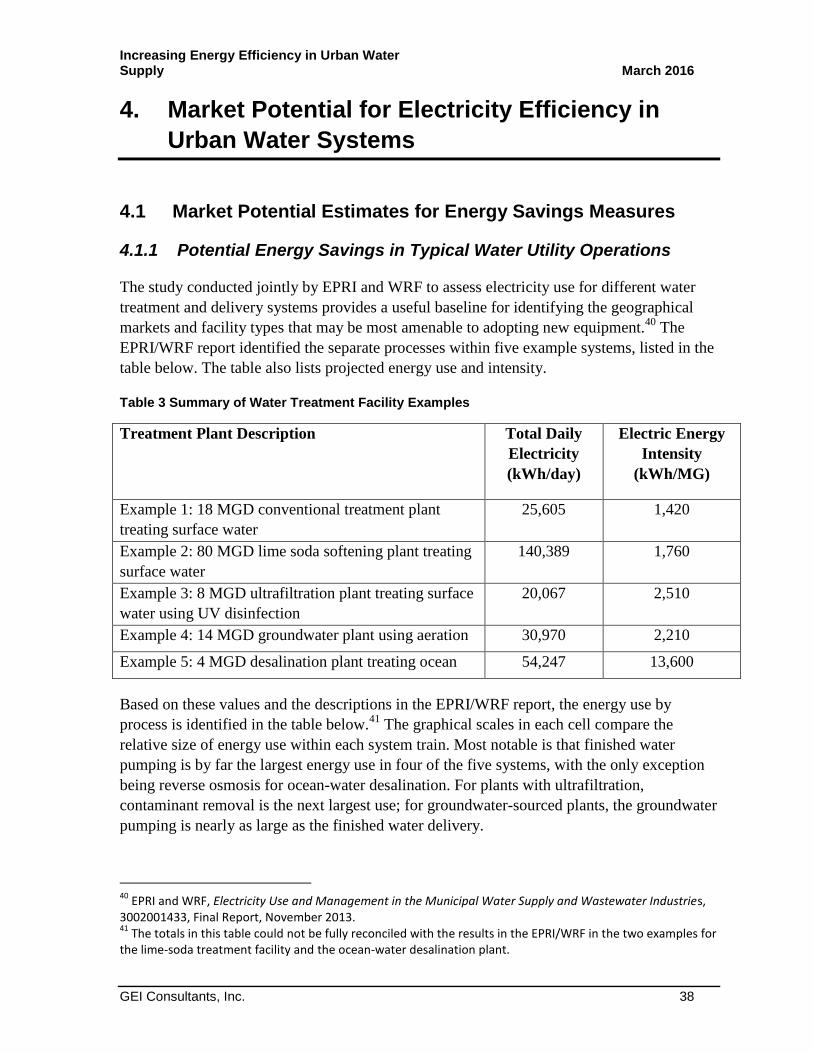
Increasing Energy Efficiency in Urban Water Supply March 2016
GEI Consultants, Inc. 38
4. Market Potential for Electricity Efficiency in
Urban Water Systems
4.1 Market Potential Estimates for Energy Savings Measures
4.1.1 Potential Energy Savings in Typical Water Utility Operations
The study conducted jointly by EPRI and WRF to assess electricity use for different water
treatment and delivery systems provides a useful baseline for identifying the geographical
markets and facility types that may be most amenable to adopting new equipment.40
The
EPRI/WRF report identified the separate processes within five example systems, listed in the
table below. The table also lists projected energy use and intensity.
Table 3 Summary of Water Treatment Facility Examples
Treatment Plant Description Total Daily
Electricity
(kWh/day)
Electric Energy
Intensity
(kWh/MG)
Example 1: 18 MGD conventional treatment plant
treating surface water
25,605 1,420
Example 2: 80 MGD lime soda softening plant treating
surface water
140,389 1,760
Example 3: 8 MGD ultrafiltration plant treating surface
water using UV disinfection
20,067 2,510
Example 4: 14 MGD groundwater plant using aeration 30,970 2,210
Example 5: 4 MGD desalination plant treating ocean
water
54,247 13,600
Based on these values and the descriptions in the EPRI/WRF report, the energy use by
process is identified in the table below.41
The graphical scales in each cell compare the
relative size of energy use within each system train. Most notable is that finished water
pumping is by far the largest energy use in four of the five systems, with the only exception
being reverse osmosis for ocean-water desalination. For plants with ultrafiltration,
contaminant removal is the next largest use; for groundwater-sourced plants, the groundwater
pumping is nearly as large as the finished water delivery.
40
EPRI and WRF, Electricity Use and Management in the Municipal Water Supply and Wastewater Industries, 3002001433, Final Report, November 2013. 41
The totals in this table could not be fully reconciled with the results in the EPRI/WRF in the two examples for the lime-soda treatment facility and the ocean-water desalination plant.

Increasing Energy Efficiency in Urban Water Supply March 2016
GEI Consultants, Inc. 39
Table 4 Energy Use by Process, Source: EPRI/WRF
Using these five examples, electricity bill savings were estimated by state for average
commercial and industrial utility rates.42
Potential energy savings were calculated from the
EPRI/WRF report based on improving from a “wire-to-water” efficiency of all pumping
systems of approximately 65 percent to 75 percent for four of the examples, and from 55
percent to 75 percent for the lime-soda example system. The annual electricity bill savings
were calculated assuming full operation 365 days per year.
The two tables below show the study team’s estimated energy bill savings per MGD by state
and for the U.S. average. The states with the largest savings are shaded in red, and least
savings in blue. The lime-soda and groundwater systems appear to have the greatest potential
in financial savings from improves pump efficiency, and desalination the least.43
The annual
savings per MGD for the lower 48 states range across states from $5,000 to $27,000 on
commercial rates and $3,000 to $23,000 on industrial rates. Annual savings per acre-foot for
those on commercial rates range from $6 to $16 across system types, and $5 to $24 across
states; savings on industrial rates range from $4 to $11 across types and $3 to $21 across
states.
42
U.S. Energy Information Administration, Form EIA-826, Monthly Electric Sales and Revenue Report with State Distributions Report, Table 5.6.B. Average Price of Electricity to Ultimate Customers by End-Use Sector, by State, Year-to-Date (Cents per Kilowatt-hour). 43
Note however that reverse osmosis is highly energy intensive, but given that most plants are likely using the newest technology, the additional savings potential is minimal.
Examples: 1 2 3 4 5
MGD 18 80 8 14 4
BY UNIT PROCESS Conventional Lime Soda Ultrafiltration Groundwater Desalination
source water pumping Raw surface water pumping 2,610 12,905 1,160 464
source water pumping raw groundwater pumping 12,935
clarification rapid mixing 558 2,464 256
clarification flocculation 162 720
clarification sedimentation 158 701
clarification chemical feed systems 65 65 65 65 0
clarification microfiltration (in lieu of sedimentation)
clarification ultrafiltration (contaminant removal) 6,400
clarification reverse osmosis (brackish water)
clarification reverse osmosis (ocearn water) 38,400
clarification dissolved air flotation 1,432
clarification air stripping
clarification repumping within treatment plant 3,120
filtration and solids handling backwash water pumps 225 1,038 99 36
filtration and solids handling residuals pumping 72 320 32 13
filtration and solids handling thickened solids pumping 100 496 50
disinfection, pumping and nonprocess loads onsite chlorine generation for
disinfection
disinfection, pumping and nonprocess loads ozone disinfection
disinfection, pumping and nonprocess loads UV disinfection 499 875
disinfection, pumping and nonprocess loads finished water pumping 19,456 86,819 8,754 15,248 3,428
disinfection, pumping and nonprocess loads nonprocess loads (buildings, HVAC,
lighting, computers, etc)
3,300 14,400 1,740 2,700 720
kWh/MGD 1,484 1,538 2,555 2,277 10,765
Total: 26,706 123,048 20,437 31,873 43,061
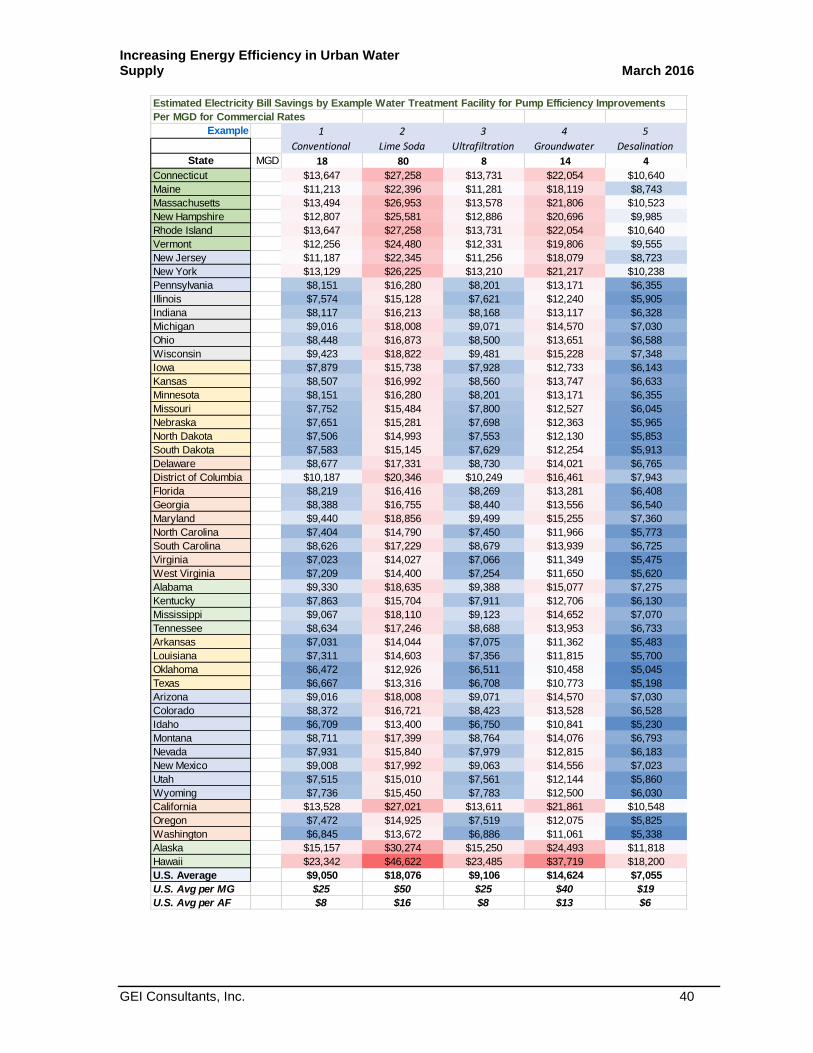
Increasing Energy Efficiency in Urban Water Supply March 2016
GEI Consultants, Inc. 40
Estimated Electricity Bill Savings by Example Water Treatment Facility for Pump Efficiency Improvements
Per MGD for Commercial Rates
Example 1 2 3 4 5
Conventional Lime Soda Ultrafiltration Groundwater Desalination
State MGD 18 80 8 14 4
Connecticut $13,647 $27,258 $13,731 $22,054 $10,640
Maine $11,213 $22,396 $11,281 $18,119 $8,743
Massachusetts $13,494 $26,953 $13,578 $21,806 $10,523
New Hampshire $12,807 $25,581 $12,886 $20,696 $9,985
Rhode Island $13,647 $27,258 $13,731 $22,054 $10,640
Vermont $12,256 $24,480 $12,331 $19,806 $9,555
New Jersey $11,187 $22,345 $11,256 $18,079 $8,723
New York $13,129 $26,225 $13,210 $21,217 $10,238
Pennsylvania $8,151 $16,280 $8,201 $13,171 $6,355
Illinois $7,574 $15,128 $7,621 $12,240 $5,905
Indiana $8,117 $16,213 $8,168 $13,117 $6,328
Michigan $9,016 $18,008 $9,071 $14,570 $7,030
Ohio $8,448 $16,873 $8,500 $13,651 $6,588
Wisconsin $9,423 $18,822 $9,481 $15,228 $7,348
Iowa $7,879 $15,738 $7,928 $12,733 $6,143
Kansas $8,507 $16,992 $8,560 $13,747 $6,633
Minnesota $8,151 $16,280 $8,201 $13,171 $6,355
Missouri $7,752 $15,484 $7,800 $12,527 $6,045
Nebraska $7,651 $15,281 $7,698 $12,363 $5,965
North Dakota $7,506 $14,993 $7,553 $12,130 $5,853
South Dakota $7,583 $15,145 $7,629 $12,254 $5,913
Delaware $8,677 $17,331 $8,730 $14,021 $6,765
District of Columbia $10,187 $20,346 $10,249 $16,461 $7,943
Florida $8,219 $16,416 $8,269 $13,281 $6,408
Georgia $8,388 $16,755 $8,440 $13,556 $6,540
Maryland $9,440 $18,856 $9,499 $15,255 $7,360
North Carolina $7,404 $14,790 $7,450 $11,966 $5,773
South Carolina $8,626 $17,229 $8,679 $13,939 $6,725
Virginia $7,023 $14,027 $7,066 $11,349 $5,475
West Virginia $7,209 $14,400 $7,254 $11,650 $5,620
Alabama $9,330 $18,635 $9,388 $15,077 $7,275
Kentucky $7,863 $15,704 $7,911 $12,706 $6,130
Mississippi $9,067 $18,110 $9,123 $14,652 $7,070
Tennessee $8,634 $17,246 $8,688 $13,953 $6,733
Arkansas $7,031 $14,044 $7,075 $11,362 $5,483
Louisiana $7,311 $14,603 $7,356 $11,815 $5,700
Oklahoma $6,472 $12,926 $6,511 $10,458 $5,045
Texas $6,667 $13,316 $6,708 $10,773 $5,198
Arizona $9,016 $18,008 $9,071 $14,570 $7,030
Colorado $8,372 $16,721 $8,423 $13,528 $6,528
Idaho $6,709 $13,400 $6,750 $10,841 $5,230
Montana $8,711 $17,399 $8,764 $14,076 $6,793
Nevada $7,931 $15,840 $7,979 $12,815 $6,183
New Mexico $9,008 $17,992 $9,063 $14,556 $7,023
Utah $7,515 $15,010 $7,561 $12,144 $5,860
Wyoming $7,736 $15,450 $7,783 $12,500 $6,030
California $13,528 $27,021 $13,611 $21,861 $10,548
Oregon $7,472 $14,925 $7,519 $12,075 $5,825
Washington $6,845 $13,672 $6,886 $11,061 $5,338
Alaska $15,157 $30,274 $15,250 $24,493 $11,818
Hawaii $23,342 $46,622 $23,485 $37,719 $18,200
U.S. Average $9,050 $18,076 $9,106 $14,624 $7,055
U.S. Avg per MG $25 $50 $25 $40 $19
U.S. Avg per AF $8 $16 $8 $13 $6

Increasing Energy Efficiency in Urban Water Supply March 2016
GEI Consultants, Inc. 41
Estimated Electricity Bill Savings by Example Water Treatment Facility for Pump Efficiency Improvements
Per MGDG for Industrial Rates
Example 1 2 3 4 5
Conventional Lime Soda Ultrafiltration Groundwater Desalination
State MGD 18 80 8 14 4
Connecticut $11,077 $22,125 $11,145 $17,900 $8,638
Maine $7,803 $15,586 $7,851 $12,610 $6,085
Massachusetts $11,340 $22,650 $11,410 $18,325 $8,843
New Hampshire $10,780 $21,532 $10,846 $17,421 $8,405
Rhode Island $11,891 $23,752 $11,965 $19,216 $9,273
Vermont $8,601 $17,178 $8,654 $13,898 $6,705
New Jersey $9,483 $18,940 $9,541 $15,324 $7,393
New York $5,488 $10,961 $5,521 $8,868 $4,278
Pennsylvania $6,183 $12,350 $6,221 $9,992 $4,820
Illinois $5,403 $10,792 $5,436 $8,731 $4,213
Indiana $5,674 $11,334 $5,709 $9,169 $4,425
Michigan $6,141 $12,265 $6,179 $9,924 $4,788
Ohio $5,836 $11,656 $5,871 $9,430 $4,550
Wisconsin $6,667 $13,316 $6,708 $10,773 $5,198
Iowa $5,225 $10,436 $5,258 $8,443 $4,073
Kansas $6,293 $12,570 $6,333 $10,170 $4,908
Minnesota $6,073 $12,130 $6,110 $9,814 $4,735
Missouri $5,394 $10,775 $5,428 $8,717 $4,205
Nebraska $6,565 $13,112 $6,605 $10,609 $5,118
North Dakota $7,099 $14,180 $7,143 $11,472 $5,535
South Dakota $6,217 $12,418 $6,255 $10,046 $4,848
Delaware $7,082 $14,146 $7,126 $11,445 $5,523
District of Columbia $7,430 $14,840 $7,476 $12,006 $5,793
Florida $7,108 $14,197 $7,151 $11,486 $5,543
Georgia $5,013 $10,012 $5,044 $8,101 $3,908
Maryland $7,464 $14,908 $7,510 $12,061 $5,820
North Carolina $5,488 $10,961 $5,521 $8,868 $4,278
South Carolina $5,132 $10,249 $5,163 $8,292 $4,000
Virginia $5,954 $11,893 $5,991 $9,621 $4,643
West Virginia $5,174 $10,334 $5,206 $8,361 $4,035
Alabama $5,301 $10,588 $5,334 $8,566 $4,133
Kentucky $4,597 $9,182 $4,625 $7,429 $3,585
Mississippi $5,717 $11,418 $5,751 $9,238 $4,458
Tennessee $5,411 $10,809 $5,445 $8,744 $4,220
Arkansas $5,267 $10,521 $5,300 $8,511 $4,108
Louisiana $4,597 $9,182 $4,625 $7,429 $3,585
Oklahoma $4,554 $9,097 $4,583 $7,360 $3,550
Texas $4,775 $9,538 $4,805 $7,716 $3,723
Arizona $5,479 $10,944 $5,513 $8,854 $4,273
Colorado $6,039 $12,062 $6,076 $9,759 $4,708
Idaho $5,759 $11,503 $5,795 $9,306 $4,490
Montana $4,504 $8,996 $4,531 $7,278 $3,513
Nevada $6,090 $12,164 $6,128 $9,841 $4,748
New Mexico $5,411 $10,809 $5,445 $8,744 $4,220
Utah $5,386 $10,758 $5,419 $8,704 $4,200
Wyoming $5,734 $11,452 $5,769 $9,266 $4,470
California $10,458 $20,888 $10,523 $16,900 $8,155
Oregon $5,157 $10,300 $5,189 $8,334 $4,020
Washington $3,757 $7,505 $3,780 $6,072 $2,930
Alaska $12,638 $25,242 $12,715 $20,422 $9,853
Hawaii $20,059 $40,066 $20,183 $32,415 $15,640
U.S. Average $5,920 $11,825 $5,956 $9,567 $4,615
U.S. Avg per MG $16 $32 $16 $26 $13
U.S. Avg per AF $5 $11 $5 $9 $4

Increasing Energy Efficiency in Urban Water Supply March 2016
GEI Consultants, Inc. 42
4.1.2 Net Present Value of Energy Efficiency Savings
To assess the investment payback, the financial benefits can be expressed in the discounted
present value of lifecycle energy savings. This can be compared to the cost of the energy
saving measure or strategy to determine the internal rate of return and payback period. Based
on survey, more than half of water utility managers are looking for a payback in four years or
less.
Assuming a 30-year average expected life, a discount rate of 5 percent based on typical
municipal utility bond rates and an electric utility rate escalation of 1 percent, the two tables
below summarize the expected present value savings over the book life of the example
system. Those can range from $80,000 to $312,000 per MGD based on the type of plant and
the state. Across states, the savings can range from 37 percent below the U.S. average to
about double the average for the most expensive rates in the lower 48 states.
Table 5 Net Present Values of Energy Efficiency Savings
4.1.3 Savings as a Proportion of Overall Costs and Ratepayer Bills
To assess the market potential for these measures, one must consider the potential for cost
savings as a proportion of total costs. Water utility managers will focus on those elements
that have the largest potential impact on their bottom lines. Water utilities are among the
most capital-intensive industries, even more so than electric utilities. In these cases, savings
on operational costs may not be as important as investment cost savings, particularly on the
costs of financing such as interest rates.
To put these savings in perspective for the total costs of the water utilities, the table below
shows the estimated percentage savings on residential water bills for each system on
commercial electricity rates. Typical water bills for the 50 largest cities were drawn from
Net Present Value of Savings - Commercial Rates
Example 1 2 3 4 5
Type Conventional Lime Soda Ultrafiltration Groundwater Desalination
MGD 18 80 8 14 4
U.S. Average $156,493 $312,573 $157,466 $252,884 $121,995
U.S. Average per MG $429 $856 $431 $693 $334
U.S. Average per AF $140 $279 $141 $226 $109
Net Present Value of Savings - Industrial Rates
Example 1 2 3 4 5
Type Conventional Lime Soda Ultrafiltration Groundwater Desalination
MGD 18 80 8 14 4
U.S. Average $102,369 $204,476 $102,996 $165,435 $79,803
U.S. Average per MG $280 $560 $282 $453 $219
U.S. Average per AF $91 $183 $92 $148 $71
Increasing Energy Efficiency in Urban Water Supply March 2016
GEI Consultants, Inc. 43
Black & Veatch’s 2013 Water Rates Survey,44
and residential domestic water use by state
was calculated from U.S. Geological Survey’s 2010 water use database.45
Again, the greatest
potential savings as proportion of total costs are shown in red. Of course, not all of these
technologies are used in those individual cities (e.g., Oklahoma City will not have an ocean
desalination plant). The median bill savings across the U.S. for cost savings ranges from 0.5
percent to 1.1 percent depending on the system technology. Savings can be as little as 0.2
percent and up to 3.8 percent. For conventional and ultrafiltration systems, the maximum is
about 1.9 percent. Assuming that the savings on the conventional treatment system is typical
for water utilities across the U.S., the total potential electricity bill savings are $217 million
annually. The net present value of those savings would be $3.75 billion.
44
Black & Veatch, “50 Largest Cities Water/Wastewater Rate Survey,” http://www.saws.org/who_we_are/community/RAC/docs/2014/50-largest-cities-brochure-water-wastewater-rate-survey.pdf, 2013. 45
USGS (2010), op. cit.

Increasing Energy Efficiency in Urban Water Supply March 2016
GEI Consultants, Inc. 44
5. Use of Performance Contracts for Advancing
Efficiency in Water Infrastructure
Energy service performance contracts (ESPCs) with energy service companies (ESCOs) have
been used for two decades to promote energy savings strategies and measures, mostly in the
commercial and public sector building sectors.46
Water efficiency service companies
(WESCOs) have been a much smaller sector serving water utilities. These companies bring
together technical know-how, institutional knowledge about available funding and
incentives, and risk-sharing to deliver customers operational savings (see also Appendix D
for a general discussion). The latter two factors could be key to making this mechanism a
useful means of increasing adoption of advanced electricity technologies in the water utility
sector.
5.1 Institutional Understanding of the Target Market
First, we begin with an understanding of the structure and incentives of water utilities. As
discussed earlier, the vast majority of water utilities are municipally-owned, either as
divisions of cities and counties or as special districts. These organizations are driven by a
concern for public welfare and political support. They are not profit-driven, and cost
reductions are of concern to the extent that those reductions translate to changes in rates.
Often these utilities have large, long-lived capital investments in various facilities and
relatively small operational costs, even compared to electric and natural gas utilities;
however, energy costs are usually a large portion of those operational costs. These utilities
are almost always outside of state economic regulation and external incentives, the rationale
being that local governments can best look out for the interests of their ratepayers. On the
other hand, they face greater state and federal health and environmental regulations. Those
latter agencies usually are not concerned about the economic consequences, and penalties for
non-compliance can be large. For this reason, a focus on low-cost service may become
secondary.
Because these are municipal entities, the governing boards tend to be conservative and risk-
averse. Board members, particularly when compose of city or county elected officials, are
less likely to be well-informed about water management issues, much less on technology
advancements. Generally, these utilities’ staff are much smaller than for investor-owned
energy utilities, but in line with municipal electric utilities. Most of the technical staff are
civil or mechanical engineers, with few electrical engineers who might be familiar with new
technologies.
46
Appendix D contains a review of the characteristics and performance of the general energy services company sector.

Increasing Energy Efficiency in Urban Water Supply March 2016
GEI Consultants, Inc. 45
As public agencies, the procurement process for these water utilities can require more effort.
As one observer pointed out, it is difficult to market to the water sector because even if the
operator knows the manufacturer or pump is a good product, you still have to go to bid, do
cost comparisons, etc. and in the end the decision is often made based on other factors.
The most important things to OEMs are first the lowest price, and then reliability and lowest
energy usage. It is a complex process of dealing with vendors – this really needs to change if
taking a systems approach.
As for the much smaller sector of investor-owned utilities, these companies are typically
much smaller and often characterized by widely-separated service areas. The investor-owned
company is often effectively a collection of many smaller companies (sometimes called
“districts”). Staff is usually “lean and mean”, focused on delivering water with the existing
infrastructure however inefficient it may be; these utilities do not often have substantial
technical expertise, particularly in electrical issues. While these utilities are regulated by state
public utilities or public service commissions, such regulation is often overshadowed by
electricity and natural gas. Either the regulatory staff is able to impose draconian
requirements that ignore the capital requirements and revenue variability of the industry, or
the companies are able to pass along all of their costs with little oversight. Unfortunately,
either situation can mute incentives for cost savings, because either regulators take all of the
savings for ratepayers without regard to long-term consequences, or managers see little
pressure to change current practices.
These structures and incentives indicate a different set of objectives than for private and
regulated investor-owned companies. Demonstrating the benefits of energy cost savings is
more indirect. As indicated in the accompanying survey, payback periods likely have to be
within the elected officials’ terms of office. IOU water companies may view energy savings
as a potential risk to their revenue stream in certain states. For public utilities, focusing on
how ratepayers may benefit with little or no risk may be the most persuasive approach.
While each utility may be full of engineers, they typically will not be as familiar with
electrical technology and the benefits of upgrading existing equipment. Providing credible
outside expertise may be an important element in gaining staff support. One manufacturing
representative said procurement mechanisms tend to be a challenge; it is important to get
both utility staff and vendors to feel comfortable with the new technologies and methods for
procuring them.
5.2 Considerations in Designing Successful Energy Service
Performance Programs
The American Council for an Energy Efficient Economy (ACEEE) and the Alliance for
Water Efficiency (AWE) promoted a contest to find the most effective water-energy
programs. Among the most relevant findings is that the most effective programs gained

Increasing Energy Efficiency in Urban Water Supply March 2016
GEI Consultants, Inc. 46
savings in both energy and water, that they were partnerships and collaboratives across
multiple organizations, and that they were part of broader long term initiatives that integrated
resources. Another important feature particularly important to using ESCOs is that the
programs acted as “one-stop shops” to get all relevant information. The challenges included
gaining commitments and trust from partners, but conveying clear information about the
benefits was key. Once the program started, maintaining sustained support also was a
challenge. Finally, quantifying the amount of energy actually saved, including that outside of
the water utility itself, was a problem.
ESCOs can facilitate many of these functions by providing a full range of support services.
Recognizing and integrating the savings across both energy and water is critical given the
mission of the water utilities. This is akin to the standard ESCO project focused on
commercial and public buildings. In that case, energy savings must be delivered while
maintaining comfort and improving building functionality. ESCOs will need to be able to
track and access incentives for both energy and water savings, and to supply that information
from a central place. As a corollary, ESCOs will need to be able to assist in negotiating the
necessary collaborative efforts across multiple parties.
The introduction of water management adds a level of complexity that does not exist in a
typical ESCO project. Energy savings usually can be measured as a separable indicator from
other building functions—it is usually not an integral part of the building’s service delivery.
That is not the case with water utilities. How energy is used to move or process water can
have an effect on the total water usage, and conversely, water efficiency gains can have a
direct impact on energy use. Improved water efficiency can actually lead to increased energy
use. For example, pressurizing drip irrigation systems improves water efficiency but can
increase energy use if the previous system was primarily gravity fed. This can create
complications in computing incentive targets in energy services performance contacts. A
water utility may implement a water saving measure that reduces overall costs but shifts
some costs to the energy bill. Ensuring that the contract covers overall cost savings to some
degree can address this problem.
A further complication is integrating more advanced technologies into an existing system. As
one of the study participants said, retrofitted water-utility facilities are frequently not tooled
and calibrated properly to best integrate new equipment, and as result will not provide lab-
tested efficiency performance. The challenge is educating product consumers to focus on
overall energy savings rather than just simple efficiency measures. Another manufacturer
representative who works with ESCOs said facilities need to be retro-commissioned;
software is needed to improve data management and support performance tracking. One
manufacturer that has successfully implemented an ESCO in the water utility sector evaluates
the integrated delivery system. The company considers the full train, including motor drive
and pump and getting that train synchronized and tuned together. Still, end users too often
are only looking at the efficiency of individual components within a system rather than the
entire system.
Increasing Energy Efficiency in Urban Water Supply March 2016
GEI Consultants, Inc. 47
Another factor adding complexity is that improved water efficiency can lead to reduced
energy use upstream and outside of the water utility’s system boundaries. For example, an
interregional water conveyance system is typically managed by a water wholesale agency. A
retail utility may not fully realize the full financial savings from the upstream energy
reductions because the wholesale utility may not pass them through. This external energy
source is one example of where “hidden energy” is embedded in delivered water. Providing
the appropriate incentives for the retail utility to fully realize energy savings may require the
intervention of the serving electricity utility, the regulatory commission or the state energy
office. An ESCO which is probably more familiar with these organizations and available
programs may be well positioned to assist a water utility looking for external incentive
programs targeting these savings.
Water utilities also face financing issues for smaller-scale projects and will want to rely on
the ESCO to mitigate annual cost increases. As one observer put it, “all public financing
decisions begin with maximizing the use of other people’s money.” The availability of
federal, state, or regional financial incentives as well as energy utility incentives can
influence a water suppliers’ decision to participate. ESCOs should come prepared with a
financing package that relies on outside grants and incentives to the extent possible (see
bullet #4 in Section 3.2.2 of this report).
Finally, risk sharing is an important consideration given the nature of the municipal utilities.
As discussed above, a utility may be making trade-offs in water and energy savings, but it
will want to push as much risk onto an ESCO as possible. An ESCO will want to assess how
to develop a modified version of the standard guaranteed savings contract that accounts for
potential trade-offs. Integrating the combined energy and water cost savings, while an
unusual aspect of ESPCs, is key to this objective. Developing metrics for savings
contributions from different strategies and measures will be important to formulating these
contracts.
5.3 Financing Methods
Energy saving performance projects can be financed in a variety of ways. These projects are
typically financed by a third-party financial institution. For water utilities, these financing
options can move debt off its books while providing the advantages of spreading costs over a
longer period. That can mitigate the potential for short-term rate increases from upfront
equipment purchases. Water suppliers are funded predominately through the rates they
charge their customers for the water the agency delivers to them. Other types of funding can
include taxes, local bonds, tap or connection fees, and special district fees.47
Often ESCOs
can help the customer understand their financing options and arrange alternative financing.
47
Helena Alegre and Sérgio T. Coelho, “Infrastructure Asset Management of Urban Water Systems,” in Water Supply System Analysis - Selected Topics, LNEC – National Civil Engineering Laboratory, Lisbon, Portugal,
Increasing Energy Efficiency in Urban Water Supply March 2016
GEI Consultants, Inc. 48
Although not common for public-sector customers such as water utilities, some large
institutional customers that have sufficient capital on-hand may consider self-financing an
energy efficiency project. Self-financing allows customers to save on interest costs and keep
the entire energy savings as return on their investment. This may be a good option for entities
that can draw on an endowment, capital budget, funds for deferred maintenance, or reserve
accounts for efficiency investments. One option though is to use enterprise fund reserves
from other municipal entities to finance these measures. Such funds currently earn extremely
low returns, and making these type of low-risk investments could be a useful revenue
generator for a municipality; however, since third-party financing is more typical, this section
focuses on some of the most common third-party financing vehicles.
For all of these financing options, the borrower’s payment obligation is not dependent on
energy savings of the ESCO project. While the ESCO is obligated to make up any shortfalls
in energy savings to the customer, the energy savings guarantee is independent of the
borrower’s agreement with its lender.
Tax-exempt lease-purchase agreement—Lease-purchase agreements have
historically been the most popular financing arrangement. Under a lease-purchase
agreement the lessee purchases the energy saving equipment provided under an
ESCO contract through scheduled installments. At the end of the agreement,
ownership of the equipment is transferred to the lessee. The major advantage of the
lease-purchase agreement is that they are often treated as off-balance sheet
transaction, depending on specific contract language. Rather than being treated as a
long-term debt obligation, which may require special approval for public agencies in
particular, lease-purchase agreements can be treated as a series of renewable, short-
term lease payments. This moves the debt obligation off the book and improves the
agency’s position for debt rating. Public institutions and in some cases nonprofit
institutions can also benefit from lower interest rates because of the tax deduction that
lessors receive on interest payments from those institutions.48
Capital lease—A capital lease is an arrangement where ownership of the equipment
remains with the lessor and the customer makes payments for use of the equipment.
Under capital leases, there is often an option to purchase the equipment at a price
below market value at the end of the lease period. The customer classifies the lease
payments as capital expenses and recognizes the asset on its balance sheet. As in the
case of lease-purchase agreements, government institutions can benefit from tax-
exempt interest rates.49
http://www.intechopen.com/books/water-supply-system-analysis-selected-topics/infrastructure-asset-management-of-urban-water-systems, 2012. 48
Clinton Climate Initiative. 2009. Energy Performance Contracting Financing Options. http://www2.presidentsclimatecommitment.org/documents/ccitoolkit/Energy_Performance_Contracting_Financing_Options.pdf 49
Ibid.
Increasing Energy Efficiency in Urban Water Supply March 2016
GEI Consultants, Inc. 49
Operating lease—Operating leases are similar to capital leases, except that there is
no purchase option at the end of the term. These lease arrangements can be
considered “off-balance sheet” since ownership of the equipment remains with the
lessor indefinitely and can be a good option for institutions at or near their debt
capacity. Operating leases are often more costly than capital leases and lease-
purchase agreements because the customer does not benefit from tax-exempt interest
rates (since ownership of the equipment remains with the lessor and not the tax-
exempt entity). In addition, operating leases are often more complex, resulting in
higher transaction costs.50
Leasing pools—Leasing pools can be a financing option for large projects when no
single investor is able to finance the entire project. Leasing pools use aggregated
financing to reduce costs and access a larger pool of investors. After a leasing
agreement is reached between a customer and a lessor, the lessor sells shares of the
financing, called certificates of participation (COP) to other investors. The proceeds
are forwarded to the customer to cover upfront costs of efficiency investments. A
government agency providing a leasing pool builds a collection of funds by selling
COPs for energy or utility type projects. The pool of funds can then be used to
finance lease tax exempt lease agreements for the state or local agencies. Interest rates
on COPs are usually higher than for general obligation bonds but leasing pools can be
more cost-effective than securing individual financing from multiple investors.
Government bonds—Bonds are a long-term debt obligation typically treated as on-
balance sheet. As with the other financing options, government institutions can
benefit from lower interest rates due to their tax-exempt status. Bonds are issued by
local and state governments and may require approval from a legislative body or local
voters. Often projects are financed in a bundle through a single bond issuance. It is
not uncommon for enterprise agencies, such as water utilities, to issue bonds on a
fairly regular annual basis.
Green bonds--These bonds raise capital exclusively for projects or activities with
specific climate or environmental sustainability objectives (e.g., renewable energy,
waste management and energy efficiency). Moody’s estimates that this financing
segment may exceed $100 billion globally.51
Performance for these bonds are
evaluated on a multi-dimensional basis focused on sustainability metrics. Water and
energy efficiency projects will have an easier task of qualifying for this type of
financing.
Revolving loan pools—Some states offer revolving loan pools for energy
improvement projects. Principal and interest repayments on these loans go to reseed
the fund, allowing the state to continue to support clean energy projects. According to
the National Association of State Energy Officials (NASEO), all but a handful of
50
Ibid. 51
Moody’s Investor Services, “Announcement: Moody's: Green bonds to blossom as global markets embrace more eco-friendly investments,” https://www.moodys.com/research/Moodys-Green-bonds-to-blossom-as-global-markets-embrace-more--PR_326218, May 27, 2015.
Increasing Energy Efficiency in Urban Water Supply March 2016
GEI Consultants, Inc. 50
states and territories had revolving loan funds in place.52
“As of July 2013, NASEO
has tracked 79 programs operating in 44 states and territories, representing a total of
$2 billion in available financing.”53
Tax equity financing—Where an on-site energy project is an attractive option to
combine with other energy efficiency measures, this mechanism can reduce the need
for conventional financing. Many renewable energy projects rely to some degree on
the tax equity market for financing. To the extent that energy savings projects can
similarly use tax credits, this instrument may be attractive; however, tax equity can be
a more expensive form of financing than other sources of capital. The tax equity
market is not very transparent, nor is it highly liquid. In addition, each project is
unique, with unique developers and investors. Participants in the tax equity market
also face significant challenges of understanding and evaluating the array of energy
technologies, project structures, and contract and market risks.54
This uniqueness
increases the transaction costs of using tax equity for financing. Investors are
generally earning yields from 7 percent to 9 percent.55
For renewable power projects, the choice of tax equity financing varies with the type
of tax credit that is applicable and most beneficial to a project.56
For projects using
the investment tax credit, most common for solar for example, a sale/leaseback is
most common. The tax equity investor leases the project for less than 80 percent of
the project life, and provides more than 20 percent of the equity contribution (plus
non-recourse debt).
52
NASEO, “State Energy Financing Programs,” http://www.naseo.org/state-energy-financing-programs, retrieved February 2016. 53
NASEO, “State Energy Revolving Loan Funds,” https://www.naseo.org/Data/Sites/1/documents/selfs/state_energy_rlf_report.pdf, July 2013. 54 One estimate puts the number of active players in the tax equity market at about 20 to 22 entities. See “State of the Tax Equity Market.” Chadbourne & Parke, LLP, Transcript from Infocast Wind Finance and Investment Summit, San Diego, CA, February, 2012. Project Finance Newswire, May 2012. 55 See Chabourne & Parke, LLP, May 2012 Project Finance Newswire. Also, Mendelsohn, M. and J. Harper. Section 1603 Treasury Grant Expiration: Industry Insight on Financing and Market Implications. National Renewable Energy Laboratory. June 2012, p. 19. 56
"Investment in Alternative Energy After the End of Cash Grants," 19 September 2011, www.mondaq.com/unitedstates/x/145170/IRS+HRMC/Investment+In+Alternative+Energy+After+The+End+Of+Cash+Grants, retrieved January 18, 2013.
Increasing Energy Efficiency in Urban Water Supply March 2016
GEI Consultants, Inc. 51
6. Conclusions and Recommendations
This study provides valuable information and data in support of NEMA’s strategic initiative
to advance energy efficiency in urban water supply systems consistent with the goals
specified. GEI’s study team was able to collect a significant body of literature regarding the
current extent to which energy efficient technologies are deployed in our nation’s water
systems and the possible barriers limiting further adoption of these technologies. In addition,
a summary of recommended best practices to advance system and energy performance is
highlighted. Responses to the water agency survey came from a regionally diverse set of
water agencies and provided meaningful insights to level of interest in energy efficiency,
institutional and financial challenges to advancing efficiency in these systems and possible
steps that can be taken to overcome them. Using information and data gathered during both
the literature review and the survey, the study team was also able to determine a conservative
estimate for energy efficiency savings potential in urban water systems. Lastly, we found that
funding exists to implement many of energy efficiency projects, albeit insufficient to meet
the entire investment need, and that the use of ESCOs and ESPCs are a viable business
model to secure these funds and implement projects.
As some NEMA members already know, ESPCs have been and are being used by some
water agencies to assist in reducing energy demands. Traditionally manufacturers have
tended to develop relationships with vendors and distributors but in the future building
stronger relationships directly with water agency representatives through activities such as
training, webinars, system assessments may be more effective tools to advance their
knowledge, understanding and acceptance of new technologies. In these interactions, NEMA
must take a brand neutral or agnostic approach to ensure it is seen as a credible and trusted
resource to which water utilities can turn for unbiased information and technical expertise.
Actions NEMA can take to advance energy efficiency of urban water systems which have
been identified in this study are summarized below.
Recognizing that some water utilities lack the analytic capacity or staff resources to
perform certain energy-related evaluations, NEMA can develop programs and tools to
facilitate site audits; perform pump evaluations, conduct testing and system
optimization assessments; and educate and train agency and facility staff.
To facilitate the development of these tools and resources, NEMA can establish a
water sector focused group made up of facility managers and operators that can assist
in the targeting of efforts to the most important water-related topics and infrastructure
needs.

Increasing Energy Efficiency in Urban Water Supply March 2016
GEI Consultants, Inc. 52
Get more involved and maintain a consistent presence in water-related associations,
non-governmental organizations, and advocacy groups to increase understanding of
the many opportunities the water sector has to improve the energy efficiency of their
processes; stay current on information about issues and challenges being faced by
water utilities; and access the paths to more direct agency interactions for project
development.
Recognizing that funding opportunities can vary from state-to-state and over time,
facilitate the identification and organization of innovative funding approaches into
various, more holistic portfolios for agencies that leverage ESCOs, public and private
dollars, and energy utility incentives. These portfolios can be updated regularly and
highlight what components of overall projects can be financed with what funding
sources, how these sources can be aligned and share to meet “match share”
requirement or fill funding gaps.
As an organization, continue to directly fund, independently or in collaboration with
other water research organizations, the demonstration of technologies, best practices
and other types of energy savings strategies, disseminating the results at water
conferences, industry publications and webinars.

Increasing Energy Efficiency in Urban Water Supply March 2016
GEI Consultants, Inc. 53
Appendix A
References
Alegre, Helena and Sérgio T. Coelho, "Infrastructure Asset Management of Urban Water
Systems," in Water Supply System Analysis - Selected Topics, LNEC - National Civil
Engineering Laboratory, Lisbon, Portugal, http://www.intechopen.com/books/water-supply-
system-analysis-selected-topics/infrastructure-asset-management-of-urban-water-systems, 2012.
American Society of Civil Engineers "2013 Report Card for America's Infrastructure", ISBN
(PDF): 978-0-7844-7883-7.
Black & Veatch, "50 Largest Cities Water/Wastewater Rate Survey,"
http://www.saws.org/who_we_are/community/RAC/docs/2014/50-largest-cities-brochure-water-
wastewater-rate-survey.pdf, 2013.
Carpenter, Adam, “EPA's Clean Power Plan Rule: A Catalyst for AWWA's Energy Initiative,
and what it means for the water sector”, Presentation by Adam T. Carpenter, CA-NV Section
AWWA, February 24, 2016.
Center for Sustainable Systems, University of Michigan (2015) "U.S. Water Supply and
Distribution Factsheet." Pub. No. CSS05-17. October 2015. See
http://css.snre.umich.edu/css_doc/CSS05-17.pdf
Chabourne & Parke, LLP, Project Finance Newswire. Also, Mendelsohn, M. and J. Harper.
Section 1603 Treasury Grant Expiration: Industry Insight on Financing and Market Implications.
National Renewable Energy Laboratory. June 2012, p. 19.
Clinton Climate Initiative. Energy Performance Contracting Financing Options. 2009.
http://www2.presidentsclimatecommitment.org/documents/ccitoolkit/Energy_Performance_Cont
racting_Financing_Options.pdf
DWR. Appendix O - Voluntary Reporting of Energy Intensity, Draft Urban Water Management
Plan Guidance, July 27, 2015
http://www.water.ca.gov/calendar/materials/appendix_o_voluntary_reporting_of_energy_intensit
y_19545.pdf
EPRI and WRF, Electricity Use and Management in the Municipal Water Supply and
Wastewater Industries, 3002001433, Final Report, November 2013.
EPRI and WRF, Electricity Use and Management in the Municipal Water Supply and
Wastewater Industries, Final Report, prepared by EnerNOC, Inc. under contract to EPRI,
November 2013.
Increasing Energy Efficiency in Urban Water Supply March 2016
GEI Consultants, Inc. 54
Goldman, Charles A. et al. Market trends in the US ESCO industry: Results from the NAESCO
database project. Lawrence Berkeley National Laboratory. 2002
ICF, Introduction to Energy Performance Contracting, Prepared for U.S. Environmental
Protection Agency ENERGY STAR Buildings,
http://www.energystar.gov/ia/partners/spp_res/Introduction_to_Performance_Contracting.pdf,
October 2007.
Larsen, PH et al., "U.S. Energy Service Company Industry: Market Size and Project
Performance from 1990 to 2008." Lawrence Berkeley National Laboratory, Environmental
Energy Technologies Division, 2014.
Leiby, Vanessa and Michael Burke. Energy Efficiency Best Practices for North American
Drinking Water Utilities, Water Research Foundation and New York State Energy Research and
Development Authority, ISBN 978-1-60573-159-9, 2011.
Maupin, M.A., et al. Estimated Use of Water in the United States in 2010: U.S. Geological
Survey, Maupin, M.A., Kenny, J.F., Hutson, S.S., Lovelace, J.K., Barber, N.L., and Linsey, K.S.,
Circular 1405, 56 p., http://dx.doi.org/10.3133/cir1405. 2014.
Miller, David et al. "Investment in Alternative Energy After the End of Cash Grants," 19
September 2011,
www.mondaq.com/unitedstates/x/145170/IRS+HRMC/Investment+In+Alternative+Energy+Afte
r+The+End+Of+Cash+Grants, retrieved January 18, 2013.
Moody's Investor Services, "Announcement: Moody's: Green bonds to blossom as global
markets embrace more eco-friendly investments," https://www.moodys.com/research/Moodys-
Green-bonds-to-blossom-as-global-markets-embrace-more--PR_326218, May 27, 2015.
NASEO, "State Energy Financing Programs," http://www.naseo.org/state-energy-financing-
programs, retrieved February 2016.
NASEO, "State Energy Revolving Loan Funds,"
https://www.naseo.org/Data/Sites/1/documents/selfs/state_energy_rlf_report.pdf, July 2013.
Satchell, Andrew et al, A Survey of the U.S. ESCO Industry: Market Growth and Development
from 2008 to 2011, Lawrence Berkeley National Laboratory, Environmental Energy
Technologies Division, http://www.naesco.org/data/industryreports/ESCO%20study.pdf, June
2010.
Stuart, Elizabeth et al, "Current Size and Remaining Market Potential of U.S. ESCO Industry,"
Lawrence Berkeley National Laboratory, Environmental Energy Technologies Division,
https://emp.lbl.gov/sites/all/files/lbnl-6300e-ppt.pdf, September 2013.
Increasing Energy Efficiency in Urban Water Supply March 2016
GEI Consultants, Inc. 55
U.S. DOE. The Water-Energy Nexus: Challenges and Opportunities, June 2014. Downloaded
from
http://energy.gov/sites/prod/files/2014/07/f17/Water%20Energy%20Nexus%20Full%20Report%
20July%202014.pdf. See also Bauer, Diane. 2014. "Water-Energy Nexus: Challenges and
Opportunities" Water-Energy Tech Team, Office of Energy Policy and Systems Analysis, U.S.
Department of Energy, September 5, 2014.
U.S. Energy Information Administration, Form EIA-826, Monthly Electric Sales and Revenue
Report with State Distributions Report, Table 5.6.B. Average Price of Electricity to Ultimate
Customers by End-Use Sector, by State, Year-to-Date (Cents per Kilowatt-hour).
U.S. EPA. Ensuring a sustainable Future: An Energy Management Guidebook for Wastewater
and Water Utilities. Publication EPA 832-R-08-002. January 2008.
U.S. EPA. Drinking Water Infrastructure Needs Survey and Assessment -Fifth Report. 2013.
U.S. EPA. National Water Program Best Practices and End of Year Performance Report, Fiscal
Year 2014, published June 2015.
WRF. Energy Efficiency in the Water Industry: a Compendium of Best Practices and Case
Studies. Web Report #4270. Prepared for the UK Water Industry Research Limited. 2010.
WRF. Energy Efficiency in the Water Industry: A Compendium of Best Practices and Case
Studies, Published by WRF for Global Water Research Coalition, Web Report #4270. March
2011.
White House (2015) "FACT SHEET: Increasing Investment in U.S. Roads, Ports and Drinking
Water Systems through Innovative Financing", The White House Press Release dated January
16, 2015. Downloaded February 2016: https://www.whitehouse.gov/the-press-
office/2015/01/16/fact-sheet-increasing-investment-us-roads-ports-and-drinking-water-syste
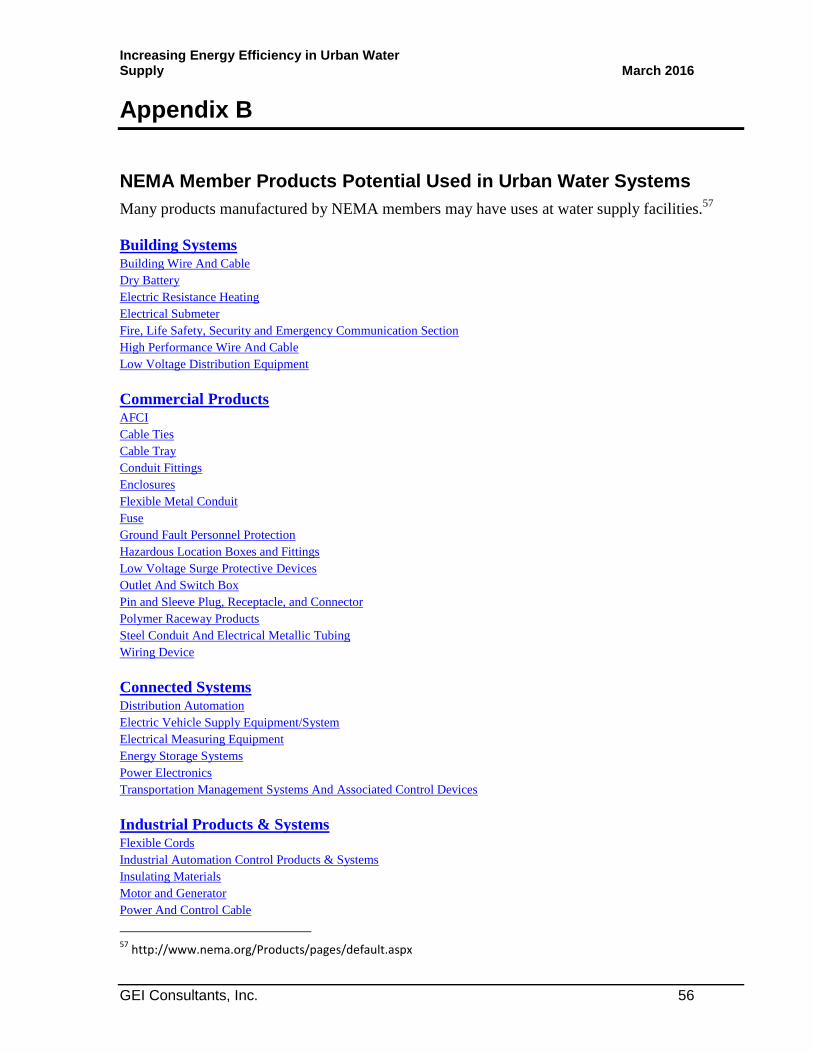
Increasing Energy Efficiency in Urban Water Supply March 2016
GEI Consultants, Inc. 56
Appendix B
NEMA Member Products Potential Used in Urban Water Systems
Many products manufactured by NEMA members may have uses at water supply facilities.57
Building Systems Building Wire And Cable
Dry Battery
Electric Resistance Heating
Electrical Submeter
Fire, Life Safety, Security and Emergency Communication Section
High Performance Wire And Cable
Low Voltage Distribution Equipment
Commercial Products AFCI
Cable Ties
Cable Tray
Conduit Fittings
Enclosures
Flexible Metal Conduit
Fuse
Ground Fault Personnel Protection
Hazardous Location Boxes and Fittings
Low Voltage Surge Protective Devices
Outlet And Switch Box
Pin and Sleeve Plug, Receptacle, and Connector
Polymer Raceway Products
Steel Conduit And Electrical Metallic Tubing
Wiring Device
Connected Systems Distribution Automation
Electric Vehicle Supply Equipment/System
Electrical Measuring Equipment
Energy Storage Systems
Power Electronics
Transportation Management Systems And Associated Control Devices
Industrial Products & Systems Flexible Cords
Industrial Automation Control Products & Systems
Insulating Materials
Motor and Generator
Power And Control Cable
57
http://www.nema.org/Products/pages/default.aspx
Increasing Energy Efficiency in Urban Water Supply March 2016
GEI Consultants, Inc. 57
Lighting Systems Ballast & Driver
Emergency Lighting
Light Source
Lighting Controls
Luminaire
Security Imaging and Communications
Utility Products Capacitor
Electrical Connector
High Voltage Insulator
Surge Arrester
Switchgear
Transformers

Increasing Energy Efficiency in Urban Water Supply March 2016
GEI Consultants, Inc. 58
Appendix C
Survey Participants
The following entities participated in the project survey:
San Francisco Public Utilities Commission, CA
City of Saint Petersburg Water Resources Department, FL
Tampa Bay Water, FL
City of Bozeman, MT
City of Phoenix Water Services Department, AZ
City of Sacramento, CA
Des Moines Water Works, IA
The Birmingham Water Works Board, AL
Austin Water, TX
Carmichael Water District, CA
Marin Municipal Water District, CA
Madison Water Utility, WI
Valencia Water Company, CA
Salt Lake City Department of Public Utilities, UT
Sun Valley Water & Sewer District, ID
Town of Bethlehem, NY
City of St. George Water Services Department, UT
South Central Connecticut Regional Water Authority, CT
City of Highland Park, IL
City of Corvallis, OR
Williamson Water Utilities, NY
City of Bremerton, WA
Calaveras County Water District, CA
Cobb County Water System, GA
City of Plano, TX
City of Elgin, IL
City of Savannah, GA
Town of Cary - Cary/Apex Water Treatment Facility, NC
City of Thorndale, TX
Utah State University, UT
South Florida Water Management District, FL
Hawaii Commission on Water Resource Management, HI
Raleigh Public Utilities, NC

Increasing Energy Efficiency in Urban Water Supply March 2016
GEI Consultants, Inc. 59
Elsinore Valley Municipal Water District, CA
Spanaway Water Company, WA
Glendale Water & Power, CA
Western Area Power Administration
Town of Silver City, NM
South Carolina Rural Water Association, SC
City of Griffin Public Works and Utilities, GA
Springfield Water and Wastewater Department, IL
City of Avondale, AZ
Crystal Systems, TX
City of Torrance Water Division, CA
City of Sugar Land, TX
Canadian Respondents
o City of Guelph
o York Region
o City of Calgary, Water Resources
o City of Saint John New Brunswick

Increasing Energy Efficiency in Urban Water Supply March 2016
GEI Consultants, Inc. 60
Appendix D
Background on Energy Saving Performance Contracts
This report is intended to address the question of whether energy savings performance contracts
might be a desirable means of attracting greater investment in energy-efficient electrical
equipment by water utilities. This analysis is based on a review of how the broader market is
performing and what contracting instruments and terms are used for these types of projects. The
report begins by reviewing the structure of these contracts, focusing on specific terms and risk
shared among the parties. The report goes through types of contractual arrangements, then the
financing mechanisms available. It concludes by comparing a set of model contracts for one
type, the guaranteed-savings contract. We then summarize the existing energy service
companies’ (ESCO) markets for energy savings performance projects, and the success of those
projects in forecasting and delivering savings.
Recently, regulators have pushed back on ESCO contracts terms as being too exorbitant.58
How
this might affect the municipal ESCO market is too early to determine.
D.1 Types of Contractual Agreements
Several types of contracts are used by ESCOs and their customers. The most common forms are
guaranteed-savings and shared savings contracts, both of which are based on the performance of
the project in delivering energy savings. Nonperformance-based contracts are also in use in the
U.S. where compensation to the ESCO is not tied to project performance but is rather agreed
upon ahead of time or “stipulated” along with the project scope. While this memo focuses on
performance-based contracting as a method of reducing risk to customers and facilitating large-
scale investments in energy efficiency, below is a description of the distinguishing characteristics
of each contract type.
Guaranteed-savings—Guaranteed-savings contracts are the most common type of ESCO
performance contract in the United States. Typically under a guaranteed-savings
agreement, the customer provides project financing either through its own resources, a
capital lease, or other form, discussed in more detail below.
Shared savings—Under this type of agreement, the ESCO typically secures project
financing in addition to implementing project development. The ESCO is liable for
repayment of upfront equipment purchases regardless of whether the project achieves
energy savings. In this way, the ESCO takes on the performance and financing risk of the
project. Because the ESCO takes on more risk under a shared savings agreement, such
agreements are not common.
58
http://www.utilitydive.com/news/ny-gov-cuomo-zero-tolerance-for-electric-service-companies-jacking-up-p/414511/

Increasing Energy Efficiency in Urban Water Supply March 2016
GEI Consultants, Inc. 61
No-guaranteed-savings—These contracts are non-performance-based; they are
essentially upfront purchase agreements.
Pay from savings—This contract type is a variation of the guaranteed-savings contract;
however, unlike a guaranteed-savings contract, project financing is typically provided by
the ESCO rather than the customer.
Chauffage—This becomes a building management or service provision arrangement
akin to types of full-service vendor agreements. The customer is entirely shielded from
energy costs to the extent that the ESCO vendor passes through those costs. Chauffage
contracts are common in Europe, but not in the United States.
Guaranteed-savings contracts are the most commonly used in the US, with shared savings
contracts and other agreements also making up a portion of the market. Figure D-1 shows the
breakdown of contract types for the private and public sector. In the 2014 Larsen sample of
ESCO contracts, guaranteed-savings arrangements made up 84 percent of performance-based
contracts in the public and institutional market sector.59
This is the market segment representing
most water utilities. Customers appear to prefer guaranteed-savings contracts because of the
certainty of savings and avoidance of project risk. ESCOs prefer guaranteed-savings contracts
because it relieves them of the financial risk; however, shared savings arrangements may be
preferred when the customer would be unable to finance the project itself.
Figure D-1 ESCO Contract Types
Evidence from the NAESCO database analysis suggests that projects that used performance
contracting had higher average costs ($2.3 million) than those using nonperformance-based
contracts ($1.6 million). Larsen suggests that performance-based contracts are typically used for
larger projects. Large projects may be required to compensate for upfront and administrative
costs of a performance contract.
59
PH Larsen, et al., “U.S. Energy Service Company Industry: Market Size and Project Performance from 1990 to 2008.” Lawrence Berkeley National Laboratory, Environmental Energy Technologies Division, 2014.
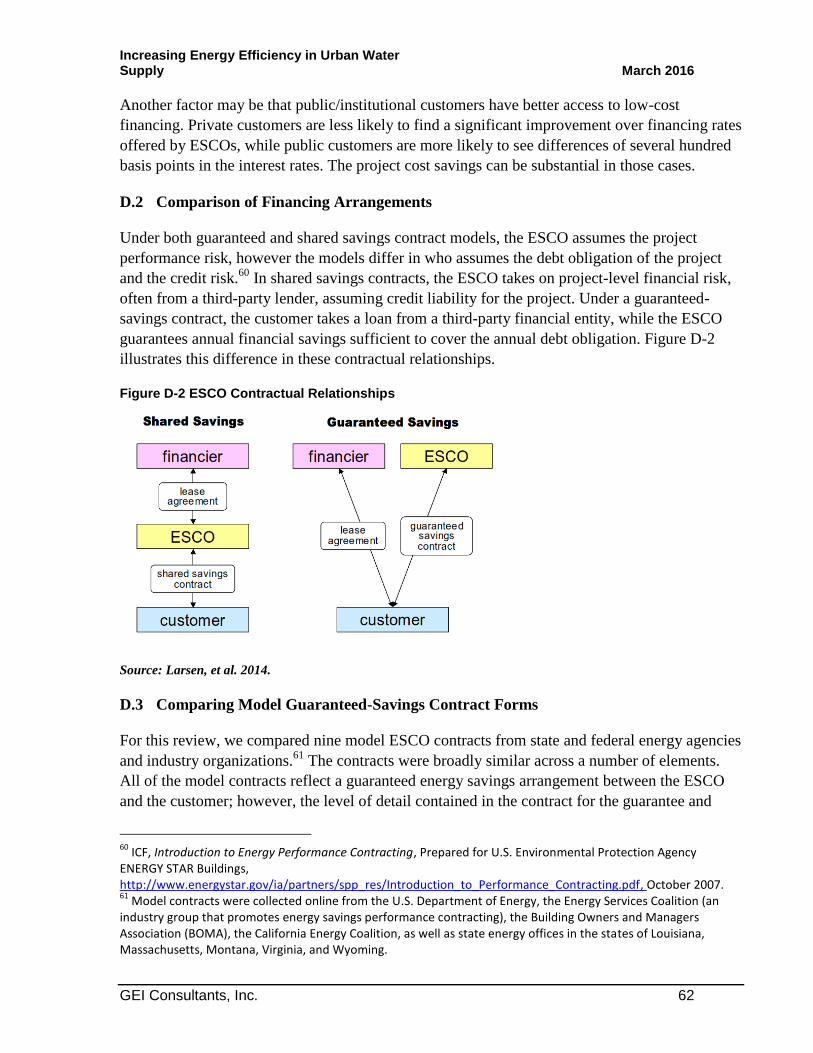
Increasing Energy Efficiency in Urban Water Supply March 2016
GEI Consultants, Inc. 62
Another factor may be that public/institutional customers have better access to low-cost
financing. Private customers are less likely to find a significant improvement over financing rates
offered by ESCOs, while public customers are more likely to see differences of several hundred
basis points in the interest rates. The project cost savings can be substantial in those cases.
D.2 Comparison of Financing Arrangements
Under both guaranteed and shared savings contract models, the ESCO assumes the project
performance risk, however the models differ in who assumes the debt obligation of the project
and the credit risk.60
In shared savings contracts, the ESCO takes on project-level financial risk,
often from a third-party lender, assuming credit liability for the project. Under a guaranteed-
savings contract, the customer takes a loan from a third-party financial entity, while the ESCO
guarantees annual financial savings sufficient to cover the annual debt obligation. Figure D-2
illustrates this difference in these contractual relationships.
Figure D-2 ESCO Contractual Relationships
Source: Larsen, et al. 2014.
D.3 Comparing Model Guaranteed-Savings Contract Forms
For this review, we compared nine model ESCO contracts from state and federal energy agencies
and industry organizations.61
The contracts were broadly similar across a number of elements.
All of the model contracts reflect a guaranteed energy savings arrangement between the ESCO
and the customer; however, the level of detail contained in the contract for the guarantee and
60
ICF, Introduction to Energy Performance Contracting, Prepared for U.S. Environmental Protection Agency ENERGY STAR Buildings, http://www.energystar.gov/ia/partners/spp_res/Introduction_to_Performance_Contracting.pdf, October 2007. 61
Model contracts were collected online from the U.S. Department of Energy, the Energy Services Coalition (an industry group that promotes energy savings performance contracting), the Building Owners and Managers Association (BOMA), the California Energy Coalition, as well as state energy offices in the states of Louisiana, Massachusetts, Montana, Virginia, and Wyoming.

Increasing Energy Efficiency in Urban Water Supply March 2016
GEI Consultants, Inc. 63
incentive structures and the monitoring and verification of project savings varies somewhat
across contracts.
D.3.1 Project Specifications and Performance Periods
Contracts outline the various phases of an ESCO contract and how important dates in the project
workflow are to be determined. During the energy audit phase the ESCO carries out a thorough
audit of the customer’s current buildings, equipment and energy use, and develops a detailed
proposal of the energy conservation measures that would be included in the project. The savings
guarantee period begins upon completion of project construction and signing of a certificate of
acceptance.
The performance period generally ranges between 10 and a maximum of 20 to 25 years in the
model contracts collected. According to the Goldman study of the ESCO market, states vary in
the maximum contract term they allow, with 34 states allowing maximum contract terms of 10
years or more in 2002.62
The histogram in Figure D-3 shows the number of states that allow
various maximum contract terms. The maximum contract term in a state affects the energy
saving strategy an ESCO can take. Large energy saving investments with a long payback period
may be appropriate in some but not all states.
The contract also specifies how baseline energy consumption and energy savings are to be
calculated and how measurement, verification and review are to be carried out. Baseline energy
use is typically calculated based on 36 months of billing data and should be adjusted for changes
in operation, occupancy or any other factors that impact energy consumption. Details of the
calculations are not generally included in the model contracts but should be included in any
actual contract.
62
Charles A. Goldman et al. 2002. Market trends in the US ESCO industry: Results from the NAESCO database project. Lawrence Berkeley National Laboratory. Unfortunately, we were unable to find any subsequent analysis on this particular topic.
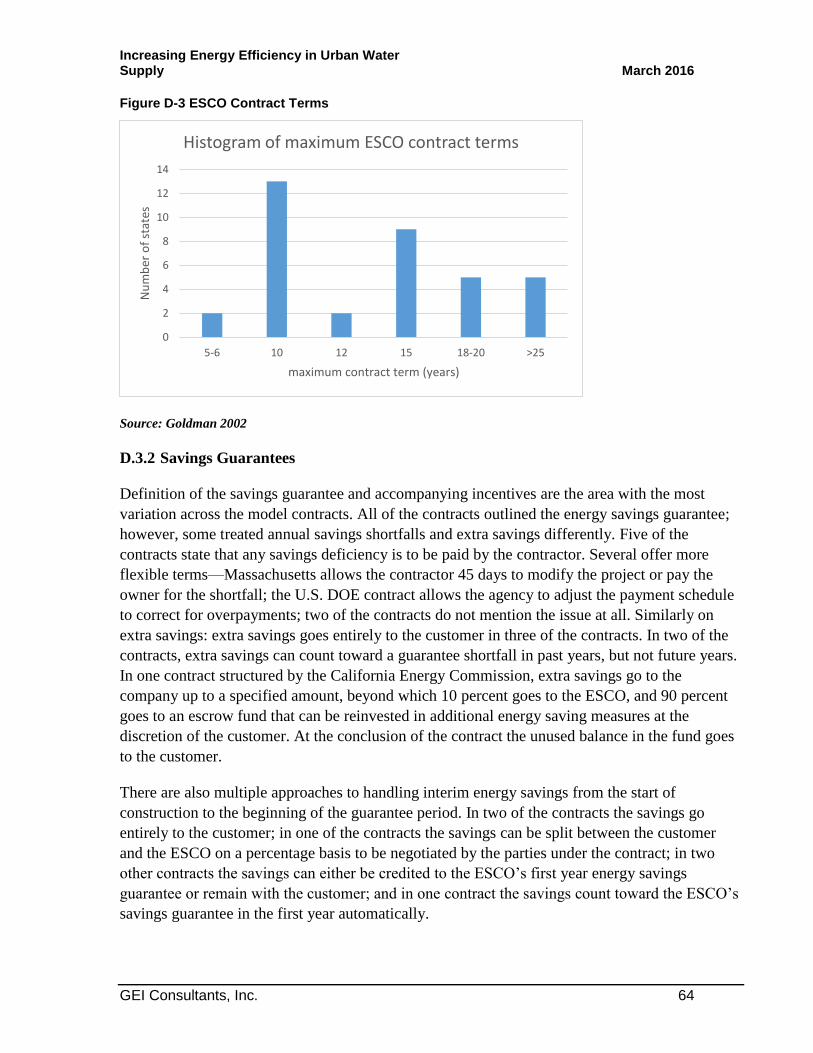
Increasing Energy Efficiency in Urban Water Supply March 2016
GEI Consultants, Inc. 64
Figure D-3 ESCO Contract Terms
Source: Goldman 2002
D.3.2 Savings Guarantees
Definition of the savings guarantee and accompanying incentives are the area with the most
variation across the model contracts. All of the contracts outlined the energy savings guarantee;
however, some treated annual savings shortfalls and extra savings differently. Five of the
contracts state that any savings deficiency is to be paid by the contractor. Several offer more
flexible terms—Massachusetts allows the contractor 45 days to modify the project or pay the
owner for the shortfall; the U.S. DOE contract allows the agency to adjust the payment schedule
to correct for overpayments; two of the contracts do not mention the issue at all. Similarly on
extra savings: extra savings goes entirely to the customer in three of the contracts. In two of the
contracts, extra savings can count toward a guarantee shortfall in past years, but not future years.
In one contract structured by the California Energy Commission, extra savings go to the
company up to a specified amount, beyond which 10 percent goes to the ESCO, and 90 percent
goes to an escrow fund that can be reinvested in additional energy saving measures at the
discretion of the customer. At the conclusion of the contract the unused balance in the fund goes
to the customer.
There are also multiple approaches to handling interim energy savings from the start of
construction to the beginning of the guarantee period. In two of the contracts the savings go
entirely to the customer; in one of the contracts the savings can be split between the customer
and the ESCO on a percentage basis to be negotiated by the parties under the contract; in two
other contracts the savings can either be credited to the ESCO’s first year energy savings
guarantee or remain with the customer; and in one contract the savings count toward the ESCO’s
savings guarantee in the first year automatically.
0
2
4
6
8
10
12
14
5-6 10 12 15 18-20 >25
Nu
mb
er o
f st
ates
maximum contract term (years)
Histogram of maximum ESCO contract terms

Increasing Energy Efficiency in Urban Water Supply March 2016
GEI Consultants, Inc. 65
D.4 Surveying the Existing ESCO Market and Metrics
ESCOs are active in nearly every state, activity concentrated in population centers and states that
have active and well-funded energy efficiency programs.63
The National Conference of State
Legislatures64
and the Oak Ridge National Laboratory65
have compiled the state statutes enabling
ESPCs. From 1990 to 2008, the five states of New York, California, Texas, Pennsylvania and
Maryland account for more than one-third of total market activity in the sample. New Jersey and
Massachusetts, states that have had well-developed efficiency programs also show substantial
ESCO market activity. Figure D-4 shows project activity from the NAESCO database by state
through 2008 along with ranking in terms of REEP budgets. States such as Missouri, Kansas and
Indiana, although not centers of population or economic activity, have energy offices that have
championed performance contracting in institutional sector markets.
Figure D-4 Project Activity by State
Source: Larsen, P.H. et al. 2014.
63
This strand of literature is based on a database compiled by the National Association of Energy Service Companies (NAESCO). NAESCO requests that its member ESCOs submit information on up to 50 energy efficiency projects completed in the previous 42 months as part of its voluntary accreditation process. Although this database is the best available source of empirical data on performance contracting, it is not perfect. The data may not necessarily be representative of all ESCO contracts, since the process includes some self-selection of projects. Large ESCOs that had more than 50 projects over the time period selected their own subset of projects to submit. In addition some project entries are missing data fields, which limits the sample for some analyses. See Larsen et al, (2014), and Goldman et al (2002). 64
http://www.ncsl.org/research/energy/state-energy-savings-performance-contracting.aspx 65
http://web.ornl.gov/info/esco/legislation/newesco.shtml
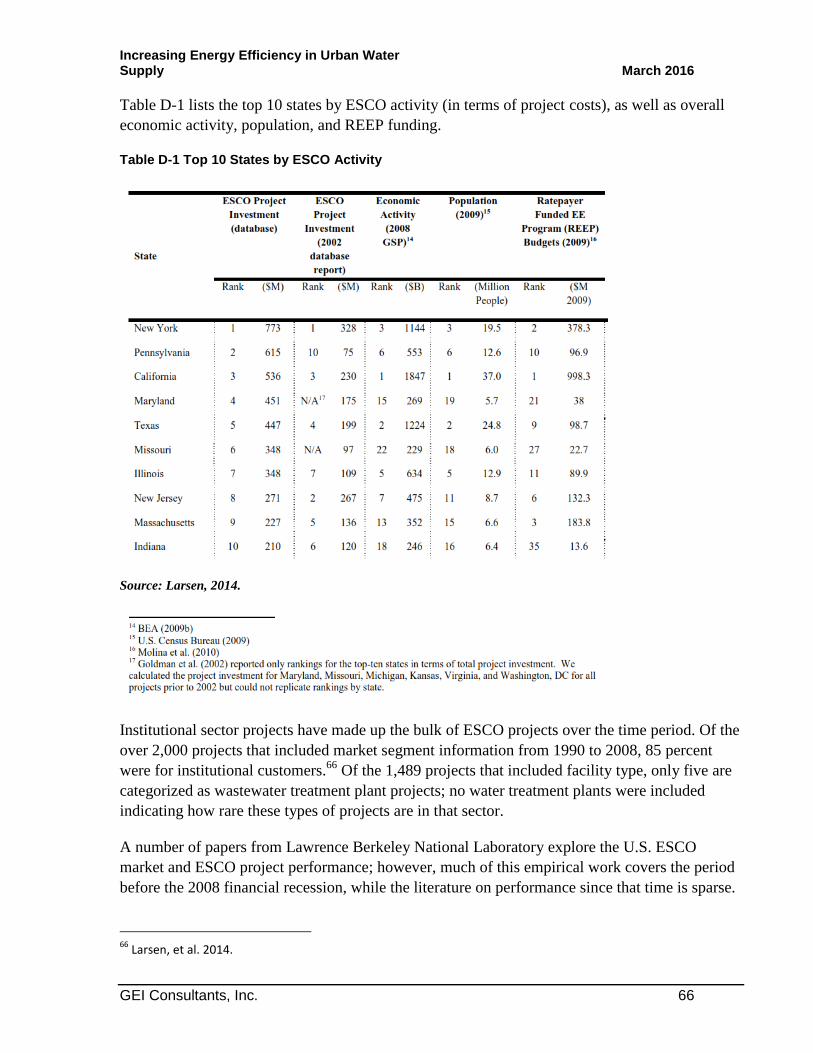
Increasing Energy Efficiency in Urban Water Supply March 2016
GEI Consultants, Inc. 66
Table D-1 lists the top 10 states by ESCO activity (in terms of project costs), as well as overall
economic activity, population, and REEP funding.
Table D-1 Top 10 States by ESCO Activity
Source: Larsen, 2014.
Institutional sector projects have made up the bulk of ESCO projects over the time period. Of the
over 2,000 projects that included market segment information from 1990 to 2008, 85 percent
were for institutional customers.66
Of the 1,489 projects that included facility type, only five are
categorized as wastewater treatment plant projects; no water treatment plants were included
indicating how rare these types of projects are in that sector.
A number of papers from Lawrence Berkeley National Laboratory explore the U.S. ESCO
market and ESCO project performance; however, much of this empirical work covers the period
before the 2008 financial recession, while the literature on performance since that time is sparse.
66
Larsen, et al. 2014.

Increasing Energy Efficiency in Urban Water Supply March 2016
GEI Consultants, Inc. 67
Of note is that market growth by 2008 had fallen below projections,67
and continued to perform
below expectations through 2011.68
LBNL estimated the remaining market potential as of 2013
was $71 to $133 billion, of which state and local agencies represented $10 to $16 billion. For
most ESCO in the survey, less than 10 percent of their projects relied on federal investment tax
credits, indicating that these type of projects have been relying largely on internally generated
positive returns on investment rather than external funding sources.
D.5 Summary of the Current Energy Savings Performance Market
ESCO contracts generally achieve a large amount of their target energy savings from reduced
electricity usage, with a focus on buildings and related structures. According to one study that
covers the period from 1990 to 2000, median energy savings were 15 thousand Btus (kBtu) per
square foot (sf).69
Reductions in electricity consumption made up the bulk of these savings,
accounting for 80 percent of the total energy savings. Savings vary by specific market segment.
Median energy savings range from 13-15 kBtu/sf for university/college, federal government and
private sector projects to 18-19 kBtu/sf for state/local government and health/hospital projects.70
Figure D-5 shows the number of projects that achieved varying levels of electricity savings. For
Lighting-Only projects covered in the 1990-2000 sample, the median electricity savings was 47
percent of the baseline use of the targeted equipment. For projects that employ both lighting and
non-lighting measures as part of their approach, median savings were 23 percent of the total
electricity baseline.
67
Andrew Satchell, et al, A Survey of the U.S. ESCO Industry: Market Growth and Development from 2008 to 2011, Lawrence Berkeley National Laboratory, Environmental Energy Technologies Division, http://www.naesco.org/data/industryreports/ESCO%20study.pdf, June 2010. 68
Elizabeth Stuart et al, “Current Size and Remaining Market Potential of U.S. ESCO Industry,” Lawrence Berkeley National Laboratory, Environmental Energy Technologies Division, https://emp.lbl.gov/sites/all/files/lbnl-6300e-ppt.pdf, September 2013. 69
Goldman et al 2002. 70
Ibid.
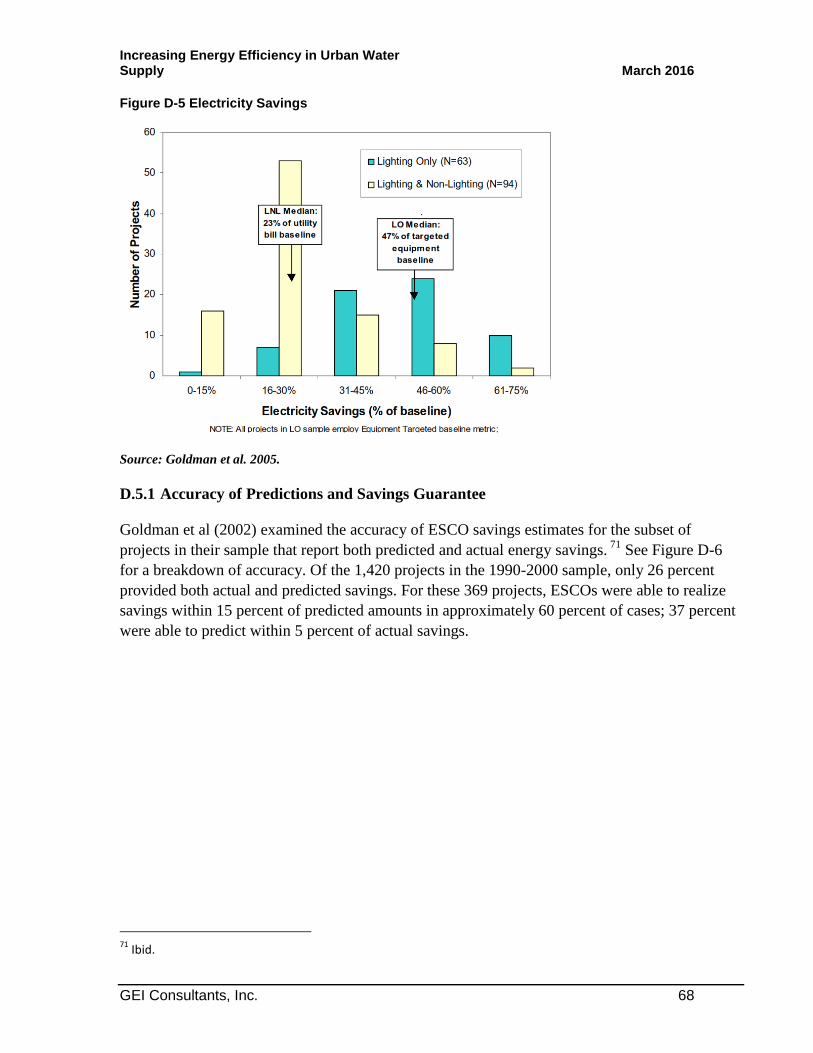
Increasing Energy Efficiency in Urban Water Supply March 2016
GEI Consultants, Inc. 68
Figure D-5 Electricity Savings
Source: Goldman et al. 2005.
D.5.1 Accuracy of Predictions and Savings Guarantee
Goldman et al (2002) examined the accuracy of ESCO savings estimates for the subset of
projects in their sample that report both predicted and actual energy savings. 71
See Figure D-6
for a breakdown of accuracy. Of the 1,420 projects in the 1990-2000 sample, only 26 percent
provided both actual and predicted savings. For these 369 projects, ESCOs were able to realize
savings within 15 percent of predicted amounts in approximately 60 percent of cases; 37 percent
were able to predict within 5 percent of actual savings.
71
Ibid.

Increasing Energy Efficiency in Urban Water Supply March 2016
GEI Consultants, Inc. 69
Figure D-6 Accuracy of ESCP Saving Predictions
Figure 6 also shows the breakdown of predicted versus actual savings. From 1990 to 2000, 13
percent of projects stipulated savings for all installed measures (stipulated savings means
assuming a savings amount based on assumed energy consumption rates and average usage data,
without requiring measurement and verification of that amount). Out of the remaining projects
that undergo a measurement and verification process to determine energy savings (a total of 314
projects), 57 percent had actual energy savings that exceeded predicted savings. For the entire
period from 1990 to 2008, 85 percent of the subset of projects for public and institutional
customers had savings that met or exceeded the guarantee.72
The majority of ESCO contracts are guaranteed-savings contracts. Some of the papers examine
the relationship between the amount of savings predicted by the ESCO and the amount
guaranteed by the ESCO. Only 15 companies provided information on both predicted and
guaranteed-savings; however, for this small sample size, seven guaranteed 100 percent of
predicted savings, six guaranteed an amount between 50 percent and 100 percent of predicted
savings, and two guaranteed less than 50 percent of predicted savings.73
D.5.2 Other Indicators of Effectiveness
Goldman et al calculate three different measures of project effectiveness or economic value from
the customer’s perspective—project net benefits, a benefit/cost ratio, and simple payback time.
These calculations do not include financial incentives from ratepayer-funded energy efficiency
programs (REEP). These are incentives provided by local utilities that are often passed on in full
or in part to customers to reduce the cost of the project. Approximately 30 percent of projects in
72
Larsen et al. 2014. 73
Goldman, C.A., et al. 2002.
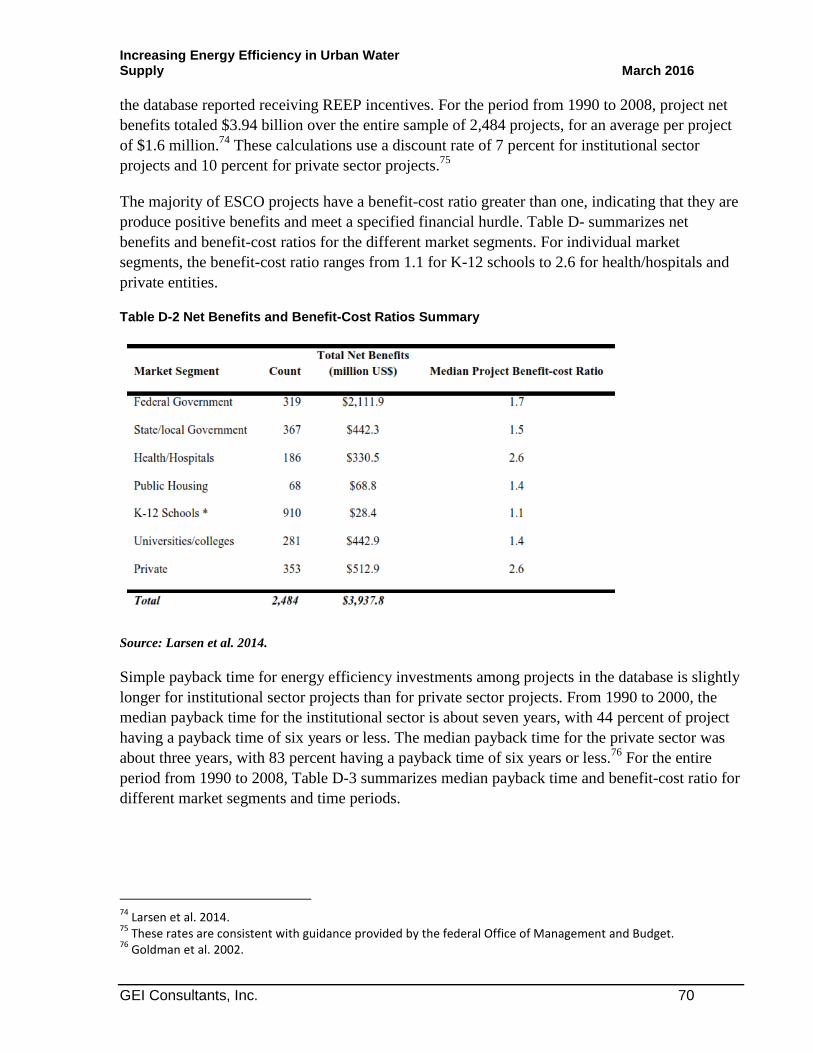
Increasing Energy Efficiency in Urban Water Supply March 2016
GEI Consultants, Inc. 70
the database reported receiving REEP incentives. For the period from 1990 to 2008, project net
benefits totaled $3.94 billion over the entire sample of 2,484 projects, for an average per project
of $1.6 million.74
These calculations use a discount rate of 7 percent for institutional sector
projects and 10 percent for private sector projects.75
The majority of ESCO projects have a benefit-cost ratio greater than one, indicating that they are
produce positive benefits and meet a specified financial hurdle. Table D- summarizes net
benefits and benefit-cost ratios for the different market segments. For individual market
segments, the benefit-cost ratio ranges from 1.1 for K-12 schools to 2.6 for health/hospitals and
private entities.
Table D-2 Net Benefits and Benefit-Cost Ratios Summary
Source: Larsen et al. 2014.
Simple payback time for energy efficiency investments among projects in the database is slightly
longer for institutional sector projects than for private sector projects. From 1990 to 2000, the
median payback time for the institutional sector is about seven years, with 44 percent of project
having a payback time of six years or less. The median payback time for the private sector was
about three years, with 83 percent having a payback time of six years or less.76
For the entire
period from 1990 to 2008, Table D-3 summarizes median payback time and benefit-cost ratio for
different market segments and time periods.
74
Larsen et al. 2014. 75
These rates are consistent with guidance provided by the federal Office of Management and Budget. 76
Goldman et al. 2002.

Increasing Energy Efficiency in Urban Water Supply March 2016
GEI Consultants, Inc. 71
Table D-3 Median Payback Time and Benefit-cost Ratio Summary
Source: Larsen et al. 2014.
D.6 Types of ESCO Contracts
Guaranteed-savings—The ESCO guarantees a specific amount of energy savings. Using
pre-defined assumptions about serving utility tariff rates the ESCO sets the guarantee so
that the energy savings created by a project will cover the cost of project financing for the
life of the project, typically 10 to 20 years. If savings are less than the guaranteed
amount, the ESCO agrees to pay the shortfall amount, thereby mitigating the financial
risk for the customer. Savings in excess of the guaranteed amount are retained by the
customer. After the guaranteed-savings period, the building owner retains the full value
of the energy savings and assumes ownership of the equipment. Guaranteed-savings
contracts are the most common type of ESCO performance contract in the United States.
Typically under a guaranteed-savings agreement, the customer provides project financing
either through its own resources, a capital lease, or other form, discussed in more detail
below.
Shared savings—In a shared savings agreement project savings are divided at an agreed
upon percentage between the customer and the ESCO. The ESCO only receives payment
from the customer if there are positive energy savings during a given period. Under this
type of agreement, the ESCO typically secures project financing in addition to
implementing project development. The ESCO is liable for repayment of upfront
equipment purchases regardless of whether the project achieves energy savings. In this
way, the ESCO takes on the performance and financing risk of the project. In general, the
Increasing Energy Efficiency in Urban Water Supply March 2016
GEI Consultants, Inc. 72
ESCO receives a higher proportion of project savings in early years to cover project
financing, often ramping down over the course of the project. Because the ESCO takes on
more risk under a shared savings agreement, such agreements are not common.
No-guaranteed-savings—In a no-guaranteed-savings contract the ESCO provides the
energy audit, design and construction of an energy savings project, but does not
guarantee the energy savings. The customer assumes full responsibility for both the
performance risk and the financial risk of the project. The customer provides project
financing, though financing can be linked to projected savings from the project. These
contracts are non-performance-based; they are essentially upfront purchase agreements.
Pay from savings—This contract type is a variation of the guaranteed-savings contract,
in which the payment schedule is tied to the level of savings. With higher levels of
savings project costs can be repaid more quickly; however, unlike a guaranteed-savings
contract, project financing is typically provided by the ESCO rather than the customer.
Chauffage—In a chauffage contract, the performance contractor assumes operation of
the building or facility, making energy savings upgrades and also taking over payment of
utility bills. This becomes a building management or service provision arrangement akin
to types of full-service vendor agreements. The customer is entirely shielded from energy
costs to the extent that the ESCO vendor passes through those costs. Chauffage contracts
are common in Europe, but not in the United States.
Increasing Energy Efficiency in Urban Water Supply March 2016
GEI Consultants, Inc. 73
Appendix E
Acronyms and Abbreviations
ACWA Association of California Water Agencies
AF Acre Foot
AFY Acre Foot per Year
AIEE American Institute of Electrical Engineers
APPA American Public Power Association
AWE Alliance for Water Efficiency
AWWA American Water Works Association
bgs Below ground surface
CEC California Energy Commission
cfs Cubic feet per second
CPUC California Public Utilities Commission
CUWCC California Urban Water Conservation Council
CWA Clean Water Act
DDW California State Water Board Division of Drinking Water
DWR California Department of Water Resources
EC Electrical conductivity
EPRI Electric Power Research Institute
ESCO Energy Service Companies
ESPC Energy Savings Performance Contracts
GEI GEI Consultants, Inc.
gpm Gallons per minute
GWh gigawatt-hours
HI Hydraulic Institute
hp horsepower
HVAC Heating, Ventilating, and Air Conditioning
IEEE Institute of Electrical and Electronics Engineers, Inc.
kW kilowatt
Increasing Energy Efficiency in Urban Water Supply March 2016
GEI Consultants, Inc. 74
kWh kilowatt-hour
MCL Maximum contaminant level
mg/l Milligrams per liter
Mgal Million gallons
Mgal/day Million gallons per day
MW megawatt
MWh megawatt-hour
NAESCO National Association of Energy Service Companies
NASEO National Association of State Energy Officials
NEMA National Electric Manufacturers Association
NYSERDA New York State Energy Research and Development Authority
O&M Operations and maintenance
RFP Request for Proposal
SWRCB State Water Resources Control Board
TAF Total acre feet
USBR U.S. Bureau of Reclamation
US DOC U. S. Department of Commerce
US DOE U. S. Department of Energy
US EPA United States Environmental Protection Agency
WERF Water Environment Research Foundation
WRF Water Research Foundation

Increasing Energy Efficiency in Urban Water Supply March 2016
GEI Consultants, Inc. 75
Appendix F
Glossary of Terms
NOTE: This Glossary of Terms includes terms used in the definitions of terms and references
used within this report for the convenience of the reader.
Acre-foot
A volume of water that covers one acre to a depth of one foot, or 43,560 cubic feet (1,233.5
cubic meters) or 325,851 gallons.
Advanced Metering Infrastructure (AMI)
Refers to a system that measures, collects, and analyzes energy usage while interacting with
advanced devices such as water meters through various communication media, either on demand
or on predefined schedules. This infrastructure includes hardware, software, communications,
consumer energy displays and controllers, customer associated systems, meter data management
software, and supplier and network distribution systems.
Aeration
The process of adding air to water. Air can be added to water by either passing air through water
or passing water through air through mechanical processes.
Air Blower
A device used to ventilate [portions of a system such as] manholes and lift stations.
Air Lift Pump
A special type of pump consisting of a vertical riser pipe submerged in the wastewater or sludge
to be pumped. Compressed air is injected into a tail piece at the bottom of the pipe. Fine air
bubbles mix with the wastewater or sludge to form a mixture lighter than the surrounding water,
which causes the mixture to rise in the discharge pipe to the outlet.
Air Padding
Pumping dry air (dew point –40°F (–40°C)) into a container to assist with the withdrawal of a
liquid or to force a liquefied gas such as chlorine or sulfur dioxide out of a container.
Alternating Current (AC)
An electric current that reverses its direction (positive/negative values) at regular intervals.
Altitude Valve
Increasing Energy Efficiency in Urban Water Supply March 2016
GEI Consultants, Inc. 76
A valve that automatically shuts off the flow into an elevated tank when the water level in the
tank reaches a predetermined level. The valve automatically opens when the pressure in the
distribution system drops below the pressure in the tank.
Analyzer
A device that conducts a periodic or continuous measurement of turbidity or some factor such as
chlorine or fluoride concentration. Analyzers operate by any of several methods including
photocells, conductivity, or complex instrumentation.
Aquifer
A natural, underground layer of porous, water-bearing materials (sand, gravel) usually capable of
yielding a large amount or supply of water.
Asset Management
The process of maintaining the functionality and value of a utility's assets through repair,
rehabilitation, and replacement. Examples of utility assets include buildings, tools, equipment,
pipes, and machinery used to operate a water or wastewater system. The primary goal of asset
management is to provide safe, reliable, and cost-effective service to a community over the
useful life of a utility's assets.
Audit, Water
A thorough examination of the accuracy of water agency records or accounts (volumes of water)
and system control equipment. Water managers can use audits to determine their water
distribution system efficiency. The overall goal is to identify and verify water and revenue losses
in a water system.
Average Demand
The total demand for water during a period of time divided by the number of days in that time
period [such as a day to obtain the average daily demand].
Back Pressure
A pressure that can cause water to backflow into the water supply when a user's water system is
at a higher pressure than the public water system.
Backflow
A reverse flow condition, created by a difference in water pressures, that causes water to flow
back into the distribution pipes of a potable water supply from any source or sources other than
an intended source.
Benchmarking
A process an agency uses to gather and compare information about the productivity and
performance of other similar agencies with its own information. The purpose of benchmarking is

Increasing Energy Efficiency in Urban Water Supply March 2016
GEI Consultants, Inc. 77
to identify best practices, set improvement targets, and measure progress. The benchmark is a
standard or point of reference used to judge or measure quality or value.
Best Available Technology (BAT)
BAT is based on the very best (state-of-the-art) control and treatment measures that have been
developed, or are capable of being developed, and that are economically achievable within the
appropriate industrial category.
Best Practicable Technology (BPT)
A level of technology represented by the average of the best existing performance levels within
the industrial category.
Capital Improvement Plan (CIP)
A detailed plan that identifies requirements for the repair, replacement, and rehabilitation of
facility infrastructure over an extended period, often 20 years or more. A utility usually updates
or prepares this plan annually. For water systems, the plan is often a part of a master plan that
combines water demand projections with supply alternatives and facility requirements. For
wastewater systems, the plan consists of programs and projects to upgrade and rehabilitate
wastewater collection and treatment systems and increase their capacity to allow for future
growth.
Commissioning
The procedures used by a utility agency to inspect, test, train staff, start up, operate, and
ultimately accept a new facility.
Conduit
Any artificial or natural duct, either open or closed, for carrying fluids from one point to another.
An electrical conduit carries electricity.
Consumptive Use
That part of water withdrawn that is evaporated, transpired by plants, incorporated into products
or crops, consumed by humans or livestock, or otherwise removed from the immediate water
environment. Also referred to as water consumed.
Control System
An instrumentation system that senses and controls its own operation on a close, continuous
basis in what is called proportional (or modulating) control.
Controller
A device that controls the starting, stopping, or operation of a device or piece of equipment.

Increasing Energy Efficiency in Urban Water Supply March 2016
GEI Consultants, Inc. 78
Conveyance Loss
Water that is lost in transit from a pipe, canal, or ditch by leakage or evaporation. Generally, the
water is not available for further use; however, leakage from an irrigation ditch, for example,
may percolate to a ground-water source and be available for further use.
Cubic Feet per Second (cfs)
A rate of the flow, in streams and rivers, for example. It is equal to a volume of water one foot
high and one foot wide flowing a distance of one foot in one second. One "cfs" is equal to 7.48
gallons of water flowing each second. As an example, if your car's gas tank is 2 feet by 1 foot by
1 foot (2 cubic feet), then gas flowing at a rate of 1 cubic foot/second would fill the tank in two
seconds.
Current
A movement or flow of electricity. Electric current is measured by the number of coulombs per
second flowing past a certain point in a conductor. A coulomb is equal to about 6.25 x 10¹⁸
electrons (6,250,000,000,000,000,000 electrons). A flow of one coulomb per second is called
one ampere, the unit of the rate of flow of current.
Cycle
A complete alternation of voltage or current in an alternating current (AC) circuit.
Debt Service
The amount of money required annually to pay the (1) interest on outstanding debts or (2) funds
due on a maturing bonded debt or the redemption of bonds.
Desalinization
The removal of dissolved salts (such as sodium chloride, NaCl) from water by natural means
(leaching) or by specific water treatment processes.
Direct Current (DC)
Electric current flowing in one direction only and essentially free from pulsation.
Distributed Control System
A computer control system having multiple microprocessors to distribute the functions
performing process control, thereby distributing the risk from component failure. The distributed
components (input/output devices, control devices, and operator interface devices) are all
connected by communications links and permit the transmission of control, measurement, and
operating information to and from many locations.
Domestic Water Use
Water used for household purposes, such as drinking; food preparation; bathing; washing
clothes, dishes, and dogs; flushing toilets; and watering lawns and gardens. About 85 percent of
Increasing Energy Efficiency in Urban Water Supply March 2016
GEI Consultants, Inc. 79
domestic water is delivered to homes by a public-supply facility, such as a county water
department. About 15 percent of the nation's population supply their own water, mainly from
wells.
Drawdown
1. The drop in the water table or level of water in the ground when water is being pumped from a
well.
2. The amount of water used from a tank or reservoir.
3. The drop in the water level of a tank or reservoir.
Electric Current
The flow of electric charges.
Electricity
Physical conditions associated with the presence and flow of electric charges.
Energy Savings Performance Contracts
ESPCs are a financing mechanism used by Energy Service Companies (ESCO) to make energy
efficiency upgrades to facilities on behalf of the owner which are then paid for using money
resulting from the energy savings. For more information see: http://energy.gov/eere/slsc/energy-
savings-performance-contracting.
Enterprise Fund Reserves
Enterprise fund reserves typically serve two purposes: 1) funding unanticipated or emergency
repairs to utility infrastructure (e.g., water main breaks, pump failures, etc.) and 2) making up for
revenue shortfalls due to variations in utility usage (e.g., lower water usage during drought
conditions) that provides a financial buffer avoiding the need to continually adjust rates to
account for usage variations. The minimum level of reserves relative to investments and
operations costs is often defined in the debt covenants with the lender.
Equity
The value of an investment in a facility.
Evaporation
The process by which water or other liquid becomes a gas (such as water vapor or ammonia
vapor).
Feasible
Capable of being accomplished in a successful manner within a reasonable period of time, taking
into account economic, environmental, legal, social and technological factors (California Water
Code Section 8307).
Feedback
Increasing Energy Efficiency in Urban Water Supply March 2016
GEI Consultants, Inc. 80
The circulating action between a sensor measuring a process variable and the controller that
controls or adjusts the process variable.
Fixed Costs
Costs (rent, insurance, interest) that a utility must cover or pay even if there is no demand for
water or no water to sell to customers.
Flow
The continuous movement of a liquid from one place to another.
Freshwater
Water that contains less than 1,000 milligrams per liter (mg/L) of dissolved solids; generally,
more than 500 mg/L of dissolved solids is undesirable for drinking and many industrial uses.
Fuse
A protective device having a strip or wire of fusible metal that, when placed in a circuit, will
melt and break the electric circuit if heated too much. High temperatures will develop in the fuse
when a current flows through the fuse in excess of that which the circuit will carry safely.
Gauge
A device for checking or measuring a particular dimension of something, using specific
standardized units. For example, a gauge might measure the elevation of a water surface, the
velocity of flowing water, the pressure of water, the amount or intensity of precipitation, or the
depth of snowfall. Gauges also are used to determine the location or position of equipment
during installation and after operation.
Gravity Flow
Water or wastewater flowing from a higher elevation to a lower elevation due to the force of
gravity. The water does not flow due to energy provided by a pump. Wherever possible,
wastewater collection systems are designed to use the force of gravity to carry waste liquids and
solids.
Greywater
Wastewater from clothes washing machines, showers, bathtubs, hand washing, lavatories and
sinks.
Ground
An expression representing an electrical connection to earth or a large conductor that is at the
earth's potential or neutral voltage.
Groundwater
Increasing Energy Efficiency in Urban Water Supply March 2016
GEI Consultants, Inc. 81
Subsurface water in the saturation zone from which wells and springs are fed. In a strict sense the
term applies only to water below the water table.
Groundwater Depth
The distance of the groundwater table below the surface at any selected location.
Groundwater Recharge
The natural or intentional infiltration of surface water into the zone (ground) of saturation.
Groundwater Table
The average depth or elevation of the groundwater over a selected area.
Head
The vertical distance, height, or energy of water above a reference point. A head of water may be
measured in either height (feet or meters) or pressure (pounds per square inch or kilograms per
square centimeter).
Head Loss
The head, pressure, or energy (they are the same) lost by water flowing in a pipe or channel as a
result of turbulence caused by the velocity of the flowing water and the roughness of the pipe,
channel walls, or restrictions caused by fittings. Water flowing in a pipe loses head, pressure, or
energy as a result of friction. Also called FRICTION LOSS.
Headworks
The facilities where wastewater enters a wastewater treatment plant. The headworks may consist
of bar racks or bar screens, comminutors, a wet well, and pumps.
Hectare
A metric unit equal to 2.471 acres or a 10,000 square meters
Hertz (Hz)
The number of complete electromagnetic cycles or waves in one second of an electric or
electronic circuit. Also called the frequency of the current.
Hydraulic Gradient
The slope of the hydraulic grade line. This is the slope of the water surface in an open channel,
the slope of the water surface of the groundwater table, or the slope of the water pressure for
pipes under pressure.
Influent
Water or other liquid—raw (untreated) or partially treated—flowing INTO a reservoir, basin,
treatment process, or treatment plant.

Increasing Energy Efficiency in Urban Water Supply March 2016
GEI Consultants, Inc. 82
Injection Well
A well-constructed for the purpose of injecting water (including treated wastewater) directly into
the ground. Water is generally forced (pumped) into the well for dispersal or storage into a
designated aquifer.
Input Horsepower
The total power used in operating a pump and motor.
Interceptor
A septic tank or other holding tank that serves as a temporary wastewater storage reservoir for a
septic tank effluent pump (STEP) system.
Irrigation
The controlled application of water for agricultural purposes through manmade systems to
supply water requirements not satisfied by rainfall.
Kinetic Energy
Energy possessed by a moving body of matter, such as water, as a result of its motion.
Life-Cycle Costing
An economic analysis procedure that considers the total costs associated with a sewer during its
economic life, including development, construction, and operation and maintenance (includes
chemical and energy costs). All costs are converted to a present worth or present cost in dollars.
Lift Station
In water systems, a series of pumps and valves that lifts water (or wastewater) to a higher
elevation. Lift stations may be equipped with air-operated ejectors or centrifugal pumps.
Sometimes called a pump station.
Mechanical Aeration
The use of machinery to mix air and water so that oxygen can be absorbed into the water. Some
examples are paddle wheels, mixers, or rotating brushes to agitate the surface of an aeration tank;
pumps to create fountains; and pumps to discharge water down a series of steps forming falls or
cascades.
Metered
Measured through a meter, as a quantity of water or flow might be measured.
Increasing Energy Efficiency in Urban Water Supply March 2016
GEI Consultants, Inc. 83
Million Gallons
A unit of measurement used in wastewater treatment plant design and collection system
capacities or performances. One million gallons of water is approximately equivalent to these
units of measurement:
13,690 Cubic Feet
3.07 Acre-Feet
8,340,000 Pounds of Weight
4,170 Tons of Weight
3,785 Cubic Meters
Motor Efficiency
The ratio of energy delivered by a motor to the energy supplied to it during a fixed period or
cycle. Motor efficiency ratings will vary depending on motor manufacturer and usually will be
near 90.0 percent.
Nameplate
A durable, metal plate found on equipment that lists critical installation and operating conditions
for the equipment.
Operating Pressure Differential
The operating pressure range for a hydropneumatic system. For example, when the pressure
drops below 40 psi in a system designed to operate between 40 psi and 60 psi, the pump will
come on and stay on until the pressure builds up to 60 psi. When the pressure reaches 60 psi the
pump will shut off. The operating pressure differential in this example is 20 psi.
Operation and Maintenance
Efforts that must be expended to keep facilities in good working order and condition so they
continue to perform as designed; poorly maintained facilities tend to be more vulnerable to
failure.
Outfall
1. The point, location, or structure where wastewater or drainage discharges from a sewer, drain,
or other conduit.
2. The conduit leading to the final discharge point or area. Also see OUTFALL SEWER.
Overall Pump Efficiency
The combined efficiency of a pump and motor together. Also called the wire-to-water efficiency.
Overdraft
The pumping of water from a groundwater basin or aquifer in excess of the supply flowing into
the basin. This pumping results in a depletion or mining of the groundwater in the basin.
Peak Demand

Increasing Energy Efficiency in Urban Water Supply March 2016
GEI Consultants, Inc. 84
The maximum momentary load placed on a water treatment plant, pumping station, or
distribution system. This demand is usually the maximum average load in one hour or less, but
may be specified as the instantaneous load or the load during some other short time period.
Potable Water
Water of a quality suitable for drinking.
Raw Water
1. Water in its natural state, prior to any treatment.
2. Water entering the first treatment process of a water treatment plant.
Reclaimed Wastewater
Treated wastewater that can be used for beneficial purposes, such as irrigation and industrial
processes that do not require potable water.
Recycled Water
Water that is used more than one time before it passes back into the natural hydrologic system.
Representative Sample
A subset (sample) of a population that reflects the entire population, such as portion of material,
water, or wastestream that is as nearly identical in content and consistency as possible to that in
the larger body being sampled.
Reservoir
A pond, lake, or basin, either natural or artificial, for the storage, regulation, and control of
water.
Reuse
The use of water or wastewater after it has been discharged and then withdrawn by another user.
Also see RECYCLE.
Reverse Osmosis (RO)
The application of pressure to a concentrated solution, which causes the passage of a liquid from
the concentrated solution to a weaker solution across a semipermeable membrane. The
membrane allows the passage of the water (solvent) but not the dissolved solids (solutes). In the
reverse osmosis process, two liquids are produced: (1) the reject (containing high concentrations
of dissolved solids), and (2) the permeate (containing low concentrations). The clean water
(permeate) is not always considered to be demineralized. Also see OSMOSIS.
SCADA System
Supervisory Control and Data Acquisition system. A computer-monitored alarm, response,
control, and data acquisition system used to monitor and adjust treatment processes and facilities.

Increasing Energy Efficiency in Urban Water Supply March 2016
GEI Consultants, Inc. 85
Sensor
A device that measures (senses) a physical condition or variable of interest. Floats and
thermocouples are examples of sensors. Also called a primary element.
Surface Water
Water that is on the Earth's surface, such as in a stream, river, lake, or reservoir.
Telemetering Equipment
Equipment that translates physical measurements into electrical impulses that are transmitted to
dials or recorders.
Telemetry
The electrical link between a field transmitter and the receiver. Telephone lines are commonly
used to serve as the electrical line.
Temperature Sensor
A device that opens and closes a switch in response to changes in the temperature. This device
might be a metal contact, or a thermocouple that generates a minute electric current proportional
to the difference in heat, or a variable resistor whose value changes in response to changes in
temperature. Also called a heat sensor.
Tertiary Treatment
Any process of water renovation that upgrades treated wastewater to meet specific reuse
requirements. May include general cleanup of water or removal of specific parts of wastes
insufficiently removed by conventional treatment processes. Typical processes include chemical
treatment and pressure filtration. Also called advanced waste treatment.
Ultraviolet (UV)
Pertaining to a band of electromagnetic radiation just beyond the visible light spectrum.
Ultraviolet radiation is used to disinfect water and wastewater. When ultraviolet radiation is
absorbed by the cells of microorganisms, it damages the genetic material in such a way that the
organisms are no longer able to grow or reproduce, thus ultimately killing them.
Upstream
The direction against the flow of water; or, toward or in the higher part of a sewer or collection
system.
Urban Area
A location characterized by high human population and human-built features; these areas can be
cities or towns.

Increasing Energy Efficiency in Urban Water Supply March 2016
GEI Consultants, Inc. 86
Urban Water Supply System
A water system designed and operated to supply the domestic supply needs of a city or town.
This water is withdrawn from a source, treated to appropriate standards and then provided for
domestic, commercial, thermoelectric power, industrial, and public water users.
Variable Costs
Costs that a utility must cover or pay that are directly associated with the actual production and
delivery of service. These costs vary or fluctuate.
Variable Frequency Drive
A control system that allows the frequency of the current applied to a motor to be varied. The
motor is connected to a low-frequency source while standing still; the frequency is then
increased gradually until the motor and pump (or other driven machine) are operating at the
desired speed.
Vault
A small, box-like structure that contains valves used to regulate flows.
Voltage
The electrical pressure available to cause a flow of current (amperage) when an electric circuit is
closed. Also called electromotive force (EMF).
Wastewater
A community's used water and water-carried solids (including used water from industrial
processes) that flow to a treatment plant. Stormwater, surface water, and groundwater infiltration
also may be included in the wastewater that enters a wastewater treatment plant. The term
sewage usually refers to household wastes, but this word is being replaced by the term
wastewater.
Wastewater Facilities
The pipes, conduits, structures, equipment, and processes required to collect, convey, and treat
domestic and industrial wastes, and discharge or reuse of the effluent and sludge.
Water Cycle
The process of evaporation of water into the air and its return to earth by precipitation (rain or
snow). This process also includes transpiration from plants, groundwater movement, and runoff
into rivers, streams, and the ocean. Also called the hydrologic cycle.
Water Supplier
An agency, utility or person that supplies water (usually potable water) to a customer.
Increasing Energy Efficiency in Urban Water Supply March 2016
GEI Consultants, Inc. 87
Watt
A unit of power equal to one joule per second. The power of a current of one ampere flowing
across a potential difference of one volt.
Well (water)
An artificial excavation put down by any method for the purposes of withdrawing water from the
underground aquifers. A bored, drilled, or driven shaft, or a dug hole whose depth is greater than
the largest surface dimension the purpose of which is to reach underground water supplies or to
store or bury fluids below ground.
Wire-to-Water Efficiency
The combined efficiency of a pump and motor together. Also called the overall efficiency.
Yield (also called Safe Yield)
The quantity of water (expressed as a rate of flow—GPM, GPH, GPD, cu m/day, ML/day, or
total quantity per year) that can be collected for a given use from surface or groundwater sources.
The yield may vary with the use proposed, with the plan of development, and also with economic
considerations.