nepalese journal of agricultural sciences
TRANSCRIPT
Nepalese Journal of Agricultural Sciences, 2021, volume 21 ISSN 2091-042X; eISSN 2091-0428
0
ISSN 2091-042X
ONLINE ISSN 2091-0428
Himalayan College of Agricultural Sciences and Technology
(HICAST) Purbanchal University affiliate
Kalanki, Kirtipur 1, Kathmandu, Nepal
ISSN 2091-042X
ONLINE ISSN 2091-0428
NEPALESE JOURNAL OF
AGRICULTURAL SCIENCES 2021, volume 21
Nepalese Journal of Agricultural Sciences, 2021, volume 21 ISSN 2091-042X; eISSN 2091-0428
1
ISSN 2091-042X
ONLINE ISSN 2091-0428
NEPALESE JOURNAL OF
AGRICULTURAL SCIENCES 2021, volume 21
, volume 7
Himalayan College of Agricultural Sciences and Technology
(HICAST)
Purbanchal University affiliate
Kirtipur 1, Kathmandu, Nepal
Nepalese Journal of Agricultural Sciences, 2021, volume 21 ISSN 2091-042X; eISSN 2091-0428
2
Editorial Board
Editor-in-Chief
Dr Binayak P RAJBHANDARI, PhD
Editors
Dr Upendra Man SINGH, PhD (Nepal)
Dr Raj Kumar ADHIKARI, PhD (Nepal)
Dr Poshendra SATYAL, PhD (UK)
Dr Gopal D BHATT, PhD (Canada)
Dr Sushil THAPA, PhD (USA)
Dr Anisha BAJRACHARYA, PhD (Australia)
Published on: 25 July 2021
Price Nepal NRs 500.00
(Including postage charge) SAARC countries US $ 15.00
Other countries US $ 25.00
@ HICAST
Publisher
Himalayan College of Agricultural Sciences & Technology (HICAST)
Post Box 25535, Kathmandu, Nepal
Email: [email protected]
URL://www.hicast.edu.np/
“The opinions expressed or the interpretations of the findings in the
articles are those of the author(s); and do not reflect the views of the
editors or the publisher”.
Nepalese Journal of Agricultural Sciences, 2021, volume 21 ISSN 2091-042X; eISSN 2091-0428
3
TABLE OF CONTENTS
RESEARCH ARTICLES
5 Effect of bypass protein supplementation to the dairy cattle in farmer
management condition at Lamjung district, Nepal- Bhojan Dhakal, Megh
Raj Tiwari, Sabita Subedi & Tek Bahadur Gurung
17 Evaluation and characterization of elite genotype of Okra- Manish Kumar
Thakur, Ishwari Prasad Gautam and Sabita Karki
23 Nutritional management of Pakhribas Black Pigs for improved
productivity- Pawan Kumar Jha
33 Effects of desiccation and immersion on larval and pupal survival of
Chinese citrus fly (Bactrocera minax) (Diptera: Tephritidae)- Kishor
Bhandari, G. Timilsina, G. Gautam and M.K. Thakur
48 Fattening of male buffalo calf for economic meat production- Pawan Kumar
Jha, Anjay Kumar Sah & Pankaj Kumar Jha
59 A study on maize weevil (Sitophilus zeamais) management at farmers’
condition in Mid Western Nepal- Janarjan Gautam and N. Lamsal
65 Evaluation of brinjal genotypes for yield and quality traits- Manish Kumar
Thakur, Ishwari Prasad Gautam, Mahabir Lal Deo and Sabita Karki
67 Biology and population dynamics of Chinese citrus fruit fly (Bactrocera
minax) (Diptera: Tephritidae) in eastern hills of Nepal- Kishor Bhandari, G.
P. Timsina, G. Gautam & M.K. Thakur
75 Effect of dietary supplementation of carotenoids on growth performance
of rainbow trout (Oncorhynchus mykiss, Walbaum) in Rasuwa, Nepal-
Suraj K Singh, Mahendra P Bhandari and Prem Timalsina
86 Insecticide assay with rapid bioassay of pesticide residue (RBPR)
technique of vegetables in different markets of Pokhara, Nepal- Sadikshya
Poudel and Narendra Bahadur Singh
97 Dynamics of organic N in an alluvial soil with the application of
Ammonium sulphate and assimilation of N at different parts of maize
plant - Shree Prasad Vista, Nishan Bista and Dipankar Saha
116 Study on association of different animal and management factors on
occurrence of Pneumonia in sheep in Jumla- Ramesh Prasad Sah, Mohan P.
Yadav and Surendra P. Kanu
125 Economics of early-season cauliflower production and marketing in
Benighat Rorang Rural Municipality, Dhading District- Ashma Pandey
135 Management of white grub in ginger - Janarjan Gautam, K. Bhandari and D.
Ghimire
143 Aphid monitoring using yellow and blue sticky trap in sweet pepper field-
Aashish Shrestha and Sundar Tiwari 150 Postharvest vase life of gerbera under different chemical treatments- Dipti
Kandel, Padma Nath Atreya and Sujata Poudel
158 Economics of production and marketing of vegetables in Pokhara, Kaski-
Satish Kharal and Kiran Raj Joshi
164 Effect of chemical fertilizers and organic sources in soil chemical
properties under rice-wheat cropping system- Shukra Raj Shrestha, Dinesh
Khadka and Damali Sherpa

Nepalese Journal of Agricultural Sciences, 2021, volume 21 ISSN 2091-042X; eISSN 2091-0428
4
168 Status of agriculture insurance service business in Nepal- Rojan Kakri,
Ashma Pandey, K.P. Timsina, Arun G.C
179 Influence of rice residue management practices on yield and yield
attributing parameters of wheat grown with different levels of nutrients
under rice-wheat cropping system in Western Terai- Rita Amgain, Dinesh
Khadka, Sushila Joshi & Narayan Khatri
188 Effect of supplementation of soybean cake and roasted soybean in broiler
diet on the growth performance of turkey poults- Mukesh Karki, Megh Raj
Tiwari and Ritesh Shah
194 Factors affecting women farmers’ participation in agricultural
cooperatives in Lamjung and Nawalpur districts, Nepal- Binayak Prakash
Mishra and S. Bhatta
202 Economic viability of hydroponic system: a case from Kathmandu valley-
Ganesh Thapa, Arun GC and Ashma Pandey
210 Gross margin analysis of major vegetables of Phedikhola Rural
Municipality, Syangja- Aayusha Pandey and Kamal Raj Gautam
218 Effects of a dwarfing gene sd1-d (Dee-geo-woo-gen dwarf) on yield and
related traits in rice- Mukunda Bhattarai, Misa Kamimukai, Birendra Bahadur
Rana and Masayuki Murai
230 In- vitro efficacy of trichoderma isolates against fusarium oxysporum f. Sp.
Lentis- Sudikshya Devkota and Pratima Poudel
239 Diversity and use of neglected and underutilized species at Godawari
municipality, Nepal- Prakriti Chand and Binayak P. Rajbhandari
247 A comparative study of helminth parasites of backyard poultry in Dang,
Nepal - Arjun Pandit and Kapil Bhusal
REVIEW ARTICLES 252 Biochar as an efficient soil enhancer to improve soil fertility and crop
productivity in Nepal- Naba Raj Pandit, S. Dahal, S. Shrestha, S.P. Vista,
D.K. Gautam
266 Vertical farming: a future vegetable production system- Krish Rauniyar
Nepalese Journal of Agricultural Sciences, 2021, volume 21 ISSN 2091-042X; eISSN 2091-0428
5
RESEARCH ARTICLES
Effect of bypass protein supplementation to the dairy cattle in
farmer management condition at Lamjung district, Nepal
1Bhojan Dhakal,
2Megh Raj Tiwari,
3Sabita Subedi
&
1Tek B. Gurung
1National Animal Science Research Institute, Khumaltar, Lalitpur
2Directorate of Agricultural Research, Province N01, Tarahara, Sunsari
3Goat Development specialist, KUBK, Pyuthan
Corresponding Author: [email protected]
ABSTRACT
An experiment was carried out to identify the impacts of
supplementing the different level of bypass protein on dairy
cattle production by introducing the varied amount of
rapeseed oil cake, in 2014 at Lamjung, milk production, and
other output variables were recorded for 3 months period
within 12 lactating cattle in farmer's management condition in
completely randomized block design. Based on the hypothesis
that dairy animals in farmer management condition were
mostly getting undernourished, especially onprotein-based
concentrates; an intervention was made by replacing rice and
wheat bran (mixed in 1:1 ratio) with bypass protein in equal
proportion via dried oil-seed cake (rapeseed cake) at control
(T0), T1 (0.5 kg), T2 (1kg) and T3 (1.5) kg per day per animal,
respectively. Experiment revealed that the total milk
production (evening and morning) was statistically significant
(p<.001) among the treatments within the intervened animals.
Similarly, daily dry matter intake (DMI) was highly significant
among the treatments (p<0.001). The average daily milk
production is highly correlated (0.469) to the quantity of
oilseed cake (up to 1.5 kg daily basis) intervened to the cattle.
Moreover, seasonal feedstuffs were catalogued and feed
samples were taken for chemical analysis. The milk
production at T3 was more economical than other treatment
groups. Our results suggests that there is a need to be
improved management in the feeding practices of the dairy
cattle to increase the daily milk production level specially
focusing on the protein requirement of dairy animals.
Key words: Oil seed cakes, protein supplement, milk production, cattle
Nepalese Journal of Agricultural Sciences, 2021, volume 21 ISSN 2091-042X; eISSN 2091-0428
6
INTRODUCTION
One of the challenges for ruminant production is unavailability of quality feed
especially protein based concentrates. Majority of prevailing feeding condition
at the farm level is traditional type without adoption of the improved technology
(Poudel, 2000). Similarly, feeding materials varies from season to season and
region to region. The more problematic situation can be observed in the mid
hills condition during winter season. Therefore, an evaluation of additional
nutrient required according to the production status is required to strengthen the
household milk production with minimum fluctuation round the year.
Ramachandran et al. (2007) argued that several oilseed cakes such as sunflower
oil cake, sesame oil cake, soybean cake, coconut oil cake, mustard oil cake,
groundnut oilcake, cotton seed oil cake, rape seed oil cake have greater level of
crude protein (CP) and rumen-degradable protein (RDP) which significantly
enhances fermentation and biochemical processes in the rumen, thus positively
affecting nutrient utilization. For example, rapeseed oil cake (ROC) and other
oil seed meal manifest that supplementation of oil cakes with low-quality
forages enhances dry matter (DM) and organic matter (OM) intake and leads
towards positive nitrogen balance (Fereira et al., 2012). Nitrogen balance is
necessary for protein utilization in the body. Under these circumstances, the
supplementation of oilseed cakes could be a potential way to improve low-
quality feeds. Research suggested that that supplementation of poor-quality
forages increases feed intake, digestibility and microbial protein supply to the
rumen that leads to increased productivity (Wanapat, 2009; Khandakar et al.,
2012; Fereira et al., 2012).
Low milk yield, poor reproductive performance and growth rate have been
reported in cattle's by various researchers (Allen, 1996, Wynn et al., 2009;
Fereira et al., 2012 Khandakar et al., 2012)). In Nepal, the cattle are mainly fed
cereal straws that are highly lignified and poor fermentable protein and
carbohydrates contained. Supplementation of critical nutrient in ration
(Khandakar et al., 2012)) can improve the utilization of poor quality roughages
and address the deficiency of nutrients. The supplementation of bypass protein
to the cattle fed with straw based diet has increased the growth and supported
milk production (Allen, 1996, Wynn et al., 2009; Fereira et al., 2012). However,
minimum efforts have been made in Nepal to evaluate the performance of
indigenous as well as crossbred dairy cows for their productive and reproductive
performance and economic study on the basis of interventions. The objective of
the research was to enhance the performance of crossbred dairy cows in terms
of their milk off take and other economic parameter since the majority of the
cattle are far below the optimum production potentiality in the country.

Nepalese Journal of Agricultural Sciences, 2021, volume 21 ISSN 2091-042X; eISSN 2091-0428
7
MATERIALS AND METHODS
Experimental set up
Twelve lactating crossbred dairy cattle were selected for the experiment period
of 3 months. Supplementation were done after one month of parturition and
continued for next three months. Feeding was done three times in 24 hours. Out
of the 12 cattle, 9 lactating animals were assigned in CRD design and
supplemented with different level of the rapeseed and mustard seed cakes and 3
were with local feed (Kudo) (1:1 ratios of rice and wheat bran mixed and
cooked) for 90 days of early lactation. Supplemented was adopted after first
month of parturition and continued for next three months.
Feeding of experimental animals (by treatment group)
Each treatment group includes control T0) with no external supplementation,
treatment first (T1) with 0.5 kg, T2 with1 kg and T3 with 1.5 kg of rapeseeds
cakes supplementation, replaced with local feed in equal proportion. Feed was
supplemented in morning and evening in equal proportion The oil seed cake
was soaked at least a one hour and cooked in luke-warm water as a general
practice of the farmer in the research sites. Fresh water and rice straw provided
to the animals were adlibitum whereas 10 kg of green grasses in an average was
provided to the animals daily on fresh matter basis. Amount of feed and fodder
supplied to the cattle and management practices was similar within all the
treatment groups. However, type of grass, vegetables wastes, wastage food
provided were not considered in this study because they all were non-
considerable proportion. Daily milk yield of individual animal was recorded by
an investigator daily.
Data recording
The information on dry matter intake, roughages and concentrate intake, and
daily milk production were accessed. The fat content of the milk was recorded
on the local collection center and cooperative of the village. Milk yield was
recorded at the morning and the evening at the milking time. After the
adaptation period, data were collected for daily milk off take, intake of all
feedstuffs. Body condition of the trail animals were estimated in every month.
Sample collection of feedstuffs
Moreover, seasonal feedstuffs were catalogued and samples were taken for
chemical analysis. Regular de-worming was made in late monsoon and another
during the winter period. The participants (farmers) were supported for sapling
of promising forage species to supplement adequate green roughages of the
desirable quality to optimize the production potential.
Body condition scoring
Body Condition Scores (BCS) were estimated by two independent observations
and the mean were recorded as the body condition of the cows. Body condition
Nepalese Journal of Agricultural Sciences, 2021, volume 21 ISSN 2091-042X; eISSN 2091-0428
8
estimation was done according to the procedure designed by Bercovich, et al.
(2012) using a scale from 1 (very thin) to 5 points (over conditioned) which
combined both visual and tactical appraisals.
Partial budgeting
Variable costs for input supplement and income from selling milk were recorded
for partial budgeting. Prevailing market prices of feed ingredients and milk
during the experimental period were used to calculate net return/cow/day, net
return/l of milk, feed costs/l of milk and benefit-cost ratios.
Net return/cow/day was calculated as the difference of daily milk sold per cow
minus daily feed costs per cow. Feed costs/l of milk was calculated using feed
costs per day divided by milk off take/day. The benefit-cost ratio was calculated
from change in net return between the control and supplemented diet during the
experiment divided by change in feed costs. The data obtained from
experimental design were entered in Microsoft Excel for cross checking and
validation, and then transferred to Statistical Packages for Social Science
version 16 and R Studio for the statistical analysis and interpretation of the
results.
RESULTS AND DISCUSSION
Milk production
The increase in milk production was highly significant for supplemented group
(Table 1). The efficiency of nutrient use for milk production is primarily
dependent on the level of supplementation and replacement (Chilliard, 1989).
For the control group with locally available feeds (Kudo), the milk production
was minimal with greater fat percent. When supplementation increased from
treatment (T1) 0.5 kg per day/animal to T3 to 1.5 kg/day/animal, the milk
production increased in a linear pattern. The lowest milk production was
observed in To with morning 4.73±0.81litres in morning, 3.07±0.66 liters in the
evening and 7.03±1.40 litres in the day respectively. Similarly, for the cattle
group with 1.5 kg rapeseed cake supplementation per day per animal was
significantly better in term of milk reduction with an average of 4.76±0.87 in the
morning, 4.35±0.91 in the evening, and 9.08±1.4 liters on the day respectively.
The higher milk production due to supplementation was may be due to better
protein utilization by the animals by ingested bypass protein from rapeseed and
rapeseed cake.
Feed Intake
No significant supplementation effect was observed for body condition score
along the treatment group. The daily mean rapeseed seed cake consumption per
animal in the period of 240 days was 1.97±0.92 kg despite the variation in
among the cattle. The daily green grass consumed by the experimental animal
was 4.32±.70 kg and straw consumed was 9.76±0.84 kg, respectively in DM
basis.
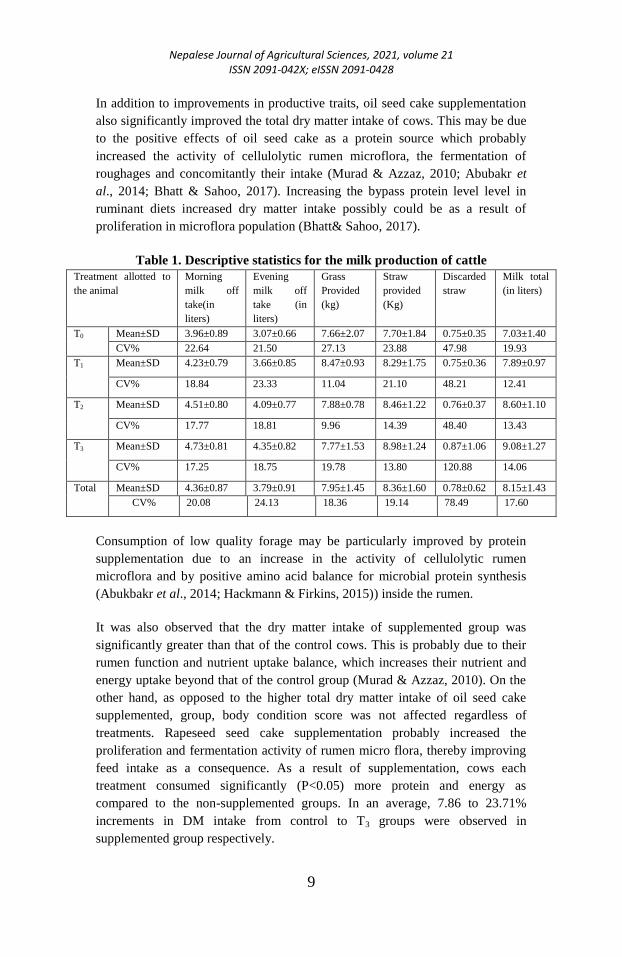
Nepalese Journal of Agricultural Sciences, 2021, volume 21 ISSN 2091-042X; eISSN 2091-0428
9
In addition to improvements in productive traits, oil seed cake supplementation
also significantly improved the total dry matter intake of cows. This may be due
to the positive effects of oil seed cake as a protein source which probably
increased the activity of cellulolytic rumen microflora, the fermentation of
roughages and concomitantly their intake (Murad & Azzaz, 2010; Abubakr et
al., 2014; Bhatt & Sahoo, 2017). Increasing the bypass protein level level in
ruminant diets increased dry matter intake possibly could be as a result of
proliferation in microflora population (Bhatt& Sahoo, 2017).
Table 1. Descriptive statistics for the milk production of cattle
Treatment allotted to
the animal
Morning
milk off
take(in
liters)
Evening
milk off
take (in
liters)
Grass
Provided
(kg)
Straw
provided
(Kg)
Discarded
straw
Milk total
(in liters)
T0 Mean±SD 3.96±0.89 3.07±0.66 7.66±2.07 7.70±1.84 0.75±0.35 7.03±1.40
CV% 22.64 21.50 27.13 23.88 47.98 19.93
T1 Mean±SD 4.23±0.79 3.66±0.85 8.47±0.93 8.29±1.75 0.75±0.36 7.89±0.97
CV% 18.84 23.33 11.04 21.10 48.21 12.41
T2 Mean±SD 4.51±0.80 4.09±0.77 7.88±0.78 8.46±1.22 0.76±0.37 8.60±1.10
CV% 17.77 18.81 9.96 14.39 48.40 13.43
T3 Mean±SD 4.73±0.81 4.35±0.82 7.77±1.53 8.98±1.24 0.87±1.06 9.08±1.27
CV% 17.25 18.75 19.78 13.80 120.88 14.06
Total Mean±SD 4.36±0.87 3.79±0.91 7.95±1.45 8.36±1.60 0.78±0.62 8.15±1.43
CV% 20.08 24.13 18.36 19.14 78.49 17.60
Consumption of low quality forage may be particularly improved by protein
supplementation due to an increase in the activity of cellulolytic rumen
microflora and by positive amino acid balance for microbial protein synthesis
(Abukbakr et al., 2014; Hackmann & Firkins, 2015)) inside the rumen.
It was also observed that the dry matter intake of supplemented group was
significantly greater than that of the control cows. This is probably due to their
rumen function and nutrient uptake balance, which increases their nutrient and
energy uptake beyond that of the control group (Murad & Azzaz, 2010). On the
other hand, as opposed to the higher total dry matter intake of oil seed cake
supplemented, group, body condition score was not affected regardless of
treatments. Rapeseed seed cake supplementation probably increased the
proliferation and fermentation activity of rumen micro flora, thereby improving
feed intake as a consequence. As a result of supplementation, cows each
treatment consumed significantly (P<0.05) more protein and energy as
compared to the non-supplemented groups. In an average, 7.86 to 23.71%
increments in DM intake from control to T3 groups were observed in
supplemented group respectively.
Nepalese Journal of Agricultural Sciences, 2021, volume 21 ISSN 2091-042X; eISSN 2091-0428
10
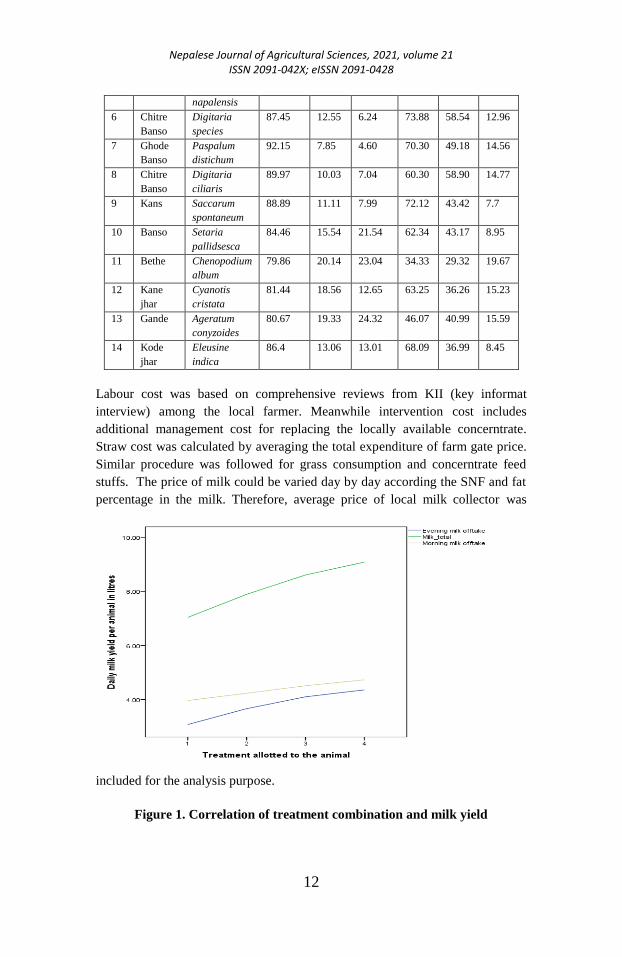
Milk production performance
The average milk yield per cattle is 8.8±1.03 liters per day and at least 50% of
the cross breed cattle in farmer management condition have milk yield below
average level. The highest milk production was found in 1.5 kg oil seed cake
supplementation with daily 3.14+0.85 litres of increased milk on daily basis
while for 1kg and 0.5 kg feed supplementation, there was 2.35±.93 litres and
1.7±0.53 litres increase per days as compared to the control groups (farmer
management condition). The average daily milk production (evening and
morning) was statistically highly significant (0.001) between the treatments and
statistically similar within the treatment; and was non-significant (0.05) within
non intervened animals. Similarly, the amount daily straw and grass consumed
was highly significant (0.001) between the treatments. The average daily milk
production is highly correlated (0.469) to the total amount of oilseed cake (up to
1.5 kg daily basis) intervened to the cattle. This means that for those lactating
animals, for each 0.5 kg of addition of oilseed cake, the total milk production
can be increased by at least by 1.7±0.53 kg of milk in an average.
Table 2. Production performance and feed intake of cross breed cattle in
different feeding regimes
Parameters Control (T0) T1 T2 T3 p value
Milk off take
(l/day)
7.3±1.40 7.89±.97b 8.60±1.10c 9.08±1.27d <0.001
Milk fat yield (g/l
of milk)
42.2±1.32b 41.5±1.32b 39.4±1.26a 38.1±1.21a >0.001
Milk fat (g/ day) 294.1±52.21a 327.6±43.21b 338.4±43.11c 345.2±45.45d NS
BCs 2.9±0.23 3.7±0.32 3.2±0.35 3.4±0.41 NS
TDMI (kg/day) 11.3±1.20a 12.17±1.12ab 13.05±1.21bc 13.98±1.23c <0.05
BCs = Body condition scoring, TDMI= total dry matter intake
Mean denoted by superscripts are significantly different at 95% significant level.
Table 3. Significance level of the different treatment combination on
production variables
Parameter Groups Sum of
Squares
Mean
Square F Sig.
Fat percent per
day average
Between Groups
(Combined) 4.848 1.616 23.089 0.000
Within Groups 33.314 .070
Milk production
per day total
(kg)
Between Groups
(Combined) 286.030 95.343 64.722 0.000
Within Groups 701.208 1.473
Evening milk off
take (kg)
Between Groups
(Combined) 113.195 37.732 62.180 0.000
Within Groups 288.841 .607
Morning milk
off take (kg)
Between Groups
(Combined) 39.777 13.259 19.307 0.000
Within Groups 326.885 .687
Nepalese Journal of Agricultural Sciences, 2021, volume 21 ISSN 2091-042X; eISSN 2091-0428
11
Straw provided
(kg)
Between Groups
(Combined) .075 .025 0.007 NS
Within Groups 1683.303 3.536
Grass Provided
(kg)
Between Groups
(Combined) .075 .025 0.007 NS
Within Groups 1683.303 3.536
Total income
(NRs)
Between Groups
(Combined) 865241.254 288413.751 64.722 0.000
Within Groups 2121154.745 4456.207
NS=non-significant
Cost benefit analysis
This indicates the possibility of increasing the milk production by intervening
the protein supplement such as oilseed cake since the daily protein supplement
to the dairy animals were found severe deficiency level.
Top ranked indigenous forage species fed to the treated animals
Each sample was analyzed with three replications. Organic matter total ash,
crude protein, NDF, ADF and ADL content of the most commonly available
forages were analyzed to find out the nutrient composition. There was huge
variation in the nutrient composition of the grass. Considering the crude protein
content of selected grass species, Mothe, Gande and Kode-Jhar had highest
protein content while Khar, Siru, Kanyaa-Banso had lowest protein content
though these have significant NDF content. Banso, Bethe and Kane-Jhar had
highest ash content than any other grass species observed.
The benefit cost analysis was performed among the treated animals. Major cost
variable were included in the partial budgeting where as cost of veterinary
practices and other management cost were discarded for the analysis. In the
similar way, the income from farm yard manure and body weight gain by the
animals were also excluded for reducing dedundencies during the calculation of
the net benefit from the program.
Table 4. Nutrient composition major grass species
SN Forage
species
Scientific
name
Organic
matter
Total
ash
Crude
protein
NDF ADF ADL
1 Khar Themeda
species
92.01 7.99 5.6 69.47 54.25 15.32
2 Siru Imperata
cylindrical
93.04 6.96 7.78 78.33 56.95 10.43
3 Dubo Cynodon
dactylon
84.65 15.35 12.51 71.43 43.35 14.32
4 Ghode
Dubo
Hemarthria
compressa
93.6 6.40 3.78 70.23 46.23 13.46
5 Furke Pittosporum 93.93 6.07 5.98 80.25 42.68 5.01
Nepalese Journal of Agricultural Sciences, 2021, volume 21 ISSN 2091-042X; eISSN 2091-0428
12
napalensis
6 Chitre
Banso
Digitaria
species
87.45 12.55 6.24 73.88 58.54 12.96
7 Ghode
Banso
Paspalum
distichum
92.15 7.85 4.60 70.30 49.18 14.56
8 Chitre
Banso
Digitaria
ciliaris
89.97 10.03 7.04 60.30 58.90 14.77
9 Kans Saccarum
spontaneum
88.89 11.11 7.99 72.12 43.42 7.7
10 Banso Setaria
pallidsesca
84.46 15.54 21.54 62.34 43.17 8.95
11 Bethe Chenopodium
album
79.86 20.14 23.04 34.33 29.32 19.67
12 Kane
jhar
Cyanotis
cristata
81.44 18.56 12.65 63.25 36.26 15.23
13 Gande Ageratum
conyzoides
80.67 19.33 24.32 46.07 40.99 15.59
14 Kode
jhar
Eleusine
indica
86.4 13.06 13.01 68.09 36.99 8.45
Labour cost was based on comprehensive reviews from KII (key informat
interview) among the local farmer. Meanwhile intervention cost includes
additional management cost for replacing the locally available concerntrate.
Straw cost was calculated by averaging the total expenditure of farm gate price.
Similar procedure was followed for grass consumption and concerntrate feed
stuffs. The price of milk could be varied day by day according the SNF and fat
percentage in the milk. Therefore, average price of local milk collector was
included for the analysis purpose.
Figure 1. Correlation of treatment combination and milk yield
Nepalese Journal of Agricultural Sciences, 2021, volume 21 ISSN 2091-042X; eISSN 2091-0428
13
Table 5. Benefit-cost analysis of oil seed cake supplementation in mid-
lactation
Parameters T0 T1 T2 T3
labor cost, NRs 1 labor@500per dim
for total animal
caring,
Therefore,=NRs.5000
1 labor@500per dim
for total animal
caring,
Therefore,=NRs.5000
1 labor@500per dim
for total animal
caring,
Therefore,=NRs.5000
1 labor@500per dim
for total animal
caring,
Therefore,=NRs.5000
Itervention
cost
NRs. 5000 in total NRs. 6000 in total NRs. 7000 in total NRs. 8000 in total
Straw cost 7.7kg per day per
animals, Rs 3 per kg
@ for 90 days,= NRs
2079
8.29 kg per day per
animals, Rs 3 per kg
@ for 90 days,= NRs
2239
8.46 kg per day per
animal, Rs 3 per kg
@ for 90 days,= NRs
2284
8.98 kg per day per
animal, Rs 3 per kg
@ for 90 days,= NRs
2425
Green grass
cost
5.5 kg per day per
animals, Rs 6 per kg
@ for 90 days,= NRs
2970
5.5 kg per day per
animals, Rs 6 per kg
@ for 90 days,= NRs
2970
5.5 kg per day per
animals, Rs 6 per kg
@ for 90 days,= NRs
2970
5.5 kg per day per
animals, Rs 6 per kg
@ for 90 days,= NRs
2970
Concentrate
feed cost
3 kg per day per
animals, Rs 45 per kg
@ for 90 days,= NRs
12150
3 kg per day per
animals, Rs 45 per kg
@ for 90 days,= NRs
12150
3 kg per day per
animals, Rs 45 per kg
@ for 90 days,= NRs
12150
3 kg per day per
animals, Rs 45 per kg
@ for 90 days,= NRs
12150
Total cost NRs. 27199 NRs. 28359 NRs. 29404 NRs. 30545
Income from
milk in 3
months
7.3 litres of milk per
day for 90 days @
NRs. 70 per litres in
an average =NRs.
45990 per animal
7.89 litres of milk per
day for 90 days @
NRs. 70 per litres in
an average
=NRs.49707
8.6 litres of milk per
day for 90 days @
NRs. 70 per litres in
an average
=NRs.54180
9.08 litres of milk per
day for 90 days @
NRs. 70 per litres in
an average
=NRs.57204
Net Benefit
(total cost -
income)
NRs. 18791 per
animal
NRs.21348 NRs.24776 NRs. 26659
The oil seed cake supplementation practiced herein proved to be economically
beneficial taking into account the milk production and feed costs, the relative
average improvement in net return per day as a result of supplementation with
oil seed cake (p<0.001) (Table 5). In absolute numbers, financial gains resulting
from supplementation were greater for supplemented group of cows than control
counterparts. Uddin et al. (2002) also reported that, when cattle cows were
supplemented with protein supplements, cattle cows which were supplemented
had a greater net return per day than those of the control group in farmer's
management condition. This was attributed to the lower cost of protein based
supplement compared to concentrate and enhanced milk production.
The average value of the production parameters were calculated and represented
as follows. The most of the production inputs in each treatment was somewhat
similar except added amount of oil seed cake. The other insurance and labor
hiring cost were not included in this partial budgeting. It is because the cost of
straw and green grasses was assumed to be covered to all other type of farm
management cost. The available milk produced form the farmer were considered
Nepalese Journal of Agricultural Sciences, 2021, volume 21 ISSN 2091-042X; eISSN 2091-0428
14
marketable and could get already negotiated price between producer and
seller/local collector.
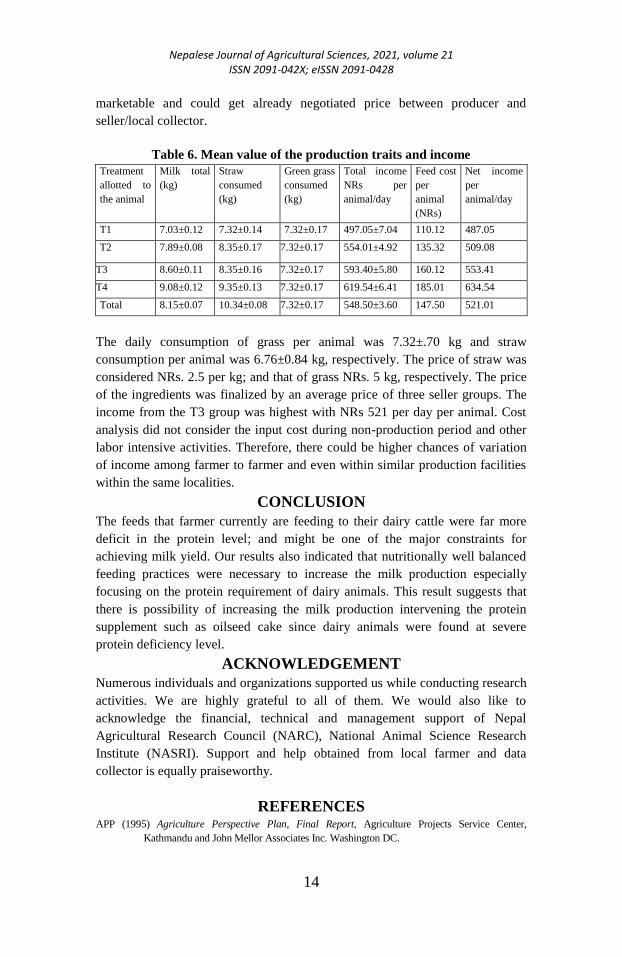
Table 6. Mean value of the production traits and income
Treatment
allotted to
the animal
Milk total
(kg)
Straw
consumed
(kg)
Green grass
consumed
(kg)
Total income
NRs per
animal/day
Feed cost
per
animal
(NRs)
Net income
per
animal/day
T1 7.03±0.12 7.32±0.14 7.32±0.17 497.05±7.04 110.12 487.05
T2 7.89±0.08 8.35±0.17 7.32±0.17 554.01±4.92 135.32 509.08
T3 8.60±0.11 8.35±0.16 7.32±0.17 593.40±5.80 160.12 553.41
T4 9.08±0.12 9.35±0.13 7.32±0.17 619.54±6.41 185.01 634.54
Total 8.15±0.07 10.34±0.08 7.32±0.17 548.50±3.60 147.50 521.01
The daily consumption of grass per animal was 7.32±.70 kg and straw
consumption per animal was 6.76±0.84 kg, respectively. The price of straw was
considered NRs. 2.5 per kg; and that of grass NRs. 5 kg, respectively. The price
of the ingredients was finalized by an average price of three seller groups. The
income from the T3 group was highest with NRs 521 per day per animal. Cost
analysis did not consider the input cost during non-production period and other
labor intensive activities. Therefore, there could be higher chances of variation
of income among farmer to farmer and even within similar production facilities
within the same localities.
CONCLUSION
The feeds that farmer currently are feeding to their dairy cattle were far more
deficit in the protein level; and might be one of the major constraints for
achieving milk yield. Our results also indicated that nutritionally well balanced
feeding practices were necessary to increase the milk production especially
focusing on the protein requirement of dairy animals. This result suggests that
there is possibility of increasing the milk production intervening the protein
supplement such as oilseed cake since dairy animals were found at severe
protein deficiency level.
ACKNOWLEDGEMENT
Numerous individuals and organizations supported us while conducting research
activities. We are highly grateful to all of them. We would also like to
acknowledge the financial, technical and management support of Nepal
Agricultural Research Council (NARC), National Animal Science Research
Institute (NASRI). Support and help obtained from local farmer and data
collector is equally praiseworthy.
REFERENCES APP (1995) Agriculture Perspective Plan, Final Report, Agriculture Projects Service Center,
Kathmandu and John Mellor Associates Inc. Washington DC.
Nepalese Journal of Agricultural Sciences, 2021, volume 21 ISSN 2091-042X; eISSN 2091-0428
15
Abubakr, A. et al. (2014) Effect of feeding palm oil by-products based diets on total bacteria,
cellulolytic bacteria and methanogenic archaea in the rumen of goats, PLoS ONE, 9(4), p.
95713. doi: 10.1371/journal.pone.0095713.
Allen, M.S. (1996) Physical constraints on voluntary intake of forages by ruminants. J Anim
Sci. ;74:3063–3075.
Bercovich, A. et al. (2012) ‘Automatic Cow ’ S Body Condition Scoring’, International Conference
of Agricaultural Engineering, (IGR-AgEng2012), (2012), pp. 2–7.
Bhatt, RS & Sahoo, A. (2017) Effect of feeding complete feed block containing rumen protected
protein, non-protein nitrogen and rumen protected fat on improving body condition and
carcass traits of cull ewes’, Journal of Animal Physiology and Animal Nutrition, 101(6),
pp. 1147–1158. doi: 10.1111/jpn.12628.
Fereira, A.C, Oliveira, R.L, Bagaldo, A.R, De Carvalho, G.G.P, Da Silva, R.N.V., & De Oliveira,
P.A. (2012) Intake, digestibility and intake behaviour in cattle fed different levels of palm
kernel cake. Revista MVZ Cordoba, 17(3), 3105–3112 https://doi.org/10.21897/rmvz.208
Fereira, A.C, Oliveira, R..L., Bagaldo, A.R., De Carvalho, GGP, Da Silva, RNV, & De Oliveira, P.A.
(2012) Intake, digestibility and intake behaviour in cattle fed different levels of palm kernel
cake. Revista MVZ Cordoba, 17(3), 3105–3112. https://doi.org/10.21897/rmvz.208
Hackmann, TJ, & Firkins, J.L., (2015) Maximizing efficiency of rumen microbial protein
production. In: Frontiers in Microbiology, 6, 465. Frontiers Media S.A.
https://doi.org/10.3389/fmicb.2015.00465
Khandaker, Z. H. et al. (2012) ‘Effect of supplementation of mustard oil cake on intake, digestibility
and microbial protein synthesis of cattle in a straw-based diet in Bangladesh’, Tropical
Animal Health and Production, 44(4), pp. 791–800. doi: 10.1007/s11250-011-9969-z.
Luitel, C.P. (2001) Food security and poverty alleviation through large ruminant situation and scope.
Proceedings of the First SAS/N Convention. March 29-31, 1999, Kathmandu, Nepal, Pp 228-
237.
MoAC. (2009) Statistical information on Nepalese agriculture, Agri-Business Promotion and Statistics
Division Ministry of Agriculture and Cooperative Singha Durbar, Kathmandu, Nepal.
MoAC, (2010/11) Statistical information on Nepalese agriculture, Agri-Business Promotion and
Statistics Division Ministry of Agriculture Development, Singha Durbar, Kathmandu, Nepal.
Murad, H.A. & Azzaz, H.H. (2010) Cellulase and dairy animal feeding, Biotechnology, 9(3),238–
256. doi: 10.3923/biotech.2010.238.256.
Poudel, LN (2000) Livestock feeds and feeding system in Gulmi district of western Nepal: Past, present
and future perspective. Proceedings of the Fourth National Animal Science Convention,
November 29- December 1, 2000, 96-102.
Ramachandran, S, Singh, SR, Larroche, C, Soccol, CR and Pandey, A., (2007) Oil cakes and their
biotechnological applications- A review. Bioresource Technology, 98 (10), 2000–2009 (9)
(PDF) Effect of supplementation of mustard oil cake on intake, digestibility and microbial
protein synthesis of cattle in a straw-based diet in Bangladesh. Available from:
https://www.researchgate.net/publication/51641847_Effect_of_supplementation_of_mustard
_oil_cake_on_intake_digestibility_and_microbial_protein_synthesis_of_cattle_in_a_straw-
based_diet_in_Bangladesh [accessed Sep 14 2020].
Tyrrell, H.F., Reid, J.T., (1965 (1) Prediction of the energy value of cow’s milk, In: Effects of dairy cow
genotype with two planes of nutrition on energy partitioning between milk and body tissue. J.
Dairy Sci. 89: 1031-1042.
Tyrrell, H.F., Reid, J.T. (1965 (2) Prediction of the energy value of cow’s milk, In: DHI GLOSSARY
(2011). Dairy Records Management Systems (DRMS), 31 p.
http://www.drms.org/PDF/materials/glossary.pdf
Wanapat, M. (2009) Potential uses of local feed resources for ruminants. Tropical Animal Health and
Production, 41, 1035–1049.
Wanapat, M., Polyorach, S., Boonnop, K., Mapato, C. and Cherd-thong, A., (2009) Effects of treating
rice straw with urea or urea and calcium hydroxide upon intake, digestibility, rumen
fermentation and milk yield of dairy cows. Livestock Science, 125, 238–243 (9) (PDF) Effect
Nepalese Journal of Agricultural Sciences, 2021, volume 21 ISSN 2091-042X; eISSN 2091-0428
16
of supplementation of mustard oil cake on intake, digestibility and microbial protein synthesis
of cattle in a straw-based diet in Bangladesh, Available from:
https://www.researchgate.net/publication/51641847_Effect_of_supplementation_of_mustard
_oil_cake_on_intake_digestibility_and_microbial_protein_synthesis_of_cattle_in_a_straw-
based_diet_in_Bangladesh [accessed Sep 14 2020].
Nepalese Journal of Agricultural Sciences, 2021, volume 21 ISSN 2091-042X; eISSN 2091-0428
17
Evaluation and characterization of elite genotype of
okra
Manish Kumar Thakur1*
, Ishwari Prasad Gautam2 & Sabita Karki
1
1 Directorate of Agriculture Research, Province 1, Tarahara, Sunsari
2 National Horticulture Research Center, Lalitpur, Khumaltar
*Corresponding Author: [email protected]
ABSTRACT Varietal evaluation of Okra was carried out for two consecutive
years (2018 and 2019) at Horticulture Research Unit of Regional
Agriculture Research Station Tarahara. Five genotypes of okra were
used for evaluation considering each genotype as an individual
treatment; and were replicated four times under Randomized
Complete Block Design. From above experiment result revealed that
T2 (Green Finger) gave significant result with respect to Plant
Height(176 cm & 178.75 cm), plant vigour (3.75 & 3.63) and total
number of fruit (214 & 212.5) in both year. Similarly, in first year
highest plot yield was observed with Green Finger (8.97 kg).
Expected yield per hectare found to be highest with Green finger i.e.
37.8 kg/ha and 41.25 ton/ha respectively. Thus, with respect to the
observed data, all the genotype production is on an average triple
than that of national productivity i.e. 11 t/ha (MoAD, 2016/17) and
higher than check (Arka Anamika). Though, Green Finger observed
high yielding as compared to other, Green Finger, Green Line and
Lucky Seven yielded higher than the national productivity. Therefore,
promotion of these genotypes certainly contributes in increasing
production, productivity and minimizing import of Okra in Nepal.
Keywords: Green finger, green line, evaluation, productivity, yield
INTRODUCTION
Cultivated Okra (Abelmoschus esculentus L. Moench) also known as Ladies
Finger is a member of Malvaceae family. Locally it is known as ‘Bhindi’ or
‘Chiple bhindi’. It is an important vegetable crop in the tropical and sub tropical
regions in the world (Osekita, 2009). It probably originated in either tropical
Africa or tropical Asia, and is now widely grown throughout the tropics (Ali et
al., 2012). The crop is well distributed throughout the Indian subcontinent and
East Asia (Rashid, 1999).The tender okra pods are consumed fresh as well as
canned and dried. Okra seeds are roasted, grounded and used as substitute of
coffee in Turkey. It is a nutritious and delicious vegetable, fairly rich in vitamins
and minerals (Khushk, Usman & Memon, 2003). The edible portion of pod
(100g) has moderate levels of vitamin A (375 IU), vitamin C (21.1 mg), calcium
Nepalese Journal of Agricultural Sciences, 2021, volume 21 ISSN 2091-042X; eISSN 2091-0428
18
(81mg), phosphorus (63mg) and potassium (303mg) (USDA National Nutrient
Database). The content of thiamine (0.07mg), riboflavin (0.08mg) and niacin
(0.08mg) per 100gm edible portion of pod is higher than that of many vegetables
(Rashid, 1999). It is also one of the important vegetable crop of Nepal having
total area 10,694 ha with production 113,676 ton and productivity 11 t/ha
(MoAD, 2017).
Though, being one of the important vegetable crops cultivated in Nepal having
limited registered varieties for commercial cultivation, only three varieties i.e.
Parvati (Open Pollinated), Arka Anamika (Open Pollinated) and Jaya (F1
Hybrid) are registered at SQCC (SQCC, 2016). So, there is potentiality of high
yielding new open pollinated or hybrid genotypes of okra. Therefore, evaluation
and characterization of some elite genotypes was carried out to obtain following
objectives:
To identify high yielding genotypes.
To characterize selected genotypes.
MATERIALS AND METHODS
Evaluation and characterization of five given genotypes of Okra was carried out
at Horticulture Research Unit, Regional Agricultural Research station Tarahara,
Sunsari of Province No. 1 for two consecutive years (2018 and 2019). All the
genotypes as stated below were considered as individual treatments and
replicated four times under RCB Design.
Treatment 1 (T1): Ashlea
Treatment 2 (T2): Green Finger
Treatment 3 (T3): Green Line
Treatment 4 (T4): Lucky Seven
Treatment 5 (T5): Arka Anamika (Check)
Standard management practices were given to all these treatments as stated
below:
Date of sowing: 11/02/2018 and 15/02/2019
Spacing: 60 cm x 45 cm
No of plants per treatment: 10
Plot size: 1.2 m x 2.25 m
Plot to Plot distance: 1 m
Total No. of plots: 20
Manure and fertilizer: 20 ton FYM + 100 kg nitrogen + 60 kg phosphorus + 50
kg potassium / ha.
Replications: 4
Experimental Design: RCBD
Nepalese Journal of Agricultural Sciences, 2021, volume 21 ISSN 2091-042X; eISSN 2091-0428
19
Land was well prepared by deep ploughing and leveled. Raised plots of a given
size were prepared. Full dose of FYM, phosphorus, potassium and half dose of
nitrogen were applied as a basal at the time of plot preparation. Remaining half
dose of nitrogen was top-dressed at the time of flowering. Seeds are sown in a
plot at recommended spacing. Standard cultural practices were followed
throughout the experimental period to give selected genotypes a favorable
environment to fully express their genetic potentials.
Observation on different parameters like number of seed germinated per plot,
plant height, plant vigour, number of branches, time taken for 50% flowering,
time of fruit setting, number of fruits per harvest, weight of individual fruit,
length of fruit, fruit diameter, fruit colour, leaf size, leaf colour, colour of
petiole, number of plant harvested, total number of fruit per plot, yield per plot,
expected yield per hectare, Insidence of insect-pest, Incidence of diseases
(Yellow vein mosaic virus) was taken at regular interval. Statistical tool used for
data analysis was Statistics 10.
RESULTS AND DISCUSSION
Evaluation and characterization of elite Okra genotype was carried out at
Horticulture Research Unit, Regional Agricultural Research station Tarahara,
Sunsari of Province No. 1 for two consecutive years (2018 and 2019). The
observation on different parameters was taken at regular interval and the results
obtained are discussed below:
Plant Height: Plant height was taken after last harvest of individual plant.
Average height of 10 plants was taken for analysis. In both years, significantly
highest plant height was observed with Green Finger i.e. 76 cm & 178.75 cm in
first and second year respectively. But minimum plant height was observed
with Ashlea (130.5 - 132 cm) as stated in Table 1a.
Plant Vigour: Significant result was observed on plant vigour in both the year.
In first year Maximum vigour was observed with Green Finger (3.75), Green
Line (3.75) and Lucky Seven (3.5) followed by Ashlea (2.50). In the second
year, maxmum vigour was observed with Green Finger (3.63), Green Line
(3.63); and the lowest with Lucky Seven (2.25) as stated in Table 1a.
Number of branches: In first year non significant result was observed but in
second year significantly maximum number of branch was observed with Ashlea
(3.54) and minimum with all other treatment as stated in Table 1.
Days to 50% flowering: Non-significant result was observed in first year. But
in second year significantly highest result was observed with T4 (45.5), T1
(45.25), T2 (45) and lowest with T3 (43.5) as stated in Table 1a.
Nepalese Journal of Agricultural Sciences, 2021, volume 21 ISSN 2091-042X; eISSN 2091-0428
20
Table 1a. Evaluation and characterization of elite genotype of Okra
Individual fruit weight (gm): Individual fruit weight of all the treatments
observed to be non-significant. Though, individual fruit weight was observed to
be highest with Ashlea (43.75 gm and 46.9 gm) as compared to other in both the
year.
Fruit Length (cm): Fruit length also revealed non-significant result. Though,
maximum fruit length observed to be highest with Lucky Seven (22 cm ) in both
year.
Fruit Diameter (mm): Significantly maximum fruit diameter was observed to
be with Ashlea (25.12 mm and 25.14 mm) followed by Lucky Seven (22.74 mm
and 22.68 mm) in both years, respectively.
Total number of fruit per plot: Significant result was observed in both the year
where maximum number of fruit was obtained by Green Finger .i.e. 214 and
212.5 respectively. Similar report was propounded by Quality Trade of
Bangladesh that the Green Finger variety produced on an average 60 fruits per
plant. Fruit yield / plot (Kg.): Fruit yield / plot was observed to be significantly
highest with Green Finger (8.97 kg) and Green Line (8.08 kg) in the first year.
But in the second year non-significant result was observed with all the
treatments.
Adjusted yield / hectare (Ton/Ha.): Adjusted yield / hectare was found to be
significant with all the treatments in both year. In first year, the highest yield
was gained by Green Finger (37.8 t/ha) which was followed by Green Line
(29.83 t/ha), Lucky Seven (28.79 t/ha), Ashlea (28.42 t. /ha) and Arka Anamika
(24.35 t/ha). But in second year, highest yield was observed with Green Finger
(41.25 t/ha) followed by Green Line (38.5 t/ha). Quality Trade also mentioned in
their site that the average yield of Green Finger is at the rate 30-35 ton/ha
(Quality Trade).
Treatment/
Genotype
Plant Height (cm) Plant vigour
(1 – 5 scale)
Number of
branches
Days to 50%
Flowering
2018 2019 2018 2019 2018 2019 2018 2019
T1 - Ashlea 130.50c 132.00c 2.50b 3.10b 3.50a 3.54a 42.50a 45.25a
T2 - Green Finger 176.00a 178.75a 3.75a 3.63a 2.40b 2.20b 41.75a 45.00a
T3 - Green Line 172.25ab 175.00ab 3.75a 3.62a 2.45b 2.45b 41.50a 43.50b
T4 - Lucky Seven 169.50b 170.50b 3.50a 2.25c 2.47b 2.35b 42.00a 45.50a
T5 - Arka Anamika
(Check)
172.75ab 175.25ab 3.50a 2.92b 2.22b 2.22b 42.50a 44.75ab
P (≤0.05) ** ** * * NS * NS *
CV(%) 1.83 2.32 13.42 14.67 8.98 10.90 3.31 2.11
SEM± 1.49 1.92 0.34 0.24 0.16 0.19 0.98 0.66
Nepalese Journal of Agricultural Sciences, 2021, volume 21 ISSN 2091-042X; eISSN 2091-0428
21
Table 1b. Evaluation and characterization of elite genotype of Okra
Insect-pest infestation (1-5 scale): At initial stage of growth no any insect pest
were observed on any of the treatments in all four replications. But at later stage
of growth, all the treatments were infested by Jassids giving non-significant
result. Though, lowest infestation was observed with Green Line (2.25) in first
year hereas in second year with Lucky Seven (2.7) as stated in table 1.
Table 1c. Evaluation and characterization of elite genotype of Okra
** Highly significant; *Significant
Fruit colour: Ashlea, Green Line, Lucky Seven possess green colour fruit at
immature (edible) stage. Immature fruit of Green Finger produced dark green
colour skin. Similar character of fruit colour was observed in Green Finger by
Quality Trade. But Ark Anamika produced fruit of light green in colour.
Fruit Skin Texture: Smooth skin texture of immature fruit was observed with
Green Finger, Green Line and Arka Anamika. Slight hairy and smooth fruit skin
Treatment /
Genotype
Individual fruit
Weight (gm)
Length of fruit (cm)
fruit diameter
(mm)
Days to fruit setting
2018 2019 2018 2019 2018 2019 2018 2019
T1 - Ashlea 43.75a 46.90a 21.00a 21.00a 25.12a 25.14 49.50a 48.25a
T2 - Green Finger 40.47a 41.71a 20.00a 20.00a 20.25b 19.91b 47.00b 48.00a
T3 - Green Line 41.15a 42.67a 20.75a 20.75a 20.75b 20.83b 47.00b 46.75a
T4 - Lucky Seven 41.14a 41.54a 22.00a 22.00a 22.74ab 22.68ab 47.25b 48.5a
T5 - Arka Anamika
(Check)
42.57a 44.64a 18.37a 18.50a 20.87b 20.81b 47.75ab 47.5a
P (≤0.05) NS NS NS NS * * NS NS
CV (%) 6.13 11.48 14.25 14.26 9.77 9.87 3.03 3.6
SEM± 1.28 2.49 1.45 1.45 1.07 1.07 0.72 0.92
Treatment /
Genotype
Number of plant
harvested
Total number of fruit
per plot
Insidence of
insect-pest
(1-5)
Plot yield
(kg/plot)
Expected yield per
hectare
(ton/hectare)
2018 2019 2018 2019 2018 2019 2018 2019 2018 2019
T1 - Ashlea 7.30ab 7.30ab 166.50b 171.25bc 2.62a 2.87a 6.65b 7.57ab 28.42b 27.63b
T2 - Green
Finger
6.82bc 6.82bc 214.00a 212.50a 2.32a 2.82a 8.97a 9.15a 37.80a 41.25a
T3 - Green
Line
5.92c 5.92c 170.25b 195.25ab 2.25a 2.75a 8.08a 8.25ab 29.83b 38.50a
T4 - Lucky
Seven
8.00a 8.00a 169.00b 167.50bc 2.45a 2.70a 6.55b 6.65b 28.79b 26.80b
T5 - Arka
Anamika
(Check)
7.17ab 7.17ab 155.75b 153.75c 2.62a 2.87a 6.32b
7.02ab 24.35b 26.01b
P (≤0.05) * * * * NS NS * NS * *
CV(%) 9.42 9.42 13.19 12.97 8.98 9.13 12.30 19.15 16.67 16.40
SEM± 0.33 0.33 11.54 11.67 0.13 0.12 0.45 0.73 2.48 2.62
Nepalese Journal of Agricultural Sciences, 2021, volume 21 ISSN 2091-042X; eISSN 2091-0428
22
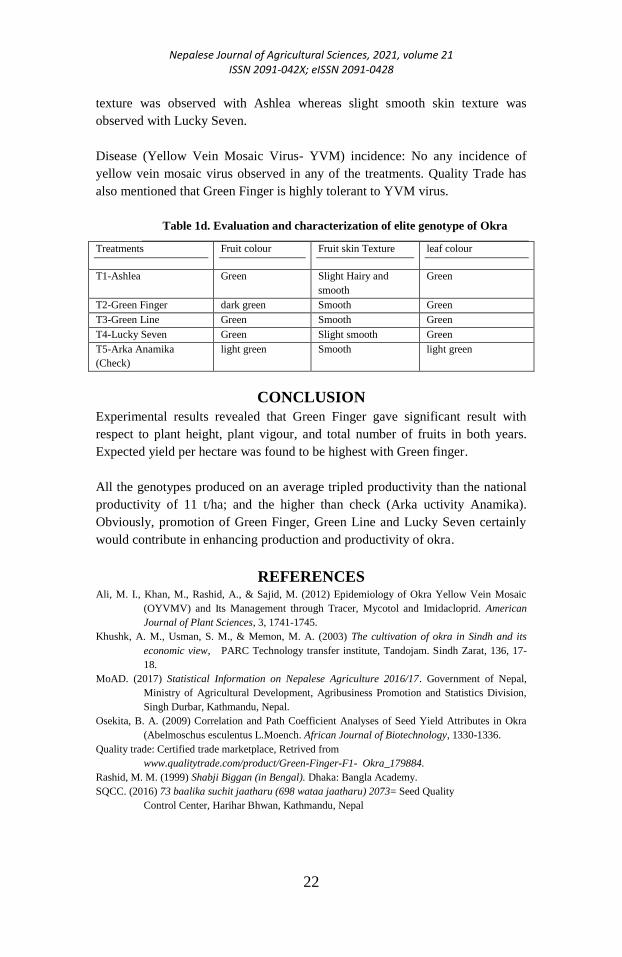
texture was observed with Ashlea whereas slight smooth skin texture was
observed with Lucky Seven.
Disease (Yellow Vein Mosaic Virus- YVM) incidence: No any incidence of
yellow vein mosaic virus observed in any of the treatments. Quality Trade has
also mentioned that Green Finger is highly tolerant to YVM virus.
Table 1d. Evaluation and characterization of elite genotype of Okra
Treatments Fruit colour Fruit skin Texture leaf colour
T1-Ashlea Green Slight Hairy and
smooth
Green
T2-Green Finger dark green Smooth Green
T3-Green Line Green Smooth Green
T4-Lucky Seven Green Slight smooth Green
T5-Arka Anamika
(Check)
light green Smooth light green
CONCLUSION
Experimental results revealed that Green Finger gave significant result with
respect to plant height, plant vigour, and total number of fruits in both years.
Expected yield per hectare was found to be highest with Green finger.
All the genotypes produced on an average tripled productivity than the national
productivity of 11 t/ha; and the higher than check (Arka uctivity Anamika).
Obviously, promotion of Green Finger, Green Line and Lucky Seven certainly
would contribute in enhancing production and productivity of okra.
REFERENCES Ali, M. I., Khan, M., Rashid, A., & Sajid, M. (2012) Epidemiology of Okra Yellow Vein Mosaic
(OYVMV) and Its Management through Tracer, Mycotol and Imidacloprid. American
Journal of Plant Sciences, 3, 1741-1745.
Khushk, A. M., Usman, S. M., & Memon, M. A. (2003) The cultivation of okra in Sindh and its
economic view, PARC Technology transfer institute, Tandojam. Sindh Zarat, 136, 17-
18.
MoAD. (2017) Statistical Information on Nepalese Agriculture 2016/17. Government of Nepal,
Ministry of Agricultural Development, Agribusiness Promotion and Statistics Division,
Singh Durbar, Kathmandu, Nepal.
Osekita, B. A. (2009) Correlation and Path Coefficient Analyses of Seed Yield Attributes in Okra
(Abelmoschus esculentus L.Moench. African Journal of Biotechnology, 1330-1336.
Quality trade: Certified trade marketplace, Retrived from
www.qualitytrade.com/product/Green-Finger-F1- Okra_179884.
Rashid, M. M. (1999) Shabji Biggan (in Bengal). Dhaka: Bangla Academy.
SQCC. (2016) 73 baalika suchit jaatharu (698 wataa jaatharu) 2073= Seed Quality
Control Center, Harihar Bhwan, Kathmandu, Nepal
Nepalese Journal of Agricultural Sciences, 2021, volume 21 ISSN 2091-042X; eISSN 2091-0428
23
Nutritional management of Pakhribas Black Pigs for
improved productivity
Pawan Kumar Jha
Nepal Agricultural Research Council
Corresponding Author: [email protected]
ABSTRACT
A study was conducted to understand the traditional feeding
practices in Eastern Hill districts (Dhankuta, Bhojpur and
Terhathum) of Nepal. Farmers were randomly selected and
interviewed. A semi-structured questionnaire was prepared to
find out feeding management practices and type of feed
provided to the pigs. Sixty five per cent farmers stall-fed their
pig and remaining 35 per cent scavenge their pigs during dry
winter (January to April). Crop by products, green vegetables,
weeds and brewery residues were the major portion of pig
diet. Samples of feeding materials used by local farmers were
collected and they were subjected to proximate analysis.
According to the availability of feed resources, feed
formulation comprising four feeding regimes was done. The
results of the present study have suggested that locally
available roughages along with concentrates can be better
utilized for improved productivity of Pakhribas pig in farmers’
condition. A medium size black pig like Pakhribas pig is
suitable to meet both socio-cultural demand and increased
meat production for the eastern hill farmers. Current
unhygienic pig housing system need to be improved for better
health management and improved productivity.
Key words: Feeding system, roughage, concentrates, housing system,
productivity
INTRODUCTION
Pigs are important domestic animals in the eastern hills of Nepal. Forty five per
cent of farmers in the Koshi hills own pigs (Gurung et al. 1989). They have been
playing as an important source of cash income and meat for most hill farmers in
the eastern hills of Nepal, particularly in Rai, Limbu, Magar, and Tamang
communities (Oli, 1986). They have also an important value in the social and
religious events among the communities. Pigs are reared irrespective of socio-
economic categories of farmers (Rai and Kshatri 1994), and among the pig
Nepalese Journal of Agricultural Sciences, 2021, volume 21 ISSN 2091-042X; eISSN 2091-0428
24
rearing communities in the eastern hills rank second in terms of cash generation
(Gatenby et al. 1990).
Pakhribas pig was developed by inter breeding between Tamorth, Saddle Back
and Fayuen in the early 1980's to meet the demand of eastern hill farmers. This
pig is very popular because of its black colour and high productivity (Gatenby et
al. 1990). In spite of the popularity of Pakhribas Pig, it is not performing to its
full potential. The reasons for its low productivity are reported mainly due to
deficiency of feeds and fodder (Joshi, 1988 and Shrestha, 1989). Moreover,
Rajbhandari and Shah, (1981) reported deleterious effects and animal diseases
due to insufficient nutrition at the farm level. The production performance of the
Pakhribas Pig at the Pakhribas Livestock Farm and under Farmers' conditions
differs greatly. ARS-Pakhribas has made a number of recommendations for pig
management however, the farmers have not been able to adopt these practices
due to their lack of awareness and inputs, especially feeds. Moreover, the value
of the product does not usually go above the production costs when the station
management practices are utilized. Hence, it is the very important to develop an
appropriate nutrient management scheme which makes use of indigenous
resources to address the constraints (limited cash incomes and feed resources) of
the marginalized farmers of the hills.
Feed plays an important role in successful pig production representing about 70
to 80 per cent of the production cost (Devendra and Fuller, 1979; Cromwell,
1986). The objectives of this study on the nutritional management strategies for
improved productivity of Pakhribas pig were to find out traditional feeding and
management practices of pigs, to indicate the areas for increasing productivity of
pigs under traditional (village conditions).
MATERIALS AND METHODS
A survey was done using semi-structured questionnaires for the collection of
current feeding practice of the farmers in the ARS-P command areas, and
marginal farmers were targeted as the respondents. The collected samples of
commonly used by the marginal farmers were subjected to proximate analysis
e.g. crude protein, dry matter and others. Simultaneously; literature based on the
research conducted in the area of pig nutrition was collected through visits
within the country and via electronic media from abroad. Based on those
activities treatment diets for different treatment groups were formulated for the
on-farm trial. Four different sites were selected on the basis of altitude
difference (mid, high and low). In the meantime farmers were selected for each
animal to be treated for the feeding trial. Individual sheds were constructed for
each animal using maximum possible locally available construction materials
Nepalese Journal of Agricultural Sciences, 2021, volume 21 ISSN 2091-042X; eISSN 2091-0428
25
(Bamboo, Wood, Thatch roof etc). With the formulated treatments on-farm trial
was conducted in the following fashion.
Location: ARS, Pakhribas Command Areas
Sites: Four on-farm sites covering low, mid and high altitudes
Design: RCBD
Treatments: 4
Animals: 32 (16 males and 16 females) piglets of similar age, sex and body
weight
Housing: Traditional bamboo+wooden materials with thatch roof
Dressing per cent
After 10 months of trial initiation, 12 randomly selected pigs were slaughtered
and they were subjected to dressing per cent. Pigs were slaughtered by
traditional methods i.e. stabbing. When pigs were stunned, the chest cavity was
opened and the blood was collected. Kerosene oil was spread over the dead pig
and ignited. The body was scraped. After scrapping, it was washed with clean
spring water, and then dissected. Measurements of all parts were carried out.
Back fat thickness was measured at the loin. With the given live weight of a pig,
a measure of the yield of saleable meat i.e. killing out per cent (weight of the
dressed carcass as a per cent of live weight before slaughter) was calculated.
Data were analyzed based on the biological and economic information collected.
For analysis of the biological data, GenStat was used and for the economic and
social data, SPSS was used to conclude the findings. The final report was
prepared for the use of farmers and scientists and extension materials were
published for the dissemination of the project finding. One-day stakeholder's
workshop was carried out for the dissemination of generated technology.
Similarly, two days trainers’ training was also organized. Based on the
information collected during dissemination plus the technical report published
earlier, a final report of the project was prepared and published.
Observation on body weight gain was collected on fortnightly basis using the
weighing balance and weigh band. Animals were vaccinated against major
epidemic diseases of pigs in the study sites. Besides this, samples of faeces were collected and analyzed in the laboratory fortnightly basis to know the parasitic
load against the nutritional status of animals. Animals, after finishing the
feeding trial (10 months) were slaughtered to test the carcass quality by
randomly selecting two animals per treatment.
RESULTS AND DISCUSSION Systems of management
About 65 per cent of the farmers kept their pigs in a pig pen throughout the year.
The remaining 35 per cent practised a scavenging system during the dry period
Nepalese Journal of Agricultural Sciences, 2021, volume 21 ISSN 2091-042X; eISSN 2091-0428
26
(January to April) and in a pen for the rest of the year. The time spent on
scavenging each day ranged from 5 to 10 hours, with an average of 7.5 hours.
All pig housing in the survey areas were of local materials, such as bamboo,
mud wall with stone and thatched roof. It was noticed that farmers do not pay
much importance to pig housing, as compared with other livestock. Feeding
troughs were made locally either from wood or stone. Unhygienic conditions
were found in their management systems (like unclean troughs and pigs with not
regularly cleaned). Most pig houses were muddy, dirty and open, with pigs
generally exposed to direct sunlight. This may be one reason why farmers in the
eastern hills prefer black pigs (Aryal, 1998) as white pigs are sensitive to
sunlight and heat and suffer from skin diseases. Compost was found to make
with leaf litter collected from the forest, greens from baris and mixed with pig
manure. They used compost in their kitchen gardens and other crop fields to
increase the production and productivity.
Feeding system of pigs
Pigs in the eastern hills are reared in the traditional feeding and management
system. Feed plays an important role in successful pig production representing
about 70 to 80 per cent of the production cost (Devendra and Fuller, 1979;
Cromwell, 1986). They are fed with the locally available feed ingredients
mainly based on greens, residues, rice bran, maize bran, kitchen wastes etc
(Table 1). Pigs are extensively fed on local vegetation e.g. Sisnu (Urtica dioca),
Amaranthus spp, gagleto etc.
Table 1. Chemical composition of diets
(i) Major ingredients
Cereal by-products DM CP EE CF TA NFE Ca P Ma K DE
Jand ko kat
(Distillars' residues)
16.20 17.7 6.80 11.6 5.90 58.00 0.50 0.30 0.06 0.43 15.30
Jandko chhokra
(Mashed brewery
residues)
29.54 16.0 4.55 10.9 2.76 65.71 0.64 0.19 0.03 0.16 15.27
Tongbako chhokra
(Brewery residues)
18.60 14.6 3.50 11.0 5.05 65.80 2.05 0.36 0.04 0.67 14.95
Makaiko bhus
(Maize bran)
87.42 9.06 4.12 5.94 2.85 78.03 0.32 0.40 0.02 0.43 15.55
Makaiko pitho
(Maize flour)
88.60 13.2 2.74 3.68 4.71 75.62 0.32 0.79 0.03 0.71 15.43
Dhanko bhus(Rice
bran)
88.08 13.0 4.15 29.3 18.15 28.40 0.51 0.40 0.05 0.72 12.59
According to the availability of the above ingredients at different seasons, they
are placed in a container, mixed thoroughly with water, generally boiled/cooked
and added little amount of flour or bran (maize, wheat, rice, millet) and fed to
the pigs in the morning and evening. Frequently green grass is also provided as
feed and their bedding materials Similar results were also found in the studies of
Aryal et al., 1994; Shrestha et al., 1997 and Subba et al., 1990. In the pig

Nepalese Journal of Agricultural Sciences, 2021, volume 21 ISSN 2091-042X; eISSN 2091-0428
27
farming in eastern hills, the major problem cited was feed (Rai and Kshatri,
1994 and Shrestha et al., 1997). Aryal et al. (1994) reported that the cereals
contribute 66%, brewing residues and kitchen left over 18% and green
vegetables and grasses 16% of the total dry matter in the diet of pig.
Table 1: contd..
(ii) Green supplements
Vegetables and
weeds
DM CP EE CF TA NFE Ca P Ma K DE
Mane (Alocasia
spp)
10.42 11.68 1.62 19.43 19.74 47.53 1.78 0.51 0.19 2.70 11.38
Pindalu
(Colocasia spp)
9.05 17.31 1.78 15.19 16.68 49.04 1.81 0.48 0.14 1.80 13.52
Sisnu (Urtica
spp.)
17.74 31.38 0.97 9.44 18.76 56.96 13.38
Palunge 14.45 16.31 0.94 12.32 15.53 54.90 1.59 0.46 0.20 1.39 13.72
Ratneulo 13.01 9.87 1.14 18.36 12.17 50.46 13.50
Remai jhar 11.32 26.68 1.01 23.01 16.35 32.95 1.86 0.59 0.15 1.39 12.91
Dhendu Phule 7.12 18.87 1.13 14.41 17.56 48.03 1.67 0.78 0.19 1.71 13.44
Latte
(Amarantuus spp)
11.53 19.31 1.86 11.24 17.67 49.92 0.08 0.56 0.18 1.84 13.77
Kane Jhar 11.46 15.06 1.39 15.97 18.32 49.26 2.07 0.53 0.13 1.30 13.27
Pharsi 11.27 15.81 1.42 10.62 17.11 55.04 2.65 0.54 0.11 1.39 13.79
Halhale 9.25 25.12 2.24 11.24 16.73 44.67 1.35 0.38 0.25 1.48 13.93
Galgale 12.01 19.18 0.97 16.06 22.14 41.65 4.03 0.27 0.14 1.68 12.94
Gagleto 10 22.1 3.25 15.3 22.56 36.68
R. Latte 29.65 16.87 4.54 17.2 8.55 52.84
W. Latte 13.12 19.21 2.75 15.79 19.02 43.13
Radish leaves 8.82 16.31 3.23 13.28 17.47 49.71
Sim Rayo 7.74 22.06 2.31 17.68 24.98 33.03
Cabbage 8.39 20.44 3.53 13.5 18.06 44.47
Kuvindo 5.24 6.7 1.26 15.78 6.82 69.44
Kuvimdo leaves 9.55 29.39 3.65 10.87 15.33 40.77
Pindalu gano 3.43 8.81 2.86 27.38 21.81 39.14
DM: g/100 g fresh matter; DE: MJ/kg DM; All other values: g/100 g DM
Feed formulation
Concentrate based feed were prepared by mixing different ingredients like
maize, mustard cake, bone meal, rice bran, mineral and salt (Table 2a,b, c).
Starter, grower and finisher ration were prepared. The starter, grower and
finisher ration were fed to pigs up to 25, 65 and above 65 kg of body weight
respectively. Crude per cent was maintained 18, 16, and 14 in starter, grower
and finisher ration respectively. Concentrate ration formulated was fed along
with roughage in the following manner:
Treatment group 1: Roughage 70 parts: concentrate 30 parts
Treatment group 2: Roughage 60 parts: concentrate 40 parts
Treatment group 3: Roughage 80 parts: concentrate 20 parts
Nepalese Journal of Agricultural Sciences, 2021, volume 21 ISSN 2091-042X; eISSN 2091-0428
28
Treatment group 0: Farmers own practice
Table 2. Types of ration provided during the trail and their ingredients
a. Starter ration
Ingredients Quantity CP (%)
Maize 48 5.76
Mustard cake 20 5.60
Bone Meal 11 4.4
Rice Bran 19 2.28
Mineral 1 -
Salt 1 -
Total 100 18
b. Grower ration
Ingredients Quantity CP (%)
Maize 52 6.24
Mustard cake 15 4.20
Bone Meal 7 2.8
Rice Bran 24 2.88
Mineral 1 -
Salt 1 -
Total 100 16
c. Finisher ration
Ingredients Quantity CP (%)
Maize 57 6.84
Mustard cake 10 2.8
Bone Meal 3 1.2
Rice Bran 28 3.36
Mineral 1 -
Salt 1 -
Total 100 14
CP: Crude protein
Body weight gain
The average body weight gain was observed 462 g/day (Table 3) but the highest
gain was observed in T2 group (60 roughage: 40 concentrate) followed by T1
(70:30), T3 (80:20), and T0 (farmers. own practice) (Table 3).
Table 3. Body weight gain (g) on the basis of treatment group
Treatment group Average weight
gain (g)
Number Standard
Deviation
Significance
Farmers’ own practice 362 72 0.273 0.01
Roughage:Concentrate (80:20) 401 73 0.298
Roughage:Concentrate (60:40) 563 58 0.396
Roughage:Concentrate (70:30) 525 57 0.451
Total 462 260 0.348
Nepalese Journal of Agricultural Sciences, 2021, volume 21 ISSN 2091-042X; eISSN 2091-0428
29
On the basis of sites, the highest body weight gain was observed in Basantapur
(521 g) followed by Pakhribas (499 g), Mulghat (498 g), and
Ghorlikharka/Jarayotar (318 g) (Table 4).
Table 4. Body weight gain on the basis of sites
Sites Average weight
gain (g)
Number Standard
Deviation
Significance
Ghorlikharka/Jarayotar 318 62 0.226 0.005
Pakhribas 499 61 0.394
Basantapur 521 66 0.336
Mulghat 498 71 0.342
Total 462 260 0.325
On the basis of sex, males (518 g) were found to grow more per day as compared
to females (406 g) (Table 5).
Table 5. Body weight gain on the basis of sex
Sex Average weight gain (g) Number Standard Deviation Significance
Male 518 129 0.397
0.015
Female 406 131 0.325
Total 462 260 0.361
Dressing per cent
Dressing per cent was found highest in T2 (i.e. roughage 60: concentrate 40)
group followed by T1 (70:30), T3 (80:20) and T0 (farmers own practice group)
(Table 6).
Table 6. Dressing per cent after slaughtering the pig
Particulars T1 (70:30) T2 (60:40) T3 (80:20) T0 (Farmers own)
Live weight (kg) 179.5 186.5 175 93
Dressing % 60.50 61.01 59.67 59.39
Heart (kg) 0.400 0.303 0.500 0.267
Lung (kg) 0.700 0.694 0.600 0.550
Kidney (kg) 0.375 0.379 0.250 0.200
Spleen (kg) 0.275 0.186 0.200 0.117
Liver (kg) 1.675 1.480 1.500 0.950
Backfat thickness (cm) 3.1 3.3 2.97 2.75
Feed conversion ratio (FCR)
The least feed intake (2.95 kg) was found in T2 (roughage 60: concentrate 40)
group followed by T1 (3 kg), T3 (4.5 kg) and T0 (5.1 kg) for the production of 1
kg of meat (Table 7)
Table 7. Feed conversion ratio for producing 1 kg of meat (kg)
Group Feed (kg) Numbers
T1 (70:30) 3 8
T2 (60:40) 2.95 8
T3 (80:20) 4.5 8
T0 (Farmers’ own) 5.1 8
Nepalese Journal of Agricultural Sciences, 2021, volume 21 ISSN 2091-042X; eISSN 2091-0428
30
Chemical analysis of meat
The meat of slaughtered pigs was subjected to chemical analysis (moisture
content, ash, fat, crude protein, PH after 1 hour of slaughtering and PH after 24
hours of slaughtering). However these parameters were not significantly
different in different treatment groups (Table 8).
Table 8. Chemical analysis of meat after slaughtering of pigs
Group Moisture
(%)
Ash Fat CP PH (24
hrs)
PH (1 hr)
T1 72.77 1.50 7.9 26.66 5.69 6.10
T2 71.61 1.40 10.4 26.31 5.87 6.23
T3 67.48 1.56 12.4 25.52 5.75 6.13
T0 75.75 1.47 8.8 25.23 5.70 6.18
NS NS NS NS NS NS
NS: Not significant
Economic analysis
Maximum body weight and gain was achieved in treatment group 2 (roughage:
concentrate - 60:40) followed by T1 (70:30). After slaughtering of pig, highest
income was made in T2 followed by T1 and T3 (Table 9 a).
Table 9 (a). Market price of meat drawn from various treatment groups
Group Wt.
gain/day
(g)
Body wt.
(kg) for
345 days
Dressing
%
Dressed
wt. (kg)
Price @ Rs.
150/kg
T0 362 125.00 59.39 74.23 11134.5
T3 401 138.34 59.67 82.54 12381
T2 563 194.25 61.01 118.51 17776.5
T1 525 181.12 60.50 109.57 16435.5
On the basis of market price of feed ingredients, the total feed cost of starter;
grower and finisher ration was calculated as Rs. 24.82, 23.22 and 20.92 per
kilogram (Table 9, b). Contribution of roughage and concentrate for producing 1
kilogram of meat was calculated (Table 9, c). Price of roughage was fixed as Rs.
2/ kg according to local rate. Treatment groups T1 (70:30) and T2 (60:40) were
observed as most profitable (Table 9, d) with attractive returns as compared to
T3 (80:20) and T0 (farmers’ own practice). In the farmers own practice it has
been assumed that they give 10 % concentrate to their pigs as feed along with
90% roughage.
Table 9 (b). Market price of feed ingredients
Ingredients Price
(Rs./kg)
Starter ration Grower ration Finisher ration
Parts/100 kg Cost Parts/100 kg Cost Parts/100 kg Cost
Maize 20 48 960 52 1040 57 1140
Mustard cake 22 20 440 15 330 10 220
Rice bran 18 19 342 24 432 28 432
Mineral 120 1 120 1 120 1 120
Nepalese Journal of Agricultural Sciences, 2021, volume 21 ISSN 2091-042X; eISSN 2091-0428
31
Salt 15 1 15 1 15 1 15
Bone meal 55 11 605 7 385 3 165
Price/kg feed, Rs 24.82 23.22 20.92
Table 9 (c). Feed conversion ratio and contribution on FCR from
concentrate and roughage
Group FCR Concentrate Roughage
T1 3 0.9 2.1
T2 2.95 1.18 1.77
T3 4.5 0.9 3.6
T0 5.1 0.51 4.59
FCR: Feed conversion ratio
Table 9 (d). Cost involvement in concentrate and roughage and profit from
the sale of meat
Group Weight
(kg)
Total consumption Cost Total
feed cost
Income from
meat (Rs)
Profit
(Rs) Concentrate Roughage Concentrate Roughage
T0 125 66.86 601.74 1536.44 1203.48 2739.92 11134.5 8394.58
T3 138.34 124.51 498.02 3179.05 996.04 4175.09 12381 8205.91
T2 194.25 226.75 340.12 5210.71 680.24 5890.95 17776.5 11885.55
T1 181.12 163.01 380.35 4162.13 760.70 4922.73 16435.5 11512.77
Problem of farmers
Most of the farmers reported that the dry season is the most difficult period to
meet the feed requirement of pigs. Majority of the grasses and vegetables are
unavailable during the period and cereals are also in limited supply for
concentrates and brewing. Farmers use a variety of feed ingredients for feeding
pigs depending upon their access to resources (Shrestha et al. 1997). However,
the quantity of feed is greatly variable among the farmers. In farmers condition,
crude matter intake is very low, so the level of crude matter intake should be
improved for better productivity. Mustard cake and Soya bean cake can be some
of the cheapest sources of protein supplement for improving local diet quality in
the eastern hills.
DISCUSSION
Successful pig production requires a planned and efficient feeding programme.
To have the profitable and efficient production, pigs must be provided with
sufficient protein, vitamins, fats and carbohydrates in their daily ration. Pig
grows at a very faster rate and thus the demands for feed are very high. Pigs
require different rations at different stages of life. As the pig grows older,
protein requirement in proportion to body weight significantly decrease. Animal
protein in particular, is more indispensable for young than for the older animal
and the ability of the pig to deal with roughages increases with age,
Most communities in the eastern hills comprise subsistence farmers. As
commercial foodstuffs are less available and farmers are dependent on locally

Nepalese Journal of Agricultural Sciences, 2021, volume 21 ISSN 2091-042X; eISSN 2091-0428
32
available feed resources (Shrestha et al. 1997), it is difficult for farmers to
manage bigger herds. In the present context, a herd size of 2 or 3 per household
utilizing local resources for feeding and housing is suggested for its
sustainability. The heavy breeds of pig demand more food, and better
management (Aryal, 1999). The average mature live weight of Pakhribas pig is
100-200 kg. Therefore, a medium size pigs like Pakhribas pig can be suggested
for the existing conditions for better management along with good return.
CONCLUSION
Pig farming is very important in Rai, Limbu, Magar and occupational caste
communities and it can not be separated from existing agricultural farming in
the eastern hills. The results of the present study have suggested that locally
available roughages along with concentrates can be better utilized for improved
productivity of Pakhribas pig in farmers condition. A medium size black pig like
Pakhribas pig is suitable to meet both socio-cultural demand and increased meat
production for the eastern hill farmers. Current unhygienic pig housing system
need to be improved for better health management and improved productivity.
REFERENCES Aryal, I.K., (1998) Colour preference of pigs for sustainable pig production in the hills of eastern
Nepal. Paper presented at the Fourth Global Conference on Domestic Animal Genetic
Resources organized by Rare Breed International and Nepal Agricultural Research
Council (NARC), August 17-21, 1998. Kathmandu, Nepal
Aryal, I.K. (1999) Importance of pig production and strategy for sustainable development in the
eastern hills of Nepal. Proceedings of III National Conference on Science and
Technology Volume 2: 880-889
Aryal I.K., N.P. Shrestha, P.B. Chemjong and H.B. Gurung (1994) Establishment of nucleus
breeding units: A sustainable way for disseminating technology. Proceedings of the IInd
National Conference on Science and Technology (RONAST), Kathmandu, Nepal.
Cromwell, G.L. (1986) Feeding Swine. p 389. In D.C. Charch ed. Livestock Feeds and Feeding.
New Jersey 07632, USA.
Devendra, C. and Fuller. M.F. (1979) Pig production in the tropics. Oxford University Press. p. 72.
Gurung, H.B., Gatenby, R.M., Neopane, S.P., Shrestha N.P. and. Chemjong P.B (1989) Numbers of
animals on farms in the Koshi hills. PAC Technical Paper No. 109. Pakhribas
Agricultural Centre, Dhankuta, Nepal.
Gatenby, R.M., Shrestha, N.P. and Joshi, Y.R. (1990) The benefits of animal keeping in the Koshi
hills. PAC Technical Paper No. 137. Pakhribas Agricultural Centre, Dhankuta, Nepal.
Oli, K.P. (1986) Comparative study of carcass yield of different breeds of pigs in the eastern hills of
Nepal. PAC Technical Paper No. 90. Pakhribas Agricultural Centre, Dhankuta Nepal
Rai, U.P. and Kshatri, B.B. (1994) An evaluation of the pig nucleus breeding unit program in the
Koshi hills. PAC Technical Paper No. 160. Pakhribas Agricultural Centre, Dhankuta,
Nepal.
Shrestha, N.P., Aryal, I.K. and Gurung, H.B. (1997) Traditional feeding practices for pigs in the
Koshi hills. Nepal Agriculture Research Journal Vol. 1 No. 1. Nepal Agricultural
Research Council, Society of Agricultural Scientist, Nepal: 71-76
Subba, D.B., Tamang, P.M. and Mahato, S.N. (1990) Livestock in the hills of Nepal. Proceedings of
Second Livestock Workshop. Pakhribas Agricultural Centre, Dhankuta Nepal
Nepalese Journal of Agricultural Sciences, 2021, volume 21 ISSN 2091-042X; eISSN 2091-0428
33
Effects of desiccation and immersion on larval and
pupal survival of Chinese citrus fly (Bactrocera
minax) (Diptera: Tephritidae)
Kishor Bhandari 1*
, G. Timilsina2, G. Gautam
3 and
M.K. Thakur 1
1Directorate of Agricultural Research, Tarahara;
2 Agricultural Research Station,
Pakhribas, 3Agricultural Research Station, Jaubari
*Corresponding Author: [email protected]
ABSTRACT
Chinese citrus fly (Bactrocera minax) is the notorious pest of
citrus crops in Asia. It has spread largely from Taplejung to
Myagdi in mid-hills of Nepal at 27 to 28 degrees north
latitude. Mid-hills of Nepal has subtropical climate with
abundant rainfall. Therefore, soil moisture can be a major
factor affecting the survival of larvae and puape of B. minax.
In the present research, response of Chinese citrus fly third
instar larvae and puape to desiccation and immersion was
examined in the Laboratory of National Citrus Research
Program, Paripatle. The result revealed that time to 50 %, 90
% and 99 % mortality (LT 50, LT 90 and LT 99) of third instar
larvae were 22.87, 55.99 and 116.16 h in the desiccation test,
and 44.42, 171.08 and 513.568 h in the immersion test.
Similarly, LT 50, LT 90 and LT 99 values of pupae were 34.5,
95.1 and 217 h in desiccation test and, 139.8, 341.4 and 706.8
h in immersion situation.The average eclosion duration of
survived flies was not significantly different with desiccation
time. Additionally, treated larvae did not emerge beyond 72 h
in dry soils, though it emerged even after 192 h in immersion
condition. Cumulative weight loss of larvae as well as pupae
increased curvilinearly with desiccation time, and the rate of
weight loss was greatest during the first 55 h of desiccation.
The cumulative weight loss was 54.7±3.4 % for larva and
44.12±6.0 % for pupa during 96 h of desiccation. The
relationship between the mortality and cumulative weight loss
percentage was explained by probit model in desiccation test.
It was estimated that when percentage of cumulative weight
loss was 39.5 %, 60.2 % and 84.9 %, respectively, the
mortality rates was 50 %, 90 % and 99 %, correspondingly.
Key words: Citrus, maggot, soil-moisture stress, mortality, adult emergence

Nepalese Journal of Agricultural Sciences, 2021, volume 21 ISSN 2091-042X; eISSN 2091-0428
34
INTRODUCTION
Chinese citrus fly (Bactrocera minax) is very devastating insect of citrus crops
causing 15-97 % losses especially in mandarin, sweet orange, lemon and
pummelo (Bajracharya, 2008). Its populations has largely distributed in areas at
27 to 28 degrees north latitude (Bhandari et. al., 2018a) from Taplejung to
Myagdithat has a subtropical monsoon climate. The biology and survival of the
Chinese citrus fly is entirely unique than other fruit fly species in being
univoltine and oligophagous nature (Bhandari et. al., 2018b).B. minax has four
developmental stages. The developmental phases of larva and pupa are longest,
and during these stages, B. minax are in contact with the soil. Generally,
maggot-infested fruits drop from the trees at the last week of September to
November in orchards and larvae live in the fruit till they reach the third instar,
after which they burrow into the soil to pupate. Adult flies emerge from the soil
from first week of April to third week of May but maximum (about 70 percent)
adult flies emerge on first fifteen days of April (Bhandari et. al., 2018a).
Soil moisture is the most important lethal factor during the pupa period for
several fruit fly species (Yee, 2013; Quesada et.al, 2012; Hulthen & Clarke,
2006). Pupae of Bactrocera dorsalis (Hendel) (Ren et.al, 2007)) and Bactrocera
correcta (Bezzi) (Wei & Zeng, 2011) cannot survive 100% soil moisture
conditions, while the same moisture content causes only 30 % pupal mortality in
B. tryoni (Froggat) (Hulthen & Clarke, 2006). In general, mortality of pupa
increases with increasing moisture content in soil (Zhang & Li, 2001; Liu et.al,
2010). Tolerance of insects to water immersion and desiccation is different
among species. For example, Cieindellatogata has a maximum larval survival
time of 6 d and time to 50 % mortality of 85.9 h, which is more than eight times
longer than those of similarly treated larvae of Tenebrio molitor immersed in
water (Luo & Chen, 1987).
Though various studies have been carried out to determine the effects of
temperatures on development, survival and fertility of the other fruit fly species
(Vargas et.al., 1984; Yang et.a., 1994; Vergas et.al., 1996; Vergas et.al., 1997;
Vergas et.al., 2000), less attention has been paid to the effects of humidity and
desiccation on the Chinese citrus fly. Some researchers have shown that soil
humidity has a direct and strong effect on pupal development and adult
emergence ratios of Chinese citrus fly (Li et.al. 2019). However, it is not well
known about the tolerance of the Chinese citrus fly to extreme humidity and
desiccation. Therefore, this study aimed to determine the effects of immersion
and desiccation of B. minax larvae and pupae on survival and emergence, and
relationship between desiccation duration, cumulative weight loss and mortality.
This information may provide support for the distribution of B. minax in wet
conditions and recommend an appropriate management option.
Nepalese Journal of Agricultural Sciences, 2021, volume 21 ISSN 2091-042X; eISSN 2091-0428
35
MATERIALS AND METHODS
Insects
Chinese citrus fruit fly (Bactrocera minax) used in experiments were collected
from infested fruits at citrus orchard, National Citrus Research Program
(NCRP), Paripatle, Dhankuta. The experiment was conducted on November
2014. Late third instar larvae were collected from orchard and placed in moist
sand at laboratory till pupation. Hence, third instar larvae as well as the freshly
metamorphosed pupae were used in the experiments.
1. Desiccation tolerance test
The soil samples collected at 0-20 cm depths from citrus orchard, National
Citrus Research Program (NCRP), Paripatle were oven dried for making
desiccation test against larvae and pupae of Chinese citrus fruit fly (Bactrocera
minax). At first, the soils were sifted through a 1 mm mesh metal sieve and dried
at 100 oC for 48 h in an oven. Eight durations (12, 24, 36, 48, 60, 72, 84 and96
hours) were designed for the desiccation research, each with 40 pupae/larvae for
testing. The larvae/pupae were placed in plastic cups containing dried soil. The
cups were drilled to make some holes to ensure adequate aeration. Then, the
cups were held in chamber at room temperature. Individual cups were removed
from the chamber at prescribed time periods. The larvae/pupae were screened
from the soils, transferred to another plastic cup with moist and sterile sand and
kept at room temperature for emergence. Newly emerged flies were checked and
removed daily until no emergence was observed. Control pupae were placed in
moist sand at the beginning i.e., desiccation duration = 0 h. Each treatments
were replicated four times in the experiment. Hence, both third instar larvae as
well as pupae were used in desiccation response test.
2. Weight loss in desiccation
Cumulative weight loss of the pupae in dried soils over time was observed
gravimetrically. Forty pupae were weighed as a group on an electronic balance
and kept in desiccation conditions as described above. The pupae were screened
from the soils and reweighed after exposing to defined desiccation durations (12,
24, 36, 48, 60, 72, 84 and 96 hours). The cumulative weight loss for forty pupae
was calculated using the following equation: (Mo – Mt)/ Mo, where Mo was the
initial fresh mass, Mt was the mass measured at specific time durations as
mentioned above. Four replications were designed.
3. Immersion tolerance test
Third instar larvae and freshly metamorphosed pupae were immersed in still
water at room temperature. Sodium benzoate was added to the tap water to
prevent growth of fungi. About 320 larvae/pupae were immersed in water for
eight time durations of 24,48,72,96,120,144,168 and 196 hours. Forty larvae as
well as pupae were removed randomly from the water and transferred to plastic
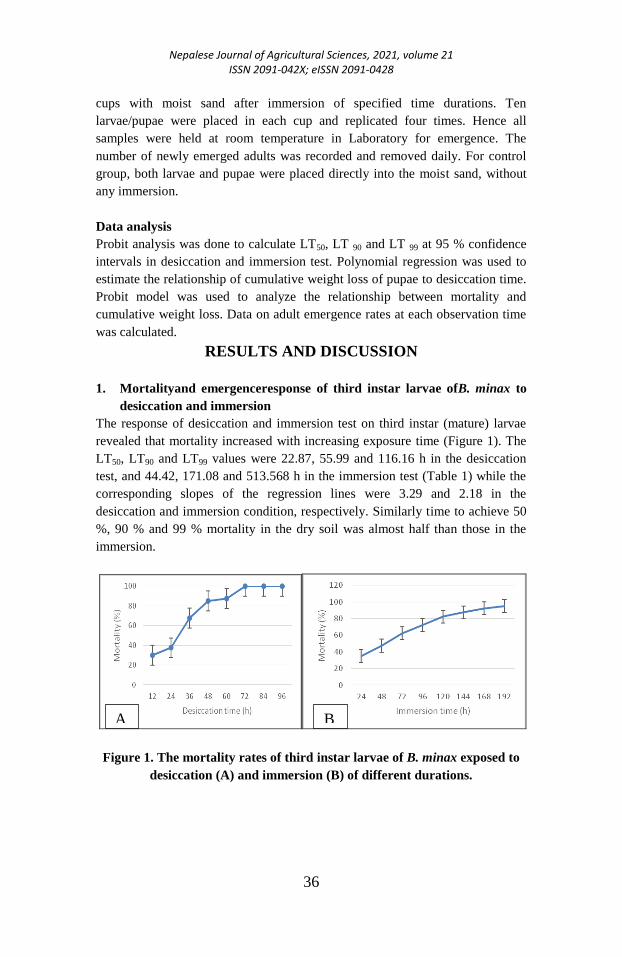
Nepalese Journal of Agricultural Sciences, 2021, volume 21 ISSN 2091-042X; eISSN 2091-0428
36
cups with moist sand after immersion of specified time durations. Ten
larvae/pupae were placed in each cup and replicated four times. Hence all
samples were held at room temperature in Laboratory for emergence. The
number of newly emerged adults was recorded and removed daily. For control
group, both larvae and pupae were placed directly into the moist sand, without
any immersion.
Data analysis
Probit analysis was done to calculate LT50, LT 90 and LT 99 at 95 % confidence
intervals in desiccation and immersion test. Polynomial regression was used to
estimate the relationship of cumulative weight loss of pupae to desiccation time.
Probit model was used to analyze the relationship between mortality and
cumulative weight loss. Data on adult emergence rates at each observation time
was calculated.
RESULTS AND DISCUSSION
1. Mortalityand emergenceresponse of third instar larvae ofB. minax to
desiccation and immersion
The response of desiccation and immersion test on third instar (mature) larvae
revealed that mortality increased with increasing exposure time (Figure 1). The
LT50, LT90 and LT99 values were 22.87, 55.99 and 116.16 h in the desiccation
test, and 44.42, 171.08 and 513.568 h in the immersion test (Table 1) while the
corresponding slopes of the regression lines were 3.29 and 2.18 in the
desiccation and immersion condition, respectively. Similarly time to achieve 50
%, 90 % and 99 % mortality in the dry soil was almost half than those in the
immersion.
Figure 1. The mortality rates of third instar larvae of B. minax exposed to
desiccation (A) and immersion (B) of different durations.
A B
Nepalese Journal of Agricultural Sciences, 2021, volume 21 ISSN 2091-042X; eISSN 2091-0428
37
Table 1. Estimated lethal times (LT50, LT90, LT99) of Bactrocera minax third
instar larvae in different treatments
Treatments Intercept
(SE)
Slope
(SE)
LT50
LT90 LT99
Desiccated
soil
-4.482
(0.533)
3.297
(0.343)
22.879
(15.559-
29.302)
55.998
(43.225-
86.609)
116.169
(77.726-
268.047)
Immersion -3.606
(0.544)
2.189
(0.284)
44.426
(33.881-
53.845)
171.083
(137.403-
237.251)
513.568
(341.129-
1002.475)
In the desiccated soil, flies emerged in 169-171 day (d) but the greatest number
of adults emerged in 171 d, regardless of desiccation durations. No significant
difference was observed in the average emergence time among different
desiccation durations (Table 3). However, there was significant difference in
adult emergence rates in response to desiccation durations. Though treated
larvae emerged even after 192 h in immersion condition, it did not emerge
beyond 72 h in dry soils.
In the immersion test, though average adult eclosion time ranged from 172.7 to
175.5 d, the largest number emerged in 174 d. There were no significant
differences in the average eclosion time among different immersion period
(Table 4). Nevertheless, there was slight delayed in first adult emergence under
immersion condition than dry soils.
2. Mortality and emergenceresponse ofB. minaxpupae to desiccation and
immersion
The mortality trend of B. minax pupae in response to desiccation and immersion
has been shown in Figure 2. LT50, LT90 and LT99 values were 34.5, 95.1 and 217
h in desiccation test and, 139.8, 341.4 and 706.8 h in immersion situation
whereas corresponding slopes were 2.9 and 3.3, respectively.Time to attain 50
%, 90 % and 99 % mortality in the dry soil was much shorter than those in the
immersion.
Figure 2. The mortality rates of B. minax pupae exposed to desiccation (A)
and immersion (B) of different durations
A B
Nepalese Journal of Agricultural Sciences, 2021, volume 21 ISSN 2091-042X; eISSN 2091-0428
38
Table 2. Estimated lethal times (LT50, LT90, LT99) of Bactrocera minax pupa
in different treatments
Table 3. Eclosion rate and average emergence duration of B. minax in
desiccation test
Average eclosion time ranged from 169.7 to 172.5 d in the dry soil, and 170.7 to
173.5 d in immersion condition. No significant difference was found in average
emergence duration of pupa in response to desiccation and immersion (Table 3,
4). Similarly, there was significant difference in adult eclosion rates among
different immersion durations. Adult eclosion rate of treated pupae was 39.5 %
for control that varies significantly with different exposure durations.
Treatments Intercept(SE) Slope (SE) LT50
LT90 LT99
Desiccated
soil
-4.477
(0.519)
2.910
(0.312)
34.538
(29.745-39.213)
95.198
(79.809-121.918)
217.575
(161.252-340.167)
Immersion -7.095
(0.915)
3.307
(0.439)
139.887
(125.135-160.202)
341.477
(268.586- 506.474)
706.874
(482.417- 1343.329)
Third instar larvae of Bactrocera minax Pupae of Bactrocera minax
Desicc
ation
time
(h)
Eclosion percent (Mean±SEM) Averag
e time
to
emerge
nce
(d)
Eclosion percent (Mean±SEM) Average
time to
emergence
(d)
160d 165d 170d 175d Total 160d 165d 170d 175d Total
0 4.0
±0.8a
5.7
±1.7a
19.5
±1.0a
8.2
±1.2a
37.5
±2.0a
169.5±4
.7a
6.2
±0.5a
7.2
±0.5a
17.5
±1.2a
7.0
±0.8a
38.0
±0.8a
169.7±5.
6a
12 4.0±0.
8a
4.7
±0.9ab
14.5
±1.2b
5.5
±1.2b
28.5
±1.2b
171.7±4
.9a
5.0±0.
8b
6.0±0.
8b
16.5±1.2
a
5.7±0.9
a
33.2±0
.9b
171.7±5.
6a
24 4.0
±0.8a
3.7
±0.9b
10.5
±1.0c
5.2
±1.5b
23.7
±0.9c
171.2±5
.8a
4.2
±0.5b
c
5.2
±0.5b
6.5
±2.5b
6.0
±0.8a
29.5
±1.2c
171.5±7.
0a
36 1.7
±0.5b
2.5
±0.5c
6.7
±2.5d
1.7
±1.2c
12.7
±1.2d
169.7±2
.8a
4.0
±0.8c
5.0
±0.8bc
5.0
±0.0c
4.0
±1.4b
19.5
±1.2d
170.2±2.
8a
48 0.5
±0.5bc
1.2
±0.5d
4.2
±1.2e
1.2
±0.5cd
7.2 ±0.9e 169.5±4
.9a
2.5
±0.5d
4.0
±0.8cd
3.2
±1.7cd
3.0
±0.8bc
14.5
±1.2e
170.0±4.
5a
60 1.0
±0.0cd
0.7
±0.5de
3.0
±0.0e
0.5
±0.5cd
5.2 ±0.5f 171.5±3
.8a
2.0
±0.8d
3.2
±1.7d
2.7
±1.2de
2.0
±1.4cd
10.5
±1.2f
172.5±3.
8a
72 0.0
±0.0d
0.0
±0.0e
0.0
±0.0f
0.0
±0.0d
0.0 ±0.0g 171.2±4
.6a
1.0
±0.8e
1.5
±1.0e
1.2
±0.5e
0.7
±0.9de
6.0
±0.8dg
171.5±5.
0a
84 0.0
±0.0d
0.0
±0.0e
0.0
±0.0f
0.0
±0.0d
0.0 ±0.0g 171.7±2
.7a
0.7
±0.5e
1.25
±0.9e
1.2
±0.5e
0.7
±0.5de
4.0
±0.8h
172.5±1.
9a
96 0.0
±0.0d
0.0
±0.0e
0.0
±0.0f
0.0
±0.0d
0.0 ±0.0g 171.0±1
.1a
0.2±0.
5e
0.7±0.
5e
2.2±0.5e 0.0±0.0
e
3.2±0.
5h
171.5±0.
5a
F-Test *** *** *** *** *** ns *** *** *** *** *** ns
LSD
(0.05)
0.9 1.0 1.6 1.3 1.5 0.9 1.09 2.1 1.3 0.7
CV % 36.5 36.0 17.1 36.3 8.3 21.5 19.7 19.1 3.0
Nepalese Journal of Agricultural Sciences, 2021, volume 21 ISSN 2091-042X; eISSN 2091-0428
39
Table 4: Eclosion rate and average emergence duration of B. minax in
immersion test
Third instar larvae of Bactrocera minax Pupae of Bactrocera minax
Imm
ersio
n
time
(h)
160
d
165d 170d 175d 180d Tota
l
Averag
e time
to
emerge
nce, d
160
d
165d 170d 175d 180d Total Averag
e time
to
emerge
nce, d
0 4.7±0.9
a
5.7±
0.9a
3.7±
0.9a
14.7±2
.3a
8.2±
3.5a
37.2±1
.7a
172.7
±5.6a
5.2±
0.5a
5.5±1.
2a
21.2±
1.7b
4.5±
0.5a
3.0±
0.0a
39.5±
0.5a
170.7
±5.6a
24 3.7±0.
9b
4.7±
0.9b
2.7±
0.9b
10.5±1
.0b
3.2±
1.5b
25.0±1
.8b
174.7
±5.6a
4.2±
0.5b
4.7±1.
2ab
23.7±
1.5a
3.7±0
.5ab
2.5±
0.5a
39.0±
0.8a
172.7
±5.6a
48 3.7±
0.9b
4.7±
0.9b
2.7±
0.9b
7.5±
1.7c
1.5±1.
0bc
20.2±
1.7bc
174.5
±7.0a
4.0±
0.8b
4.5±1.
0abc
23.5±
1.9a
3.2±0
.9bc
1.7±
0.5b
37.0±
0.8b
172.5
±7.0a
72 2.7±
0.9c
3.7±
0.9c
1.7±
0.9c
5.0±
1.4d
1.2±
0.9c
14.2±1
.7c
173.2
±2.8a
3.7±
1.2b
4.0±0.
8bcd
21.5±
1.7b
2.7±0
.5cd
1.2±0
.5bc
33.2±
0.9bc
171.2
±2.8a
96 2.2±
0.5c
2.7±
0.5d
1.5±
0.5c
2.7±
0.9e
1.0±
0.8c
10.2±1
.7c
173.0
±4.5a
3.0±
0.8c
3.2±0.
9cde
15.2±
1.5c
2.2±0.
9de
0.5±0
.5cd
24.2±
0.9cd
171.0
±4.5a
120 1.2±
0.9d
1.7±
0.9e
0.7±0.
9de
1.7±0.
9ef
0.2±
0.5c
5.7±
2.5c
175.5
±3.8a
2.7±
1.2c
2.7±0.
9def
14.5±
2.0c
1.5±1
.0ef
0.7±
0.5d
22.2±
1.7d
173.5
±3.8a
144 0.7±0.
5de
1.2±0.
9ef
1.0±
0.8d
1.0±
0.8f
0.0±
0.0c
4.0±
2.1c
174.2
±3.8a
2.0±
0.8d
2.2±0.
9ef
12.7±
1.2d
1.0±0.
8fg
0.2±
0.5d
18.2±
0.9d
172.5
±3.8a
168 0.5±0.
5de
0.7±0.
5fg
0.2±
0.5f
1.2±0.
5ef
0.0±
0.0c
2.5±
1.2c
174.5
±3.8a
2.0±
0.8d
1.7±0.
9f
10.2±
1.2e
0.7±0
.5fg
0.5±
0.5d
15.2±
0.9d
173.5
±1.9a
192 0.2±
0.5e
0.2±
0.5g
0.5±0.
5ef
0.7±
0.5f
0.0±
0.0c
2.0±
0.8c
174.5
±0.1a
1.2±
0.5e
2.2±2.
6ef
10.0±
2.8e
0.5±
0.5g
0.2±
0.5d
14.2±
0.9d
172.5
±0.5a
F-
Test
*** *** *** *** *** *** ns *** *** *** *** *** *** ns
LSD,
0.05
0.7 0.8 0.4 1.7 1.8 1.0 0.5 1.4 1.6 0.8 0.6 0.6 4.8
CV % 23.5 19.8 18.4 23.1 73.5 5.1 12.4 28.7 6.6 26.3 36.9 1.5 1.9
3. Weight loss of larva and pupa in desiccation
Cumulative percentage of weight loss (Y) increased curvilinearly with
desiccation time in both larvae and pupa (Figure 3). The regression equation was
Y= 32.14 (±4.37) + 0.41(±0.07) X, F (1, 6) = 33.56, P = 0.00, R2 = 0.848 for
larva, and Y= 13.42 (±2.59) + 0.56 (±0.54) X, F (1, 6) = 176.23, P = 0.00, R2 =
0.967 for pupa.
Figure 3. Cumulative weight loss percentage of B. minax larva (A) and pupa
(B) over time during desiccation
A B
Nepalese Journal of Agricultural Sciences, 2021, volume 21 ISSN 2091-042X; eISSN 2091-0428
40
The rate of weight loss of larva and pupa was highest between 0-36 and 0-60
hour of desiccation, respectively, after that the rate of increment was gradual. In
addition, the cumulative weight loss was 54.7±3.4 % for larva and 44.12±6.0 %
for pupa during 96 h of desiccation.
4. Relationship between weight loss and mortality in desiccation
Third instar larvae and pupae of B. minax did not die at cumulative body weight
loss below 30 % and 20 %, respectively. However, mortality increased sharply
above that. Once cumulative weight loss crosses 65 %, almost all larvae were
dead but pupae were found hardy in comparison to third instar larvae. The
relationship between weight loss and mortality was fitted by Probit model. The
intercept and slope of the regression equation was -11.19 (±1.24) and 7.00
(±0.73), χ2 = 25.25, P = 0.00 for larva whereas, intercept and slope was -5.26
(±.70) and3.27 (±0.43), χ2 = 2.39, P = 0.88 for pupa. It was observed that when
the cumulative weight loss percentage was 39.5 %, 60.2 % and 84.9 %
respectively, the mortality rates was 50 %, 90 % and 99 % correspondingly.
Figure 4. The relationship between cumulative weight loss and mortality
(mean± SEM) of larvae (A) and pupae (B) of Chinese citrus fruit fly
DISCUSSION
In the present experiment, effect of desiccation and immersion on larval and
pupal mortality of B. minax was studied and the result indicated that third instar
larvae of the Chinese citrus fly more susceptible to desiccation (LT50 22.87 h)
than to immersion (LT50 44.42 h). The significant difference in tolerance of
immersion may be due to its habitat and biological structure. The larvae of
Chinese citrus fly develop within fruits with high moisture content. Cuticle
structure and physiological mechanism of the mature larvae could make them
adapt to extreme moist environment.
In addition, the effect of immersion time on insect mortality varies based on
insect species and development stage. Sun, et al. (2013) discovered that when
Carposina sasakii pupae were immersed for 2 d, the mortality was 100 %.
A B
Nepalese Journal of Agricultural Sciences, 2021, volume 21 ISSN 2091-042X; eISSN 2091-0428
41
Likewise, Cavallaro, et al. (2017) found that the lethal time to 50 % mortality
for Nicrophorus investigator, N. marginatus, Necrodes surinamensis, and
Thanatophilus lapponicus was 14.9; 9.0; 3.3; and 12.2 h, respectively. However,
present study on immersion of pupae revealed that lethal time to 99 % mortality
was 706.8 h (29 d). Hence, the results indicated that the B. minxlarvae as well as
pupae have stronger tolerance to immersion than desiccation in comparison to
some previously studied insects.
In desiccated soil, the rate of the larvae weight loss was highest during the initial
times of exposure. Vargas et. al. (1987) found the similar result in the pupae of
the oriental fruit fly and other two tephritid species developed in dry soil.
Additionally, there was an explicit relationship between the weight loss and the
mortality (Fig. 4). The result depicted that cumulative weight loss of less than 20
% had little effect on mortality, while those surpassing about 30 % caused a
sharp increase in mortality. This might be due to very less moisture in soil that
resulted in desiccation of larva, and sharp increase in mortality may be attributed
to the loss of body weight reaching the critical level. The relationship between
the weight loss and mortality in the present work was similar to that observed in
eggs of the tick, Rhipicephalus (Boophilus) microplus (Canestrini) (Ixodidi)
(Sutherest and Bourne, 2006).
Immersion test not only affected survival, but also the development of Chinese
citrus fly. The developmental duration was slightly prolonged in the immersion
condition in comparison to the desiccated soil. This might be due to the fact that
wandering phase larvae ceased movement, and the process of puparium
formation was prevented or checked by water. Hence, excessive water might
have interfered with normal developmental process. This phenomenon was also
found in Sacrophage peregrine (Okhtaki, 1966), Anastrepha suspense
(Taschenberg, et al. (1974), and Glosina morsitans (Zdarek & Denlinger, 1991).
However, the metamorphosis of Chinese citrus fly was not influenced by
desiccation durations.
Our results showed that treated larvae did not emerge beyond 72 h in dry soils,
though it emerged even after 192 h in immersion condition. Thus, dry soils had
more detrimental effects on adult emergence of B. minax compared to
immersion condition. Similarly, the emergence ratios of A. ludens were lower
(3.2%) when pupae were kept in dry soil (0 % field capacity) (Montoya et.al,
2008). Nevertheless, the emergence ratios of B. dorsalis in dry soil increased by
55.5-88.9 % compared to soil with 100 % relative water content (Liu et.al.,
2010), which indicated that B. dorsalis had remarkable tolerance to dry soil.
Thus, dry soil may be more harmful to B. minax populations in the field. High
mortality of pupae in the dry soil is due to inadequate water content in the soil.
The result of the present study is in agreement with the observations of Hou et

Nepalese Journal of Agricultural Sciences, 2021, volume 21 ISSN 2091-042X; eISSN 2091-0428
42
al. (2006) who found that in drought condition soil moisture content was too low
to meet the requirements for pupal development of B. dorsalis.
REFERENCES Bajracharya ASR, Timsina, GP, Piya, S, Ghimire, K., Mandal DL and Mehta, S.N.
(2008) Monitoring of citrus fruit flies with lures and its management on sweet
orange orchard. Paper presented In: Third SAS-N convention "Agricultural
research for enhancing livelihood of Nepalese people, August 27-29,2008, Nepal
Agricultural Research Council, Khumaltar, Lalitpur, Nepal.
Bhandari K., Ansari A.R., Joshi S.L., Subedi H.P. and Thakur M.K. (2017) Efficacy
study of protein baits against Bactrocera minax and their potential use in spot
sprays in eastern hills of Nepal. Proceedings of the Ninth National Horticulture
Workshop-2017, May 31-June 1, Khumaltar, Lalitpur, PP: 57-64
Bhandari K., Ansari, A.R., Joshi S.L., Subedi H.P. and Thakur, M.K. (2017) Fruit fly
(Diptera:Tephritidae) diversity in citrus fruits in eastern hills of Nepal. Proceedings
of the Ninth National Horticulture Workshop-2017, May 31-June 1, Khumaltar,
Lalitpur. PP: 65-76.
Cavallaro, M.C.; Barnhart, M.C.; Hoback, W.W. (2017) Causes of rapid carrion beetle
(coleoptera: Silphidae) death in flooded pitfall traps, response to soil flooding,
immersion tolerance, and swimming behavior. Environ. Entomol. 46, 362–368.
Hou, B.; Xie, Q.; Zhang, R. (2006) Depth of pupation and survival of the Oriental fruit
fly, Bactrocera dorsalis (Diptera: Tephritidae) pupae at selected soil moistures.
Appl. Entomol. Zool. 41, 515–520.
Hulthen, A.D.; Clarke, A.R. (2006) The influence of soil type and moisture on pupal
survival of Bactrocera tryoni (Froggatt) (Diptera: Tephritidae). Aust. J. Entomol.
45, 16–19.
Li, L.; Xiao, R.L.; Huang, Y.; Li, H. (2001) Change of moisture and management on
water in soil from newly established citrus orchards in the Northwest of Guangxi
Zhuang Autonomous Region. Agro-Environ. Prot., 20, 88–90.
Liu, Q.; Niu, C.Y.; Wang, X. (2010) Influence of drowning time and soil water content
on the pupal eclosion rate of Bactrocera dorsalis (Hendel) of Hubei Province. Plant
Quar. 24, 22–24.
Liu, T.; Zhang, Z.F.; Wu, W.J. (2009) Effect of immersion in water on egg survival in the
grasshopper Fruhstorferiola tonkinensis, Chin. Bull. Entomol. 46, 895–897.
Luo, L.Y.; Chen, C.F., (1987) Biological characteristics of pupa of Tetradacus citri
(Chen). South China Fruit, 4, 9–10.
Montoya, P.; Flores, S.; Toledo, J. (2008) Effect of rainfall and soil moisture on survival
of adults and immature stages of Anastrepha ludens and A. obliqua (Diptera:
Tephritidae) under semi-field conditions. Fla. Entomol., 91, 643–650.
Ohtaki, T. (1966) On the delayed pupation of the fleshfly, Sarcophaga peregrina
RobineauDesvoidy. Jpn. J. Med. Sci. Biol. 19: 97–104.
Quesada-Moraga, E.; Valverde-García, P.; Garrido-Jurado, I. (2012) The effect of
temperature and soil moisture on the development of the preimaginal
mediterranean Fruit Fly (Diptera: Tephritidae). Environ. Entomol. 41, 966–970.
Ren, L.; Lu, Y.Y.; Zeng, L., (2007) Effect of sand water content on the pupal survival of
Bactrocera dorsalis (Hendel), J. South China Agric. Univ. 28, 63–66. 12.
Nepalese Journal of Agricultural Sciences, 2021, volume 21 ISSN 2091-042X; eISSN 2091-0428
43
Sun, R.H.; Wu, H.B.; Zhang, K.P.; Li, A.H.; Zhang, X.P. (2013) Influence of the
humidity and water immersion on egg hatch and adult emergence of Carposina
sasakii. J. Fruit Sci. 30, 449–451.
Sutherst, R. W. & Bourne, A. S. (2006) The effect of desiccation and low temperature on
the viability of eggs and emerging larvae of the tick, Rhipicephalus (Boophilus)
microplus (Canestrini) (Ixodidae). Int. J. Parasitol. 36: 193–200.
Taschenberg, E. F., Lopez, F. & Steiner, L. F. (1974) Response of maturing larvae of
Anastrepha suspense to light and to immersion in water, J. Econ. Entomol, 67(6):
731– 734.
Vargas, R. I., Miyashita, D., & Nishida, T. (1984) Life history and demographic
parameters of three laboratory-reared Tephritids (Diptera: Tephritidae). Ann.
Entomol. Sci. Am. 77: 651–656.
Vargas, R. I., Chang, H. B., Komura M. & Kawamoto, D., (1987) Mortality, stadial
duration, and weight loss in three species of mass-reared fruit fly pupae (Diptera:
Tephritidae) held with and without vermiculite at selected relative humidities, J.
Econ. Entomol. 80: 972–974.
Vargas, R. I., Stark, J. D. & Nishida, T. (1989) Abundance, distribution, and dispersion
indices of the oriental fruit fly and melon fly (Diptera: tephritidae) on Kauai,
Hawaiian Islands. J. Econ. Entomol, 82(6): 1609–1615.
Vargas, R. I., Stark, J. D. & Nishida, T., (1990). Population dynamics, habitat preference,
and seasonal distribution patterns of oriental fruit fly and melon fly (Diptera:
Tephritidae) in an agricultural area. Environ. Entomol, 19(6): 1820–1828.
Vargas, R. I., Walsh, W. A., Kanehisa, D., Jang, E. B. & Armstrong, J. W., (1997)
Demography of four Hawaiian fruit flies (Diptera: Tephritidae) reared at five
constant temperatures. Ann. Entomol. Sci. Am. 90(2): 162–168.
Vargas, R. I., Walsh, W. A., Kanehisa, D., Stark, J. D., & Nishida, T., (2000)
Comparative demography of three Hawaiian fruit flies (Diptera: Tephritidae) at
alternating temperatures. Ann. Entomol. Sci. Am. 93(1): 75–81.
Vargas, R. I., W. A. Walsh, E. B. Jang, J. W. Armstrong & D. T. Kanehisa. (1996)
Survival and development of immature stages of four Hawaiian fruit flies (Diptera:
Tephritidae) reared at five constant temperatures. Ann. Entomol. Sci. Am. 89(1):
64–69.
Wei, C.H. and Zeng, L. (2011) Effect of different soil water content on pupa of
Bactrocera correcta (Bezzi). Guangdong Agric. Sci., 9, 65–67.
Yang, P. J., Carey, J. R. & Dowell, R. V., (1994) Temperature influences on the
development and demography of Bactrocera dorsalis (Diptera: Tephritidae) in
China. Environ. Entomol, 23(4): 971–974.
Yee, W.L. (2013) Soil moisture and relative humidity effects during postdiapause on the
emergence of western cherry fruit fly (Diptera: Tephritidae). Can. Entomol., 145,
317–326.
Zdarek, J. and Denlinger, D. L., (1991) Wandering behaviour and pupariation in tsetse
larvae, Physiol. Entomol,16(4): 523–529.
Zhang, Z. and Li, Z.Z. (2001) Effects of the soil relative moisture content and the soil-
soaking on pupal development of Liriomyza huidobrensis. J. Mt. Agric. Biol. 220,
422–425. 14.
Nepalese Journal of Agricultural Sciences, 2021, volume 21 ISSN 2091-042X; eISSN 2091-0428
44
Fattening of male buffalo calf for economic meat
production
Pawan Kumar Jha1, Anjay K Sah
1 and Pankaj K Jha
1
1 National Buffalo Research Program, Tarahara, Sunsari
Corresponding Author: [email protected]
ABSTRACT
The study was carried out on-station at National Buffalo
Research Program (NBRP), Tarahara. The aim of this study
was to find out the cost effective meat production technology
of male buffalo calves fed with different feed formula. The
total three types of feed formula have been developed to find
out the economic meat production. The study was carried out
in a randomized complete block design (RCBD) having 4
treatments and replicated 4 times. Each experimental unit
consisted of 4 animals. There were altogether 4 treatment
groups in experiment in which treatment 1 (T1) received diet
of feed formula 1, treatment 2 (T2) feed formula 2, treatment 3
(T3) feed formula 3 and control group (T0) received diet
based on farmers practices. All the treatments groups (T1, T2
& T3) were provided the ration containing 25% concentrate
and straw and green (Roughage) at the ratio of 3:1 and
control group (T0) kept as farmers management practices. The
dry matter intake (DMI) estimated @ 3% of body weight. The
average initial live weights of animals were 106, 105.25, 106
and 105.50kg in treatment group 1, 2, 3 and control group
(T0) respectively, which increased up-to 296, 298, 288 and
197kg for the respective group after 240 days of feeding.
There were non-significant differences (p>0.05) among the
treatment groups T1, T2 and T3 have been observed fed the
ration formulated for trial animals. Though, T0 (farmers
practices) significantly differ from these three groups in terms
of all the parameters under considerations (p<0.01). The
average daily weight gains of calves found highest in T2
(803g) followed by T3 (798g), T1 (793g) and T0 (390)
respectively. Likewise, highest economic return (net return)
has been found Rs. 20230, 17210, 16290 and 7009 in T2, T3,
T1 and T0, respectively under current market prices.
Key words: Buffalo calves, concentrate, roughage, net return, market price,
Nepalese Journal of Agricultural Sciences, 2021, volume 21 ISSN 2091-042X; eISSN 2091-0428
45
INTRODUCTION
Buffalo is a one of the most important livestock commodity in the Nepalese
farming system. It is the choice livestock species of smallholder and commercial
farmers. Buffalo meat (buffen) contributes about 58.3% of total meat production
of Nepal (MOAC, 2015). In recent years, Nepalese people prefer buff meat due
to low cholesterol and cheap source of animal protein as compared to other
livestock products, and due to that reason demand of buffalo meat is increasing
for domestic consumption as well as import substitution. Sinclair et al., (1982)
reported that cholesterol content in buffalo meat is (46 %), sheep (68%) and goat
(58%). In addition to the conventionally accepted animal products like milk,
mutton, chevon, chicken, eggs and fish, buffalo meat (buffen) is also an
excellent source of protein in the diet of human beings. Until recently buffalo
had been a very popular animal as far as dairy products are concerned; due to
high content of fat and better acceptance to the masses in comparison to cow
milk. Therefore, male buffalo calves are not given proper care and are poorly
fed right from its birth. The farmer wants to dispose off male calves immediately
after weaning, as it is uneconomic to keep these animals and in many districts of
Nepal new born male buffalo calves are slaughtered in early to get more milk
from milch buffalo. In other hand, there is huge demand of male buffalo in the
country for meat purpose. The demand of buffen is not fulfilled yet (Devkota
and Kolachhapati, 2008).
Most of the buffalo meat is produced from aged buffalo which have been used
as draft (males) and milking (females). There is demand for the improvement in
efficiency of buffalo meat production. The alternative use of young male calves
may have advantage over old animals if they can be reared faster by feeding of
nutritious diets. Kumagai et al. (2012) indicated that 0.45 kg/day gain could be
provided in crossbred male buffalo calves (Murrah x Nepal native buffalo)
supplemented with limited amounts of concentrate at 0.75 % of their body
weight (BW) from 128 to 250 Kg and higher daily gain, 0.72 kg, was attained by
increasing the concentrate amount at 1.5% of Body weight. Previous studies
indicated that average daily gain of buffaloes ranged between 0.433 and 0.780
kg (El-Feel et al., 1993, Gigli et al., 1993, Omar et al., 1993, Sadek et al., 1993
and Mehrez et al., 1993).
Farmers are always aiming at achievement of higher productive performance
along with lower feed consumption i.e., best utilization. Preston (1986)
suggested that in order to achieve the best performance of growing fattening
animals, farmer should select the basal carbohydrate (concentrate) resource
according to availability, potential fermentability and price. Nowadays, the price
of animal feedstuffs, especially concentrates is going up leading to higher prices
of the animal products (milk, meat etc). To produce low price meat, feed intake
Nepalese Journal of Agricultural Sciences, 2021, volume 21 ISSN 2091-042X; eISSN 2091-0428
46
should be programmed in order to lower the concentrate ratio in the diet using
cheaper source of ingredients. This could be achieved by restriction concentrates
with ad libitum feeding of roughages. Fattening of male buffalo is the major
national issues raised by buffalo raising farmers under the low cost production
system. Therefore, these calves should be utilized for meat production on low
cost expenses. To address these problems, an experiment has been conducted to
develop appropriate and cost effective feeding system for male buffalo calf
fattening.
MATERIALS AND METHODS
Animal selection
The study was carried out at National buffalo Research Program (NBRP),
Tarahara-Sunsari to know the effect of different types of feeding regime on
productivity of animals. For that, sixteen animals of Murrah crosses up-to the
age of 10-12 month with a mean body weight of 100±10kg have been purchased
from local animal market (Pashu Haat). They were divided into four treatment
group and four calves in each treatment groups using randomized completely
bock design (RCBD). The total three types of feeding formula based on locally
available and cost effective feeding material have been developed and assigned
to treatment groups. The average initial live weights of animals were 106,
105.25, 106 and 105.50kg in treatment group 1, 2, 3 and control group (T0)
respectively. The experiment was lasted for 240 days.
Feeds and feeding
Three types of feeding formula have been developed based on locally available
ingredients for experimental animals (Table 1) and animals were randomly
assigned to one of the following feeding system: T1: Formula 1 + roughage ad-
lib (straw and green at the ratio of 3:1); T2: Formula 2 (urea and molasses) +
roughage ad-lib (straw and green at the ratio of 3:1); T3: Formula 3 (oilseed
cakes) + roughage ad-lib (straw and green at the ratio of 3:1) and T0: Control –
farmers' practices. The animals groups were fed at the ratio of 25% concentrate
with 75% roughage (straw and green at the ratio of 3:1). The daily DM
requirement of the growing calves was fixed at 3% of their body weight
(Ranjan, 1995). The feed allowance was adjusted monthly as per their body
weight changed. Daily intake of crop residues, green forages and concentrate
were recorded during the entire trial period. A residue if any was weighed next
day to calculate total dry matter consumed by each animal. The animals had free
access to clean drinking water at all the times. The nutrient analysis of offered
feeds was performed at Animal Nutrition Division, Khumaltar.
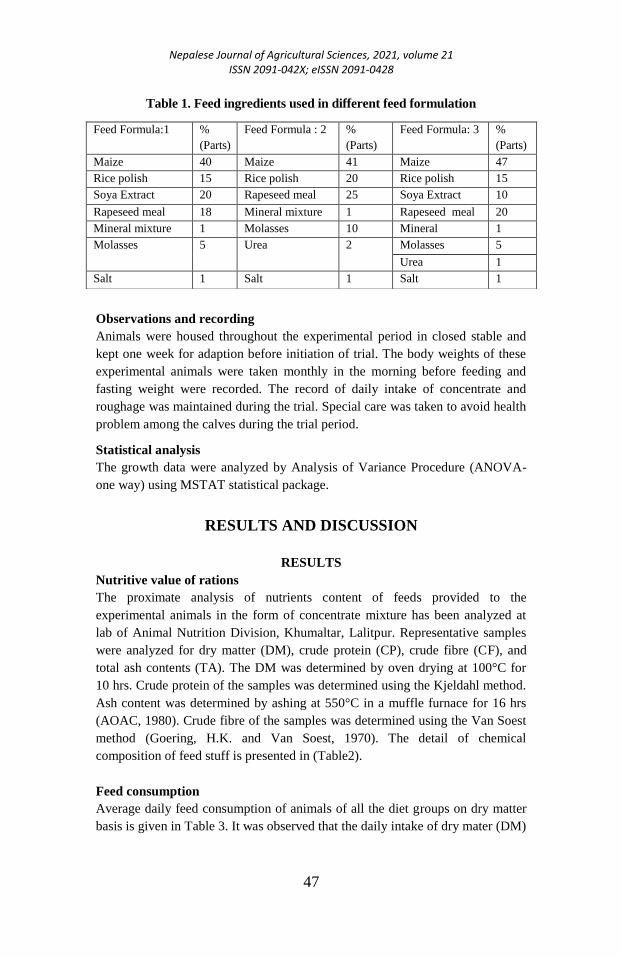
Nepalese Journal of Agricultural Sciences, 2021, volume 21 ISSN 2091-042X; eISSN 2091-0428
47
Table 1. Feed ingredients used in different feed formulation
Observations and recording
Animals were housed throughout the experimental period in closed stable and
kept one week for adaption before initiation of trial. The body weights of these
experimental animals were taken monthly in the morning before feeding and
fasting weight were recorded. The record of daily intake of concentrate and
roughage was maintained during the trial. Special care was taken to avoid health
problem among the calves during the trial period.
Statistical analysis
The growth data were analyzed by Analysis of Variance Procedure (ANOVA-
one way) using MSTAT statistical package.
RESULTS AND DISCUSSION
RESULTS
Nutritive value of rations
The proximate analysis of nutrients content of feeds provided to the
experimental animals in the form of concentrate mixture has been analyzed at
lab of Animal Nutrition Division, Khumaltar, Lalitpur. Representative samples
were analyzed for dry matter (DM), crude protein (CP), crude fibre (CF), and
total ash contents (TA). The DM was determined by oven drying at 100°C for
10 hrs. Crude protein of the samples was determined using the Kjeldahl method.
Ash content was determined by ashing at 550°C in a muffle furnace for 16 hrs
(AOAC, 1980). Crude fibre of the samples was determined using the Van Soest
method (Goering, H.K. and Van Soest, 1970). The detail of chemical
composition of feed stuff is presented in (Table2).
Feed consumption
Average daily feed consumption of animals of all the diet groups on dry matter
basis is given in Table 3. It was observed that the daily intake of dry mater (DM)
Feed Formula:1 %
(Parts)
Feed Formula : 2 %
(Parts)
Feed Formula: 3 %
(Parts)
Maize 40 Maize 41 Maize 47
Rice polish 15 Rice polish 20 Rice polish 15
Soya Extract 20 Rapeseed meal 25 Soya Extract 10
Rapeseed meal 18 Mineral mixture 1 Rapeseed meal 20
Mineral mixture 1 Molasses 10 Mineral 1
Molasses 5 Urea 2 Molasses 5
Urea 1
Salt 1 Salt 1 Salt 1
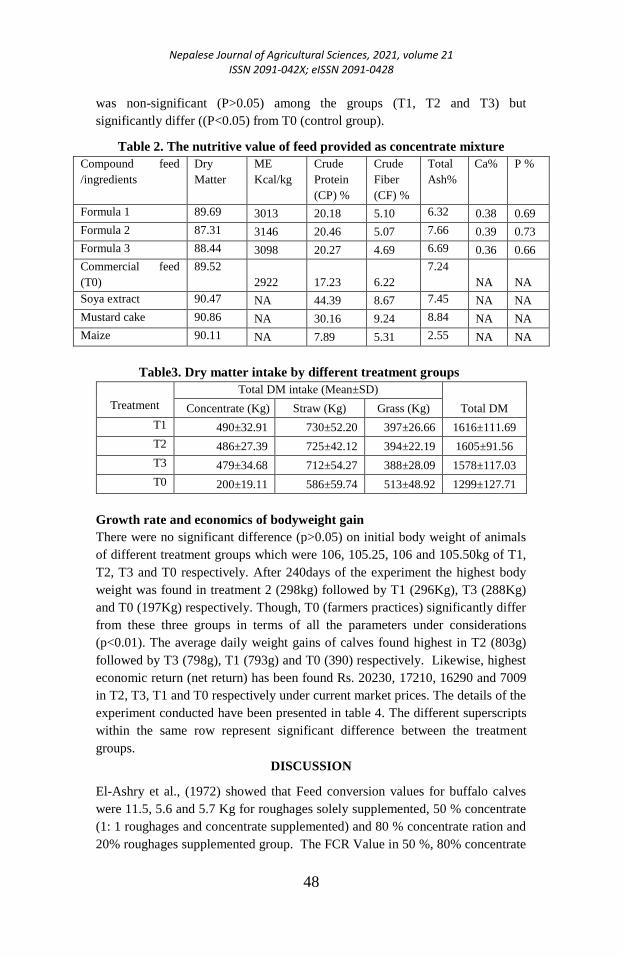
Nepalese Journal of Agricultural Sciences, 2021, volume 21 ISSN 2091-042X; eISSN 2091-0428
48
was non-significant (P>0.05) among the groups (T1, T2 and T3) but
significantly differ ((P<0.05) from T0 (control group).
Table 2. The nutritive value of feed provided as concentrate mixture
Compound feed
/ingredients
Dry
Matter
ME
Kcal/kg
Crude
Protein
(CP) %
Crude
Fiber
(CF) %
Total
Ash%
Ca%
P %
Formula 1 89.69 3013 20.18 5.10 6.32 0.38 0.69
Formula 2 87.31 3146 20.46 5.07 7.66 0.39 0.73
Formula 3 88.44 3098 20.27 4.69 6.69 0.36 0.66
Commercial feed
(T0)
89.52
2922 17.23 6.22
7.24
NA NA
Soya extract 90.47 NA 44.39 8.67 7.45 NA NA
Mustard cake 90.86 NA 30.16 9.24 8.84 NA NA
Maize 90.11 NA 7.89 5.31 2.55 NA NA
Table3. Dry matter intake by different treatment groups
Treatment
Total DM intake (Mean±SD)
Total DM Concentrate (Kg) Straw (Kg) Grass (Kg)
T1 490±32.91 730±52.20 397±26.66 1616±111.69
T2 486±27.39 725±42.12 394±22.19 1605±91.56
T3 479±34.68 712±54.27 388±28.09 1578±117.03
T0 200±19.11 586±59.74 513±48.92 1299±127.71
Growth rate and economics of bodyweight gain
There were no significant difference (p>0.05) on initial body weight of animals
of different treatment groups which were 106, 105.25, 106 and 105.50kg of T1,
T2, T3 and T0 respectively. After 240days of the experiment the highest body
weight was found in treatment 2 (298kg) followed by T1 (296Kg), T3 (288Kg)
and T0 (197Kg) respectively. Though, T0 (farmers practices) significantly differ
from these three groups in terms of all the parameters under considerations
(p<0.01). The average daily weight gains of calves found highest in T2 (803g)
followed by T3 (798g), T1 (793g) and T0 (390) respectively. Likewise, highest
economic return (net return) has been found Rs. 20230, 17210, 16290 and 7009
in T2, T3, T1 and T0 respectively under current market prices. The details of the
experiment conducted have been presented in table 4. The different superscripts
within the same row represent significant difference between the treatment
groups.
DISCUSSION
El-Ashry et al., (1972) showed that Feed conversion values for buffalo calves
were 11.5, 5.6 and 5.7 Kg for roughages solely supplemented, 50 % concentrate
(1: 1 roughages and concentrate supplemented) and 80 % concentrate ration and
20% roughages supplemented group. The FCR Value in 50 %, 80% concentrate
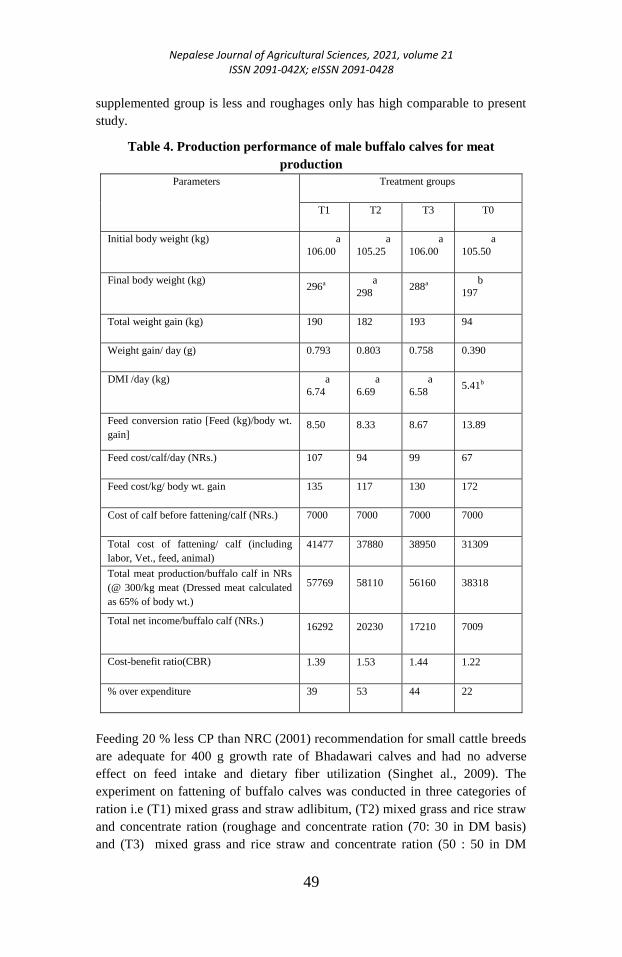
Nepalese Journal of Agricultural Sciences, 2021, volume 21 ISSN 2091-042X; eISSN 2091-0428
49
supplemented group is less and roughages only has high comparable to present
study.
Table 4. Production performance of male buffalo calves for meat
production
Parameters Treatment groups
T1 T2 T3 T0
Initial body weight (kg)
106.00
a
105.25
a
106.00
a
105.50
a
Final body weight (kg) 296a
298
a
288a
197
b
Total weight gain (kg) 190 182 193 94
Weight gain/ day (g) 0.793 0.803 0.758 0.390
DMI /day (kg)
6.74
a
6.69
a
6.58
a
5.41b
Feed conversion ratio [Feed (kg)/body wt.
gain] 8.50 8.33 8.67 13.89
Feed cost/calf/day (NRs.) 107 94 99 67
Feed cost/kg/ body wt. gain 135 117 130 172
Cost of calf before fattening/calf (NRs.) 7000 7000 7000 7000
Total cost of fattening/ calf (including
labor, Vet., feed, animal)
41477 37880 38950 31309
Total meat production/buffalo calf in NRs
(@ 300/kg meat (Dressed meat calculated
as 65% of body wt.)
57769 58110 56160 38318
Total net income/buffalo calf (NRs.) 16292 20230 17210 7009
Cost-benefit ratio(CBR) 1.39 1.53 1.44 1.22
% over expenditure 39 53 44 22
Feeding 20 % less CP than NRC (2001) recommendation for small cattle breeds
are adequate for 400 g growth rate of Bhadawari calves and had no adverse
effect on feed intake and dietary fiber utilization (Singhet al., 2009). The
experiment on fattening of buffalo calves was conducted in three categories of
ration i.e (T1) mixed grass and straw adlibitum, (T2) mixed grass and rice straw
and concentrate ration (roughage and concentrate ration (70: 30 in DM basis)
and (T3) mixed grass and rice straw and concentrate ration (50 : 50 in DM
Nepalese Journal of Agricultural Sciences, 2021, volume 21 ISSN 2091-042X; eISSN 2091-0428
50
basis). The body weight gain for T1, T2, and T3 were 202, 455 and 618 gm/day.
The more economical combination was mixed grass and rice straw, concentrate
supplementation (70: 30 in DM basis) (Banstola et al., 2004). The feeding
combination of roughage and concentrate (70: 30 in DM basis) growth rate is at
par with the present findings.
Devkota and Kolachapati (2008) reported that buffalo calves were reared on on-
farm condition using 15 buffalo calves in three treatment groups with three
animals in each treatment replicated five times. The treatment combination was
urea treated rice straw with 1.5 kg Berseem and little molasses (5 % of dry
matter requirement), urea untreated rice straw with little concentrate ( 10 % of
total dry matter requirement) and berseem forage ( straw and berseem in the
ratio of 1:1), untreated rice straw and berseem ( 1:1 ratio out of which 80 % dry
matter from straw and 20 % from berseem) for a period of 150 days found per
kg meat production cost was 67.77 on untreated rice straw and berseem
supplemented group . The daily weight gains were 360 g, 323 and 305 g
respectively. Net profit per kg meat production was found highest Rs 39.61 on
urea non-treated and berseem feeding group. The growth rate found better on
urea treated cum berseem feeding and molasses supplemented group. On
molasses unavailability, condtion straw and berseem could be used for feeding.
The growth rates in present findings were greater than reported by Devkota and
Kolachayapati (2008).
Response of different level of concentrate feeding on local male buffalo calves
was conducted at RARS Lumle for a period of 210 days, the ratio of concentrate
to roughages assigned in the three treatments were 40:60, 50:50 and 60: 40. The
average daily gain were 645 g, 728 g, 747 g, respectively and the net return per
animal were Rs 4528, 4330 and 4630 in three treatment groups respectively (
Jha et al., 2004). The growth rate on present study is 508 g/day in concentrate to
roughages ratio (25: 75 %) which is less than (40: 60 concentrate and forage
ration) supplementation reported by Jha et al., 2006.
Meat production potential and carcass characteristics of eight local male buffalo
calves were studied. A group of 4 calves (treatment group) were kept under
concentrate feeding, whereas, another group having similar number of calves
(control group) were kept under general village feeding practices. The calves on
treatment group received 70 % of total requirement was consisted from
concentrate and 30 % from roughage. The animals of treatment group received
significantly (P<0.05) higher daily weight gain (719 g) compared to control
group (469 gm) (Rana et al., 2000). Increasing the concentrate level increased
the weight gain, the weight gain in this treatment group is higher where
concentrate had contribution of 70 % dry matter requirement. The present study

Nepalese Journal of Agricultural Sciences, 2021, volume 21 ISSN 2091-042X; eISSN 2091-0428
51
has 508 gm average daily gain on 25 % dry matter requirement fulfillment from
concentrate and rest is from roughages.
The economics of buffalo meat production was compared at veal stage (200 kg
body weight) and at beef stage (300 kg weight) under four feeding planes. The
calves under 6 hr grazing and concentrate supplementation @ 1 % of body
weight and adlib bhusa feeding found to more economical i.e net return per
animal was found to be Rs. 1898. Concentrate mixture consisting of barley
grains (50%), deoiled rice bran (10%), deoiled sunflower cake (20%), deoiled
mustard cake (17%), mineral mixture 2%, and common salt 1 %. The fodder to
concentrate ratio was maintained at 60: 40 in all these treatments (Kamboj et al.,
2007). The present research net return per animal is similar with reported by
Kamboj et al. (2007) in urea molasses supplemented group.
Eighteen male calves from native, crossbred (Holstein *Native) and buffalo (six
animals for each group) with an average body weight (BW) of 160 Kg were
fatten till 300 kg. Total mixed ration feed (5 % over animal appetite) offered to
each animal 3 times daily. The average daily gain (gm/day) found to be 777, 641
and 912 for buffalo, native and crossbred (HN). Similarly, the significant dry
matter intakes (Kg/day) were 5.58, 5.31, and 6.3 and feed conversion ratio was
7.2, 8.3 and 6.9 which was found non-significant (Azary et al., 2007). The dry
matter intake found higher than present study, but feed conversion efficiency
was found similar.
Growth rate of buffalo calves reported by Thapa et al., (1997) was 389 g per day
fed on concentrate. Similarly, the growth rate varied from 200 to 550 g per day
(Langer et al., 1985; Punia and Sharma 1988; Kakker et al., 1991). However,
Pathak et al. (1987) observed a daily weight gain of 576 g on high protein and
high energy diet. These growth rates were comparable with present findings.
CONCLUSION
Details of study showed that feed play major role in production performances
animals contribute sixty percent of cost of production followed by cost of labor
(20%), cost of animal (20%) and rest veterinary and miscellaneous cost. So,
major focus should be given to economic feeding mixture and labor efficiency
for commercial fattening of animals for higher returns. In this study it was
observed that feeding animals based on formula 2 get higher returns as
compared to rest of the groups. In order to meet the demand of meat, buffalo
meat could be one of the alternatives. The young male buffalo calf could be
raised on proper feeding management using locally available feed ingredient.
Such planning will help to stop early disposal and/or force mortality of male
buffalo calf and check the import of unhygienic buffalo from the border site.
Nepalese Journal of Agricultural Sciences, 2021, volume 21 ISSN 2091-042X; eISSN 2091-0428
52
ACKNOWLEDGEMENT
The authors are thankful to Nepal Agricultural Research Council (NARC) for
providing fund to conduct study. Likewise, we would like to thanks Dr. Megraj
Tiwari, Principal Scientist, NARC and Mr. Bhola Shankar Shrestha (former
Senior Scientist, NARC) for editing this paper.
REFERENCES AOAC (1980) Official methods of analysis, Association of Official Analysis Chemists, Washington
DC, U.S.A
Azary, A.M., Manafiazar, G., Razagzadeh, S. and Amini-jabalkandi, J. (2007) Comparing fattening
performance of Azeri buffalo, Native and Crossbred (native *Holstein) male calves in
west Azerbaijan-Iran, Italian Journal of Animal Science, 6: 12521255
Banstola, B.R., Shrestha, H.R., Thapa, M.S.and Osti N.P. (2004) Fattening of Buffalo calves for
economic meat Production. In: B.R. Joshi, D. Pariyar, S.P. Neopane, T.B. Gurung, K.P.
Poudel, B.S. Shrestha (eds.), Proceedings of Sixth National Conference on Livestock and
Fisheries Research, Khumaltar, Lalitpur, 1-2 July (pp140-145). Nepal Agriculture
Research Council
Devkota, N.R., and Kolachayapati, M.R. (2008) Forage-based Buffalo fattening technology for meat
production, Institute of Agriculture and Animal Science, Rampur, National Agriculture
and Research Development Fund, Kathmandu pp 28-33.
EI-Ashry, M.A., Mogawer, H.H. and El-Khishin, S.S., (1972) Comparative study, meat production
from cattle and buffalo male calves, Egypt. J. Anim. Prod., 12: 99
El-Feel, F.M.R., Hassan, H.A., Morsy, N.H.A. and Fahmy, S.T.M. (1993) Performance of buffalo
calves raised under the upper Egypt conditions as affected by level of feeding, season of
calving and body weight. Proceedings of the International Symposium on Prospects of
Buffalo Production in the Mediterranean/ Middle East, Cairo, Egypt, Nov. 9- 12, (1992),
pp. 133-136.
Gigli, S., Carretta, A., Failla, S. and Napolitano, F. (1993) Meat production in Italian male buffaloes
with two nutritive levels and slaughtered at 4 different ages. In vita performance, carcass
characteristics and meat quality, Proceedings of the International Symposium on
Prospects of Buffalo Production in the Mediterranean/ Middle East, Cairo, Egypt, Nov.
9-12, (1992), pp. 124-128.
Goering, H.K. and Van Soest (1970) Forage fibre analysis apparatus, reagents, procedures and
some application, ARS, USDA, Handbook N 397
Jha, P.K., Shrestha B.S. and Rana, R.S. (2004) Response to Different Level of Concentrate Feeding
on Meat Production of Local Male Buffalo Calves. In: B.R. Joshi, D. Pariyar, S.P.
Neopane, T.B. Gurung, K.P. Poudel, B.S. Shrestha (eds.), Proceedings of Sixth National
Conference on Livestock and Fisheries Research, Khumaltar, Lalitpur, 1-2 July (pp133-
139). Nepal Agriculture Research Council
Kakker, V.K., Malik, N.S. and Makar, G.S. (1991) Protein Requirement of male buffalo calves.
Indian Journal of Animal Nutrition, 8: 191-194.
Kamboj, M.L., Paul S.S., Chawla, D.S. and Prasad S. (2007) Economics of rearing niliravi male
buffalo calves under four feeding regimes for meat production. Indian Journal of Animal
Research.41 (3): 200-203.
Kumagai, H., Baral, B.R., Shiino, T., Devkota, N.R., Oishi, K., Hirooka H., Kolachhapati, M.R.,
Tiwari, I.C.P., (2012) Effects of Plane of Nutrition on Growth, Feed intake, Digestibility
and Nitrogen Balance in Murrah graded male Buffalo (Bubalus bubalis) calves in Nepal.
Animal Science Journal, 83(1): 50-54.
Langer, P.N., Bakshi, M.P.S., and Saini, K.S. (1985) Growth Performance of buffalo heifers raised
on urea-wheat straw rations. Indian Journal of Animal Sciences, 55: 1053-1059.
Nepalese Journal of Agricultural Sciences, 2021, volume 21 ISSN 2091-042X; eISSN 2091-0428
53
Mehrez, A.Z., El-Ayouty, S.A., Ibrahim, Z.M.K., and Younis, A.A. (1993) Effect of feeding level on
meat production from buffalo calves: 2- Growth performance, feed utilization, and
carcass quality. Proceedings of the International Symposium on Prospects of Buffalo
Production in the Mediterranean/ Middle East, Cairo, Egypt, Nov. 9-12, (1992), pp. 137-
140.
MOAC, (2015) Selected Indicators of Nepalese Agriculture and Population. Agri Business
Promotion and Statistics Division, Ministry of Agriculture and Cooperatives, Singha
Durbar, Kathmandu, Nepal
Omar, S.S., Houria, M.A. and Baraghite, G.A. (1993) Studies on growth performance of male
buffalo and bovine calves under commercial fattening farms in Menofiya province,
Egyptian J. of Anim. Prod., 30(2):117-128
Preston, T.R., (1986). Better utilization of crop residues and by-products in animal feeding: research
guidelines, 2. A practical manual for research workers, 1986, FAO publications
Pathak, N.N., Ranjhan, S.K. and Baruah, K.K. (1987) Growth responses feed efficiency and carcass
characteristics of Indian buffalo (Bubalus bubalis) calves fattened on different plane of
nutrition. Buffalo Bulletin, 6: 77-82
Punia, B.S. and Sharma, D.D. (1988) Effect of dietary energy source in complete feed on digestion
and Live weight gain in buffalo and crossbred cattle calves. Indian Journal of Animal
Science, 58: 715-720
Ranjan, S. K. (1995) Animal nutrition and feeding-A text book
Rana, R.S., Amatya, N., and Shrestha, H.R. (2000) Effect of Concentrate feeding on meat
Production of Local Male Buffalo Calves, In: S.P. Neopane, A.K. Rai, R. Bhurtel (eds.),
Proceedings of the Fourth National Workshop on Livestock and Fisheries Research in
Nepal, Khumaltar, Lalitpur, 24-26 April (pp 132-1139). Nepal Agriculture Research
Council
Sadek, R.R., El-Kholy, A.F., Nigm, A.A., Ibrahim, M.A.M. and Morsy, M.A. (1993) Daily gain,
feed conversion and carcass characteristics of Friesian and buffalo males fed on
Flavomycin. Proceedings of the International Symposium on "Prospects of Buffalo
Production in the Mediterranean/ Middle East", Cairo, Egypt, Nov. 9-12, (1992), pp.
129- 132
Sinclair, A.J., Slattery W.J. and Dea K.O. (1982) The analysis of Polysaturated fatty acids in meat by
capillary gas liquid chromatography. Journal of Science and Good Agriculture, 33: 771-
76
Singh, S.S., Kundu S., Kushwaha B.P. and Maity S.B. (2009) Response of Bhadawari Buffalo
calves to dietary feed intake, nutrients utilization, N balance, nutrient efficiency and
growth performance. Indian Journal of Animal Science, 79(12): 1233-1237.
Thapa, M.S., Shreshta, H.R. and Kuwnar, B.S. (1997) Annual Technical Report, Nepal Agriculture
Research Council, Bovine Research Program, Khumaltar, Lalitpur, Nepal
Nepalese Journal of Agricultural Sciences, 2021, volume 21 ISSN 2091-042X; eISSN 2091-0428
54
A study on maize weevil (Sitophilus zeamais)
management at farmers’ condition in Mid Western
Nepal
Janarjan Gautam1*
and N. Lamsal2
1*Agriculture Research Station, NARC, Jaubari, Ilam
2Institute of Agriculture and Animal Science, TU
Corresponding Author:[email protected]
ABSTRACT The study was conducted to develop maize weevil management
technology in farmer’s condition of Salyan and Pyuthan
districts of mid-west Nepal during the year 2014 and 2015.
The experimental materials used for the study was
Manakamana 3 variety of maize grain and five types of maize
storage systems namely: 1) Local storage by using nylon sack
2) Sack lined inside with ordinary white plastic 3) Local
structure with botanicals (Timur powder 5 g/kg of seed +
Turmeric powder 5 g/kg of seed) 4) Super grain bag and 5)
Metal bin with celphos (Aluminum phosphide) at the rate of 12
gm/t. The highly significantly highest weight after storage (99.
15%) was found in botanical (Timur powder 5 gm/kg of seed
+ Turmeric powder 5 g/kg of seed) treated storage method
followed by the maize grain stored in metal bin using celphos
(99.13%) and super grain bag (98.96%). There was no
significant different in good grain weight recovery % (in these
three storage methods (97.27 - 98.24%) but was significantly
differ from local management practices (73.84%). This study
has suggested that farmers can locally save loss of stored
grains by using the locally available botanicals (Timur
powder 5 gm/kg of seed + Turmeric powder 5 g/kg of seed)
using storage in sack.
Keywords: Weevil infestation, metal bin, storage, botanical pesticides, seed
INTRODUCTION In Nepal, maize is closely associated with the livelihood of people in the hills
and mountains. It contributes 30% of the total cereal produced in the high hills
and 40% in the mid-hills indicating its vital role in the food supply to the people
living in the remote area of Nepal (Pandey et al., 2001). National average
Nepalese Journal of Agricultural Sciences, 2021, volume 21 ISSN 2091-042X; eISSN 2091-0428
55
productivity of maize is low (2.83 t/ ha). A considerable quantity of the total
maize production is lost after harvest as a result of poor storage practice. A wide
range of insect pests attack maize seeds in the storage (Neupane et al., 1991).
Nearly one thousand species of insects have been found associated with stored
products in various parts of the world. The maize weevil (Sitophilus zeamais) is
a species of beetle in the family Curculionidae can be found in numerous
tropical areas around the world, and in the Nepal, and is a major pest of maize.
Maize weevil is the most notorious storage pest damage by destroy the grain and
contaminate the rest with undesirable odors and flavors. In general the loss (pre
and post harvest) due to pests has been estimated about 15-30% (Neupane,
1995: KC, 1992).
Majority of the farmers in on-farm situation stores maize grains in a very
meager situation resulting into the excessively higher losses. Different types of
insecticides have been recommended for the control of storage pests in Nepal
(Anonymous, 1990, Neupane et al., 1991). However, direct application of such
insecticides to edible grains is not therefore; development of alternative
measures would be of great important. Farmers do not have inadequate
knowledge about safe handling of insecticides in stored produce. In another
hand, most farmers cannot afford improved structures, resulting into the
difficulty of creating specific condition required for insecticides application in
storage which has virtually caused pesticide misuse, public health hazards and
environment pollution. In Nepal, preventive measures and use of natural
resources have not been fully explored despite of their greater significance in the
environment and human beings.
Farmers rely on natural drying in the sunlight. In Nepal the harvesting time
coincides with rainy season as a result of which the grains are not dried
properly. Farmers are ignorant about the bio-ecology of the insect pests and
fundamentals of the storage and the efficacy of botanicals to control pest. The
efficient control of stored grain pests has long been the aim of entomologists
throughout the world. Synthetic chemical pesticides have been used for many
years to control stored grain pests (Salem et al., 2007). However, the potential
hazards for mammals from synthetic insecticides, increased concern by
consumers over insecticide residues in processed cereal products, the occurrence
of insecticide-resistant insect strains, the ecological consequences, the increased
of the cost of application and the precautions necessary to work with traditional
chemical insecticides, call for new approaches to control stored-product insect
pests (Salem et al., 2007). The majority of Nepalese farmers are poor, cannot
afford to purchase pesticides and expensive grain storing technology (storage in
metal bins). There is a need to look for alternative organic sources that are
readily available, affordable, less toxic to mammals and less detrimental to the
environment.
Nepalese Journal of Agricultural Sciences, 2021, volume 21 ISSN 2091-042X; eISSN 2091-0428
56
MATERIALS AND METHODS
Study area: The study was carried out in mid hill region at lower altitude of
Salyan and Pyuthan districts during October 2012 to April 2013. Two places of
Siddheswori from Slayan and Bangesaal and Barjibang from Pyuthan were
selected. The elevation of these area lies between 450- 900 masl; and
experiences annual average rainfall of 1000 mm.
Experimental materials and study periods: The experimental materials used
for the study was Manakamana 3 variety of maize grain and five types of maize
storage systems namely 1. Local storage by using nylon sack 2. Sack lined
inside with ordinary white plastic 3. Grains stored with botanicals (Timur
powder 5 g/kg of seed + Turmeric powder 5 gm/kg of seed) in nylon sac 4.
Super grain bag and 5 Metal bins with chelphos (Aluminum phosphide) at the
rate of 12 g/ t. The botanicals used were edible in nature and play as a role of
repellent for weevil.
A super grain bag is type of storage container made from multilayer polythene
(PE). It can store commodities for prolonged periods without the risks of
moisture ingress, pest infestation and fungal growth. This eco-friendly and
pesticide-free product also preserves the quality and germination capacity of
stored grains.
Experimental Design
Five kinds of storage system in maize as described above were used as
treatments and repeated in four different locations. Thirty kilograms of seed
grains were stored in each storage method and placed them inside farmer's
condition in side house. Observations were taken on grain weight loss, damaged
grain, good grains, weevil's numbers and recovery percentage.
Sampling of the grain for evaluation
After 6-month, one kg sample from each storage and unit was collected and
grain numbers (good and damaged), grain weight recovery percentage and
weevil numbers were assessed and expressed as percentage.
Insects counting: From all the samples both live and dead insects were counted
and expressed as total weevil number per kg maize grain. Weevil infestation
severity was scored using 1-5 scale as; 1=No infestation to 5= severe infestation.
The percentage of insects damaged seed was calculated as follows:
Insect damaged grains = No of insect damaged grains / Total No of grains X 100
Nepalese Journal of Agricultural Sciences, 2021, volume 21 ISSN 2091-042X; eISSN 2091-0428
57
The grain weight losses was determined using the thousand grain mass (TGM).
From a kilogram of sampled grain at each sampling day, 1000 grain kernels
were randomly taken and weighed using digital balance and recorded as
Thousand Grain Mass (Proctor and Rowley, 1983;Mashilla, 2004). Then the
percentage weight loss was computed using the formula indicated below:
Weight loss (%) = M1 – Mx / M1 X 100
Where, M1 is Thousand Grain Mass (TGM) at the beginning of the study and
Mx is the TGM of grain on occasion “x”.
Data analysis: Statistical analysis was performed on insect abundance and
insect damage over the storage periods for the two agro-ecologies using SPSS
(Statistical Package for the Social Sciences) Version 16.0. Means were
compared for the significant factors using Least Significant Difference (LSD)
test and significance was accepted at 5%. Descriptive statistics was also used for
organizing and presenting some of the data.
RESULTS AND DISCUSSION
Number of weevil and damage
The more number of weevils (87.33 weevils/kg maize) and weevil scoring
(3.75) was found in ordinary nylon local sack followed by maize grain stored in
sack lined inside with ordinary white plastic (29.30 weevils/kg maize grain with
3.25). On the other hand, the minimum weevil number (2.45 weevils/kg maize
grain) was found in maize grain stored in metal bin using celphos followed by
the use of botanical (Timur powder 5 gm/kg of seed + Turmeric powder 5 gm/kg
of seed) treated (6.17 weevils/kg maize grain) and super grain bag (7.83
weevils/kg maize grain).
Grain weight recovery and grain weight
Highest grain weight recovery (99. 15%) was found in botanical (Timur powder
5 gm/kg of seed + Turmeric powder 5 g/kg of seed) treated storage method
followed by the maize grain stored in metal bin using celphos (99.13%) and
super grain bag (98.96 %). There was no significant difference in good grain
weight recovery % but was significantly different from local storage by using
nylon sacks (Table 1).
CONCLUSION
Storage method had significant effect on the infestation and severity of weevil.
The highest grain weight after storage (99. 15%) was found in botanicals treated
sacks followed by metal bin using celphos (99.13%) and super grain bag
(98.16%). There was no significant variation in good grain weight recovery %
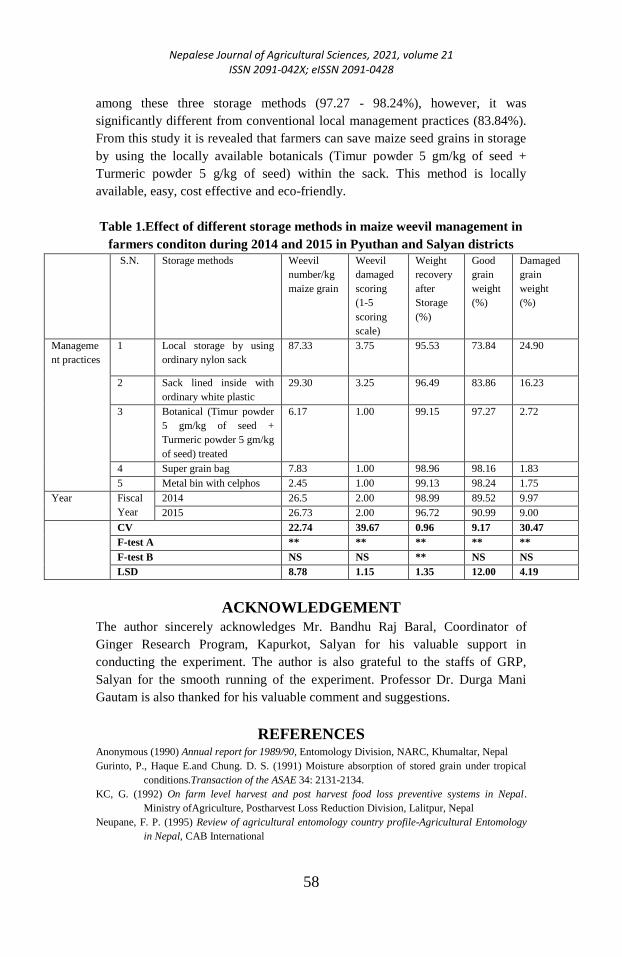
Nepalese Journal of Agricultural Sciences, 2021, volume 21 ISSN 2091-042X; eISSN 2091-0428
58
among these three storage methods (97.27 - 98.24%), however, it was
significantly different from conventional local management practices (83.84%).
From this study it is revealed that farmers can save maize seed grains in storage
by using the locally available botanicals (Timur powder 5 gm/kg of seed +
Turmeric powder 5 g/kg of seed) within the sack. This method is locally
available, easy, cost effective and eco-friendly.
Table 1.Effect of different storage methods in maize weevil management in
farmers conditon during 2014 and 2015 in Pyuthan and Salyan districts
S.N. Storage methods Weevil
number/kg
maize grain
Weevil
damaged
scoring
(1-5
scoring
scale)
Weight
recovery
after
Storage
(%)
Good
grain
weight
(%)
Damaged
grain
weight
(%)
Manageme
nt practices
1 Local storage by using
ordinary nylon sack
87.33 3.75 95.53 73.84 24.90
2 Sack lined inside with
ordinary white plastic
29.30 3.25 96.49 83.86 16.23
3 Botanical (Timur powder
5 gm/kg of seed +
Turmeric powder 5 gm/kg
of seed) treated
6.17 1.00 99.15 97.27 2.72
4 Super grain bag 7.83 1.00 98.96 98.16 1.83
5 Metal bin with celphos 2.45 1.00 99.13 98.24 1.75
Year Fiscal
Year
2014 26.5 2.00 98.99 89.52 9.97
2015 26.73 2.00 96.72 90.99 9.00
CV 22.74 39.67 0.96 9.17 30.47
F-test A ** ** ** ** **
F-test B NS NS ** NS NS
LSD 8.78 1.15 1.35 12.00 4.19
ACKNOWLEDGEMENT
The author sincerely acknowledges Mr. Bandhu Raj Baral, Coordinator of
Ginger Research Program, Kapurkot, Salyan for his valuable support in
conducting the experiment. The author is also grateful to the staffs of GRP,
Salyan for the smooth running of the experiment. Professor Dr. Durga Mani
Gautam is also thanked for his valuable comment and suggestions.
REFERENCES Anonymous (1990) Annual report for 1989/90, Entomology Division, NARC, Khumaltar, Nepal
Gurinto, P., Haque E.and Chung. D. S. (1991) Moisture absorption of stored grain under tropical
conditions.Transaction of the ASAE 34: 2131-2134.
KC, G. (1992) On farm level harvest and post harvest food loss preventive systems in Nepal.
Ministry ofAgriculture, Postharvest Loss Reduction Division, Lalitpur, Nepal
Neupane, F. P. (1995) Review of agricultural entomology country profile-Agricultural Entomology
in Nepal, CAB International
Nepalese Journal of Agricultural Sciences, 2021, volume 21 ISSN 2091-042X; eISSN 2091-0428
59
Neupane, F. P., Shrestha, S. M. Thapa R. B. and Adhikari T. B. (1991) Crop protection (Nepali),
Institute ofAgriculture and Animal Science, Rampur, Chitwan, Nepal.
Salem, S.A., Abou-Ela, R.G., Matter, M.M., El-Kholy, M.Y., (2007) Entomocidal effect of Brassica
napusextractson two store pests, Sitophilus Oryzae (L.) and Rhizoperthadominica (Fab.)
(Coleoptera). Journal of Applied Sciences Research 3, 317-322.
Nepalese Journal of Agricultural Sciences, 2021, volume 21 ISSN 2091-042X; eISSN 2091-0428
60
Evaluation of brinjal genotypes for yield and quality
traits
Manish K Thakur1*
, Ishwari P Gautam2, Mahabir Lal Deo
1
and Sabita Karki1
1 Directorate of Agricultural Research, Province 1, Tarahara, Sunsari
2 National Horticulture Research Center, Lalitpur, Khumaltar
*Corresponding Author: [email protected]
ABSTRACT
Brinjal is an important solanaceous crop which is cultivated in
tropical and sub-tropical region of Nepal. Evaluation of brinjal
genotypes was carried out for two consecutive years (2018 and
2020) at Horticulture Research Unit, Directorate of Agricultural
Research, Province 1, Tarahara. Five hybrid genotypes of brinjal
was used for evaluation considering each genotype as an
individual treatment and was replicated four times under
Randomized Complete Block Design. Significant variation in plant
growth, fruit quality and yield parameters were observed in all the
genotypes. Though, Laboni performed significantly well with
respect to Days to fifty percent flowering (55), plant height (97.75
cm) and yield (52.68 ton/ha ). Though production of Banani and
Long Green was satisfactory, due to its fruit colour (green with
white streaks) may not get consumer preference. Similarly, days to
first harvest of Shamali variety was quite delayed (88–90 day) as
compared to other genotypes. At the same Tim Laboni and Purple
King performed best with respect to days to first harvest, fruit
length, diameter, fruit colour and yield. So, it can be concluded
that Laboni, Purple King and Shamali performed best in an
environmental condition of eastern terai region of Province 1 and
can be promoted for commercial cultivation.
Key words: Brinjal, laboni, purple, fruit, yield
INTRODUCTION
Brinjal (Solanum melongena L.) is an important solanaceous crop which is
cultivated in tropical and sub-tropical region of Nepal. It is native to southern
India and widely grown in America, Europe, and Asia including Nepal
(Achhami et al 2013). It is a perennial but grown commercially as an annual
crop (Joshi, 2003). The total area under brinjal cultivation in Nepal is 8,732 ha
with annual production of 126, 475 mt and 14.48 mt/ha, productivity (MoALD
2019). But productivity of brinjal in India is 17.4 mt/ha, whereas in Asia it is
Nepalese Journal of Agricultural Sciences, 2021, volume 21 ISSN 2091-042X; eISSN 2091-0428
61
29.0 mt/ha and the worlds productivity 29.4 mt/ha, respectively (FAOSTAT,
2018). Since, there is limited registered hybrids of Brinjal in Nepal and farmers
are compelled to use unregistered, non verified lines.
Though being one of the important vegetable crops cultivated in Nepal, having
limited registered varieties for commercial cultivation farmers are compelled to
grow unknown genotypes. Therefore, potentialities for genotypes having quality
and high yielding traits are of high demand. Thus, evaluation of different
genotypes is of prime importance to identify high yielding lines suitable to
particular climatic condition. Therefore, evaluation of some hybrid lines of
brinjal was carried out to obtain the following objectives:
To identify high yielding genotypes.
To identify important traits of selected genotypes.
MATERIALS AND METHODS
Evaluation and characterization of five hybrid genotypes of brinjal was carried
out at Horticulture Research Unit, Regional Agricultural Research station
Tarahara, Sunsari of Province No. 1 for two consecutive years (2017 and 2020).
All the given genotypes as stated below were considered as individual
treatments and replicated four times under RCB Design.
T1: Laboni
T2: Green Long
T3: Purple King
T4: Banani
T5: Shamli (Check)
Standard management practices were given to all these treatments as stated
below:
Date of sowing: 29/10/2017 and 20/11/2019
Spacing: 75 cm x 60 cm
No of plants per treatment: 10
Plot size: 1.4 m x 3 m
Plot to Plot distance: 1 m
Total No. of plots: 20
Replications: 4
Design: RCBD
Manure and fertilizer: 20-25 ton FYM + 182 kg urea + 180 kg DAP + 80 kg
MoP / ha.
Land was well prepared by deep ploughing and leveled. Raised plots of a given
size were prepared. Full dose of FYM, DAP, MoP and one third of Urea was
applied as a basal at the time of transplanting. Remaining two third of urea was
top-dressed at the time of flowering. Seedlings of all genotypes were
Nepalese Journal of Agricultural Sciences, 2021, volume 21 ISSN 2091-042X; eISSN 2091-0428
62
transplanted in individual plot seperately at a recommended spacing. Standard
cultural practices were followed throughout the experimental period to give the
cultivars a favorable environment to fully express their genetic potentials.
Observation on different parameters like plant height, plant vigour, number of
primary branches, time taken for 50% flowering, days to first harvest, number of
fruits per harvest, weight of individual fruit, length of fruit, fruit diameter, fruit
colour, leaf colour, number of plant harvested, total number of fruit per plot,
yield per plot, expected yield per hectare, presence or absence of thorn, thorn
colour and insidence of insect-pest was taken at regular interval. Statistical tool
used for data analysis was Statistix 10.
RESULTS AND DISCUSSION
Evaluation and characterization of elite hybrid genotypes of brinjal was carried
out at Horticulture Research Unit, Regional Agricultural Research station
Tarahara, Sunsari of Province No. 1 for two consecutive years (2017 and 2020).
The observation on different parameters was taken at regular interval and the
results obtained are discussed below:
Days to fifty percent flowering: Significant result was observed in both year and
minimum number of days taken to fifty percent flowering by Laboni (55 day)
and maximum by Shamli (64.3.to 67.3 day).
Days to first harvest: Number of days taken to first harvest was observed
significantly maximum with Shamli (88. 5 to 90.3 day) and minimum with
Green Long (73 to 74.8 day) and Laboni (74.8 to 73.25 day) in both year
respectively as stated in table 1a.
Plant Height (cm): In the first year, non significant result was observed but in
second year significantly maximum plant height was gained by Laboni (97.75
cm) and minimum with Shamli (73 cm).
Plant vigour (1–5 scale): All the genotype revealed significant result with
respect to plant vigour in both years. Laboni attained maximum vigour i.e. 4.8
and 5 in both years respectively. But minimum vigour was obtained by Purple
King i.e. 3.3 and 3.25 respectively.
Number of plant harvested per plot: There was 10 plants was maintained per
plot which propounded significant result on first year but non significant in
second year. In first year, maximum plant harvest per plot was Shamli (8.3) and
minimum with Green Long (4.3).
Nepalese Journal of Agricultural Sciences, 2021, volume 21 ISSN 2091-042X; eISSN 2091-0428
63
Number of fruit harvested per plot: In the first year, Shamli produced
significantly highest number of fruit (238) and minimum produced from Green
Long (117. 5) as stated in table b.
Yield per plot (kg): Yield per plot found to be significantly maximum in first
year by Laboni (22.12 kg pe4 plot) and minimum with Purple King (11.48 kg).
Yield per plant (Kg): Second year production revealed significantly maximum
with Green Long (4.72 Kg per plant) and minimum with Shamli (2. 5 kg) .
Estimated yield per hectare (Ton./Ha): Significantly highest yield was obtained
by Laboni (52.68 ton/ha) and minimu by Banani i.e. 27.32 ton/ha.
Individual fruit length (cm): First year data propounded significant highest fuit
length with Purple King (22.7 cm) and minimum with Laboni 16.18 cm. Second
year observation revealed non significant result.
Individual fruit diameter (mm): Both years revealed significant result. In both
year Banani possess maximu fruit diameter (67.55 and 57.23 mm) than other
genotypes.
Number of primary branches: It revealed non significant result in both year.
Though, maximum branch was produced by Laboni (5.75) in first year and
Purple king (5.95) in second year.
Insect pest (1– 5 scale) incidence: All the genotype propounded non significant
result with respect to incidence of insect pest. Maximum infestation of fruit and
shoot borer was observed with Laboni (3–3.4).
Fruit colour: Fruit colour of all the genotype was different. Laboni produced
dark purple, long green produced light green with white streaks, purple king
produced moderately purple and Shamli produced purple colour, banani fruit
was having green skin with white streak and Shamali produced purple coloir
fruit.
Leaf colour: Laboni was having green coloured leaf with purple midrib and vein
whereas green long produced green leaf with whitish green midrib and vein.
Similaly, Purple King produced green leaf with purple midrib and vien, banani
had green leaf with whish green midrib and vein whereas Shamali produced
light green and shiny leaf with whitish green midrib and vein.
Thorn: All the genotype except Shamli produced thorn on calyx. Laboni was
having brown and soft thorn on calyx whereas Green Long was having whitish
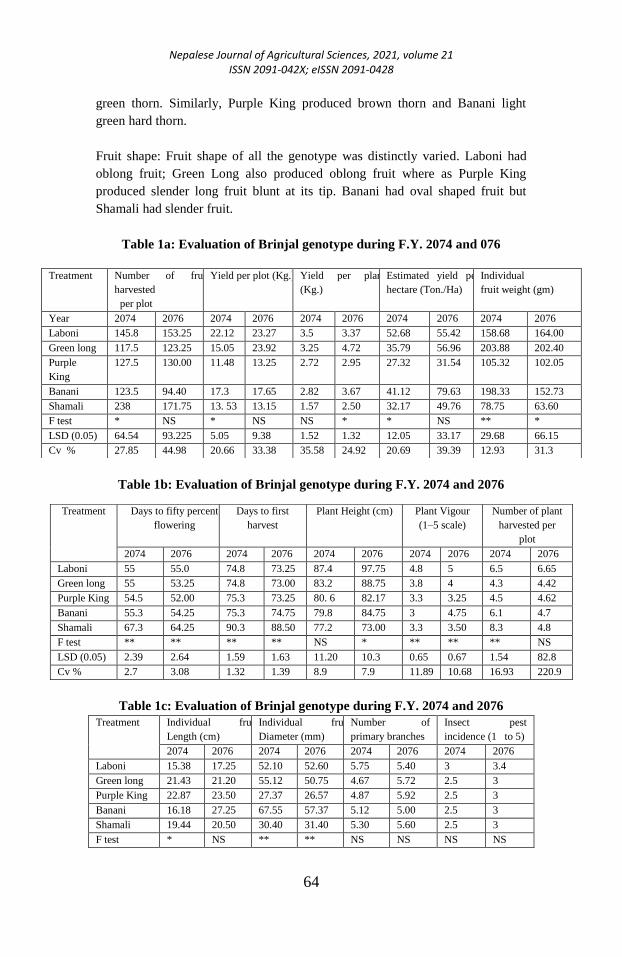
Nepalese Journal of Agricultural Sciences, 2021, volume 21 ISSN 2091-042X; eISSN 2091-0428
64
green thorn. Similarly, Purple King produced brown thorn and Banani light
green hard thorn.
Fruit shape: Fruit shape of all the genotype was distinctly varied. Laboni had
oblong fruit; Green Long also produced oblong fruit where as Purple King
produced slender long fruit blunt at its tip. Banani had oval shaped fruit but
Shamali had slender fruit.
Table 1a: Evaluation of Brinjal genotype during F.Y. 2074 and 076
Table 1b: Evaluation of Brinjal genotype during F.Y. 2074 and 2076
Table 1c: Evaluation of Brinjal genotype during F.Y. 2074 and 2076
Treatment Individual fruit
Length (cm)
Individual fruit
Diameter (mm)
Number of
primary branches
Insect pest
incidence (1 to 5)
2074 2076 2074 2076 2074 2076 2074 2076
Laboni 15.38 17.25 52.10 52.60 5.75 5.40 3 3.4
Green long 21.43 21.20 55.12 50.75 4.67 5.72 2.5 3
Purple King 22.87 23.50 27.37 26.57 4.87 5.92 2.5 3
Banani 16.18 27.25 67.55 57.37 5.12 5.00 2.5 3
Shamali 19.44 20.50 30.40 31.40 5.30 5.60 2.5 3
F test * NS ** ** NS NS NS NS
Treatment
Number of fruit
harvested
per plot
Yield per plot (Kg.) Yield per plant
(Kg.)
Estimated yield per
hectare (Ton./Ha)
Individual
fruit weight (gm)
Year 2074 2076 2074 2076 2074 2076 2074 2076 2074 2076
Laboni 145.8 153.25 22.12 23.27 3.5 3.37 52.68 55.42 158.68 164.00
Green long 117.5 123.25 15.05 23.92 3.25 4.72 35.79 56.96 203.88 202.40
Purple
King
127.5 130.00 11.48 13.25 2.72 2.95 27.32 31.54 105.32 102.05
Banani 123.5 94.40 17.3 17.65 2.82 3.67 41.12 79.63 198.33 152.73
Shamali 238 171.75 13. 53 13.15 1.57 2.50 32.17 49.76 78.75 63.60
F test * NS * NS NS * * NS ** *
LSD (0.05) 64.54 93.225 5.05 9.38 1.52 1.32 12.05 33.17 29.68 66.15
Cv % 27.85 44.98 20.66 33.38 35.58 24.92 20.69 39.39 12.93 31.3
Treatment Days to fifty percent
flowering
Days to first
harvest
Plant Height (cm) Plant Vigour
(1–5 scale)
Number of plant
harvested per
plot
2074 2076 2074 2076 2074 2076 2074 2076 2074 2076
Laboni 55 55.0 74.8 73.25 87.4 97.75 4.8 5 6.5 6.65
Green long 55 53.25 74.8 73.00 83.2 88.75 3.8 4 4.3 4.42
Purple King 54.5 52.00 75.3 73.25 80. 6 82.17 3.3 3.25 4.5 4.62
Banani 55.3 54.25 75.3 74.75 79.8 84.75 3 4.75 6.1 4.7
Shamali 67.3 64.25 90.3 88.50 77.2 73.00 3.3 3.50 8.3 4.8
F test ** ** ** ** NS * ** ** ** NS
LSD (0.05) 2.39 2.64 1.59 1.63 11.20 10.3 0.65 0.67 1.54 82.8
Cv % 2.7 3.08 1.32 1.39 8.9 7.9 11.89 10.68 16.93 220.9
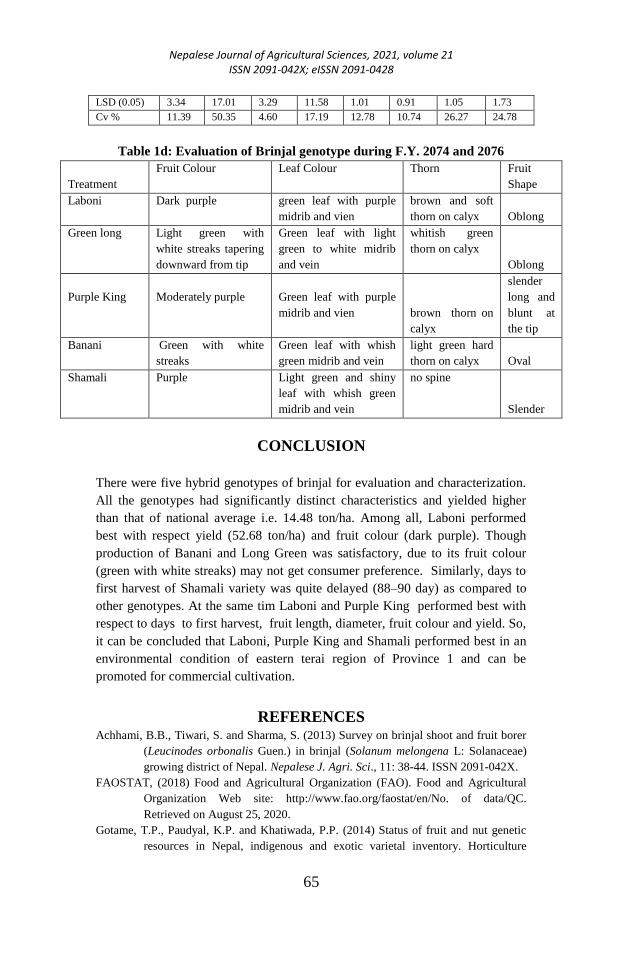
Nepalese Journal of Agricultural Sciences, 2021, volume 21 ISSN 2091-042X; eISSN 2091-0428
65
LSD (0.05) 3.34 17.01 3.29 11.58 1.01 0.91 1.05 1.73
Cv % 11.39 50.35 4.60 17.19 12.78 10.74 26.27 24.78
Table 1d: Evaluation of Brinjal genotype during F.Y. 2074 and 2076
Treatment
Fruit Colour Leaf Colour Thorn Fruit
Shape
Laboni
Dark purple
green leaf with purple
midrib and vien
brown and soft
thorn on calyx Oblong
Green long
Light green with
white streaks tapering
downward from tip
Green leaf with light
green to white midrib
and vein
whitish green
thorn on calyx
Oblong
Purple King
Moderately purple
Green leaf with purple
midrib and vien
brown thorn on
calyx
slender
long and
blunt at
the tip
Banani
Green with white
streaks
Green leaf with whish
green midrib and vein
light green hard
thorn on calyx Oval
Shamali
Purple
Light green and shiny
leaf with whish green
midrib and vein
no spine
Slender
CONCLUSION
There were five hybrid genotypes of brinjal for evaluation and characterization.
All the genotypes had significantly distinct characteristics and yielded higher
than that of national average i.e. 14.48 ton/ha. Among all, Laboni performed
best with respect yield (52.68 ton/ha) and fruit colour (dark purple). Though
production of Banani and Long Green was satisfactory, due to its fruit colour
(green with white streaks) may not get consumer preference. Similarly, days to
first harvest of Shamali variety was quite delayed (88–90 day) as compared to
other genotypes. At the same tim Laboni and Purple King performed best with
respect to days to first harvest, fruit length, diameter, fruit colour and yield. So,
it can be concluded that Laboni, Purple King and Shamali performed best in an
environmental condition of eastern terai region of Province 1 and can be
promoted for commercial cultivation.
REFERENCES Achhami, B.B., Tiwari, S. and Sharma, S. (2013) Survey on brinjal shoot and fruit borer
(Leucinodes orbonalis Guen.) in brinjal (Solanum melongena L: Solanaceae)
growing district of Nepal. Nepalese J. Agri. Sci., 11: 38-44. ISSN 2091-042X.
FAOSTAT, (2018) Food and Agricultural Organization (FAO). Food and Agricultural
Organization Web site: http://www.fao.org/faostat/en/No. of data/QC.
Retrieved on August 25, 2020.
Gotame, T.P., Paudyal, K.P. and Khatiwada, P.P. (2014) Status of fruit and nut genetic
resources in Nepal, indigenous and exotic varietal inventory. Horticulture
Nepalese Journal of Agricultural Sciences, 2021, volume 21 ISSN 2091-042X; eISSN 2091-0428
66
Research Division, Nepal Agricultural Research Council, Khumaltar, Lalitpur.
NARC Publication Serial No. 0090-12 (2013/14).
Joshi, S.L. (2003) Investigation of eggplant fruit and shoot borer (Leucinoides orbonalis
Guen) in Nepal. In: Proceeding of the Third National Horticulture Research
Workshop, 7-8 June 2000. Nepal Agricultural Research Council, Horticulture
Research Division, Khumaltar, Lalitpur, Nepal. Pp. 54-60.
MoAD. (2019) Statistical information on Nepalese agriculture 2016/17. Government of
Nepal, Ministry of Agricultural Development, Agribusiness Promotion and
Statistics Division, Singh Durbar, Kathmandu, Nepal.

Nepalese Journal of Agricultural Sciences, 2021, volume 21 ISSN 2091-042X; eISSN 2091-0428
67
Biology and population dynamics of Chinese citrus
fruit fly (Bactrocera minax) (Diptera: Tephritidae) in
eastern hills of Nepal
Kishor Bhandari 1*
, G. P. Timsina2, G. Gautam
3 & M.K.
Thakur 1
1 Directorate of Agricultural Research, Tarahara;
2Agricultural Research Station,
Pakhribas, 3Agriculture Research Station, Jaubari
*Corresponding Author: [email protected]
ABSTRACT
Bactrocera minaxis considered as a serious pest of citrus
crops in Nepal and can cause 15-97 % citrus fruit drop. As
part of development of management tactics against the fly in
citrus orchard, a study was carried out to determine the
developmental stages as well as population dynamics of the
insect in National Citrus Research Program (NCRP),
Paripatle, Dhankuta from 2012 to 2013. The study indicated
that adult flies emerged from soil from first week of April to
third week of May but maximum (about 70 percent) adult flies
emerged on first fifteen days of April indicating that the peak
emergence period of the insect. Likewise, a study on
oviposition period of fruit fly revealed that the egg laying
period occurs from 16th May to 16th July, reaching maximum
on first week of June. Similarly, an attempt made to know
natural pupation depth of pupa by sampling soil under canopy
of citrus orchard indicated that larvae can go up to 20 cm
depth in sandy loam soil for pupation but it is confined only up
to 12 cm from surface level in case of clay-loam soil. In
addition, an investigation on monitoring of the insect with the
help of protein bait trap showed that the number of flies
increased sharply from third week of May and reached peak
on first week of June. The population plummeted steeply till
first week of July. The adult flies were observed in the citrus
orchard till second week of September.
Key words: Chinese citrus fruit fly, adult emergence, oviposition period,
pupation depth, adult longevity
INTRODUCTION
The Chinese citrus fruit fly, Bactrocera minax (Enderlein) is one of the
notorious pests of citrus in Nepal, India, Bhutan and China (Wang and Luo
Nepalese Journal of Agricultural Sciences, 2021, volume 21 ISSN 2091-042X; eISSN 2091-0428
68
1995, Dorji et al. 2006, Drew et al. 2006 and Bhandari et al. 2017a). The larval
host range of B. minax is largely restricted to wild and cultivated species of
Citrus.In Nepalese context mandarin and sweet orange are the major income
generating commodities in the mid-hills. Unfortunately, B. minax has caused a
serious yield loss ranging from 15 to 97 % in mandarin, sweet orange, lemon
and pumelo in eastern mid-hill.It has been reported in several region of Nepal
from Dhankuta, Bhojpur, Sindhuli, Ramechhap to Myagdi, Gulmi and Parbat
(Bhandari, et al. 2017a).
Relatively few researches have been published on biology and pest management
of B. minax in Nepal. It is univoltine and oligophagous pest of Citrus fruits
(Dong et al. 2013). Adult emergence period of B. minax in eastern hill of Nepal
has been identified as April to May (Bhandari et al. 2017a).The adult flies
appear for the first time in citrus orchardon third week of April and vanish
completely from September onwards (Bhandari, et al. 2017b).
The knowledge of biology and different developmental stages of insect is
prerequisite in designing effective management strategies. Therefore, this study
was undertaken to gain precise knowledge of the various developmental stages,
their duration, adult emergence period, adult longevity, oviposition period,and
pupation depth and population dynamics of the insect.
MATERIALS AND METHODS
1. Determination of adult emergence period
To capture the adult emergence from pupa in soil of the sweet orange orchard,
fine pollinating net with a base of 1 m2 were placed at twelve locations under the
trees with fallen fruits for a seven month period from August 2012 to April
2013. Twelve nets were placed in 25 year old sweet orange orchard at NCRP,
Dhankuta on August 2012 and subsequently inspected at weekly intervals. In the
year 2013, similar design nets were placed in the same orchard as used
previously, under trees where there was natural fruit drop. Traps net located
under the sweet orange orchard were inspected daily from August to April in
order to know the emergence duration of fruit fly infesting citrus fruits and
identify peak emergence period of adult flies.
2. Measurement of oviposition period in sweet orange
Fruit fly is oviparous insect, which lays eggs with little embryonic development
within the mother. Thus, identification of egg-laying period is crucial that helps
to determine the appropriate time for employing of the control measures such as
cover sprays, protein bait sprays and other forms of baiting substances to
manipulate pest population. A study on the identification of oviposition period
of fruit fly was carried out at NCRP, Paripatle in 2013. The observations of egg
Nepalese Journal of Agricultural Sciences, 2021, volume 21 ISSN 2091-042X; eISSN 2091-0428
69
lying were taken at eleven fortnight intervals beginning from 1st May to 16
th
November 2013. Five branches each tree containing of five fruits from eleven
trees of sweet orange were selected for the study. Initially the selected fruited
branches of all trees were bagged with pollinating net to protect the fruit from
oviposition. Beginning on 1st May, five randomly selected fruit bearing branches
were exposed for a two week period and then enclosed for a total of ten
fortnights. The last exposure period was 1st to 16
th November 2013. After the
fruits reach at maturity, all the bagged fruits were harvested and inspected for
recording fruit fly damage. The logic of the research was that if the fruits
harvested were found to be damaged, could have been infested during the
exposure period.
3. Survey of natural pupation depth
An attempt was made to know natural pupation depth of Chinese citrus fruit fly
(B. minax) larva in soil by sampling of soil under canopy of citrus orchard.
Under the canopies of a sweet orange and mandarin, the soil (sandy, loamy and
clay, respectively) was excavated in layers and examined for fruit fly pupae. A
quadrate of (30 by 30 cm) was used for sampling soil. In each quadrate, pupae
were searched at five levels, surface, 0-4 cm, 4-8 cm, 8-12 cm and 12-16 cm.
Five samples were taken for each soil type. Hence, after no pupae were found in
five such quadrates, sampling at this additional depth was abandoned. Soil was
sieved using colander (pore size ~ 1.5 mm).
4. Measurement of pupation depth in Laboratory
In order to study the pupation depth of Chinese fruit fly, three types of soil i.e.,
sandy, loamy and clay soil were collected from citrus orchard and brought to
Laboratory. Soil samples were obtained on November 2013 from the top 10 cm
of the horizon. They were air-dried, sifted through a 4 mm mesh wire sieve, and
dried in an oven for 6 h at 80 0 C to kill soil inhabiting insects. Hence oven-dried
soil was used for the study, and water was added @ 100 ml/kg of dry soil to
make congenial for the larva to pupate. The moisture in the soil was regularly
maintained by adding water in 3-4 days interval till January.
The Chinese fruit fly larvae used for the experiment was collected from the
infested fruits from citrus orchard. For the collection of infested fruit sweet
orange trees were shaken with hand to ensure infested fruit drop from the trees.
The fruits hence dropped were cut half with the help of knife and larvae inside
the fruits were utilized for the experiment. The translucent polyethylene plastic
containers of the size 4 liter, 20 cm high with 50 cm diameter were used for the
experiment. The height (20 cm) of containers was marked distinctly with each
line 1 cm with permanent markers from outside. One larva was placed into each
test container. Single larva was used per experimental unit to eliminate
possibility of any interaction among larvae while burrowing. After 60 days,
layers of soil were removed in 1 cm increments and sieved a 1.68 mm mesh wire
Nepalese Journal of Agricultural Sciences, 2021, volume 21 ISSN 2091-042X; eISSN 2091-0428
70
sieve to locate the pupae. The depth of pupation was recorded from different
depth of each test container. The pupal depth data was analyzed as split plot
design with moisture level as the main plot treatment and soil type as sub-plot
treatment.
5. Population dynamics of Chinese citrus fruit fly
As the Chinese citrus fruit fly can’t be ensnared by using para-pheromone as of
Oriental Fruit Fly do, protein bait is the best potential method for monitoring
and detection of this insect. Hence, an experiment on monitoring population
dynamics of the insect was carried out to know characteristics of population
build up in citrus orchard at NCRP, Paripatle during 2014 and 2015. The study
aimed at determining the population dynamics in relation to different dates so as
to develop an appropriate control measure against this pest. The McPhail trap
(McP) was used with autolyzed protein (50 % Protein, Australlia) and Spinosad
for knockdown keeping bait solution up to 1 cm at the bottom of the trap. The
traps were baited with 250 ml aqueous solution at the rate of 20 ml autolysed
protein per litre water and hanged to the tree branches at 2 m height. Four traps
were used in 4 hector orchard of sweet orange. Insects trapped in each trap were
collected and the species and sex were identified and recorded. After that, traps
were washed with water and recharged with fresh bait every week.
Fruits were covered with net before being susceptible to the fly, then exposed
for two weeks on from the given date of exposure and then subsequently re-
bagged till fruit maturity.
RESULTS AND DISCUSSION
1. Determination of adult emergence period
Trap net located under the sweet orange orchard showed that adult flies started
to emerge from first week of April. A total of 2450 flies were found to emerge
from soil from first week of April till third week of May. However, maximum
(about 70%) adult flies emerged on first fifteen days of April which was found
as the peak emergence period of the insect (Figure 1).
Figure 1. Number of adult flies emerged from soil in trap nets located under
the sweet orange orchard
Nepalese Journal of Agricultural Sciences, 2021, volume 21 ISSN 2091-042X; eISSN 2091-0428
71
2. Measurement of oviposition period in sweet orange
The maximum infestation (89%) with fruit fly was observed on first week of
June followed by next two consecutive fortnights. The first oviposition was
commenced from second week of May and ended after first week of July.
Therefore, the result revealed that the egg laying period occurs from 16th
May to
16th
July, reaching maximum on first week of June (fig: 2). From this study it
could be suggested that the control measure during this period would be
effective for minimizing the population of this pest.
Figure 2. Fruit infestation by larvae of Bactrocera minax in sweet orange
3. Survey of natural pupation depth
The soil excavated and examined under the canopies of a sweet orange orchard
in the sandy –loam soil indicated 52 pupae of B. minax. Out of them only 5
pupae were found at a depth of >16 cm; 19 pupae found at a depths of up to 4
cm, 19 at 8-12 cm and 9 at 12-16 cm and none were found on the surface. In the
clay-loam soil of Chha Garhe Block, a total of 54 pupae were collected. There
were 26 pupae at 0-4 cm and 28 pupae at 4-8 cm but none were found at a depth
of > 12 cm (Figure 3).
Figure 3. Number of pupae of B. minax found in two types of soil in various
depth
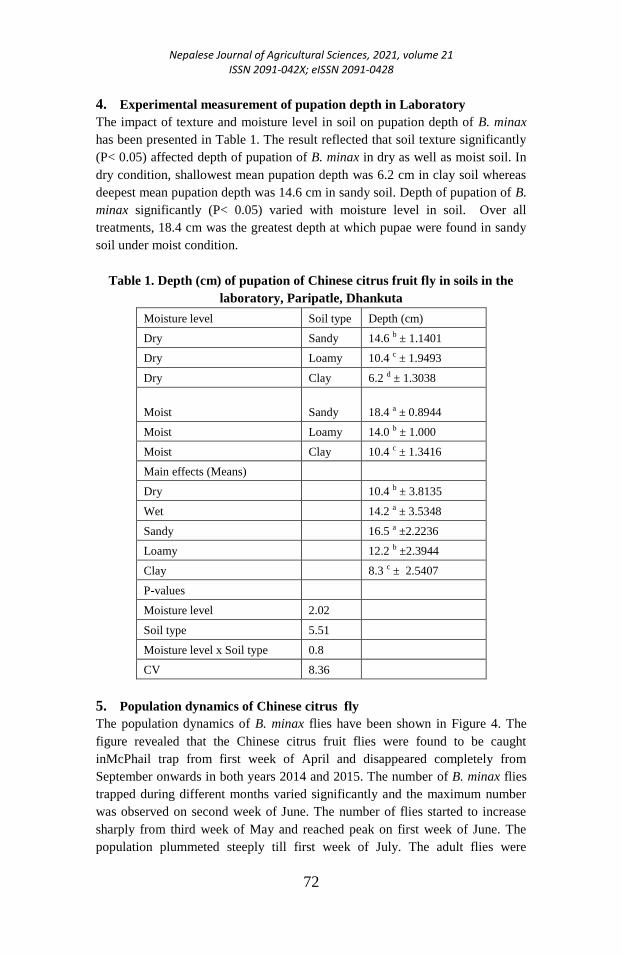
Nepalese Journal of Agricultural Sciences, 2021, volume 21 ISSN 2091-042X; eISSN 2091-0428
72
4. Experimental measurement of pupation depth in Laboratory
The impact of texture and moisture level in soil on pupation depth of B. minax
has been presented in Table 1. The result reflected that soil texture significantly
(P< 0.05) affected depth of pupation of B. minax in dry as well as moist soil. In
dry condition, shallowest mean pupation depth was 6.2 cm in clay soil whereas
deepest mean pupation depth was 14.6 cm in sandy soil. Depth of pupation of B.
minax significantly (P< 0.05) varied with moisture level in soil. Over all
treatments, 18.4 cm was the greatest depth at which pupae were found in sandy
soil under moist condition.
Table 1. Depth (cm) of pupation of Chinese citrus fruit fly in soils in the
laboratory, Paripatle, Dhankuta
Moisture level Soil type Depth (cm)
Dry Sandy 14.6 b ± 1.1401
Dry Loamy 10.4 c ± 1.9493
Dry Clay 6.2 d ± 1.3038
Moist Sandy 18.4 a ± 0.8944
Moist Loamy 14.0 b ± 1.000
Moist Clay 10.4 c ± 1.3416
Main effects (Means)
Dry
10.4 b ± 3.8135
Wet 14.2 a ± 3.5348
Sandy
16.5 a ±2.2236
Loamy
12.2 b ±2.3944
Clay 8.3 c ± 2.5407
P-values
Moisture level 2.02
Soil type 5.51
Moisture level x Soil type 0.8
CV 8.36
5. Population dynamics of Chinese citrus fly
The population dynamics of B. minax flies have been shown in Figure 4. The
figure revealed that the Chinese citrus fruit flies were found to be caught
inMcPhail trap from first week of April and disappeared completely from
September onwards in both years 2014 and 2015. The number of B. minax flies
trapped during different months varied significantly and the maximum number
was observed on second week of June. The number of flies started to increase
sharply from third week of May and reached peak on first week of June. The
population plummeted steeply till first week of July. The adult flies were
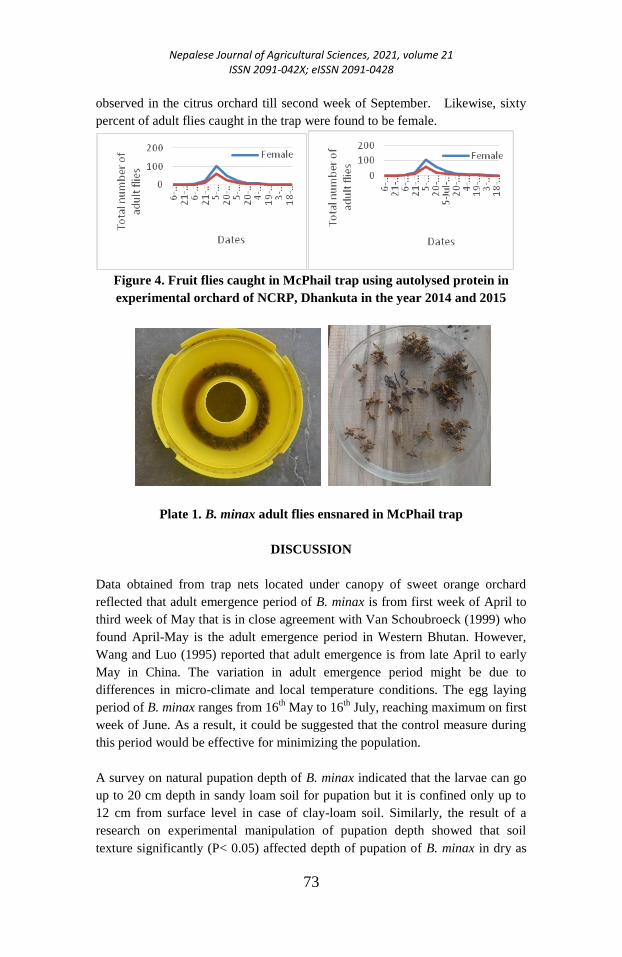
Nepalese Journal of Agricultural Sciences, 2021, volume 21 ISSN 2091-042X; eISSN 2091-0428
73
observed in the citrus orchard till second week of September. Likewise, sixty
percent of adult flies caught in the trap were found to be female.
Figure 4. Fruit flies caught in McPhail trap using autolysed protein in
experimental orchard of NCRP, Dhankuta in the year 2014 and 2015
Plate 1. B. minax adult flies ensnared in McPhail trap
DISCUSSION
Data obtained from trap nets located under canopy of sweet orange orchard
reflected that adult emergence period of B. minax is from first week of April to
third week of May that is in close agreement with Van Schoubroeck (1999) who
found April-May is the adult emergence period in Western Bhutan. However,
Wang and Luo (1995) reported that adult emergence is from late April to early
May in China. The variation in adult emergence period might be due to
differences in micro-climate and local temperature conditions. The egg laying
period of B. minax ranges from 16th
May to 16th
July, reaching maximum on first
week of June. As a result, it could be suggested that the control measure during
this period would be effective for minimizing the population.
A survey on natural pupation depth of B. minax indicated that the larvae can go
up to 20 cm depth in sandy loam soil for pupation but it is confined only up to
12 cm from surface level in case of clay-loam soil. Similarly, the result of a
research on experimental manipulation of pupation depth showed that soil
texture significantly (P< 0.05) affected depth of pupation of B. minax in dry as
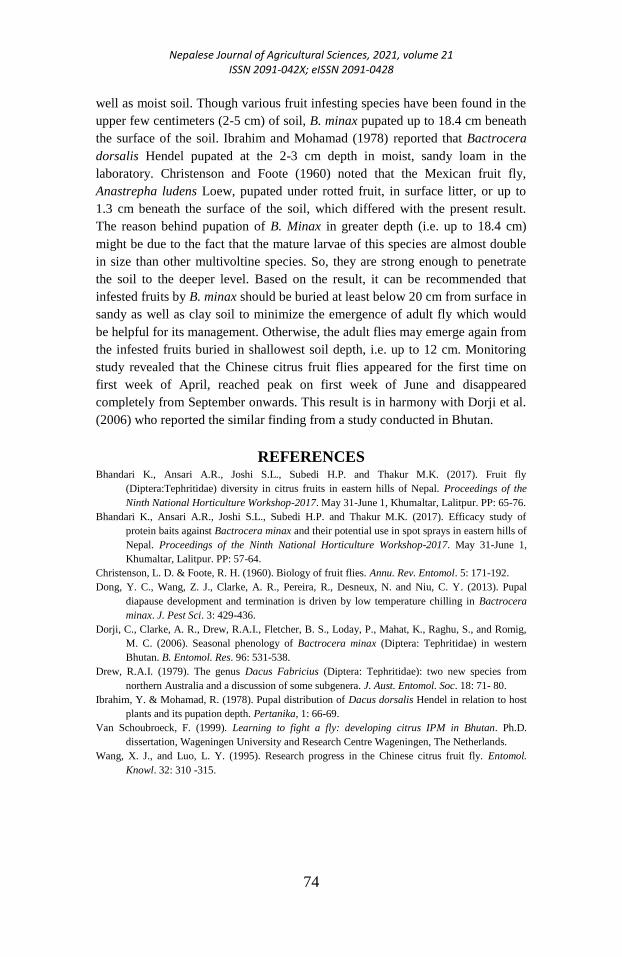
Nepalese Journal of Agricultural Sciences, 2021, volume 21 ISSN 2091-042X; eISSN 2091-0428
74
well as moist soil. Though various fruit infesting species have been found in the
upper few centimeters (2-5 cm) of soil, B. minax pupated up to 18.4 cm beneath
the surface of the soil. Ibrahim and Mohamad (1978) reported that Bactrocera
dorsalis Hendel pupated at the 2-3 cm depth in moist, sandy loam in the
laboratory. Christenson and Foote (1960) noted that the Mexican fruit fly,
Anastrepha ludens Loew, pupated under rotted fruit, in surface litter, or up to
1.3 cm beneath the surface of the soil, which differed with the present result.
The reason behind pupation of B. Minax in greater depth (i.e. up to 18.4 cm)
might be due to the fact that the mature larvae of this species are almost double
in size than other multivoltine species. So, they are strong enough to penetrate
the soil to the deeper level. Based on the result, it can be recommended that
infested fruits by B. minax should be buried at least below 20 cm from surface in
sandy as well as clay soil to minimize the emergence of adult fly which would
be helpful for its management. Otherwise, the adult flies may emerge again from
the infested fruits buried in shallowest soil depth, i.e. up to 12 cm. Monitoring
study revealed that the Chinese citrus fruit flies appeared for the first time on
first week of April, reached peak on first week of June and disappeared
completely from September onwards. This result is in harmony with Dorji et al.
(2006) who reported the similar finding from a study conducted in Bhutan.
REFERENCES Bhandari K., Ansari A.R., Joshi S.L., Subedi H.P. and Thakur M.K. (2017). Fruit fly
(Diptera:Tephritidae) diversity in citrus fruits in eastern hills of Nepal. Proceedings of the
Ninth National Horticulture Workshop-2017. May 31-June 1, Khumaltar, Lalitpur. PP: 65-76.
Bhandari K., Ansari A.R., Joshi S.L., Subedi H.P. and Thakur M.K. (2017). Efficacy study of
protein baits against Bactrocera minax and their potential use in spot sprays in eastern hills of
Nepal. Proceedings of the Ninth National Horticulture Workshop-2017. May 31-June 1,
Khumaltar, Lalitpur. PP: 57-64.
Christenson, L. D. & Foote, R. H. (1960). Biology of fruit flies. Annu. Rev. Entomol. 5: 171-192.
Dong, Y. C., Wang, Z. J., Clarke, A. R., Pereira, R., Desneux, N. and Niu, C. Y. (2013). Pupal
diapause development and termination is driven by low temperature chilling in Bactrocera
minax. J. Pest Sci. 3: 429-436.
Dorji, C., Clarke, A. R., Drew, R.A.I., Fletcher, B. S., Loday, P., Mahat, K., Raghu, S., and Romig,
M. C. (2006). Seasonal phenology of Bactrocera minax (Diptera: Tephritidae) in western
Bhutan. B. Entomol. Res. 96: 531-538.
Drew, R.A.I. (1979). The genus Dacus Fabricius (Diptera: Tephritidae): two new species from
northern Australia and a discussion of some subgenera. J. Aust. Entomol. Soc. 18: 71- 80.
Ibrahim, Y. & Mohamad, R. (1978). Pupal distribution of Dacus dorsalis Hendel in relation to host
plants and its pupation depth. Pertanika, 1: 66-69.
Van Schoubroeck, F. (1999). Learning to fight a fly: developing citrus IPM in Bhutan. Ph.D.
dissertation, Wageningen University and Research Centre Wageningen, The Netherlands.
Wang, X. J., and Luo, L. Y. (1995). Research progress in the Chinese citrus fruit fly. Entomol.
Knowl. 32: 310 -315.
Nepalese Journal of Agricultural Sciences, 2021, volume 21 ISSN 2091-042X; eISSN 2091-0428
75
Effect of dietary supplementation of carotenoids on
growth performance of rainbow trout (Oncorhynchus
mykiss, Walbaum) in Rasuwa, Nepal
Suraj K Singh1*
, Mahendra P Bhandari1, Prem Timalsina
2
1Rainbow Trout Fishery Research Station, Dhunche, Rasuwa, Nepal
2National Fishery Research Centre, Godawari, Nepal
*Corresponding Author: [email protected]
ABSTRACT
The effect of dietary supplementation of carotenoids on growth
performance of rainbow trout oncorhynchus mykiss, walbaum was
studied. 120 fish were maintained in 12 raceways of 3m3 laid out
in complete randomized design and fed with four diets; Diet-1:
Fish meal based; Diet-2: 3% Marigold Petal; Diet-3: 3% Red
pepper; and Diet-4: 60 mg/kg synthetic astaxanthin for 90 days
which were replicated 3 times. Fishes were hand fed twice a day
with pellet feed as suggested by rainbow trout daily feeding guide.
Growth parameters as well as yield parameters were at par in Diet
2, diet 3 and diet 4 whereas were significantly different with
control diet. There were no significant differences between
treatments in water quality parameters during culture period. For
the growth enhancement in rainbow trout 3% marigold petal and
3% red pepper were as better as synthetic astaxanthin than that of
control diet.
Key words: Marigold petal, red pepper, astaxanthin, growth parameters
INTRODUCTION
Phytoplankton, algae and plants has been known to combine to form a more
complex product such as carotenoids which are a group of over 600 natural fat
soluble pigments. Caretenoids are known to be integrated into various tissues
often transmuting into other forms of carotenoids by being assimilated into
animal diets (Lorenz, 2000). Fish such as salmon, rainbow trout, red sea bream,
prawn and lobster has been linked with flesh pigmentation for the additional
market value for which their diet has been added with carotenoids previously
(Sommer et al, 1991; Ahilan & Prince Jeyaseelan, 2001; Alagappan et al, 2004;
Choubert et al, 2006; Ezhil, 2007; Ezhil et al, 2008).
Nepalese Journal of Agricultural Sciences, 2021, volume 21 ISSN 2091-042X; eISSN 2091-0428
76
Synthetic pigments such as astaxanthin are very expensive sources of
carotenoids and thus aquaculture feed production become costlier and less profit
from trout farming. The supplementation of synthetic additives was common but
emphasis on use of natural sources of carotenoids highly emphasized as feed
additives. Aquatic organisms are incapable of biosynthesizing carotenoids, so
diet is their source as only plants, bacteria, fungi and algae have the capacity for
its synthesis (Huyghebaert, 1993). Furthermore, synthetic pigments have only
specific carotenoid i.e. beta carotene and it also involve petrochemical solvents
and other complex organic solvents, leading to residue problems (Theis,
Salzburger, & Egger, 2012). Recently red pepper and marigold has been
subjected as an alternative to synthetic astaxanthin for pigmentation of
salmonids (Vernon Carter et al, 1994; Yanar et al, 1997).
Chile, Denmark, France, Germany, Italy, Iran, Norway, Spain, the UK and the
USA are the major countries producing the rainbow trout. The global production
of rainbow trout amounted to 848.1 thousand tons in 2018 (FAO, 2020).
Rainbow trout, a salmonid species has an economic importance worldwide and
contributes to the indigenous food security with annual production of 420 tons in
2019 thus establishing itself as one of the main cultured fish species in Nepal
(NFRS, 2020). To the best of our knowledge, no investigations on marigold and
red pepper has been done in rainbow trout in context of Nepal. Therefore, the
present study was conducted to evaluate the growth performance of rainbow
trout with inclusion of both natural and synthetic carotenoid sources in diets.
MATERIALS AND METHOD
Experimental site and design
The experiment was carried out under controlled conditions at Rainbow Trout
Fishery Research Station, Dhunche (28.1080° N, 85.2891° E) located at the
altitude of 1850 meter above sea level. Initially, about 300 trout of 200-250g
size were maintained in raceway. During the culture period of a week, the fishes
were acclimatized by feeding control diet (commercial extruded trout feed of
crude protein 34.9%; crude lipid 1.17%; crude fiber 4.98%; total ash 16.99%) at
the rate of 3% of the body size in a flow-through raceway type. After
acclimatization, 10 trout were netted from the raceways and transferred to each
individual 12 outdoor raceway with flow-through system having water volume
of 3m3 (3m × 1m × 1m). There were four treatments having 4 diets with control
diet or Fish meal based (T1), 3 % Marigold Petal (T2), 3 % Red pepper (T3) and
60 mg/kg Synthetic Astaxanthin (T4) incorporated on all diets. The treatments
were replicated three times, randomized by creating random numbers in the MS
Excel sheet for total culture period of 90 days.
Nepalese Journal of Agricultural Sciences, 2021, volume 21 ISSN 2091-042X; eISSN 2091-0428
77
3m
1m T3 T2
T4 T1
T4
T2
T1
T3
T1 T3
T4 T2
Figure 1. Layout and geometry of the experimental raceways
Preparation of pellet diet
Four diets with same levels of dietary protein (approximately 47%) for rainbow
trout were formulated: - fish meal based diet (control) and 3% Marigold Petal,
3% Red pepper and 60mg/kg Synthetic Astaxanthin. To prepare formulated diet
for the experiment, all ingredients (Table 1) were ground thoroughly and sieved
to pass through 0.05mm mesh size; mixed together in a blender and then put into
the electric operated pellet machine for the preparation of pellet diet of size
<6mm. The pellets were air dried and were packed in plastic bags and stored at -
4°C.
Proximate analysis of feed ingredients and experimental diets
Quadrant sampling of ingredients and prepared diets was done to draw
representatives for proximate analysis. Proximate analysis of each type of
ingredient and experimental feed was done according to AOAC (1990) at the
Food Research Division, Khumaltar, Lalitpur.
Table 1. Ingredients and their compositionused in the experimental diets
Ingredients Control (%) Marigold petal (%) Red pepper (%) Astaxanthin (%)
Jwala 51.86 51.86 51.86 51.86
Soya full roasted 35 35 35 35
Wheat grain 6.14 6.14 6.14 6.14
Rice Bran 4 4 4 4
Additional
Vitamin premix* 2 2 2 2
Mineral mix** 2 2 2 2
Liver tonic 3 3 3 3
Yeast 1 1 1 1
Salt 1 1 1 1
Additives
Carotenoids None 3 3 60mg/kg
*Vitamin mixture/kg premix containing the following: 33000IU vitamin A,
3300IU, vitamin D3, 410IU vitamin E, 2660mg Vitamin BI, 133mg vitamin B2,
580mg vitamin B6, 41mg vitamin B12, 50mg biotin, 9330mg choline chloride,
4000mg vitamin C, 2660mg Inositol, 330mg para-amino benzoic acid, 9330mg
niacin, 26.60mg pantothenic acid
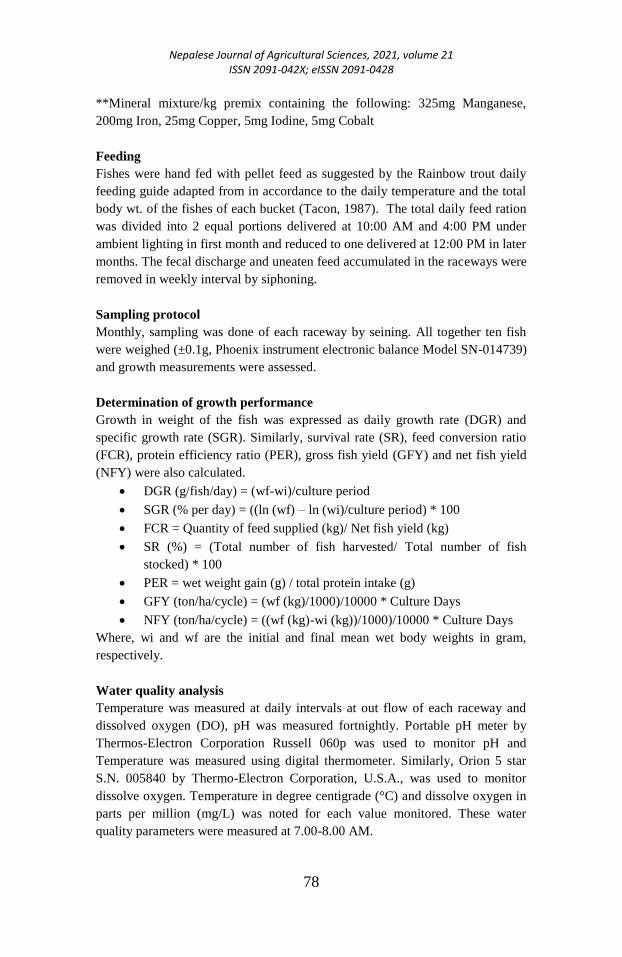
Nepalese Journal of Agricultural Sciences, 2021, volume 21 ISSN 2091-042X; eISSN 2091-0428
78
**Mineral mixture/kg premix containing the following: 325mg Manganese,
200mg Iron, 25mg Copper, 5mg Iodine, 5mg Cobalt
Feeding
Fishes were hand fed with pellet feed as suggested by the Rainbow trout daily
feeding guide adapted from in accordance to the daily temperature and the total
body wt. of the fishes of each bucket (Tacon, 1987). The total daily feed ration
was divided into 2 equal portions delivered at 10:00 AM and 4:00 PM under
ambient lighting in first month and reduced to one delivered at 12:00 PM in later
months. The fecal discharge and uneaten feed accumulated in the raceways were
removed in weekly interval by siphoning.
Sampling protocol
Monthly, sampling was done of each raceway by seining. All together ten fish
were weighed (±0.1g, Phoenix instrument electronic balance Model SN-014739)
and growth measurements were assessed.
Determination of growth performance
Growth in weight of the fish was expressed as daily growth rate (DGR) and
specific growth rate (SGR). Similarly, survival rate (SR), feed conversion ratio
(FCR), protein efficiency ratio (PER), gross fish yield (GFY) and net fish yield
(NFY) were also calculated.
DGR (g/fish/day) = (wf-wi)/culture period
SGR (% per day) = ((ln (wf) – ln (wi)/culture period) * 100
FCR = Quantity of feed supplied (kg)/ Net fish yield (kg)
SR (%) = (Total number of fish harvested/ Total number of fish
stocked) * 100
PER = wet weight gain (g) / total protein intake (g)
GFY (ton/ha/cycle) = (wf (kg)/1000)/10000 * Culture Days
NFY (ton/ha/cycle) = ((wf (kg)-wi (kg))/1000)/10000 * Culture Days
Where, wi and wf are the initial and final mean wet body weights in gram,
respectively.
Water quality analysis
Temperature was measured at daily intervals at out flow of each raceway and
dissolved oxygen (DO), pH was measured fortnightly. Portable pH meter by
Thermos-Electron Corporation Russell 060p was used to monitor pH and
Temperature was measured using digital thermometer. Similarly, Orion 5 star
S.N. 005840 by Thermo-Electron Corporation, U.S.A., was used to monitor
dissolve oxygen. Temperature in degree centigrade (°C) and dissolve oxygen in
parts per million (mg/L) was noted for each value monitored. These water
quality parameters were measured at 7.00-8.00 AM.
Nepalese Journal of Agricultural Sciences, 2021, volume 21 ISSN 2091-042X; eISSN 2091-0428
79
Harvesting
Final harvesting of rainbow trout was done after 90 days by draining each
raceway completely on termination of the research. Harvested fish was
measured using electronic balance. Fish was counted and their batch weight was
recorded.
Statistical analysis
The data were collected during the course of time and on the basis of individual
fish observations, the population means for each character was computed. The
analysis of variance was used to compare different growth parameters and water
quality parameters using R-Stat version 4.1.0. The mean and standard errors
were calculated for each treatment. The data entry was done through MS Excel
2016. The accepted level of significance was p<0.05.
RESULTS AND DISCUSSION
The effect of different inclusion rate of different sources of carotenoids on
growth parameter is presented under the following headings.
Growth parameters
The total stock number, total stock weight, mean stock weight (MSW), total
harvest weight, total harvest number, mean harvest weight (MHW), net weight
gain, survival number, survival rate, feed conversion ratio and protein efficiency
ratio are presented in the Table 2. The experiment was carried out in flow
through system. There were 10 fishes stocked in each raceway and their total
stock weight range was 2070.00±34.64 to 2116.67±17.64g. The mean total stock
weight range was between 207.00±3.46 to 211.66±1.76g in four different
treatments. The stock weight of rainbow trout varied from 200 to 250g where as
they were wide-ranging between 255 to 348g at the termination of
experimentation.
At the termination of the experiment, the result showed that total stock weight
and survival rate were non significant in all treatments during experimental
period. The highest mean harvest weight observed in treatment T2 (296.67±2.96
g) followed by treatment T3 (294.67±3.84 g), and T4 (290.33±1.45 g) and are
significantly at par with each other (p>0.05). The lowest mean harvest weight
was recorded in control treatment T1 (280.00±2.08 g). The total harvest weight
was highest in treatment T2 (2966.67±29.63 g) which was not significantly
different with T3 (2946.67±38.44 g) and T4 (2903.33±14.53 g) but was
significantly different with T1 (2800.00±20.82 g) (p<0.05). Similarly, the
highest mean harvest weight was also highest in treatment T2 (296.67±2.96 g)
which was not significantly different with treatment T3 (294.67±3.84g), and T4
(290.33±1.45g) but was at par with treatment T1 (280.00±2.08g) (p<0.05).
Similarly, the lowest FCR was observed in treatment T1 (2.45±0.02) which was
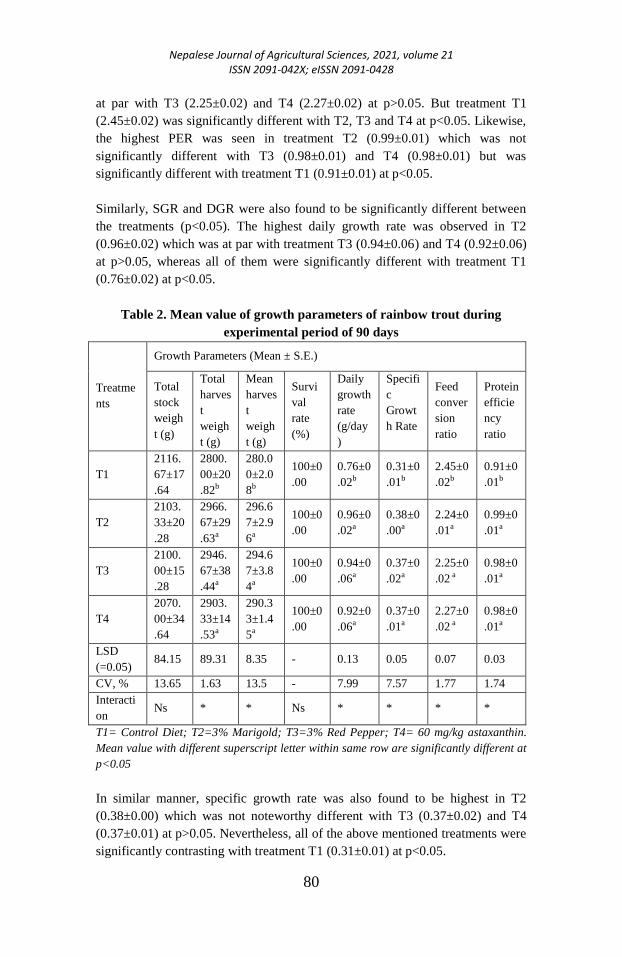
Nepalese Journal of Agricultural Sciences, 2021, volume 21 ISSN 2091-042X; eISSN 2091-0428
80
at par with T3 (2.25±0.02) and T4 (2.27±0.02) at p>0.05. But treatment T1
(2.45±0.02) was significantly different with T2, T3 and T4 at p<0.05. Likewise,
the highest PER was seen in treatment T2 (0.99±0.01) which was not
significantly different with T3 (0.98±0.01) and T4 (0.98±0.01) but was
significantly different with treatment T1 (0.91±0.01) at p<0.05.
Similarly, SGR and DGR were also found to be significantly different between
the treatments (p<0.05). The highest daily growth rate was observed in T2
(0.96±0.02) which was at par with treatment T3 (0.94±0.06) and T4 (0.92±0.06)
at p>0.05, whereas all of them were significantly different with treatment T1
(0.76±0.02) at p<0.05.
Table 2. Mean value of growth parameters of rainbow trout during
experimental period of 90 days
Treatme
nts
Growth Parameters (Mean ± S.E.)
Total
stock
weigh
t (g)
Total
harves
t
weigh
t (g)
Mean
harves
t
weigh
t (g)
Survi
val
rate
(%)
Daily
growth
rate
(g/day
)
Specifi
c
Growt
h Rate
Feed
conver
sion
ratio
Protein
efficie
ncy
ratio
T1
2116.
67±17
.64
2800.
00±20
.82b
280.0
0±2.0
8b
100±0
.00
0.76±0
.02b
0.31±0
.01b
2.45±0
.02b
0.91±0
.01b
T2
2103.
33±20
.28
2966.
67±29
.63a
296.6
7±2.9
6a
100±0
.00
0.96±0
.02a
0.38±0
.00a
2.24±0
.01a
0.99±0
.01a
T3
2100.
00±15
.28
2946.
67±38
.44a
294.6
7±3.8
4a
100±0
.00
0.94±0
.06a
0.37±0
.02a
2.25±0
.02 a
0.98±0
.01a
T4
2070.
00±34
.64
2903.
33±14
.53a
290.3
3±1.4
5a
100±0
.00
0.92±0
.06a
0.37±0
.01a
2.27±0
.02 a
0.98±0
.01a
LSD
(=0.05) 84.15 89.31 8.35 - 0.13 0.05 0.07 0.03
CV, % 13.65 1.63 13.5 - 7.99 7.57 1.77 1.74
Interacti
on Ns * * Ns * * * *
T1= Control Diet; T2=3% Marigold; T3=3% Red Pepper; T4= 60 mg/kg astaxanthin.
Mean value with different superscript letter within same row are significantly different at
p<0.05
In similar manner, specific growth rate was also found to be highest in T2
(0.38±0.00) which was not noteworthy different with T3 (0.37±0.02) and T4
(0.37±0.01) at p>0.05. Nevertheless, all of the above mentioned treatments were
significantly contrasting with treatment T1 (0.31±0.01) at p<0.05.
Nepalese Journal of Agricultural Sciences, 2021, volume 21 ISSN 2091-042X; eISSN 2091-0428
81
The inclusions of both natural and synthetic carotenoid sources can influence on
growth of rainbow trout. Among the carotenoids used, the marigold flower
contains higher carotenoids can enhance nutrient utilization and might
ultimately improve growth and play a positive role in the intermediary
metabolism in fish (Tacon, 1981). Similar result has been suggested in different
organisms like rainbow trout (Buyukcapar et al, 2007); in fish and prawn
(Harpaz et al, 1998; Ezhil et al, 2008); Barilius bendelisis (Jha et al, 2012);
goldfish (Carassius auratus) (Villar-Martínez et al., 2013); orange chromide &
rosy barb (Jagadeesh et al., 2014 & 2015); blue gourami (Jorjani et al, 2018).
Likewise, it is reported that inclusion of red pepper in the diet results in weight
gain of rainbow trout (Talebi et al, 2013) as well as in broilers (Galib et al,
2011). Similarly, addition of astaxanthin on diets enhanced the growth of
aquatic organisms. Torrissen (1984), observed increased growth in Atlantic
salmon fry fed commercial diets supplemented with 30 mg astaxanthin and 30
mg canthaxanthin per kg. Christiansen et al. (1994) also observed a positive
effect of dietary astaxanthin supplementation on the growth of Atlantic salmon
fry fed casein or gelatin based diets containing 15 and 45 mg astaxanthin per kg
dry matter. In addition a similar positive effect of astaxanthin on the growth was
suggested by Christiansen et al. (1995a).
Since, the natural and synthetic pigments are good source carotenoids. Many
studies supported in the different fishes like Atlantic salmon fry (Salmo salar),
rainbow trout (Oncorhyncus mykiss), goldfish (Carassius auratus) and characins
(Hyphessobrycon callistus) have shown positive effect on growth and survival
of the fishes (Christiansen et al, 1995; De la Mora et al, 2006; Pan et al, 2010).
Similarly, the positive effect of dietary carotenoids on growth has been found in
other fish species, such as red tilapia, Oreochromis niloticus L. (Boonyaratpalin
& Unprasert, 1989). However, treatment using carotenoid pigments on diets
were highly efficient than the treatment without carotenoids due to better feed
efficiency and utilization. Christiansen et al, (1996) used astaxanthin as a source
of carotenoid and observed lower FCR in Atlantic salmon juveniles. Similarly,
lower FCR recorded in Penaeus monodon fed on the diet containing spirulina as
a source of carotenoid (Boonyaratpalin et al, 2001). Restricted growth and
settlement of many pathogenic and non-pathogenic groups of bacteria in fish gut
due to the herbal add on sums up for the more efficient use of diet, resulting in
improved growth and greater feed efficiency (Dawood et al, 2017). The better
feed utilization due to feed palatability is demonstrated by the FCR results
increase in feed consumption and growth rate of fish. Due to better feed
palatability, growth rate enhancement results improvement in protein efficiency
ratio. Similar results were also reported by Kumar et al. (2009) and Zhang et al.
(2013).
After the experimentation of 90 days, the observed extrapolated gross fish yield
(GFY) and net fish yield (NFY) is presented in Table 3. Extrapolated highest
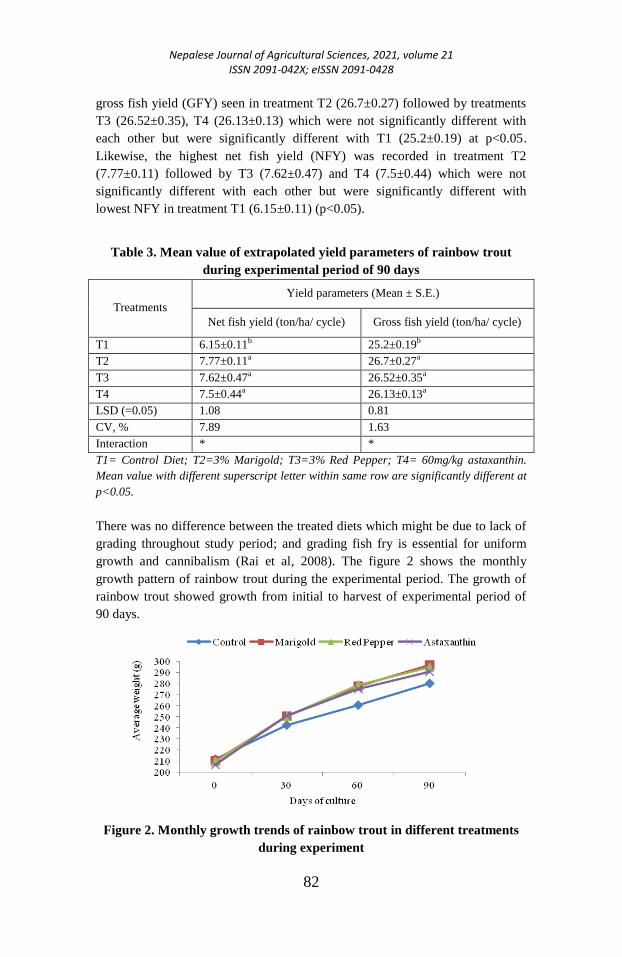
Nepalese Journal of Agricultural Sciences, 2021, volume 21 ISSN 2091-042X; eISSN 2091-0428
82
gross fish yield (GFY) seen in treatment T2 (26.7±0.27) followed by treatments
T3 (26.52±0.35), T4 (26.13±0.13) which were not significantly different with
each other but were significantly different with T1 (25.2±0.19) at p<0.05.
Likewise, the highest net fish yield (NFY) was recorded in treatment T2
(7.77±0.11) followed by T3 (7.62±0.47) and T4 (7.5±0.44) which were not
significantly different with each other but were significantly different with
lowest NFY in treatment T1 (6.15±0.11) (p<0.05).
Table 3. Mean value of extrapolated yield parameters of rainbow trout
during experimental period of 90 days
Treatments
Yield parameters (Mean ± S.E.)
Net fish yield (ton/ha/ cycle) Gross fish yield (ton/ha/ cycle)
T1 6.15±0.11b 25.2±0.19b
T2 7.77±0.11a 26.7±0.27a
T3 7.62±0.47a 26.52±0.35a
T4 7.5±0.44a 26.13±0.13a
LSD (=0.05) 1.08 0.81
CV, % 7.89 1.63
Interaction * *
T1= Control Diet; T2=3% Marigold; T3=3% Red Pepper; T4= 60mg/kg astaxanthin.
Mean value with different superscript letter within same row are significantly different at
p<0.05.
There was no difference between the treated diets which might be due to lack of
grading throughout study period; and grading fish fry is essential for uniform
growth and cannibalism (Rai et al, 2008). The figure 2 shows the monthly
growth pattern of rainbow trout during the experimental period. The growth of
rainbow trout showed growth from initial to harvest of experimental period of
90 days.
Figure 2. Monthly growth trends of rainbow trout in different treatments
during experiment
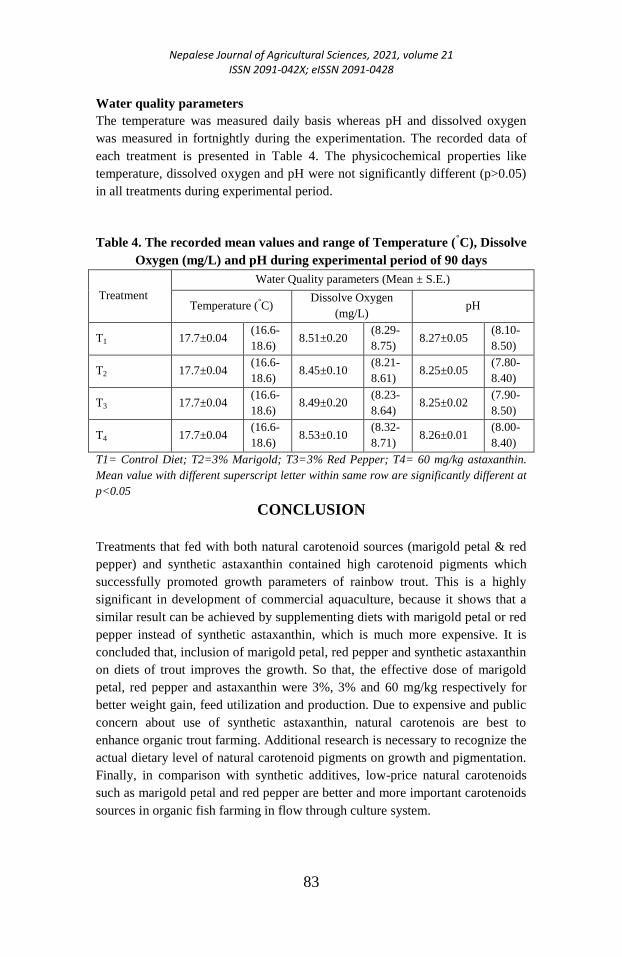
Nepalese Journal of Agricultural Sciences, 2021, volume 21 ISSN 2091-042X; eISSN 2091-0428
83
Water quality parameters
The temperature was measured daily basis whereas pH and dissolved oxygen
was measured in fortnightly during the experimentation. The recorded data of
each treatment is presented in Table 4. The physicochemical properties like
temperature, dissolved oxygen and pH were not significantly different (p>0.05)
in all treatments during experimental period.
Table 4. The recorded mean values and range of Temperature (°C), Dissolve
Oxygen (mg/L) and pH during experimental period of 90 days
Treatment
Water Quality parameters (Mean ± S.E.)
Temperature (°C) Dissolve Oxygen
(mg/L) pH
T1 17.7±0.04 (16.6-
18.6) 8.51±0.20
(8.29-
8.75) 8.27±0.05
(8.10-
8.50)
T2 17.7±0.04 (16.6-
18.6) 8.45±0.10
(8.21-
8.61) 8.25±0.05
(7.80-
8.40)
T3 17.7±0.04 (16.6-
18.6) 8.49±0.20
(8.23-
8.64) 8.25±0.02
(7.90-
8.50)
T4 17.7±0.04 (16.6-
18.6) 8.53±0.10
(8.32-
8.71) 8.26±0.01
(8.00-
8.40)
T1= Control Diet; T2=3% Marigold; T3=3% Red Pepper; T4= 60 mg/kg astaxanthin.
Mean value with different superscript letter within same row are significantly different at
p<0.05
CONCLUSION
Treatments that fed with both natural carotenoid sources (marigold petal & red
pepper) and synthetic astaxanthin contained high carotenoid pigments which
successfully promoted growth parameters of rainbow trout. This is a highly
significant in development of commercial aquaculture, because it shows that a
similar result can be achieved by supplementing diets with marigold petal or red
pepper instead of synthetic astaxanthin, which is much more expensive. It is
concluded that, inclusion of marigold petal, red pepper and synthetic astaxanthin
on diets of trout improves the growth. So that, the effective dose of marigold
petal, red pepper and astaxanthin were 3%, 3% and 60 mg/kg respectively for
better weight gain, feed utilization and production. Due to expensive and public
concern about use of synthetic astaxanthin, natural carotenois are best to
enhance organic trout farming. Additional research is necessary to recognize the
actual dietary level of natural carotenoid pigments on growth and pigmentation.
Finally, in comparison with synthetic additives, low-price natural carotenoids
such as marigold petal and red pepper are better and more important carotenoids
sources in organic fish farming in flow through culture system.
Nepalese Journal of Agricultural Sciences, 2021, volume 21 ISSN 2091-042X; eISSN 2091-0428
84
ACKNOWLEDGEMENTS
The authors are thankful to NARC for providing financial support to conduct the
study. Authors are also very much grateful to Dr. Neeta Pradhan for her
continuous guidance throughout the research period. Similarly, our sincere
gratitude goes to all the staffs of Rainbow Trout Fishery Research Station for
smooth and successful completion of the research.
REFERENCES Ahilan, B & Prince Jeyaseelan, MJ (2001) Effect of different pigment sources on color changes and
growth of juvenile Carrasius auratus. Journal of Aquaculture in Tropics, 16(1): 29-36.
Alagappan, Vijula MK & Sinha, A. (2004) Utilization of spirulina algae as a source of carotenoid
pigment for blue gouramis (Trichogaster trichopterus Pallas), Journal of Aquariculture
and Aquatic Sciences, 10(1): 1-11
AOAC, (1990) Official methods of analyses of association of analytical chemist (15th eds.).
Washington DC: AOAC
Boonyaratpalin, M, Thongrod S, Supamattaya K, Britton G & Schlipalius LE (2001) Effects of a-
carotene source, Dunaliella salina, and astaxanthin on pigmentation, growth, survival and
health of Penaeus monodon, Aquaculture Research, 32(1): 182–90
Boonyaratpalin, M & Unprasert N (1989) Effect of pigments from different sources on colour
changes and growth of red Oreochromis niloticus, Aquaculture, 79(1-4): 375-380
Buyukcapar, HM, Yanar M & Yanar Y., (2007) Pigmentation of Rainbow Trout (Oncorhynchus
mykiss) with Carotenoids from Marigold Flower (Tagetes erecta) and Red Pepper
(Capsicum annum). Turkish Journal of Veterinary and Animal Sciences, 31(1): 7-12
Choubert, G, Mendes-Pinto MM & Morais R (2006) Pigmenting efficacy of astaxanthin fed to
rainbow trout Oncorhynchus mykiss: Effect of dietary astaxanthin and lipid sources.
Aquaculture, 257: 429-436
Christiansen, R, Lie O & Torrissen OJ (1995) Growth and survival of Atlantic salmon, Salmo salar
L., fed different dietary levels of astaxanthin. First-feeding fry, Aquaculture
Nutrition, 1(3): 189-198
Christiansen, R & Torrissen OJ (1996) Growth and survival of Atlantic salmon, Salmo salar L. fed
different dietary levels of astaxanthin. Juveniles. Aquaculture Nutrition, 2(1): 55-62
Dawood, MAO, Koshio S & Esteban MÁ (2017) Beneficial roles of feed additives as
immunostimulants in aquaculture: a review. Reviews in Aquaculture, 10(4): 950-974.
https://doi.org/10.1111/raq.12209
de la Mora, GI, Arredondo-Figueroa JL, Ponce-Palafox JT & Vernon-Carter JE (2006) Comparison
of red chilli (Capsicum annuum) oleoresin and astaxanthin on rainbow trout
(Oncorhyncus mykiss) fillet pigmentation. Aquaculture, 258(1-4): 487-495
Ezhil, J, (2007) Ecophysiology and bioenergetics of achosen ornamental cichlid, Pseudotropheus
lombardoi, Ph.D. Thesis, MS University, Tirunelveli, India
Ezhil, J, Jeyanthi C & Narayanan M (2008) Marigold as a carotenoid source on pigmentation and
growth of red swordtail, Xiphophorus helleri, Turkish Journal of Fisheries and Aquatic
Sciences, 8(1): 99-101
FAO, (2020) The state of world fisheries and aquaculture, meeting the sustainable development
goals. Food and Agriculture Organization of the United Nations, 30
Harpaz, S, Rise, M, Arad S & Gur N (1998) The effect of three carotenoid sources on growth and
pigmentation of juvenile freshwater crayfish Cherax quadricarinatus, Aquaculture
Nutrition, 4(3): 201-208
Huyghebaert, G (1993) The utilisation of oxy-carotenoids for egg yolk pigmentation (Doctoral
dissertation, Ghent University)
Jagadeesh TD, Murthy HS, Surendranath SV, Panikkar P, Manjappa N & Mahesh V (2015) Effects
of supplementation of marigold (Tagetes erecta) oleoresin on growth, survival and
Nepalese Journal of Agricultural Sciences, 2021, volume 21 ISSN 2091-042X; eISSN 2091-0428
85
pigmentation of rosy barb, Puntius conchonius (HAMILTON). The Bioscan, 10(3): 1431-
1435
Jagadeesh, TD, Murthy HS, Swain SH, Chethan N, Manjunatha AR & Baglodi V (2014) Effect of
Marigold Oleoresin on Growth, Survival and Pigmentation in Orange Chromide, Etroplus
maculatus (Bloch, 1795). Fishery Technology, 51(1): 25-30.
Jha, GN, Sarma D, Qureshi TA & Akhtar MS (2012) Effect of marigold flower and beetroot meals
on growth performance, carcass composition, and total carotenoids of snow trout
(Schizothorax richardsonii).
Jorjani, M, Sharif Rohani M, Mirhashemi Rostami A, Ako H & Tan Shau Hwai A (2018).
Pigmentation and growth performance in the blue gourami, Trichogaster trichopterus,
fed marigold, Calendula officinalis, powder, a natural carotenoid source. Journal of the
World Aquaculture Society, 50(4): 789–799. https://doi.org/10.1111/jwas.12562
Kumar, V, Pillai BR, Sahoo PK, Mohanty J & Mohanty S (2009) Effect of dietary astaxanthin on
growth and immune response of Giant freshwater prawn Macrobrachium rosenbergii (de
man), Asian Fisheries Science, 22(1): 61-69.
Lorenz, TR (2000) NatuRose natural astaxanthin were as a carotenoid and vitamin source for
ornamental fish and animals. Natu Rose Technical Bulletin, 54
NFRS (2018) Annual Report 2072/73 (2015/16), National Fisheries Research Station NARC,
Godawari, Lalitpur, Nepal. 12.
Rai, AK, Gurung TB, Basnet SR & Mulmi RM (2008) Present Status and prospect of Rainbow Trout
(Oncorhynchus mykiss) farming in Nepal. Rainbow trout, 5-11
Sommer, TR, Morrissy NM & Potts WT (1991) Growth and pigmentation of marron (Chera
tenuimanus) fed a reference ration supplemented with micro alga Dunaliella salina.
Aquaculture, 99: 85-295.
Tacon, AG (1981) Speculative review of possible carotenoid function in fish, The Progressive Fish-
Culturist, 43(4), 205-208
Tacon, AG (1987) The nutrition and feeding of farmed fish and shrimp a training manual: the
essential nutrients (No. 639.2085 T32). FAO
Talebi, M, Khara H, Zoriehzahra J, Ghobadi S, Khodabandelo A & Mirrasooli E (2013) Study on
effect of red bell pepper on growth, pigmentation and blood factors of rainbow trout
(Oncorhynchus mykiss). World Journal of Zoology, 8(1): 17-23.
Theis A, Salzburger W & Egger B (2012) The function of anal fin egg-spots in the cichlid fish
Astatotilapia burtoni. PLoS One, 7(1), e29878.
Torrissen, OJ (1984) Pigmentation of salmonids—effect of carotenoids in eggs and start-feeding diet
on survival and growth rate. Aquaculture, 43(1-3): 185-193.
Vernon, Carter J, Ponce Palafox JT & Pedroza Islas R (1994) Bioensayo de pigmentaci.n de trucha
arcoiris (Oncorhynchus mykiss) con extractos de chile ancho (Capsicum annum).
Archivos Latinoamericanos de Nutrición, 44: 252-255.
Yanar, M, Kumlu M, Celik M, Yanar Y & Tekelio Ûlu, N (1997) Pigmentation of rainbow trout
(Oncorhynchus mykiss) with carotenoids from red pepper, Israeli Journal of
Aquaculture Bamidgeh, 49: 193-198
Zhang, J, Liu YJ, Tian LX, Yang HJ, Liang GY, Yue YR & Xu DH (2013) Effects of dietary
astaxanthin on growth, antioxidant capacity and gene expression in Pacific white shrimp
Litopenaeus vannamei, Aquaculture Nutrition, 19(6): 917-927
Nepalese Journal of Agricultural Sciences, 2021, volume 21 ISSN 2091-042X; eISSN 2091-0428
86
Insecticide assay with rapid bioassay of pesticide
residue (RBPR) technique of vegetables in different
markets of Pokhara, Nepal
Sadikshya Poudel1
and Narendra Bahadur Singh1
1Institute of Agriculture and Animal Sciences, Lamjung Campus, Nepal
Corresponding Author: [email protected]
ABSTRACT
Consumption of vegetables with unacceptable level of
pesticide residue is of growing concern due to its potential
health hazards. In this regard, the study was conducted to
evaluate the level of carbamate and organophosphate present
in the vegetables collected from five markets of Pokhara viz,
Prithvichowk, Malepatan, Hemja, Lamachaur, and Birauta.
Total 25 vegetables were evaluated by Rapid Bioassay of
Pesticide Residues (RBPR) technique developed by Taiwan
Agricultural Research Institute (TARI) at Rapid Pesticides
Residue Analysis Laboratory of Prithvichowk, Pokhara from
November to December, 2019. For carbamate residue, out of
total samples, 92% were in green level and 8% were in yellow
level. For organophosphate residue, out of total samples, 76%
were in green level and 24% were in yellow level. Results
indicate that there might be increased risk of pesticide residue
exposure on human health, increase in use of pesticide other
than carbamate and organophosphate, and absence of RBPR
analysis has made people of the Pokhara valley to
unknowingly consume vegetables with unaccepted level of
pesticide residues.
Key words: Carbamate, organophosphate, residue analysis, vegetable
INTRODUCTION
Vegetables are herbaceous plant grown for an edible part which is usually
eaten as part of a meal that provides essential nutrients and possess medicinal
properties (Gruda, 2005). In Nepal, total vegetables are produced in an area of
297,195 ha with the productivity of 4,271,270 mt (MoALD, 2020). Enormous
potential and high demand vegetable producers are growing day by day, and
most farmers use new technology with high fertilizer and pesticides application
Nepalese Journal of Agricultural Sciences, 2021, volume 21 ISSN 2091-042X; eISSN 2091-0428
87
to optimize their output and benefit. An annual pesticide import in Nepal is
about 410mt, with insecticides of 138mt, fungicides of 164mt, weedicides of
101mt, and others of 7mt (PPD, 2017). It has been estimated that 85% pesticides
used in Nepal are applied in vegetables (PPD, 2017). The growing intensity of
vegetable farming in some pocket area is supported by the heavy use of
chemicals (fertilizers, pesticides, and hormones) in Pokhara (Adhikari, 2018).
Greater part of the ranchers is ignorant of pesticide types, level of harming,
security safety measures, and potential dangers on wellbeing and environment.
Due to lack of technical knowledge on pesticide use, farmers in the region are
harvesting vegetables within short span of time after spraying and even dip the
product in pesticide solution to give them a fresh and natural look (Dahal, 2014).
The use of these vegetables has an impact on human health, society,
environment, wildlife, water habitats, soil fauna and flora, plants, and
biodiversity.
The RBPR technique was developed by the TARI in 1985 by using particularly
purified Acetyl-cholinesterase (AChE) from the housefly head for screening
organophosphate and carbamate pesticide residues present in several vegetables
and fruits. This technique was first introduced by Entomology Division in 2012
and the technique was transferred to different officers of PPD (Entomology
Division, 2014). Analysis of pesticide residue helps to identify farmer’s
organization producing high residue risk vegetables and fruits and adopt
corrective measures to practice good agriculture practices to bring down the
pesticide residue level in their products (PPD, 2017). This research will help to
evaluate the level of carbamate and organophosphate present in the vegetables
from different markets of Pokhara.
MATERIALS AND METHODS
The experiment was conducted from November to December, 2019 in a well-
established Rapid Pesticide Residue Analysis laboratory of Pokhara. Twenty-
five different vegetable samples were collected by purposive random sampling
method from various markets of Pokhara. Cauliflower, broccoli, radish, tomato,
and broad leaf mustard were collected from the five markets viz. Malepatan,
Hemja, Birauta, Prithvichowk, and Lamachaur according to the seasonal
availability of the vegetables during the research period. Short discussion with
the farmers was also conducted to know about the pesticide use status in that
area. Vegetables were then enclosed in a polythene bag and transported within a
day. Each laboratory sample was allocated with the unique reference code for
the proper identification and handling. The prepared sample was then subjected
to laboratory analysis by Standard Operating Procedures for Rapid Bioassay of
Pesticide Residues Laboratory, PPD, Pokhara, Nepal (Dhakal, 2017).
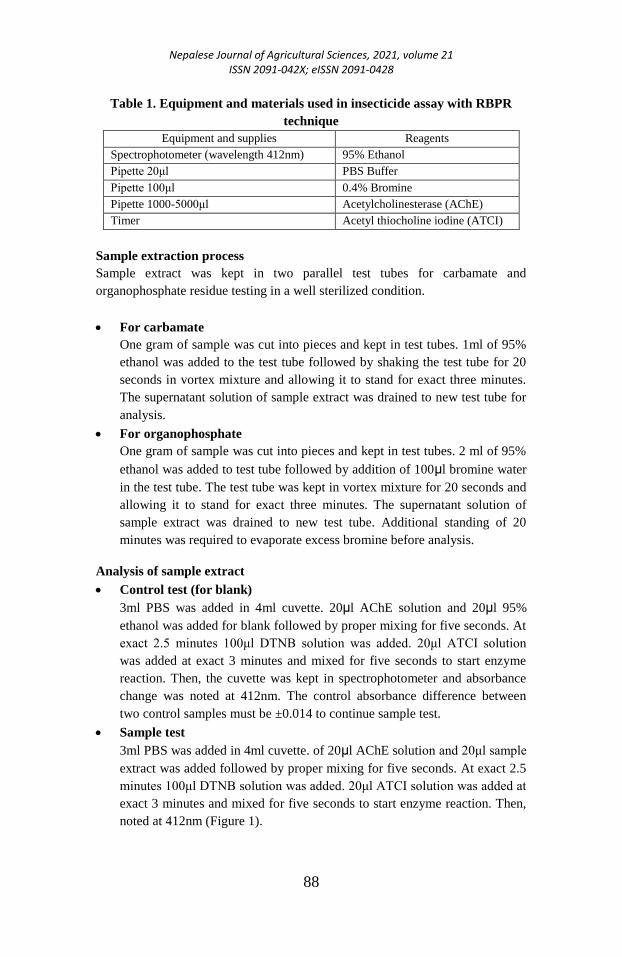
Nepalese Journal of Agricultural Sciences, 2021, volume 21 ISSN 2091-042X; eISSN 2091-0428
88
Table 1. Equipment and materials used in insecticide assay with RBPR
technique
Equipment and supplies Reagents
Spectrophotometer (wavelength 412nm) 95% Ethanol
Pipette 20μl PBS Buffer
Pipette 100μl 0.4% Bromine
Pipette 1000-5000μl Acetylcholinesterase (AChE)
Timer Acetyl thiocholine iodine (ATCI)
Sample extraction process
Sample extract was kept in two parallel test tubes for carbamate and
organophosphate residue testing in a well sterilized condition.
For carbamate
One gram of sample was cut into pieces and kept in test tubes. 1ml of 95%
ethanol was added to the test tube followed by shaking the test tube for 20
seconds in vortex mixture and allowing it to stand for exact three minutes.
The supernatant solution of sample extract was drained to new test tube for
analysis.
For organophosphate
One gram of sample was cut into pieces and kept in test tubes. 2 ml of 95%
ethanol was added to test tube followed by addition of 100μl bromine water
in the test tube. The test tube was kept in vortex mixture for 20 seconds and
allowing it to stand for exact three minutes. The supernatant solution of
sample extract was drained to new test tube. Additional standing of 20
minutes was required to evaporate excess bromine before analysis.
Analysis of sample extract
Control test (for blank)
3ml PBS was added in 4ml cuvette. 20μl AChE solution and 20μl 95%
ethanol was added for blank followed by proper mixing for five seconds. At
exact 2.5 minutes 100μl DTNB solution was added. 20μl ATCI solution
was added at exact 3 minutes and mixed for five seconds to start enzyme
reaction. Then, the cuvette was kept in spectrophotometer and absorbance
change was noted at 412nm. The control absorbance difference between
two control samples must be ±0.014 to continue sample test.
Sample test
3ml PBS was added in 4ml cuvette. of 20μl AChE solution and 20μl sample
extract was added followed by proper mixing for five seconds. At exact 2.5
minutes 100μl DTNB solution was added. 20μl ATCI solution was added at
exact 3 minutes and mixed for five seconds to start enzyme reaction. Then,
noted at 412nm (Figure 1).
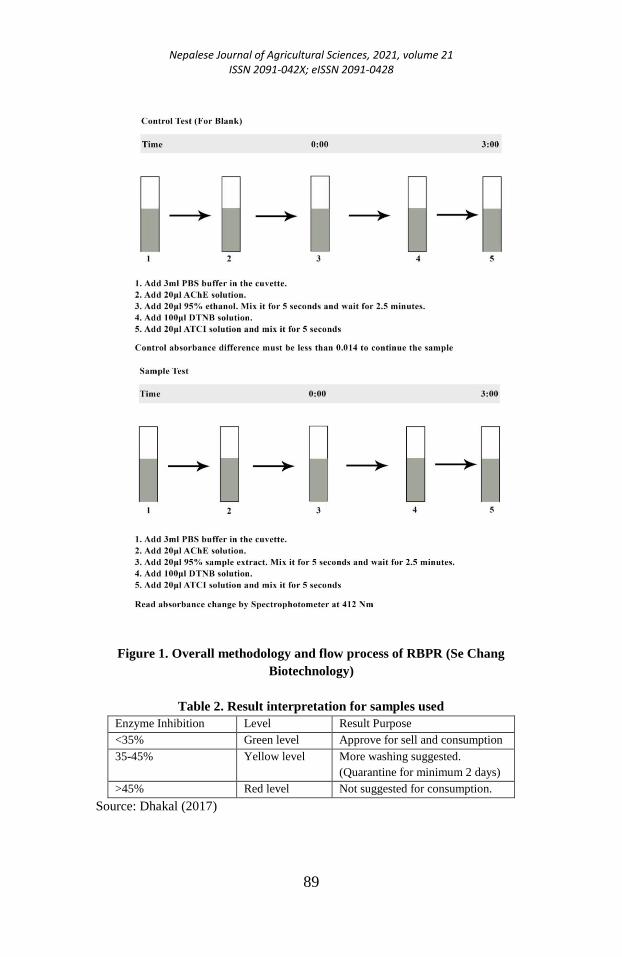
Nepalese Journal of Agricultural Sciences, 2021, volume 21 ISSN 2091-042X; eISSN 2091-0428
89
Figure 1. Overall methodology and flow process of RBPR (Se Chang
Biotechnology)
Table 2. Result interpretation for samples used
Enzyme Inhibition Level Result Purpose
<35% Green level Approve for sell and consumption
35-45% Yellow level More washing suggested.
(Quarantine for minimum 2 days)
>45% Red level Not suggested for consumption.
Source: Dhakal (2017)
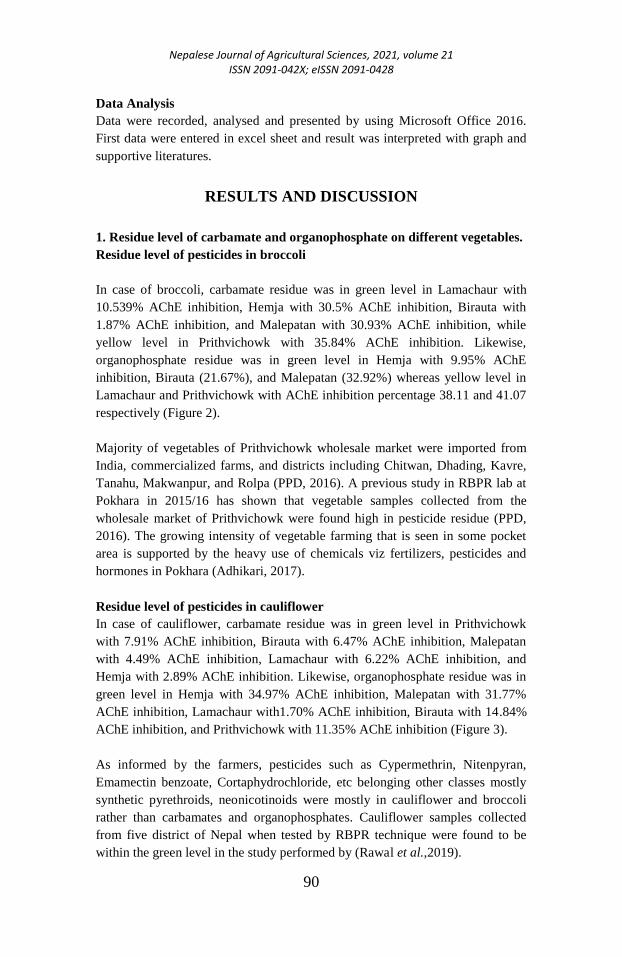
Nepalese Journal of Agricultural Sciences, 2021, volume 21 ISSN 2091-042X; eISSN 2091-0428
90
Data Analysis
Data were recorded, analysed and presented by using Microsoft Office 2016.
First data were entered in excel sheet and result was interpreted with graph and
supportive literatures.
RESULTS AND DISCUSSION
1. Residue level of carbamate and organophosphate on different vegetables.
Residue level of pesticides in broccoli
In case of broccoli, carbamate residue was in green level in Lamachaur with
10.539% AChE inhibition, Hemja with 30.5% AChE inhibition, Birauta with
1.87% AChE inhibition, and Malepatan with 30.93% AChE inhibition, while
yellow level in Prithvichowk with 35.84% AChE inhibition. Likewise,
organophosphate residue was in green level in Hemja with 9.95% AChE
inhibition, Birauta (21.67%), and Malepatan (32.92%) whereas yellow level in
Lamachaur and Prithvichowk with AChE inhibition percentage 38.11 and 41.07
respectively (Figure 2).
Majority of vegetables of Prithvichowk wholesale market were imported from
India, commercialized farms, and districts including Chitwan, Dhading, Kavre,
Tanahu, Makwanpur, and Rolpa (PPD, 2016). A previous study in RBPR lab at
Pokhara in 2015/16 has shown that vegetable samples collected from the
wholesale market of Prithvichowk were found high in pesticide residue (PPD,
2016). The growing intensity of vegetable farming that is seen in some pocket
area is supported by the heavy use of chemicals viz fertilizers, pesticides and
hormones in Pokhara (Adhikari, 2017).
Residue level of pesticides in cauliflower
In case of cauliflower, carbamate residue was in green level in Prithvichowk
with 7.91% AChE inhibition, Birauta with 6.47% AChE inhibition, Malepatan
with 4.49% AChE inhibition, Lamachaur with 6.22% AChE inhibition, and
Hemja with 2.89% AChE inhibition. Likewise, organophosphate residue was in
green level in Hemja with 34.97% AChE inhibition, Malepatan with 31.77%
AChE inhibition, Lamachaur with1.70% AChE inhibition, Birauta with 14.84%
AChE inhibition, and Prithvichowk with 11.35% AChE inhibition (Figure 3).
As informed by the farmers, pesticides such as Cypermethrin, Nitenpyran,
Emamectin benzoate, Cortaphydrochloride, etc belonging other classes mostly
synthetic pyrethroids, neonicotinoids were mostly in cauliflower and broccoli
rather than carbamates and organophosphates. Cauliflower samples collected
from five district of Nepal when tested by RBPR technique were found to be
within the green level in the study performed by (Rawal et al.,2019).
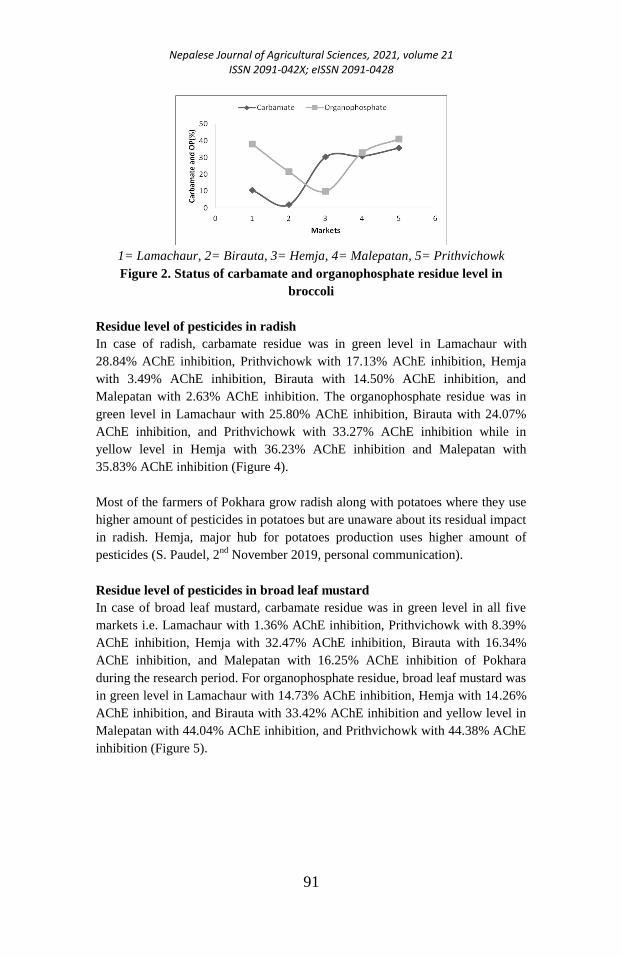
Nepalese Journal of Agricultural Sciences, 2021, volume 21 ISSN 2091-042X; eISSN 2091-0428
91
1= Lamachaur, 2= Birauta, 3= Hemja, 4= Malepatan, 5= Prithvichowk
Figure 2. Status of carbamate and organophosphate residue level in
broccoli
Residue level of pesticides in radish
In case of radish, carbamate residue was in green level in Lamachaur with
28.84% AChE inhibition, Prithvichowk with 17.13% AChE inhibition, Hemja
with 3.49% AChE inhibition, Birauta with 14.50% AChE inhibition, and
Malepatan with 2.63% AChE inhibition. The organophosphate residue was in
green level in Lamachaur with 25.80% AChE inhibition, Birauta with 24.07%
AChE inhibition, and Prithvichowk with 33.27% AChE inhibition while in
yellow level in Hemja with 36.23% AChE inhibition and Malepatan with
35.83% AChE inhibition (Figure 4).
Most of the farmers of Pokhara grow radish along with potatoes where they use
higher amount of pesticides in potatoes but are unaware about its residual impact
in radish. Hemja, major hub for potatoes production uses higher amount of
pesticides (S. Paudel, 2nd
November 2019, personal communication).
Residue level of pesticides in broad leaf mustard
In case of broad leaf mustard, carbamate residue was in green level in all five
markets i.e. Lamachaur with 1.36% AChE inhibition, Prithvichowk with 8.39%
AChE inhibition, Hemja with 32.47% AChE inhibition, Birauta with 16.34%
AChE inhibition, and Malepatan with 16.25% AChE inhibition of Pokhara
during the research period. For organophosphate residue, broad leaf mustard was
in green level in Lamachaur with 14.73% AChE inhibition, Hemja with 14.26%
AChE inhibition, and Birauta with 33.42% AChE inhibition and yellow level in
Malepatan with 44.04% AChE inhibition, and Prithvichowk with 44.38% AChE
inhibition (Figure 5).
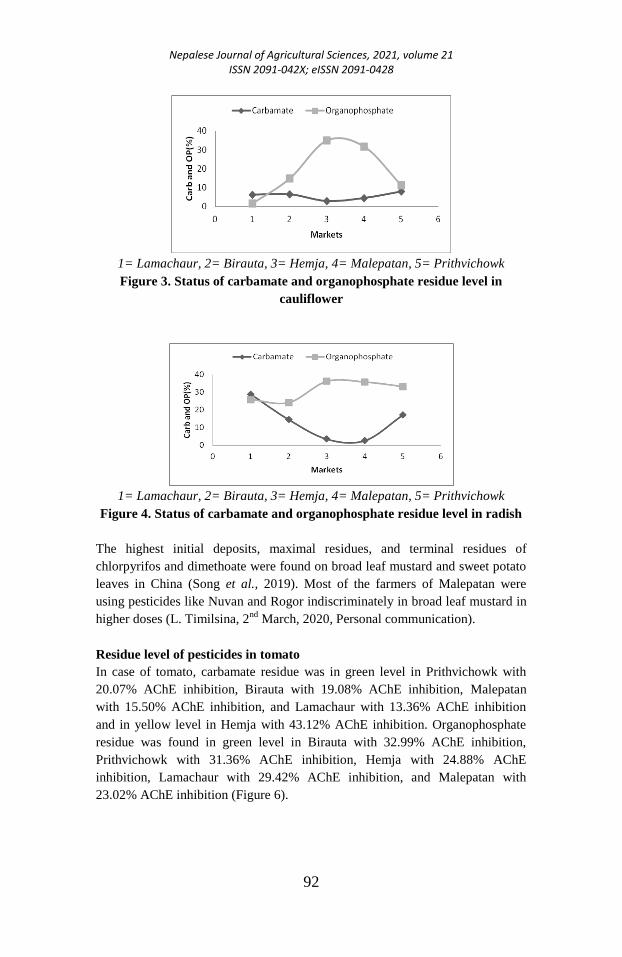
Nepalese Journal of Agricultural Sciences, 2021, volume 21 ISSN 2091-042X; eISSN 2091-0428
92
1= Lamachaur, 2= Birauta, 3= Hemja, 4= Malepatan, 5= Prithvichowk
Figure 3. Status of carbamate and organophosphate residue level in
cauliflower
1= Lamachaur, 2= Birauta, 3= Hemja, 4= Malepatan, 5= Prithvichowk
Figure 4. Status of carbamate and organophosphate residue level in radish
The highest initial deposits, maximal residues, and terminal residues of
chlorpyrifos and dimethoate were found on broad leaf mustard and sweet potato
leaves in China (Song et al., 2019). Most of the farmers of Malepatan were
using pesticides like Nuvan and Rogor indiscriminately in broad leaf mustard in
higher doses (L. Timilsina, 2nd
March, 2020, Personal communication).
Residue level of pesticides in tomato
In case of tomato, carbamate residue was in green level in Prithvichowk with
20.07% AChE inhibition, Birauta with 19.08% AChE inhibition, Malepatan
with 15.50% AChE inhibition, and Lamachaur with 13.36% AChE inhibition
and in yellow level in Hemja with 43.12% AChE inhibition. Organophosphate
residue was found in green level in Birauta with 32.99% AChE inhibition,
Prithvichowk with 31.36% AChE inhibition, Hemja with 24.88% AChE
inhibition, Lamachaur with 29.42% AChE inhibition, and Malepatan with
23.02% AChE inhibition (Figure 6).
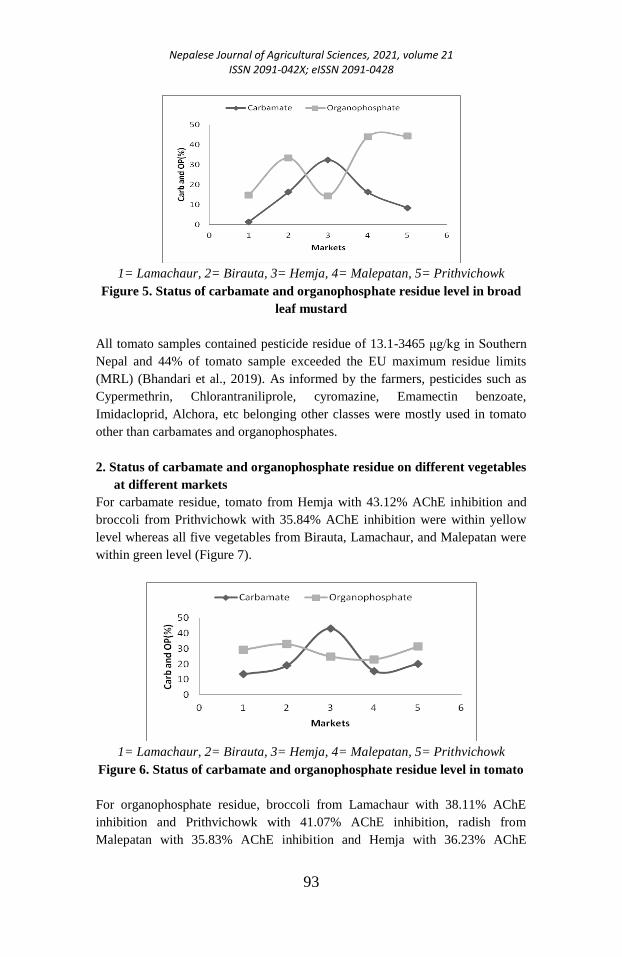
Nepalese Journal of Agricultural Sciences, 2021, volume 21 ISSN 2091-042X; eISSN 2091-0428
93
1= Lamachaur, 2= Birauta, 3= Hemja, 4= Malepatan, 5= Prithvichowk
Figure 5. Status of carbamate and organophosphate residue level in broad
leaf mustard
All tomato samples contained pesticide residue of 13.1-3465 μg/kg in Southern
Nepal and 44% of tomato sample exceeded the EU maximum residue limits
(MRL) (Bhandari et al., 2019). As informed by the farmers, pesticides such as
Cypermethrin, Chlorantraniliprole, cyromazine, Emamectin benzoate,
Imidacloprid, Alchora, etc belonging other classes were mostly used in tomato
other than carbamates and organophosphates.
2. Status of carbamate and organophosphate residue on different vegetables
at different markets
For carbamate residue, tomato from Hemja with 43.12% AChE inhibition and
broccoli from Prithvichowk with 35.84% AChE inhibition were within yellow
level whereas all five vegetables from Birauta, Lamachaur, and Malepatan were
within green level (Figure 7).
1= Lamachaur, 2= Birauta, 3= Hemja, 4= Malepatan, 5= Prithvichowk
Figure 6. Status of carbamate and organophosphate residue level in tomato
For organophosphate residue, broccoli from Lamachaur with 38.11% AChE
inhibition and Prithvichowk with 41.07% AChE inhibition, radish from
Malepatan with 35.83% AChE inhibition and Hemja with 36.23% AChE
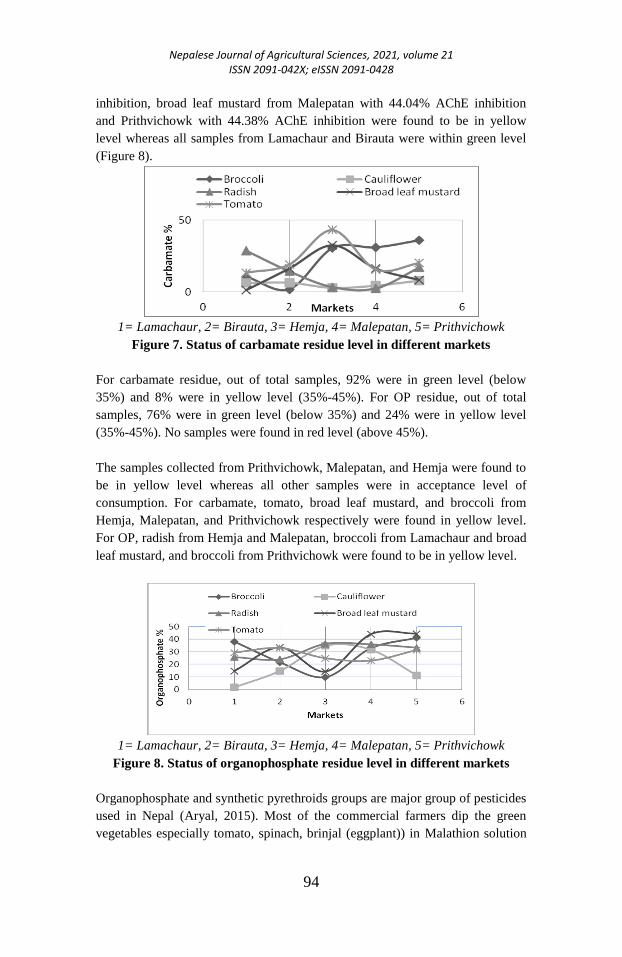
Nepalese Journal of Agricultural Sciences, 2021, volume 21 ISSN 2091-042X; eISSN 2091-0428
94
inhibition, broad leaf mustard from Malepatan with 44.04% AChE inhibition
and Prithvichowk with 44.38% AChE inhibition were found to be in yellow
level whereas all samples from Lamachaur and Birauta were within green level
(Figure 8).
1= Lamachaur, 2= Birauta, 3= Hemja, 4= Malepatan, 5= Prithvichowk
Figure 7. Status of carbamate residue level in different markets
For carbamate residue, out of total samples, 92% were in green level (below
35%) and 8% were in yellow level (35%-45%). For OP residue, out of total
samples, 76% were in green level (below 35%) and 24% were in yellow level
(35%-45%). No samples were found in red level (above 45%).
The samples collected from Prithvichowk, Malepatan, and Hemja were found to
be in yellow level whereas all other samples were in acceptance level of
consumption. For carbamate, tomato, broad leaf mustard, and broccoli from
Hemja, Malepatan, and Prithvichowk respectively were found in yellow level.
For OP, radish from Hemja and Malepatan, broccoli from Lamachaur and broad
leaf mustard, and broccoli from Prithvichowk were found to be in yellow level.
1= Lamachaur, 2= Birauta, 3= Hemja, 4= Malepatan, 5= Prithvichowk
Figure 8. Status of organophosphate residue level in different markets
Organophosphate and synthetic pyrethroids groups are major group of pesticides
used in Nepal (Aryal, 2015). Most of the commercial farmers dip the green
vegetables especially tomato, spinach, brinjal (eggplant)) in Malathion solution

Nepalese Journal of Agricultural Sciences, 2021, volume 21 ISSN 2091-042X; eISSN 2091-0428
95
before taking the product to market to maintain the fresh look and shine on
vegetables (Sharma, 2019).
Around 80.0% of the vegetable growers in Kaski district were using pesticides
for more than ten years. All the vegetable growers were using highly hazardous
(Ib) pesticides. Almost 80.0% of the vegetable growers spray pesticides more
than six times a year. Less than half (44.3%) of the vegetable growers know the
adverse effect of pesticides. Waiting period for picking vegetable is less than
four days for nearly two-third (61.9%) of the vegetable growers (Bhrtyal et al.,
2016).
CONCLUSION
The study helped in understanding the working procedure and implication of
RBPR which is beneficial for researchers, students, and farmers. It showed that
the pesticide residue was high in the market of Malepatan, Hemja, and
Prithvichowk which are the major market hub for vegetables in Pokhara valley.
Indiscriminate and injudicious use of pesticide and presence of pesticide residue
in vegetables is a matter of great concern. With increasing use of pesticides,
farmers are using pesticides belonging to other classes than carbamate and
organophosphate. Owing to this fact, various methods for detecting different
pesticide residues should be bought in action. Results indicate the need of
awareness of the farmers regarding proper pesticide use, storage, and waiting
periods and provide testing laboratories with adequate infrastructure and human
resources capability. This study paves the way to future research that might
apply similar methodological approach to a larger sample in different parts of
our country.
ACKNOWLEDGEMENT
Authors owe their gratitude to former Senior Plant Protection Officer Dhan
Bahadur Rana and all other helping hands from Plant Protection Directorate,
Pokhara for their support and for providing with the resources necessary for our
research. Authors would like to thank Institute of Agriculture and Animal
Science, Lamjung campus for their administrative support. Profound sense of
gratitude goes to Assistant Prof. Ganesh Rawal and Senior Scientist Sunil Aryal,
Entomology Division, NARC for providing constructive comments during the
presentation of the report and his support.
REFERENCES Adhikari, P. (2018) An Overview on Pesticide Management in Nepal, The Journal of Agriculture
and Environment, 18(3): 95-105.
Adhikari, J. (2017) Organic Farming and its Prospects in Peri-urban Area of Pokhara, Nepal, Journal
of Forest and Livelihood, 15(2): 13-31.
Dhakal, A.P. (2017) Standard Operating Procedure on Rapid Bioassay of Pesticide Residue Analysis
Laboratory, Plant Protection Directorate, Lalitpur, Nepal, [Online], Available:
https://centralaglab.gov.np/public/uploads/Pdffile/SOP of RBPR Labs-75073-39254.pdf
[Retrieved Nov 15th, 2019]
Nepalese Journal of Agricultural Sciences, 2021, volume 21 ISSN 2091-042X; eISSN 2091-0428
96
Aryal, S. (2014) Review on the pesticide residue works in Nepal. National Symposium on Pesticide
Pollution:
https://www.researchgate.net/publication/306018451_Review_on_the_pesticide_residue_
works_in_Nepal [Accessed 2 Jan, 2020]
Bhandar, G, P Zomer, K Atreya, HGJ Mol, X Yang and Geissen, V. (2019) Pesticide residues in
Nepalese vegetables and potential health risks, Environmental Research. [Online],
Available: http://dx.doi.org/10.1016/j.envres.2019.03.002 [Retrieved Nov 15th, 2019].
Bhurtyal, Y.B,, Kanbargi, R., Umasankhar, S and Dhungana, S. (2017) Knowledge, practice and use
of pesticides among commercial vegetable growers of Kaski district, Nepal, International
Journal of Science Technology and Engineering. 3(3).
Dahal, N. (2014) Health Risk of pesticide residue in Vegetable and Constructive Efforts from
Government of Nepal. International Journal of Science Technology and Engineering,
URL: https://issuu.com/navindahal/docs/risk_of_pesticide_in_human_health_f [Accessed
2 Jan, 2020].
Dhakal, A.P. (2017). Standard Operating Procedure on Rapid Bioassay of Pesticide Residue
Analysis Laboratory, Plant Protection Directoriate, Lalitpur, Nepal, URL:
http://centralaglab.gov.np/public/uploads/Pdffile/SOP%20of%20RBPR%20Labs-
75073.pdf [Accessed 25 Nov,2019].
Gruda, N. (2005) Impact of Environmental Factors on Quality of Greenhouse Vegetables for Fresh
Consumption, Critical review on Plant Science. 25(3): 247.
MoALD, (2020) Statistical Information on Nepalese Agriculture 2016/17, Singha Durbar,
Kathmandu Nepal: Ministry of Agriculture and Development, Agri-Business Promotion
and Statistics Division. URL: https://nepalindata.com/resource/statistical-information-
nepalese-agriculture-207374-201617/ [Accessed 10 May, 2020].
PPD, (2017) Annual Report, Harihar Bhawan, Lalitpur, Nepal
Rajbhandari, R.D. (2016) Analysis of Carbamate and OP, PPD, Birauta, Pokhara, Nepal
Rapid bioassay for pesticide residue (RBPR) Reagent Kit, (n.d.) Taiwan Si ChengBiotechnology Co.
Ltd. Taiwan,Access [Brochure]
Rawal, G., Kafle, K and Sapkota, R. (2019) Rapid Bioassay for Pesticide Residue (RBPR) Analysis
of Vegetables in Different Districts of Nepal, Agricultura, 111: 3-4.
Sharma, D.R. (2019) Status of Chemical pesticides use and their regulation in Nepal, Plant
Quarantine and Pesticide Management Centre, URL:
http://www.npponepal.gov.np/uploads/files/Status%20of%20Chemical%20Pesticides%2
0and%20their%20use-%20Dr%20Dilli%20Ram%20Sharma.pdf [Accessed 2 Jan, 2020].
Song S, H Huang, Z Chen, C Wei J. Deng, H Tan and X Li, ( 2019) Representative commodity for
six leafy vegetables based on the determination of six pesticide residues by gas
chromatography, AK Journals. 31(1)
Nepalese Journal of Agricultural Sciences, 2021, volume 21 ISSN 2091-042X; eISSN 2091-0428
97
Dynamics of organic N in an alluvial soil with the
application of Ammonium sulphate and assimilation
of N at different parts of maize plant
Shree Prasad Vista1, Nishan Bista
2 and Dipankar Saha
3
1National Soil Science Research Centre, NARC, Nepal
2Faculty of Agriculture and Plantation Mgmt, Wayamba University, Sri Lanka
3Department of Agricultural Chemistry and Soil Science, BCKV, India
Corresponding Author: [email protected]
ABSTRACT
Availability of nitrogen in plants depends upon the availability
of inorganic form of nitrogen in soil. Again, uptake of N by
different parts of a growing plant in a particular time is not
only controlled by the plant type itself but also by the
microenvironment of rhizosphere, which influences different
N- transformation processes in soil. The present investigation
was, therefore, conducted to make a relationship of changes in
different forms of organic N in an alluvial soil. Three levels of
nitrogen were given equally to different situation i.e., cropping
and without cropping situations. Results revealed that
irrespective of cropping and N-addition, in general, the
amount of organic forms of N decreased with increase in the
period of investigation. Furthermore, in general, the amount
of different forms including hydrolysable NH4+ and amino
acid- N were maintained in higher amount in cropped over the
uncropped system suggesting that presence of plant influences
the micro-environment of rhizospheric soil. The congenial
atmosphere created in rhizospheric soil in presence of maize
leads to the release of higher amount of hydrolysable organic
N in cropped situation. As the organic and inorganic forms of
N in soil are inter-convertible within themselves, the
utilization of inorganic N by maize crop is replenished by
different fractions of organic N released through
mineralization. Assimilation of N in maize plant is more in
vegetative parts than the root portion.
Key words: Alluvial soil, Nitrogen assimilation, organic nitrogen
Nepalese Journal of Agricultural Sciences, 2021, volume 21 ISSN 2091-042X; eISSN 2091-0428
98
INTRODUCTION
Nitrogen is one of the major nutrients required by plants for growth and
metabolic activities, mostly taken up by plants. The efficient utilization of N
from native or applied sources depends on the clear understanding of N-
transformation processes in soil. Nitrogen transformation processes may
progress simultaneously and they interact in several ways in soil. The role of
organic form of N and the time for making itself available to plants is another
factor that determines the growth of particular crop. It is therefore, necessary to
understand all the processes involved in totality to get a clear picture of N-
transformation in soil. Presence of plant changes the microenvironment in the
soil. When the plants are growing, during respiration the roots are excreting
exudates which are beneficial for microbial growth and their activities. With the
age of crop, the uptake of nitrogen from the soil increases up to reproductive
phase and then shows a decreasing trend. The present investigation was,
therefore, conducted to study the transformation of different fractions of organic
N in alluvial soil and assimilation of nitrogen at different parts at different
growth stages of maize crop. This study was carried out in presence and absence
of N in alluvial soil of West Bengal, India to make a relationship between the
release pattern of different fractions of N from the soil and uptake of N by
different parts at different growth stages of maize crop.
MATERIALS AND METHODS
The present investigation was conducted to study the effect of cropping and
application of ammonium sulphate on changes in different fractions of organic
N in soil cropped with maize plant. Assimilation of nitrogen at different parts at
different stages of crop growth was also monitored to make a relationship
between the pattern of release of different forms of N in soil and its uptake by
different portions of plant at different growth stages. The soil (0-15cm depth)
used in the present investigation was composite sample of cultivated field
collected from the experimental farm of Bidhan Chandra Krishi Viswavidyalaya
at Chakdah, Nadia, West Bengal, India. Some of the relevant physical and
chemical characteristics of the soil are presented in Table 1. The collected soil
was air dried and passed through 5mm sieve. Green house experiment was
conducted with 2 kg air-dried soil. Two seeds of maize (var. A-de Cuba) were
sown in each pot. Phosphorus and potassium were applied at 50kg P2O5 and
50kg K2O ha-1
in the form of single super phosphate and murate of potash
respectively to each pot as basal application. Altogether two sets were
maintained for cropped and uncropped situation. For the soil three doses of
inorganic N were applied viz., zero doses, 70 mg N kg-1
and 100 mg N kg-1
as
basal application through ammonium sulphate. Destructive sampling procedure
was followed for collection of soil and plant sample on the 0th
, 30th
, 60th
, and
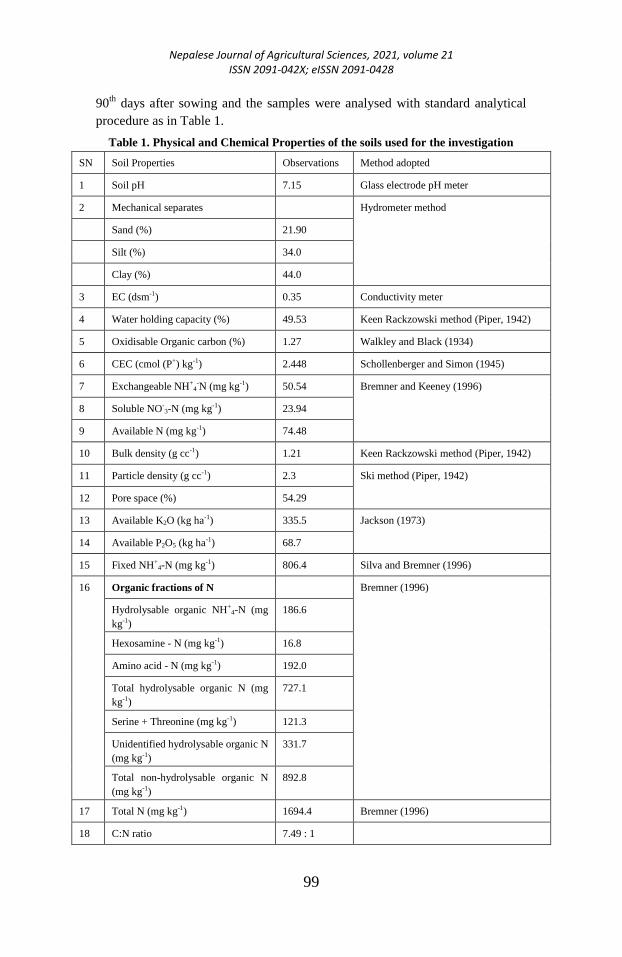
Nepalese Journal of Agricultural Sciences, 2021, volume 21 ISSN 2091-042X; eISSN 2091-0428
99
90th
days after sowing and the samples were analysed with standard analytical
procedure as in Table 1.
Table 1. Physical and Chemical Properties of the soils used for the investigation
SN Soil Properties Observations Method adopted
1 Soil pH 7.15 Glass electrode pH meter
2 Mechanical separates Hydrometer method
Sand (%) 21.90
Silt (%) 34.0
Clay (%) 44.0
3 EC (dsm-1) 0.35 Conductivity meter
4 Water holding capacity (%) 49.53 Keen Rackzowski method (Piper, 1942)
5 Oxidisable Organic carbon (%) 1.27 Walkley and Black (1934)
6 CEC (cmol (P+) kg-1) 2.448 Schollenberger and Simon (1945)
7 Exchangeable NH+4
-N (mg kg-1) 50.54 Bremner and Keeney (1996)
8 Soluble NO-3-N (mg kg-1) 23.94
9 Available N (mg kg-1) 74.48
10 Bulk density (g cc-1) 1.21 Keen Rackzowski method (Piper, 1942)
11 Particle density (g cc-1) 2.3 Ski method (Piper, 1942)
12 Pore space (%) 54.29
13 Available K2O (kg ha-1) 335.5 Jackson (1973)
14 Available P2O5 (kg ha-1) 68.7
15 Fixed NH+4-N (mg kg-1) 806.4 Silva and Bremner (1996)
16
Organic fractions of N Bremner (1996)
Hydrolysable organic NH+4-N (mg
kg-1)
186.6
Hexosamine - N (mg kg-1) 16.8
Amino acid - N (mg kg-1) 192.0
Total hydrolysable organic N (mg
kg-1)
727.1
Serine + Threonine (mg kg-1) 121.3
Unidentified hydrolysable organic N
(mg kg-1)
331.7
Total non-hydrolysable organic N
(mg kg-1)
892.8
17 Total N (mg kg-1) 1694.4 Bremner (1996)
18 C:N ratio 7.49 : 1
Nepalese Journal of Agricultural Sciences, 2021, volume 21 ISSN 2091-042X; eISSN 2091-0428
100
Similarly, another set was maintained for all the uncropped soils. All the
treatments were replicated three times. Deionized water was added to each pot
on every alternate day by estimating the difference in weight of the moisture of
soil in each pot. The crop was raised with best possible management practices.
Organic N in soil was estimated after extracting inorganic N from the soil with
2M KCl. The data obtained at each growth stage as per treatment were analysed
statistically for analysis of variance as well as critical difference were calculated
at 5% level of probability to test the significance of means for the treatment
difference.
RESULTS AND DISCUSSION
The results of the effect of cropping on changes in the amount of different forms
of organic N in an alluvial soil as well as N-uptake by different parts of maize
plant at different growth stages are presented in Tables 2 to 9 and Figure 1.
Changes in the amount of total hydrolysable organic N in soil due to cropping of
maize and N fertilization are presented in Figure 1. Results reveal that
irrespective of N-fertilization, the amount of total hydrolysable organic N
decreased in uncropped but increased in cropped soil up to 30 day of the
investigation. Again, in absence of crop, the amount of total hydrolysable
organic N found to increase with increase in time up to last stage of the
experiment. This is true both for untreated and N-treated systems. On the other
hand, in presence of maize crop, the amount tended to decrease on 60th
but
thereafter showed an increasing trend up to the last stage of the investigation.
This trend of results is found both in presence and absence of N-fertilizer. The
decrease in the amount of total hydrolysable organic N on 30th
day in the
uncropped soil particularly treated with N-fertilizer is perhaps due to conversion
of organic to inorganic N through mineralization process (Saha, 1997). The
increase in total hydrolysable organic N with time is the result of presence of
higher number of microorganisms whose cell walls are proteinaceous in nature
(Frankenberger and Arshad, 1995). More or less similar type of results was
observed in soils cropped with maize. Introduction of crop as a factor changed
the release and fixation pattern of soil N by microorganisms. Results in Table 2
reveal that hydrolysable NH+
4-N increased at the last stage of the experiment.
This is found irrespective of cropping and N-fertilization. In presence of crop, a
continuously increasing trend of results in the amount of hydrolysable NH+
4-N
was observed in both the untreated and N-treated systems. With time, the rate of
growth of roots of maize plants increased and as a result of which proliferation
as well as activities of microorganisms in rhizosphere soil increased which in
turn keeps the hydrolysable organic N in NH+
4 form in higher order throughout
the experimentation period.
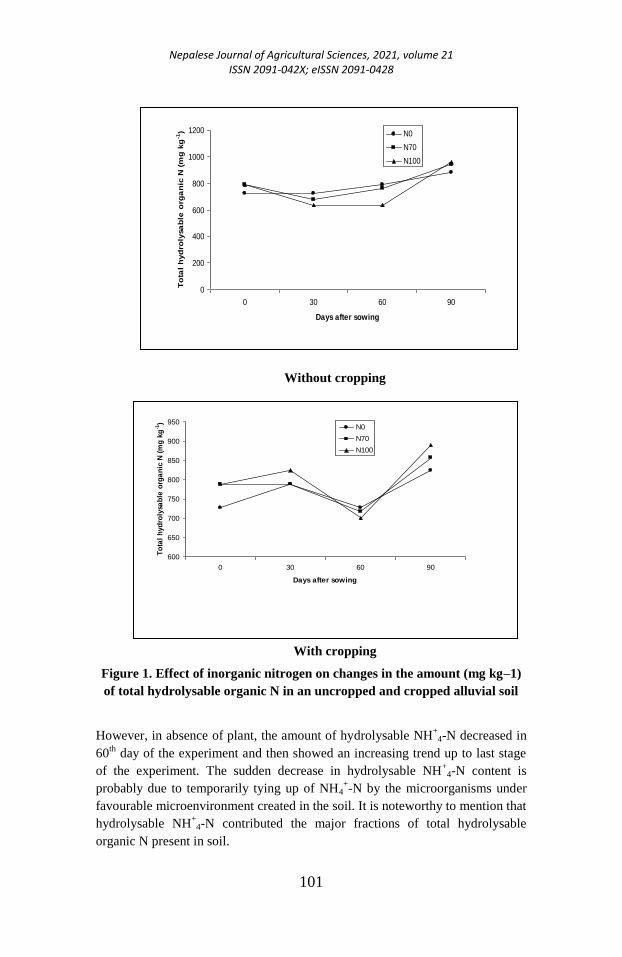
Nepalese Journal of Agricultural Sciences, 2021, volume 21 ISSN 2091-042X; eISSN 2091-0428
101
Without cropping
With cropping
Figure 1. Effect of inorganic nitrogen on changes in the amount (mg kg–1)
of total hydrolysable organic N in an uncropped and cropped alluvial soil
However, in absence of plant, the amount of hydrolysable NH+
4-N decreased in
60th
day of the experiment and then showed an increasing trend up to last stage
of the experiment. The sudden decrease in hydrolysable NH+
4-N content is
probably due to temporarily tying up of NH4+-N by the microorganisms under
favourable microenvironment created in the soil. It is noteworthy to mention that
hydrolysable NH+
4-N contributed the major fractions of total hydrolysable
organic N present in soil.
0
200
400
600
800
1000
1200
0 30 60 90
Days after sowing
To
tal
hyd
roly
sa
ble
org
an
ic N
(m
g k
g-1
) N0
N70
N100
600
650
700
750
800
850
900
950
0 30 60 90
Days after sowing
To
tal
hyd
roly
sab
le o
rga
nic
N (
mg
kg
-1)
N0
N70
N100
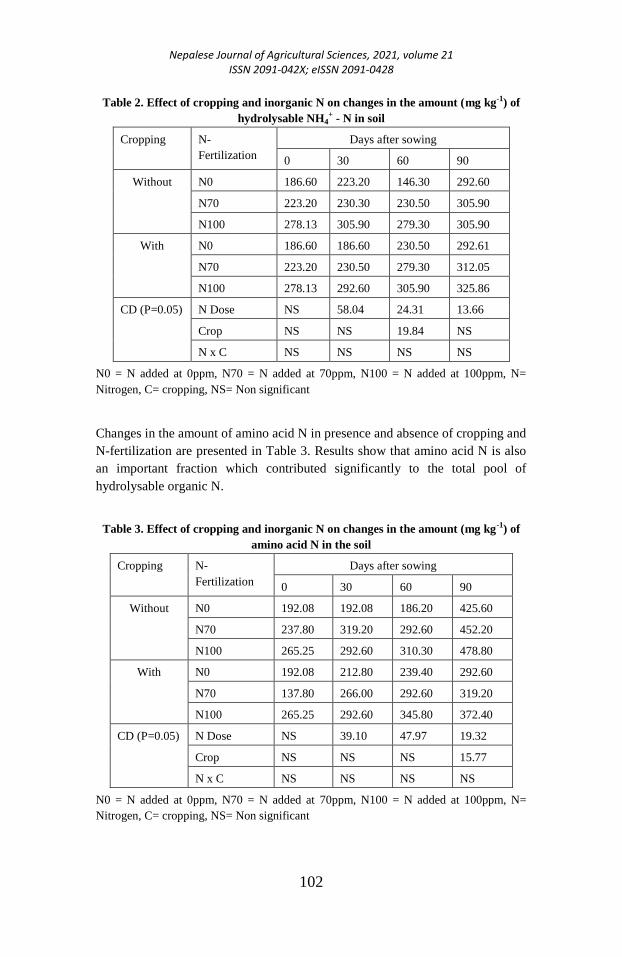
Nepalese Journal of Agricultural Sciences, 2021, volume 21 ISSN 2091-042X; eISSN 2091-0428
102
Table 2. Effect of cropping and inorganic N on changes in the amount (mg kg-1) of
hydrolysable NH4+ - N in soil
Cropping N-
Fertilization
Days after sowing
0 30 60 90
Without N0 186.60 223.20 146.30 292.60
N70 223.20 230.30 230.50 305.90
N100 278.13 305.90 279.30 305.90
With N0 186.60 186.60 230.50 292.61
N70 223.20 230.50 279.30 312.05
N100 278.13 292.60 305.90 325.86
CD (P=0.05) N Dose NS 58.04 24.31 13.66
Crop NS NS 19.84 NS
N x C NS NS NS NS
N0 = N added at 0ppm, N70 = N added at 70ppm, N100 = N added at 100ppm, N=
Nitrogen, C= cropping, NS= Non significant
Changes in the amount of amino acid N in presence and absence of cropping and
N-fertilization are presented in Table 3. Results show that amino acid N is also
an important fraction which contributed significantly to the total pool of
hydrolysable organic N.
Table 3. Effect of cropping and inorganic N on changes in the amount (mg kg-1) of
amino acid N in the soil
Cropping N-
Fertilization
Days after sowing
0 30 60 90
Without N0 192.08 192.08 186.20 425.60
N70 237.80 319.20 292.60 452.20
N100 265.25 292.60 310.30 478.80
With N0 192.08 212.80 239.40 292.60
N70 137.80 266.00 292.60 319.20
N100 265.25 292.60 345.80 372.40
CD (P=0.05) N Dose NS 39.10 47.97 19.32
Crop NS NS NS 15.77
N x C NS NS NS NS
N0 = N added at 0ppm, N70 = N added at 70ppm, N100 = N added at 100ppm, N=
Nitrogen, C= cropping, NS= Non significant
Nepalese Journal of Agricultural Sciences, 2021, volume 21 ISSN 2091-042X; eISSN 2091-0428
103
The amount of amino acid N is of lower order in comparison to hydrolysable
organic N. Data in Table 3 showed more of less similar trend of results as was
found for hydrolysable NH+
4-N. The explanation furnished earlier to interpret
the results of hydrolysable NH+
4-N is equally applicable for amino acid fraction
of total hydrolysable organic N. Irrespective of cropping, the amount of amino
acid N increased with the increase in dose of added inorganic N over the
untreated system, certainly a portion of the added inorganic N has been
converted to amino acid N fraction. However, the conversion of amino acid to
other forms of inorganic or organic N can only be evidenced through N15 tracer
study.
Perusal of the data in Table 4 reveals that irrespective of N - addition, the
amount of hexosamine N increased up to 60 day and then showed a decreasing
trend up to the last stage of the experiment in uncropped situation. However, in
cropped soil, the amount of hexosamine increased up to 30 day then showed a
decreasing trend up to 60 day and again increased at the last stage of the
investigation. N-addition increased the hexosamine N content in soil. It may be
noted again that with increase in dose of N - addition, the amount of hexosamine
N increased.
Table 4. Effect of cropping and inorganic N on changes in the amount (mg kg-1) of
hexosamine N in the soil
Cropping N-
Fertilization
Days after sowing
0 30 60 90
Without N0 14.77 16.70 26.62 18.26
N70 16.90 26.62 29.18 20.82
N100 20.86 26.86 29.18 20.82
With N0 14.77 16.70 14.83 18.26
N70 16.80 21.86 16.60 20.28
N100 20.86 35.95 20.82 24.86
CD (P=0.05) N Dose 3.71 3.70 NS 2.71
Crop NS NS 2.98 NS
N x C NS 5.24 NS NS
N0 = N added at 0ppm, N70 = N added at 70ppm, N100 = N added at 100ppm, N=
Nitrogen, C= cropping, NS= Non significant
This trend of results is observed both in uncropped and cropped situation over
the whole period of investigation. Data in Table 4 further reveal that in general,
irrespective of N - addition and stages of sampling, the amount of hexosamine N
is of lower order in cropped over the uncropped system. Perhaps the plant has
consumed little amount of hexosamine - N from the soil. The present result is in
Nepalese Journal of Agricultural Sciences, 2021, volume 21 ISSN 2091-042X; eISSN 2091-0428
104
agreement of earlier finding of Pal et al., 1987. Critical analysis of the data
reveal that irrespective of N addition, the amount of hexosamine N in soil is
more in the last stage of experiment in cropped over the uncropped system. This
is perhaps due to production of roots at the last growth stage of crop of the
experiment which leads to associate higher number of microorganisms. The
microorganisms may consume nitrogen and N is present in amino sugar form in
the cell wall of those microorganisms (Arshad and Frankenberger, 1998) show a
net effect of increase in hexosamine N in cropped over the uncropped system.
Changes in (serine + threonine) - N in soil in presence and absence of crop and
inorganic N are presented in Table 5.
Table 5. Effect of cropping and inorganic N on changes in the amount (mg kg-1) of
serine + threonine-N in the soil
Cropping N-
Fertilization
Days after sowing
0 30 60 90
Without N0 167.10 128.56 128.56 133.00
N70 125.16 106.40 125.16 179.55
N100 121.30 106.40 131.21 152.95
With N0 167.10 159.60 197.70 152.95
N70 125.16 146.30 128.56 199.50
N100 121.30 195.10 195.10 199.50
CD (P=0.05) N Dose 16.22 NS 29.40 10.03
Crop NS 18.32 24.00 8.18
N x C NS 31.73 NS 14.18
N0 = N added at 0ppm, N70 = N added at 70ppm, N100 = N added at 100ppm, N=
Nitrogen, C= cropping, NS= Non significant
Although (serine + threonine) - N is a part of amino acid - N but the data did not
show the similar trend of results as was found for amino acid - N. However, it
may be mentioned here that irrespective of stages of sampling and N-addition,
the amount of (serine + threonine) - N is more in cropped over the uncropped
system. Roots of maize plant is responsible for accumulation of higher amount
of (serine + threonine) - N in cropped soil. The higher order of activities of
microorganisms under cropped situation (Saha et al., 1982) perhaps causes
higher order of release of (serine + threonine) - N from the amino acid - N
fraction in soil. No definite trend of result of (serine + threonine) - N was,
however, found due to addition of different doses of inorganic N to soil.
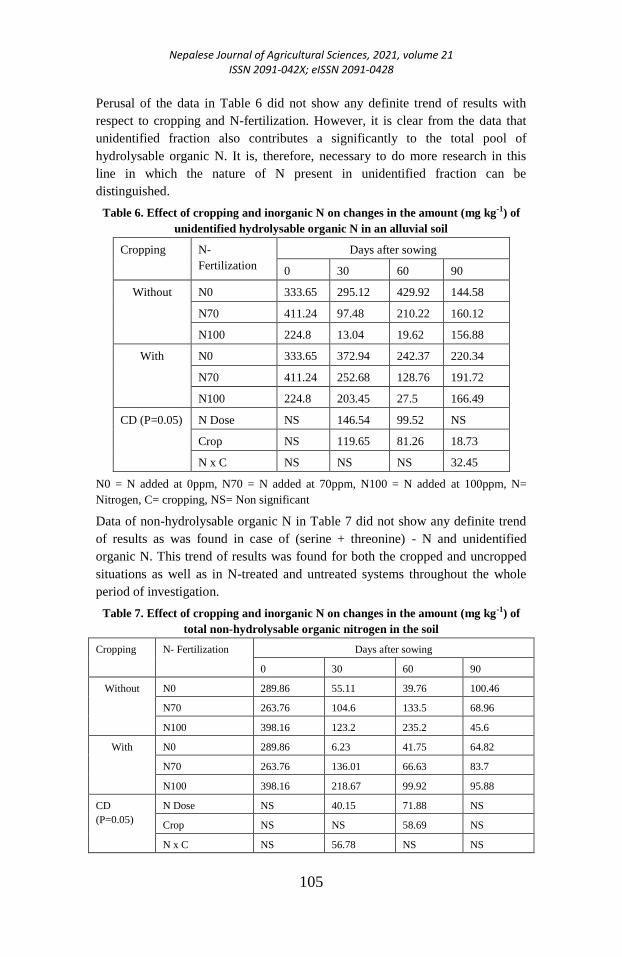
Nepalese Journal of Agricultural Sciences, 2021, volume 21 ISSN 2091-042X; eISSN 2091-0428
105
Perusal of the data in Table 6 did not show any definite trend of results with
respect to cropping and N-fertilization. However, it is clear from the data that
unidentified fraction also contributes a significantly to the total pool of
hydrolysable organic N. It is, therefore, necessary to do more research in this
line in which the nature of N present in unidentified fraction can be
distinguished.
Table 6. Effect of cropping and inorganic N on changes in the amount (mg kg-1) of
unidentified hydrolysable organic N in an alluvial soil
Cropping N-
Fertilization
Days after sowing
0 30 60 90
Without N0 333.65 295.12 429.92 144.58
N70 411.24 97.48 210.22 160.12
N100 224.8 13.04 19.62 156.88
With N0 333.65 372.94 242.37 220.34
N70 411.24 252.68 128.76 191.72
N100 224.8 203.45 27.5 166.49
CD (P=0.05) N Dose NS 146.54 99.52 NS
Crop NS 119.65 81.26 18.73
N x C NS NS NS 32.45
N0 = N added at 0ppm, N70 = N added at 70ppm, N100 = N added at 100ppm, N=
Nitrogen, C= cropping, NS= Non significant
Data of non-hydrolysable organic N in Table 7 did not show any definite trend
of results as was found in case of (serine + threonine) - N and unidentified
organic N. This trend of results was found for both the cropped and uncropped
situations as well as in N-treated and untreated systems throughout the whole
period of investigation.
Table 7. Effect of cropping and inorganic N on changes in the amount (mg kg-1) of
total non-hydrolysable organic nitrogen in the soil
Cropping N- Fertilization Days after sowing
0 30 60 90
Without N0 289.86 55.11 39.76 100.46
N70 263.76 104.6 133.5 68.96
N100 398.16 123.2 235.2 45.6
With N0 289.86 6.23 41.75 64.82
N70 263.76 136.01 66.63 83.7
N100 398.16 218.67 99.92 95.88
CD
(P=0.05)
N Dose NS 40.15 71.88 NS
Crop NS NS 58.69 NS
N x C NS 56.78 NS NS
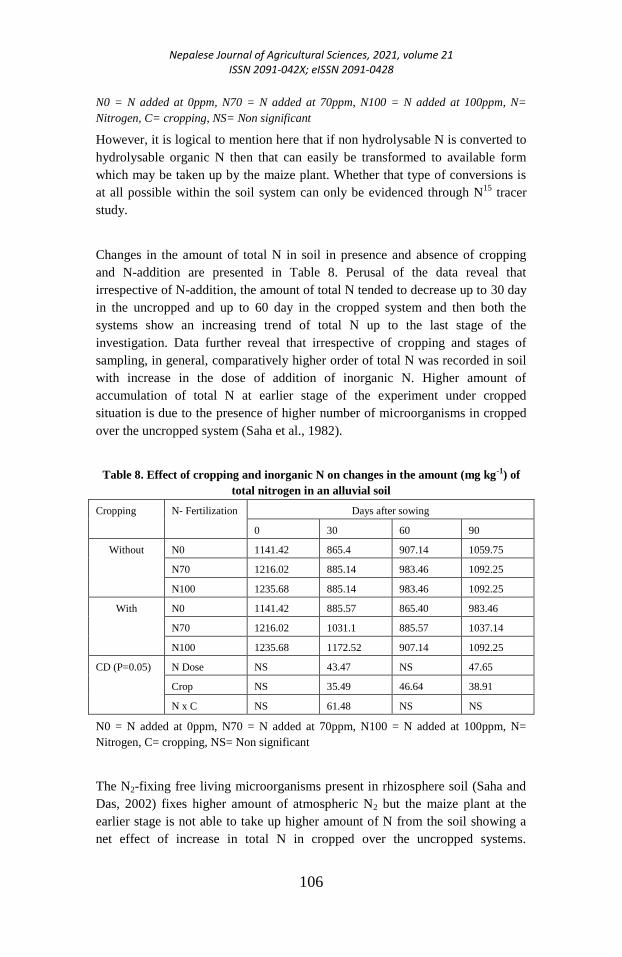
Nepalese Journal of Agricultural Sciences, 2021, volume 21 ISSN 2091-042X; eISSN 2091-0428
106
N0 = N added at 0ppm, N70 = N added at 70ppm, N100 = N added at 100ppm, N=
Nitrogen, C= cropping, NS= Non significant
However, it is logical to mention here that if non hydrolysable N is converted to
hydrolysable organic N then that can easily be transformed to available form
which may be taken up by the maize plant. Whether that type of conversions is
at all possible within the soil system can only be evidenced through N15
tracer
study.
Changes in the amount of total N in soil in presence and absence of cropping
and N-addition are presented in Table 8. Perusal of the data reveal that
irrespective of N-addition, the amount of total N tended to decrease up to 30 day
in the uncropped and up to 60 day in the cropped system and then both the
systems show an increasing trend of total N up to the last stage of the
investigation. Data further reveal that irrespective of cropping and stages of
sampling, in general, comparatively higher order of total N was recorded in soil
with increase in the dose of addition of inorganic N. Higher amount of
accumulation of total N at earlier stage of the experiment under cropped
situation is due to the presence of higher number of microorganisms in cropped
over the uncropped system (Saha et al., 1982).
Table 8. Effect of cropping and inorganic N on changes in the amount (mg kg-1) of
total nitrogen in an alluvial soil
Cropping N- Fertilization Days after sowing
0 30 60 90
Without N0 1141.42 865.4 907.14 1059.75
N70 1216.02 885.14 983.46 1092.25
N100 1235.68 885.14 983.46 1092.25
With N0 1141.42 885.57 865.40 983.46
N70 1216.02 1031.1 885.57 1037.14
N100 1235.68 1172.52 907.14 1092.25
CD (P=0.05) N Dose NS 43.47 NS 47.65
Crop NS 35.49 46.64 38.91
N x C NS 61.48 NS NS
N0 = N added at 0ppm, N70 = N added at 70ppm, N100 = N added at 100ppm, N=
Nitrogen, C= cropping, NS= Non significant
The N2-fixing free living microorganisms present in rhizosphere soil (Saha and
Das, 2002) fixes higher amount of atmospheric N2 but the maize plant at the
earlier stage is not able to take up higher amount of N from the soil showing a
net effect of increase in total N in cropped over the uncropped systems.
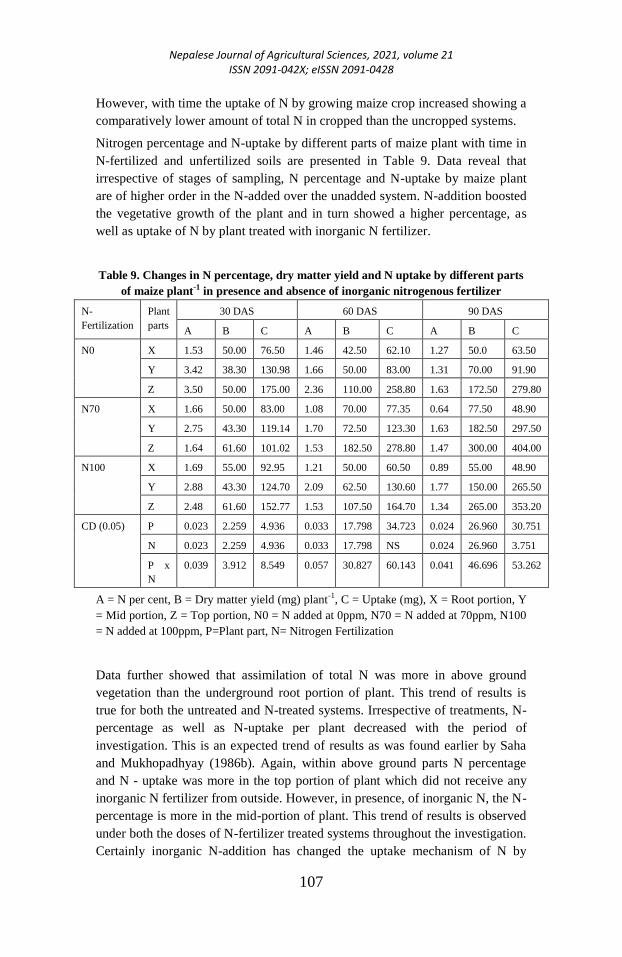
Nepalese Journal of Agricultural Sciences, 2021, volume 21 ISSN 2091-042X; eISSN 2091-0428
107
However, with time the uptake of N by growing maize crop increased showing a
comparatively lower amount of total N in cropped than the uncropped systems.
Nitrogen percentage and N-uptake by different parts of maize plant with time in
N-fertilized and unfertilized soils are presented in Table 9. Data reveal that
irrespective of stages of sampling, N percentage and N-uptake by maize plant
are of higher order in the N-added over the unadded system. N-addition boosted
the vegetative growth of the plant and in turn showed a higher percentage, as
well as uptake of N by plant treated with inorganic N fertilizer.
Table 9. Changes in N percentage, dry matter yield and N uptake by different parts
of maize plant-1 in presence and absence of inorganic nitrogenous fertilizer
N-
Fertilization
Plant
parts
30 DAS 60 DAS 90 DAS
A B C A B C A B C
N0 X 1.53 50.00 76.50 1.46 42.50 62.10 1.27 50.0 63.50
Y 3.42 38.30 130.98 1.66 50.00 83.00 1.31 70.00 91.90
Z 3.50 50.00 175.00 2.36 110.00 258.80 1.63 172.50 279.80
N70 X 1.66 50.00 83.00 1.08 70.00 77.35 0.64 77.50 48.90
Y 2.75 43.30 119.14 1.70 72.50 123.30 1.63 182.50 297.50
Z 1.64 61.60 101.02 1.53 182.50 278.80 1.47 300.00 404.00
N100 X 1.69 55.00 92.95 1.21 50.00 60.50 0.89 55.00 48.90
Y 2.88 43.30 124.70 2.09 62.50 130.60 1.77 150.00 265.50
Z 2.48 61.60 152.77 1.53 107.50 164.70 1.34 265.00 353.20
CD (0.05) P 0.023 2.259 4.936 0.033 17.798 34.723 0.024 26.960 30.751
N 0.023 2.259 4.936 0.033 17.798 NS 0.024 26.960 3.751
P x
N
0.039 3.912 8.549 0.057 30.827 60.143 0.041 46.696 53.262
A = N per cent, B = Dry matter yield (mg) plant-1, C = Uptake (mg), X = Root portion, Y
= Mid portion, Z = Top portion, N0 = N added at 0ppm, N70 = N added at 70ppm, N100
= N added at 100ppm, P=Plant part, N= Nitrogen Fertilization
Data further showed that assimilation of total N was more in above ground
vegetation than the underground root portion of plant. This trend of results is
true for both the untreated and N-treated systems. Irrespective of treatments, N-
percentage as well as N-uptake per plant decreased with the period of
investigation. This is an expected trend of results as was found earlier by Saha
and Mukhopadhyay (1986b). Again, within above ground parts N percentage
and N - uptake was more in the top portion of plant which did not receive any
inorganic N fertilizer from outside. However, in presence, of inorganic N, the N-
percentage is more in the mid-portion of plant. This trend of results is observed
under both the doses of N-fertilizer treated systems throughout the investigation.
Certainly inorganic N-addition has changed the uptake mechanism of N by
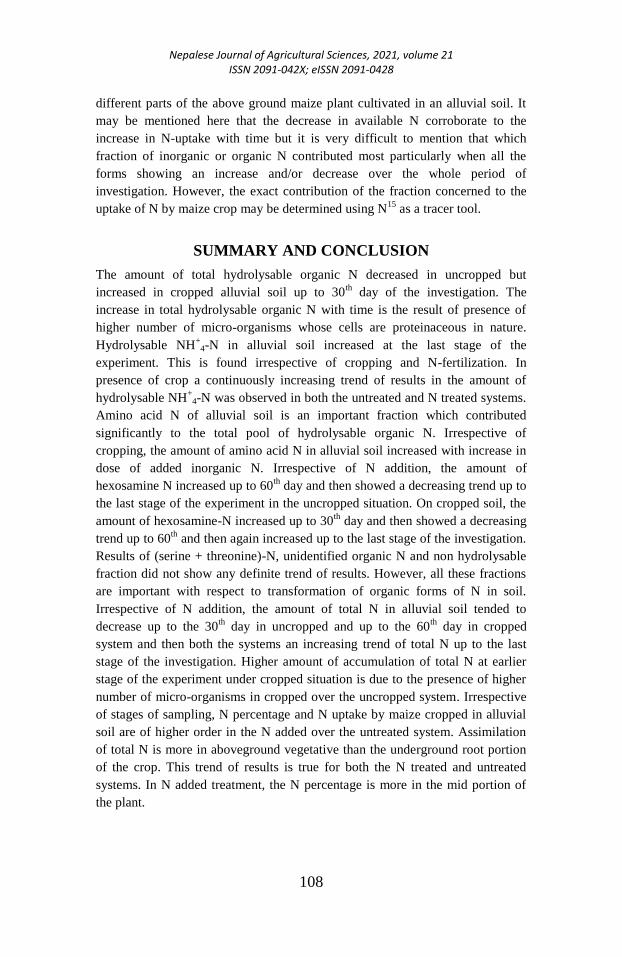
Nepalese Journal of Agricultural Sciences, 2021, volume 21 ISSN 2091-042X; eISSN 2091-0428
108
different parts of the above ground maize plant cultivated in an alluvial soil. It
may be mentioned here that the decrease in available N corroborate to the
increase in N-uptake with time but it is very difficult to mention that which
fraction of inorganic or organic N contributed most particularly when all the
forms showing an increase and/or decrease over the whole period of
investigation. However, the exact contribution of the fraction concerned to the
uptake of N by maize crop may be determined using N15
as a tracer tool.
SUMMARY AND CONCLUSION
The amount of total hydrolysable organic N decreased in uncropped but
increased in cropped alluvial soil up to 30th day of the investigation. The
increase in total hydrolysable organic N with time is the result of presence of
higher number of micro-organisms whose cells are proteinaceous in nature.
Hydrolysable NH+
4-N in alluvial soil increased at the last stage of the
experiment. This is found irrespective of cropping and N-fertilization. In
presence of crop a continuously increasing trend of results in the amount of
hydrolysable NH+
4-N was observed in both the untreated and N treated systems.
Amino acid N of alluvial soil is an important fraction which contributed
significantly to the total pool of hydrolysable organic N. Irrespective of
cropping, the amount of amino acid N in alluvial soil increased with increase in
dose of added inorganic N. Irrespective of N addition, the amount of
hexosamine N increased up to 60th
day and then showed a decreasing trend up to
the last stage of the experiment in the uncropped situation. On cropped soil, the
amount of hexosamine-N increased up to 30th
day and then showed a decreasing
trend up to 60th
and then again increased up to the last stage of the investigation.
Results of (serine + threonine)-N, unidentified organic N and non hydrolysable
fraction did not show any definite trend of results. However, all these fractions
are important with respect to transformation of organic forms of N in soil.
Irrespective of N addition, the amount of total N in alluvial soil tended to
decrease up to the 30th
day in uncropped and up to the 60th
day in cropped
system and then both the systems an increasing trend of total N up to the last
stage of the investigation. Higher amount of accumulation of total N at earlier
stage of the experiment under cropped situation is due to the presence of higher
number of micro-organisms in cropped over the uncropped system. Irrespective
of stages of sampling, N percentage and N uptake by maize cropped in alluvial
soil are of higher order in the N added over the untreated system. Assimilation
of total N is more in aboveground vegetative than the underground root portion
of the crop. This trend of results is true for both the N treated and untreated
systems. In N added treatment, the N percentage is more in the mid portion of
the plant.
Nepalese Journal of Agricultural Sciences, 2021, volume 21 ISSN 2091-042X; eISSN 2091-0428
109
REFERENCES
Arshad, M. and Frankenberger, W.T. Jr. (1998) Plant growth regulating substances in the
rhizosphere: microbial production and functions, Adv. Agron., 62: 45-51
Bremner, J. M. (1996) Nitrogen total In: Sparks et al. (Ed.). Methods of Soil Analysis,
part 3 Soil Science Society of America Inc. and American Society of
Agronomy Inc, Madison, Wisconsin, USA, pp. 1085-1121
Bremner, J. M. and Keeny, D. R. (1996) Determination of exchangeable ammonium
nitrate and nitrite by extraction distillation methods, Soils Sci. Soc. Am. Proc.,
30: 577-587
Frankenberger, W.T. Jr. and Arshad, M. (1995) Phytohormones in soil: Microbial
production and function, Mercel Dekker Inc, New York, USA
Jackson, M. L. (1973) Soil Chemical Analysis, Prentice Hall of India Pvt. Ltd., New
Delhi
Keeney, D. R. and Bremner, J. M. (1966) Characterisation of mineralizable nitrogen in
soils, Soils Sci. Soc. Am. Proc., 30: 714-719
Piper, C.S. (1942) Soil and Plant Analysis, University of South Australia
Saha, D. (1997) N-transformation as influenced by nitrogen fertilization and cropping in
succession, Ann. Agric. Res. 18: 80-86
Saha, D. and Mukhopadhyay, A. K. (1986) Availability of recently fixed NH+4 to crops,
Trop. Agric. 63 : 221
Saha, D. and Mukhopadhyay, A. K. (1986a) Liming soils of acidic reaction on changes in
the amount of different organic and inorganic forms of nitrogen including fixed
NH+4 – N, Agrochimica, 29(5-6): 496
Nepalese Journal of Agricultural Sciences, 2021, volume 21 ISSN 2091-042X; eISSN 2091-0428
110
Study on association of different animal and
management factors on occurrence of Pneumonia in
sheep in Jumla
Ramesh Prasad Sah*, Mohan P. Yadav and Surendra P. Kanu
Sheep and Goat Research Program, NARC, Guthichaur, Jumla
*Corresponding Author: [email protected]
ABSTRACT
This observational study was employed to scrutinize the risk
factors of pneumonia in sheep raised under farmers’ field
management system with the confidence that such information
will aid to reduce further losses. Therefore the present study is
focused at diagnosis of pneumonia in sheep by clinical
symptoms and the association of different animal and
management factors with the occurrence of pneumonia in
sheep. A total number of 160 sheep with respiratory disorder
was observed in and around Sheep and Goat Research
Program, Guthichaur, Jumla district during April 2020 to
March 2021. In the study, the sick sheep showed pyrexia,
serous, mucoid or mucopurulent nasal discharge, cough,
moist and respiratory rales on auscultation of the lungs and
diagnosed as pneumonia. Risk factors including animal and
management factors were measured. It was observed that the
age group of <1 year, female sheep and animal with poor
body condition score were in greater risk to pneumonia. On
the other hand among management factors free range (night
shelter only), muddy floor with poor drainage system showed
susceptibility to pneumonia. Similarly, sheep having a feeding
pattern of grazing in individual, group or community-based
grazing pattern showed susceptible to pneumonia. High
percentage of occurrence of pneumonia was recorded 45% in
< 1 year age group, 70% in female and 70% in poor body
condition score. Similarly, it was also found in free range
housing (night shelter only), muddy floor type, poor drainage
system and grazing pattern in group were 50%, 75%, 60%
and 50% respectively.
Key words: Sheep, pneumonia, animal factor, management factor and Jumla
Nepalese Journal of Agricultural Sciences, 2021, volume 21 ISSN 2091-042X; eISSN 2091-0428
111
INTRODUCTION
Small ruminants particularly sheep in Jumla are amongst the commonest farm
animal species, which contribute to the livelihoods of smallholders and the rural
poor including women headed household situations (Annual Report SGRP,
2019). Sheep population is projected at 806,079 heads in Nepal (about 70,000
heads in Jumla), and meat (mutton) production is 2735 metric ton in 2019-20
(Agriculture diary, 2078). The herd is mainly composed of indigenous animals
and small proportion of upgraded. Their small size, quick maturity, low capital
asset per head and quick returns suit them to the needs of poor resource farmers.
Sheep production provides animal protein (meat), immediate cash income,
manure, raw materials (hides and skin), capital investments and fulfills socio-
economic and cultural obligations (Adane and Girma, 2008; Dhaba et al., 2012;
Pandey and Gyawali, 2012). Thus, sheep make a significant contribution to
nutrition and food security especially to the poor in the rural areas (Gupta et al.,
2018).
Currently, sheep production in Jumla is confronted with various challenges that
greatly affect its economic returns. High incidence of diseases and parasites are
considered as major restrictions causing direct losses, such as death and
diminished production, and indirect losses, such as export limitations (Tiwari,
2001; Pradere, 2014; Torsson et al., 2017; Sah et al., 2020).
Poor management and husbandry practices and diseases of varied etiologies are
among the leading bottlenecks of sheep and goat production (Molla, 2016).
Among the wide range of diseases that affect sheep and goats, respiratory
diseases are most frequent as air and blood are their main routes of transmission
(Tesfaye and Mekonnen, 2016). Overcrowding coupled with the involuntary
inhalation of air polluted with a variety of potentially injurious materials is the
most important risk factor for transmission (Caswell and Williams, 2007).
Pneumonia, a respiratory disease arising from an inflammatory response of the
lung parenchyma usually accompanied with the inflammation of the bronchioles
(broncho-pneumonia) or with pleura (pleuro-pneumonia), is still the major
disease limiting the development of animal production in the tropics (Attoh-
Kotoku et al., 2018). It is manifested clinically by rapid shallow breathing,
cough, ronchi etc. All species of animals irrespective of ages suffer from
pneumonia (Blood et al., 1989).
Pneumonia is regarded as a disease complex, involving interactions between the
host (immunological and physiological), multiple etiological agents (viral,
bacterial, mycoplasmal, parasitic, etc.), and environmental factors (temperature,
Nepalese Journal of Agricultural Sciences, 2021, volume 21 ISSN 2091-042X; eISSN 2091-0428
112
humidity, dust levels, etc) (Taylor et al., 2010; Dar et al., 2014). Irrespective of
the cause, respiratory diseases significantly impact upon the profitability of
farms, both directly and indirectly (Provvido et al., 2018) and compromise the
welfare of the animals (Bell, 2008). In general, respiratory ailments are the
major cause of death in lambs and decreased productivity in older animals in
most developing countries (Dar et al., 2013).
The etiology and incidence of respiratory diseases in sheep vary with the
geographical location and management system. Pneumonia (43.7%), starvation
(18.4%) and abscess (15.5%) were the topmost causes of mortality in Tanzania
(Mlimbe et al., 2020).
Many bacteria, viruses and helminthes parasites are known to cause respiratory
diseases in sheep. In addition to the infectious agents, which cause the
pneumonia, there are predisposing factors that contribute to the susceptibility of
the animals. These are of paramount importance in any consideration of
pneumonia (Chakrabarti, 1994). The predisposing factors are exposure of animal
in damp place and cold environment, housing in an ill ventilated room, exertion
due to extensive work, long transport by vehicles, severe hunger, malnutrition,
chronic under-nutrition, exposure to cold wave during winter month, sudden
changes in weather, cardiac weakness, recumbence for a long period of time,
other debilitating diseases, inhalation of dust, irritating vapour etc. according to
etiology.
Clinical diagnosis of pneumonia is difficult and usually involves physical
examination, imaging, serology and identification of the etiological agent from
nasal swabs, bronchial lavages, and even feces (for verminous pneumonia)
(Caswell and Williams, 2007; Bell, 2008; McRae et al., 2016).
Among all other diseases, pneumonia causes high mortality and poor production
of sheep. However, to the authors’ knowledge, very little work has been done to
date on pneumonia in sheep. Thus, the present study was conducted with the
objective of estimating the association of different animal factors and
management factors on occurrence of pneumonia.
MATERIALS AND METHODS
Study location was situated at Guthichaur-2, Jumla district in mountainous
region with the altitude ranges from 2500-3000 (average 2700 masl) meters
above sea level. Latitude and longitude of the site is 29017’72.5” N and
82040’83.4” E, respectively.
A total number of 160 indigenous Baruwal and Bhyanglung sheep with
respiratory disorder were examined in and around Sheep and Goat Research
Program (SGRP), Guthichaur, Jumla district during April 2020 to March 2021.
The age of the animal was ranging from months to four years. The system of

Nepalese Journal of Agricultural Sciences, 2021, volume 21 ISSN 2091-042X; eISSN 2091-0428
113
diagnosis was based on history and clinical examination (inspection, palpation,
percussion and auscultation). Here, the sick sheep showed pyrexia, serous,
mucoid or mucopurulent nasal discharge, cough, moist and respiratory rales on
auscultation of the lungs and diagnosed as pneumonia.
Different risk factors related with pneumonia were discussed, recorded. For
convenience of study risk factors were divided into two viz. animal and
management factors. Age, sex and body condition score were included in animal
factors. Types of housing, type of floor, drainage system, feeding pattern and
grazing pattern were included in management factors.
The data were analyzed using Microsoft Excel. Results of strength of association
between the pneumonia and their risk factors were expressed as risk ratio. The
strength of association was measured using the lowest risk group as baseline.
RESULTS AND DISCUSSION
Effect of animal factors on occurrence of pneumonia
Respiratory problem/pneumonia was found common in study areas. It might be
due to different animal and management factors. Pneumonia is ranked as one of
the most important health problems that are quite detrimental to small ruminants
in the tropics and it causes enormous production losses through morbidity and
mortality (Mekbibib, et al., 2019). Association of variable animal factors on
occurrence of pneumonia is given below (Table 1).
Effect of age on occurrence of pneumonia
The age group belonging to <1 year age had higher percentage (45%), while
with increase of the age exceeding 2 years of age had lower percentage (20%).
Effect of age on occurrence of pneumonia recorded in this study supports the
report published by Donkin et al. (2004) who recorded kids were susceptible to
pneumonia. The age group belonging < 1 year was 2.25 times more and the age
group belonging 1-2 years was 1.75 times more prone to have developed
pneumonia than the base line group (>2 years) (Table 1).
Effect of sex on occurrence of pneumonia
In this study it was observed that, female species suffered the most because
among whole study population the disease percentage was 70% in case of
female and only 30% in case of male. This statement supports the report by
Mlimbe et al. (2020). This might be due to sex variation of the species. The
female sheep also remained 2.33 times more at risk than the male (Table 1).
Effect of body condition score on occurrence of pneumonia
Poor body condition score (BCS-2) of sheep was recorded to be more
susceptible than good body condition (BCS-3) to pneumonia, where disease
Nepalese Journal of Agricultural Sciences, 2021, volume 21 ISSN 2091-042X; eISSN 2091-0428
114
percentage was 70% and 30% respectively. Effect on body condition score on
occurrence of pneumonia recorded in this study supports the report of Hale et al.
(2003) who recorded weak and stressed animals were susceptible to pneumonia.
The sheep obtaining score 2 were 2.33 times more likely to have pneumonia
than the sheep obtaining score 3 (Table 1).
Table 1. Calculation of risk ratio among the animal factors on occurrence of
pneumonia
Variable Category Total no of
animal affected
Percent Risk ratio
Age
<1 year 72 45 2.25
1-2 yr 56 35 1.75
>2 yr 32 20 1
Sex Female 112 70 2.33
Male 48 30 1
Body condition
score
2 (Poor) 112 70 2.33
3 (Good) 48 30 1
Effect of management factors on occurrence of pneumonia
Association of variable management factors on occurrence of pneumonia is
given below (Table 2).
Effect of type of housing on occurrence of pneumonia
From this study it is known that, goats remaining on free range (night shelter
only) are more vulnerable to pneumonia (50%) while those housed in loose and
stall are less prone to get pneumonia (35% & 15%). According to Hale et al.
(2003) poor ventilation, overcrowding, dirty or poorly ventilated barn are
associated with severe outbreak of pneumonia. Jha (1999) reported the
overcrowding of small ruminants in the pen during night and long storage of
dropping and urine below pens in villages may be predisposing factors for the
occurrence of respiratory disease. Loose and free ranged sheep were also
remained in 2.33 times and 3.33 times more at risk than the stalled sheep (Table
2).
Effect of type of floor on occurrence of pneumonia
Among the three types of floor, muddy floor appeared to be the predisposing
factor to develop pneumonia in sheep. The disease percentage was 75% in
muddy floor while 15% and 10% in case of concrete floor and machan system
respectively. Sheep reared in muddy and concrete floor remained in 7.5 times
and 1.5 times more at risk than the sheep reared in machan system (Table 2). An
unexpected cold snap can increase pneumonia in goat and sheep (Smith et al.,
1994). According to Hale et al. (2003), dirty floor, a manure pack, and high
humidity were considered as risk factors to develop pneumonia.
Nepalese Journal of Agricultural Sciences, 2021, volume 21 ISSN 2091-042X; eISSN 2091-0428
115
Effect of drainage system on occurrence of pneumonia
According to the history of drainage system, poor drainage system was more
prone to develop pneumonia in sheep. In this study, 60% disease was in poor
drainage system while 30% and 10% in fair and good drainage system
respectively. Sheep housed with poor drainage system remained in 6 times more
at risk than the sheep housed with good drainage system for developing
pneumonia (Table 2). According to Hale et al. (2003), poor waste management
was considered as risk factor to develop pneumonia.
Effect of feeding pattern on occurrence of pneumonia
Regarding feeding pattern, the study revealed that 85% of sheep having grazing
and only 5% sheep having stall feeding developed pneumonia. The grazing
group remained 17 times more at risk than the stall-feeding group (Table 2).
According to Hale et al. (2003), dusty feed and feeding can also detrimental to
health, which enhance development of pneumonia.
Table 2. Calculation of risk ratio among the management factors on occurrence of
pneumonia
Variable Category Total no. of
animal
affected
Percent Risk
ratio
Types of
housing
Stall 24 15 1
Loose 56 35 2.33
Night shelter only 80 50 3.33
Types of
floor
Muddy 120 75 7.5
Concrete 24 15 1.5
Machan 16 10 1
Drainage
system
Good 16 10 1
Fair 48 30 3
Poor 56 60 6
Feeding
pattern
Stall feeding 8 5 1
Grazing 136 85 17
Stall feeding +grazing 16 10 2
Grazing
pattern
Individual 64 40 4
Group or community 80 50 5
Others 16 10 1
Effect of grazing pattern on occurrence of pneumonia
As usually, group or community based grazing pattern developed more
pneumonia in sheep where the disease percentage was 50% and at the same time
individual grazing pattern developed less pneumonia where the disease
percentage was 40%. Group or community based sheep were 5 times more at
risk than the non-grazed sheep (Table 2) because there might be more chances to
Nepalese Journal of Agricultural Sciences, 2021, volume 21 ISSN 2091-042X; eISSN 2091-0428
116
transmission of pathogenic microorganisms via the aerosol route. Effect of
grazing pattern on pneumonia recorded in this study supports the report of Hale
et al. (2003) who reported higher percentage of pneumonia occur due to
overcrowding in grazing places.
CONCLUSIONS AND RECOMMENDATIONS
The following conclusions and recommendations are made:
Generally animal factors and management factors seemed to develop
pneumonia in sheep, so care should be taken towards minimize the
related risk factors.
Sheep of <1 year age group were more susceptible to pneumonia than
other age groups.
Poor ventilation, overcrowding, dirty or poorly ventilated barn, muddy
floor, and high humidity may be the predisposing factors for occurrence
of pneumonia.
Pneumonia can be reduced by avoiding damp and poorly ventilated
houses, abolishing overcrowding and delivery of nutritious feed and
optimal herd health management practices.
Therefore, awareness to the farmers needs to be created so as to follow
the good management practices for rearing sheep.
ACKNOWLEDGEMENT
Authors express sincere thanks to staffs of Sheep and Goat Research Program,
Guthichaur, Jumla to record the data in appropriate way that made easy to
analyze.
REFERENCES
Adane, Y and Girma A (2008) Economic significance of sheep and goats, In: Alemu and Yami and
R C Markel (Eds.). Sheep and Goat Production. Handbook for Ethiopia. ESGPIP (Ethiopia
Sheep and Goats Productivity Improvement Program). Addis Ababa, Ethiopia. pp 2-24.
Attoh-Kotoku, A, Emikpe BO and Obuadey D (2018) Patterns and direct financial implications of
contagious pleuropneumonia in cattle slaughtered in Kumasi Abattoir, Ghana. Animal
Research International, 15: 2937–2943.
Bell, S (2008) Respiratory disease in sheep. In Practice, 30: 278-283.
Blood, DC Radostits OM (1989) Diseases caused by Bacteria. In: Veterinary Medicine, 7th edn., A
text book of diseases of cattle, sheep, pigs, goats and horses. English Language Book
Society, Baillire Tindal. Pp. 370,673-675.
Caswell, JL and Williams KJ (2007) Respiratory system. In Jubb, Kennedy and Palmer Pathology of
Domestic Animals, M. G. Maxie, Ed., vol. 5th, pp. 524–650, Elsevier, Edinburgh, Scotland.
Chakrabarti, A (1994) Text book of Clinical Veterinary Medicine, 3rd edn., Kalyani Publishers, New
Delhi-110002. pp. 360-419.
Dar L, Darzi M and Mir M (2014). Histopathological and histoenzymatic studies on
bronchopneumonia in sheep. Journal of Applied Animal Research, 42(3): 289-296.
Nepalese Journal of Agricultural Sciences, 2021, volume 21 ISSN 2091-042X; eISSN 2091-0428
117
Dar, LM, Darzi MM, Mir MS, Kamil SA, Rashid A and Abdullah S (2013) Prevalence of lung
affections in sheep in northern temperate regions of India: A postmortem study. Small
Ruminant Research, 110(1): 57–61
Dhaba, U, Belay D, Solomon D and Taye T (2012) Sheep and goat production systems in Ilu Abba
Bora zone of Oromia Regional State, Ethiopia: Feeding and management strategies. Global
Veterinaria, 9(4): 421–429
Donkin, EF and Boyazoglu PA (2004) Diseases and mortality of goat kids in a South African milk
goat herd. South African Journal of Animal Science, 34: 258-261.
Gupta, A, Chaudhary M, Goyal RK, Yadav V, Chandra S and Sinha S (2018) Recent advances in
reproductive biotechnologies in small ruminants. Journal of Entomology and Zoology
Studies, 6(3): 62-66.
Hale, L and Kritzmzn E (2003) Pygmy Goats: Best Memo (1976-1981). National Pygmy Goat
Association, Pp. 89-90.
Jha, VC (1999) Preliminary study on diseases, with special reference to respiratory problems in
goats in Tanahun district of Nepal, Advances in Agricultural Research in Nepal.
Proceedings of the first SAS/N convention, Pp. 254-257.
McRae, KM, Baird HJ, Dodds KG, Bixley MJ and Clarke SM (2016) Incidence and heritability of
ovine pneumonia and the relationship with production traits in New Zealand sheep. Small
Ruminant Research, 145: 136–141.
Mekibib, B, Mikir T, Fekadu A and Abebe R (2019) Prevalence of Pneumonia in Sheep and Goats
Slaughtered at Elfora Bishoftu Export Abattoir, Ethiopia: A Pathological Investigation.
Journal of Veterinary Medicine, Article ID 5169040, 1-10.
Mlimbe ME, Hyera E, Ochanga PO, Nguluma AS, Marwa LJ, Rugaimukamu AP, Godfrey JD,
Ngabo MS and Shirima EJM (2020) Study on the causes and pattern of sheep mortality
under farm conditions in Northern Tanzania, Livestock Research for Rural Development, 32
(10): 1-8.
Molla, B (2016) Te health performance of imported Boer goat (Capra hircus) and their crosses with
Woito-guji goat breeds in South Omo Zone, South-Western Ethiopia, Tropical Animal
Health and Production, 48(4): 855–861.
Pandey, LN and Gyawali R (2012) Constraints and potential of goat and sheep production under
transhumance management system in the high mountainous regions of Nepal, Conference
paper: The Proceeding of the National workshop on Research and Development Strategies
for Goat Enterprises in Nepal 27-28 September 2012 held in Kathmandu. Pp.92-101
Pradere, JP (2014) Improving animal health and livestock productivity to reduce poverty, Revue
scientifique et technique, 33: 723-744
Provvido, AD, Teodoro GD, Muuka G, Marruchella G and Scacchia M (2018). Lung lesion score
system in cattle: proposal for contagious bovine pleuropneumonia. Tropical Animal Health
and Production, 50(1): 223–228.
Sah, RP, Yadav MP, Kanu SP and Rijal TR (2020) Study on ovine fascioliasis: Case study,
associated risk factors and economic significance at Sheep and Goat Research Program,
Guthichaur, Jumla, Nepal, International Journal of Veterinary Sciences and Animal
Husbandry, 5(4): 164-168
Smith, C and Sherman M (1994) Goat Medicine, Lea and Febiger, Philadelphia
Taylor, JD, Fulton RW, Lehenbauer TW, Step DL and Confer AW (2010) Te epidemiology of
bovine respiratory disease: What is the evidence for predisposing factors? Canadian
Veterinary Journal, 51(10): 1095–1102
Tesfaye, S and Mekonnen N (2016) A study on major causes of organs condemnation and their
financial losses in cattle slaughtered at Gondar ELFORA abattoir, Northwestern, Ethiopia.
Global Veterinaria, 17: 365–374

Nepalese Journal of Agricultural Sciences, 2021, volume 21 ISSN 2091-042X; eISSN 2091-0428
118
Tiwari,, M. R. (2001) Exploration of constraints and oppourtunities of small ruminant production
system in Karnali zone, Final Technical Paper. Sheep and Goat Resaearch Programme
(SGRP), Guthichaur, Jumla
Torsson, E, Berg M, Misinzo G, Herbe I, Kgotlele T, Paarni M, Roos N, Blomstrom AL, Stahl K
and Wensman JJ (2017) Seroprevalence and risk factors for peste des petits ruminants and
selected differential diagnosis in sheep and goats in Tanzania, Infection Ecology and
Epidemiology, 7: 1-13
Nepalese Journal of Agricultural Sciences, 2021, volume 21 ISSN 2091-042X; eISSN 2091-0428
119
Economics of early-season cauliflower production
and marketing in Benighat Rorang Rural
Municipality, Dhading District
Ashma Pandey
HICAST, Kathmandu, Nepal
Corresponding Author: [email protected]
ABSTRACT
The study was conducted to assess the economics of early-
season cauliflower production and marketing in Benighat
Rorang Rural Municipality of Dhading district. Benighat
Rorang Rural Municipality was purposely selected as it is one
of the pocket areas for cauliflower production. Altogether 75
respondents including 60 farmers and 15 traders were
selected using simple random sampling method. The study
estimated the total cost of production of early-season
cauliflower per ropani was NRs 13,588.81 while the yield was
727.94 kg/ropani. The average farm gate price of early season
cauliflower was found to be NRs 50.065/kg. The gross return,
gross margin, and net profit were calculated NRs 36444.32,
NRs 25194.54, and NRs 22855.51 per ropani respectively. The
benefit-cost ratio was estimated to be 2.68 that revealed the
early season cauliflower production is highly attractive and
profitable enterprise. Among the different cost factors,
chemical fertilizers and manure were found to be significant
contributors (P<0.05) in total gross return. The major
marketing channel was found to be Producer-Collector-
Wholesaler-Retailer-Consumer with highest price speared of
NRs 35/kg. Major problem in the production and marketing of
cauliflower in the study area was diseases and pests and
inappropriate marketing channels. Hence, the study revealed
that the production of early-season cauliflower is one of the
profitable options for farmers in the study area.
Key word: Gross Margin, Profitability, Cobb-Douglas, Benefit Cost Ratio,
Marketing channel
INTRODUCTION
Agriculture remains the pillar of the economy in any part of the world,
particularly in developing countries like Nepal. It solely contributes 26.98%
Nepalese Journal of Agricultural Sciences, 2021, volume 21 ISSN 2091-042X; eISSN 2091-0428
120
to the national GDP (MoF, 2019). In Nepal, total agriculture cultivated land
is 3,091,000 ha, out of which vegetable is cultivated in 297,195 ha with
4,271,270 metric tons production (MOALD, 2019).
Cauliflower (Brassica oleracea var. botrytis) is the major vegetable crop in
Nepal having high market potentialities. It is an amazing vegetable having a
good source of Vitamin D and K and a good source of fiber along with
good taste. As per (MOALD, 2019) the total area coverage of cauliflower is
35,764 ha producing 5, 74,795 mt in 2076/77 with average productivity of
16.07 metric tons per hectare. Cauliflower has the highest shares followed
by tomato and cabbage in Dhading district. The production of cauliflower
in Dhading district is found to be 8035 metric tons with average
productivity of 15.98 mt/ha (MOALD, 2019). It is grown both as a seasonal
and off-seasonal vegetable. Cauliflower varieties are grouped in three
different categories: early season varieties, main season varieties, and late -
season varieties and recommended as per geographical belt. Early season
varieties are sown from May-August and harvested in September-November
targeting the major festivals when the demand is high. Hence, this study
was designed to find out the economics of early-season cauliflower
production and marketing in Benighat Rorang Rural Municipality of
Dhading district as a broad objective.
MATERIALS AND METHODS
Study area and sampling method
Benighat Rorang Rural Municipality of Dhading district was selected for this
research. This study area was purposely selected based on the high production
potential of cauliflower. Altogether 60 farmers were selected by using simple
random sampling without replacement whereas 15 traders including 5 local
collectors, 5 wholesalers, 5 retailers were selected based on referral information
from focus group discussion (FGD) and key informant interview (KII).
Methods of data collection and analysis
Primary information was collected by adopting face to face interview method
using pre-tested semi-structured questionnaire. Thus collected information was
tabulated and analyzed by using Microsoft excel and Statistical Package of
Social Science (SPSS), and run following functions and formulas:
Cost of Production
The total cost of production of cauliflower was calculated by using following
formula:
TC = TVC + TFC ………………………. Equation 1
Nepalese Journal of Agricultural Sciences, 2021, volume 21 ISSN 2091-042X; eISSN 2091-0428
121
Where,
TC = Total cost of produciton
TVC = Total variable cost which included cost of produciton inputs namely
fertilizers, manures, pesticides, irrigation, transportation, farm supplies
and interest on operational expenses
TFC = Total fixed cost which included water tax, land tax, land rent and
depreciation of farms machinery and equipment’s.
Profitability analysis
The study uses gross margin and net profit to determine the profitability.
Following formula was adopted from (Poudel, et al., 2019; Khadka & Adhikari,
2021).
Gross Margin = Gross Revenue – Total Variable Cost ……………equation 2
Net Profit = Gross Revenue – Total Cost
Where,
Gross Revenue = Selling Price * Quantity produced
Benefit-Cost ratio
It is the ratio of total revenue and total cost.
………………….. Equation 3
Market Margin
The difference between the farm-gate price and the retailer’s price is the
marketing margin. It is calculated as follows:
Market margin= Retailer’s Price – Farm gate price ……….. Equation 4
Price Spread and Producer’s share
Price spread = Price paid by the consumer – price received by the producer
(farmers)
Producer’s share in consumer’s price = (price received by farmers/price paid by
consumers) * 100
Ranking of problems
The scaling technique was used for the production and marketing problem
ranking. The index of the problem was calculated by using the formula:
Iprob= ………………..equation 5
Where,
I= index value for intensity of problem (0 to 1,)
Nepalese Journal of Agricultural Sciences, 2021, volume 21 ISSN 2091-042X; eISSN 2091-0428
122
Si= scale value at ith
severity,
Fi= frequency of the ith
severity
N= total number of respondents
∑ = Summation
Analysis of factor affecting gross return
To determine the contribution of different inputs as well as for the estimation of
the efficiency of variable production input in two different production systems,
the Cobb-Douglas production function was used as described by (Khadka&
Adhikari, 2021; Adhikari, 2012). The general form of Cobb-Douglas production
function was used to determine resource productivity, and efficiency is as
follow:
Y=X1b1
X2b2
X3b3
X4b4
X5b5
X6b6
…………. Equation 6
Where, Y= Gross return (NRs./ropani), X1 = Cost on seed (NRs./ropani), X2 =
Cost on chemical fertilizer (NRs./ropani), X3 = Cost on manure (NRs./ropani),
X4 = Cost on plant protection (NRs./ropani), X5 = cost on labor (NRs./ropani),
X6 = cost on transportation, (NRs./ropani), and b1, b2...b7 are coefficient of
respective variable.
RESULTS AND DISCUSSION
Cauliflower variety
From the study, it was revealed that 45% of respondents grow White Cob
variety of cauliflower followed by White Top (28%). Similarly, 17% grow snow
Mystique variety and 10% grow Kathmandu local. From this, we can conclude
that majority of respondents grow White Cob variety as early-season
cauliflower.
Economics of cauliflower production
For calculating total production cost, fixed cost, and variable cost were taken
into consideration. In this study, the fixed cost included land tax, water tax,
depreciation of farm machinery and equipment and land rent and variable cost
included all the labor and inputs cost that were directly related to cauliflower
production like seed, seedlings, fertilizers, plant protectants, micro-nutrients,
seed treatment, irrigation, transportation, and interest on total variable cost.
From the study, it was evident that the total cost (TC) of the seed of early-season
cauliflower per ropani was NRs 840.4 which covers 6.2 percent of the total cost
of early-season cauliflower. The farmers used different kinds of fertilizers for a
higher yield of cauliflower. Commonly used fertilizers were Urea, DAP, and
MOP. Costs of fertilizers were estimated according to the cash price paid. The
cost of chemical fertilizer was found to be 1225.08 per ropani of land. It
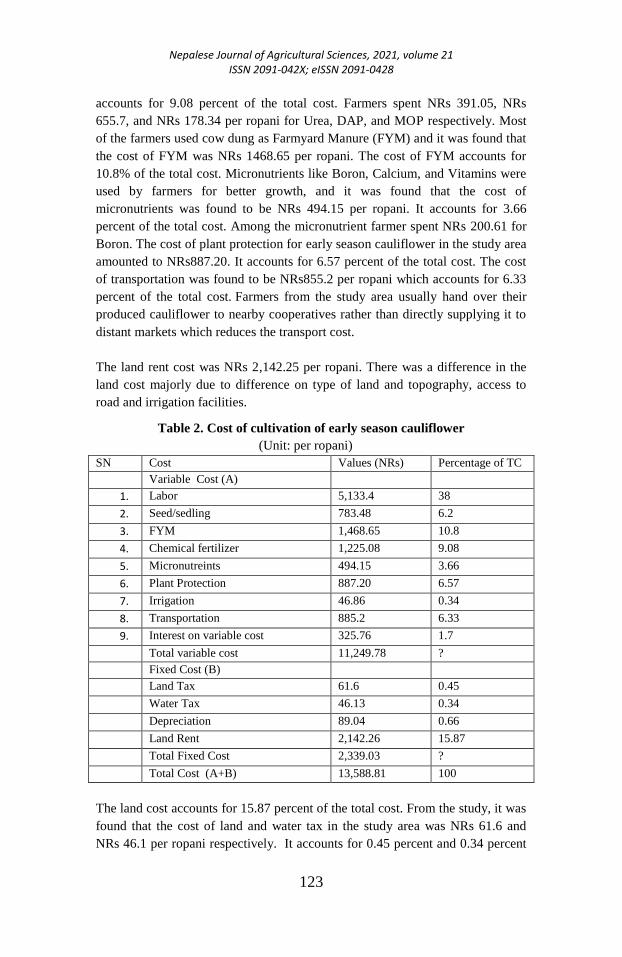
Nepalese Journal of Agricultural Sciences, 2021, volume 21 ISSN 2091-042X; eISSN 2091-0428
123
accounts for 9.08 percent of the total cost. Farmers spent NRs 391.05, NRs
655.7, and NRs 178.34 per ropani for Urea, DAP, and MOP respectively. Most
of the farmers used cow dung as Farmyard Manure (FYM) and it was found that
the cost of FYM was NRs 1468.65 per ropani. The cost of FYM accounts for
10.8% of the total cost. Micronutrients like Boron, Calcium, and Vitamins were
used by farmers for better growth, and it was found that the cost of
micronutrients was found to be NRs 494.15 per ropani. It accounts for 3.66
percent of the total cost. Among the micronutrient farmer spent NRs 200.61 for
Boron. The cost of plant protection for early season cauliflower in the study area
amounted to NRs887.20. It accounts for 6.57 percent of the total cost. The cost
of transportation was found to be NRs855.2 per ropani which accounts for 6.33
percent of the total cost. Farmers from the study area usually hand over their
produced cauliflower to nearby cooperatives rather than directly supplying it to
distant markets which reduces the transport cost.
The land rent cost was NRs 2,142.25 per ropani. There was a difference in the
land cost majorly due to difference on type of land and topography, access to
road and irrigation facilities.
Table 2. Cost of cultivation of early season cauliflower
(Unit: per ropani)
SN Cost Values (NRs) Percentage of TC
Variable Cost (A)
1. Labor 5,133.4 38
2. Seed/sedling 783.48 6.2
3. FYM 1,468.65 10.8
4. Chemical fertilizer 1,225.08 9.08
5. Micronutreints 494.15 3.66
6. Plant Protection 887.20 6.57
7. Irrigation 46.86 0.34
8. Transportation 885.2 6.33
9. Interest on variable cost 325.76 1.7
Total variable cost 11,249.78 ?
Fixed Cost (B)
10. Land Tax 61.6 0.45
11. Water Tax 46.13 0.34
12. Depreciation 89.04 0.66
13. Land Rent 2,142.26 15.87
14. Total Fixed Cost 2,339.03 ?
Total Cost (A+B) 13,588.81 100
The land cost accounts for 15.87 percent of the total cost. From the study, it was
found that the cost of land and water tax in the study area was NRs 61.6 and
NRs 46.1 per ropani respectively. It accounts for 0.45 percent and 0.34 percent
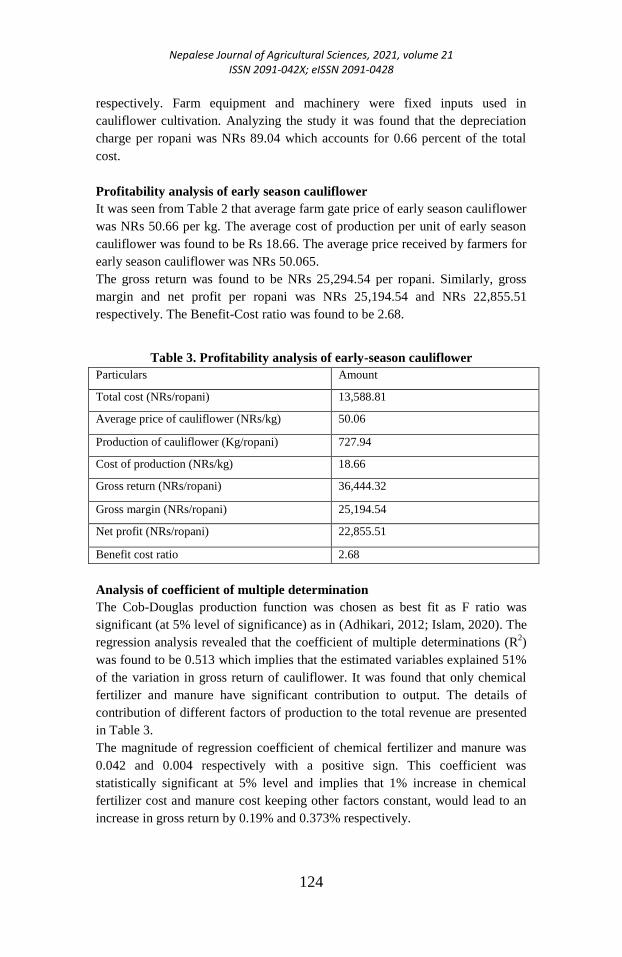
Nepalese Journal of Agricultural Sciences, 2021, volume 21 ISSN 2091-042X; eISSN 2091-0428
124
respectively. Farm equipment and machinery were fixed inputs used in
cauliflower cultivation. Analyzing the study it was found that the depreciation
charge per ropani was NRs 89.04 which accounts for 0.66 percent of the total
cost.
Profitability analysis of early season cauliflower
It was seen from Table 2 that average farm gate price of early season cauliflower
was NRs 50.66 per kg. The average cost of production per unit of early season
cauliflower was found to be Rs 18.66. The average price received by farmers for
early season cauliflower was NRs 50.065.
The gross return was found to be NRs 25,294.54 per ropani. Similarly, gross
margin and net profit per ropani was NRs 25,194.54 and NRs 22,855.51
respectively. The Benefit-Cost ratio was found to be 2.68.
Table 3. Profitability analysis of early-season cauliflower
Particulars Amount
Total cost (NRs/ropani) 13,588.81
Average price of cauliflower (NRs/kg) 50.06
Production of cauliflower (Kg/ropani) 727.94
Cost of production (NRs/kg) 18.66
Gross return (NRs/ropani) 36,444.32
Gross margin (NRs/ropani) 25,194.54
Net profit (NRs/ropani) 22,855.51
Benefit cost ratio 2.68
Analysis of coefficient of multiple determination
The Cob-Douglas production function was chosen as best fit as F ratio was
significant (at 5% level of significance) as in (Adhikari, 2012; Islam, 2020). The
regression analysis revealed that the coefficient of multiple determinations (R2)
was found to be 0.513 which implies that the estimated variables explained 51%
of the variation in gross return of cauliflower. It was found that only chemical
fertilizer and manure have significant contribution to output. The details of
contribution of different factors of production to the total revenue are presented
in Table 3.
The magnitude of regression coefficient of chemical fertilizer and manure was
0.042 and 0.004 respectively with a positive sign. This coefficient was
statistically significant at 5% level and implies that 1% increase in chemical
fertilizer cost and manure cost keeping other factors constant, would lead to an
increase in gross return by 0.19% and 0.373% respectively.
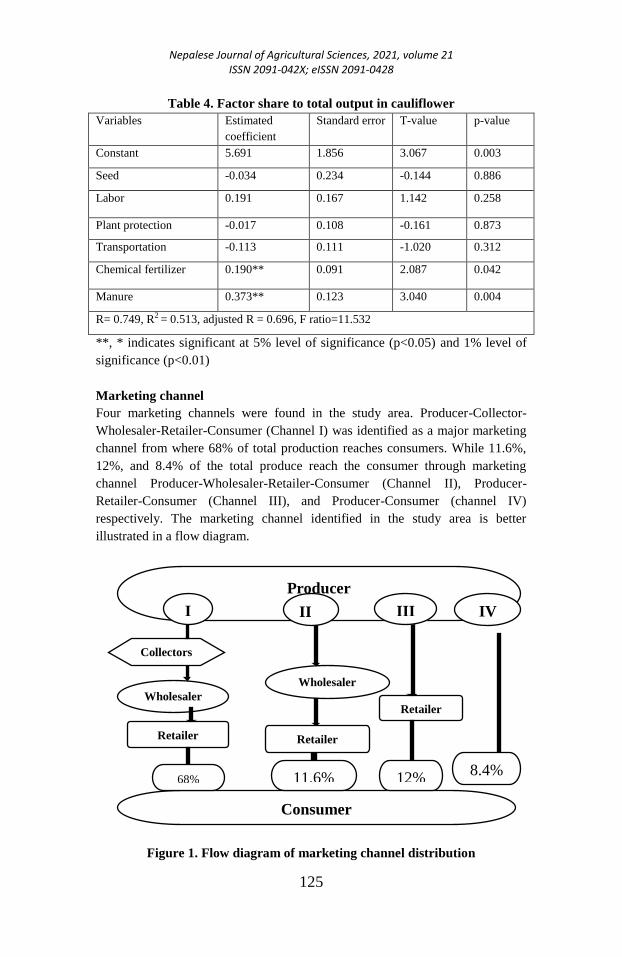
Nepalese Journal of Agricultural Sciences, 2021, volume 21 ISSN 2091-042X; eISSN 2091-0428
125
Table 4. Factor share to total output in cauliflower
Variables Estimated
coefficient
Standard error T-value p-value
Constant 5.691 1.856 3.067 0.003
Seed -0.034 0.234 -0.144 0.886
Labor 0.191 0.167 1.142 0.258
Plant protection -0.017 0.108 -0.161 0.873
Transportation -0.113 0.111 -1.020 0.312
Chemical fertilizer 0.190** 0.091 2.087 0.042
Manure 0.373** 0.123 3.040 0.004
R= 0.749, R2 = 0.513, adjusted R = 0.696, F ratio=11.532
**, * indicates significant at 5% level of significance (p<0.05) and 1% level of
significance (p<0.01)
Marketing channel
Four marketing channels were found in the study area. Producer-Collector-
Wholesaler-Retailer-Consumer (Channel I) was identified as a major marketing
channel from where 68% of total production reaches consumers. While 11.6%,
12%, and 8.4% of the total produce reach the consumer through marketing
channel Producer-Wholesaler-Retailer-Consumer (Channel II), Producer-
Retailer-Consumer (Channel III), and Producer-Consumer (channel IV)
respectively. The marketing channel identified in the study area is better
illustrated in a flow diagram.
Figure 1. Flow diagram of marketing channel distribution
Producer
Consumer
Collectors
Wholesaler
Retailer
Wholesaler
Retailer
68% 11.6% 12% 8.4%
I II III IV
Retailer
Nepalese Journal of Agricultural Sciences, 2021, volume 21 ISSN 2091-042X; eISSN 2091-0428
126
Note: Percentage in the box describes the amount of cauliflower marketed
through respective channels.
Price Spread and Producer’s share
The study showed, price spread was NRs 35 in channel-I, Rs 32 in channel-II,
and NRs 25 in channel-III and NRs 0 in channel-IV. The price spread is higher
when there are a large number of intermediaries involved.
Producer’s share in consumer’s price was observed as 57.14%, 68%, 67.3%, and
100% in channel 1st, 2
nd, 3
rd, and 4
th respectively. Study shown that producer's
share is inversely proportional to the length of the marketing channel i.e.
producer’s share decreases with the increase in the length of the channel.
Producer’s share was maximum (100%) in channel 4 where no marketing
intermediaries were involved.
Table 5. Price spread and producer's share in consumer's price
Particulars Channel I Channel II Channel III Channel IV
Price Spread (Rs) 35 32 25 0
Producer’s Share (%) 57.14 68 67.3 100
Market margin
Study showed market margin was highest in channel-I as compared to other
channels. Channel-IV had least consumer’s price, which indicates that there was
least price spread in channel-IV. It indicates that market margin is high when
there are more intermediaries in the marketing channel. The market margin of
different intermediaries is presented in Table 5:
Table 6. Marketing margins of different marketing intermediaries
Channel Collector’s Wholesaler’s Retailer’s Consumer’s
Price
Total
Market
Margin
Price Margin Price Margin Price Margin
I 60 +18 78 +12 90 +15 105 45
II 68 +18 88 +17 100 32
III 64 +31 95 31
IV 90 0
Production and marketing problems
From the study, among the production problems, disease and pest problems
appeared as the major problem for early season cauliflower production followed
by availability of fertilizer and manure, irrigation water and facility, quality of
seed material and problem-related to soil fertility as presented in Table 6. On the
other hand, inappropriate marketing is the important problem faced by farmers
Nepalese Journal of Agricultural Sciences, 2021, volume 21 ISSN 2091-042X; eISSN 2091-0428
127
followed by price fluctuation, access to market, problem in the transportation of
produces and lack of proper storage facilities. The detailed marketing problems
faced by the sampled farmers are presented in Table 7.
Table 7. Problems in production of cauliflower
Production Problems Index value Rank
Diseases and pests 0.76 I
Unavailability of fertilizer and manure 0.63 II
Irrigation water and facility 0.60 III
Quality of seed material 0.51 IV
Mechanization 0.48 V
Table 8. Problems of cauliflower marketing
Marketing Problems Index value Rank
Inappropriate marketing channel 0.76 I
Price fluctuation 0.68 II
Distant market (No nearby access to market) 0.62 III
Transportation 0.54 IV
Storage facilities 0.38 V
CONCLUSION
The positive BCR indicates early season cauliflower production is highly
profitable in the study area. Most practiced marketing channel in the study area
was the flow of cauliflower from producers to collectors, - wholesalers, retailers,
and consumers. Longer channels were found to have more marketing margins
than the short channel. Study showed that producers share was inversely
proportional to the length of the marketing channel i.e. producer’s share
decreased with the increase in the length of the channel. Diseases and pest and
inappropriate marketing channel were major production and marketing
problems, respectively. The study revealed that chemical fertilizers and manures
cost had a significant impact (p < 0.05) on gross return.
ACKNOWLEDGMENT
With the most appreciation, I am grateful to all the respondents of the study
area, who provided the information without any hesitation, warm love and great
hospitality during my field visit. I am greatful to my thesis advisor Mr Nanu Jha
for his scholarly support. I am highly indebted to Prime-Minister Agriculture
Modernization Project (PMAMP), Dhading for the financial support provided
for my internship and field study.
Nepalese Journal of Agricultural Sciences, 2021, volume 21 ISSN 2091-042X; eISSN 2091-0428
128
REFERENCES
Adhikari, R. K., (2012) Economics of finger millet (Elecusine coracana G.) production
and marketing in peri urban area of Pokhara valley of Nepal, Journal of
Development and Agriculture Economics, 4(6), pp. 151-157
Islam, M. S., (2020) An Economic Analysis of Cauliflower Production in Selected Areas
of Mymensingh District of Bangladesh, ICRRD HIGH INDEX RESEARCH
JOURNAL, 29(2).
Khadka, S. and Adhikari, R.K. (2021) Comparative economics of tomato production
under polyhouse and open field condition in Dhading district of Nepal -.
Nepalese Journal of Agricultural Sciences , 20, 100-107
MOALD, (2019) Statistical Information on Nepalese Agriculture 2075/76, Singha
Durbar, Kathmandu, Nepa: Ministry of Agriculture & Livestock Deveopment
Planning & Development Cooperation coordination Division Statistics and
Anaysis Section l.
MoF, (2019) Economic Survey 2019/20, Singh Durbar, Kathmandu: Government of
Nepal, Ministry of Finance.
Poudel, K., Pokharel, S., KC, S. & Adhikari, S., (2019) Analysis of supply chain of
cauliflower in Tanahun, Nepal, Academia Journal of Agricultural Research,
7(12), pp. 295-306.
Nepalese Journal of Agricultural Sciences, 2021, volume 21 ISSN 2091-042X; eISSN 2091-0428
129
Management of white grub in ginger
Janarjan Gautam1*, K. Bhandari
2 and D. Ghimire
3
*1Agriculture Research Station, NARC, Jaubari, Ilam.
2Directorate of Agriculture Research, NARC, Tarhara, Sunsari 3National Horticulture Research Center, NARC, Khumaltar
*Corresponding Author, email: [email protected]
ABSTRACT
A field experiment was under taken during the year 2014/015
to 2016/017 to study the effect of different botanicals, bio-
pesticides and chemical pesticide for the sustainable
management of white grub (Phyllophaga sp.) of ginger at
Ginger Research Programme, Salyan (1520 masl).
Experiment was arranged in RCB design with three
replications. Among the tested management practices lowest
amount of mean white grub infected rhizome yield (0.16
mt/ha) was recorded with the use of microbial pesticide
Metarhizium DN @ 1kg/ropani compared to 1.04 mt/ha white
mean grub infected rhizome yield in control plot. All the other
tested treatments produced the less than 0.81 mt/ha white grub
infected rhizome yield. The use of Furadon @1kg/ropani
produced the highest harvested mean fresh rhizome yield
(27.36 mt/ha) and retain more mean mother rhizome 92.10
mt/ha) yield. The use of other botanicals, bio-pesticides and
chemicals produced 21.02 to 23.48 mt/ha mean fresh rhizome
yield and 0.85 to 1.66 mean mother rhizome yield. From this
study the use of different Metarhizium strains @ 1 kg/ropani
in row at the time of ginger planting was found effective and
eco-friendly as with check pesticide check pesticide furadon @
1.5 kg/ropani for white grub management and fresh ginger
rhizome yield.
Key words: Ginger, White grub, Furadon, Metarhizium, ginger pest
INTRODUCTION
Ginger (Zingiber officinale Rosc.) is one of the major spice grown in Nepal and
has been popularized as commercial crop in hilly region. Its cultivation is
spreading from east to west and inner terai, foot hills to mid hills up to an
altitude of 1600 masl. In Nepal ginger is grown in an estimated area of 22132
hectares with an annual production of 297512 mt in 2018/19 (MoALD, 2019).
Nepalese Journal of Agricultural Sciences, 2021, volume 21 ISSN 2091-042X; eISSN 2091-0428
130
Insufficient number of high yielding varietal option to growers, high cost of
production, rhizome rot, white grub, rhizome fly, unstable market price etc are
the major bottle neck for ginger production in Nepal.
A total of 32 kinds of insect pests of ginger have been identified in the world but
very few of them have been reported in Nepal (CABI, 2007). Sharma et al
(1998) reported the occurrence of six diseases and five insect pests in ginger in
Nepal. Rhizome fly, shoot borer, mites, and white grub were found associated
with the rhizome rot complex of ginger (Sah et al, 2001). Sharma et al, 1998
reported that the white grubs species associated with the damage of ginger
rhizome are Phyllofaga spp. The grubs are creamy white with brown head, 'C'
shaped and found in the upper 50-100 mm layer of the soil. The grubs eat away
roots and feed on rhizomes and make holes inside them. Probably it paves the
way for the infection of fungi to develop rhizomes rot. The damage become
evident only when entire plant dries up due to feeding by grubs on roots and
rhizomes. White grub is a serious threat to the different agronomical and
horticultural crops in the in the mid and high hills of Nepal. The extent of
damage by the grubs varies with the crops. In ginger the damage ranges from 80
to 100%, 25- 50% in maize, vegetables and the late harvested potato, 20% in tea
planted in upland (Timsina, 2003). White grub and rhizome fly are becoming
emerging threats in many ginger growing area of country with the maximum
field incidence of 22.71 % and 17.8 % respectively (GRP, 2012).
White grub is a soil pest and some chemicals have been recommended for its
management. Chemical is the quick and effective means of pest control.
Gautam, 2014 reported that statistically significantly lowest number of live
white grubs (6.8/m2) at one month after germination of ginger and highly
significantly lowest amount of white grub infected rhizome yield (0.28 mt/ha)
was obtained with the use of Chloropyrifos @ 1.5 kg/ropani followed by the use
of Metarhizium anisopliae 1.15% WP (PACER) along with @ 10g/kg compost
(8.03 white grub/m2 and 0.35 mt/ha). Often excess or uncontrolled uses of
chemical pesticides have spoiled the balance of insect population. Besides
causing serious threat to the environment, resistance, resurgence and persistency
problems can also not be denied. Majority of chemical pesticides contain
harmful chemicals and toxins that not only kill the unwanted pests, but also
many beneficial insects and non target animals of the ecosystem. These
chemicals are also posing serious threat to human health. Under such scenario,
insect pest control strategies have necessitated the attention towards alternative
method of insect management that offer adequate levels of pest control with
fewer hazards. Such alternative are the use of botanicals and microbial
insecticides or their byproducts.

Nepalese Journal of Agricultural Sciences, 2021, volume 21 ISSN 2091-042X; eISSN 2091-0428
131
MATERIALS AND METHODS
A field experiment was conducted at the white grub infected field of Ginger
Research Programme, Kapurkot, Salyan during the ginger growing season of
2014/015 to 2016/017 to study the effect of different botanicals and bio-
pesticides including furadon as check chemical pesticides to minimize the white
grub infestation. The experiment had eight different treatments: 1) Timur dust @
3 kg/ropani; 2) Neem cake@ 3 kg/ropani; 3) Metarhizium PM-2 @ 1 kg/ropani;
4) Metarhizium PM-1 @ 1 kg/ropani; 5) Metarhizium DN-1 @ 1 kg/ropani; 6)
Furadon @1kg/ropani; 7) Fetera @1kg/ropani; and 8) Control. Metarhizium
strains were brought from Entomology Division, NARC, Khumaltar. All the
treatments were applied at the time of ginger planting in row and well mixed
with soil. Trial was arranged in RCBD design and each treatment replicated
thrice. Planting was done during the second week of April. Rhizome bits of 50-
60 gram size were planted in 30 cm x 30 cm spacing in a plot of 4.5 m2
during
the third week of April. FYM and fertilizers were applied @ 30 t/ha and NPK @
75: 50: 50 kg/ha, respectively. Mulching with dry leaves was done immediately
after planting. Two times weeding was done during crop season. The trial was
harvested at a time when leaves and pseudo stems became dry and fallen down
during the first week of December. The data observations like plant stand, tiller
number, plant height, fresh rhizome yield (FRY), white grub infected rhizome
yield (WGIRY), rotten rhizome yield (RRY) and mother rhizome yield (MRY)
were recorded and analyzed using MSTATC tool.
RESULTS AND DISCUSSION
The result of the efficacy of different botanicals, bio-pesticides and chemical
insecticide for the management of white grub during 2014/15 has been presented
in table 1. Mother rhizome yield was found statistically highly significant as
well as white grub infected rhizome yield showed significant result. All the
other observed traits were found statistically at par with each other. Tiller
number ranges from 6.06 – 7.46/clump and plant height varies from 68.73 –
74.53 cm. However, application of furadan@1kg/ropani was found effective for
highest fresh rhizome yield (16.81 mt/ha) followed by Metarhizium DN-
1@1kg/ropani (15.83 mt/ha) and Timur dust @3kg/ropani (15.20 mt/ha). The
significantly lowest amount of white grub infected rhizome yield was found on
Metarhizium DN@1kg/ropani (0.24 mt/ha) followed by Timur dust
@3kg/ropani (0.41 mt/ha). The used of furadan@1kg/ropani retained highest
mother rhizome yield (1.11 mt/ha) which was due to the less damage of mother
rhizome by white grub.
The result of the efficacy of different botanicals, bio-pesticides and chemical
insecticide for the management of white grub during 2015/16 has been presented
Nepalese Journal of Agricultural Sciences, 2021, volume 21 ISSN 2091-042X; eISSN 2091-0428
132
in table 2. Fresh rhizome yield, white grub infected rhizome yield, rotten
rhizome yield and mother rhizome yield were found statistically highly
significant. All the other yield attributing traits were found statistically at par
with each other. Tiller number ranges from 7.66 – 9.53/clump and plant height
varies from 70.33 – 86.13 cm.
Table 1. Evaluation of different botanicals, bio-pesticides and chemical
pesticide for the management of White grub in ginger at GRP, 2014 /15
NS – Not significant * – Significant ** – Highly significant
Note: 20 Ropani= 1 hectare
The application of furadan@1kg/ha was found effective for highest fresh (42.50
mt/ha) as well as mother rhizome yield (3.61 mt/ha) followed by the application
of Fetera @ 1kg/ha for fresh rhizome yield (37.63 mt/ha) and Neem cake @
3kg/ropani (37.50 mt/ha). No any white grub infected rhizome yield was found on
Furadan @1kg/ha.
Metarhizium DN@1kg/ropani produced the lowest (0.06 mt/ha) white grub
infected rhizome yield and satisfactory fresh rhizome yield (31.66 mt/ha). The use
of Timur dust @ 3 kg/ropani was found effective from the diseased management
S.N Treatment Plant
stand/
m2
Tiller
/clum
p
Plant
height,
cm
Ginger rhizome yield, mt/ha
FRY WGIR
Y
RRY MRY
1 Neem
cake@3kg/ropani
6.66 6.40 74.53 14.7
9
0.90 0.97 0.97
2 Fetera@1kg/ropani 5.76 6.53 71.66 14.9
0
1.11 0.48 0.97
3 Furadan@1
kg/ropani
6.31 6.86 71.26 16.8
1
0.69 0.48 1.11
4 Timur dust
@3kg/ropani
6.25 7.40 69.00 15.2
0
0.41 0.62 0.83
5 Metarhizium
DN@1kg/ropani
6.18 7.46 71.66 15.8
3
0.24 0.69 0.76
6 Metarhizium PM-
1@1kg/ropani
5.41 6.40 68.80 9.58 0.52 0.83 0.27
7 Metarhizium PM-2
@1kg/ropani
6.18 7.73 68.73 14.0
2
1.31 0.55 0.62
8 Control 6.45 6.06 69.80 13.7
5
1.02 0.69 0.48
CV % 10.17 16.75 8.10 22.9
3
47.89 55.1
1
27.40
P value NS NS NS NS * NS **
LSD (p=0.05) 0.655 0.362
Nepalese Journal of Agricultural Sciences, 2021, volume 21 ISSN 2091-042X; eISSN 2091-0428
133
(0.05 mt/ha rotton rhizome yield and 35.13 mt/ha fresh rhizome yield) point of
view. Bio – pesticide Metarhizium anisopliae would be the possibly best
alternative pest control on insect killing fungus as a means of soil pest control.
Table 2: Evaluation of different botanicals, bio-pesticides and chemical
pesticide for the management of White grub in ginger at GRP, 2015 /16
Treatment Plant
stand/m2
Tiller
/clump
Plant
height,
cm
Ginger Rhizome Yield, mt/ha
FRY WGIRY RRY MRY
Neem
cake@3kg/ropani
7.91 7.66 78.46 37.50 0.69 1.11 2.91
Fetera@1kg/ha 8.05 7.66 70.33 37.63 0.12 1.38 1.87
Furadan@1 kg/ha 8.12 8.60 85.00 42.50 0.00 0.48 3.61
Timur dust
@3kg/ropani
8.12 8.00 81.46 35.13 0.43 0.05 2.08
Metarhizium
DN@1kg/ropani
8.05 8.20 86.13 31.66 0.06 0.13 0.97
Metarhizium PM-
1@1kg/ropani
7.91 8.86 84.33 33.19 0.27 0.83 2.98
Metarhizium PM-2
@1kg/ropani
8.05 9.53 83.00 31.38 0.16 0.62 1.87
Control 8.19 8.53 80.46 28.19 0.97 1.97 1.11
CV % 3.17 15.05 10.27 10.36 45.05 9.06 34.63
P value NS NS NS ** ** ** **
LSD (p=0.05) 6.28 0.27 0.13 1.32
NS – Not significant * – Significant ** – Highly significant
Note: 20 Ropani= 1 hectare
The result of the efficacy of different botanicals, bio-pesticides and chemical
insecticide for the management of white grub during 2016/17 has been presented
in table 3. Fresh rhizome yield, mother rhizome yield and white grub infected
rhizome yield showed significant result. All the other observed traits were found
statistically at par with each other. Tiller number ranges from 5.53 – 7.06
tiller/clump and plant height varies from 55.60 – 71.66 cm. Application of
furadan@1kg/ropani was found effective for highest fresh rhizome yield (22.77
mt/ha) followed by Metarhizium PM-2@1kg/ropani (20.98 mt/ha) and
Metarhizium DN@1kg/ropani (20.47 mt/ha). The significantly lowest amount of
white grub infected rhizome yield was found on Metarhizium DN@1kg/ropani
(0.20 mt/ha) followed by Timur dust @3kg/ropani (0.41 mt/ha). The used of
furadan@1kg/ropani retained highest mother rhizome yield (1.58 mt/ha) which
was due to the less damage of mother rhizome by white grub.
The lowest amount of mean white grub infected rhizome yield (0.16 mt/ha) was
recorded with the use of microbial pesticide Metarhizium DN @ 1kg/ropani
Nepalese Journal of Agricultural Sciences, 2021, volume 21 ISSN 2091-042X; eISSN 2091-0428
134
compared to 1.04 mt/ha white mean grub infected rhizome yield in control plot.
All the other tested treatments produced the less than 0.81 mt/ha white grub
infected rhizome yield. The used of Furadon @1kg/ropani produced the highest
harvested mean fresh rhizome yield (27.36 mt/ha) and retain more mean mother
rhizome 92.10 mt/ha) yield.
Table 3. Evaluation of different botanicals, bio-pesticides and chemical
pesticide for the management of White grub in ginger at GRP, 2016 /17
NS – Not significant * – Significant ** – Highly significant
Note: 20 Ropani= 1 hectare
Three years combined results for the efficacy of different botanicals, bio-
pesticides and chemical insecticide for the management of white grub during
2014/15 to 2016/17 has been presented in table 4. Mean tiller number ranged
from 6.61 tillers/clump in TN2- Fetera @1kg/ ropani to 7.59 tillers/clump in the
TN7-Metarhizium PM- 2 @ 1kg/ropani of land. Similarly, mean plant height
varies from 66.33 cm in used of Fetera @1kg/ ropani to 75.97 cm in Furadon
@1kg/ropani.
The used of other botanicals, bio-pesticides and chemicals produced the 21.02 to
23.48 mt/ha mean fresh rhizome yield and 0.85 to 1.66 mean mother rhizome
yield. However, Timur dust 3kg /ropani was found effective for minimizing the
T.N Treatment Plant
stand/
m2
Tiller
/clump
Plant
height,
cm
Ginger Rhizome Yield, mt/ha
FRY WGIRY DRY MRY
1 Neem
cake@3kg/ropani
6.58 6.40 65.93 12.57 0.86 1.13 1.11
2 Fetera@1kg/ropani 7.49 5.66 57.00 17.92 1.16 0.57 1.24
3 Furadan@1
kg/ropani
8.64 7.06 71.66 22.77 0.57 0.59 1.58
4 Timur dust
@3kg/ropani
7.81 7.06 55.60 19.97 0.41 0.60 0.98
5 Metarhizium
DN@1kg/ropani
7.57 6.46 63.86 20.47 0.20 0.76 0.82
6 Metarhizium PM-
1@1kg/ropani
7.07 5.86 57.06 20.30 0.48 0.85 0.38
7 Metarhizium PM-2
@1kg/ropani
7.73 5.53 60.00 20.98 0.44 0.53 0.56
8 Control 7.65 5.93 55.60 16.68 1.14 0.68 0.40
CV % 14.42 17.93 21.29 36.89 56.21 46.3
3
31.14
P value NS NS NS * * NS *
LSD (p=0.05) 4.159 0.597 0.461
Nepalese Journal of Agricultural Sciences, 2021, volume 21 ISSN 2091-042X; eISSN 2091-0428
135
rotten rhizome yield (0.42 mt/ha rotten rhizome yield compared to 1.11 mean
rotten rhizome yield in control plot). Metarhizium anisopliae would be the
possibly best alternative pest control on insect killing fungus as a means of soil
pest control (GC, 2006).
Table 4. Over all (mean) effect of different treatments on management of
White grub in ginger at GRP during 2014/015 to 2016/017
Treatment
Mean
Plant
stand/
m2
Mean
Tiller/
clump
Mean
Plant
height
(cm)
Mean ginger rhizome yield, mt/ha
Fresh White
grub
infected
Rotten Mother
Timur dust 3kg
/ropani 7.39 7.48 68.68 23.43 0.41 0.42 1.29
Neem cake @ 3kg
/ropani
7.05 6.82 72.97 21.62 0.81 1.07 1.66
Metarhizium PM-
2@1kg/ropani
7.32 7.59 70.57 22.12 0.63 0.56 1.01
Metarhizium PM -
1@1kg/ropani
6.79 7.04 70.06 21.02 0.42 0.83 1.21
Metarhizium
DN@1kg/ropani
7.26 7.37 73.88 22.65 0.16 0.52 0.85
Furadon
@1kg/ropani
7.69 7.50 75.97 27.36 0.42 0.51 2.10
Fetera
@1kg/ropani
7.10 6.61 66.33 23.48 0.79 0.81 1.36
Control 7.43 6.84 68.62 19.54 1.04 1.11 0.66
In Nepal, microbial control is entirely a new approach however, attribute
making the fungi as ideal biological insecticide is due to broad host range, high
virulence, safety to non-target organisms, compatibility with some pesticide,
ease of production with local materials and application without using costly
equipment (GC, 2009). The use of furadon is banded since last year and its
alternative is necessary for pest management. The use of Metarhizium
anisopliae 1.15% WP (PACER) @ 10 g/kg compost was equally effective and
eco-friendly as with check pesticide (chloropyrifos) @ 1.5 kg/ropani for white
grub management in ginger (Gautam, 2014). The use of different Metarhizium
strains @ 1 kg/ropani in row at the time of ginger planting was found effective
for white grub management.
CONCLUSION
This study revealed that the use of different Metarhizium strains @ 1 kg/ropani
in row at the time of ginger planting was found effective and comparable with
check pesticide Furadon for white grub management and fresh ginger rhizome
yield. Other tested bio-chemicals were found not effective to control white grub
Nepalese Journal of Agricultural Sciences, 2021, volume 21 ISSN 2091-042X; eISSN 2091-0428
136
in ginger. Metarhizium @ 1kg/ha could be the best method to manage white
grub pest in ginger.
ACKNOWLEDGEMENT
The author sincerely acknowledges Mr. Bandhu Raj Baral., the Co-ordinator of
Ginger Research Program, Kapurkot, Salyan for his valuable support in
preparing this article. The author is also grateful to the staffs of GRP, Salyan for
the smooth running of the experiment. Professor Dr. Durga Mani Gautam is also
thankful for his valuable comments and suggestions.
REFERENCES CABI. (2007) Crop protection compendium. Wallingford, UK: CAB International.
Gautam J. (2014) Development of ecofriendly technology for the management of white
grub (Phyllophaga sp) pest in ginger. Nepalese Journal of Agricultural
Sciences, 12, 124-128.
GC, YD. (2006) White grub (Coleopter: scababaeidae) associated with Nepalese
agriculture and their control with indigenous entomopathogenic fungus
(Metarhizium anisopliae). Sorokin. PhD Thesis. University of Basel.
Swizerland. Pp 250.
GC, YD. (2009) Microbial control of white grub in Nepal: The way foreward. The
journal of agriculture and environment Vol: 10.
GRP. (2012) Annual technical report 2011/2012. National Ginger Research Program
(NGRP), Kapurkot, Salyan, Nepal.
MoALD. (2019) Statistical information on Nepalese agriculture 2018/19. Ministry of
agriculture development, Singhdurbar, Kathmandu, Nepal.
Sah, DN, Malla, S and Pokharel, D. (2001) Integrated management of rhizome rot disease
of ginger in the hills of Nepal. Journal of Lumle technical paper. Agriculture
Research Station Lumle, Pokhara, Nepal.
Sharma, BP, Shrestha, SK and Giri,Y.P. (1998) Present status of diseases and insect pests
of ginger in Nepal. In: Proceedings of the second national horticulture
research workshop on 13-15 May 1998, Khumaltar, Lalitpur, Nepal. Nepal
Agriculture Research Council (NARC). Pp. 173-178.
Timsina. (2003) Verification and validation of biological control technology of white
grubs in the eastern hills of Nepal 2009. In: annual technical report of
agriculture research station, Pakhribas, Dhankuta for the year 2008/2009.
Nepal Agriculture Research Council (NARC), Khumaltar, Lalitpur, Nepal. P.
78.
Nepalese Journal of Agricultural Sciences, 2021, volume 21 ISSN 2091-042X; eISSN 2091-0428
137
Aphid monitoring using yellow and blue sticky trap in
sweet pepper field
Aashish Shrestha and Sundar Tiwari
Department of Entomology, Faculty of Agriculture, AFU, Chitwan, Nepal
Corresponding Author: [email protected]
ABSTRACT
Sweet pepper (Capsicum annuum) is high-valued commercial
crops grown for spice, and vegetable purposes. Production,
productivity and product quality are influenced by biotic
factors such as insect pest and diseases. Sucking pests like
aphids, whiteflies, thrips, mites, etc. are the major insect pest
in sweet pepper fields. Pesticide spray practices do not
coincide with the timing of the peak population of aphids and
other sucking pests. Similarly, farmers don't have an idea of
the type of sticky trap use. Hence, a study was performed to
know the population dynamics, especially to assess the peak
aphid (Myzus persicae) population and the efficient type of
traps used. This field study was conducted in three different
locations of Bharatpur-23, Chitwan from Oct 2019 to Jan
2020. Yellow and blue sticky traps of equal size were installed
in three different places in the Capsicum field for 24 hours to
record the captured aphid population. Data were analyzed by
using paired sample t-test and correlation analysis with the
help of SPSS (Statistical Package of the Social Sciences), a
data analysis programme. The result showed that the aphid
population was highest (11.69) in January month, and these
aphid populations was negatively correlated to the
temperatures, and positively correlated to the relative
humidity and rainfall. The yellow sticky trap was significantly
more effective than the blue sticky trap. These findings are
helpful to make a pesticide spray calendar over a year and
help to use an efficient management tools in sweet pepper
fields.
Keywords: Aphid, sweet pepper Capsicum, monitoring, sticky traps
INTRODUCTION
Aphids are a well-known serious pest in agriculture with a wide range of host
plant selection. Approximately 4000 species of aphids have been described,
feeding over 250 agricultural and horticultural crops throughout the world
(Blackman & Eastop, 2000). They are polyphagous with a huge potential to
Nepalese Journal of Agricultural Sciences, 2021, volume 21 ISSN 2091-042X; eISSN 2091-0428
138
damage young and succulent plant parts. They can also transmit more than one
hundred and fifty viral diseases in different host crops particularly in
solanaceous vegetables (Cloyd & Sadof, 1998). Sweet pepper (Capsicum
annuum L.) tomato, potato and tobacco are the important vegetable crops
belonging to the family Solanaceae (Dias et al., 2013). Among various
production constraints, sucking insects significantly decreases both the
production and quality of Capsicum fruit. Of which, aphids (Myzus persicae
Sulzer, Aphis gossypi Glover), are the most dominant sucking pests in capsicum
fields (Berke & Sheih, 2000).
Effective pest population monitoring is crucial for evaluating pest effects on
host plants and implementing insect control measures on time (Gillespie &
Quiring, 1987). Pesticides are getting wastage and farmers investing more
money in vegetable production due to the lack of awareness of peak pest
incidence and their damage threshold level. Sticky traps are used as a one
effective IPM strategy for different insect pests in most parts of the world. They
provide an easy method for the estimation of pest population density. So, sticky
traps are effective for aphid management, but farmers are unaware of the type of
trap use in Nepal. Hence, this study was purposed to know the peak aphid
population in Chitwan and other geographically similar districts of Nepal.
Similarly, selection of suitable and efficient monitoring tools (yellow or blue
sticky traps) can enhance the aphid management skill in sweet pepper fields.
MATERIALS AND METHODS
Study site and experimental setup
The study was carried out in Bharatpur-23 (latitude of 270 33' North; longitude
840 19' East) Chitwan, from Oct 2019 to Jan 2020. Aphid monitoring was
performed in three different locations of Chitwan, located 200 m apart.
Seedlings were raised in a plastic tray (520×280×45 mm) and ready to transplant
forty days after sowing. Fifty healthy seedlings were transplanted in the main
field maintaining 60 cm row to row and 45 cm plant to plant distance. Chemical
fertilizers viz. Nitrogen, Phosphorus and Potassic fertilizers were applied at the
rate of 70:50:40 kg/ha (AITC, 2019). Half dose of nitrogen and a full dose of
phosphorus and potassium were applied at basal dose while the remaining half
dose of nitrogen was applied in two split doses as a side dressing. Various
intercultural operations like earthing up, gap filling, weeding, irrigation was
done when necessary. Insecticides were not used throughout the study period.
The yellow and blue sticky traps of size 8.5×6.0 inches were used for
monitoring of aphid. Both yellow and blue sticky traps were installed at the
center of the field. Three replications of traps were allotted for each field. Traps
were left on the field for 24 hours.
Nepalese Journal of Agricultural Sciences, 2021, volume 21 ISSN 2091-042X; eISSN 2091-0428
139
Data collection and analysis
The sticky traps were removed after 24 hours and aphids (winged) collected in
both yellow and blue sticky traps were counted with the help of a hand lens
(10×). The data were collected at 15 days interval and continued for 90 days.
Traps were replaced after each reading.
The recorded data were entered in MS-Excel and the average population of
insect was used for statistical analysis. After testing the population distribution,
abnormal data were normalized by squar- root transformation. A paired-sample
t-test was used to compare the two population means of aphid captured in
yellow and blue sticky traps. The meteorological data viz. maximum-minimum
temperature, relative humidity (RH) and rainfall were also subjected to
statistical analysis and correlation coefficient was computed using SPSS
software to study the effect of various weather parameters on aphid population
in the capsicum field.
RESULTS AND DISCUSSIONS
Yellow sticky trap monitoring
Aphid population was recorded at 15 days interval in the yellow sticky trap from
16 October 2019 to 15 January 2020 to study the incidence of aphid population
in the different growing period. The result showed that the aphid population was
recorded the lowest (8.02) in October month and the highest (11.69) in January
month.
The correlation study was done with the environmental parameters viz.
maximum-minimum temperature, relative humidity and rainfall. Significant
negative correlation was found with maximum temperature (r = - 0.84) and
minimum temperature (r = - 0.75) while positive correlation was found in
relative humidity (r = 0.42) and rainfall (r = 0.77). The results demonstrated that
the aphid population was increased as the temperature decrease but this
population was increased with increasing relative humidity and rainfall (Table
1). Satar et al. (2008) reported that the optimum temperature for M. persicae
population growth was 25.0°C. The total nymphal mortality rates were found
highest at 30.0°C as compared with low temperatures. At higher temperatures,
survival rates of adults M. persicae dropped significantly following the peak of
nymph production, but between 15.0 °C and 27.5 °C, a rather extended post-
reproductive period was observed. M. persicae thrived well in cold
environments, and was able to colonize pepper plants in greenhouses through
the winter and spring (Satar et al., 2008). The study showed that the aphid
population was highest during the cool and humid weather condition. As per the
weather report, the maximum and minimum temperature decreased from Oct
2019 to Jan 2020 and the aphid population was found to increase from 8.02 in
Oct 16, 2019 and become maximum (11.69) during Jan 1, 2020. The present
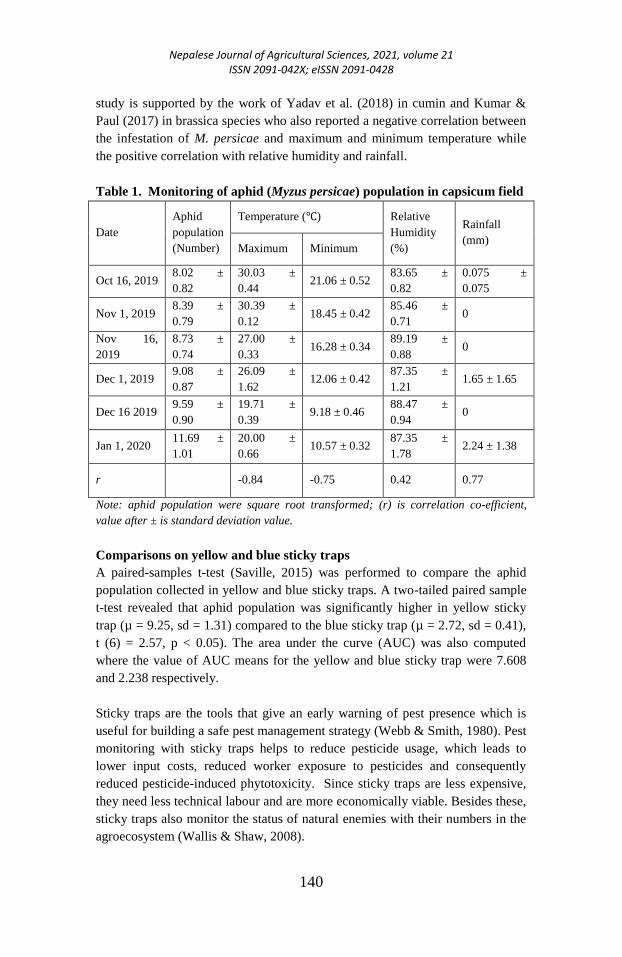
Nepalese Journal of Agricultural Sciences, 2021, volume 21 ISSN 2091-042X; eISSN 2091-0428
140
study is supported by the work of Yadav et al. (2018) in cumin and Kumar &
Paul (2017) in brassica species who also reported a negative correlation between
the infestation of M. persicae and maximum and minimum temperature while
the positive correlation with relative humidity and rainfall.
Table 1. Monitoring of aphid (Myzus persicae) population in capsicum field
Date
Aphid
population
(Number)
Temperature (℃) Relative
Humidity
(%)
Rainfall
(mm) Maximum Minimum
Oct 16, 2019 8.02 ±
0.82
30.03 ±
0.44 21.06 ± 0.52
83.65 ±
0.82
0.075 ±
0.075
Nov 1, 2019 8.39 ±
0.79
30.39 ±
0.12 18.45 ± 0.42
85.46 ±
0.71 0
Nov 16,
2019
8.73 ±
0.74
27.00 ±
0.33 16.28 ± 0.34
89.19 ±
0.88 0
Dec 1, 2019 9.08 ±
0.87
26.09 ±
1.62 12.06 ± 0.42
87.35 ±
1.21 1.65 ± 1.65
Dec 16 2019 9.59 ±
0.90
19.71 ±
0.39 9.18 ± 0.46
88.47 ±
0.94 0
Jan 1, 2020 11.69 ±
1.01
20.00 ±
0.66 10.57 ± 0.32
87.35 ±
1.78 2.24 ± 1.38
r -0.84 -0.75 0.42 0.77
Note: aphid population were square root transformed; (r) is correlation co-efficient,
value after ± is standard deviation value.
Comparisons on yellow and blue sticky traps
A paired-samples t-test (Saville, 2015) was performed to compare the aphid
population collected in yellow and blue sticky traps. A two-tailed paired sample
t-test revealed that aphid population was significantly higher in yellow sticky
trap (µ = 9.25, sd = 1.31) compared to the blue sticky trap (µ = 2.72, sd = 0.41),
t (6) = 2.57, p < 0.05). The area under the curve (AUC) was also computed
where the value of AUC means for the yellow and blue sticky trap were 7.608
and 2.238 respectively.
Sticky traps are the tools that give an early warning of pest presence which is
useful for building a safe pest management strategy (Webb & Smith, 1980). Pest
monitoring with sticky traps helps to reduce pesticide usage, which leads to
lower input costs, reduced worker exposure to pesticides and consequently
reduced pesticide-induced phytotoxicity. Since sticky traps are less expensive,
they need less technical labour and are more economically viable. Besides these,
sticky traps also monitor the status of natural enemies with their numbers in the
agroecosystem (Wallis & Shaw, 2008).
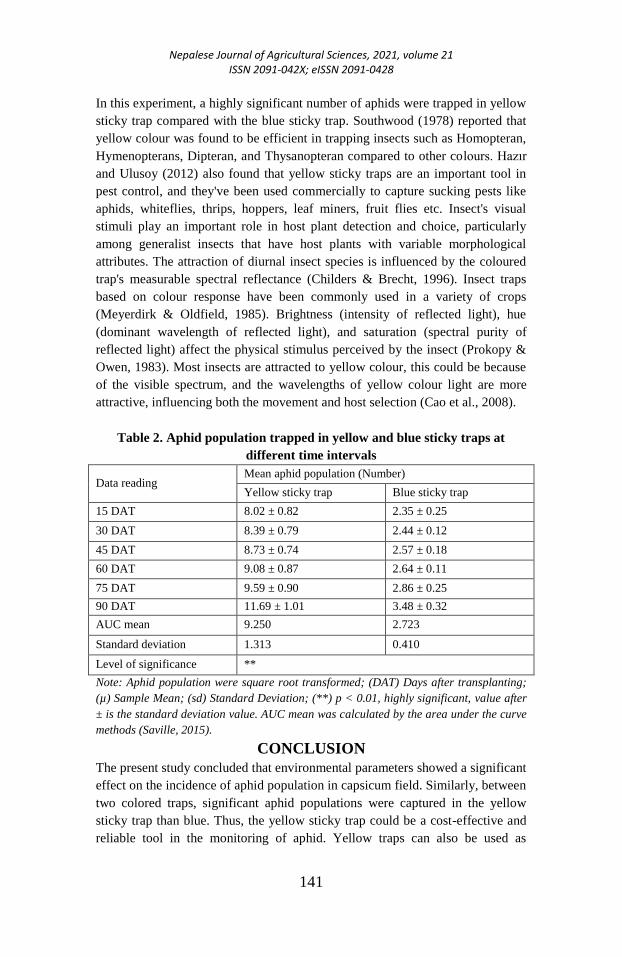
Nepalese Journal of Agricultural Sciences, 2021, volume 21 ISSN 2091-042X; eISSN 2091-0428
141
In this experiment, a highly significant number of aphids were trapped in yellow
sticky trap compared with the blue sticky trap. Southwood (1978) reported that
yellow colour was found to be efficient in trapping insects such as Homopteran,
Hymenopterans, Dipteran, and Thysanopteran compared to other colours. Hazır
and Ulusoy (2012) also found that yellow sticky traps are an important tool in
pest control, and they've been used commercially to capture sucking pests like
aphids, whiteflies, thrips, hoppers, leaf miners, fruit flies etc. Insect's visual
stimuli play an important role in host plant detection and choice, particularly
among generalist insects that have host plants with variable morphological
attributes. The attraction of diurnal insect species is influenced by the coloured
trap's measurable spectral reflectance (Childers & Brecht, 1996). Insect traps
based on colour response have been commonly used in a variety of crops
(Meyerdirk & Oldfield, 1985). Brightness (intensity of reflected light), hue
(dominant wavelength of reflected light), and saturation (spectral purity of
reflected light) affect the physical stimulus perceived by the insect (Prokopy &
Owen, 1983). Most insects are attracted to yellow colour, this could be because
of the visible spectrum, and the wavelengths of yellow colour light are more
attractive, influencing both the movement and host selection (Cao et al., 2008).
Table 2. Aphid population trapped in yellow and blue sticky traps at
different time intervals
Data reading Mean aphid population (Number)
Yellow sticky trap Blue sticky trap
15 DAT 8.02 ± 0.82 2.35 ± 0.25
30 DAT 8.39 ± 0.79 2.44 ± 0.12
45 DAT 8.73 ± 0.74 2.57 ± 0.18
60 DAT 9.08 ± 0.87 2.64 ± 0.11
75 DAT 9.59 ± 0.90 2.86 ± 0.25
90 DAT 11.69 ± 1.01 3.48 ± 0.32
AUC mean 9.250 2.723
Standard deviation 1.313 0.410
Level of significance **
Note: Aphid population were square root transformed; (DAT) Days after transplanting;
(µ) Sample Mean; (sd) Standard Deviation; (**) p < 0.01, highly significant, value after
± is the standard deviation value. AUC mean was calculated by the area under the curve
methods (Saville, 2015).
CONCLUSION
The present study concluded that environmental parameters showed a significant
effect on the incidence of aphid population in capsicum field. Similarly, between
two colored traps, significant aphid populations were captured in the yellow
sticky trap than blue. Thus, the yellow sticky trap could be a cost-effective and
reliable tool in the monitoring of aphid. Yellow traps can also be used as
Nepalese Journal of Agricultural Sciences, 2021, volume 21 ISSN 2091-042X; eISSN 2091-0428
142
management tools in crop early stages. Moreover, the yellow sticky trap could
be used as one of the eco-friendly pest management tools in IPM and organic
farming, as it significantly captures a wide range of alate (winged) insects other
than aphids.
ACKNOWLEDGEMENTS
The authors are grateful to the Department of Entomology, Faculty of
Agriculture, Agriculture and Forestry University, Bharatpur, Chitwan, Nepal for
providing necessary requirements and all the helping hands during the course of
research period.
REFERENCES Agriculture Information and Training Center, (2019). Krishi diary. AITC, DoA,
MoALD, 193 pp.
Berke, T., & Sheih, S.C. (2000). Chilli peppers in Asia. Capsicum and Egg Plant Newsl,
19: 38-41.
Blackman, R.L., & Eastop, V.F. (2000). Aphids on the World's Crops: An Identification
Guide, 2nd ed n. Wiley-Interscience.
Cao, F.Q., Liu, W.X., Wan, F.H., & Cheng, L.S. (2008). Behavior Selection of Bemisia
tabaci B-Biotype to Different Host Plants and Colors. Chinese Bulletin of
Entomology, 45, 431–436.
Childers, C.C., & Brecht, J.K. (1996). Coloured sticky traps for monitoring
Frankliniella bispinosa (Morgan) (Thysanoptera: Thripidae) during flowering
cycles in citrus. Journal of Economic Entomology, 89: 1240– 1249.
Cloyd, R.A., & Sadof, C.S. (1998). Aphids: Biology and Management. Floriculture
Indiana, 12: 3-7.
Dias, G.B., Gomes, V.M., Moraes, T.M.S., Zottich, U.P., Rabelo, G.R., Carvalho, A.O.,
Moulin, M., Goncalves, L.S.A., Rodrigues, R. & da Cunha, M. (2013).
Characterization of Capsicum species using anatomical and molecular data.
Genetics and Molecular Research, 4(2): 1-14.
Gillespie, D.R., & Quiring, D., (1987) Yellow sticky traps for detecting and monitoring
greenhouse whitefly (Homoptera: Aleyrodidae) adults on greenhouse tomato
crop. Journal of Economic Entomology, 80: 675–679.
Hazır, A., & Ulusoy, M.R. (2012) Population fluctuation of thrips species
(Thysanoptera: Thripidae) in nectarine orchards and damage levels in east
Mediterranean region of Turkey. Journal of the Entomological Research
Society, 14: 41–52.
Kumar, J., & Paul, B., (2018) Population dynamics of aphid, Myzus persicae (Sulzer)
(Hemiptera: Aphididae) on different Brassica species, Agricultural Science
Digest, 37:64-67.
Meyerdirk, D.E., & Oldfield, G., (1985) Evaluation of trap color and height placement
for monitoring Circulifer tenellus (Baker) (Homoptera: Cicadellidae). The
Canadian Entomologist, 117: 505–511.
Prokopy, R.J., & Owen, E.D., (1983) Visual detection of plants by hervivorous insects.
Annual Review of Entomology, 28:337-364.
Satar, S., Kersting, U., & Uygun, N., (2008) Effect of temperature on population
parameters of Aphis gossypii and Myzus persicae on pepper, Journal of Plant
Nepalese Journal of Agricultural Sciences, 2021, volume 21 ISSN 2091-042X; eISSN 2091-0428
143
Diseases and Protection, 115(2), 69–74, ISSN 1861-3829. © Eugen Ulmer
KG, Stuttgart
Saville, D.J., (2015) Multiple comparisons procedures- Cutting the Gordian knot.
Agronomy Journal, 107, 730-735
Southwood, T.R.E., (1978) Ecological methods with particular reference to the study of
insect populations. 2nd Edition. London, UK: Chapman and Hall.
Wallis, D.R., & Shaw, P.W., (2008) Evaluation of coloured sticky traps for monitoring
beneficial insects in apple orchards. New Zealand Plant Protect, 61:328–332.
Webb, R.E., & Smith, F.F., (1980) Greenhouse whitefly control of an integrated
regimen based on adult trapping and nymphal parasitism. IOBC/ WPRS
Bulletin, 3(3), 235- 246
Yadav, T., Acharya V.S., Ramawtar, Y., & Singh, V., (2018) Seasonal incidence of
aphid, Myzus persicae (Sulzer) on cumin, Cuminum cyminum linn, Journal of
Pharmacognosy and Phytochemistry, 7(1): 1084-1086

Nepalese Journal of Agricultural Sciences, 2021, volume 21 ISSN 2091-042X; eISSN 2091-0428
144
Postharvest vase life of gerbera under different
chemical treatments
Dipti Kandel1*
, Padma Nath Atreya2
Sujata Poudel3
1 Himalayan College of Agricultural Sciences and Technology, Kathmandu
2 Temperate Horticulture Development Centre, Marpha, Mustang
3National Horticulture Research Centre, Khumaltar, Kathmandu
*Corresponding Author: [email protected]
ABSTRACT
An experiment was conducted at National Horticulture
Research Centre from 15th
December, 2020 to 29th
December,
2020 to find the best concentration of citric acid and salicylic
acid each of 200 ppm with 3% sucrose that enhances and
prolongs the flower quality and longevity. The experiment was
laid out in a completely randomized design (CRD) with seven
treatments and three replications. Among all the treatments,
the vase solution of 4% sucrose with 200 ppm citric acid was
found the best for the longest vase life. Thus this combination
can be used as a potential vase solution for commercial cut
flower preservative solution for delaying flower senescence,
enhancing post-harvest quality and prolonging the vase life of
cut gerbera flowers.
Keywords: Gerbera, vase life, citric acid, sucrose, cut flower
INTRODUCTION
Gerbera (Gerbera jamesonii), also known as Transvaal daisy or Barbetron daisy
is a member of the composite family (Dole & Wilkins, 1999). It occupies a
prominent position among the most popular commercial cut flowers in the
world, and according to the global trends in floriculture; it comes at the fourth
place among cut flowers (Khanal et al., 2018). They are attractive flowers and
are available in a wide range of colors such as yellow, orange, pink, crimson,
red, purple and white (De Silva, Kirthisinghe & Alwis, 2013).
Vase life is one of the quality traits as it represents the amount of time spent and
the conditions that flowers experience while in transit from farm to end user.
The longevity of cut flowers is one of the main challenges of the floriculture
industry (Marandi et al., 2011). Keeping quality of cut flower is an important
parameter for the evaluation of cut flower quality, for both domestic and
international markets (Sacalis & John, 1993). Thus, the techniques of prolonging

Nepalese Journal of Agricultural Sciences, 2021, volume 21 ISSN 2091-042X; eISSN 2091-0428
145
the vase-life of cut flowers have to be given special attention as they play a great
role for growers, traders and final users (Hashemabadi et al., 2016).
Gerbera has short vase life and is sensitive to microbial contamination at the
stem end and in the preservative solution (Balestra et al., 2005; Liu et al., 2009).
Senescence of cut flowers is induced by several factors, e.g., water stress micro-
organisms and ethylene effects (Han & Miller, 2003). Microbial contamination
causes stem end blockage, imbalance between water uptake and water loss and
finally wilting and shortening vase life (Balestra et al., 2005). Short postharvest
vase life is one of the most important problems of the cut flowers. However, the
longevity of vase life is an important factor for consumer preference (Kader,
2003).
Most of the stakeholders do not apply chemical preservatives during the
postharvest life so there is a large postharvest loss. Hence, this experiment was
designed to assess the effects of different concentrations of sucrose, citric acid
and salicylic acid on vase life of gerbera and find out optimum concentration of
them which enhances and prolongs vase life.
MATERIALS AND METHODS
Plant material, study area and duration
A fully mature gerbera with its ray floret perpendicular to the stalk and pollen
just started to form were harvested from plants grown in the Uday decor farm in
Dadhikot, Bhaktapur. A quick sugar pulsing with a 16% sucrose solution was
given to the flowers for 15 min. They were immediately kept in buckets and
transported to the National Horticulture Research Centre (NHRC), Lalitpur
where research was conducted. The flower stems were covered with a paper to
minimize moisture loss during transportation. The flowers with uniform size,
color and free from pest and disease infestation were selected. The study was
conducted from 15 December, 2020 to 29 December, 2020.
Experimental design and treatments
The experiment was conducted in a completely randomized design (CRD) with
seven treatments and three replications. The treatments were tap water (control),
distilled water, distilled water+ 4% sucrose, 200ppm salicylic acid, 200ppm
citric acid, 200ppm salicylic acid + 4% sucrose solution and 200ppm citric acid
+ 4% sucrose. Flowers were kept in a 300 ml conical flask containing respective
treatment solution of 300ml. Each flask contained 2 sticks of gerbera flower
with uniform stem length. Top of the flask was wrapped with aluminum foil
after placing the flower in the conical flask as it helps to prevent the evaporation
loss. The flowers were kept in a vase life (controlled environment) room under
Nepalese Journal of Agricultural Sciences, 2021, volume 21 ISSN 2091-042X; eISSN 2091-0428
146
the following conditions: temperature of 13.9-15.2℃ and relative humidity of
52-60%.
Data recording
The following data were recorded: solution uptake (g), weight gain or loss (g),
flower diameter, stems diameter, flower freshness, flower discoloration and vase
life (days). All the data were observed and recorded in one day of interval.
Data analysis
The observational data were recorded and entered into MS-Excel-7. The
analysis of variance was done using Genstat. The mean was subjected to Post-
Hoc analysis by DMRT (Duncan’s Multiple Range Test) with 5% level of
significance.
RESULTS AND DISCUSSION
Solution uptake
Solution uptake was found significantly different (p<0.5) among the different
treatments. Highest uptake was found with 200 ppm Citric acid + 4%Sucrose
(30.33 ml) followed by 200 ppm Salicylic acid + 4%Sucrose (20.00ml). Least
solution uptake was found in Tap water (1.67ml). Similar reports was found in
different preservative solutions among which the solution uptake showed better
in citric acid + sucrose (4.22 ml/day) followed by salicylic acid + sucrose (3.66
ml/day) (Khanal et al., 2018). Mehdikhah and his co-workers (2016) found the
most effective treatment on vase solution uptake was 100 mg l-1 citric acid than
the salicylic acid and ascorbic acid.
Table 1. Effect of different treatments on Solution uptake
Treatments Day 3 Day 5 Day 7 Day 9 Day 11 Day 13 Day 15
Tap water 3.33e 2.33f 1.67f
Distilled water 4.67de 4.33ef 3.336f 2.33e
Distilled water + 4%
sucrose
6.33de 7.33de 7.33de 5.67de
200 ppm Salicylic acid 8.00cd 9.67d 11.00cd 11.33cd 7.67c
200 ppm Citric acid 11.00c 13.67c 14.67c 15.33bc 12.67b 9.00c
200 ppm Salicylic+ 4%
sucrose
15.33b 17.67b 20.00b 20.00b 17.33b 14.67b 12.00b
200 ppm Citric+ 4%
sucrose
22.67a 27.33a 29.33a 30.33a 27.33a 22.67a 18.33a
F value 28.27 57.50 45.03 52.19 33.24 20.53 36.10
P value 0.001 0.001 0.001 0.001 0.001 0.002 0.004
LSD (0.05) 3.897 3.460 4.424 4.337 4.738 5.244 2.927
CV% 21.8 16.8 20.2 17.2 15.5 17 8.3
SEM 1.285 1.141 1.458 1.408 1.453 1.515 0.745
Grand mean 10.19 11.76 12.48 14.17 16.25 15.44 15.17
Nepalese Journal of Agricultural Sciences, 2021, volume 21 ISSN 2091-042X; eISSN 2091-0428
147
Flower diameter
Treatment 200 ppm Citric acid + 4% Sucrose found highest flower diameter
(85.77mm) followed by 200ppmSalicylic acid +4% Sucrose (75.75 mm) and
least diameter was recorded in treatment Tap water solution (54.03 mm).
However, (Chaudhary & Khanal, 2018) found that maximum flower diameter in
distilled water + 6% sucrose than other treatments. Jamshidi, Hadavi & Naderi
(2012) revealed that maximum diameter in salicyclic acid than other treatments.
According to (Krishnamoorthy, 2021) results indicated that the treatment Citric
acid has highest diameter followed by Sucrose.
Table 2. Effect of different treatment on flower diameter
Treatments Day 1 Day 3 Day 5 Day 7 Day 9 Day 11 Day 13 Day 15
Tap water 63.27b 56.91d 55.83e 54.03f
Distilled water 64.85b 65.98c 61.11d 58.08ef 57.02e
Distilled water + 4%
sucrose
67.54ab 67.54c 67.63c 66.73cd 62.32d
200 ppm Salicylic
acid
67.67ab 68.48c 66.05cd 63.30de 62.78d 60.48a
200 ppm Citric acid 74.34a 75.64b 74.08b 72.53bc 69.72c 66.85b 64.29c
200 ppm Salicylic+
4% sucrose
69.34ab 74.30b 76.47b 77.75b 76.63b 72.34b 70.06b 65.95a
200 ppm Citric+ 4%
sucrose
69.43ab 81.75a 85.36a 85.77a 85.04a 83.07a
79.81a 75.08a
F value 2.98 18.99 36.12 31.39 44.36 67.57 48.21 26.45
P value 0.043 0.001 0.001 0.001 0.001 0.001 0.001 0.007
LSD (0.05) 6.277 5.569 5.020 6.045 4.820 3.798 3.909 4.925
CV% 5.3 4.5 4.1 5.1 3.9 2.9 2.7 3.1
SEM 2.069 1.836 1.655 1.993 1.564 1.164 1.130 1.254
Grand mean 68.06 70.09 69.50 68.31 68.92 70.69 71.39 70.52
Stem diameter
Treatment 200 ppm Citric acid + 4% Sucrose had the highest stem diameter
(6.32mm) followed by 200 ppm Salicylic acid + 4% Sucrose (5.40 mm) and
least diameter was recorded in treatment Distilled water solution (2.973 mm).
Weight loss or gain
Treatment 200 ppm Citric acid + 4%Sucrose gains maximum weight (21.17g)
followed by treatment 200 ppm Citric acid (19g) whereas treatment Tap water
(9.17g) gains least water respectively. According to (Mashhadian et al., 2012) in
an experiment conducted with different concentrations of salicylic acid and
citric acid showed that maximum weight was gained by 300 ppm salicylic acid
followed by 200 ppm of citric acid. Mehdikhah, Onsinejad & Hashemabadi,
(2016) evaluated that 100 mg l-1 citric acid had the highest fresh weight (9.80 g)
between other treatments.
Nepalese Journal of Agricultural Sciences, 2021, volume 21 ISSN 2091-042X; eISSN 2091-0428
148
Table 3. Effect of different treatment on stem diameter
Treatments Day 1 Day 3 Day 5 Day 7 Day 9 Day 11 Day 13 Day 15
Tap water 4.76ab 4.597d 4.01d 3.217d
Distilled water 4.03a 4.473d 4.073d 3.433d 2.97d
Distilled water + 4%
sucrose
5.26b 5.14c 4.93c 4.47c 3.323d
200 ppm Salicylic acid 5.44b 5.503bc 5.33bc 5.08bc 4.46c 3.82c
200 ppm Citric acid 5.29b 5.57b 5.16bc 4.70bc 4.58c 4.23bc 3.95c
200 ppm Salicylic+ 4%
sucrose
4.86ab 5.28bc 5.84b 5.19b 5.40b 4.61ab 4.66b 3.92b
200 ppm Citric+ 4%
sucrose
5.33b 6.21a 6.83a 6.17a 6.32a 5.27a 5.39a 4.95a
F value 2.35 24.39 20.15 22.41 81.29 8.76 26.91 15.79
P value 0.088 0.001 0.001 0.001 0.001 0.007 0.001 0.016
LSD (0.05) 0.982 0.367 0.66 0.65 0.42 0.678 0.48 0.72
CV% 11.2 4.0 7.4 8.2 5.3 8.0 5.3 4.6
SEM 0.324 0.121 0.21 0.21 0.1390 0.20 0.14 0.18
Grand mean 5.00 5.25 5.17 4.61 4.51 4.49 4.65 4.43
Table 4. Effect of different treatments on weight loss or gain
Treatments Day 1 Day 3 Day 5 Day 7 Day 9 Day 11 Day 13 Day
15
Tap water 11.17d 11.33e 10e 9.17f
Distilled water 11.50d 12.33de 11.67e 11.33e 10.83e
Distilled water + 4%
sucrose
11.83bc 14.33c 14d 14.83d 13.00d
200 ppm Salicylic
acid
12.83cd 13.83cd 15.17cd 15.83cd 16.00c 13.67c
200 ppm Citric acid 15.67ab 16.83b 18.33ab 18.67b 19.00b 17.67ab 15.83ab
200 ppm Salicylic+
4% sucrose
14.83abc 15.17bc 17.00abc 17.50bc 18.17b 16.33b 14.33b 14.00b
200 ppm Citric+ 4%
sucrose
16.00a 19.33a 20.33a 20.83a 21.17a 19.00a 17.83a 17.67a
F value 8.82 21.02 24.82 41.38 67.77 9.22 4.63 6.91
P value 0.001 0.001 0.001 0.001 0.001 0.006 0.061 0.058
LSD (0.05) 1.976 1.792 2.228 1.930 1.453 2.446 2.825 3.871
CV% 8.2 6.9 8.4 7.1 5 7.8 8.8 10.8
SEM 0.625 0.591 0.735 0.636 0.471 0.750 0.816 0.986
Grand mean 13.69 14.74 15.21 15.45 16.36 16.67 16 15.83
Flower freshness
Treatment 200 ppm Citric acid + 4%Sucrose showed best freshness score (2.00)
followed by 200 ppm Salicylic acid +4% Sucrose (3.00) and lowest freshness
Nepalese Journal of Agricultural Sciences, 2021, volume 21 ISSN 2091-042X; eISSN 2091-0428
149
score was recorded in treatment Tap water solution (5.00). In an experiment it
was found that maximum days taken for petal discoloration by Salicylic acid +
chitosan (13.6) followed by Citric + chitosan (12.7) while minimum by Salicylic
acid (10.6) (Mehraj et al., 2016).
Table 5. Effect of different treatment on flower freshness (scoring)
Treatments Day 3 Day 5 Day 7 Day 9 Day 11 Day 13 Day 15
Tap water 2.00b 4.67d 5.00d
Distilled water 1.667ab 3.67c 3.67c 4.667c
Distilled water + 4%
sucrose
1.33ab 3.00bc 3.00b 4.33c
200 ppm Salicylic acid 1.67ab 2.67b 2.667b 4.00c 4.67c
200 ppm Citric acid 1.00a 2.33b 2.33b 2.67b 3.33b 4.33b
200 ppm Salicylic+ 4%
sucrose
1.00a 1.00a 1.00a 1.33a 2.00a 2.67a 3.00a
200 ppm Citric+ 4%
sucrose
1.00a 1.00a 1.00a 1.00a 1.33a 1.67a 2.00a
F value 3.44 28.25 42.78 33.60 26.22 8.17 3.00
P value 0.026 0.001 0.001 0.001 0.001 0.019 0.158
LSD (0.05) 0.66 0.7643 0.6619 0.839 0.941 1.631 1.603
CV% 27.4 16.7 14.2 15.7 17.6 28.3 28.3
SEM 0.2182 0.2520 0.2182 0.272 0.289 0.471 0.408
Grand mean 1.381 2.619 2.67 2.83 2.83 2.89 2.50
Flower discoloration
During the study, treatment 200 ppm Citric acid + 4%Sucrose scored the best
result (1.33) followed by treatment 200 ppm Salicylic acid + 4%Sucrose (2.33).
Treatment Tap water scored better results followed by Distilled water, Distilled
water + 4% Sucrose, 200 ppm Salicylic acid and 200 ppm Citric acid.
Muraleedharan & Joshi, (2017) reported that Citric acid 125 ppm + 8% sucrose
took maximum days for discoloration of flower followed by citric acid 150ppm.
Vase life (Days)
The longest vase life was observed with Treatment 200 ppm Citric acid + 4%
Sucrose (15.67 days) followed by Treatment 200 ppm Salicylic acid + 4%
Sucrose (15 days). Treatment with Tap water found the lowest vase life as 7.33
days. Similar report was found in different preservative solutions among which
the citric acid + sucrose showed longer vase life than other treatments (Aryal et
al., 2019). Mehdikhah, Onsinejad & Hashemabadi, (2016) results revealed that a
flower’s vase life of cut gerbera when held in a solution containing 100 mg l-1
of citric acid was significantly higher than other treatment. According to
(Heidarnezhadian, Eghbali & Kazemi, 2017), the results showed that the vase
solution containing 1.5 mM salicylic acid significantly increased vase life
compared to the control.

Nepalese Journal of Agricultural Sciences, 2021, volume 21 ISSN 2091-042X; eISSN 2091-0428
150
Table 6. Effect of different treatment on flower discoloration (scoring)
Treatments Day 5 Day 7 Day 9 Day 11 Day 13 Day 15
Tap water 2.00b 3.00c
Distilled water 2.00b 3.00c 3.00c
Distilled water + 4%
Sucrose
2.00b 2.67c 3.00c
200 ppm Salicylic acid 1.33a 2.00b 2.33b 3.00c
200 ppm Citric acid 1.00a 1.00a 2.00b 1.67b 3.00b
200 ppm Salicylic + 4%
Sucrose
1.00a 1.00a 1.00a 1.00a 1.33a 2.33a
200 ppm Citric + 4%
Sucrose
1.00a 1.00a 1.00a 1.00a 1.00a 1.33a
F value 16.00 57.00 44.20 32 31 4.50
P value 0.001 0.001 0.001 0.001 0.001 0.101
LSD (0.05) 0.3821 0.3821 0.4193 0.5435 0.66 1.603
CV% 14.8 11.2 11.5 17.3 18.8 28.3
SEM 0.1260 0.1260 0.1361 0.1667 0.192 0.408
Grand mean 1.476 1.952 2.056 1.667 1.78 2.50
Figure 1. Vase life of Gerbera flower in different solutions
CONCLUSION
It is concluded from the study that for achieving better quality of rose cut
flowers with maximum vase life, the gerbera cut flower may be treated with a
combination of 4%sucrose with 200 ppm citric acid with distilled water.
REFERENCES Aryal, P., Adhikari, A., Pathak, R., & Pudasaini, R. (2019) Effects of different concentrations of
sucrose and citric acid on vase life of rose, Journal of Agriculture and Natural Resources,
2(1), 127-134.
Balestra, G.M., Agostini, R., Bellincontro, A., Mencarelli, F. & Varvaro, L. (2005) Bacterial
Nepalese Journal of Agricultural Sciences, 2021, volume 21 ISSN 2091-042X; eISSN 2091-0428
151
populations related to gerbera (Gerbera jamesonii L.) stem break,. Phytopathology of
Mediterranean, 44: 291-299.
Chaudhary, G. & Khanal, A. (2018) Effects of Different Concentrations of Sucrose on Vase Life of
Rose (Rosa sps.cv. Dutch Hybrid). Journal of the Institute of Agriculture and Animal
Science, 35(1), 183–190.
Dole, J. M. & Wilkins, H. F. (1999) Floriculture, Principle and Species. Prentice Hall, Upper Saddle
River, New Jersey, 356–360.
De Silva, W. A. N. T., Kirthisinghe, J. P. & Alwis, L. M. H. R. (2013) Extending the Vase Life of
Gerbera (Gerbera hybrida) Cut Flowers Using Chemical Preservative Solutions. Tropical
Agricultural Research, 24(4), 375–379.
Han, S. S. & Miller, J. A. (2003) Role of ethylene in postharvest quality of cut oriental lily
‘Stargazer’. Plant Growth Regulation, 40, 213–22.
Heidarnezhadian, H., Eghbali, B. & Kazemi, M. (2017) Post harvest life of cut gerbera flower as
affected by salicylic acid and citric acid. Trakia Journal of Sciences, 1, 27-29.
Hashemabadi, D., Torkashvand, A. M., Kavinani, B., Bagherzadeh, M., Rezaalipour, M. & Zarchini,
M. (2016) Effect of antibiotics and essential oils on postharvest life and quality
characteristics of chrysanthemum cut flower. Journal of Ornamental Plants, 3(4), 259–
265.
Jamshidi, M., Hadavi, E. & Naderi, R. (2012) Effect of Salicylic acid and Malic acid on vase life and
bacterial and yeast populations of preservative solution in cut Gerbera Flowers.
International Journal of AgriScience, 2(8), 671–674.
Krishnamoorthy, C. (2021) Influence of Post-harvest Chemical Treatments on Shelf life of Gerbera
(Gerbera jamesonii), Department of Horticulture, Vanavarayar Institute of Agriculture,
10, 2319-7706.
Kader, A. (2003) A perspective on postharvest horticulture. Journal of Horticultural Science,
38:1004–8.
Khanal, A., Khanal, A., Poudel, S., & Sapkota, B. (2018) Postharvest Quality and Longevity of
Gerbera Varieties as Affected by Different Floral Preservatives. Research & Reviews:
Journal of Botany, 7(2)(January 2018), 29-35p.
Liu, J.P., He, S.G., Zhang, Z.Q., Cao, J.P., Lv, P.T., He, S.D., Cheng, G.P. & Joyce, D.C. (2009)
Nano-silver pulse treatments inhibit stem-end bacteria on cut gerbera cv. Ruikou flowers.
Postharvest Biology and Technology, 54: 59-62.
Marandi, R. J., Hassani, Abdollahi, A. & Hanafi, S. (2011) Improvement of the vase life the cut
gladiolus flowers by essential oils, salicylic acid and silver thiosulphate. Journal of
medicinal plants research, 5(20), 5039–5043.
Mehdikhah, M., Onsinejad, R., Ilkaee, M. N. & Kaviani, B. (2016) Effect of Salicylic Acid, Citric
Acid and Ascorbic Acid on Post-harvest Quality and Vase Life of Gerbera (Gerbera
jamesonii) Cut Flowers. Journal of Ornamental Plants, 6(3), 181–191.
Mehdikhah, M., Onsinejad, R. & Hashemabadi, D. (2016) Postharvest life of cut gerbera (Gerbera
jamesonii) flowers as affected by salicylic acid, citric acid and ascorbic acid. ARPN
Journal of Agricultural and Biological Science, 11(5), 170–174.
Mashhadian, N. V., Tehranifar, A., Bayat, H., & Selahvarzi, Y. (2012) Salicylic and Citric Acid
Treatments Improve the Vase Life of Cut Chrysanthemum Flowers. Journal Agriculture
Science Technology, 12, 879–887.
Mehraja, H., Taufiqueb, T., Shamsuzzohab, M., Shiamb, I. H. & Jamal Uddin, A. F. M. (2016)
Effects of floral preservative solutions for vase life evaluation of Gerbera, Journal of
Bioscience and Agriculture Research, 9(2), 804–811.
Muraleedharan, A. & Joshi, J. L. (2017) Studies on prolonging the vase life of rose flowers with
citric acid and sucrose solution, Department of Horticulture, Faculty of Agriculture,
Annamalai University, Annamalai nagar, 4.
Sacalis, J. N. & John, M. G. (1993) Cut flowers prolonging freshness. Ball, Bativa, Illinois, USA.
Nepalese Journal of Agricultural Sciences, 2021, volume 21 ISSN 2091-042X; eISSN 2091-0428
152
Economics of production and marketing of vegetables
in Pokhara, Kaski
1Satish Kharal and
2Kiran Raj Joshi
1HICAST, Kathmandu and
2NARC, Lalitpur
Corresponding Author: [email protected]
ABSTRACT
Considering the substantial contribution of urban or peri-
urban farming and its marketing to the increasing urban
population, the economic study on vegetable production and
marketing was performed in Pokhara, one of the major cities
in Nepal. This study deals with the economic aspects such as
cost of production, marketing cost incurred to farmers, gross
and net return, benefit-cost ratio and producers share that
was obtained through the farming and includes marketing
structure and margins obtained by different stakeholders in
five major vegetable produced in the study area:
Cauliflower,Sponge Gourd, Bitter Gourd, Cucumber and
Coriander greens. The survey was performed by taking
interview personally with 85 respondents in which 40, 20, 20
and 5 of them were producers, retailers, wholesalers and
collectors respectively. Findings of the study revealed that the
vegetable farmers in the study area are receiving a fair share
of the benefit accruing from the marketing of the selected
vegetables. Out of different marketing channels, farmers
preferred to market their product through collectors but
inconsistency in availability of collectors compels farmer to
take other route of marketing. Small land holdings and lack of
interest of younger generation in vegetable farming had been
observed as a major problem in the study area. There is an
immense need to adopt market oriented policy and programs
to encourage urban farming in the study area.
Key words: Urban farming, marketing channels, margins, land holding
INTRODUCTION
Vegetable crops are efficient to generate cash even from a small plot of land in a
short period of time and helps farmers to improve their livelihood (Gurunget al.,
2016). Because of the great demand for perishable commodities such as
vegetables, most farmers around urban and peri-urban areas are moving towards

Nepalese Journal of Agricultural Sciences, 2021, volume 21 ISSN 2091-042X; eISSN 2091-0428
153
the commercial production of vegetables (Bhatta and Doppler, 2010). Regarding
agricultural marketing in Nepal, a general remark had been such that the traders
usually tried transferring all sort of price risks to farmers and offered low prices
to them by creating monopolistic situation, debt-ties and cartel (Thapa et al.,
1995). However, such things are not studied in view of vegetables production
and marketing in Nepal. The traders might have been doing the job nicely so
they shouldn’t be observed as exploiting farmers just by comparing farmers and
consumers’ prices. Many components of marketing system like production and
intermediation are equally responsible for increased price and low farm income
(Pokhrel, 2010).
MATERIALS AND METHODS
The study was performed in Kaski district focusing Pokhara metropolitan city.
The vegetable markets and the local farms were observed carefully and the most
common five vegetables being supplied from local farm to the market at the
time of study was chosen.
Table 1. Selected vegetables
S.N. Selected
Vegetables
Local Names Scientific Names Production Period
1. Cauliflower Kaauli Brassica oleracea var. botrytis August– November
2. Sponge Gourd Ghiraula Luffaaegyptiaca February–October
3. Bitter Gourd TiteKarela Momordicacharantia February– August
4. Cucumber Kaakro Cucumis sativus June- September
5. Coriander greens Dhaniyapatta Coriandrum sativum September- Nov.
Survey was taken with 85 respondents out of which number of producers,
retailers, wholesalers and collectors were 40, 20, 20 and 5 respectively. The
survey was taken from the month of September to November in a year 2019 AD
with different type of stakeholders maintaining a week gap to understand the
fluctuation and pattern of a vegetable market better. The primary data for the
purpose was collected through personal interview with the help of semi-
structured questionnaire. Cost of production, gross and net return, benefit-cost
ratio, producers share and marketing margin were analyzed to study the
economics of production and marketing of selected vegetable products. The
collected data were analyzed by using the level of input utilization and cost of
production of vegetables. Total cost of production was calculated by adding the
incurred fixed and variable cost in which variable cost included the expenditure
on seed, manures and fertilizers, vitamins and pesticides, micronutrient, hired
human labor, land revenue, irrigation charges and machinery charges, and fixed
cost included expenditure on interest on working capital, depreciation on farm
implement, rental value of owned land and interest on own fixed capital
(excluding land).
B/C ratio =
Nepalese Journal of Agricultural Sciences, 2021, volume 21 ISSN 2091-042X; eISSN 2091-0428
154
Gross Margin = Selling Price - Purchase Price
Producer share in retail price = × 100%
RESULTS AND DISCUSSION
Economic aspect
The cost of production of Bitter Gourd was comparatively more followed by
Sponge Gourd, Cauliflower, Cucumber and Coriander Greens. This was due to
the time difference from first seeding to the last harvesting of different selected
vegetables and their incurred fixed and variable cost of different components.
The highest net return of NRs. 68,042 was obtained from Cucumber, however
higher B/C ratio of 6.53 was obtained in Coriander greens.
Table 2. Economic aspect of selected vegetables
Particulars Cauliflower Sponge
Gourd
Bitter
Gourd
Cucumber Coriander
greens
Average price (NRs./ kg) 68.32 48.02 63.35 62.23 242.92
Productivity (Kg/ ropani) 750 1554 1055 1300 210
Gross return (NRs./ ropani) 51,240 74,623 66,835 80,900 51,013
Total Cost of Production (NRs./ Ropani) 13,072.4 19,371 23,551 11,574.84 7604.14
Marketing cost in producer level 740.25 1,533.8 1,041.2 1,283 207.27
Total cost (NRs./ ropani) 13,812.6 20,904.8 24,592.2 12,857.84 7,811.41
Total cost (NRs./ Kg) 18.41 13.45 23.31 9.89 37.19
Net return (NRs./ ropani) 37,427.3 53,718.2 42,242.7 68,042.16 43,201.60
B/C ratio 3.7 3.57 2.71 6.29 6.53
This shows that the benefit from selling Coriander greens was greater,
whatsoever the net return i.e. profit was obtained higher in Cucumber because of
its greater production. Though the productivity of the Sponge Gourd was
obtained higher, the return was not as much as Cucumber because of its
comparatively low price in market and cost incurred in it was also high. Though
net return obtained from the Bitter gourd is higher than that of Cauliflower, the
capability of Cauliflower to get revenue in short period of time and its higher
B/C ratio makes Cauliflower production and marketing more worthy than Bitter
Gourd.
Marketing channels
In the study area four different channels were used by the farmers to sale their
products.
Channel I: Producers- Consumer
Channel II: Producers- Retailer-Consumer
Channel III: Producers-Wholesalers-Retailers-Consumer
Channel IV: Producers-Collectors-Wholesalers-Retailers-Consumer
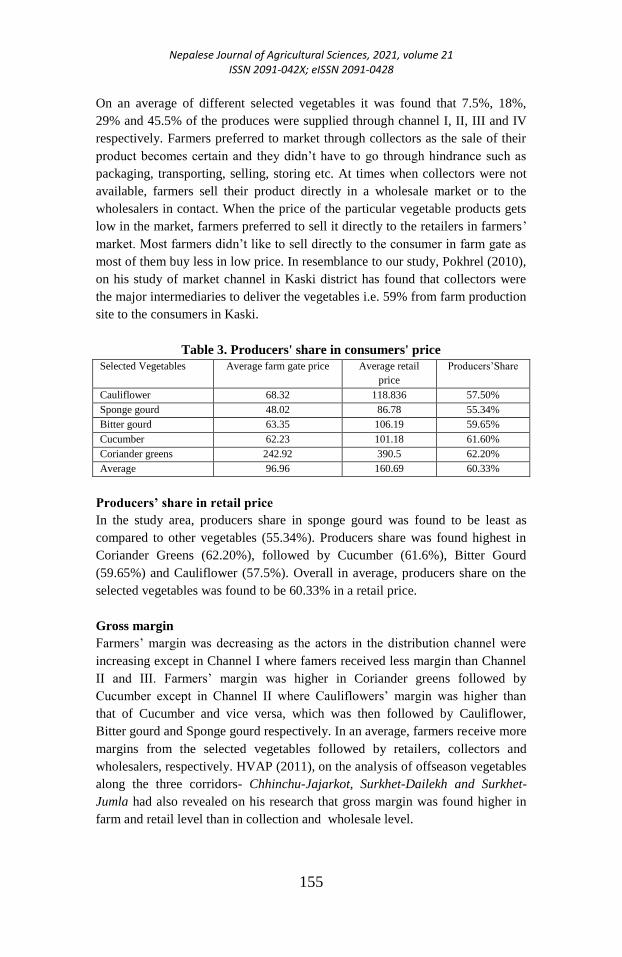
Nepalese Journal of Agricultural Sciences, 2021, volume 21 ISSN 2091-042X; eISSN 2091-0428
155
On an average of different selected vegetables it was found that 7.5%, 18%,
29% and 45.5% of the produces were supplied through channel I, II, III and IV
respectively. Farmers preferred to market through collectors as the sale of their
product becomes certain and they didn’t have to go through hindrance such as
packaging, transporting, selling, storing etc. At times when collectors were not
available, farmers sell their product directly in a wholesale market or to the
wholesalers in contact. When the price of the particular vegetable products gets
low in the market, farmers preferred to sell it directly to the retailers in farmers’
market. Most farmers didn’t like to sell directly to the consumer in farm gate as
most of them buy less in low price. In resemblance to our study, Pokhrel (2010),
on his study of market channel in Kaski district has found that collectors were
the major intermediaries to deliver the vegetables i.e. 59% from farm production
site to the consumers in Kaski.
Table 3. Producers' share in consumers' price
Selected Vegetables Average farm gate price Average retail
price
Producers’Share
Cauliflower 68.32 118.836 57.50%
Sponge gourd 48.02 86.78 55.34%
Bitter gourd 63.35 106.19 59.65%
Cucumber 62.23 101.18 61.60%
Coriander greens 242.92 390.5 62.20%
Average 96.96 160.69 60.33%
Producers’ share in retail price
In the study area, producers share in sponge gourd was found to be least as
compared to other vegetables (55.34%). Producers share was found highest in
Coriander Greens (62.20%), followed by Cucumber (61.6%), Bitter Gourd
(59.65%) and Cauliflower (57.5%). Overall in average, producers share on the
selected vegetables was found to be 60.33% in a retail price.
Gross margin
Farmers’ margin was decreasing as the actors in the distribution channel were
increasing except in Channel I where famers received less margin than Channel
II and III. Farmers’ margin was higher in Coriander greens followed by
Cucumber except in Channel II where Cauliflowers’ margin was higher than
that of Cucumber and vice versa, which was then followed by Cauliflower,
Bitter gourd and Sponge gourd respectively. In an average, farmers receive more
margins from the selected vegetables followed by retailers, collectors and
wholesalers, respectively. HVAP (2011), on the analysis of offseason vegetables
along the three corridors- Chhinchu-Jajarkot, Surkhet-Dailekh and Surkhet-
Jumla had also revealed on his research that gross margin was found higher in
farm and retail level than in collection and wholesale level.
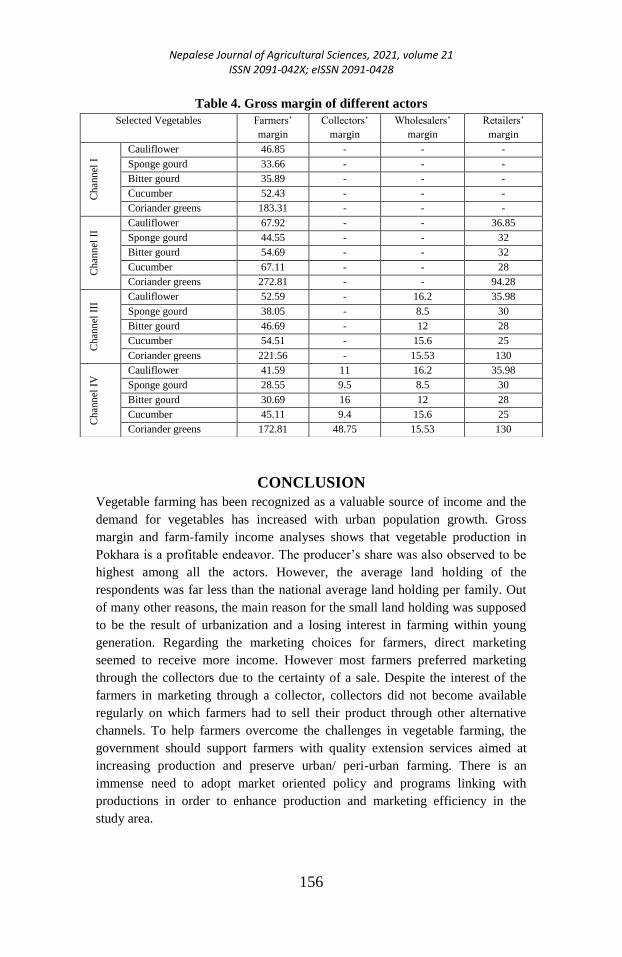
Nepalese Journal of Agricultural Sciences, 2021, volume 21 ISSN 2091-042X; eISSN 2091-0428
156
Table 4. Gross margin of different actors
CONCLUSION
Vegetable farming has been recognized as a valuable source of income and the
demand for vegetables has increased with urban population growth. Gross
margin and farm-family income analyses shows that vegetable production in
Pokhara is a profitable endeavor. The producer’s share was also observed to be
highest among all the actors. However, the average land holding of the
respondents was far less than the national average land holding per family. Out
of many other reasons, the main reason for the small land holding was supposed
to be the result of urbanization and a losing interest in farming within young
generation. Regarding the marketing choices for farmers, direct marketing
seemed to receive more income. However most farmers preferred marketing
through the collectors due to the certainty of a sale. Despite the interest of the
farmers in marketing through a collector, collectors did not become available
regularly on which farmers had to sell their product through other alternative
channels. To help farmers overcome the challenges in vegetable farming, the
government should support farmers with quality extension services aimed at
increasing production and preserve urban/ peri-urban farming. There is an
immense need to adopt market oriented policy and programs linking with
productions in order to enhance production and marketing efficiency in the
study area.
Selected Vegetables Farmers’
margin
Collectors’
margin
Wholesalers’
margin
Retailers’
margin
Chan
nel
I
Cauliflower 46.85 - - -
Sponge gourd 33.66 - - -
Bitter gourd 35.89 - - -
Cucumber 52.43 - - -
Coriander greens 183.31 - - -
Chan
nel
II
Cauliflower 67.92 - - 36.85
Sponge gourd 44.55 - - 32
Bitter gourd 54.69 - - 32
Cucumber 67.11 - - 28
Coriander greens 272.81 - - 94.28
Chan
nel
III
Cauliflower 52.59 - 16.2 35.98
Sponge gourd 38.05 - 8.5 30
Bitter gourd 46.69 - 12 28
Cucumber 54.51 - 15.6 25
Coriander greens 221.56 - 15.53 130
Chan
nel
IV
Cauliflower 41.59 11 16.2 35.98
Sponge gourd 28.55 9.5 8.5 30
Bitter gourd 30.69 16 12 28
Cucumber 45.11 9.4 15.6 25
Coriander greens 172.81 48.75 15.53 130
Nepalese Journal of Agricultural Sciences, 2021, volume 21 ISSN 2091-042X; eISSN 2091-0428
157
ACKNOWLWDGEMENT
We would like to express our gratitude to all the respondents who were very
kind to us at the time of survey. We are sincerely thankful to Pokhara
Agriculture Wholesale Market Management Committee and the team of
Directorate of Agriculture Development, Gandaki Province, Pokhara for briefing
us about the scenario of vegetable markets and its marketing pattern.
REFERENCES Bhatta, G.D. and Doppler, W. (2010) Socio-economic and environmental aspects of
farming practices in the peri-urban hinterlands of Nepal, J. Agric. Environ., 11,
pp.26–39
Gurung, B., Thapa, R., Gautam, D., Karki, K. and Regmi, P,, (2016) Commercial
vegetable farming: an approach for poverty reduction in Nepal, Agron. J.
Nepal, 4, pp. 92–106
HVAP (2011) A report on value chain analysis of offseason vegetables. Surkhet: MoAD,
High Value Agriculture Project in Hill and Mountain Areas.
Pokhrel, M.D. (2010) Comparison of farm production and marketing cost and benefit
among selected vegetable pockets in Nepal, The Journal of Agriculture and
Environment, 11
Shrestha, S. (2012) Status of Agricultural Mechanization in Nepal. Research Gate.
Available at:
https://www.researchgate.net/publication/228534387_Status_of_Agricultural_
Mechanization_in_Nepal/link/02e7e51d1a8fa2f9ca000000/download
(Accessed: 24 Dec. 2019).
Thapa, G.B., Paudyal, D. (1995) Dynamics of vegetables, pp. 231-270
Nepalese Journal of Agricultural Sciences, 2021, volume 21 ISSN 2091-042X; eISSN 2091-0428
158
Effect of chemical fertilizers and organic sources in
soil chemical properties under rice-wheat cropping
system
Shukra Raj Shrestha1, Dinesh Khadka
2 and Damali Sherpa
1
1Directorate of Agricultural Research, NARC, Tarahara, Sunsari, Nepal 2National Soil Science Research Center, NARC, Khumaltar, Lalitpur
Corresponding Author: [email protected]
ABSTRACT
A field experiment was conducted at Directorate of
Agricultural Research (DoAR), Tarahara, Sunsari during
2017 to 2019 to evaluate the changes in soil chemical
properties under diverse forms of soil fertilization practices
like chemical fertilizers, organic sources and green manures
in rice-wheat cropping system. The experiment was laid out in
RCBD with seven treatments replicated thrice. At initial,
composite soil sample of upper 25 cm (0-25 cm depth) was
collected in May 2017 before rice transplantation. The soil
samples were examined once a year after wheat harvest for
total nitrogen, available phosphorus, potassium, soil organic
matter and pH. Green manure crops were incorporated during
puddling for rice transplantation. The results showed total N
and soil organic matter varied significantly over the years. All
the parameters were significantly influenced by the
treatments. The total N status at initial (0.8%) ranged from
0.06 to 0.11% at the end of trial. A declined trend of available
P but increased K level were revealed in treatments 1, 2 and
3, where green manure crops were incorporated for rice
transplanting with inorganic NPK fertilizers in wheat. The
sole application of 10 t/ha FYM resulted increased total N and
SOM but decreased level of available P and K in soil.
Combined application of 5 t/ha FYM and 60: 20: 20 kg/ha
NPK fertilizers resulted constant N, decreased P and K
content and slight increase of SOM status. The soil pH ranges
from 6.11 to 6.68 at the end of trial. All the parameters
exhibited negative change under foliar application of urine.
Keywords: Organic manure, inorganic fertilizers, cropping system, soil
chemical properties
Nepalese Journal of Agricultural Sciences, 2021, volume 21 ISSN 2091-042X; eISSN 2091-0428
159
INTRODUCTION
Rice is normally grown in water stagnated field whereas following crop wheat
requires well-drained soil condition. Two crops possessing significant
differences in field preparation techniques and water management system the
alteration and dynamics in soil chemical and physical properties under this
system holds core importance to overall production system (Singh et al., 2011).
The majority of soils in tropical countries, including India, Pakistan, Bangladesh
and Nepal are deficient in organic matter, N and P. Deficiency of secondary
nutrients and micronutrients is also becoming a problem with the intensive
cropping and the use of high analysis fertilizers (Mahajan and Gupta, 2009). In
eastern terai of Nepal rice-wheat is the most prevalent cropping system but the
widespread stagnation and occasional decline has indicated threats on
sustainability of this major grains production system (DoAR, 2020). So, the
crops productivity enhancement with sustained soil fertility is now being highly
emphasized among farmers.
It has been observed that continuous use of chemical fertilizers in imbalanced
ways deteriorates soil physical properties (Bhattacharyya et al., 2015).
Increasing the productivity of land through intensive cropping system depletes
nutrient reserves of the soil at faster rate while unbalanced fertilizer application
may disturb nutrient availability to crops, leading to a reduction in yield.
Indiscriminate use of fertilizers based on their blanket recommendations or
without knowing the native availability of plant nutrients in soil has received
little importance in Nepalese agricultural system which not only hampers at
improving crop productivity but also at maintaining the fertility status of soil for
sustained crop production. Improving productivity and increasing cropping
intensity to sustain yields and meet the future food needs requires adequate soil
fertility management schemes (Regmi et al., 2002). To meet the ever increasing
food demand, farmers are compelled to go for intensive cereal crop cultivation.
Therefore, soil fertility issues like reduction in soil organic matter, potassium
depletion with degraded soil structure and soil acidity have resulted productivity
loss of cultivable land. In this situation, physical and nutritional characteristics
of cultivable lands in this region have become worse and crop production is
either stagnant or moving downward in many rice-based cropping system
adopted areas. The detrimental impacts of chemical fertilizers, coupled with
escalating prices and timely availability issues in this region, have led to
growing interests in the use of organic fertilizers as a source of nutrients.
Furthermore, organic sources of fertilizers are the alternative means for
sustained soil nutrients balance (Satyanarayan et al., 2002).
Summer green manuring crops like dhaincha and mungbean cultivation may be
good option to overcome this situation. Green manure is the ideal source of
organic matter, which influences on the crop production quality and soil fertility
Nepalese Journal of Agricultural Sciences, 2021, volume 21 ISSN 2091-042X; eISSN 2091-0428
160
(Sarwar et al., 2017). Dhaincha and mungbean are the cheapest green manure
crops and good source of organic matter to rice-wheat cropping system. They
are widely grown in pre-monsoon season after wheat harvest. They are quick
growing, succulent, easily decomposable and produce maximum amount of
organic matter, as well as nitrogen in soils (Palaniappan and Siddeswaran,
2001). They enhance soil physical properties and water holding capacity, reduce
the leaching of nutrients from the soil (Abro and Abbasi, 2002). Hence, to
monitor changes in soil nutrients: total nitrogen, available phosphorus,
potassium, soil organic matter and pH under different soil fertilization practices,
the activity entitled 'Effect of chemical fertilizers and organic sources in soil
chemical properties under rice-wheat cropping system' was put into action since
summer 2017 at Directorate of Agricultural Research, Tarahara, Sunsari.
MATERIALS AND METHODS
Experimental site and duration
A field experiment in clay loam soil was conducted during 2017 to 2019 at
Directorate of Agricultural Research, Tarahara, Sunsari. The experimental site is
situated in Eastern terai of Nepal at 26042' North latitude and 87
016' East
longitude and located at an elevation of 127 meters above mean sea level.
Soil sampling and analysis
A composite soil sample was collected in May 2017 before rice transplantation.
Then after, soil samples were taken from every treatment once a year after wheat
harvest in April. The soil samples of upper layer (0-25 cm depth) were collected.
The samples were air dried, powdered, allowed to pass through 2 mm sieve and
analyzed following the standard lab methods (Table 1). The chemical properties
analyzed in the lab of Directorate of Agricultural Research, Tarahara, Sunsari
and National Soil Science Research Center (NSCRC), Khumaltar is presented in
table 1. The soil samples were examined for total nitrogen, available
phosphorus, potassium and key soil parameters like organic matter and pH
(Table 1).
Table 1. Parameters and methods adopted for the laboratory analysis at
DoAR, Tarahara and NSCRC, Khumaltar
SN Parameter Units Method
1 Total Nitrogen % Kjeldahl Digestion (Bremner and Mulvaney
1982)
2 Available P2O5 ppm Olsen (Olsen et al1954)
3 Available K2O ppm Ammonium acetate extraction (Jackson 1967)
4 Soil Organic
Matter
% Walkley and Black (Walkley and Black 1934)
5 pH Potentiometric 1:2.5 (Jackson 1973)
Experiment setup and treatments details
The field trial was conducted in RCBD with seven treatments (Table 2) with
three replications. The experiment included two cereal crops per year, rice (July
Nepalese Journal of Agricultural Sciences, 2021, volume 21 ISSN 2091-042X; eISSN 2091-0428
161
to November) and wheat (November-April). The size of individual plot was 6m
x 5m = 30 m2. In both crops nitrogen (N) was provided through Urea and
Diammonium phosphate (DAP). The source of phosphorus and potassium were
DAP and Muriate of potash (MOP) respectively. In rice, whole dose of
phosphorus, potassium, FYM and 1/3 of nitrogen were applied at the time of
final land preparation before rice transplanting. Second split of 1/3 N were
applied at the time of maximum tillering; 25 days after transplanting (DAT) and
final 1/3 at the time of panicle initiation (50 DAT). In wheat, whole dose of
phosphorus, potassium, FYM and 1/2 of nitrogen were applied at the time of
final land preparation before sowing. Second split of 1/2 N was applied at the
time of Crown root initiation (CRI); 25 days after sowing (DAS). The seedlings
of rice variety 'Radha 12' was transplanted in puddled land maintaining spacing
of 25 cm between rows and hills as well. The seed rate of rice in nursery was 45
kg/ha. The seeds of wheat variety 'Gautam' were sown continuously in rows
with spacing of 25 cm at the rate of 120 kg/ha.
Table 2. Treatments combinations for field trials at DoAR, Tarahara,
Sunsari (2017-2019)
T/No. Rice Wheat
T1 GM of dhaincha + TD of N (twice @ 40
kg N/ha)
60: 20: 20 kg N: P2O5: K2O/ha
T2 GM of dhaincha + TD of N (once @ 40 kg
N/ha)
80: 40: 40 kg N: P2O5: K2O/ha
T3 GM of mungbean 120: 40: 40 kg N: P2O5: K2O/ha
T4 120: 40: 40 kg N: P2O5: K2O/ha 120: 40: 40 kg N: P2O5: K2O/ha
T5 5 t FYM/ha + 60: 20: 20 kg N: P2O5:
K2O/ha
5 t FYM/ha + 60: 20: 20 kg N: P2O5:
K2O/ha
T6 10 t FYM/ha 10 t FYM/ha
T7 Urine + water spray (1:3) Urine + water spray (1:3)
Note: GM-Green manuring; TD-Top dressing; FYM-Farmyard manure; t/ha-
tons per hectare
In treatments 1 and 2, seeds of dhaincha (Sesbania rostrata L.) and mungbean
(Vigna radiata L.) in treatment 3 were broadcasted at the rate of 35 and 25 kg/ha
respectively with single tillage after wheat harvest and incorporated into soil
with puddling at 45 DAS during rice transplanting. In treatments 5 and 6, FYM
was applied in dry weight basis. In treatment 7, both crops were treated with
buffalo urine @ 4L/30 m2
by diluting it with water (urine: water = 1: 3). The
mixture was sprayed for 3 times at the interval of 25 days, rice from the day of
transplanting and wheat from sowing.
Statistical analysis
Data entry and processing was carried out using Microsoft Office Excel 2013.
Analysis of variance (ANOVA) and mean estimation were done with the
software - R version 3.6.2. The treatment means were compared by the Least
Significant Difference (LSD) test at 5% level (Gomez and Gomez, 1984).

Nepalese Journal of Agricultural Sciences, 2021, volume 21 ISSN 2091-042X; eISSN 2091-0428
162
RESULTS AND DISCUSSION
Total Nitrogen
The total N status in soil over the trial period and among the treatments changed
significantly. In addition, the interaction effect of treatments in different years
was also significant (Table 3). The total N status ranged from 0.06 to 0.11% at
the end of trial with highest increment (0.08 to 0.11%) in treatment where 120
kg N/ha was applied through urea and DAP (treatment number 4) to both crops.
The application of more ammoniacal fertilizers like urea and DAP to both crops
might be the reason for increased N content in soil. The total N content in soil
showed significant decrease from 0.08 to 0.06% where foliar application of
urine was performed to both crops. The total N status at the initial and after 2019
in green manures applied plots increased by 20, 11 and 20% in treatments 1, 2
and 3 respectively. The increase in total N content of soil may be the effect of
incorporation of dhaincha in soil. Hoque et al 2016 reported the line findings
that N content increased in dhaincha incorporated plot, but static in
unincorporated plot. In addition, the inclusion of a legume crops adds N through
biological N fixation and nutrients recycling from the deeper soil layers (Singh
et al., 2005). The combined application of 5 t/ha FYM and 60: 20:20 kg/ha NPK
fertilizers applied plots has constant nitrogen content in soil while the plots
where only FYM was applied has 11% N increment in soil (Table 3). The
increase in total N content of soil due to application of organic manure may be
attributed to the mineralization of N and greater multiplication of soil microbes,
which could convert organically bond N to inorganic form (Rahman et al.,
2013).
Table 3. Change in total nitrogen (%) over the trial period under different
treatments at DoAR, Tarahara
Treatments
Years T1 T2 T3 T4 T5 T6 T7
Initial 0.08 0.08 0.08 0.08 0.08 0.08 0.08
April 2018 0.08 0.08 0.09 0.10 0.07 0.09 0.07
April 2019 0.10 0.09 0.10 0.11 0.08 0.09 0.06
Years
(Y)
Treatments
(T)
Interactions
(Y x T)
p-value <0.001 <0.001 <0.001
LSD (0.05) 0.002 0.003 0.005
SEm (±) 0.001 0.001 0.003
CV (%) 4.21
Available phosphorus (P2O5)
The available phosphorus in soil varied significantly under different treatments
(Table 4). A declined trend of available P was found in treatment 1 (8.2%),
treatment 2 (1.8%) and treatment 3 (0.3%) where dhaincha was incorporated for
rice transplanting with inorganic NPK fertilizers in wheat. The consumption of P
by the rice-wheat cropping system might be more than the addition of P in soil
by green manures incorporation and 20, 40 and 40 kg/ha P2O5 to wheat in
Nepalese Journal of Agricultural Sciences, 2021, volume 21 ISSN 2091-042X; eISSN 2091-0428
163
treatments 1, 2 and 3 respectively through chemical fertilizers. The slightly
acidic range of soil pH (Table 7) indicated the possibility of adsorption of
phosphate ions on solid Al or Fe hydroxide (Georgantas and Grigoropoulou,
2006) resulting available P deficient in soil. Application of inorganic NPK
fertilizers in treatment 4 resulted in increased available P content by 12.18%.
The residue of largest biomass produced by the direct addition of inorganic NKP
fertilizers and the release of soil P after their decomposition might be the reason
for increased available P in treatment 4. FYM, combined application of 5 t/ha
FYM and 60: 20: 20 kg/ha NPK fertilizers and urine treated plots resulted a
negative balance of available P (Table 4). The uptake of this nutrient might be
more than the amount supplied by the organic sources of fertilization in
treatments 5, 6 and 7 as the tested varieties of crops are very responsive to
applied phosphorus.
Table 4. Change in available phosphorus (ppm) over the trial period under
different treatments at DoAR, Tarahara
Treatments
Years T1 T2 T3 T4 T5 T6 T7
Initial 10.60 10.60 10.60 10.60 10.60 10.60 10.60
April
2018
10.13 10.40 10.73 11.67 10.52 10.50 9.30
April
2019
9.73 10.37 10.57 12.07 10.36 10.57 8.94
Years
(Y)
Treatments
(T)
Interactions
(Y x T)
p-
value
0.25 <0.001 <0.001
LSD
(0.05)
0.23 0.35 0.61
SEm
(±)
0.11 0.17 0.30
CV
(%)
3.58
Available potassium (K2O)
The available K varied significantly among different treatments (Table 5). The
data revealed significant buildup of available K in the plots where dhaincha and
mungbean was incorporated for rice transplanting with inorganic NPK fertilizers
in wheat. The higher exchangeable K obtained might be due to the extensive
root system of green manure crops that improve the physical condition of soil
and liberated CO2 and organic acids which helped in dissolving native
potassium in soil and thus increasing the availability of K (Dhudhan et al., 2004
and Singh et al., 2009). The highest positive K balance (9.65%) was recorded in
treatment 4 where inorganic NPK fertilizers were applied to both crops. The
direct application of potassic fertilizers might have significantly reduced the
depletion of exchangeable K in soil. A negative balance of soil K was observed
in FYM (Treatment 5), combined application of 5 t/ha FYM and 60: 20: 20
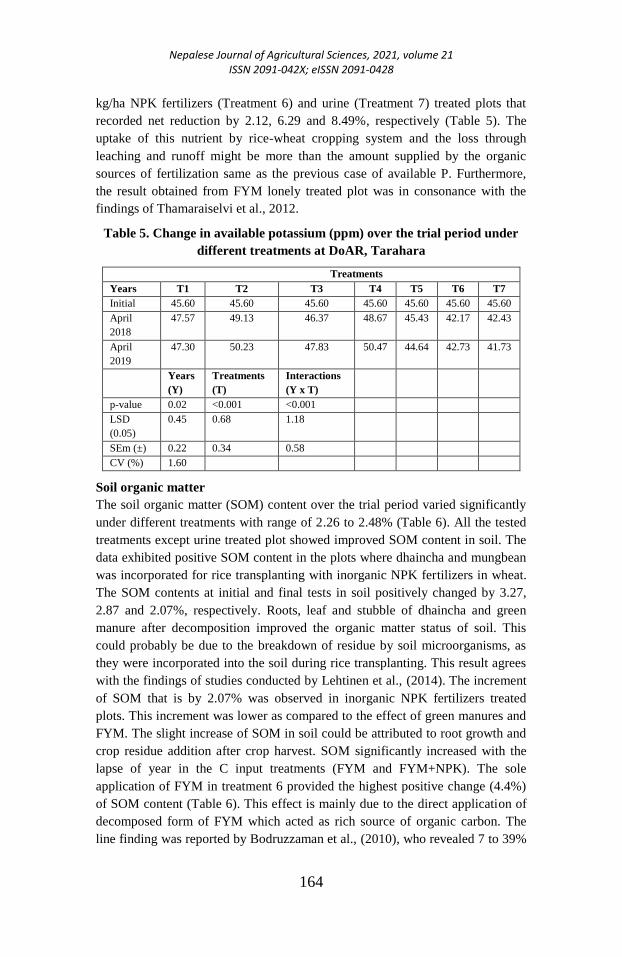
Nepalese Journal of Agricultural Sciences, 2021, volume 21 ISSN 2091-042X; eISSN 2091-0428
164
kg/ha NPK fertilizers (Treatment 6) and urine (Treatment 7) treated plots that
recorded net reduction by 2.12, 6.29 and 8.49%, respectively (Table 5). The
uptake of this nutrient by rice-wheat cropping system and the loss through
leaching and runoff might be more than the amount supplied by the organic
sources of fertilization same as the previous case of available P. Furthermore,
the result obtained from FYM lonely treated plot was in consonance with the
findings of Thamaraiselvi et al., 2012.
Table 5. Change in available potassium (ppm) over the trial period under
different treatments at DoAR, Tarahara
Treatments
Years T1 T2 T3 T4 T5 T6 T7
Initial 45.60 45.60 45.60 45.60 45.60 45.60 45.60
April
2018
47.57 49.13 46.37 48.67 45.43 42.17 42.43
April
2019
47.30 50.23 47.83 50.47 44.64 42.73 41.73
Years
(Y)
Treatments
(T)
Interactions
(Y x T)
p-value 0.02 <0.001 <0.001
LSD
(0.05)
0.45 0.68 1.18
SEm (±) 0.22 0.34 0.58
CV (%) 1.60
Soil organic matter
The soil organic matter (SOM) content over the trial period varied significantly
under different treatments with range of 2.26 to 2.48% (Table 6). All the tested
treatments except urine treated plot showed improved SOM content in soil. The
data exhibited positive SOM content in the plots where dhaincha and mungbean
was incorporated for rice transplanting with inorganic NPK fertilizers in wheat.
The SOM contents at initial and final tests in soil positively changed by 3.27,
2.87 and 2.07%, respectively. Roots, leaf and stubble of dhaincha and green
manure after decomposition improved the organic matter status of soil. This
could probably be due to the breakdown of residue by soil microorganisms, as
they were incorporated into the soil during rice transplanting. This result agrees
with the findings of studies conducted by Lehtinen et al., (2014). The increment
of SOM that is by 2.07% was observed in inorganic NPK fertilizers treated
plots. This increment was lower as compared to the effect of green manures and
FYM. The slight increase of SOM in soil could be attributed to root growth and
crop residue addition after crop harvest. SOM significantly increased with the
lapse of year in the C input treatments (FYM and FYM+NPK). The sole
application of FYM in treatment 6 provided the highest positive change (4.4%)
of SOM content (Table 6). This effect is mainly due to the direct application of
decomposed form of FYM which acted as rich source of organic carbon. The
line finding was reported by Bodruzzaman et al., (2010), who revealed 7 to 39%
Nepalese Journal of Agricultural Sciences, 2021, volume 21 ISSN 2091-042X; eISSN 2091-0428
165
increment of SOM under long term application of FYM in his long-term soil
fertility trial in rice-wheat cropping system. The SOM in soil decreased from
2.37 to lowest recorded level (2.26%) in urine treated plots.
Table 6. Change in soil organic matter (%) over the trial period under
different treatments at DoAR, Tarahara
Treatments
Years T1 T2 T3 T4 T5 T6 T7
Initial 2.37 2.37 2.37 2.37 2.37 2.37 2.37
April 2018 2.42 2.43 2.40 2.39 2.39 2.41 2.35
April 2019 2.45 2.44 2.42 2.39 2.41 2.48 2.26
Years
(Y)
Treatments
(T)
Interactions
(Y x T)
p-value 0.005 <0.001 0.002
LSD (0.05) 0.02 0.03 0.06
SEm (±) 0.01 0.02 0.03
CV (%) 1.36
Soil pH
Status of soil pH over the time period changed significantly among the
treatments (Table 7). Overall, the soil pH ranges from 6.11 to 6.68 at the end of
trial. The increased acidity of soil (lowering trend of soil pH) was identified in
the plots (Treatments 1, 2 and 3) where dhaincha and mungbean was
incorporated for rice transplanting with inorganic NPK fertilizers in wheat. This
acidity of soil could probably be due to the dissociation of organic acids released
from dhaincha and mungbean residue, as outlined by Nierves and Salas, (2015)
and Rukshana et al., (2012). The plot receiving only inorganic NPK fertilizers
(Treatment 4) showed decreased trend of soil pH that is from 6.31 to 6.21. One
of the primary reasons for soils becoming more acidic over time by the use of
nitrogen (N) fertilizers containing ammonium-N is because the ammonium-N in
fertilizers undergoes nitrification (conversion of ammonium to nitrate in soils by
bacteria), hydrogen (H+) is released, which can increase acidity. Soil pH
significantly increased in treatments where only FYM (6.31 to 6.68) and
FYM+NPK fertilizers (6.31 to 6.46) were applied (Table 7). During the initial
decomposition of manures, prior to their collection, some formation of phenolic,
humic-like material may have occurred (Narambuye and Haynes, 2006). It is
these organic anions that consume protons from the soil, thus tending to raise the
equilibrium pH. Another mechanism that has been proposed to explain the
increase in soil pH by such materials as FYM is the specific adsorption of humic
material and/or organic acids (the products of decomposition of OMs) onto
hydrous surfaces of Al and Fe oxides by ligand exchange with corresponding
release of OH− as suggested by Hue et al., (1986).
Nepalese Journal of Agricultural Sciences, 2021, volume 21 ISSN 2091-042X; eISSN 2091-0428
166
Table 7. Change in soil pH over the trial period under different treatments
at DoAR, Tarahara
Treatments
Years T1 T2 T3 T4 T5 T6 T7
Initial 6.31 6.31 6.31 6.31 6.31 6.31 6.31
April 2018 6.17 6.18 6.24 6.31 6.42 6.66 6.25
April 2019 6.13 6.11 6.20 6.21 6.46 6.68 6.21
Years
(Y)
Treatments
(T)
Interactions
(Y x T)
p-value 0.896 <0.001 <0.001
LSD (0.05) 0.08 0.12 0.21
SEm (±) 0.04 0.06 0.11
CV (%) 2.04
CONCLUSION
Dhaincha and mungbean biomass incorporation in soil before rice
transplantation in R-W cropping system has potential effect on soil fertility and
nutrient availability. Green manuring crops were found effective for organic
matter, nitrogen and potassium contribution. These green manures could be
beneficial for nutrient exhaustive different cropping pattern through nitrogen as
well as NK fertilizers saving and helpful for sustained soil nutrients balance. On
the other hand, FYM has been receiving much attention in this study as it has
significantly increased soil organic matter. Generally, soil health and
productivity are always predicted to be more sustainable with the integrated
application of inorganic fertilizers and organic sources of fertilizers rather than
the use of inorganic fertilizers alone. But, in this study combined application of
5 t/ha FYM and 60: 20: 20 kg/ha NPK fertilizers showed static total nitrogen,
negative PK and slightly increased soil organic matter indicating insufficient
supply of major nutrients to this particular cropping system.
ACKNOWLEDGEMENTS
Authors express gratitude to Nepal Agricultural Research Council (NARC) for
supporting this study. The authors are thankful to Directorate of Agricultural
Research, Tarahara, Sunsari and National Soil Science Research Center,
Khumaltar, Lalitpur for providing lab facilities and technical supports.
REFERENCES
DoAR, (2020) Soil fertility management research in Eastern terai of Nepal, In: Annual report of FY
20019/20. Directorate of Agricultural Research (DoAR) - Nepal Agricultural Research
Council, Tarahara, Sunsari, pp.84-86
Singh, Y., Singh, V. P., Singh, G., Yadav, D. S., Sinha, R. K. P., Johnson, D. E. & Mortimer, A. M.
(2011). The implications of land preparation, crop establishment method and weed
management on rice yield variation in the rice–wheat system in the Indo-Gangetic plains.
Field Crops Research, 121: 64-74.
Nepalese Journal of Agricultural Sciences, 2021, volume 21 ISSN 2091-042X; eISSN 2091-0428
167
Mahajan, A. & Gupta, R. D. (2009) Soil-Related Constraints in the Rice and Wheat Production:
Integrated Nutrient Management (INM) in a Sustainable Rice—Wheat Cropping System,
Springer; pp. 169-183. https://doi.org/10.1007/978-1-4020-9875-8_11.
Bhattacharyya, P., Nayak, A. K., Shahid, M., Tripathi, R., Mohanty, S., Kumar, A., Rajagounder, R.,
Panda, B. B., Lal, B., Gautam, P., Swain, C. K., Singh, R. K. & Dash, P. K. (2015). Effects
of 42-year long-term fertilizer management on soil phosphorus availability, fractionation,
adsorption–desorption isotherm and plant uptake in flooded tropical rice. The Crop Journal,
4: 34-41
Regmi, A. P., Ladha, J. K., Pathak, H., Pasuquin, E., Bueno, C., Dawe, D., Hobbs, P. R., Joshy, D.,
Maskey, S. L. & Pandey, S. P. (2002) Yield and Soil Fertility Trends in a 20-Year Rice-
Rice-Wheat Experiment in Nepal, Soil Sci. Soc. Am. J. 66:857-867.
Singh, V. K., Dwivedi, B. S., Shukla, A. K., Chauhan, Y. S. & Yadav, R. L. (2005) Diversification
of rice with pigeonpea in a rice–wheat cropping system on a Typic Ustochrept: Effect on
soil fertility, yield and nutrient use efficiency. Field Crops Res. 92: 85–105
Hoque, T. S., Akhter, F. & Islam, M.R. (2016) Residual effects of different green manures on the
growth and yield of wheat, Asian J.Med.Biol.Res., 2(4): 624-630.
Thamaraiselvi, T., Brindha, S., Kaviyarasi, N. S., Annadurai, B. & Gangwar, S. K. (2012). Effect of
Organic Amendments on the Bio Chemical Transformations under Different Soil
Conditions, International Journal of Advanced Biological Research, 2 (1): 171-173.
Rahman, M. H., Islam, M. R., Jahiruddin, M., Rafi, M. Y., Hanafi, M. M. & Malek, M. A. (2013)
Integrated nutrient management in maize-legume-rice cropping pattern and its impact on
soil fertility. Journal of Food Agriculture and Environment, 11: 648-652.
Georgantas, D. A. & Grigoropoulou, H. P. (2006) Phosphorus and organic matter removal form
synthetic wastewater using Alum and Aluminum hydroxide. Global NEST J, 8(2): 121-130.
Dhudhan, B. S., Grewal, K. S., Dahiya, S. S. & Singh, N. (2004) Comparative efficiency of different
green manure in improving and nutrition of rice. Haryana Agricultural University and
Research, 34: 71-74.
Singh, R. P., Singh, P. K. & Singh, A. K. (2009) Effect of green manuring on physico- chemical
properties of soil and productivity of rice. Oryza. 48 (2):120- 123.
Lehtinen, T., Schlatter, N., Baumgarten, A., Bechini, L., Krüger, J., Grignani, C., Zavattaro, L.,
Costamagna, C. & Spiegel, H. (2014) Effect of crop residue incorporation on soil organic
carbon and greenhouse gas emissions in European agricultural soils. Soil Use and
Management, 30 (4): 524-538.
Bodruzzaman, M., Meisner, C. A., Sadat, M. A. & Hossain, M. I. (2010) “Long-Term Effects of
Applied Organic Manures and Inorganic Fertilizers on Yield and Soil Fertility in a Wheat-
Rice Cropping Pattern,” 19th World Congress of Soil Science, Soil Solutions for a
Changing World, Brisbane.
Rukshana, F., Butterly, C. R., Baldock, J. A., Xu, J. M. and Tang, C. (2012) Model organic
compounds differ in priming effects on alkalinity release in soils through carbon and
nitrogen mineralization. Soil Biology and Biochemistry, 51, 35-43.
Nierves, M. C. P. & Salas, F.M. (2015) Assessment of soil phosphorus and phosphorus fixing
capacity of three vegetable farms at Cabintan, Ormoc city, Leyte, World J.Agril.Res, 3(2):
70-73
Narambuye F. X. & Haynes, R. J. (2006) “Effect of organic amendments on soil Ph and aL solubility
and use of laboratory indices to predict their liming effect,” Soil Science, 17110(10): 754–
763.
Hue, N. V., Craddock, G. R. & Adams, F. (1986) “Effects of organic acids on aluminum toxicity in
subsoil,” Soil Science Society of America Journal, 25: 3291–3303
Satyanarayana, V., Prasad, P. V., Murthy, V. R. K. & Boote, K. J. (2002). “Influence of Integrated
Use of Farmyard Manure and Inorganic Fertilizers on Yield and Yield Components of
Irrigated Lowland Rice,” Journal of Plant Nutrition, 25(10): 2081-2090.
Nepalese Journal of Agricultural Sciences, 2021, volume 21 ISSN 2091-042X; eISSN 2091-0428
168
Status of agriculture insurance service business in
Nepal
1Rojan Kakri,
1Ashma Pandey,
2 K.P. Timsina,
1,3Arun G.C.
1HICAST, Kathmandu, Nepal
2Nepal Agriculture Research Institute, Kathmandu, Nepal
3Ministry of Agriculture and Livestock Development (MOALD), Kathmandu,
Corresponding Author: [email protected]
ABSTRACT
A study was conducted to assess the status of agriculture and
livestock insurance service business in Nepal. Building on
existing work in insurance sector: it asks what might be the
favorable environment in which this sector can flourish?
Based on a review of literature and theories of agriculture
insurance, a census survey was conducted during the year
2019 October to December at Kathmandu focusing only on the
head office of different insurance companies. The information
obtained was coded and analyzed using "MS Excel." Age and
education were found to be influential factors in embracing
agriculture insurance. Despite the variety and potential,
companies are not seen to be drawn towards agriculture due
mainly to crop insurance because of complications thus
undisputedly all preferred livestock insurance. Agriculture
began with six insurance products and has since grown to
include more than 70. The leading sector among the available
insurance companies was discovered to be the private sector,
namely Shikhar Insurance, while the profited insurance
company was discovered to be the government sector, namely
Rastriya Beema Company. A national database could be
developed to provide agricultural insurers with reliable and
consistent agricultural yield figures, crop production losses,
livestock mortality rates, geographical and meteorological
information, and other information that would allow
institutions to improve their product design. Various
mitigating strategies, such as advertising, extension, and
appealing insurance policies, must be implemented based on
farmer demand and market demand.
Key words: Insurers, P/E ratio, policy, risk transfer, extension
INTRODUCTION
The model of agriculture that is supposed to have originated from foraging has
dramatically changed. There have been many agrarian movements that changed
Nepalese Journal of Agricultural Sciences, 2021, volume 21 ISSN 2091-042X; eISSN 2091-0428
169
human lives. Domestication swept away foraging, making it the most successful
adaptation. Agriculture began independently in different parts of the globe,
which started as domestication has alternated towards commercialization.
Damage in agricultural production can be crucial for the economy of a state
especially in those countries where agricultural production, prevails in the gross
national income. Agriculture is the major source of the Nepalese economy and
source of livelihood of the two third population of the country (Chaudhary,
2018). Traditional way of agriculture, rain fed irrigation system, weather based
cultivation system, lack of infrastructure and small land holdings are major
hindrance of growth of agriculture sector.
“Nepal is a natural disaster hotspot, with hazards increasing over the past three
decades. The disaster damage their properties, interrupt their livelihood and
causes severe loses. Disease outbreaks are a major obstacle for farmers engaged
in animal husbandry and poultry farming. Agriculture pests have been a serious
problem on crops such as paddy, wheat, maize etc (Anon., 2016).
People are always looking for safety whether it is related to their assets or their
lives. As a result of rapid economic and industrial development, several social
and environmental changes have taken place today, so people today are more
vulnerable to uncertainty, so they are in a hurry to have physical and economic
security. Consumers are not usual to danger and prefer safety to unpredictable
consumption. This doesn’t mean that risk should be avoided at all costs, but only
that it should be considered when taking decisions. In agriculture, risks and
uncertainties are normal, as there is a gap between making decisions and
achieving returns. There are several factors which affect farm yields, many of
which are beyond farmers' control (Shashikiran & Umesh, 2015). From the point
of view of an agricultural producer, insurance represents a method of the
transfer of risk from themselves to an insurance company, in exchange for a
premium in a certain amount (World Bank, 2011). An entity which provides
insurance is known as an insurer, insurance company, and insurance carrier or
underwriter. A person or entity who buys insurance is known as an insured or as
a policyholder.
METHODOLOGY
The study was conducted in Kathmandu, the capital city, because it is home to
the headquarters of all non-life insurance companies and also the Insurance
Board (Beema Samiti), an autonomous body established under the Ministry of
Finance, Government of Nepal, to develop, systemize, regularize, and regulate
Nepal's insurance business. In a total of 40 insurance companies by 2019, only
20 non-life insurance companies are engaged in non-life insurance, so all 20
non-life insurance companies were selected for interviews using a semi-
structured questionnaire as a result of census survey.
Nepalese Journal of Agricultural Sciences, 2021, volume 21 ISSN 2091-042X; eISSN 2091-0428
170
Both primary and secondary data were used in this study. A field visit served as
the primary data source. Initially, the insurance company was visited, and
personnel involved in agricultural insurance from the respective company were
interviewed. Secondary information was gathered from a variety of published
and unpublished sources, including related journals, books, reports, and
unpublished reports. Organizations such as Beema Samiti were visited for
additional details. To describe the status and characteristics of the data collected,
descriptive statistics such as mean, percent, and frequency were used. Data entry
and analysis were carried out using the computer software packages "MS
Excel." The analyzed data was then displayed in tables, graphs. “MS Excel” was
used to analyze data pertaining to the likert scale and rating scale.
RESULTS AND DISCUSSION
Age of the insured clients
The term "economically active population" refers to people aged 16 to 60. The
age group of those visiting to insure their firms, businesses, and so on was
divided into four sections, and the respondent was entrusted with ranking the
number of people insured. For this rating scale was used and it was found that
age group 30-60 was found to be the most active age group where as age group
16-30; 60 and above and up to 15 were respectively 2nd
, 3rd
and 4th
. Age is
among various factors which ultimately determine the demand for insurance
product (Tsikirayi et al., n.a.).
Figure 1. Graphical representation of insured based on age
Educational status of the insured clients
Educational achievement of farmers has a vital role to play in raising awareness
for the adoption of agricultural insurance. Level of farmer’s education has been
linked as a key factor for farmer’s preference to insurance (Tsikirayi et al.,
n.a.).The educational level has been classified into 5 groups including Illiterate,
Primary, Secondary, Intermediate and University level. For this rating scale was
used and it was found that insured clients with secondary level of education to
be the most active group where as intermediate, primary, illiterate and university
level were respectively 2nd
, 3rd
,4th
and 5th
.

Nepalese Journal of Agricultural Sciences, 2021, volume 21 ISSN 2091-042X; eISSN 2091-0428
171
Preference to insurance practices
Agriculture insurance has a long history in Nepal, dating back seven decades,
though it was only implemented as a separate policy in 2013. Despite its critical
need, the government of Nepal only recently (2013) implemented an agriculture
insurance policy. Nepal has a total of 20 non-life insurance companies. The
Nepalese government provided these 20 insurance firms with services in all 77
districts (Beema Samiti, 2017). In spite of scope and possibility, companies are
not seen to be attracted towards the agriculture mainly crop insurance. It is seen
that crop insurance needs improved technologies (seeds, fertilizers, pesticides,
etc.) regular supervision and is risky for the company compared to livestock
insurance so undisputedly all favored livestock insurance compared to crop
insurance. The insurance markets work perfectly if the underlying risks are
independently distributed, risk position of the insured is known, and the insured
has no control over the event or the claim. In crop insurance, seldom these
conditions are met and result in market failure (Ahsan et al., 1982). Overall
insurance market is particularly higher for livestock than the crop sector (Beema
Samiti, 2017).
Figure 2. Graphical representation of insured based on educational status
Non-life insurance in its entirety
After the dreadful earthquake of 2015, the rise in the insurance industry showed
a shift. The insurance industry also benefitted from increased awareness among
people and their growing living standards. Today, public opinion is more aware
of the significance of insurance.
Number of policies
As of the third quarter of FY 2075/76, Shikhar Insurance Company (SICL) held
a lead position with 215,905 insurance policies, led by Neco Insurance
Company Limited (NIL) (204,103) and NLG Insurance Company Limited
(NLG) (124,856) The average number of policies within the sector is around
78,829.
Net premium
Shikhar Insurance Company (SICL) has the highest net premium amounting to
Rs 1.24 arba among the listed non-life insurance companies. It is followed by
Neco Insurance Company (NIL) and Sagarmatha Insurance Company (SIC)
Nepalese Journal of Agricultural Sciences, 2021, volume 21 ISSN 2091-042X; eISSN 2091-0428
172
with Rs 85.70 crore and Rs 83.61 crore as net premiums. The average net
premium for the industry is at Rs 44.27 crore.
Insurance fund
When we evaluate third quarter insurance fund 2075/76, Rastriya Beema
Company Limited (RBCL) has the largest Rs 1.64 arba insurance fund. Shikhar
Insurance Company (SICL) with a fund of Rs 1.01 arba stands in second
position. With Rs 78.42 crore in insurance fund, NLG Insurance Company
(NLG) is seen in third position. The average insurance fund for the industry
stands at Rs 49.02 Crore.
Net profit
The third quarter report shows that Rastriya Beema Company Limited (RBCL)
has received the highest net profit of Rs 58.48 crore among the non-life
insurance companies. It is also followed by Shikhar Insurance Company Limited
(SICL) with Rs 33.61 Crore net profit. Neco Insurance Company Limited (NIL)
is also in third place with a net profit of Rs 25.16 crores. Average net profit for
the industry stands at Rs 15.48 crore.
Net worth
Rastriya Beema Company Limited (RBCL) has the highest net worth of Rs
986.24, followed by Sagarmatha Insurance Company (SIC) with a net value of
Rs 335.78, evaluating the net worth per share. We have Premier Insurance
Company (PIC) in third place, with net worth per share of Rs 299.43. The
average net worth of the industry per share is in Rs 244.94.
Price to earnings ratio
The PE ratio indicator shows Nepal Insurance Company Limited (NICL) has the
least ratio of 14.01 times. It is further followed by Neco Insurance Company
Limited (NIL) with a PE Ratio of 18.06 times. Shikhar Insurance Company
Limited (SICL) has a P/E ratio of 20.31 times.
Table 1. Financial scenario of companies in nutshell
Company Name No. of
policies
Net
Premium
(In crore)
Insurance
Fund
(In crore)
Net profit
(In crore)
Net
Worth
(In Crore)
P/E
Ratio
Everest Insurance 63,981 29.49 21.70 4.02 230.77 22.00
Himalayan General
Insurance
35,686 22.11 46.91 12.49 166.93 23.50
Nepal Insurance 114,519 38.67 26.01 13.06 201.21 14.01
NLG Insurance 124,856 53.61 78.42 15.34 262.01 25.58
Premier Insurance 14,559 60.57 48.89 15.03 299.43 35.00
Nepalese Journal of Agricultural Sciences, 2021, volume 21 ISSN 2091-042X; eISSN 2091-0428
173
Prudential
Insurance
97,517 35.57 46.15 12.73 208.24 26.62
Prabhu Insurance 53,909 39.55 51.31 14.03 175 22.14
Rastriya Beema
Company
10,734 30.34 164.47 58.48 986.24 37.62
Sagarmatha
Insurance
106,472 83.61 48.88 17.19 335.78 33.46
Siddartha Insurance 89,783 61.96 64.80 18.10 206.5606 20.99
United Insurance 49,438 23.83 34.09 7.55 239.77 28.98
IME General
Insurance
63,182 39.52 22.80 10.00 143.46 30.47
Lumbini General
Insurance
117,126 46.25 51.42 14.93 188.51 22.15
Neco Insurance 204,103 85.70 66.92 25.16 209.29 18.06
Shikhar Insurance 215,905 124.36 101.93 33.62 240.27 20.31
General Insurance 19,768 9.74 2.20 2.31 105.98 -
Sanima Insurance 7,989 2.77 2.17 2.03 102.81 -
Ajod Insurance 29,407 9.30 2.30 2.61 106.57 -
Industry average 78,829.67 44.27 49.02 15.48 244.94 25.39
Source: Nepal Life and Reliable Nepal maintain the lead, 2019
Note: 1 crore = 10 million
Hence in a nutshell among the private companies Shikhar insurance is a leading
entity as it is placed first on the basis of number of policies sold and the net
premium collected likewise the only existing governmental insurance company
i.e. Rastriya Beema Company is the most profited company as it receives the
highest amount of insurance fund and has collected highest net profit, net worth
and P/E ratio. Following table contains all the detailed information of the
existing non-insurance company and their scenario as per the third quarter report
of 2075/2076.
Policy and premium status of agriculture insurance
In Nepal, due to the lack of protection towards the agricultural sector, the
attraction towards the agricultural occupation is continuously decreasing. In
spite of scope and possibility, the peasants are not able to progress in this sector
because of the lack of knowledge and practice of facing the risk of investment in
this sector (World Bank, 2009; Ghimire, 2014; Ghimire et al., 2016). But to
protect the farmer’s investment; the insurance companies have come up with
various plans for securing the farmer’s investment in the agricultural sector. The
insurance board has made the agriculture insurance compulsory sending the
companies to the villages specifying the districts. From the insurers prospective
there are two potential benefits when insurance was made compulsory to the
farmers: the reduction of adverse selection, which is a major problem on
voluntary agricultural insurance program and the ability to generate a larger and
Nepalese Journal of Agricultural Sciences, 2021, volume 21 ISSN 2091-042X; eISSN 2091-0428
174
more balanced agricultural insurance portfolio (FAO, 2011). The government
has set premium rates and provided subsidy on the premium amount which is
paid directly by government to respective private non-life insurance company
(insurer). Subsidising premiums will go a long way in increasing the enrolment
of farmers to make schemes sustainable (Liang 2014; Babcock 2015).The value
of each product is estimated based on its maturity stage for crops and age, type
of breeds, and purpose for livestock and poultry. The Insurance companies were
asked to classify the number of premium per year and all agreed that the number
of premium per year is in thousands which also supports the table presented
below that focuses on the gradual increase of the insurance policy and
premiums.
Link among companies
When a financial risk is too high or even catastrophic for one company's
financial status, companies can band together to combine their resources as a
form of risk management. In such condition relationship among companies play
a crucial role. When insurance companies were asked to rank their relationship
with one another than 11 of the companies ranked it to be strongly satisfactory,
2 of them ranked their relationship as satisfactory where as remaining 7 of them
ranked their relationship to be neutral.
Table 2. Improvement of agriculture insurance
Topic 2069/70 2070/71 2071/72 2073/74 2074/75 Remark
Total Insured Amount 54876.90 625404.00 3173837.00 6038412.22 9209236.22 From fiscal year
2071/72 VAT
has been
removed and
premium amount
has 75% subsidy
Source: Beema Samiti, 2017
Government intervention
Agricultural insurance is normally undertaken as a market-based activity by
private or state sector insurance companies, often with support measures from
government. Governments in developing countries have been increasingly
involved in the support of commercial agricultural insurance programs in recent
years.
Table 3. Link among insurance companies
SN. Link among
company
Number of
company
Names of company
1 Strongly satisfactory 11 Ime General Insurance, Neco Insurance,
National Insurance, Nepal Insurance, Oriental
Insurance, Himalayan General Insurance
,Sanima General Insurance, Prabhu Insurance ,
Everest Insurance, Premier Insurance ,Prudential
Insurance
Nepalese Journal of Agricultural Sciences, 2021, volume 21 ISSN 2091-042X; eISSN 2091-0428
175
2 Satisfactory 2 Shikhar Insurance, Ajod Insurance
3 Neutral 7 United Insurance, Rastriya Beema Company,
Lumbini General Insurance, Prabhu Insurance,
Siddartha Insurance, NLG Insurance,
Sagarmatha Insurance
The various types of intervention which are made by governments to facilitate
agricultural insurance are whilst premium subsidy, legal and regulatory
framework by Insurance Board, reinsurance, technical and administrative
assistance, and linkages to government extension services in agriculture (Dick
et.al, 2010). Companies were asked about the role of government for efficiency
regarding three major points i.e. role of insurance board , subsidy receivable
time and government scheme as government compensate 1-2 lakh rupees incase
death of the client who has a agricultural commodity insured.
Private scheme
Since January 2013, the Government of Nepal (GoN) has introduced crop and
livestock insurance by formulating Directives on crop and livestock insurance.
Under this order, the government provided 75 per cent premium subsidies for
farmers .Initially, agriculture started with six insurance products based on cost
of production until 2018, more than 70 insurance products has been developed.
Based on demand of farmers and market need, about 55 insurance products
(including 49 vegetable crops) have been designed based on value of production
(Beema Samiti, 2017).
Figure 3. Government intervention in a nut shell
Insurance is a voluntary activity the farmers have choice to accept or not to
accept it. Government is linking different program to increase the effectiveness
of the insurance like Mega rice (spring rice) program. In addition to the
compulsory program, other different agricultural projects/programs like youth
focused (Yuba Lakshit) program supported by DoA; mega projects of Ministry
of Agriculture and Livestock such as Project for Agriculture Commercialization
and Trade (PACT), Raising Income of Small and Medium Farmers Project
(RISMFP), High Value Agriculture Project (HVAP), Irrigation and Water
Nepalese Journal of Agricultural Sciences, 2021, volume 21 ISSN 2091-042X; eISSN 2091-0428
176
Resources Management Project (IWRMP); and other different agriculture
programs supported by different organizations/institutions such as NGOs, Bank,
community based organizations i.e. cooperatives have also been linked (Timsina
et al., 2018).
Table 4. Need for an individual scheme
SN. Need of private scheme Number of
company
Names of company
1 Highly needed 4 Nepal Insurance, Shikhar Insurance, , Prabhu
Insurance, Siddartha Insurance
2 Needed 15 Ime General Insurance, Neco Insurance, National
Insurance, Oriental Insurance, Himalayan General
Insurance , Sanima General Insurance, Everest
Insurance, Premier Insurance ,Prudential
Insurance, Ajod Insurance, United Insurance,
Lumbini General Insurance ,NLG Insurance,
Sagarmatha Insurance, General Insurance
3 Neutral 1 Rastriya Beema Company
Moreover when insurance companies were asked about the private individual
scheme than 4 companies responded that there is a high need of separate private
scheme,15 companies responded separate private scheme are needed and 1
company stayed neutral regarding the need of separate private scheme .
SWOT analysis of agriculture insurance
Strength Weakness
- Addition of several products under
agriculture insurance
- From the FY 2077/78, farmers may pay
premium after harvest
- Introduction of weather based index
insurance practice
- Strong involvement of private sector
- Insurance company collect the scattered
savings of the people in the form of
premium and then invest it in the form of
capital on a long term basis in development
projects
- Unavailability of schemes such as that of
India; National Agricultural Insurance
Scheme (NAIS) and Weather Index Based
Crop Insurance Scheme (WIBCIS)
- Lack of effective advertisement about
agriculture insurance
- Lack of accurate data base
- Agriculture and Livestock related policies
have not been implemented effectively
because of various factors like limited human
resources, implementation capacity ,lack of
supportive legislation, monitoring
,evaluation, poor coordination, planning
Opportunity Threat
- The government is providing 75% subsidy
on premium
- APP introduced the vision of
commercialization of agriculture sector
- The APP emphasized the promotion of
private sector investment in livestock, as
livestock output is assumed to be largely
demand-driven and dependent on private
sector activities.
- APP’s long-term vision recognize the need
- APP didn’t take into consideration climate
change and its effect.
- Farmer’s in rural areas are illiterate and
expansion of insurance company is missing
in such places.
- World after liberalization, Nepali Insurance
market where insurance penetration and
density is very low many foreign insurance
companies were lured.
- Nepalese Insurance market after
Nepalese Journal of Agricultural Sciences, 2021, volume 21 ISSN 2091-042X; eISSN 2091-0428
177
of formulating policy in view of recent
developments including the liberalized
economic environment , increased role of
private sector , Nepal’s Millennium
Development Goal commitment , and
Nepal’s commitment to the WTO and
regional trading arrangements.
- ADS consider the agricultural sector in its
complexity and encompass not only the
production sectors but also the processing
sectors trade and other services.
- Provisions on livestock and crop insurance
and extension of livestock insurance
program by National Agriculture Policy
(2004 AD).
liberalization was assaulted by the pressure
of globalization, competition from
multinational insurance companies and
lavish under writing chase which can be
seen as threats as well as opportunities for
insurance companies.
- Attitude and extension of technician , client
to work in rural , undeveloped area
CONCLUSION
As per the study, agricultural sector had very low insurance uptake as compared
to other economic sectors like manufacturing, mining and services. Farmers
perceived insurance as an unnecessary expense instead of a future risk
mitigating measure. Specific factors such as age, experience, farmer's level of
education, land size, insurer's credibility and insurance satisfaction determined
farmer’s preferences directly related to farmer's risk aversion, which ultimately
defined insurance product demand.
One of the key challenges in adoption of agriculture insurance in Nepal was
the user and supplier confidence in product, as consumers were influenced
by various factors but for provider they were using agriculture insurance to
broaden their business in the life insurance sector.
There was a disparity between technology and the understanding of
farmers; and thus various mitigating strategies need to be adopted, such as
advertisement, extension and attractive insurance policy.
As of the third quarter of FY 2075/76, Shikhar Insurance Company (SICL)
holds a lead position with insurance policies and also had the highest net
premium. Among the private companies Shikhar insurance was a leading
entity likewise the only existing governmental insurance company i.e.
Rastriya Beema Company was the most profited company.
Initially, agriculture started with six insurance products based on cost of
production until 2018, more than 70 insurance products had been
developed. Based on demand of farmer’s and market need, about 55
insurance products (including 49 vegetable crops) were designed based on
value of production.
RECOMMENDATIONS
Based on findings of the study following recommendation can be made:
Nepalese Journal of Agricultural Sciences, 2021, volume 21 ISSN 2091-042X; eISSN 2091-0428
178
Discussion with insured, insurers and Government to alleviate problems of
compensation time for insured and subsidy time for insurers.
A national database could be created. This database should provide accurate
and consistent agricultural yield statistics, crop production losses, livestock
mortality rates, geographic and meteorological information to agricultural
insurers, which would enable them to improve their product design.
More intensive study should be performed to assess the scale of basis risk,
farmers’ acceptance of and willingness-to-pay for innovative programs, and
their impacts on farmers’ agricultural production behaviors.
Insurance companies must have the power to introduce individual scheme
for agriculture insurance.
REFERENCES Anonymous, (2016) Nepal: Huge challenges in preparing for natural disasters. The New
Humanitarian Available at:
http://www.thenewhumanitarian.org/feature/2008/10/08-0 [Accessed Oct 12, 2019].
Bima Samiti, (2017) Crop and Livestock Insurance Report, Bima Samiti, Kupandole, Lalitpur,
Nepal
Chaudhary, D. (2018). Agricultural Policies and Rural Development in Nepal: An Overview.
[online] Available at: https://www.nepjol.info
Dick, W.J.A., Wang, W. (2010) Governmental Intervention in Agricultural Insurance [Online]
Available at:
https://www.researchgate.net/publication/251722149_Government_Interventions_in_Agr
icultural_Insurance/link/0267a4180cf2946d9a22314a/download
FAO, (2011) Agricultural insurance in Asia and the Pacific region, Food and Agriculture
Organization of the United Nations Regional Office for Asia and the Pacific, Bangkok
Liang, L. (2014) Federal crop insurance and credit constraints/ : theory and evidence. In:
Agricultural & Applied Economics Association’s 2014 AAEA Annual Meeting,
Minneapolis, MN, 27-29 July
Sharesansar.com (2019) Which Life Insurance Company Earned How Much? Nepal Life And
Reliable Nepal Maintain The Lead. [online] Available at:
<https://www.sharesansar.com/newsdetail/which-life-insurance-company-earned-how-
much-Nepal-life-and-reliable-Nepal-maintain-the- lead?
Fbclid=IwAR2jLYuBGliLw0k4BQmIBr2w4SaLSewI89i7FvjHIruG1hWz6JvMwVK_pF
w> [Accessed 5 March 2020].
Shashi kiran. &Umesh, K. B. (2015). Willingness to pay for crop insurance premium: a study on
maize farmers in India. In: Conference of International Association of Agricultural
Economists, Milan, Italy. [online] Available at:
https://econpapers.repec.org/paper/agsiaae15/210867.htm[Accessed 14 Nov. 2019].
Timsina, K.P., Ghimire, Y.N., Kandel, G., &Devkota, D. (2018) Does program linking with
insurance makes agriculture insurance sustainable? Journal of Agriculture and
Natural Resources, 1(1), 6-20. [online] Available at: http://prithucollege.edu.np/wp-
content/uploads/2018/12/02-full- article.pdf[Accessed 14 Nov. 2019]
Tsikirayi, C.R., Makoni, E., & Matiza, J. (n.a) Analysis of the uptake of agricultural insurance
services by the agricultural sector in Zimbabwe, Journal of International Business and
Cultural Studies
World Bank, (2009) Agricultural Insurance Feasibility Study for Nepal. Draft report. Report
No.46521-NP
World Bank, (2011) Weather Index Insurance for Agriculture: Guidance for Development
Practitioners. Agriculture and Rural Development Discussion Paper 50
Nepalese Journal of Agricultural Sciences, 2021, volume 21 ISSN 2091-042X; eISSN 2091-0428
179
Influence of rice residue management practices on
yield and yield attributing parameters of wheat grown
with different levels of nutrients under rice-wheat
cropping system in Western Terai
Rita Amgain1, Dinesh Khadka
1, Sushila Joshi
1 &
Narayan Khatri2
1National Soil Science Research Centre, NARC, Khumaltar Lalitpur, Nepal
2National Wheat Research Program, NARC, Bhairahawa, Rupandehi, Nepal
Corresponding Author:[email protected];
ABSTRACT
Adoption of mechanized farming in Nepal is increasing
specially for harvesting of rice and wheat which leaves a large
volume of crop residue in the field which is either burnt or
dumped. Considering this, a study was conducted to examine
the effect of three residue management practices viz. residue
removal, residue incorporation and residue burning with three
level of fertilizers (control, recommended dose of NPK and
125% of recommended dose of NPK fertilizer) on grain yield
and yield attributing characters of wheat at National Wheat
research Program, Bhairahawa, Rupandehi district of Nepal
during 2018 and 2019. The experiment was laid out in split
plot design with residue management as a main plot and
fertilizer level as subplot replicated three times. Result of the
study revealed that there was no significant difference of
residue management practices on grain yield of wheat in both
years. But fertilizer level had significant influence on yield
and yield attributes of wheat. Highest grain yield was
obtained from 125% of recommended dose of NPK fertilizer
which was statically at par with recommended dose of NPK
fertilizer. Similarly, the interaction of treatment combination
of residue management practices and fertilizer levels were not
significant for yield and yield attributes. The higher grain
yield was observed in the treatment with residue incorporated
along with 125% of recommended dose of NPK fertilizers.
Key words: Rice residue, fertilizer level, wheat, grain yield
INTRODUCTION
Rice-wheat cropping system is one of Nepal’s principal agricultural production
systems and it covers about 0.5 million ha of land in the country (Ladha et al
Nepalese Journal of Agricultural Sciences, 2021, volume 21 ISSN 2091-042X; eISSN 2091-0428
180
2003). Rice (Oryza sativa L.) and Wheat (Triticum aestivum L.) crops in total share
65u.8 % and 72.1 % to the total area and total production of cereal crops in the
country respectively, which provides food, income and employment to cover
83% of the Nepalese. Thus, the rice-wheat production system has great
importance in assuring food security and enhancing livelihood of the Nepalese
population (Tripathi , 2010).Wheat is the third most important crop in Nepal after
rice and maize with a total acreage of 0.73 million ha in 2016 (MOAD, 2017).
Nutrient and residue management are major issues in present condition of
Nepal. Farmers are applying by own way as the availability of inputs and
manage residue as their own practices. Crop residues, in general are parts of the
plants left in the field after crops have been harvested and threshed. A large
amount of rice and wheat residue is annually produced in the rice and wheat
growing countries. Moreover, the adoption of mechanized farming has resulted
in leaving a sizeable amount of rice straw in the field after harvesting the grain.
In rice-wheat cropping system, the residues of rice and wheat amount to as
much as 7-10 t ha-1
each year. Both rice and wheat are exhaustive feeders of
nutrients, and the double cropping system is heavily depleting the soil of its
nutrient content. A rice-wheat sequence that yields 7 t ha-1
of rice and 4 t ha-1
of
wheat remove more than N 300, P 30 and K 300 kg ha-1
from the soil (Singh
and Singh, 2001). Another estimate shows that 10 t ha-1 crop removes 730 kg
NPK from the soil that is often not returned to the soils (Gupta et al., 2002). If
this residue is not returned this may cause mining of soil for major nutrients
leading to net negative balance and multi- nutrient deficiencies in crops.
Further, incorporation of rice straw is being wider in C: N ratio causes the
immobilization of nitrogen which further decreases the grain yields (Bhatt et al.,
2015). Management of rice straw is a serious problem than wheat straw,
because there is very little turn -around time between rice harvest and wheat
sowing and due to the lack of proper technology for recycling. Due to this
reason, in terai region of our country, most of the farmers are burning the crop
residues. But this practice causes loss of nutrients and organic matter, killing of
beneficial soil microorganisms and thereby causes air pollution.
According to Mandal et al. (2004) burning of rice residues causes the large
losses of N up to 80 %, 25% of phosphorus and 21 % of K2O and 4-60 % of S.
According to Singh et al., (2018), increased air pollution during rice straw
burning periods has become a serious environment problem in large cities in
northern India and southern Nepal. Therefore, there is an urgent need to develop
suitable residue management practices to avoid the rice residue burning in this
region. Therefore, the objectives of this study was to examine the effects of
three residue management practices with three nutrient levels on grain yield of
wheat in rice- wheat system.
Nepalese Journal of Agricultural Sciences, 2021, volume 21 ISSN 2091-042X; eISSN 2091-0428
181
MATERIALS AND METHODS
An experiment was conducted for two consecutive years 2018 and 2019 at
NWRP, Bhairahawa to study the optimum level of nutrient with the best option
of rice residue management and its effect on wheat yield and yield attributing
character in rice- wheat cropping system. The study area was located at 270
32’
north latitude and 83025’ east longitudes with the elevation of 104 masl. The
experiment was laid out in split plot design replicated three times. The three
residue management options were kept on main plot and three fertilizer level
were kept on sub plot. Three residue management options consists of burning
residue (left over residue after harvesting of crops by using combine harvester
i.e. bottom 30cm of straw) (R1), incorporation of residue( bottom 30cm straw)
(R2), and removal of Residue (R3) and three fertilizer level consists of control
(F1), recommended dose of fertilizer (100: 50: 50 N P2O5 K2O for wheat and
100: 60: 40 N P2O5 K2O for rice) (F2) and 125% of recommended dose (F3).
Wheat variety Vijaya was selected and sown on 30th November 2018 (14th
Mangsir, 2075) and 29th
November 2019 (13th
Mangsir, 2076) at spacing of 25
cm between rows with continuous sowing. The experiment was repeated in the
same plot. Half dose of nitrogen and full dose of phosphorus and potassium
were applied as a basal at the time of seed sowing. Remaining half dose of
nitrogen was top dressed at 30 and 45 days after sowing. Five plants were
selected randomly from each plot at harvest to measure the plant height, spike
length, number of spike per meter square, number of grain per five spike and
their averaged values were used for analysis. Grain yield were taken from inner
8 rows at harvesting. The harvested plants were sun dried on threshing floor and
threshed, sun dried, cleaned and final weight of grain was taken. Digital
Moisture Meter was used to record the moisture percentage of the grain. Finally
grain yield was adjusted at 12% moisture using the following formula:
(100-MC) × Plot yield (kg)
Gain yield (kg ha-1) at 12% moisture = ×10000 (m2)
(100-12) × Net plot area (m2)
Where, MC is the moisture content in percentage of the grains.
The recorded parameters were tabulated in Microsoft Excel and subjected to
Analysis of Variance (ANOVA) using STAR software version 2.0.1. Significant
means were separated by using Duncan’s Multiple Range Test (DMRT) at 5%
level of significance (Gomez and Gomez, 1984).
RESULTS AND DISCUSSION
Plant height, number of effective tillers and spike per square meter
The plant height was not influenced by residue management options in both
years (Table 1). However, fertilizer level had significant effect on plant height
Nepalese Journal of Agricultural Sciences, 2021, volume 21 ISSN 2091-042X; eISSN 2091-0428
182
on both years. Recommended dose of fertilizer had significantly taller plant
height as compared to control but at par with the treatment of 125% of
recommended dose of fertilizer.
Number of effective tiller per square meter (spike/m2) was not influenced by
residue management treatments in both years. However, number of spike per
square meter was significantly affected by fertilizer level in both years. The
recommended dose of fertilizer had greater number of spike per square as
compared to control in year first whereas, in second year highest number of
spike per square meter was recorded from the plots treated with 125% of
recommended dose of fertilizer but statistically similar with recommended dose
of fertilizer (Table 1).
Spike length and number of grain per five spikes
Spike length was not significantly affected by residue management options in
year first but significantly influenced in year second. Among the residue
management treatment, residue incorporation had longest spike length and the
treatment with residue removal had shortest spike length. Similarly, spike
length was significantly influenced by fertilizer level in both years (Table 2).
Table 1. Effect of residue management practices with fertilizer level on
plant height and spike per square meter of wheat, NWRP, Bhairahawa,
2018 and 2019
Treatments Plant height Spike per square meter
Year 2018 Year 2019 Mean Year 2018 Year 2019 Mean
Residue management options
(A)
Residue burning 96.22 93.31 94.77 288.8 288.7 288.7
Residue incorporation 94.82 93.22 94.02 275.3 284.1 279.7
Residue removal 92.96 92.02 92.49 295.2 303.0 299.1
LSD 0.05 5.079ns 3.77ns 2.47ns 50.64ns 24.43ns 32.27ns
SEM 1.29 0.96 0.63 12.90 6.22 8.22
Fertilizer level (B)
125% of recommended dose 97.56a 96.33a 96.94a 296.0a 354.2a 325.1a
Recommended dose 97.78a 97.11a 97.44a 314.8a 334.8a 324.8a
Control 88.67b 85.11b 86.89b 248.6b 186.8b 217.7b
LSD 0.05 5.33** 2.65*** 3.66*** 41.17* 32.55*** 24.94***
SEM 1.73 0.86 1.18 13.36 10.56 8.09
Interaction
F- test of A × B ns ns ns ns ns ns
SEM 2.76 1.55 1.79 22.88 16.18 14.09
CV% 5.5 2.8 3.2 14.0 10.9 11.5
SEM= standard error of mean, CV= coefficient of variation, Treatment means separated
by Duncan’s Multiple Range Test (DMRT) and columns represented with same letter(s)
are not significantly different among each other at 5% level of significance.
Nepalese Journal of Agricultural Sciences, 2021, volume 21 ISSN 2091-042X; eISSN 2091-0428
183
In year first, longest spike length was recorded from the treatment with 125% of
recommended dose of fertilizer which was statistically similar with
recommended dose of fertilizer. But in the second year, longest spike length was
recorded from recommended dose of fertilizer which was statistically similar
with 125% of recommended dose of fertilizer.
Number of grain per five spikes was influenced by residue management
treatments but not affected by fertilizer level in year first only. Higher number of
grain per five spikes was recorded from treatment with residue incorporation
which was at par with residue removal treatment. But in the second year, residue
management options had not shown effect on grain per five spikes but fertilizer
level had influenced significantly. Higher number of grain per five spikes was
obtained from recommended dose of fertilizer, but it was statistically similar
with 125% of recommended dose of fertilizer (Table 2).
Table 2. Effect of residue management practices with varying fertilizer
levels on spike length and number of grain/five spike of wheat (2018 and
2019)
Treatments Spike length (cm) Number of grain /five spike
Year
2018
Year
2019
Mean Year
2018
Year
2019
Mean
Residue management
options(A)
Ressidue burning 9.04 9.18 9.11b 165.7b 149.3 157.5
Residue incorporation 9.27 9.4 9.33a 190.4a 157.0 173.7
Residue removal 8.89 9.07 8.97b 181.7a 159.9 170.8
LSD 0.05 0.76ns 0.31ns 0.27* 18.33* 35.32ns 21.62ns
SEM 0.19 0.08 0.06 4.67 8.99 5.51
Fertilizer level
125% of recommended dose 9.58a 9.89a 9.73a 178.6 163.6a 171.1
Recommended dose 9.29a 9.91a 9.60a 176.6 168.3a 172.4
Control 8.33b 7.84b 8.09b 182.7 134.3b 158.5
LSD 0.05 0.72** 0.42*** 0.40*** 19.52ns 26.20* 17.72ns
SEM 0.23 0.0.13 0.13 6.33 8.50 5.75
Interaction
F- test of A × B ns ns ns ns ns ns
SEM 0.38 0.21 0.20 10.10 10.10 9.82
CV% 7.8 4.5 6.1 10.6 10.10 12.2
SEM= standard error of mean, CV= coefficient of variationTreatment means separated by Duncan’s
Multiple Range Test (DMRT) and columns represented with same letter(s) are not significantly
different among each other at 5% level of significance.
Grain yield and thousand grain weight
Grain yield was not influenced by residue management practices in both years.
But fertilizer level highly influenced in both years. The higher grain yield was
recorded from 125% of recommended dose of fertilizer than control but at par
Nepalese Journal of Agricultural Sciences, 2021, volume 21 ISSN 2091-042X; eISSN 2091-0428
184
with recommended dose of fertilizer (Table 3). Weight of thousand grains was
significantly influenced by residue management options in both years but in the
first year, higher test weight was recorded from residue burning treatment and in
the second year, higher test weight was recorded from residue incorporation
treatment. Similarly, fertilizer level had not shown significant effect on thousand
grain weight in year first but influenced significantly in second year. The higher
thousand grain weight was recorded from the plots treated with 125 % of
recommended dose of fertilizer as compared to control in both years.
Table 3. Effect of residue management practices and fertilizer levels on
grain yield and thousand grain weight of wheat (2018 and 2019)
Treatments Grain yield (kg/ha) Thousand grain weight (g)
Year
2018
Year
2019
Mean Year
2018
Year
2019
Mean
Residue management
practices (A)
Residue burning 3254 2609 2932 58.38a 43.64b 51.01
Residue incorporation 3651 2748 3199 53.68b 46.38a 50.03
Residue removal 3620 2748 3184 57.41a 42.38b 49.89
LSD 0.05 416.1ns 216.2ns 247ns 2.59* 1.64* 2.09ns
SEM 106 55.1 62.9 0.66 0.41 0.53
Fertilizer level (B)
125% of recommended dose 4246a 3457a 3852a 57.07 45.07a 51.06
Recommended dose 4066a 3279b 3673a 56.92 44.49a 50.71
Control 2212b 1369c 1791b 55.50 42.84b 49.17
LSD 0.05 704.6*** 160.8*** 361.8*** 2.83ns 1.49* 1.99ns
SEM 228.7 52.2 117.4 0.91 0.48 0.64
Interaction
F- test of A × B ns ns ns ns * ns
SEM 340.3 92.2 177.6 1.45 0.80 1.06
CV% 19.6 5.8 14.0 4.9 1.6 2.9
SEM= standard error of mean, CV= coefficient of variation Treatment means separated by
Duncan’s Multiple Range Test (DMRT) and columns represented with same letter(s) are not
significantly different among each other at 5% level of significance
The interaction of treatment combination of residue management options and
fertilizers levels were not significant for plant height, spike length, number of
spike per square meter, number of grain per five spike, and grain yield in both
years (Table 1,2 ,3)however, the highest grain yield was obtained from residue
incorporation with 125% of recommended dose of fertilizer followed by residue
incorporation with recommended dose of fertilizer in both years but thousand
grain weight was found significant in second year (Table 3). In general, the
highest thousand grain weight was recorded from residue incorporation with
125% of recommended dose of fertilizer.
DISCUSSION
This study was carried out to examine the effects of three residue management
practices with three nutrient levels on plant growth, yield attributing characters
Nepalese Journal of Agricultural Sciences, 2021, volume 21 ISSN 2091-042X; eISSN 2091-0428
185
and grain yield of wheat in rice- wheat cropping system. The effect of residue
management practices on grain yield and yield attributing characters were
found non-significant in both years. It needs longer time to demonstrate the
effect of residue management in soil and crops. Due to this reason, the non-
significant result might be obtained from residue management treatment. In
few studies, wheat yield were lower during the first one to three years of straw
incorporation because of immobilization of soil N in presence of crop residues
with wide C/N ratio, but in later years straw incorporation did not affect wheat
yields (Mandal et al. 2004).Pandey and Kandel (2019), also indicated that there
was no significant different on wheat yield with rice residue retention treatment
during first year of experiment but increased grain yield in the second and
third year indicating the potential increase in wheat yield due to rice residue
retention in long run.
Application of different dose of fertilizer had shown significant difference on
yield and yield attributes of wheat in both years. Increased the fertilizer level
increased the grain yield of wheat. This may be due to the increment in nutrient
uptake by cop by increasing the fertilizer level. Similar result was also reported
by Dotaniya (2013).
The treatment combination of residue management practices with fertilizer
level had not shown significant difference on yield and yield attributes in both
years, however higher grain yield was observed from the application of 125 %
of recommended dose of fertilizer in combination with residue incorporation as
compared to residue removal and residue burnt. This result was in accordance
with the findings of Sarwar et al., (2008). Similarly, Ali et al. (2.16) reported
that residue incorporated with 25% additional N + recommended NPK fertilizer
gave higher grain yield of wheat. Application of inorganic fertilizers with crop
residues accelerates the decomposition of residue in soil and increase the easy
availability of plant nutrients from the soil solution hence increase the crop
yield. Several evidences revealed that proper residue incorporation and
fertilization management practices can reduce nitrogen immobilization into the
soil. Zhang et al. (2016) reported that the incorporation of straw was a good
method for increasing soil fertility and better yield production in semiarid
region of China. According to Kumari et al. (2019) the crop residue offers
sustainable and ecologically sound alternatives for meeting the nutrient
requirements of soil, crop productivity and environmental quality.
CONCLUSION
The result of this study indicated that among three residue management
practices, viz. residue removal, residue burning and residue incorporation;
incorporation of rice residue showed the positive impact on wheat grain yield.
Nepalese Journal of Agricultural Sciences, 2021, volume 21 ISSN 2091-042X; eISSN 2091-0428
186
Therefore, rice residue incorporation is recommended as the best residue
management practices for sustainable rice wheat production. The result of the
experiment also concluded that there was statistically no difference on grain
yield of wheat with the application of recommended dose of fertilizer and 125%
of recommended dose of fertilizer. Similarly, interaction effect was not differed
significantly however highest grain yield was obtained from incorporation of
residue with 125% of recommended dose of NPK fertilizer as compared to
residue burning and residue removal in rice wheat cropping system.
ACKNOWLEDGEMENTS
The authors would like to acknowledge Nepal Agricultural Research Council for
funding this research. We are very much thankful to staffs of National wheat
Research Program Bhairahawa for their hard work during entire period of
experiment. Similarly, support of the National Soil Science Research Centre,
Khumaltar, Lalitpur for providing moral and physical support as well as other
technical support is highly acclaimed.
REFERENCES Ali, M.N., Alam M.P, Ahmad, E., and Sah, A. (2016) Effect of different residue management
practices of rice on growth and yield of wheat and soil health in rice- wheat
system.International Journal of Bio-resource and Stress Management, 7(4) pp 567-574
DOI: https:// doi.org/10.5958/0976-4038.2016.00090.7
Bhatt R, Kukal, SS, Busari, MA Arora, S and Yadav, M., (2015) Sustainability issues on rice-wheat
cropping system. Journal of International Soil and Water Conservation Research 4 (1):
64-74.
Dotaniya, M.L. (2013) Impact of crop residue management practices on yield and nutrient uptake in
rice- wheat system.Current Advances in Agricultural Sciences, 5(2) pp 269-271.
Gupta RK, Shukla, AK, Ashraf, M, Ahmed, ZU, Sinha, RKP and Hobbs, PR (2002) Options for
establishment of rice and issues constraining its productivity and sustainability in eastern
Gangetic plains of Bihar, Nepal and Bangladesh, Rice-Wheat Consortium Travelling
Seminar Report Series 4, New Delhi, India: Rice-Wheat Consortium for the Indo-
Gangetic Plains. pp 36
Jhang, P., Chen, X., Wei, T., Yang, Z.,Jia, Z., Yang, B., and Ren, X.,(2016) Effects of straw
incorporation on the soil nutrient contents, enzyme activities, and crop yield in a semiarid
region of China. Soil and Tillage Research, 160:65-72.
Kumari, R.,Singh, R., and Kumar, N., (2019) Effect of crop residue management on soil organic
carbon, soil organic matter and crop yield: an overview. Journal of Applied and Natural
Science, 11(3) pp 712-717 DOI: https:// doi.org/10.31018jans.v11i3 .2152
Ladha J K, Dawe D., Pathak, H., Padre, AT, Yadav RL, Bijay S, Singh Y, Singh P, Kundu A L,
Sakal R, Ram N, Regmi AP, Gami SK, Bhandari A L, Amin R, Yadav CR, Bhattari EM,
Das S, Aggarwal HP, Gupta RK, Hobbs PR. (2003) How extensive are yield declines in
long-term rice-wheat experiments inAsia? Field Crops Research, 81: 159-180
Mandal, K.G., Mishra, A.K, Hati, K.M., Bandyopadhyay, K.K., Ghosh, P.K., and Mohanty, M.
(2004) Rice residue management options and its effects on soil properties and crop
productivity. Journal of Food Agriculture &Environment, 2(1), 224-231.
Ministry of Agricultural Development (2017) Statistical Information on Nepalese Agriculture,
2015/2016.Agri-statistic section, Monitoring, Evaluation and Statistic Division, Ministry
of Agricultural Development Singh Durbar Kathmandu, Nepal
Nepalese Journal of Agricultural Sciences, 2021, volume 21 ISSN 2091-042X; eISSN 2091-0428
187
Pandey, B.P., and Kandel, T.P. (2019) Growth and Yield response of wheat to tillage, rice residue
and weed management under Rice- Wheat cropping system. Global Journal of
Agricultural and Allied Sciences, 1(1): 43-48
Sarwar, G., Hussian, N., Schmeisky H, Muhammad, S., Ibrahim, M. and Safdar, E. (2008).
Improvement of soil physical and chemical properties with compost application in rice-
wheat cropping system,.Pakistan Journal of Botany, 40:275-282.
Singh Y and Singh, B.(2001) Efficient Management of Primary Nutrients in the Rice-Wheat
System. In: Kataki, P.K. (Ed.). The Rice-Wheat Cropping Systems of South Asia:
Efficient Production Management. Food Products Press, New York, USA. 23-85.
Singh, J., Singhal, N., Singhal, S., Sharma M., Agarwal, S., and Arora, S. (2018) Environmental
implications of rice and wheat stubble burning in north- western states of India, In:
Advance in Health and Environment Safety 47-55. Springer, Singapore.
Tripathi, J. (2010). Evaluation and promotion of resource conservation technologies in low land rice-
wheat ecosystem, Agronomy Journal of Nepal, 1: 28-39
Nepalese Journal of Agricultural Sciences, 2021, volume 21 ISSN 2091-042X; eISSN 2091-0428
188
Effect of supplementation of soybean cake and
roasted soybean in broiler diet on the growth
performance of turkey poults
Mukesh Karki1, Megh Raj Tiwari and Ritesh Shah
1
1 Directorate of Agricultural Research Station, Province 1.Tarahara, Sunsari,
Nepal
Corresponding Author: [email protected]
ABSTRACT
The observation was conducted at Poultry Research Unit of
Directorate of Agricultural Research, Province No 1
Tarahara from 12 June 2020 to 16 August 2020. A total of
forty five turkey poults of 2-week age were randomly divided
and assigned into three dietary treatments with three
replications.Commercially available broiler feed was
considered as basal diet (T1), Treatment 2 (T2) was prepared
by supplementation of 15% of roasted soybean to T1and
Treatment 3 was prepared by supplementation of 15% of
soybean cake to T1. Feed intake was recorded daily; body
weight was recorded at 2-week interval and cumulative feed
efficiency was calculated at 8-week of age. Significantly
(p<0.01) higher body weight was observed in the poults fed
with T3 (1370.0 ± 30.0 g), followed by T2 (1328.0 ± 29.1 g)
than that of the basal feed (1172.7 ± 37.9 g). Similarly,
cumulative feed intake was recorded significantly (p<0.001)
higher in T2 (3138 ± 9.5 g), followed by T3 (3093 ± 11.2 g)
than that of basal feed T1 (3004 ± 10.0 g). Up to the age of 8-
week, significantly (p<0.05) better feed conversion ratio
(FCR) was observed in the turkey poults fed with T3 (2.57 ±
0.067) than that of basal feed (2.99 ± 0.096). Treatment-2 also
exerted positive improvement in FCR (2.71 ± 0.065) than that
of basal feed; however the difference was not statistically
significant than T1 but at par with T2. The study clearly
indicated that supplementation of either soybean cake (15%)
or roasted soybean (15%) in commercial broiler feed could be
beneficial in enhancing higher body weight and better FCR up
to the 8-week age of turkey poults rearing.
Keywords: Body weight, FCR, feed intake, soybean, turkey
Nepalese Journal of Agricultural Sciences, 2021, volume 21 ISSN 2091-042X; eISSN 2091-0428
189
INTRODUCTION
Turkey is an important poultry species reared primarily for meat production. As
of 2019, turkey shared 4.5% to the total poultry production of the world with
contributing around 6 million tons of meat (FAOSTAT, 2021). In Nepal, it was
introduced first time for research purpose in January 2001 at Regional
Agricultural Research Station, Parwanipur, NARC, Nepal. Consequently, the
parent sock of turkey has extended to different research station of NARC as well
as of private farms. Studies carried out in the past indicated that turkey could be
reared easily with more or less similar feeding and management conditions as
chicken and farming is possible under wide range of climatic condition (Karki
2005). Observation carried out at Bara, Parsa and Rautahat district of Nepal
showed that turkey can be successfully reared even under scavenging low input
management with male and female turkey attained 12.99±0.98 kg and 5.83±0.24
kg, respectively (Paudel et al, 2009). However, feeding management and rearing
of turkey poults at initial age have always been major challenge for farmers. At
present turkey feed are not commercial available in the market so majority of
farmers used broilers/layers feed. Bhanja and Majumdar (2001) reported that
turkey need high protein diet at early stage i.e. 28% protein and 2800Kcal ME
with lysine (1.6%) and methonine (0.55%) up to 4 weeks of age, 25% protein
and 2900 Kcal ME with lysine (1.5%) and methonine (0.45%) for 5- 8 weeks,
22% protein with 3000 Kcal ME for 9-12 weeks and then slowly step down of
protein and gradually increase in dietary metabolic energy with age. It was
mentioned that chicken ration may not able to sustain rapid growth of turkey
poults at initial age. Research conducted in the Regional Agricultural Research
Station, Parwanipur suggested supplementing soybean cake in broiler ration to
enhance growth and feed efficiency of turkey poults (Karki, 2005). Though
soybean cake/meal is one of the most common protein source for non-ruminants
diet in around the world (Ibanez et al, 2020), it is not commonly found in the
Nepalese market. Unavailability of soybean cake in the ordinary Nepalese
market is being constrained to adopt soybean cake supplementing technology by
ordinary turkey growers. Therefore, there is need of explore alternate protein
rich ingredients which have potentialities to adopt by turkey growers. Soybean is
most commonly locally available in Nepal but presence of anti nutritional
factors that prevent the direct use of raw soybean in turkey (Linerode et al,
1961), toasting process reduced antinutrients to lower level (Qureshi and
Christensent, 2004). So the study was designed to know the growth performance
of turkey poults feeding on broiler ration supplementing with roasted soybean.
MATERIALS AND METHODS
Location and duration of study
The observation was conducted at poultry unit of Directorate of Agriclutlral
Research, (DoAR), Provience No 1, Tarahara during 12 Jun 2020 to 16 Aug
2020.
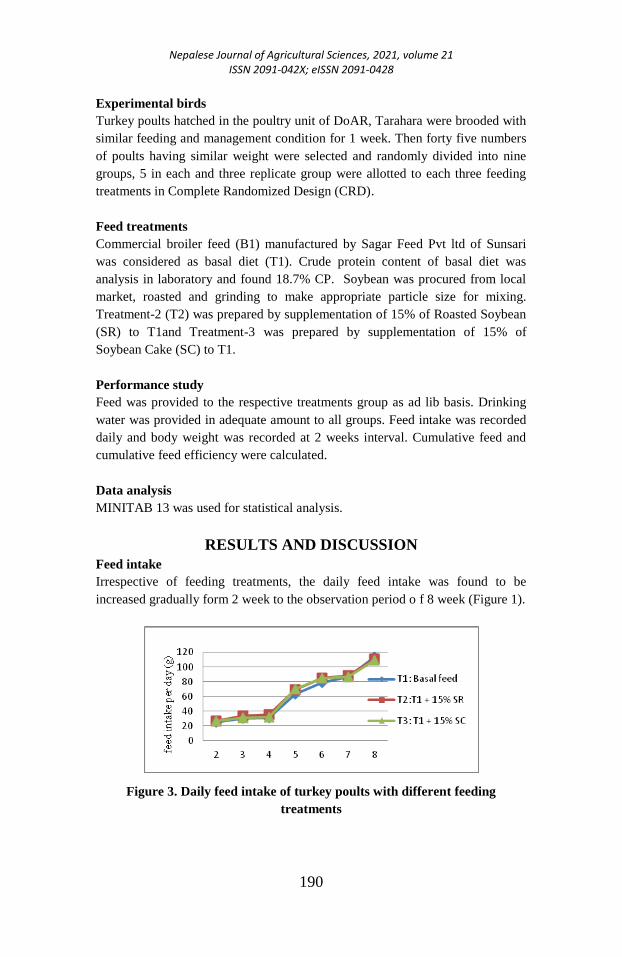
Nepalese Journal of Agricultural Sciences, 2021, volume 21 ISSN 2091-042X; eISSN 2091-0428
190
Experimental birds
Turkey poults hatched in the poultry unit of DoAR, Tarahara were brooded with
similar feeding and management condition for 1 week. Then forty five numbers
of poults having similar weight were selected and randomly divided into nine
groups, 5 in each and three replicate group were allotted to each three feeding
treatments in Complete Randomized Design (CRD).
Feed treatments
Commercial broiler feed (B1) manufactured by Sagar Feed Pvt ltd of Sunsari
was considered as basal diet (T1). Crude protein content of basal diet was
analysis in laboratory and found 18.7% CP. Soybean was procured from local
market, roasted and grinding to make appropriate particle size for mixing.
Treatment-2 (T2) was prepared by supplementation of 15% of Roasted Soybean
(SR) to T1and Treatment-3 was prepared by supplementation of 15% of
Soybean Cake (SC) to T1.
Performance study
Feed was provided to the respective treatments group as ad lib basis. Drinking
water was provided in adequate amount to all groups. Feed intake was recorded
daily and body weight was recorded at 2 weeks interval. Cumulative feed and
cumulative feed efficiency were calculated.
Data analysis
MINITAB 13 was used for statistical analysis.
RESULTS AND DISCUSSION
Feed intake
Irrespective of feeding treatments, the daily feed intake was found to be
increased gradually form 2 week to the observation period o f 8 week (Figure 1).
Figure 3. Daily feed intake of turkey poults with different feeding
treatments
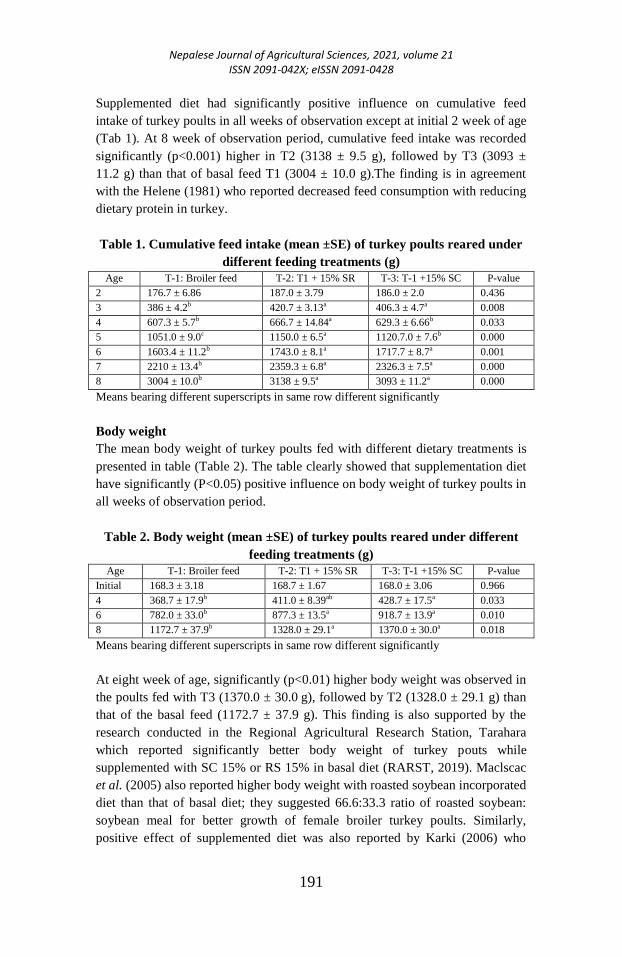
Nepalese Journal of Agricultural Sciences, 2021, volume 21 ISSN 2091-042X; eISSN 2091-0428
191
Supplemented diet had significantly positive influence on cumulative feed
intake of turkey poults in all weeks of observation except at initial 2 week of age
(Tab 1). At 8 week of observation period, cumulative feed intake was recorded
significantly (p<0.001) higher in T2 (3138 ± 9.5 g), followed by T3 (3093 ±
11.2 g) than that of basal feed T1 (3004 ± 10.0 g).The finding is in agreement
with the Helene (1981) who reported decreased feed consumption with reducing
dietary protein in turkey.
Table 1. Cumulative feed intake (mean ±SE) of turkey poults reared under
different feeding treatments (g)
Age T-1: Broiler feed T-2: T1 + 15% SR T-3: T-1 +15% SC P-value
2 176.7 ± 6.86 187.0 ± 3.79 186.0 ± 2.0 0.436
3 386 ± 4.2b 420.7 ± 3.13a 406.3 ± 4.7a 0.008
4 607.3 ± 5.7b 666.7 ± 14.84a 629.3 ± 6.66b 0.033
5 1051.0 ± 9.0c 1150.0 ± 6.5a 1120.7.0 ± 7.6b 0.000
6 1603.4 ± 11.2b 1743.0 ± 8.1a 1717.7 ± 8.7a 0.001
7 2210 ± 13.4b 2359.3 ± 6.8a 2326.3 ± 7.5a 0.000
8 3004 ± 10.0b 3138 ± 9.5a 3093 ± 11.2a 0.000
Means bearing different superscripts in same row different significantly
Body weight
The mean body weight of turkey poults fed with different dietary treatments is
presented in table (Table 2). The table clearly showed that supplementation diet
have significantly (P<0.05) positive influence on body weight of turkey poults in
all weeks of observation period.
Table 2. Body weight (mean ±SE) of turkey poults reared under different
feeding treatments (g)
Age T-1: Broiler feed T-2: T1 + 15% SR T-3: T-1 +15% SC P-value
Initial 168.3 ± 3.18 168.7 ± 1.67 168.0 ± 3.06 0.966
4 368.7 ± 17.9b 411.0 ± 8.39ab 428.7 ± 17.5a 0.033
6 782.0 ± 33.0b 877.3 ± 13.5a 918.7 ± 13.9a 0.010
8 1172.7 ± 37.9b 1328.0 ± 29.1a 1370.0 ± 30.0a 0.018
Means bearing different superscripts in same row different significantly
At eight week of age, significantly (p<0.01) higher body weight was observed in
the poults fed with T3 (1370.0 ± 30.0 g), followed by T2 (1328.0 ± 29.1 g) than
that of the basal feed (1172.7 ± 37.9 g). This finding is also supported by the
research conducted in the Regional Agricultural Research Station, Tarahara
which reported significantly better body weight of turkey pouts while
supplemented with SC 15% or RS 15% in basal diet (RARST, 2019). Maclscac
et al. (2005) also reported higher body weight with roasted soybean incorporated
diet than that of basal diet; they suggested 66.6:33.3 ratio of roasted soybean:
soybean meal for better growth of female broiler turkey poults. Similarly,
positive effect of supplemented diet was also reported by Karki (2006) who

Nepalese Journal of Agricultural Sciences, 2021, volume 21 ISSN 2091-042X; eISSN 2091-0428
192
found significantly higher body weight with Soybean cake supplemented diet
that that of basal diet. Lower body weight of turkey poults fed on basal diet in
this observation was due to the low protein content of the diet. Lower body
weight of turkey with reducing level of dietary protein was also reported by
Helene (1981).
Table 3. Cumulative FCR (mean ±SE) of turkey poults reared under
different feeding treatments
Age T-1: Broiler feed T-2: T-1 + 15% SR T-3: T-1 +15% SC P-value
4 3.07 ± 0.209a 2.76 ± 0.097ab 2.43 ± 0.127b 0.033
6 2.63 ± 0.108a 2.46 ± 0.042ab 2.29 ± 0.027b 0.037
8 2.99 ± 0.096a 2.71 ± 0.065ab 2.57 ± 0.067b 0.041
Means bearing different superscripts in same row different significantly
Effects of feed supplementation have revealed significant influence in feed
conversion ratio (FCR) of turkey poults (Table 3). Up to the age of 8 weeks,
significantly (p<0.05) better FCR was observed in the turkey poults fed with T3
(2.57 ± 0.067) than that of basal feed (2.99 ± 0.096). Treatment-2 also exerted
positive improvement in FCR (2.71 ± 0.065) than that of basal feed; however
the difference was not statistically significant than T1 but at par with T2. This
finding is also supported by the research conducted in the Regional Agricultural
Research Station, Tarahara which reported significantly better FCR in turkey
pouts while supplemented with SC 15% or RS 15% in basal diet (RARST,
2019). Similarly, positive effect of supplemented diet was also reported by
Karki (2006) who found significantly better FCR with Soybean cake
supplemented diet than that of basal diet.
CONCLUSION
The study clearly indicated that supplementation of either soybean cake (15%)
or roasted soybean (15%) in commercial broiler feed could be beneficial in
enhancing higher body weight and better FCR up to the 8 weeks age of turkey
poults rearing.
REFERENCES FAO (2021) Food and Agricultural Organization of the United Nations,
http://www.fao.org/faostat/en/#data/QL (Retrived on Jan 28, 2021).
Bhanja, S.K. and Majumdar, S. (2001) Formulation of turkey feed. In: Modern turkey production
and management (AKD Roy, ed). Turkey Research Unit, Central Avian Research Institute,
Izatnager, India. Pp. 49-52
Helene, C.C, (1981) Effects of dietary protein on body weight and reproductive performance of male
turkey, Poultry Science, 60, 1049-1055
Ibanez, M.A., Blas, C.D., Camara, L. and Mateos, G.G. (2020) Chemical composition, protein
quality and nutritive value of commercial Soybean meals produced from bean from different
countries: A meta analytical study, Animal Feed Science and Technology, 267, 1-15.
Karki, M. (2005) Growth, efficiency of feed utilization and economic of different rearing periods of
Turkeys, Nepal Agricultural Research. Journal, 6, 84-88.
Nepalese Journal of Agricultural Sciences, 2021, volume 21 ISSN 2091-042X; eISSN 2091-0428
193
Karki, M. (2006) Effect of supplementation of Soybena cake and Fishmeal with lysine and
Methionine in Broiler diets in the growth performance of Turkey poults, Nepal Agricultural
Research Journal, 7,70-74.
Linerode, P.A, Waibel, P.E. and Pomeroy, B.S. (1961) Effects of antibiotics, amino-acids, zinc and
enzymes on the growth depression in the turkey produced by ray soybean, The Journal of
Nutrition. 75,427-434
Maclscac, J. C., Burgoyne, K.L., Anderson, D.M. and Rathgerber, B.R. (2005) Roasted full fat
soybean in starter, grower and finisher diet for female broiler turkey. Journal of Applied
Poultry Research, 14,116-121
Paudel, S., Kuswaha, B.P., Karki, M. and Yadev, J.P. (2009) Productionn performance and
economics of turkey reared under scavenging condition. In: Porceedings of the 7th National
Workshop on Livestock and Fisheries Research in Nepal. 25-27 June 2007, Khumaltar,
Lalitpur; pp 154-156.
Qureshi, M.A. and Christensent, V.C. (2004) Response of turkey poults to soybean lectin level
typically encountered in commercial diets. 1. Effect on growth and nutrient digestibility.
Poultry Science, 83(9), 1359-1571.
RARST (2019) Annual Report 2075/76 (2018/19), Regional Agricultural Research Station, NARC,
Tarahara, Sunsari, Nepal
Nepalese Journal of Agricultural Sciences, 2021, volume 21 ISSN 2091-042X; eISSN 2091-0428
194
Factors affecting women farmers’ participation in
agricultural cooperatives in Lamjung and Nawalpur
districts, Nepal
Binayak Prakash Mishra* and S. Bhatta
Agriculture and Forestry University, Chitwan, Nepal
*Corresponding author:[email protected]
ABSTRACT
Agricultural cooperatives can empower women farmers by
providing easy access to inputs, credit, capacity building
trainings and marketing facility in the developing countries.
Yet, many women farmers lack participation in agricultural
cooperatives. A research was done during 2019 in Lamjung
and Nawalpur district of western Nepal to identify the factors
affecting the women farmers’ participation in agricultural
cooperatives. The study areas were selected purposely
whereas a total of 120 women farmers; 60 women famers from
each district were selected randomly. Pre-tested semi
structured interview schedule was used for household survey,
whereas respective checklists were used for Focus Group
Discussion (FGD) and Key Informant Interview (KII) to
gather primary data. The findings from probit model revealed
that need for input, credit and marketing facility significantly
affects women farmers’ participation in agricultural
cooperatives. Hence, agricultural cooperatives programs
should be linked with the service of input supplies, credit
support and market development for maximum participation of
women farmers in agricultural cooperatives.
Key words: Women, cooperatives, participation, input facility, credit
INTRODUCTION
Women plays a significant role in the agriculture development of the country as
more than 80% of women are directly involved in farming practices in Nepal
(FAO, 2019). They comprise larger proportion of the agricultural labor force,
yet facing the several constraints that limit their contribution. Generally, Women
face barriers to access finance, capacity and skill development programs, latest
technologies, lack of extension services, lower bargaining powerand inadequate
market related information (Sigdel, 2019; Pooja, Arunima & Meera, 2016).
Several government bodies like MoALD and National Agriculture Policy (2001)
primarily focuses on cooperatives as the potential formal institution to overcome
Nepalese Journal of Agricultural Sciences, 2021, volume 21 ISSN 2091-042X; eISSN 2091-0428
195
these challenges. Agricultural cooperatives are conventional cooperatives in
which farmers are associated voluntarily for common socio-economic objectives
carrying out agriculture business activities (Helm, 1968; Niroja, Mamoru &
Muto, 2015). Agricultural cooperatives facilitates the access to credit , technical
knowledge, capacity building trainings and many other related services to
women farmers in the communities. In Nepal, agricultural cooperatives aid in
higher production utilizing available resources and management skills in
community. Along with this, it help to generate greater profit from agriculture
production with lesser input cost implying latest technologies and marketing the
product at better prices (Msimango & Oladele, 2013). Furthermore, they play a
phenomenal role to establish strong linkage with extension workers for
dissemination of information relating to production practices, markets and post-
harvest issues. As guided by the cooperative principle, inclusion of women in
any cooperatives is necessary to increase productivity and reduce poverty (Meira
& Martinho, 2018). Thereon, active and equitable participation of women in
cooperatives is required for strong economic and social empowerment (Desalew,
2009; Kebede & Kassa, 2011). Despite the benefits, still many women farmers
lack the participation in agricultural cooperatives. Thus, this study attempts to
identify the factors affecting the women farmers’ participation in agricultural
cooperatives.
METHODOLOGY
Study area
The study was done during 2019 in Lamjung and Nawalpur district of western
Nepal representing two main agro-ecological regions of Nepal (Hills and Terai).
Agricultural cooperatives are well functioning in these districts. The surveyed
municipalities in the selected districts include: Sundarbazar, Rainas and
Besisahar (Lamjung district of hill region); Devachuli, Madhyabindu and
Kawasoti (Nawalpur district of terai region).
Sampling technique
The districts were selected purposively to represent two main agro-ecological
regions of Nepal. In each district, 3 municipalities were purposively selected
considering access to agricultural cooperatives to women farmers in these areas.
Population for this study were women farmers who were household head and
involved in small holding agricultural practices as the major occupation.
Smallholders constitute more than half of Nepalese farmers and have farm size
less than 0.5 ha per household (CBS, 2011). Sixty (60) women farmers were
selected from each district by simple random sampling. A total of 120 women
farmers were selected in the study area. The survey was carried out using a
pretested semi- structured interview schedule. One (1) Focus Group Discussion
(FGD) and 1 Key Informant Interview (KII) was carried out in each
municipality to complement the information gathered through household survey.
Nepalese Journal of Agricultural Sciences, 2021, volume 21 ISSN 2091-042X; eISSN 2091-0428
196
Empirical model
Descriptive analysis and t-test were done using SPSS. Probit model was
employed using STATA 12.0 in order to determine the factors affecting the
women farmers’ participation in agricultural cooperatives. Further, to assess the
effect of each independent variable on the women farmers participation in
agricultural cooperatives, marginal effect on those variables was estimated in the
probit model. This model was used to identify the determinants (regressors) on
the probability of participation in agricultural cooperatives (regressand). The
likelihood of women farmers participating in agricultural cooperatives is a non-
linear function of regressors. The probit model used is of the form Pr (Y = 1) =
(Xi) where Pr (Y = 1) represents the probability of participating in agricultural
cooperatives with the change in X variable. A positive estimated coefficient
implies an increase in likelihood of participation in agricultural cooperatives.
Relation between probability values (between 0 and 1) and explanatory variables
is established with probit model.
Let us suppose Yi is the binary response of the farmers, Yi = 1, if the women
farmer participate in agricultural cooperatives, and Yi = 0 if the women farmer
does not the farmer participate in agricultural cooperatives.
If Yi = 1; Pr (Yi = 1) = Pi
If Yi = 0; Pr (Yi = 0) = 1-Pi
Where Pi = E (Y=1/X) represents the conditional mean of Y given certain values
of X.
Model specification
The probit model specified in this study to analyze factors affecting women
farmers’participation in agricultural cooperatives was expressed as follows.
Pr (Y = 1) = f (b0 + b1 X1 + b2 X2 + b3 X3 + b4 X4 + b5 X5 + b6 X6 + b7 X7 + b8 X8
+ b9 X9 + b10 X10 + b11 X11)
Where,
Pr (Y =1) = Probability of women farmers participation in agricultural
cooperatives
X1 = Age of the household head (years)
X2 = Education of the household head (years of schooling)
X3 = Owned farm size (ropani)
X4 = Off- farm work by household head (dummy)
X5 = Household income (NPR)
X6 = Contact with extension workers (dummy)
X7 = Nature of production (dummy)
X8 = Need for input facility (dummy)
X9 = Need for credit facility (dummy)
X10= Need for marketing facility (dummy)
Nepalese Journal of Agricultural Sciences, 2021, volume 21 ISSN 2091-042X; eISSN 2091-0428
197
X11= Need for training facility (dummy)
b0 = Regression coefficient
b1, b2 . . . . . . . . . . . . b11 = Probit coefficient
The description of the variables used is presented in Table 1.
RESULTS AND DISCUSSION
Summary statistics and explanation of the variables are presented in Table 9. As
observed, 69% of the respondents were associated with agricultural
cooperatives. The average age of the respondents was 44.55 years. Respondents,
on average, had 8.93 years of formal schooling which is consistent with the
national average in Nepal (CBS, 2011).The mean land owned by respondents
was 7.11 ropani. Respondents’ household, on average, earned NPR. 355750 in a
year and 66% of the respondents were involved in off-farm work. Only 25% of
the respondents had regular contact with the extension workers.
Table 9. Descriptive statistics of the dependent and independent variables
used in the study
Variables Description Mean Standard
Deviation
Dependent Variable
Participation in
agricultural
Cooperatives
=1 if the respondent is member in agricultural
cooperatives, 0 otherwise
0.69 0.46
Independent variable
Age Age of the household head (years) 44.55 10.48
Education Years of formal education of the head 8.93 3.06
Owned farm size Own land used for agricultural practices
(ropani)
7.11 1.76
Off- farm Work =1 if respondent participate in off-farm work,
0 otherwise
0.66 0.48
Household Income Yearly income of the household (NPR) 355750 191344.90
Contact with
extension workers
=1 if respondent has regular contact with
extension workers, 0 otherwise
0.25 0.43
Nature of
Production
= 1 if commercial production, 0 subsistence
production
0.68 0.46
Input facility =1 if respondent has need for input facility, 0
otherwise
0.73 0.45
Credit facility =1 if respondent has need for credit facility, 0
otherwise
0.89 0.31
Marketing facility =1 if respondent has need for marketing
facility, 0 otherwise
0.64 0.48
Training facility =1 if respondent has need for training facility,
0 otherwise
0.65 0.48
Source: Field survey, 2019; Note: 9.83 ropani = 0.5 ha; 1 USD = 113.32 NPR
Also, 68% of the respondents had practiced commercial agriculture. Similarly,
73% of the respondents had a need for input facility, 89% had a need for credit
Nepalese Journal of Agricultural Sciences, 2021, volume 21 ISSN 2091-042X; eISSN 2091-0428
198
facility, 64% had a need for marketing facility and 65% had a need for training
facility.
The results of differences between means of characteristics describing members
and non-members of agricultural cooperatives are presented in Table 10. There
was a significant difference in off farm work, contact with extension workers,
nature of production, need for credit facility, need for input facility and need for
training facility between members and non- members. Contact with extension
workers was significantly higher for members compared with non-members.
The members of agricultural cooperatives did not differ from non-members for
need of marketing facility. Moreover, majority of members had a need for input
and credit facility compared to non- members. Additionally, there was no
significant difference in age, education, household income and owned farm size
among the groups.
Table 10. Characteristics of members and non-members of agricultural
cooperatives
Variables Members Non- members Difference t-value
Age 44.783 44.027 0.756 0.164
Education 8.84 9.14 -0.292 0.052
Owned farm size 7.04 7.27 -0.234 0.005
Off- farm work 0.735 0.486 0.248 10.222**
Household
income
386746.988 286216.216 100530.771 1.519
Contact with
extension
workers
0.325 0.081 0.244 61.041***
Nature of
Production
0.747 0.541 0.206 10.947***
Input facility 0.880 0.378 0.501 36.145***
Credit facility 0.976 0.703 0.273 136.636***
Marketing
facility
0.819 0.243 0.576 2.302
Training facility 0.735 0.459 0.275 9.543**
Source: Field survey, 2019
Note: ***, ** indicate significant at 1%, 5% level of significance, respectively.
Factors affecting women farmers’ participation in agricultural cooperatives
in the study area
Probit regression analysis was done to assess the factors influencing the
participation in agricultural cooperatives and results are presented in Table 3.
The Wald test (LR chi2) for the model showed that, the model had good
explanatory power at the 1% level. The Pseudo R2
was 0.388.
Marginal effect was also driven from the regression coefficients as shown in
Table 11. Probit regression analysis showed that, three variables were

Nepalese Journal of Agricultural Sciences, 2021, volume 21 ISSN 2091-042X; eISSN 2091-0428
199
statistically significant for the participation in agricultural cooperatives. They
were; need for input facility, need for credit facility and need for marketing
facility. The result showed the respondent’s propensity to participate in
agricultural cooperatives increased with the need for input facility as they were
positively significant (p<0.01). Keeping other factors constant, with need for
input facility, probability of participation in agricultural cooperatives will
increase by 37.2 percent. This is possibly because agricultural cooperative
provide easy access to agricultural inputs among its member at reasonable price.
Table 11. Probit regression analysis and marginal effect for factors
affecting the participation of women farmers in agricultural cooperatives
Variables Coefficients p-value S.E dy/dx S.E (dy/dx)
Age 0.015 0.456 0.020 0.004 0.006
Education -0.004 0.954 0.070 -0.001 0.022
Owned farm size -0.085 0.349 0.090 -0.027 0.028
Off- farm work 0.030 0.951 0.487 0.009 0.157
Household
income
-0.190 0.629 0.393 -0.060 0.126
Contact with
extension
workers
0.636 0.144 0.435 0.180 0.103
Nature of
Production
0 .199 0.581 0.361 0.065 0.120
Input facility 1.059*** 0.006 0.383 0.372 0.138
Credit facility 1.019* 0.059 0.538 0.377 0.205
Marketing
facility
1.016*** 0.005 0.365 0.343 0.123
Training facility 0.137 0.697 0.353 0.044 0.116
Constant 0.288 0.949 4.520
Summary statistics
Log likelihood = -45.304
LR chi2(11) = 57.65
Prob > chi2 = 0.000
Pseudo R2 = 0.388
Number of observation (N) = 120
Source: Field survey, 2019
Note: ***, * indicate significant at 1%, 10% level of significance, respectively;
S.E.: Standard Error
This result is similar to findings of WB, FAO & IFAD (2009); Woldu &
Tadesse (2015). Similarly, respondents having a need of credit facility will have
higher participation in agricultural cooperatives which is similar to the findings
of Atmiş et al. (2009); Awotide (2012); Baden (2013). The study showed that,
need for credit facility was positively significant (p<0.10) and keeping other
factors constant, with need for credit facility, the probability of participation will
increase by 37.7 percent. This is possibly because agricultural cooperative
provide easy access to credit among its member without collateral at low rate.
Likewise, respondents who need marketing facility also have positive relation
Nepalese Journal of Agricultural Sciences, 2021, volume 21 ISSN 2091-042X; eISSN 2091-0428
200
with participation in agricultural cooperatives. This result is similar to findings
of Beal (1953); Baden (2013); Kiprop et al. (2019). In the study, the need for
marketing facility was positively significant (p<0.01) and keeping other factors
constant, with need for marketing facility, the probability of participation will
increase by 34.3 percent. This is possibly because marketing of farm produce is
carried by agricultural cooperative and members experience low market risk. As
agricultural cooperatives are formal local institutions to provide loan service and
equipped with the necessary inputs, women farmers are more likely to get
engaged to them for credit and input facilities. Collective marketing is basically
done by cooperatives with pooling of farm produce and enhances bargaining
powers of farmers. Thus, participation to agricultural cooperatives also secures
market and provides market information in local level which increases the
participation of women farmers in those cooperatives.
CONCLUSION
The findings from this study revealed that need for input; credit and marketing
facility significantly drive women farmers to participate in agricultural
cooperatives. To promote women farmers’ participation, agricultural
cooperatives need to be closely entrenched in the community to provide input
services like quality seeds, fertilizers, irrigation and machineries. Financing the
women farmers without collateral could engage them in agricultural
cooperatives and eventually promote women’s investment in agribusiness.
Moreover, market- related agricultural cooperatives which are more focused in
agricultural value chains would persuade women farmers to participate in
agricultural cooperatives. Hence, government programs and policies related to
cooperatives programs should be linked with the service of input supplies, credit
support and market development for maximum participation of women farmers
in agricultural cooperatives.
REFERENCES Atmiş, E., Günşen, H. B., Lise, B. B. & Lise, W. (2009) Factors affecting forest cooperative's
participation in forestry in Turkey, Forest policy and economics, 11(2), 102-108.
Awotide, D. O. (2012) Assessment of women’s participation in cooperative societies and its
determinants in Yewa North local government area of Ogun state, Nigeria. Asian Journal
of Agriculture and Rural Development. 2(393-2016-23836), 344-350.
Baden, S. (2013) Women's Collective Action: Unlocking the potential of agricultural markets,
Oxfam International.
Beal, G. M. (1953) Factors related to participation in farmer cooperatives.
Central Bureau of Statistics (CBS). (2011) Nepal Living Standard Survey 2010/11. Statistical
Report, Volume II. Central Bureau of Statistics, National Planning Commission
Secretariat. November, 2011. Government of Nepal. National Planning Commission
Secretariat. November 2012.
Desalew, A. (2009) The role of cooperative in gender equality. The case of Amhara Region Ambo
University College, Ethiopia.
Food and Agriculture Organization (FAO). (2019) Country gender assessment of agriculture and
the rural sector in Nepal. Kathmandu.76 pp.
Nepalese Journal of Agricultural Sciences, 2021, volume 21 ISSN 2091-042X; eISSN 2091-0428
201
Helm, F. C. (1968) The economics of co-operative enterprise.
Kebede, G. & Kassa, W. (2011) Women’s participation in cooperatives: The case of gedebhassasa
farmer’s multipurpose cooperative society in arsi zone, Oromiya, Ethiopia (Doctoral
dissertation, Mekelle University).
Kiprop, E., Okinda, C., Wamuyu, S. & Geng, X. (2019) Factors Influencing Smallholder Farmers
Participation in Collective Marketing and the Extent of Participation in Improved
Indigenous Chicken Markets in Baringo, Kenya. Asian Journal of Agricultural Extension,
Economics & Sociology. 1-12.
Meira, D. & Martinho, A. L. (2018) Cooperativism and Gender Equality: From Principles to
Practices in Governance Bodies Composition on Cooperatives in Portugal.
Msimango, B. & Oladele, O. I. (2013) Factors influencing farmers’ participation in agricultural
cooperatives in Ngaka Modiri Molema District. Journal of Human Ecology. 44(2), 113-
119.
Niroja, P., Mamoru, I. & Muto, Y. (2015) Marketing System of Agricultural Cooperatives in Nepal:
A Case Studies of Janagarathi Vegetable and Fruit Producer Agriculture,
Cooperative. Rev. Integr. Bus. Econ. Res. 4, 337.
Pooja, K., Arunima, K. & Meera, S. (2016) Analysis of constraints faced by farm women in
agriculture-A study in Samastipur district of Bihar. International Journal of Science.
4522-4526.
Sigdel, M. (2019) Women entrepreneurship in Nepal (Doctoral dissertation).Faculty of Management,
Tribhuvan University, Kathmandu, Nepal. August 2015.
Woldu, T. & Tadesse, F. (2015) Women's Participation in Agricultural Cooperatives in
Ethiopia. (No. 1008-2016-80335).
World Bank (WB)., Food and Agriculture Organization (FAO). & International Fund for
Agricultural Development (IFAD). (2009) Gender in Agriculture Sourcebook.
Agriculture and Rural Development. Washington, DC : World Bank. © World Bank.

Nepalese Journal of Agricultural Sciences, 2021, volume 21 ISSN 2091-042X; eISSN 2091-0428
202
Economic viability of hydroponic system: a case from
Kathmandu valley
Ganesh Thapa1, Arun GC
2, and Ashma Pandey
1
1HICAST, Kathmandu, Nepal
2Ministry of Agriculture and Livestock Development,
Government of Nepal
Corresponding Author: [email protected]
ABSTRACT
Recently, the use of hydroponic production mostly in urban
areas has become an increasingly practiced alternative, since
it implies a production with less use of labor, and still in a
differentiated product of better quality. A study was carried
out from 16th
February 2020 to 26th
April 2021 to analyze the
economic viability of hydroponic production in all the
hydroponic farms inside Kathmandu valley; and an interview
was conducted among all the growers using pre-tested
questionnaire to gather information on various aspects of
hydroponics farming. The techniques used to verify viability
were mainly Payback period (PBP) and Benefit Cost (BC)
ratio. The results showed that the benefit cost ratio of
hydroponics farming per ropani (0.05 hec) was found 2.32.
The results also pointed to a quick recovery of invested
capital, being approximately 3.81 year on an average of all
the farms. Results showed that all the farms were in profit with
positive net present value (NPV) after 10 years; and average
internal rate of return (IRR) was found 27%. Despite several
socio-economic and commercial benefits of hydroponic
farming the farmers were facing various problems like
leakages of pipes, nutrient toxicity and deficiency along with
marketing problems. Therefore, for more economic return and
sustainable development of hydroponic farming, the
government and all concerned agencies should have to play a
vital role on overcoming these weakness, problems and
possible threats.
Key words: Hydroponics, payback period, BC ratio, IRR, net present value
INTRODUCTION
Hydroponic system is a method of growing and developing plants in nutrient
solutions with or without the utilization of an inactive medium to offer
Nepalese Journal of Agricultural Sciences, 2021, volume 21 ISSN 2091-042X; eISSN 2091-0428
203
mechanical support instead of soil. With rapid urbanization and with land
getting increasingly scarcer and expensive, hydroponics assures best use of
limited water resources and land (Hredia, 2014). Among the many
achievements, the major achievement in past 200 years in the field of agriculture
is soilless farming also called hydroponics (Manandhar, 2018). Soil based
agriculture is presently confronting different difficulties like urbanization,
catastrophic event, environmental change, unpredictable utilization of synthetic
compounds and pesticides which is draining the land fertility. In this scenario
hydroponics can be the best alternative future farming (Sharma, 2018).
Currently hydroponic farming development is acquiring ubiquity and popularity
all over the world because of its efficient resource management and quality food
production. Today people in urban areas like Kathmandu want to do something
on their own to grow vegetables since they are fed up with eating pesticides
applied vegetables and but they have little space. In this situation, soil less
cultivation might be commenced successfully and considered as alternative for
growing healthy food plants, crops or vegetable (Acharya, 2017). There is a big
scope and possibility of this type of farming in urban areas, where land, labor
and water getting scarce day by day (Butler & Oebker, 2012). Although
hydroponic farming may quite new concept for Nepal and many interested
growers may be in doubts regarding its advantages over traditional farming but
many developed countries have been successfully producing varieties of crops
form hydroponics. And slowly peoples are recognizing its importance and
hydroponic market is increasing slowly (Guraya, 2021).
MATERIALS AND METHODS
Study area and sampling technique
The study was conducted in Kathmandu valley, in the Bagmati province in
central Nepal, which is home to three of largest cities in Nepal, including
Kathmandu, Bhaktapur and Lalitpur. The valley was selected as study site
because most of the hydroponic farming initiators are practicing this type of
cultivation practice in urban areas of Kathmandu valley so most of the farms are
located inside the valley. Only limited number of growers of 11 farmers was
engaging in hydroponics farming. So, a census survey was carried out to select
all those 11 farmers for the sample size of my study. Primary data collection was
done through personal interviews with hydroponics growers in the research site,
on the basis of pre-tested semi structural questionnaires. Secondary data used in
this work was from several literatures such as books, journals, annual reports
available at different academic institutes.
Tools and technique of data analysis
The collected data were tabulated and analyzed by using Microsoft Excel. Both
quantitative and qualitative analyses were done.
Nepalese Journal of Agricultural Sciences, 2021, volume 21 ISSN 2091-042X; eISSN 2091-0428
204
Economic analysis
Gross income, net income, B/C ratio, Payback period, internal rate of return
(IRR), Net present value (NPV) were taken as economic variables. However,
B/C ratio and payback period were taken as prime economic variables. It
measures the worth of project.
Cost of production
Total cost of production was analyzed in two parts viz. fixed cost and variable
cost.
TC = TFC + TVC
Where,
TC = Total Cost
TFC = Total Fixed Cost which included the cost for total for green house setup
cost and other internal setups of farm which include PVC pipes, water reservoir,
planting net cups, electronic meters such as PH meter and EC meter, pumping
motors, air control system and growing systems.
TVC = Total Variable Cost which included variable inputs such as seedlings
production, electricity cost, water cost, nutrient solution cost, maintenance cost,
labor cost, land rent, cost of pesticides and fungicides and miscellaneous.
Benefit-Cost Ratio
The benefit-cost ratio was calculated by using formula as in (Paudel & Adhikari,
2018).
The value of the return from hydroponics farming was calculated based on the
total production of all the vegetables from hydroponics farming.
Payback period analysis
The payback period i.e. the time required to recover the initial total investment
of individual hydroponic farm was calculated by discounting the cash flows.
Then the cumulative of all the discounted cash flows was calculated till the sums
equals to initial investment. The discount rate added was 10% while discounting
the cash flows.
Net present value (NPV)
NPV of the entire hydroponics farm was analyzed by adding all the discounted
cash flows and subtracting the total initial investment for the farm setup. It was
calculated by following using formula taken from (Jory, et al., 2016).
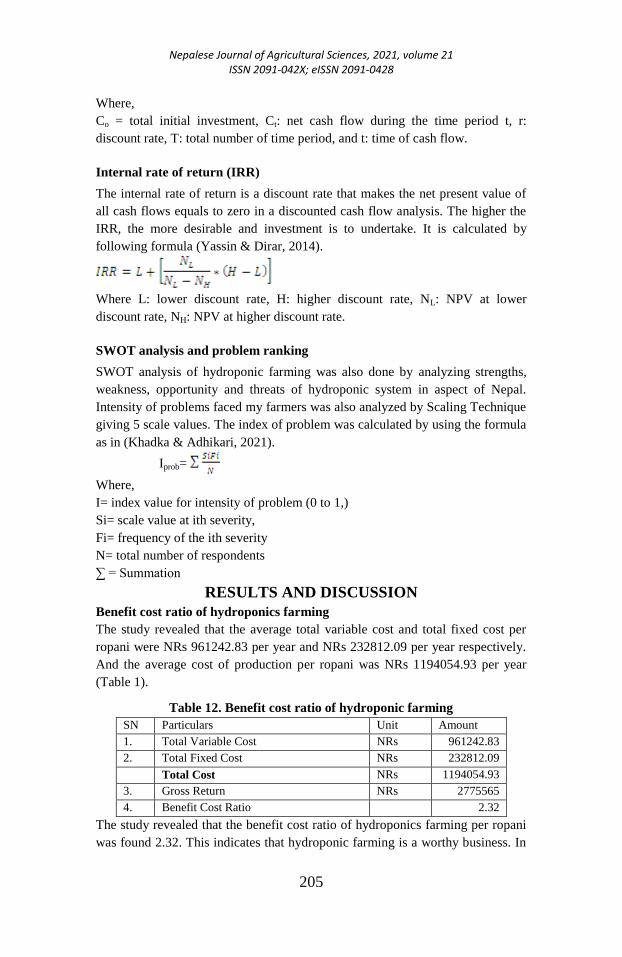
Nepalese Journal of Agricultural Sciences, 2021, volume 21 ISSN 2091-042X; eISSN 2091-0428
205
Where,
Co = total initial investment, Ct: net cash flow during the time period t, r:
discount rate, T: total number of time period, and t: time of cash flow.
Internal rate of return (IRR)
The internal rate of return is a discount rate that makes the net present value of
all cash flows equals to zero in a discounted cash flow analysis. The higher the
IRR, the more desirable and investment is to undertake. It is calculated by
following formula (Yassin & Dirar, 2014).
Where L: lower discount rate, H: higher discount rate, NL: NPV at lower
discount rate, NH: NPV at higher discount rate.
SWOT analysis and problem ranking
SWOT analysis of hydroponic farming was also done by analyzing strengths,
weakness, opportunity and threats of hydroponic system in aspect of Nepal.
Intensity of problems faced my farmers was also analyzed by Scaling Technique
giving 5 scale values. The index of problem was calculated by using the formula
as in (Khadka & Adhikari, 2021).
Iprob=
Where,
I= index value for intensity of problem (0 to 1,)
Si= scale value at ith severity,
Fi= frequency of the ith severity
N= total number of respondents
∑ = Summation
RESULTS AND DISCUSSION
Benefit cost ratio of hydroponics farming
The study revealed that the average total variable cost and total fixed cost per
ropani were NRs 961242.83 per year and NRs 232812.09 per year respectively.
And the average cost of production per ropani was NRs 1194054.93 per year
(Table 1).
Table 12. Benefit cost ratio of hydroponic farming
SN Particulars Unit Amount
1. Total Variable Cost NRs 961242.83
2. Total Fixed Cost NRs 232812.09
Total Cost NRs 1194054.93
3. Gross Return NRs 2775565
4. Benefit Cost Ratio 2.32
The study revealed that the benefit cost ratio of hydroponics farming per ropani
was found 2.32. This indicates that hydroponic farming is a worthy business. In
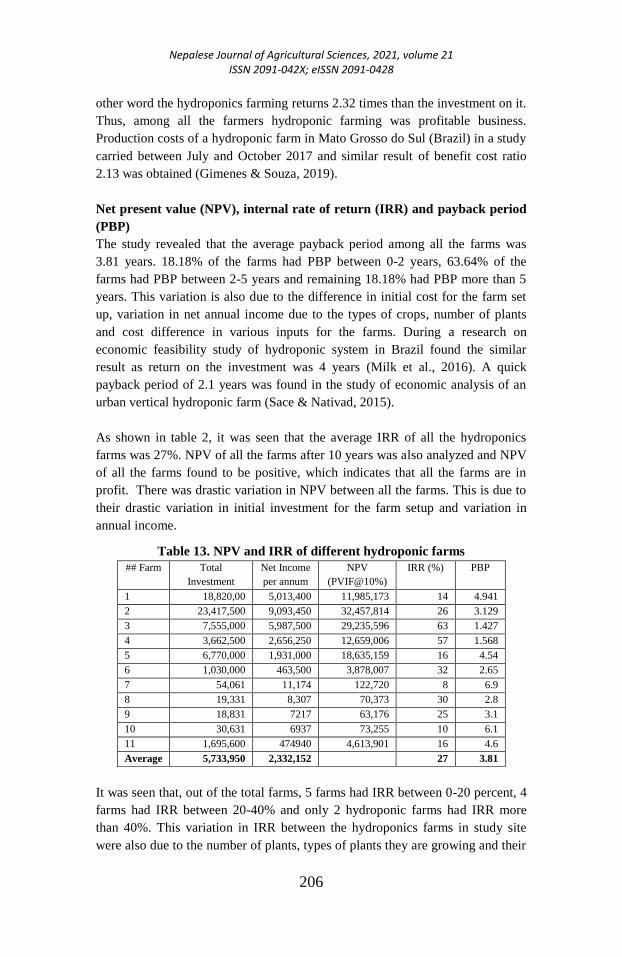
Nepalese Journal of Agricultural Sciences, 2021, volume 21 ISSN 2091-042X; eISSN 2091-0428
206
other word the hydroponics farming returns 2.32 times than the investment on it.
Thus, among all the farmers hydroponic farming was profitable business.
Production costs of a hydroponic farm in Mato Grosso do Sul (Brazil) in a study
carried between July and October 2017 and similar result of benefit cost ratio
2.13 was obtained (Gimenes & Souza, 2019).
Net present value (NPV), internal rate of return (IRR) and payback period
(PBP)
The study revealed that the average payback period among all the farms was
3.81 years. 18.18% of the farms had PBP between 0-2 years, 63.64% of the
farms had PBP between 2-5 years and remaining 18.18% had PBP more than 5
years. This variation is also due to the difference in initial cost for the farm set
up, variation in net annual income due to the types of crops, number of plants
and cost difference in various inputs for the farms. During a research on
economic feasibility study of hydroponic system in Brazil found the similar
result as return on the investment was 4 years (Milk et al., 2016). A quick
payback period of 2.1 years was found in the study of economic analysis of an
urban vertical hydroponic farm (Sace & Nativad, 2015).
As shown in table 2, it was seen that the average IRR of all the hydroponics
farms was 27%. NPV of all the farms after 10 years was also analyzed and NPV
of all the farms found to be positive, which indicates that all the farms are in
profit. There was drastic variation in NPV between all the farms. This is due to
their drastic variation in initial investment for the farm setup and variation in
annual income.
Table 13. NPV and IRR of different hydroponic farms
## Farm Total
Investment
Net Income
per annum
NPV
(PVIF@10%)
IRR (%) PBP
1 18,820,00 5,013,400 11,985,173 14 4.941
2 23,417,500 9,093,450 32,457,814 26 3.129
3 7,555,000 5,987,500 29,235,596 63 1.427
4 3,662,500 2,656,250 12,659,006 57 1.568
5 6,770,000 1,931,000 18,635,159 16 4.54
6 1,030,000 463,500 3,878,007 32 2.65
7 54,061 11,174 122,720 8 6.9
8 19,331 8,307 70,373 30 2.8
9 18,831 7217 63,176 25 3.1
10 30,631 6937 73,255 10 6.1
11 1,695,600 474940 4,613,901 16 4.6
Average 5,733,950 2,332,152 27 3.81
It was seen that, out of the total farms, 5 farms had IRR between 0-20 percent, 4
farms had IRR between 20-40% and only 2 hydroponic farms had IRR more
than 40%. This variation in IRR between the hydroponics farms in study site
were also due to the number of plants, types of plants they are growing and their
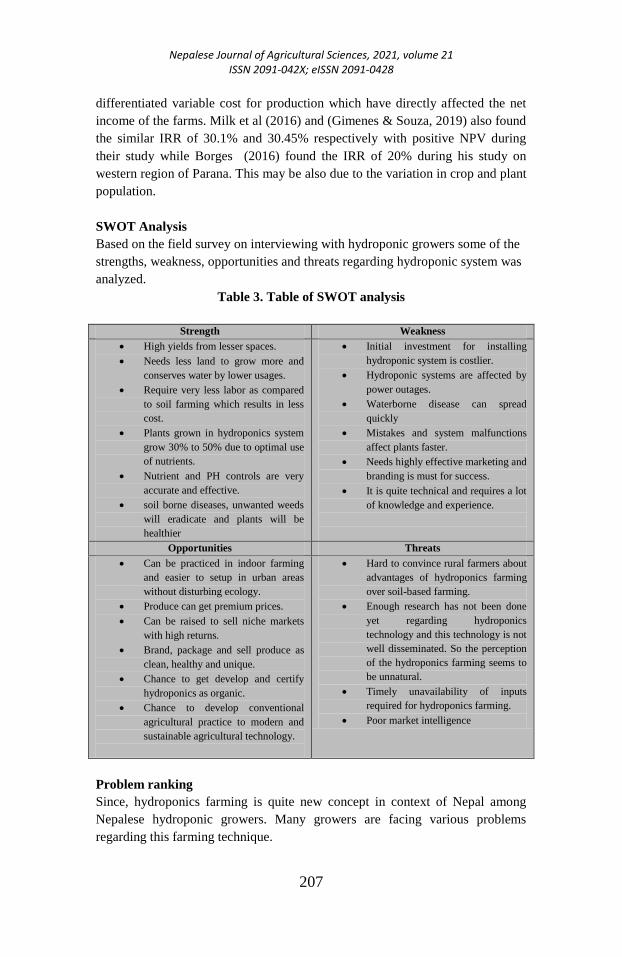
Nepalese Journal of Agricultural Sciences, 2021, volume 21 ISSN 2091-042X; eISSN 2091-0428
207
differentiated variable cost for production which have directly affected the net
income of the farms. Milk et al (2016) and (Gimenes & Souza, 2019) also found
the similar IRR of 30.1% and 30.45% respectively with positive NPV during
their study while Borges (2016) found the IRR of 20% during his study on
western region of Parana. This may be also due to the variation in crop and plant
population.
SWOT Analysis
Based on the field survey on interviewing with hydroponic growers some of the
strengths, weakness, opportunities and threats regarding hydroponic system was
analyzed.
Table 3. Table of SWOT analysis
Strength Weakness
High yields from lesser spaces.
Needs less land to grow more and
conserves water by lower usages.
Require very less labor as compared
to soil farming which results in less
cost.
Plants grown in hydroponics system
grow 30% to 50% due to optimal use
of nutrients.
Nutrient and PH controls are very
accurate and effective.
soil borne diseases, unwanted weeds
will eradicate and plants will be
healthier
Initial investment for installing
hydroponic system is costlier.
Hydroponic systems are affected by
power outages.
Waterborne disease can spread
quickly
Mistakes and system malfunctions
affect plants faster.
Needs highly effective marketing and
branding is must for success.
It is quite technical and requires a lot
of knowledge and experience.
Opportunities Threats
Can be practiced in indoor farming
and easier to setup in urban areas
without disturbing ecology.
Produce can get premium prices.
Can be raised to sell niche markets
with high returns.
Brand, package and sell produce as
clean, healthy and unique.
Chance to get develop and certify
hydroponics as organic.
Chance to develop conventional
agricultural practice to modern and
sustainable agricultural technology.
Hard to convince rural farmers about
advantages of hydroponics farming
over soil-based farming.
Enough research has not been done
yet regarding hydroponics
technology and this technology is not
well disseminated. So the perception
of the hydroponics farming seems to
be unnatural.
Timely unavailability of inputs
required for hydroponics farming.
Poor market intelligence
Problem ranking
Since, hydroponics farming is quite new concept in context of Nepal among
Nepalese hydroponic growers. Many growers are facing various problems
regarding this farming technique.

Nepalese Journal of Agricultural Sciences, 2021, volume 21 ISSN 2091-042X; eISSN 2091-0428
208
Table 14. Problem ranking
Production Problems Index value Rank
Leakages and blockages of pipes 0.836 I
Nutrient deficiency and toxicity 0.82 II
Marketing problems 0.72 III
Plant diseases and pests 0.30 IV
Other problems 0.29 V
Opinion survey was conducted to know the problem faced by hydroponic
growers inside study area. From the study it was revealed that among all the
problems, leakages and blockages of pipes, nutrient deficiency and toxicity and
marketing problem were major 1st, 2nd and 3
rd problems respectively among all
the hydroponic growers (Table 3).
CONCLUSION AND SUGGESTIONS
The hydroponic cultivation of leafy and spicy vegetables in the studied urban
areas showed good economic viability; and was an attractive alternative of food
production for the households. The result showed that hydroponic farming was a
profitable and promising agricultural practice across the study area.
There is a huge scope and opportunities in hydroponics farming across the urban
area due to access to market, easy availability of inputs, social and
environmental value and employment opportunities. With these scopes some
vital problems and threats were also recorded. The concerned agencies should
harmonize their policies to overcome various problems and threats for further
sustainable development of hydroponic farming in the urban areas of
Kathmandu valley.
ACKNOWLEDGEMENT
The authors are thankful to all the hydroponic growers for providing the useful
information without any hesitation. Similarly, authors want to express deepest
gratitude to all the administrative staff and faculties of HICAST for providing
suitable environment for my study including research.
REFERENCES
Acharya, H., (2017) Hydroponics: New and scientific methods of farming and its scope in Nepal.
Namaste times, 12 November
Borges, R. & Dal'Sotto, T., (2016) Economic-financial analysis of a hydroponic farming system,
Custos e Agronegocio, 1 January, Volume 12, pp. 217-239
Butler, J. & Oebker, N., (2012) Hydroponics as a hobby : growing plants without soil., s.l.:
University of Illinois; College of Agriculture; Extension Service in Agriculture and
Home Economics
Nepalese Journal of Agricultural Sciences, 2021, volume 21 ISSN 2091-042X; eISSN 2091-0428
209
Gimenes, R. M. T. & Souza, S. V., (2019) Economic viability for deploying hydroponic system in
emerging countries:. Land Use Policy, April, Volume 83, pp. 357-369
Guraya, G., (2021) scenario of hydroponics in Nepal [Interview] (18 February 2021)
Hredia, N., (2014) Design and construction and evaluation of a vertical hydroponic tower,
California politechnic state: Biosource and Agricultural Engineering
Jory, S., Benamraoui, A., Kumar, D. & Madichie, N., (2016) Net Present Value Analysis and the
Wealth Creation Process: A Case Illustration. The accounting educators’ journal, XXVI,
85-99
Khadka, S. & Adhikari, R. K., (2021) Comparative economics of tomato production under
polyhouse and open field condition in Dhading district of Nepal. Nepalese Journal of
Agricultural Science, Volume 20, pp. 100-107
Manandhar, A., (2018) Grow your own greens using hydroponics. The Annapurna express, 7 12
Milk, D., Migliavacca, R. A., Moreira, L. A. & Fausto, D. A., (2016) Economic feasibility of
implementing the hydroponic system for lettuce with PRONAF resources in Matao-SP=
Economic feasibility of implementing the system for hydroponic lettuce with PRONAF
resources in Matao-SP. Revista iPecege, 01, 57-65
Paudel, P. & Adhikari, R. K., (2018) Economic analysis of tomato farming under different
production system in Dhading district of Nepal. Nepalese Journal of Agricultural
Sciences, 16, 210-224
Sace, C. & Nativad, P. E., (2015) Economic analysis of an urban vertical garden for hydroponic
production of lettuce (Lactuca sativa), International Journal of Contemporary Applied
Sciences, July.Volume 2
Sharma, N., (2018) Hydroponics as an advanced technique for vegetable, Journal of soil and water
conservation, iv(17), 364-271
Yassin, E.-T. & Dirar, A., (2014) Internal Rate of Return: A suggested alternative formula and its
Macro-economics implications, Journal of American Science, Volume 10, pp. 216-221
Nepalese Journal of Agricultural Sciences, 2021, volume 21 ISSN 2091-042X; eISSN 2091-0428
210
Gross margin analysis of major vegetables of
Phedikhola Rural Municipality, Syangja
Aayusha Pandey and Kamal Raj Gautam
HICAST, Kathmandu
Corresponding Author: [email protected]
ABSTRACT
Vegetable farming has been the cornerstone of the Nepalese
economy and is in an increasing trend. Survey research was
conducted for gross margin analysis of major vegetables of
Phedikhola Rural Municipality of Syangja District from 12th
February to 20th
March 2021, for which, 4 major vegetables,
viz. cabbage, cauliflower, potato, and tomato were selected.
Six vegetable pocket areas were selected as the study site. A
stratified random sampling method was adopted and 36
farmers (6 farmers each from 6 pocket areas) were
interviewed for each of the vegetables using a pre-tested semi-
structured questionnaire, altogether forming a 144 sample
size. The study showed that the cost of production per kg,
productivity, gross margin, and net profit per ropani were
highest in tomato, which were NRs.13.24 per kg, 2,209.03
kg/ropani, NRs.57,587.65, and NRs.49,522.83 respectively.
B/C ratio was also highest in the case of tomato i.e. 2.69.
Post-harvest losses at the farm level were greater in tomatoes
(5.59%). Hypothesis testing showed that there was a
significant difference in the means of gross margin of 5 pairs
of vegetables. Limited Agri mechanization and human
resources was the most important problem in vegetable
farming. However, there is a huge opportunity for the
improvement of yield and benefit of vegetable crops through
the management of prevailing problems in this area.
Key words: Cabbage, cauliflower, economy, potato, tomato
INTRODUCTION
Vegetable production singly contributes around 9.71% to the total AGDP of
Nepal (Karki, 2015). As a significant area of the economy, vegetable production
plays an important role in improving the livelihood of the farmers, by generating
cash in a relatively short period, even from a small plot of land (Gurung et al.,
2016). Vegetables are generally labor-intensive crops and hence, offer a
Nepalese Journal of Agricultural Sciences, 2021, volume 21 ISSN 2091-042X; eISSN 2091-0428
211
considerable guarantee for creating increased rural employment opportunities
(Islam et al., 2020). According to the Ministry of Agriculture and Livestock
Development (2020), the area, production, and yield of vegetables in Nepal is
297,195 ha, 4,271,279 mt, and 14.37 mt/ha respectively. Ten years back i.e.
2008/09, the yield was 12.23 mt/ha which shows an increasing trend in the yield
of vegetables in Nepal (MoALD, 2020). The reason behind this is that the
increase in production is more than an increase in space of vegetables (Pandey et
al., 2017).
Phedikhola Rural Municipality has very fertile land with immense potential for
vegetable production as governed by its climatic factors and topography. It is
producing sufficient vegetables for the consumption of local people and even for
export to the nearby city areas. Several vegetable crops are being currently
grown here which include Cauliflower, Cabbage, Tomato, Potato, and others.
For these crop enterprises, gross margins need to be established to determine
which vegetable is more profitable in the case of farmers of Phedikhola. Hence,
a study was carried to analyse the gross margin of major vegetables and to
prioritize the problems in vegetable farming in this area.
MATERIALS AND METHODS
Study area, sampling technique, and sample size
The study was conducted in Phedikhola Rural Municipality situated in Syangja
district of Gandaki zone in Gandaki Province of Nepal. This place was selected
as a study site because it has been one of the most potential areas of vegetable
production in Nepal. Out of 5 wards, 3 wards (ward no: 1, 2, and 4) were chosen
for study because the 6 vegetable pocket areas viz. Merudada, Jaisidada,
Dadagaun, Jogithok, Pauwa, and Kudule comes under these wards and most of
the commercial vegetable farmers of Phedikhola Rural Municipality come under
these pocket areas.
The information collected has covered the detailed crop budget for 4 vegetables
viz. Cabbage, Cauliflower, Tomato, and Potato production. These vegetables
were selected because they were most commonly grown on a commercial scale
in Phedikhola. For each crop, 6 farmers from 6 vegetable pocket areas (totaling
36 farmers) were selected using the stratified random sampling technique, all
together forming 144 sample sizes.
The data were collected from both primary and secondary sources. Primary data
were collected through field visits, Key Informant's Interview (KII), and a pre-
tested semi-structured questionnaire survey among the farmers. The secondary
data were collected from related publications from MoALD, annual reports of
Nepalese Journal of Agricultural Sciences, 2021, volume 21 ISSN 2091-042X; eISSN 2091-0428
212
Phedikhola Rural Municipality, books, various published and unpublished
sources like journals, newspaper articles, TV interviews, etc.
Data analysis
The data obtained during the study were tabulated and analysed using Microsoft
Excel.
Profitability analysis
The profitability of vegetable farming from the viewpoint of an individual
farmer was measured in terms of gross return, gross margin, net profit, and
undiscounted benefit-cost ratio.
Gross Return (GR) = Total production x average market price (Islam et
al., 2020)
Gross Margin (GM) = Gross Return – Total Variable Cost (Sapkota et al.,
2019)
Net profit = Gross Return – Total Costs (Noonari et al., 2015)
Where, Total Costs = Total fixed costs + Total variable costs (Noonari et al.,
2015; Paudel & Adhikari, 2018)
Here, total fixed costs included depreciation of fixed assets, land tax, land rent,
and agricultural loan interest; while the total variable costs included labor cost,
cost of seeds, fertilizers, micronutrients, plant protection, marketing cost, and
miscellaneous.
Undiscounted Benefit-Cost Ratio (BCR) (Amgai et al.,
2016; Subedi et al., 2019; Poudel et al., 2019)
Hypothesis Testing
Null Hypothesis (H0): There is no significant difference in the means of gross
margins of the different vegetables under study. i.e. H0: μa=μb=μc=μd
Alternative Hypothesis (H1): There is a significant difference in the means of
gross margins of the different vegetables under study. i.e. H1 = ALOI
On hypothesis testing, Analysis of Variance (ANOVA) test and Tukey Kramer
Multiple Comparison Procedure were employed and gross margin per ropani
was used as a variate.
SWOT analysis and Problem Ranking
An extensive review was done by collecting relevant information using KII with
concerned personnel to evaluate the internal factors (strengths and weakness)
and assess the external factors (opportunities and threats) of vegetable
production in Phedikhola Rural Municipality.
The overall problems/constraints affecting these vegetable productions were
listed using the Key Informant's Interview (KII) and interviewed among the
farmers. The intensity of problems faced by the farmers with vegetable
production was identified by using five points scaling technique comparing most
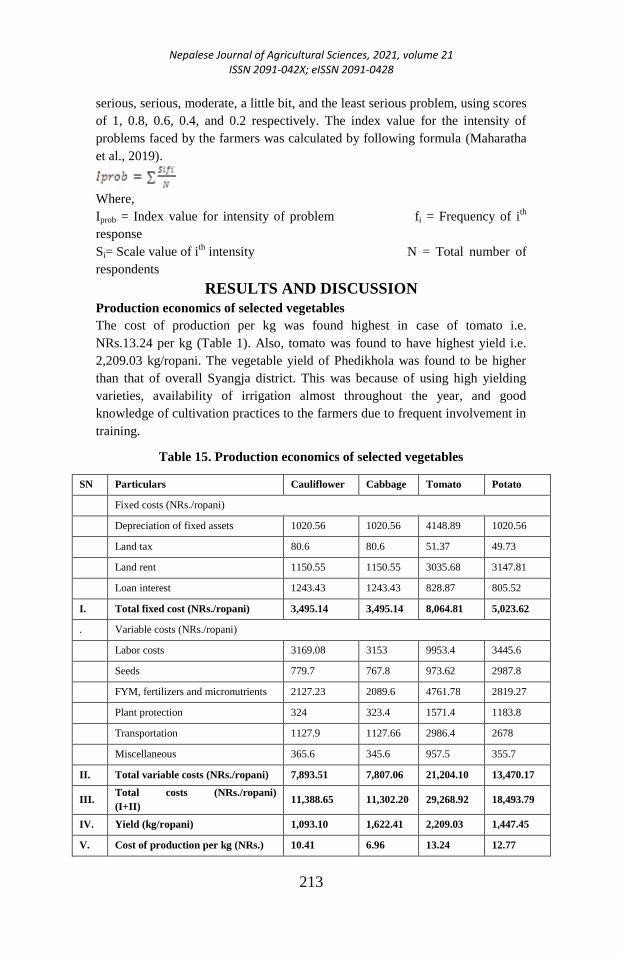
Nepalese Journal of Agricultural Sciences, 2021, volume 21 ISSN 2091-042X; eISSN 2091-0428
213
serious, serious, moderate, a little bit, and the least serious problem, using scores
of 1, 0.8, 0.6, 0.4, and 0.2 respectively. The index value for the intensity of
problems faced by the farmers was calculated by following formula (Maharatha
et al., 2019).
Where,
Iprob = Index value for intensity of problem fi = Frequency of ith
response
Si= Scale value of ith
intensity N = Total number of
respondents
RESULTS AND DISCUSSION
Production economics of selected vegetables
The cost of production per kg was found highest in case of tomato i.e.
NRs.13.24 per kg (Table 1). Also, tomato was found to have highest yield i.e.
2,209.03 kg/ropani. The vegetable yield of Phedikhola was found to be higher
than that of overall Syangja district. This was because of using high yielding
varieties, availability of irrigation almost throughout the year, and good
knowledge of cultivation practices to the farmers due to frequent involvement in
training.
Table 15. Production economics of selected vegetables
SN Particulars Cauliflower Cabbage Tomato Potato
Fixed costs (NRs./ropani)
Depreciation of fixed assets 1020.56 1020.56 4148.89 1020.56
Land tax 80.6 80.6 51.37 49.73
Land rent 1150.55 1150.55 3035.68 3147.81
Loan interest 1243.43 1243.43 828.87 805.52
I. Total fixed cost (NRs./ropani) 3,495.14 3,495.14 8,064.81 5,023.62
. Variable costs (NRs./ropani)
Labor costs 3169.08 3153 9953.4 3445.6
Seeds 779.7 767.8 973.62 2987.8
FYM, fertilizers and micronutrients 2127.23 2089.6 4761.78 2819.27
Plant protection 324 323.4 1571.4 1183.8
Transportation 1127.9 1127.66 2986.4 2678
Miscellaneous 365.6 345.6 957.5 355.7
II. Total variable costs (NRs./ropani) 7,893.51 7,807.06 21,204.10 13,470.17
III. Total costs (NRs./ropani)
(I+II) 11,388.65 11,302.20 29,268.92 18,493.79
IV. Yield (kg/ropani) 1,093.10 1,622.41 2,209.03 1,447.45
V. Cost of production per kg (NRs.) 10.41 6.96 13.24 12.77
Nepalese Journal of Agricultural Sciences, 2021, volume 21 ISSN 2091-042X; eISSN 2091-0428
214
VI. Average price per kg (NRs.) 20.89 10.5 35.67 32
VII. Gross Return (NRs./ropani) 21,427.07 16,712.06 78,791.75 46,318.29
VIII
. Gross margin (NRs./ropani) 13,533.56 8,905.00 57,587.65 32,848.12
IX. Net profit (NRs./ropani) 10,038.42 5409.86 49,522.83 27,824.50
X. Undiscounted BCR 1.88 1.47 2.69 2.5
Source: (Field Survey, 2021)
Gross margin per ropani of selected vegetables
Figure 1 shows the gross margin per ropani of the vegetables of the study area
where the tomato was found to have the highest gross margin i.e. NRs.57,587.65
per ropani which is inconsistent with the result from Paudel & Adhikari (2018)
i.e. NRs.33,700; followed by potato (NRs.32,848.12 per ropani) which is also
inconsistent with the gross margin i.e. NRs.12,199.82 from Bhandari et al
(2016). The gross margin of cauliflower was NRs.13,533.56 per ropani which is
also inconsistent with the result from Bhandari et al (2016) i.e. NRs.9,671.22.
Similarly, the gross margin of cabbage was NRs.8,905.00 per ropani which is
inconsistent with the gross margin i.e. NRs.10,156.13 from Bhandari et al
(2016). The reasons for the inconsistency (higher gross margin) of these
vegetables were because of having high productivity due to cultivating high
yielding varieties and secured market price during the main season because of
minimum support price as determined by the local government, which are
NRs.20, NRs.10, NRs.30 and NRs. 30 for cauliflower, cabbage, potato, and
tomato, respectively. Similarly, tomato was found to have highest net margin of
NRs. 49,522.83 per ropani.
13533.56 8905
57587.65
32848.12
0
20000
40000
60000
80000
Cauliflower Cabbage Tomato Potato
Gro
ss m
argin
(N
Rs.
)
Vegetables
Figure 4. Gross margin per ropani of selected vegetables
Undiscounted Benefit-Cost Ratio Analysis
The tomato was found to have the highest BCR i.e. 2.69; which is not consistent
with the study conducted by Bashyal et al (2019) in Lamahi, Dang, where the
BCR of tomato was 3.60. Potato has a BCR of 2.50, which is consistent with the
research from Subedi et al (2019), where they found the BCR of potato to be
2.13. Here, the cauliflower has BCR 1.88, which is consistent with the result of
Poudel et al (2019), who found the BCR of on-season cauliflower production in
Nepalese Journal of Agricultural Sciences, 2021, volume 21 ISSN 2091-042X; eISSN 2091-0428
215
the Tanahun district to be 1.84. The BCR of cabbage was found to be 1.47. This
result is consistent with the recent study conducted by Gahatraj et al (2019) in
the Dhankuta district of Nepal where he found the BCR of cabbage to be 1.66,
which indicated that the investment was financially viable and business can run
smoothly. Since, the tomato had the highest BCR, so tomato cultivation seemed
to be most profitable than other vegetables.
Post-harvest loss at the farm level
The highest percentage of post-harvest losses was seen in tomatoes (5.59%),
however, this loss in tomatoes is less as compared to the 10% loss at the farm
level from the study conducted by Tiwari et al (2020). Similarly, in cauliflower,
the loss was found to be 4.72% which is also less than the result from Sharma &
Singh (2011), where they obtained the total loss of 9.40% in cauliflower. In
cabbage, 4.02% post-harvest loss was found, which is less compared to the
result from GC & Ghimire (2019), where there was a 7.03% loss in cabbage. In
potato, 2.26% loss was obtained which is again less than the result (7.03% loss)
from GC & Ghimire (2019). Training regarding post-harvest loss reduction was
given in all the pocket areas. Due to this, farmers are aware to some extent of the
post-harvest losses reduction in the vegetables.
Hypothesis testing
The one-way ANOVA test resulted that the p-value (3.21128E-45) was found to
be less than the significance value, α = 0.05. Therefore, H0 was rejected and H1
was accepted, concluding that the gross margin of at least one vegetable
production was found to be significantly different from another.
Then, to analyse which pair of vegetables have significantly different means of
gross margin, Tukey Kramer Multiple Comparison Procedure was employed
which showed that the 5 pairs, viz. A to C, A to D, B to C, B to D, and C to D
were significantly different and only one pair A to B was not significantly
different at 0.05 level of significance (Table 2).
Table 16. Tukey Kramer Multiple Comparison
Comparison Absolute difference of
average value
Critical
range Results
A to B 3775.22 6823.01 Means significantly not different
A to C 44844.53 6823.01 Means significantly different
A to D 29999.32 6823.01 Means significantly different
B to C 48619.75 6823.01 Means significantly different
B to D 33774.55 6823.01 Means significantly different
C to D 14845.21 6823.01 Means significantly different
A= Cauliflower; B = Cabbage; C = Tomato; D = Potato
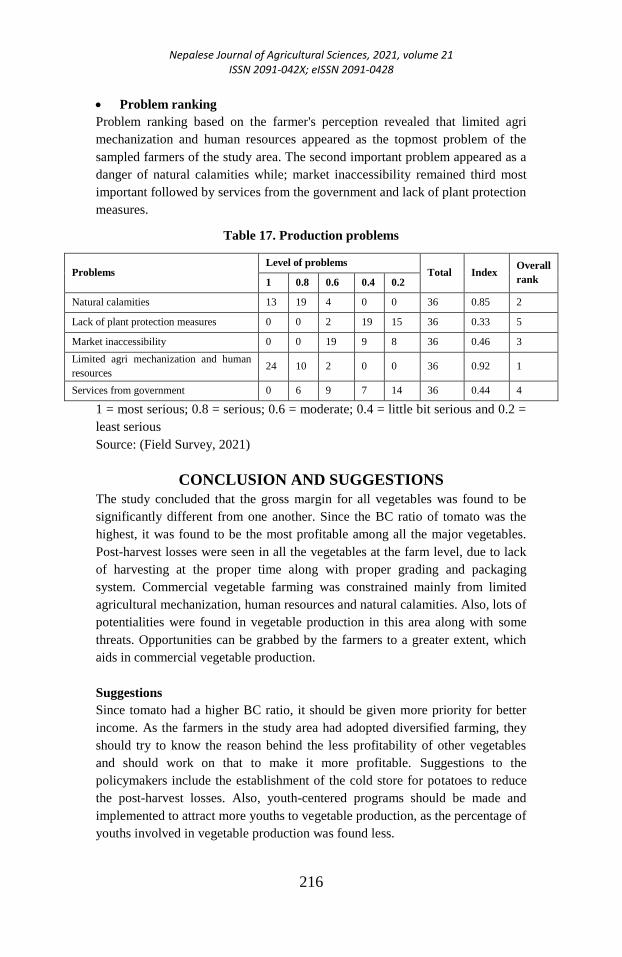
Nepalese Journal of Agricultural Sciences, 2021, volume 21 ISSN 2091-042X; eISSN 2091-0428
216
Problem ranking
Problem ranking based on the farmer's perception revealed that limited agri
mechanization and human resources appeared as the topmost problem of the
sampled farmers of the study area. The second important problem appeared as a
danger of natural calamities while; market inaccessibility remained third most
important followed by services from the government and lack of plant protection
measures.
Table 17. Production problems
Problems Level of problems
Total Index Overall
rank 1 0.8 0.6 0.4 0.2
Natural calamities 13 19 4 0 0 36 0.85 2
Lack of plant protection measures 0 0 2 19 15 36 0.33 5
Market inaccessibility 0 0 19 9 8 36 0.46 3
Limited agri mechanization and human
resources 24 10 2 0 0 36 0.92 1
Services from government 0 6 9 7 14 36 0.44 4
1 = most serious; 0.8 = serious; 0.6 = moderate; 0.4 = little bit serious and 0.2 =
least serious
Source: (Field Survey, 2021)
CONCLUSION AND SUGGESTIONS
The study concluded that the gross margin for all vegetables was found to be
significantly different from one another. Since the BC ratio of tomato was the
highest, it was found to be the most profitable among all the major vegetables.
Post-harvest losses were seen in all the vegetables at the farm level, due to lack
of harvesting at the proper time along with proper grading and packaging
system. Commercial vegetable farming was constrained mainly from limited
agricultural mechanization, human resources and natural calamities. Also, lots of
potentialities were found in vegetable production in this area along with some
threats. Opportunities can be grabbed by the farmers to a greater extent, which
aids in commercial vegetable production.
Suggestions
Since tomato had a higher BC ratio, it should be given more priority for better
income. As the farmers in the study area had adopted diversified farming, they
should try to know the reason behind the less profitability of other vegetables
and should work on that to make it more profitable. Suggestions to the
policymakers include the establishment of the cold store for potatoes to reduce
the post-harvest losses. Also, youth-centered programs should be made and
implemented to attract more youths to vegetable production, as the percentage of
youths involved in vegetable production was found less.
Nepalese Journal of Agricultural Sciences, 2021, volume 21 ISSN 2091-042X; eISSN 2091-0428
217
REFERENCES Amgai, S., Adhikari, B.K. & Kadariya, M. (2016) Economic analysis of cost of production of apple
in mustang district of Nepal. The Journal of Agriculture and Environment. 17, 141-47.
Bashyal, K., Khanal, K. & Dhakal, S. (2019) Socio-Economic Study of Tomato Producing Farmers
in Lamahi, Dang. Biomedical Journal of Scientific and Technical Research. 20(5), 15441-
43.
Bhandari, N.B., Gokarna, S. & Parajuli, K. (2016) Production cost and marketing of cereal, cash,
vegetables and industrial crops in Nepal. Harihar Bhawan, Lallitpur: Government of Nepal,
Agribusiness Promotion & Marketing Development Directorate, Market Research &
Statistics Management Program.
Field Survey. (2021) Gross margin analysis of major vegetables of Phedikhola Rural Municipality.
Survey Report. Kirtipur, Kathmandu: Himalayan College of Agricultural Sciences and
Technology.
Gahatraj, S., Rai, H.H. & Uprety, R. (2019) Assessment of contribution of cabbage in rural
livelihood and constraints of production in Dhankuta, Nepal. International Journal of
Agriculture, Environment and Food Sciences, 3(3), pp.150-54.
GC, A. & Ghimire, K. (2019) Estimating post-harvest loss at the farm level to enhance Food
Security: A Case of Nepal. International Journal of Agriculture, Environment and Food
Sciences. 3(3), 127-36.
Gurung, B. et al. (2016) Impact of PRISM Approach on Input Supply, Production and Produce
Marketing of Commercial Vegetable Farming in Kaski and Kapilvastu District of Western
Nepal. Res. Rev. J. Botan. Sci.. 5, 34-43.
Islam, M.S., Nayem, A.R. & Huda, S.N. (2020) An Economic Analysis of Cauliflower Production in
Selected Areas of Mymensingh District of Bangladesh. ICRRD HIGH INDEX RESEARCH
JOURNAL. 29(2).
Karki, Y. (2015) Nepal Portfolio Performance Review (NPPR). Kathmandu: Ministry of
Agricultural Development (MoAD).
Maharatha, S., Dahal, B.R., Acharya, N. & Devkota, S. (2019) Price behavior, marketing and
consumption pattern of tomato in selected region of western Nepal. Archives of Agriculture
and Environmental Science. 4(4), 472-77.
MoALD. (2020) Statistical Information on Nepalese Agriculture. SinghaDurbar, Kathmandu,Nepal:
Government of Nepal, Ministry of Agriculture and Livestock Department.
Noonari, S., Memon, I.N., Solangi, S.U. & Laghari, M.A. (2015) Economic Implications of Tomato
Production in Naushahro Feroze District of Sindh Pakistan. Research on Humanities and
Social Sciences. 5(7), 158-70.
Pandey, G. et al. (2017) An Analysis of Vegetables and Fruits Production Scenario in Nepal. Asian
Research Journal of Agriculture. 6(3), 1-10.
Paudel, P. & Adhikari, R.K. (2018) Economic analysis of tomato farming under different production
system in Dhading district of Nepal. Nepalese Journal of Agricultural Sciences. 16, 217-24.
Poudel, K., Pokharel, S., KC, S. & Adhikari, S. (2019) Analysis of supply chain of cauliflower in
Tanahun, Nepal. Academia Journal of Agricultural Research. 7(12), 295-306.
Sapkota, S.C., Rokaya, P.R., Acharya, H. & Uprety, S. (2019) An Economic Analysis of Potato
Production in AchhaM District of Nepal. International Journal of Horticulture &
Agriculture. 4(2), 1-9.
Sharma, G. & Singh, S.P. (2011) Economic Analysis of Post-harvest Losses in Marketing of
Vegetables in Uttarakhand. Agricultural Economics Research Review. 24, 309-15.
Subedi, S. et al. (2019) Economics of potato (Solanum tuberosum L.) production in terai region of
Nepal. Archives of Agriculture and Environmental Science. 4(1), 57-62.
Tiwari, I. et al. (2020) Post-harvest practices and loss assessment in tomato (Solanum lycopersicum
L.) in Kathmandu, Nepal. Journal of Agriculture and Natural Resources. 3(2), 335-52.
Nepalese Journal of Agricultural Sciences, 2021, volume 21 ISSN 2091-042X; eISSN 2091-0428
218
Effects of a dwarfing gene sd1-d (Dee-geo-woo-gen
dwarf) on yield and related traits in rice
Mukunda Bhattarai1, 2
, Misa Kamimukai
1, Birendra Bahadur Rana
1,
2 and Masayuki Murai
3
1The United Graduate school of Agriculture Sciences, Ehime University, Matsuyama,
Ehime, Japan 2National Potato Research Program, Nepal Agricultural Research Council, Khumaltar,
Lalitpur, Nepal 3Faculty of Agriculture and Marine Science, Kochi University, 200 Otsu, Monobe,
Nankoku, Kochi, Japan,
Corresponding Author: [email protected]
ABSTRACT The present study was conducted to examine the effect of sd1-d on
yield and related traits as compared with SD1-in and SD1-ja, by
using the two isogenic tall lines. Seedlings of IR36 and the two
isogenic lines were transplanted on an experimental field at Faculty
of Agriculture and Marine Science, Kochi University, Japan with
planting distance of 30 cm × 15 cm and two seedlings/ hill in 2017.
Chemical fertilizers were applied as basal application and top-
dressing @ 8.00, 6.86 and 7.62 g/m2 of N: P: K, respectively. Yield
and yield related traits were measured. Culm length (cm) was in the
order of 5867-36 (101.9) > Koshi-36 (80.1) > IR36 (60.0), where
“>” indicated statistically significant difference at the 5% level.
Accordingly, sd1-d reduced culm by 41.9 and 20.1 cm, compared to
SD1-in and SD1-ja, respectively, and the effect of elongating culm
was higher in the former allele than in the latter one. Regarding total
brown rice yield (g/m2), the lines-variety were in the order of IR36
(611) ≧ 5867-36 (586) ≧ Koshi-36 (572), indicating non-significant
differences mutually. The lines-variety was in the same order in
yield-1.5mm sieve as in total brown rice yield. Regarding spikelet
number per panicle, the lines-variety were in the order of 5867-36
(89.2) ≧ IR36 (84.7) ≧ Koshi-36 (79.8), and 5867-36 > Koshi-36.
The order in panicle number per m2 was IR36 (428) ≧ Koshi-36
(403) ≧ 5867-36 (353), and IR36 > 5867-36, suggesting that sd1-d
increased number of panicles compared with SD1-in. SD1-in
increased total dry matter weight at maturity but decreased harvest
index as compared with sd1-d. The sd1-d did not have significant
effect on yield in indica genetic background, as far as lodging does
not give serious damage to yield.
Key words: Rice, dwarfing gene, sd1-d, SD1-in, SD1-ja, yield
Nepalese Journal of Agricultural Sciences, 2021, volume 21 ISSN 2091-042X; eISSN 2091-0428
219
INTRODUCTION
The sd1-d originating from an indica variety ‘Dee-geo-woo-gen’, viz. a
dwarfing allele at the sd1 locus on chromosome 1 in rice (Aquino et al., 1966,
Suh et al., 1978, Ogi et al., 1993, Murai et al. 2001 and Murai et al., 2003)
enhances lodging resistance due to the two factors a follows: to reduce culm
length, particularly lower internodes, and to increase stiffness of the fourth
internodes itself (Murai et al., 2004). This allele has been intensively utilized to
develop high-yielding indica varieties adaptable to higher fertilizer- application
and is harbored by almost all elite varieties in Southeast Asia (De Datta et al.,
1968 and Peng et al., 1999).
The wild type allele SD1encodes a gibberellins biosynthetic enzyme GA20
oxidase (GA20ox-2) that catalyzes late steps of gibberellins biosynthesis, while
sd1-d includes the deletion of 382 bp between two sites of Exon 1 and Exon 2,
resulting in the loss of the enzymic function (Ashikari et al., 2002, Monna et al.,
2002, Spielmeyar et al., 2002). The dominant allele SD1 at the locus is
differentiated into SD1-in and SD1-ja which is harbored in indica and japonica
subspecies’s, respectively (Murai et al., 2011). The effect of elongating culm
was higher in the former allele than in the latter one, which could be one of
causes of intersub-specific difference in height (Murai et al., 2011).
Nonsynonymous single-nucleotide polymorphism between SD1-in and SD1-ja
was detected at two sites in Exon 1 and Exon 3 of the sd1 locus (Murai et al.,
2011, Asano et al., 2011).
The dominant allele SD1 at the locus is differentiated into SD1-in and SD1-ja
which is harbored in indica and japonica subspecies’s, respectively (Murai et
al., 2011). The effect of elongating culm was higher in the former allele than in
the latter one, which could be one of causes of inter-subspecific difference in
height (Murai et al., 2011). Non-synonymous single-nucleotide polymorphism
between SD1-in and SD1-ja was detected at the two sites in the exon 1 and 3 of
the sd1 locus (Murai et al 2011, Asano et al., 2011).
The effects of sd1-d on yielding ability have been already investigated by using
the sd1-d isogenic lines of tall japonica varieties (Murai. et al., 2002); however,
such investigation by the isogenic line of an indica variety has not been
performed yet as far as we know. The sd1-d of an indica variety IR36 was
substituted with SD1-in or SD1-ja by backcrossing with IR36 recurrently, and
two tall isogenic lines regarding the respective dominant alleles were developed.
The two tall isogenic lines and IR36 were grown in an experimental paddy field
by an ordinary way of cultivation in the present study. Besides yield and its
components, dry matter weight at maturity, harvest index, leaf area at heading,
Nepalese Journal of Agricultural Sciences, 2021, volume 21 ISSN 2091-042X; eISSN 2091-0428
220
etc. were measured. On the basis of data obtained, the effects of sd1-d on yield
and related traits, compared with SD1-in and SD1-ja, were examined in the
common genetic background of IR 36.
MATERIALS AND METHODS
Tall isogenic lines
The tall isogenic line possessing SD1-in was developed by the following way
(Murai et al., 2011). IR5867 carrying SD1-in was crossed with IR36. An F1
plant (sd1-d/SD1-in) was backcrossed with IR36. Among B1F1 plants (sd1-
d/SD1-in or sd1-d/sd1-d), a tall (sd1-d/SD1-in) plant was backcrossed with
IR36. Similarly, backcrossing and selecting tall plant were repeated to B17F1
generation. Among B17F2 plants, a tall (SD1-in /SD1-in) plant was selected.
From B17F3 to B17F4 generations, non-segregation regarding plant height and
other traits was ascertained, and the SD1-in isogenic line denoted by “5867-36”
was completed. The SD1-ja isogenic line denoted by “Koshi-36” was completed
by the same procedure as that in 5867-36 using ‘Koshihikari’ as donor of SD1-
ja.
Cultivation in experimental field
Seeds of 5867-36, Koshi-36 and IR36 were sown on plastic trays filled with
granulated soil containing N, P2O5 and K2O and being adjusted at pH 4.5, on
April 21, 2017. Seedlings were grown at 25C for 4 days and then at 21C for 8
days in a natural-light phytotron. Seedlings were transplanted at a spacing of
30cm × 15cm (22.2 hills/m2) with two seedlings per hill to an experimental field
of Faculty of Agriculture and Marine Science, Kochi University, Nankoku,
Japan (33°35′N) on May 3. Just before ploughing, an ordinary chemical
fertilizer containing N, P2O5 and K2O was applied as basal dressing at the rate of
2.67 g/m2 for each of the three nutrient elements on April 14 (Table 1).
Moreover, top-dressing was performed 60 or 64 days before 80%-heading for
the two tall lines and IR36, respectively, at the rate of 5.33, 4.19 and 4.95 g/m2
for N, P2O5 and K2O, respectively, with a slow release and coated fertilizer
ECOLONG®
413-180 type manufactured by JCAM AGRI CO., LTD.
Accordingly, the total amount of the chemical fertilizers was applied at the rate
of 8.00, 6.86 and 7.62 g/m2 for N, P2O5 and K2O, respectively (Table 1).
Table 1. Chemical fertilizers applied in the experimental field
Way of
application
Chemical fertilizers applied N
(g/m2)
P2O5
(g/m2)
K2O
(g/m2)
Basal dressing Ordinary chemical fertilizer 2.67 2.67 2.67
Top dressing ECOLONG@413-180 type 5.33 4.19 4.95
Total 8.00 6.86 7.62
ECOLONG@413-180: 3% of each nutrient element is readily available
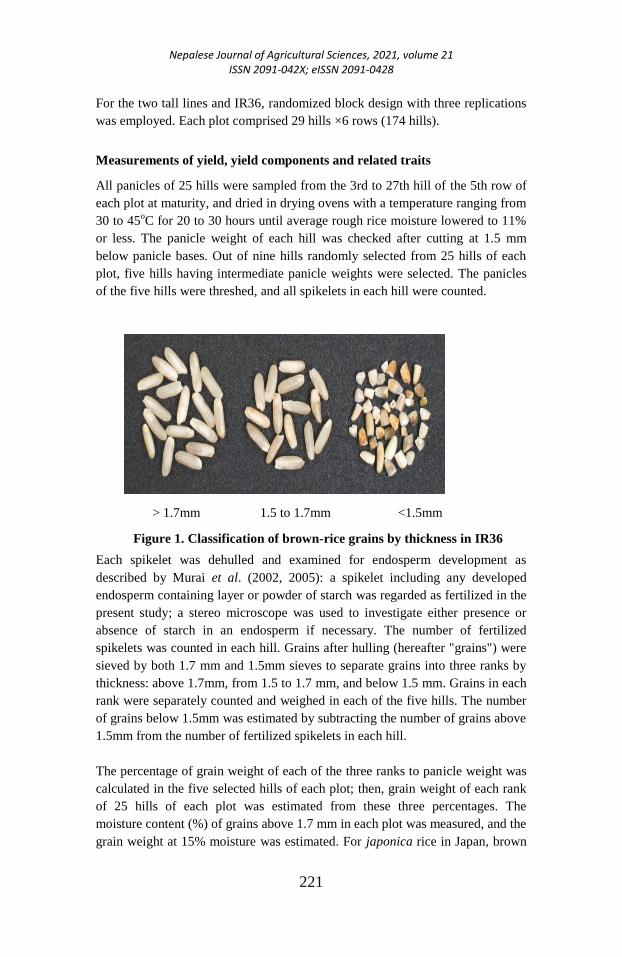
Nepalese Journal of Agricultural Sciences, 2021, volume 21 ISSN 2091-042X; eISSN 2091-0428
221
For the two tall lines and IR36, randomized block design with three replications
was employed. Each plot comprised 29 hills ×6 rows (174 hills).
Measurements of yield, yield components and related traits
All panicles of 25 hills were sampled from the 3rd to 27th hill of the 5th row of
each plot at maturity, and dried in drying ovens with a temperature ranging from
30 to 45oC for 20 to 30 hours until average rough rice moisture lowered to 11%
or less. The panicle weight of each hill was checked after cutting at 1.5 mm
below panicle bases. Out of nine hills randomly selected from 25 hills of each
plot, five hills having intermediate panicle weights were selected. The panicles
of the five hills were threshed, and all spikelets in each hill were counted.
> 1.7mm 1.5 to 1.7mm <1.5mm
Figure 1. Classification of brown-rice grains by thickness in IR36
Each spikelet was dehulled and examined for endosperm development as
described by Murai et al. (2002, 2005): a spikelet including any developed
endosperm containing layer or powder of starch was regarded as fertilized in the
present study; a stereo microscope was used to investigate either presence or
absence of starch in an endosperm if necessary. The number of fertilized
spikelets was counted in each hill. Grains after hulling (hereafter "grains") were
sieved by both 1.7 mm and 1.5mm sieves to separate grains into three ranks by
thickness: above 1.7mm, from 1.5 to 1.7 mm, and below 1.5 mm. Grains in each
rank were separately counted and weighed in each of the five hills. The number
of grains below 1.5mm was estimated by subtracting the number of grains above
1.5mm from the number of fertilized spikelets in each hill.
The percentage of grain weight of each of the three ranks to panicle weight was
calculated in the five selected hills of each plot; then, grain weight of each rank
of 25 hills of each plot was estimated from these three percentages. The
moisture content (%) of grains above 1.7 mm in each plot was measured, and the
grain weight at 15% moisture was estimated. For japonica rice in Japan, brown
Nepalese Journal of Agricultural Sciences, 2021, volume 21 ISSN 2091-042X; eISSN 2091-0428
222
rice just after hulling is separated with a 1.7mm-sieve or wider one to select
brown-rice grains with sufficiently high quality for milling from grains with low
quality. However, in each of the two tall lines and IR36, grains with thickness
from 1.5 to 1.7mm can be regarded as possessing quality sufficient for milling
(Figure 1). On the other hand, grains with thickness below 1.5 mm were already
broken or likely to break in milling process. Accordingly, we included the grains
from 1.5 to 1.7mm thickness into ripened grains. The number of grains from 1.5
to 1.7mm thickness accounted for 6.9 to 14.4% of all fertilized grains in the two
lines and IR36 (Table 2 - (1)). Grain weight from 1.5 to 1.7mm thickness
accounted for 5.8 to 12.2% of all fertilized-grain weight in the two lines and
IR36 (Table 2 - (2)). The total grain weight above 1.5mm thickness was denoted
by “yield-1.5mm sieve”. Furthermore, “total brown rice yield” was the brown
rice weight of all fertilized spikelets.
Among the four yield components, ripened-grain percentage was the ratio (%) of
the number of ripened grains to the total number of spikelets. Moreover, the
percentage of ripened grains to the fertilized spikelets, without unfertilized
spikelets, was calculated. This trait and fertilized-spikelet percentage (fertilized
spikelets ÷ all spikelets) enable to examine whether failure of spikelet
fertilization or insufficient grain-filling lowered ripened-grain percentage. The
mean spikelet number per hill of the 25 hills in each plot was estimated from
that of the five hills and the ratio of the mean panicle weight of the 25 hills to
that of the five hills. Both, “sink size-1” (single grain weight × spikelet number
per m2) and “sink size- 2” (single grain weight × fertilized-spikelet number per
m2) were estimated. Sink size- 2 provides the more exact estimate of sink
capacity of a line than the sink size-1 (Murai ea al. 2002 and 2005).
Measurements of dry matter and leaf area
At each of 80%-heading stage and maturity, nine hills were sampled from each
plot. Five hills, which had intermediate panicle numbers per hill, were selected
from the nine hills at each stage. Dry weight excluding roots of each hill was
measured after drying at 750 for two days. At the former stage, the total area of
living-leaves in each hill was measured.
Table 2. Classification of brown-rice grains by thickness in 5867-36, Koshi-
36 and IR-36
(1) Percentage on the basis of grain number
Thickness SD1-in SD1-ja sd1-d LSD (0.05)
586736 Koshi-36 IR36
>1.7 mm 85.7 a 78.8 a 78.3a 7.8
1.5- 1.7 mm 6.9 b 13.9a 14.4a 4.7
< 1.5 mm 7.4 a 7.3a 7.3a 3.4
Nepalese Journal of Agricultural Sciences, 2021, volume 21 ISSN 2091-042X; eISSN 2091-0428
223
(2) Percentage on the basis of grain weight
Thickness SD1-in SD1-ja sd1-d LSD (0.05)
586736 Koshi-36 IR36
>1.7 mm 92.3a 85.7b 85.3b 5.0
1.5- 1.7 mm 5.8b 11.8a 12.2a 4.5
< 1.5 mm 1.9a 2.5a 2.5a 0.9
Note: Values followed by the same letter within eah trait are not statistically different at 5% level,
determined by LSDs in the table.
Increase of total dry weight after heading and amount of tran-located
carbohydrates from culms and leaves to panicles
Rice yield at maturity is composed of both carbohydrates produced after heading
and carbohydrates translocated from those stored in culms and leaves (Wang et
al. 1982). The former can be approximated by the difference between total dry
matter weight at heading and that at maturity, viz. increase of total dry weight
after heading (ΔW) (Amano et al., 1993). The latter can be estimated by the
difference between dry matter weight of total brown rice (yield) and ΔW,
according to Amano et al. (1993). This estimation of amount of translocation is
employed in the present study.
Measurement of flag-leaf angle during maturing
Degree of angle between the base of a flag leaf blade and a part of culm just
above its auricle was measured with a protractor (the radius of 4.5 cm) in the
highest culm of each of 10 hills per plot of each line, on 5, 15 and 25 days after
80% heading and at maturity.
RESULTS AND DISCUSSION
Yield, yield components and culm length
The 80%-heading dates were July 27 in the two tall lines, and July 29 in IR36,
indicating little genetic difference among them in this trait (Table 1). In terms of
culm length (cm), the lines and variety were in the order of 5867-36 (101.9) >
Koshi-36 (80.1) > IR36 (60.0), where “>” indicates statistically significant
difference at the 5% level (Table 4).
Table 3. 80%-heading date and maturity of 5867-36, Koshi-36 and
IR36 in 2017
Parameters Allele
SD1-in SD1-ja sd1-d
Days to heading and maturity 5867-36 Koshi-36 IR36
80%-heading date 27-Jul 27-Jul 29-Jul
Number of days to 80%-heading 97 97 99
Maturity date 20-Aug 23-Aug 29-Aug
Number of days to maturity 121 124 130

Nepalese Journal of Agricultural Sciences, 2021, volume 21 ISSN 2091-042X; eISSN 2091-0428
224
Accordingly, sd1-d reduced culm length by 41.9 and 20.1 cm, compared with
SD1-in and SD1-ja, respectively; and the effect of elongating culm was higher in
the former allele than in the latter one. In panicle length, the lines-variety were
in the order of 5867-36 > Koshi-36 ≧ IR36, but the variation in this trait was
smaller than that in culm length. Total brown rice yield (g/m2), including
unripened grains, was in the order of IR36 (611) ≧ 5867-36 (586) ≧ Koshi-36
(572), suggesting non-significant differences among them. Similarly, significant
differences were not noticed among the two tall lines and variety regarding
yield-1.5mm sieve. Spikelet number per panicle was in the order of 5867-36
(89.2) ≧ IR36 (84.7) ≧ Koshi-36 (79.8), and 5867-36 > Koshi-36. Panicle
number per m2 was in the order of IR36 (428) ≧ Koshi-36 (403) ≧ 5867-36
(353), and IR36 > 5867-36, suggesting that sd1-d increased number of panicles
compared with SD1-in. The 1000 grain weight-1.5mm sieve (g) was in the order
of 5867-36 (21.5) > Koshi-36 (20.2) ≧ IR36 (19.9) (Table 4).
Ripened-grain percentage-1.5mm sieve was in the order of Koshi-36 (86.0) ≧
5867-36 (85.0) ≧ IR36 (82.7), and Koshi-36 > IR36. Regarding fertilized-
spikelet percentage, the lines and variety were in the same order as in ripened-
grain percentage-1.5mm sieve, ranging from 89.2 to 92.8%. There were not
significant differences among the lines and variety in the percentage of ripened
grains to the fertilized spikelets. Therefore, the difference in fertilized-spikelet
percentage seems to have almost caused that in ripened-grain percentage-1.5mm
sieve. Spikelet number per m2 was in the order of IR36 ≧ Koshi-36 ≧ 5867-36.
Regarding sink size-1 as well as sink size-2, the tall lines and IR36 were in the
order of IR36 ≧ 5867-36 ≧ Kosihi-36. It was common in these three traits that
IR36 was higher than the two tall lines although not significantly (Table 5).
Nepalese Journal of Agricultural Sciences, 2021, volume 21 ISSN 2091-042X; eISSN 2091-0428
225
Dry matter production, Harvest Index and LAI
There were not significant differences among the two tall lines and IR36 in Leaf
area index (LAI) at heading. Regarding total dry weight at heading, 5867-36 was
11% higher than IR36 while Koshi-36 was similar to IR36, although their
mutual differences were not statistically significant. The two tall lines and IR36
were in the same order in total dry weight at maturity as in that at heading.
Harvest index of total brown rice (%) was in the order of IR36 (40.0) > Koshi-
36 (38.2) > 5867-36 (35.6). The percentages of Koshi-36 and 5867-36 relative to
IR36 in harvest index-1.5mm sieve were almost identical with those in harvest
index of total brown rice. Hence, sd1-d enhanced harvest index as compared
with SD1-in as well as SD1-ja. It is noteworthy that the decrease of total dry
weight and the increase of harvest index were simultaneously produced by
replacing SD1-in with sd1-d (Table 6).
Amount of translocated carbohydrates from culms and leaves to panicles
and related traits
Regarding increase of total dry weight after heading the two tall lines and IR36
were similar to one another (330 to 349 g/m2). As for amount of translocation,
the lines and variety were not significantly different mutually.
Nepalese Journal of Agricultural Sciences, 2021, volume 21 ISSN 2091-042X; eISSN 2091-0428
226
Nevertheless, the lines and IR36 had considerably high values (30.6 to 32.9%)
in contribution of amount of translocation to dry weight of total brown rice
(yield) (Table 7).
Flag-Leaf Angle during maturing period
The two tall lines and IR36 were not significantly different mutually on 5 days
after 80%-heading and at maturity in flag-leaf angle (Table 8). 5867-36 was
significantly higher than Koshi-36 and IR36 on 15 days and 25 days after 80%-
heading in this trait although the differences were small. Even at maturity, flag
leaves were nearly erect in the two lines and IR36, suggesting the characteristic
of erect flag leaves seems to be due to the genetic back ground of IR36 with and
without sd1-d.
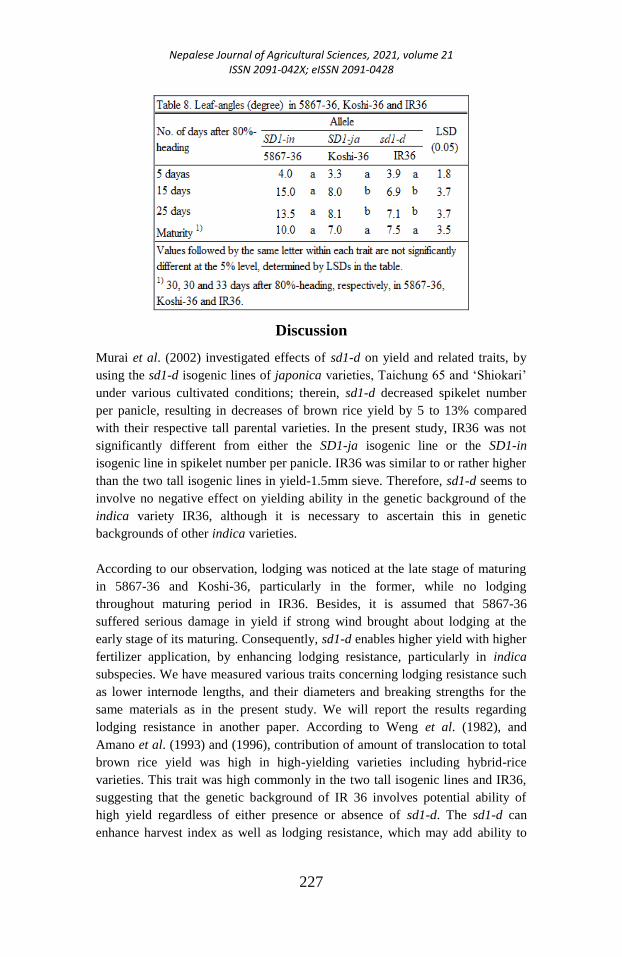
Nepalese Journal of Agricultural Sciences, 2021, volume 21 ISSN 2091-042X; eISSN 2091-0428
227
Discussion
Murai et al. (2002) investigated effects of sd1-d on yield and related traits, by
using the sd1-d isogenic lines of japonica varieties, Taichung 65 and ‘Shiokari’
under various cultivated conditions; therein, sd1-d decreased spikelet number
per panicle, resulting in decreases of brown rice yield by 5 to 13% compared
with their respective tall parental varieties. In the present study, IR36 was not
significantly different from either the SD1-ja isogenic line or the SD1-in
isogenic line in spikelet number per panicle. IR36 was similar to or rather higher
than the two tall isogenic lines in yield-1.5mm sieve. Therefore, sd1-d seems to
involve no negative effect on yielding ability in the genetic background of the
indica variety IR36, although it is necessary to ascertain this in genetic
backgrounds of other indica varieties.
According to our observation, lodging was noticed at the late stage of maturing
in 5867-36 and Koshi-36, particularly in the former, while no lodging
throughout maturing period in IR36. Besides, it is assumed that 5867-36
suffered serious damage in yield if strong wind brought about lodging at the
early stage of its maturing. Consequently, sd1-d enables higher yield with higher
fertilizer application, by enhancing lodging resistance, particularly in indica
subspecies. We have measured various traits concerning lodging resistance such
as lower internode lengths, and their diameters and breaking strengths for the
same materials as in the present study. We will report the results regarding
lodging resistance in another paper. According to Weng et al. (1982), and
Amano et al. (1993) and (1996), contribution of amount of translocation to total
brown rice yield was high in high-yielding varieties including hybrid-rice
varieties. This trait was high commonly in the two tall isogenic lines and IR36,
suggesting that the genetic background of IR 36 involves potential ability of
high yield regardless of either presence or absence of sd1-d. The sd1-d can
enhance harvest index as well as lodging resistance, which may add ability to
Nepalese Journal of Agricultural Sciences, 2021, volume 21 ISSN 2091-042X; eISSN 2091-0428
228
obtain higher yield by higher application of fertilizer into the genetic
background of IR36.
REFERENCES Amano, T., C. Shi, Y. Wang, D. Qin, Tsuda, M. and Matsumoto, Y. (1996) High-yielding
performance of paddy rice achieved in Yunan province, China. II. Spikelet production of
japonica F1 hybrid rice, Yu-Za 29, Jpn. J. Crop. Sci. 65: 22-28 (in Japanese with
English summary).
Amano, T., Q. Zhu, Y. Wang, Inoue, N.and Tanaka, H. (1993) Case studies on high yields of paddy
rice in Jiangsu province, China. II. Analysis of characters related to lodging. Jpn. J.
Crop. Sci. 62: 275-281.
Aquino, R. C. and Jennings, P. R. (1966) Inheritance of semi dwarfism in an indica rice
variety. Crop Sci. 6: 551-554.
Asano, K., M. Yamasaki, S. Takuno, K. Miura, S. Katagiri, T. Ito, K. Doi, J. Wu, K. Ebana, T.
Matsumoto, H. Innan, H. Kitano, Ashikari, M. and Matsuoka, M. (2011) Artificial
selection for a green revolution gene during japonica rice domestication, Proc. Natl.
Acad. Sci. USA, 108: 11034-11039.
Ashikari, M., A. Sasaki, M. Ueguchi-Tanaka, H. Itoh, A. Nishimura, S. Datta, K. Ishiyama, T. Saito,
M. Kobayashi, G. S. Khush, Kitano, H. and Matsuoka, M. (2002) Loss-of-function of a
rice gibberellin biosynthetic gene, GA20oxidase (GA20ox-2) led to the rice ‘Green
revolution’ Breed. Sci: 52: 143- 150.
De Datta, S. K., Tauro, A. C. and Balaoing, S. N. (1968) Effects of plant type and Nitrogen level on
the growth characteristics and grain yield of indica rice in the tropics. Agron J. 60.
Monna, L., Kitazawa, N. Yoshino R., Suzuki, J., Masuda, H., Maehara, Y.. Tanji, M. Sato, M.,
Nasu, S. and Minobe, Y. (2002) Positional cloning of rice semidwarfing gene, sd-1: Rice
“Green revolution gene” encodes a mutant enzyme involved in gibberellin synthesis.
DNA Res. 9: 11-17.
Murai, M. and Yamamoto, H. (2001) Allelic relationships and height effects of rice dwarfing genes
from cvv. Dee-geo-woo-gen, Calrose 76 and Reimei determined in a constant genetic
background, SABRO Journal of Breeding and Genetics. 33: 21-30.
Murai M., H. Nagano, K. Onishi, A. Ogino, N. Ichikawa, H. B. KC And Y. Sano (2011)
Differentiation in wild-type allele of the sd1 locus concerning culm length between
indica and japonica subspecies of Oryza sativa (rice) Hereditas, 148: 1-7.
Murai, M., Takamure, I., Sato, S., Tokutome T. and Sato, Y. (2002) Effects of the dwarfing gene
originating from ‘Dee-geo-woo-gen’ on yield and its related traits in rice, Breed. Sci. 52:
95-100.
Murai, M., K. Maruyama and F. Kikuchi (2003) Gene symbol registration No. 155. Gene
symbol: sd1-r, sd1-d, Rice Genet. News. 20: 5.
Murai, M., K. Nakamura, M. Saito, A. Nagayama and K. Ise, (2005) Yield-increasing effect of a
major gene, Ur1 (Undulate rachis -1) on different genetic background in rice, Breed. Sci.
55: 279-285.
Murai, M., Sato, S., Nagayama, A., Ishii N. and Ihashi, S. (2002) Effects of a major gene Ur1
characterized by undulation of rachis branches on yield and its related traits in rice.
Breed. Sci. 52: 299-307.
Murai, M., Komazaki, T. and Sato, S. (2004) Effects of sd1 and Ur1 (Undulate rachis-1) on lodging
resistance and its related traits in rice”, Breed. Sci. 54: 333-340.
Ogi, Y., Kato, H., Maruyama, K. and Kikuchi, F., (1993) The effects on the culm length and other
agronomic characters caused by semi-dwarfing gene at the sd-1 locus in rice, J. Breed.
43: 267-275.
Pnag, S., Cassman, K. G., Virmani, S. S., Sheehy, J. and Khush, G.S. (1999) Yield potential trends
of tropical rice since the release of IR8 and the challenge of increasing rice yield
potential. Crop Sci. 39: 1552-1559.
Nepalese Journal of Agricultural Sciences, 2021, volume 21 ISSN 2091-042X; eISSN 2091-0428
229
Spielmeyer, W., Ellis, M. H. and Chandler, P. M. (2002) Semidwarf (sd-1), “green evolution” rice,
contains a defective gibberellin 20-oxidase gene Proc. Natl. Acad. Sci. USA. 99: 9043-
9048.
Suh, S. H. and Heu, M. H., (1978) The segregation mode of plant height in the cross of rice
varieties. VI. Linkage Analysis of the semi-deafness of the rice variety “Tongil”, Korean
J. Breeding. 10: 1-6.
Weng, J., Takeda, T., Agata W., and Hakoyama, S. (1982) Studies on Dry Matter and Grain
Production of Rice Plants. I. Influence of the researved carbohydrate until heading stage
and the assimilation products during the ripening period on grain production, Proc. Crop
Sci. Soc. Japan, 51: 500-509 (in Japanese with English summary).
Nepalese Journal of Agricultural Sciences, 2021, volume 21 ISSN 2091-042X; eISSN 2091-0428
230
In- vitro efficacy of trichoderma isolates against
fusarium oxysporum f. Sp. Lentis
Sudikshya Devkota* and Pratima Poudel
Himalayan College of Agricultural Science and Technology (HICAST),
Kathmandu, Nepal *Corresponding Author: [email protected]
ABSTRACT
Soil borne pathogens attack a wide range of susceptible plants
and cause diseases like root rot, damping off, seed decay.
Fusarium is a soil borne pathogen found in almost all types of
soil causing heavy losses in the lentil production. Trichoderma
species can be used as an effective alternative technique
against synthetic fungicides and fumigants. Trichoderma
species have been known to be able to attack plant pathogenic
fungi to produce antibiotics and act as bio-control agents.
This research was carried out in Plant Pathology Division,
NARC, Khumaltar to study the in- vitro efficacy of
Trichoderma isolates against Fusarium oxysporum f. sp .lentis
by dual culture technique. Fourteen treatments with three
replications were used in the experiment in complete
randomized design (CRD). Among which, ten Trichoderma
were isolated from various soil samples and three species of
Trichoderma (T. viride, T.harzianum and T. koningii) were
collected from the laboratory of NARC. All the tested
bioagents inhibited the growth of F. oxysporum f.sp lentis.
Maximum inhibition percentage of radial growth of Fol was
shown by T. koningi (71%) followed by T. harzianum (60%)
and T. viride (59%) along with T. isolates (T6 and T7) 56%
after 168 hrs of incubation.
Keywords: Soil borne pathogen, dual culture technique, bioagents, species of
Trichoderma
INTRODUCTION
Lentil is the main pulse crop in Nepal as it covers 62% area and 64% production
of the total legume (MoAD, 2012). Lentil has been identified as one of the major
agricultural products among 12 goods with high export and medium
socioeconomic impacts potential by Nepal Trade Integration Strategy. Globally,
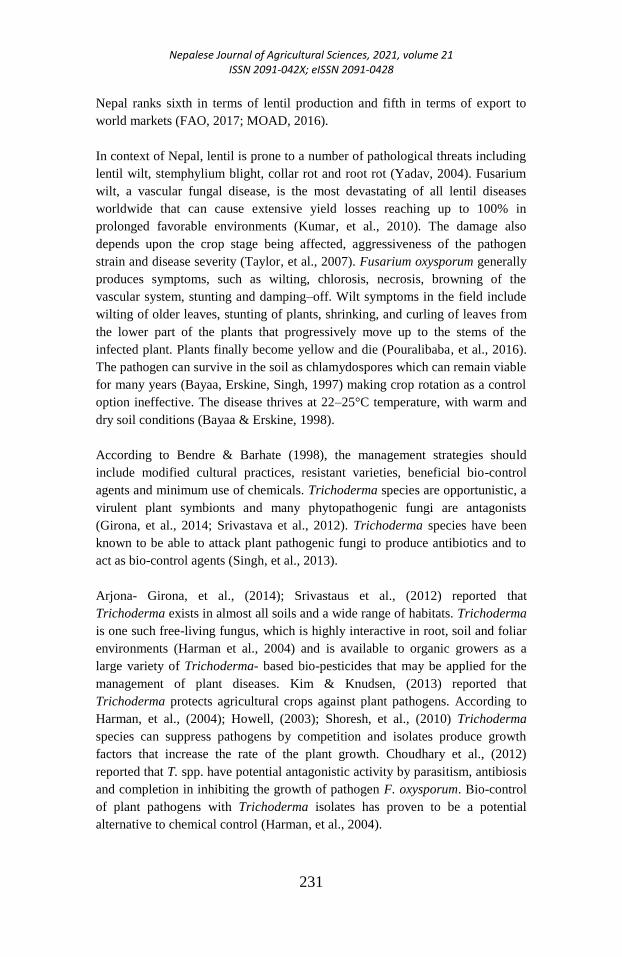
Nepalese Journal of Agricultural Sciences, 2021, volume 21 ISSN 2091-042X; eISSN 2091-0428
231
Nepal ranks sixth in terms of lentil production and fifth in terms of export to
world markets (FAO, 2017; MOAD, 2016).
In context of Nepal, lentil is prone to a number of pathological threats including
lentil wilt, stemphylium blight, collar rot and root rot (Yadav, 2004). Fusarium
wilt, a vascular fungal disease, is the most devastating of all lentil diseases
worldwide that can cause extensive yield losses reaching up to 100% in
prolonged favorable environments (Kumar, et al., 2010). The damage also
depends upon the crop stage being affected, aggressiveness of the pathogen
strain and disease severity (Taylor, et al., 2007). Fusarium oxysporum generally
produces symptoms, such as wilting, chlorosis, necrosis, browning of the
vascular system, stunting and damping–off. Wilt symptoms in the field include
wilting of older leaves, stunting of plants, shrinking, and curling of leaves from
the lower part of the plants that progressively move up to the stems of the
infected plant. Plants finally become yellow and die (Pouralibaba, et al., 2016).
The pathogen can survive in the soil as chlamydospores which can remain viable
for many years (Bayaa, Erskine, Singh, 1997) making crop rotation as a control
option ineffective. The disease thrives at 22–25°C temperature, with warm and
dry soil conditions (Bayaa & Erskine, 1998).
According to Bendre & Barhate (1998), the management strategies should
include modified cultural practices, resistant varieties, beneficial bio-control
agents and minimum use of chemicals. Trichoderma species are opportunistic, a
virulent plant symbionts and many phytopathogenic fungi are antagonists
(Girona, et al., 2014; Srivastava et al., 2012). Trichoderma species have been
known to be able to attack plant pathogenic fungi to produce antibiotics and to
act as bio-control agents (Singh, et al., 2013).
Arjona- Girona, et al., (2014); Srivastaus et al., (2012) reported that
Trichoderma exists in almost all soils and a wide range of habitats. Trichoderma
is one such free-living fungus, which is highly interactive in root, soil and foliar
environments (Harman et al., 2004) and is available to organic growers as a
large variety of Trichoderma- based bio-pesticides that may be applied for the
management of plant diseases. Kim & Knudsen, (2013) reported that
Trichoderma protects agricultural crops against plant pathogens. According to
Harman, et al., (2004); Howell, (2003); Shoresh, et al., (2010) Trichoderma
species can suppress pathogens by competition and isolates produce growth
factors that increase the rate of the plant growth. Choudhary et al., (2012)
reported that T. spp. have potential antagonistic activity by parasitism, antibiosis
and completion in inhibiting the growth of pathogen F. oxysporum. Bio-control
of plant pathogens with Trichoderma isolates has proven to be a potential
alternative to chemical control (Harman, et al., 2004).
Nepalese Journal of Agricultural Sciences, 2021, volume 21 ISSN 2091-042X; eISSN 2091-0428
232
MATERIALS AND METHODS
The experiment was carried out in the laboratory of Plant Pathology Division,
NARC located at Khumaltar, Lalitpur. The study was designed in Complete
Randomized Design (CRD).
Collection of soil samples
Forty various soil samples were collected from different geographical regions of
Nepal: Himalayan region, Hilly region and Terai region. Among which, 10
samples were self collected and 30 samples were collected from the laboratory
of Plant Pathology Division.
Isolation and identification of Trichoderma from the soil
Bioagents, Trichoderma, were isolated from the representative soil samples by
the serial dilution plate technique under laminar air flow condition. Serial
dilution is a series of sequential dilutions that are performed to convert a dense
solution into a more usable concentration. Serial dilution was done up to 5 times
making the final dilution of 10-5.Using pipette, 100 ul (0.1 ml) of sample was
pipetted out and placed in each petri plates containing TSM media and incubated
at 26±20C. After placing 2-3 days in the incubator, growth of different pathogen
takes place.
For the identification and confirmation of Trichoderma species, all the isolates
were observed under a microscope (Olympus CH20). The green sporulation
with white mycelia (fuzzy growth of fungus), branched hyaline conidiophores,
flask- shaped phialides (irregularly verticilliate, irregularly bent) and conidia
(phialospores, unicellular, round or ellipsoidal, green patches with smooth or
rough wall) borne in small terminal clusters provided a tentative identification of
Trichoderma.
Isolation and identification of pathogen from diseased plant sample
The diseased plant sample of lentil was collected from the field of Agronomy
Division, NARC and plating of infected parts was performed in moist paper and
in water agar (WA) media. Then, both the petri plates incubated for 24- 48 hours
at 26±20C.
After 3- 4 days, sporulation and mycelial growth occured in petri plates were
observed under microscope by slide preparation. Extensive mycelium and
cotton- like in culture, with some tinge of pink and purple in the mycelium;
conidiophores variable, slender, short, stout, branched irregularly: conidia
(phialospores) hyaline and variable confirms the identification of pathogen
Fusarium oxysporum.
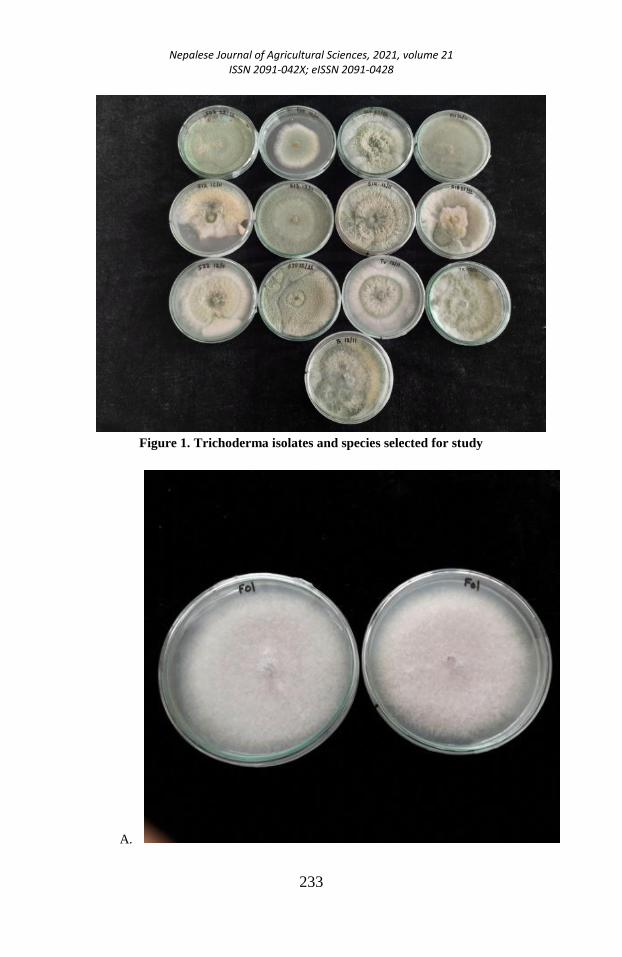
Nepalese Journal of Agricultural Sciences, 2021, volume 21 ISSN 2091-042X; eISSN 2091-0428
233
Figure 1. Trichoderma isolates and species selected for study
A.

Nepalese Journal of Agricultural Sciences, 2021, volume 21 ISSN 2091-042X; eISSN 2091-0428
234
B.
Figure 2. A. Fusarium isolated from diseased sample B. Microscopic view of Fol
In- vitro evaluation of Trichoderma isolates against Fusarium oxysporum
f.sp. lentis by dual culture plate technique
Fourteen treatments and three replications were used among which ten
treatments were different Trichoderma isolates and three were Trichoderma
species along with one control.
The pure culture of Trichoderma isolates was isolated from various soil samples
and F. oxysporum f. sp. lentis was isolated from lentil plant in laboratory of
Plant Pathology Division, NARC, Khumaltar; and incubated in incubator at
26±20 C for one week. 20ml of PDA media was poured in each petriplates of 9
cm size and allowed to solidify for 24 hours. Under laminar air flow condition,
seven days old 5 mm disc of Fol strains and T. species were cut with a sterile
cork borer and placed equidistant from the periphery at opposite ends. The
colony diameter of radial growth of targeted fungal pathogens was measured
after 48 hours interval up to 6 days of inoculation. After incubation period, the
radial growth of Fol in control as well as in treatment plates was measured and
the percent inhibition was calculated.
Percent inhibition of fungal growth was calculated using the following formula
(Vincent, 1947).
Percent growth inhibition (%) =
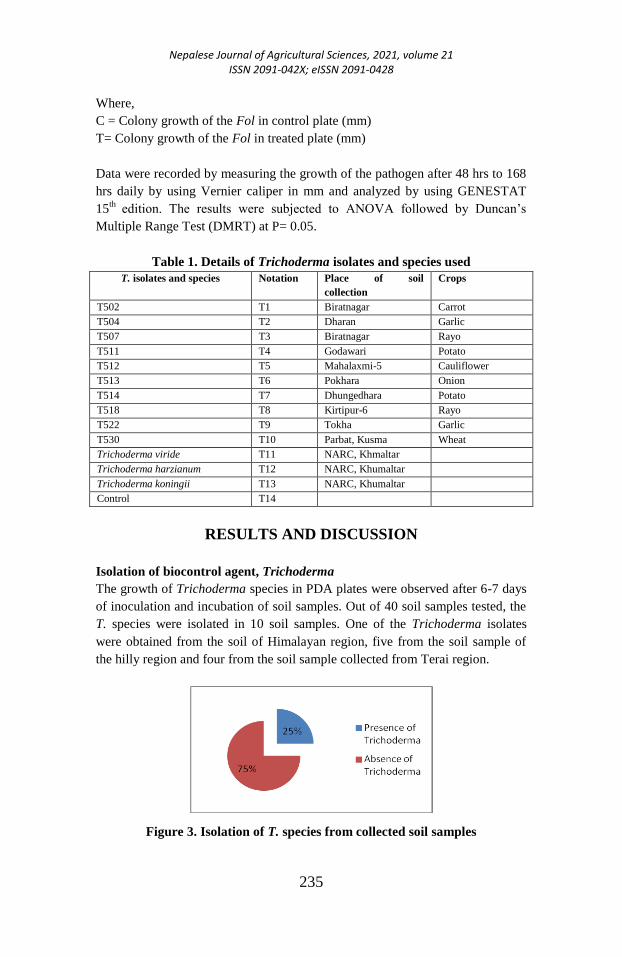
Nepalese Journal of Agricultural Sciences, 2021, volume 21 ISSN 2091-042X; eISSN 2091-0428
235
Where,
C = Colony growth of the Fol in control plate (mm)
T= Colony growth of the Fol in treated plate (mm)
Data were recorded by measuring the growth of the pathogen after 48 hrs to 168
hrs daily by using Vernier caliper in mm and analyzed by using GENESTAT
15th
edition. The results were subjected to ANOVA followed by Duncan’s
Multiple Range Test (DMRT) at P= 0.05.
Table 1. Details of Trichoderma isolates and species used
T. isolates and species Notation Place of soil
collection
Crops
T502 T1 Biratnagar Carrot
T504 T2 Dharan Garlic
T507 T3 Biratnagar Rayo
T511 T4 Godawari Potato
T512 T5 Mahalaxmi-5 Cauliflower
T513 T6 Pokhara Onion
T514 T7 Dhungedhara Potato
T518 T8 Kirtipur-6 Rayo
T522 T9 Tokha Garlic
T530 T10 Parbat, Kusma Wheat
Trichoderma viride T11 NARC, Khmaltar
Trichoderma harzianum T12 NARC, Khumaltar
Trichoderma koningii T13 NARC, Khumaltar
Control T14
RESULTS AND DISCUSSION
Isolation of biocontrol agent, Trichoderma
The growth of Trichoderma species in PDA plates were observed after 6-7 days
of inoculation and incubation of soil samples. Out of 40 soil samples tested, the
T. species were isolated in 10 soil samples. One of the Trichoderma isolates
were obtained from the soil of Himalayan region, five from the soil sample of
the hilly region and four from the soil sample collected from Terai region.
Figure 3. Isolation of T. species from collected soil samples
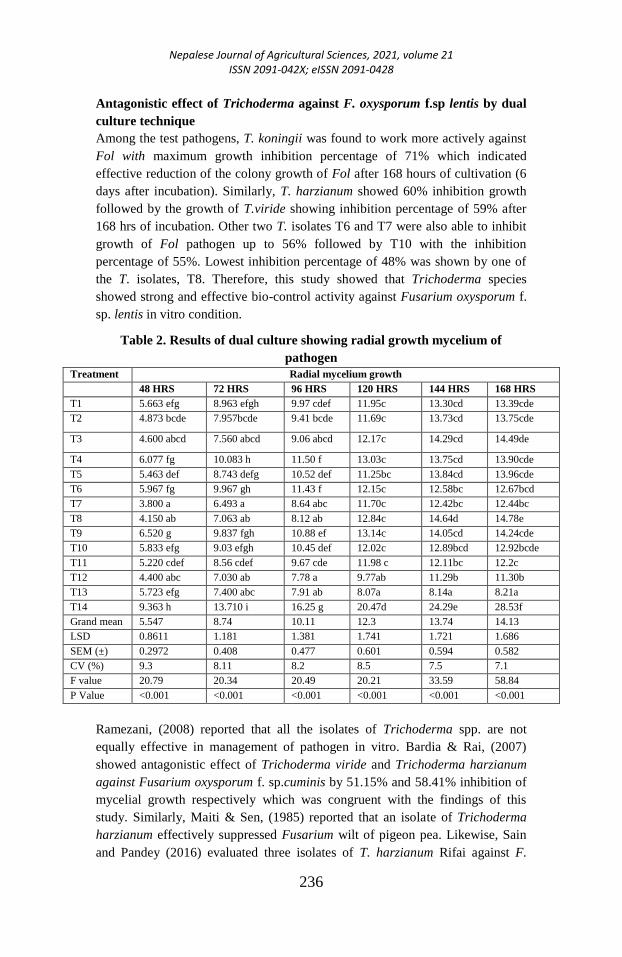
Nepalese Journal of Agricultural Sciences, 2021, volume 21 ISSN 2091-042X; eISSN 2091-0428
236
Antagonistic effect of Trichoderma against F. oxysporum f.sp lentis by dual
culture technique
Among the test pathogens, T. koningii was found to work more actively against
Fol with maximum growth inhibition percentage of 71% which indicated
effective reduction of the colony growth of Fol after 168 hours of cultivation (6
days after incubation). Similarly, T. harzianum showed 60% inhibition growth
followed by the growth of T.viride showing inhibition percentage of 59% after
168 hrs of incubation. Other two T. isolates T6 and T7 were also able to inhibit
growth of Fol pathogen up to 56% followed by T10 with the inhibition
percentage of 55%. Lowest inhibition percentage of 48% was shown by one of
the T. isolates, T8. Therefore, this study showed that Trichoderma species
showed strong and effective bio-control activity against Fusarium oxysporum f.
sp. lentis in vitro condition.
Table 2. Results of dual culture showing radial growth mycelium of
pathogen
Treatment Radial mycelium growth
48 HRS 72 HRS 96 HRS 120 HRS 144 HRS 168 HRS
T1 5.663 efg 8.963 efgh 9.97 cdef 11.95c 13.30cd 13.39cde
T2 4.873 bcde 7.957bcde 9.41 bcde 11.69c 13.73cd 13.75cde
T3 4.600 abcd 7.560 abcd 9.06 abcd 12.17c 14.29cd 14.49de
T4 6.077 fg 10.083 h 11.50 f 13.03c 13.75cd 13.90cde
T5 5.463 def 8.743 defg 10.52 def 11.25bc 13.84cd 13.96cde
T6 5.967 fg 9.967 gh 11.43 f 12.15c 12.58bc 12.67bcd
T7 3.800 a 6.493 a 8.64 abc 11.70c 12.42bc 12.44bc
T8 4.150 ab 7.063 ab 8.12 ab 12.84c 14.64d 14.78e
T9 6.520 g 9.837 fgh 10.88 ef 13.14c 14.05cd 14.24cde
T10 5.833 efg 9.03 efgh 10.45 def 12.02c 12.89bcd 12.92bcde
T11 5.220 cdef 8.56 cdef 9.67 cde 11.98 c 12.11bc 12.2c
T12 4.400 abc 7.030 ab 7.78 a 9.77ab 11.29b 11.30b
T13 5.723 efg 7.400 abc 7.91 ab 8.07a 8.14a 8.21a
T14 9.363 h 13.710 i 16.25 g 20.47d 24.29e 28.53f
Grand mean 5.547 8.74 10.11 12.3 13.74 14.13
LSD 0.8611 1.181 1.381 1.741 1.721 1.686
SEM (±) 0.2972 0.408 0.477 0.601 0.594 0.582
CV (%) 9.3 8.11 8.2 8.5 7.5 7.1
F value 20.79 20.34 20.49 20.21 33.59 58.84
P Value <0.001 <0.001 <0.001 <0.001 <0.001 <0.001
Ramezani, (2008) reported that all the isolates of Trichoderma spp. are not
equally effective in management of pathogen in vitro. Bardia & Rai, (2007)
showed antagonistic effect of Trichoderma viride and Trichoderma harzianum
against Fusarium oxysporum f. sp.cuminis by 51.15% and 58.41% inhibition of
mycelial growth respectively which was congruent with the findings of this
study. Similarly, Maiti & Sen, (1985) reported that an isolate of Trichoderma
harzianum effectively suppressed Fusarium wilt of pigeon pea. Likewise, Sain
and Pandey (2016) evaluated three isolates of T. harzianum Rifai against F.
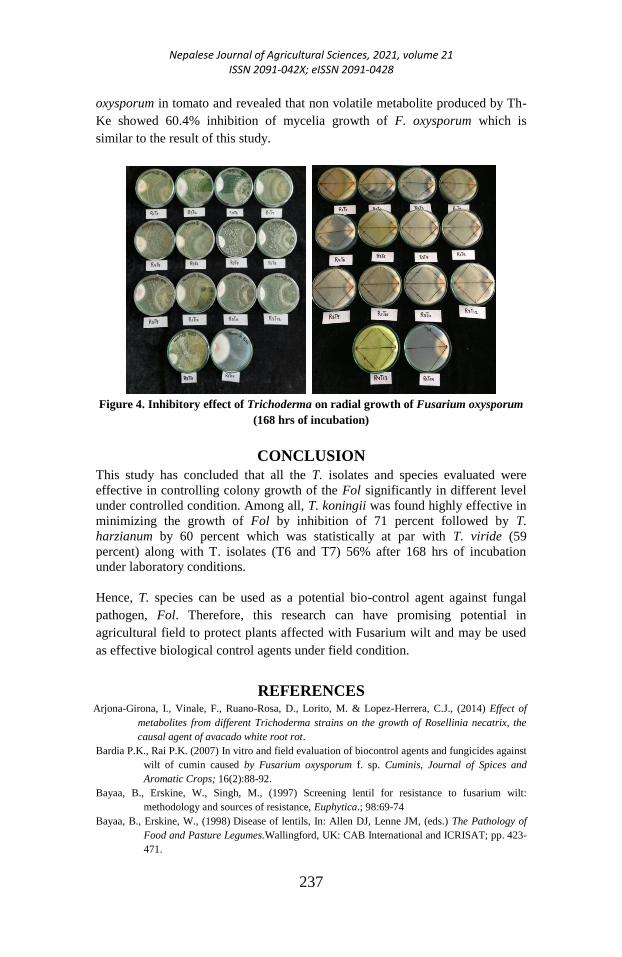
Nepalese Journal of Agricultural Sciences, 2021, volume 21 ISSN 2091-042X; eISSN 2091-0428
237
oxysporum in tomato and revealed that non volatile metabolite produced by Th-
Ke showed 60.4% inhibition of mycelia growth of F. oxysporum which is
similar to the result of this study.
Figure 4. Inhibitory effect of Trichoderma on radial growth of Fusarium oxysporum
(168 hrs of incubation)
CONCLUSION
This study has concluded that all the T. isolates and species evaluated were
effective in controlling colony growth of the Fol significantly in different level
under controlled condition. Among all, T. koningii was found highly effective in
minimizing the growth of Fol by inhibition of 71 percent followed by T.
harzianum by 60 percent which was statistically at par with T. viride (59
percent) along with T. isolates (T6 and T7) 56% after 168 hrs of incubation
under laboratory conditions.
Hence, T. species can be used as a potential bio-control agent against fungal
pathogen, Fol. Therefore, this research can have promising potential in
agricultural field to protect plants affected with Fusarium wilt and may be used
as effective biological control agents under field condition.
REFERENCES Arjona-Girona, I., Vinale, F., Ruano-Rosa, D., Lorito, M. & Lopez-Herrera, C.J., (2014) Effect of
metabolites from different Trichoderma strains on the growth of Rosellinia necatrix, the
causal agent of avacado white root rot.
Bardia P.K., Rai P.K. (2007) In vitro and field evaluation of biocontrol agents and fungicides against
wilt of cumin caused by Fusarium oxysporum f. sp. Cuminis, Journal of Spices and
Aromatic Crops; 16(2):88-92.
Bayaa, B., Erskine, W., Singh, M., (1997) Screening lentil for resistance to fusarium wilt:
methodology and sources of resistance, Euphytica.; 98:69-74
Bayaa, B., Erskine, W., (1998) Disease of lentils, In: Allen DJ, Lenne JM, (eds.) The Pathology of
Food and Pasture Legumes.Wallingford, UK: CAB International and ICRISAT; pp. 423-
471.
Nepalese Journal of Agricultural Sciences, 2021, volume 21 ISSN 2091-042X; eISSN 2091-0428
238
Bendre, N. J. & Barhate, B.G. (1998) A souvenir on disease management in chickpea, Rahuri,
Maharashtra, India: M.P.K.V.
Choudhary, S., and Mohanka, R., (2012) In vitro antagonism of indigenous Trichoderma isolates
against phytopathogen causing wilt of lentil, International Journal of Life science &
Pharma Research Vol 2
Harman, G. E., Howell, C. R., Viterbo, A., Chet, I. & Lorito, M., (2004) .Trichoderma species –
opportunistic, avirulent plant symbionts. Nature Reviews Microbiology, 2, 43–56.
Kim, T.G. & Knudsen, G. (2013) Relationship between the biocontrol fungus Trichoderma
harzianum and the phytopathogenic fungus Fusarium solani f.sp pisi, Applied Soil
Ecology, 68: 57-60
Kumar, S., Kumar, J., Singh, S., Seid Ahmed, Chaudhary, R.G. and Sarker, A. (2010). Vascular Wilt
Disease of Lentil : A Review.3 p.
Maiti, D. and Sen, C. (1985) Integrated biological control of Sclerotium rolfsii with nitrogenous
fertilizers and T. harzianum, Indian Journal of Agricultural Sciences.55: 464-468
MoAD, (2012). Stasticial information on Nepalese agriculture (Time Series Information), Agri-
business Promotion and Statistical Division, Agri. Statistics Section, Singh Durbar
Kathmandu, Nepal.
MoAD, (2016) Statistical information on Nepalese agriculture, Ministry of Agricultural
Development, Kathmandu, Nepal
Pouralibaba, H. R. & Rubiales, D., (2016) Histopathology of the infection on resistant and
susceptible lentil accessions by two contrasting pathotypes of Fusarium oxysporum f. sp.
lentis
Ramezani H., (2008). Biological control of root-rot of eggplant caused by Macrophomina
phaseolina, American- Eurasian J.Agric. Environ. Sci, 4(2): 218-220
Sain, S.K., and Pandey, A.K. (2016) Biological spectrum of Trichoderma harzianum Rifai isolates to
control fungal diseases of tomato (Solanum lycopersicon L.). Arch. Phytopathol. Plant
Prot. 49 (19-20): 507-521.
Shores, M., Harman, G.E., & Mastouri, F., (2010) Induced systemic resistance and plant responses
to fungal biocontrol agents, 48: 21-23
Taylor, P., Lindbeck, K., Chen, W. & Food, R., (2007). Lentil Diseases. In: Lentil: An Ancient Crop
for Modern Times, Yadav, S.S. and P.C. Stevenson (Eds.). The Netherlands, pp: 291-313.
Vincent, J. M. (1947) The esters of 4- hydroxybenzoic acid and related compounds. Part I. Methods
for the study of their fungicidal properties, London, J. Soc. Chem. Ind., 66: 149-155
Yadav, N. K., Ghimire, S. K., Shrestha, S. M., Sah, B. P., Sarker, A.& Sah, S. K. (2017) Source of
resistant against Fusarium wilt and Stemphylium blight in lentil (Lens culinaris Medikus),
International Journal of Applied Sciences and Biotechnology (IJASBT), 5(1), 102-107

Nepalese Journal of Agricultural Sciences, 2021, volume 21 ISSN 2091-042X; eISSN 2091-0428
239
Diversity and use of neglected and underutilized
species at Godawari municipality, Nepal
Prakriti Chand and Binayak P Rajbhandari
Himalayan College of Agricultural Sciences & Technology (HICAST), PU,
Kathmandu
Corresponding Author: [email protected]
ABSTRACT
The study was conducted in Godawari municipality, Nepal to
assess the use and diversity of neglected and underutilized
species (NUS) as well as the traditional management and
future potentialities. Wide range of participatory tools through
household survey (100 respondents), 8 focus group
discussions, and 20 key informant interviews were followed by
rapid market assessments and supplemented by literature
review. This study recorded 95 NUS belonging to 43 families.
Twenty seven species had multiple uses. The NUS observed
during the study belonged to various categories like
vegetables (31spp), fruits (20 spp), and wild species (14 spp).
Eighty nine species were observed as medicinally valued
species. It is very interesting to note that 84% of respondents
used these species variously during food deficient period of
the year. Diversity of NUS has huge potential as an alternative
future smart food (FSF) due to its remarkable ability to be
adapted in marginal soil and harsh climatic condition as well
as higher nutritional values.
Keywords: Agrobiodiversity, future smart food, conservation, NUS crops
INTRODUCTION
Nepalese economy is dominated by agriculture (MoAD, 2016) and the
contribution of agriculture in the national GDP is 27.6%. The contribution of the
horticultural crops in agriculture gross domestic products (AGDP) is 38.59%
(Ibid). Nepal is rich in biodiversity in terms of plant and animal diversity and
cultural diversity occupying 0.1% of the global area (MoAD, 2016). The country
has 118 different types of ecosystems harboring 3.2% of the world’s flora that
includes 5.1% of gymnosperms and 8.2% of bryophytes (Ibid). Agricultural
Plant Genetic Resources (APGRs) are mainly meant for food and nutritional
security. The remote settlement of communities, harsh terrains, inequity in
Nepalese Journal of Agricultural Sciences, 2021, volume 21 ISSN 2091-042X; eISSN 2091-0428
240
income generation have left millions of Nepalese people experiencing some
level of food insecurity residing both in urban and rural settings.
Generally the neglected and underutilized species (NUS) are the crops, which
are of secondary priority in terms of cultivation, research and development, but
have important role in sustaining farming system, nutrition/ food security, and
livelihoods of the local communities. Wild edible plants (WEPs) also have been
playing important role in sustaining livelihoods and food / nutrition security of
the people residing in rural settings particularly in the least developed countries
like Nepal. The WEPs are the plants that grow spontaneously in self-maintaining
populations in natural ecosystems and can exist independently of direct human
action (FAO, 1999). Most of these plants are important locally or regionally
only; and are known as “minor”, ”neglected”, ”underexploited” and “orphan”
species or “underutilized crops” or “undervalued” crops, ”poor people’s crops”
or “third order crops”. WEPs are also a kind of NUS crops. Hence, neglected
and underutilized species (NUS) are any indigenous species, which have food,
nutritional and cultural values but given zero or less attention by the researchers,
extension and development organizations, policy makers. However, these plants
are often ignored in the process of biodiversity conservation and economic
development. Many underutilized, neglected and wild species are nutritionally
rich (Thies, 2000). These species hold great genetic diversity, and vast heritage
of indigenous knowledge is linked is linked to these species (Frison et al., 2000).
In addition, they are locally adapted to marginal land and constitute an important
part of the local diet, providing valuable nutritional elements (eg protein,
vitamins and minerals) and spices, often lacking in staple crops (IAEA, 2004).
It is now time to make use of the the wealth of knowledge accumulated on NUS
so that we can develop more sustainable, nutrition-dense, climate-resilient and
diversified food systems to address hunger and malnutrition at local and regional
levels (FAO, 2018). The total number of agro- / horticultural crops found in
Nepal is roughly estimated to be about 400 as species and sub-species (Regmi,
1990). About 107 indigenous fruit and nut species have been reported in Nepal
(Adhikari, L., Hussain, A., Rasul, G., 2017). Forty-five species from thirty seven
genera are reported as wild edible fruits (Atreya and Shrestha, 2020). About
twenty five fruits are grown in commercial scale; and those fruits are eaten as
fresh, pickled and preserved in various forms. Due to high level of climatic
variation in Nepal, a total of 1506 species of agricultural plant genetic resources
(APGRs) have been reported (Joshi et al., 2019). Out of these APGRs, 93 are
introduced species, 670 are wild edible plants, 224 are crop wild relatives, 35 are
semi-domesticated and 484 cultivated crop species. Among 484 cultivated
species, 64 spp are agronomic, 145 spp are horticultural and 275 spp are foreage
species (Joshi et al., 2019). According to Khan (1997), a total of 694 species of
flora have been identified, close to 10% of the 7000 vascular plants of Nepal.
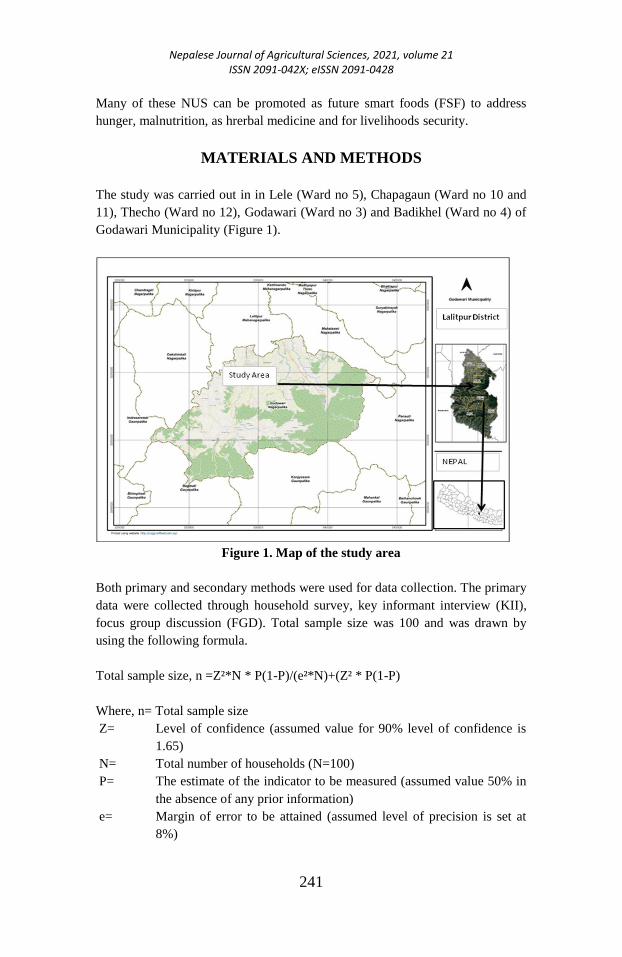
Nepalese Journal of Agricultural Sciences, 2021, volume 21 ISSN 2091-042X; eISSN 2091-0428
241
Many of these NUS can be promoted as future smart foods (FSF) to address
hunger, malnutrition, as hrerbal medicine and for livelihoods security.
MATERIALS AND METHODS
The study was carried out in in Lele (Ward no 5), Chapagaun (Ward no 10 and
11), Thecho (Ward no 12), Godawari (Ward no 3) and Badikhel (Ward no 4) of
Godawari Municipality (Figure 1).
Figure 1. Map of the study area
Both primary and secondary methods were used for data collection. The primary
data were collected through household survey, key informant interview (KII),
focus group discussion (FGD). Total sample size was 100 and was drawn by
using the following formula.
Total sample size, n =Z²*N * P(1-P)/(e²*N)+(Z² * P(1-P)
Where, n= Total sample size
Z= Level of confidence (assumed value for 90% level of confidence is
1.65)
N= Total number of households (N=100)
P= The estimate of the indicator to be measured (assumed value 50% in
the absence of any prior information)
e= Margin of error to be attained (assumed level of precision is set at
8%)
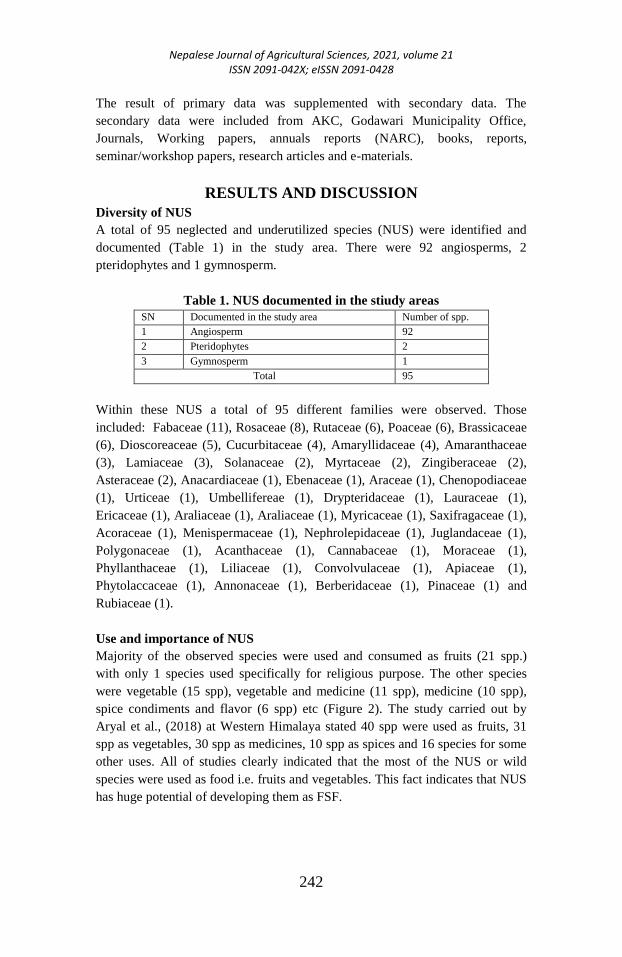
Nepalese Journal of Agricultural Sciences, 2021, volume 21 ISSN 2091-042X; eISSN 2091-0428
242
The result of primary data was supplemented with secondary data. The
secondary data were included from AKC, Godawari Municipality Office,
Journals, Working papers, annuals reports (NARC), books, reports,
seminar/workshop papers, research articles and e-materials.
RESULTS AND DISCUSSION
Diversity of NUS
A total of 95 neglected and underutilized species (NUS) were identified and
documented (Table 1) in the study area. There were 92 angiosperms, 2
pteridophytes and 1 gymnosperm.
Table 1. NUS documented in the stiudy areas
SN Documented in the study area Number of spp.
1 Angiosperm 92
2 Pteridophytes 2
3 Gymnosperm 1
Total 95
Within these NUS a total of 95 different families were observed. Those
included: Fabaceae (11), Rosaceae (8), Rutaceae (6), Poaceae (6), Brassicaceae
(6), Dioscoreaceae (5), Cucurbitaceae (4), Amaryllidaceae (4), Amaranthaceae
(3), Lamiaceae (3), Solanaceae (2), Myrtaceae (2), Zingiberaceae (2),
Asteraceae (2), Anacardiaceae (1), Ebenaceae (1), Araceae (1), Chenopodiaceae
(1), Urticeae (1), Umbellifereae (1), Drypteridaceae (1), Lauraceae (1),
Ericaceae (1), Araliaceae (1), Araliaceae (1), Myricaceae (1), Saxifragaceae (1),
Acoraceae (1), Menispermaceae (1), Nephrolepidaceae (1), Juglandaceae (1),
Polygonaceae (1), Acanthaceae (1), Cannabaceae (1), Moraceae (1),
Phyllanthaceae (1), Liliaceae (1), Convolvulaceae (1), Apiaceae (1),
Phytolaccaceae (1), Annonaceae (1), Berberidaceae (1), Pinaceae (1) and
Rubiaceae (1).
Use and importance of NUS
Majority of the observed species were used and consumed as fruits (21 spp.)
with only 1 species used specifically for religious purpose. The other species
were vegetable (15 spp), vegetable and medicine (11 spp), medicine (10 spp),
spice condiments and flavor (6 spp) etc (Figure 2). The study carried out by
Aryal et al., (2018) at Western Himalaya stated 40 spp were used as fruits, 31
spp as vegetables, 30 spp as medicines, 10 spp as spices and 16 species for some
other uses. All of studies clearly indicated that the most of the NUS or wild
species were used as food i.e. fruits and vegetables. This fact indicates that NUS
has huge potential of developing them as FSF.
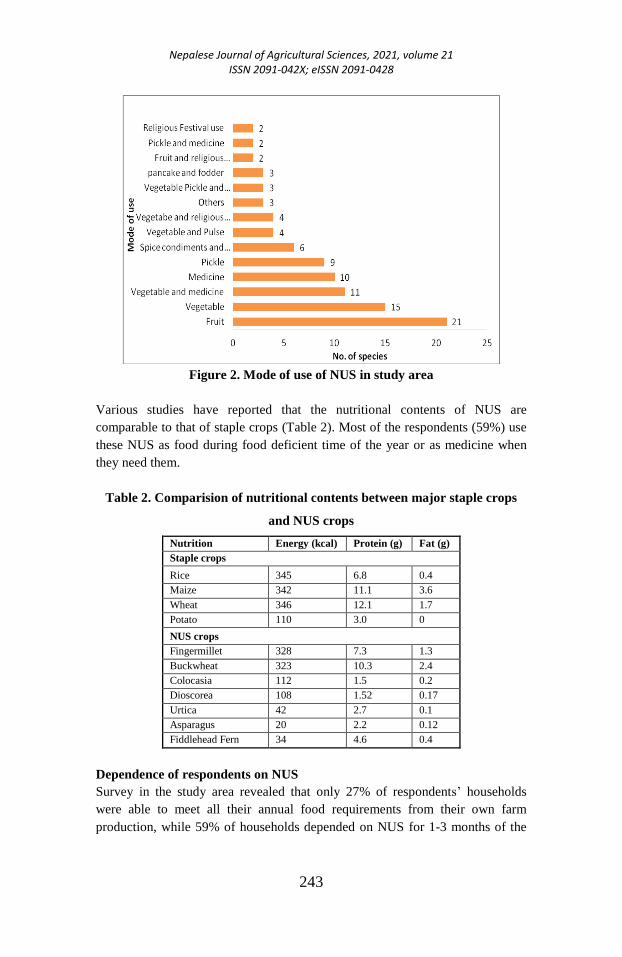
Nepalese Journal of Agricultural Sciences, 2021, volume 21 ISSN 2091-042X; eISSN 2091-0428
243
Figure 2. Mode of use of NUS in study area
Various studies have reported that the nutritional contents of NUS are
comparable to that of staple crops (Table 2). Most of the respondents (59%) use
these NUS as food during food deficient time of the year or as medicine when
they need them.
Table 2. Comparision of nutritional contents between major staple crops
and NUS crops
Nutrition Energy (kcal) Protein (g) Fat (g)
Staple crops
Rice 345 6.8 0.4
Maize 342 11.1 3.6
Wheat 346 12.1 1.7
Potato 110 3.0 0
NUS crops
Fingermillet 328 7.3 1.3
Buckwheat 323 10.3 2.4
Colocasia 112 1.5 0.2
Dioscorea 108 1.52 0.17
Urtica 42 2.7 0.1
Asparagus 20 2.2 0.12
Fiddlehead Fern 34 4.6 0.4
Dependence of respondents on NUS
Survey in the study area revealed that only 27% of respondents’ households
were able to meet all their annual food requirements from their own farm
production, while 59% of households depended on NUS for 1-3 months of the
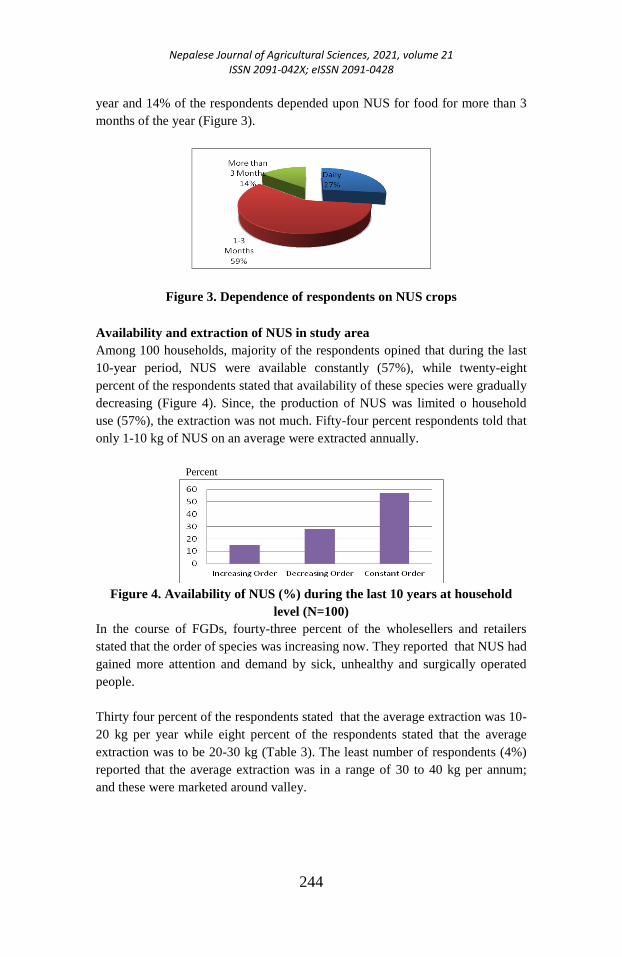
Nepalese Journal of Agricultural Sciences, 2021, volume 21 ISSN 2091-042X; eISSN 2091-0428
244
year and 14% of the respondents depended upon NUS for food for more than 3
months of the year (Figure 3).
Figure 3. Dependence of respondents on NUS crops
Availability and extraction of NUS in study area
Among 100 households, majority of the respondents opined that during the last
10-year period, NUS were available constantly (57%), while twenty-eight
percent of the respondents stated that availability of these species were gradually
decreasing (Figure 4). Since, the production of NUS was limited o household
use (57%), the extraction was not much. Fifty-four percent respondents told that
only 1-10 kg of NUS on an average were extracted annually.
Percent
Figure 4. Availability of NUS (%) during the last 10 years at household
level (N=100)
In the course of FGDs, fourty-three percent of the wholesellers and retailers
stated that the order of species was increasing now. They reported that NUS had
gained more attention and demand by sick, unhealthy and surgically operated
people.
Thirty four percent of the respondents stated that the average extraction was 10-
20 kg per year while eight percent of the respondents stated that the average
extraction was to be 20-30 kg (Table 3). The least number of respondents (4%)
reported that the average extraction was in a range of 30 to 40 kg per annum;
and these were marketed around valley.
Nepalese Journal of Agricultural Sciences, 2021, volume 21 ISSN 2091-042X; eISSN 2091-0428
245
Developing NUS at commercial scale
There is urgent need to carry out all type of promotional activities by different
governmental and non-governmental organizations for required attention and
awareness according to 33 percent of the respondents.
Table 3. Percentage distribution of responents by volume of extraction
(N=100)
Extraction of NUS per year
(Kg)
% of respondents
10-20 34.00
21-30 8.00
31-40 4.00
In the coiurse of FGDs, twenty five percent of the households in the study area
told that there should be strong implementing policies regarding the use,
development and commercialization of NUS. Fifteen percent of the respondents
opined in favour of fixed price allocation to NUS species so that they can have
clear idea about which crop can give them good monetory return and to plan and
work accordingly to cultivate them. Fourteen percent of the respondents
emphasized to have more research to explore all the diversity, importance and
usage of NUS crops/ plants.
CONCLUSION
The study revealed that the diversity of NUS was highly rich in Godawari
municipality. NUS species weren’t produced commercially in the study area.
The species were limited up to household level use; and were thus grown
traditionally. NUS were used and consumed as fruits, vegetables, spices, pickle,
and medicine revealing its huge potential for being developed or promoted as
FSF. The diversity of NUS available in the study area exhibited huge potential
to address malnutrition, health problems and livelihoods in the study area.
REFERENCES Adhikari, L., Hussain, A., Rasul, G., (2017) Tapping the Potential of Neglected and Underutilized
Food Crops for Sustainable Nutrition Security in the Mountains of Pakistan and Nepal.
International Centre for Integrated Mountain Development (ICIMOD), Kathmandu
44600, Nepal. Sustainability, 9(2), 291. DOI: https://doi.org/10.3390/su9020291
Aryal, K.P., Poudel, S., Chaudhary, R.P., Chettri, N., Chaudhary, P., Ning, W. & Kotru, R. (2018)
Diversity and use of wild and non-cultivated edible plants in the Western Himalaya,
Journal of Ethnobiology and Ethnomedicine volume 14, Article number: 10.
Atreya, P.N., Shrestha, J., (2020) Biodiversity of neglected and underutilized fruits of Nepal: a
review, Fundamental and Applied Agriculture 5 (4).
DOI: 470-483. doi:10.5455/faa.122860
FAO (2018) Future smart food: Rediscovering hidden treasures of neglected and underutilized
species for Zero Hunger in Asia, Food and Agriculture Organization of the United
Nations Bangkok, 36 pp.
IPGRI, (2002) Neglected and Underutilized Plant Species: Strategic Action Plan of the International
Plant Genetic Resources Institute. Rome, Italy
Nepalese Journal of Agricultural Sciences, 2021, volume 21 ISSN 2091-042X; eISSN 2091-0428
246
Joshi, B.K., Shrestha, R., Gauchan, D., Shrestha, A., (2019) Neglected, underutilized, and future
smart crop species in Nepal, Journal of Crop Improvement, Online first paper (26 DEC
2019). ISSN: 1542-7528 DOI: https://doi.org/10.1080/15427528.2019.1703230
Khan, M., (1997) Documentation of indigenous knowledge in the Chepang community of
Shaktikhor VDC, Chitwan, In: Ethnobotany for conservation and community
development, (eds) K Shrestha, P Jha, P Sheingji, A Rastogi, S Rajbhandari, and M
Joshi, Proceedings of the training workshop in Nepal, 6-13 January, Ethnobotanical
Society of Nepal and ICIMOD, Kathmandu, pp. 96-101
MoAD (2016) Statistics of Nepalese agriculture, Ministry of Agriculture & Livestock Development,
Kathmandu
Poudel, D, et al. (2018) Food and nutritional security status: assessment among landless people in
Chitwan, Nepal. International Journal of Applied Science and Biotechnology, 6(4): 351-
358; DOI: 10.3126/ijasbt.v6i4.21254
Thies, E. (2009) Promising and Underutilized Species Crops and Breeds, GTZ, Managing
Agrobiodiversity in Rural Areas Department Rural Development, Eschborn, Germany
Nepalese Journal of Agricultural Sciences, 2021, volume 21 ISSN 2091-042X; eISSN 2091-0428
247
A comparative study of helminth
parasites of backyard poultry in Dang, Nepal
Arjun Pandit¹and Kapil Bhusal²
¹Department of Theriogenology, HICAST, Kirtipur, Kathmandu
²Himalayan College of Agricultural Sciences and Technology (HICAST)
Corresponding Author: [email protected]
ABSTRACT
Helminth infestation causes direct losses due to drop in
production and motality of chicken and indirect economic
losses due to increased cost of production. An explorative
study was carried out during May 2021 at Tulsipur sub-
metropolitan city, Ghorahi sub-metropolitan, Babai village
municipality, Santinagar village municipality and Dangisaran
village municipality of Dang District to determine the
prevalence of helminth parasites in backyard poultry. A total
of 100 faecal samples were collected randomly and all
samples were examined by standard sedimentation and
flotation methods in the Laboratory of Parasitology, HICAST,
Kritipur. The prevalence of helminth parasite was found to be
42%. There was higher prevalence of helminths parasites in
poultry without deworming (49%, 39/80) compare to the
samples from dewormed poultry (15%, 3/20). Four species of
gastro-intestinal parasite found were Heterakis gallinae
(64.28%), Ascaridia gali (7.14%), Strongyloides ovium
(4.76%), Capillaria spp. (23.80%). Prevalence of helminth
parasite of backyard poultry with deworming and without
deworming was found to be 15% and 49% respectively. There
is significant association between the prevalence of helminth
parasite and not-deworming (p = 0.006234, p<0.05).
Key word: Gastro-intestinal parasites, prevalence, Heterakis gallinae,
Ascaridia gali, Strongyloides ovium, Capillaria spp,
INTRODUCTION
Contribution of agriculture to the gross domestic product (GDP) of Nepal is
estimated at around 27.1 percent, of which, the livestock sector contributes
about 11.5 percent and the poultry sector independently contributes to about
4 % of the national GDP (Poudel, et al., 2020).
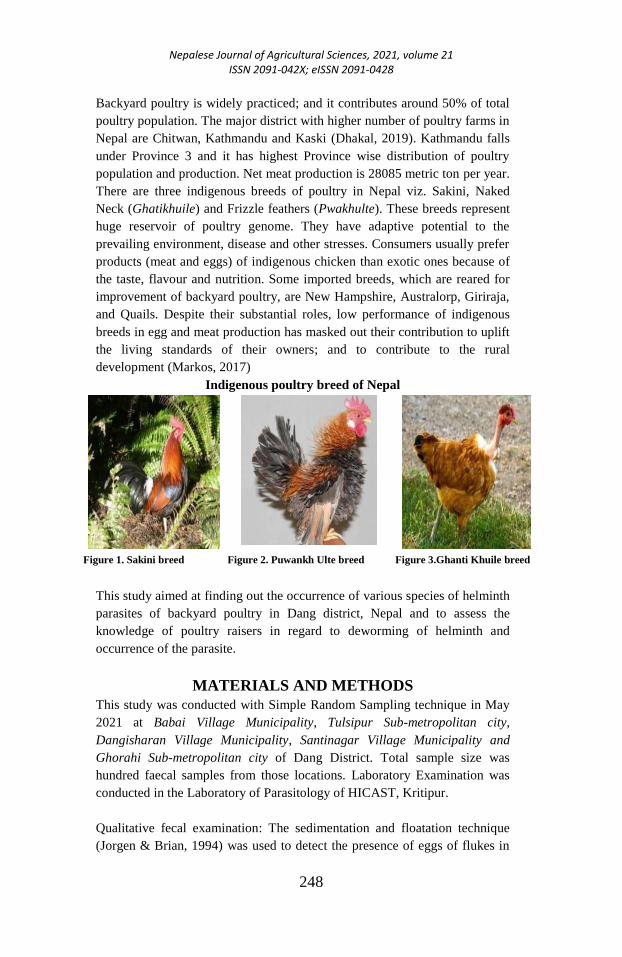
Nepalese Journal of Agricultural Sciences, 2021, volume 21 ISSN 2091-042X; eISSN 2091-0428
248
Backyard poultry is widely practiced; and it contributes around 50% of total
poultry population. The major district with higher number of poultry farms in
Nepal are Chitwan, Kathmandu and Kaski (Dhakal, 2019). Kathmandu falls
under Province 3 and it has highest Province wise distribution of poultry
population and production. Net meat production is 28085 metric ton per year.
There are three indigenous breeds of poultry in Nepal viz. Sakini, Naked
Neck (Ghatikhuile) and Frizzle feathers (Pwakhulte). These breeds represent
huge reservoir of poultry genome. They have adaptive potential to the
prevailing environment, disease and other stresses. Consumers usually prefer
products (meat and eggs) of indigenous chicken than exotic ones because of
the taste, flavour and nutrition. Some imported breeds, which are reared for
improvement of backyard poultry, are New Hampshire, Australorp, Giriraja,
and Quails. Despite their substantial roles, low performance of indigenous
breeds in egg and meat production has masked out their contribution to uplift
the living standards of their owners; and to contribute to the rural
development (Markos, 2017)
Indigenous poultry breed of Nepal
Figure 1. Sakini breed Figure 2. Puwankh Ulte breed Figure 3.Ghanti Khuile breed
This study aimed at finding out the occurrence of various species of helminth
parasites of backyard poultry in Dang district, Nepal and to assess the
knowledge of poultry raisers in regard to deworming of helminth and
occurrence of the parasite.
MATERIALS AND METHODS
This study was conducted with Simple Random Sampling technique in May
2021 at Babai Village Municipality, Tulsipur Sub-metropolitan city,
Dangisharan Village Municipality, Santinagar Village Municipality and
Ghorahi Sub-metropolitan city of Dang District. Total sample size was
hundred faecal samples from those locations. Laboratory Examination was
conducted in the Laboratory of Parasitology of HICAST, Kritipur.
Qualitative fecal examination: The sedimentation and floatation technique
(Jorgen & Brian, 1994) was used to detect the presence of eggs of flukes in
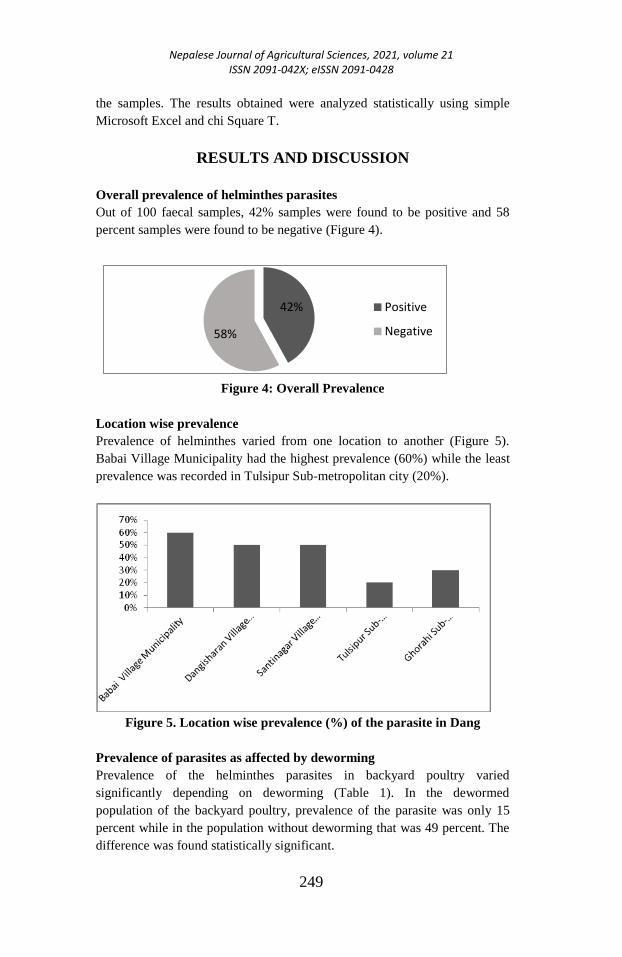
Nepalese Journal of Agricultural Sciences, 2021, volume 21 ISSN 2091-042X; eISSN 2091-0428
249
42%
58%
Positive
Negative
the samples. The results obtained were analyzed statistically using simple
Microsoft Excel and chi Square T.
RESULTS AND DISCUSSION
Overall prevalence of helminthes parasites
Out of 100 faecal samples, 42% samples were found to be positive and 58
percent samples were found to be negative (Figure 4).
Figure 4: Overall Prevalence
Location wise prevalence
Prevalence of helminthes varied from one location to another (Figure 5).
Babai Village Municipality had the highest prevalence (60%) while the least
prevalence was recorded in Tulsipur Sub-metropolitan city (20%).
Figure 5. Location wise prevalence (%) of the parasite in Dang
Prevalence of parasites as affected by deworming
Prevalence of the helminthes parasites in backyard poultry varied
significantly depending on deworming (Table 1). In the dewormed
population of the backyard poultry, prevalence of the parasite was only 15
percent while in the population without deworming that was 49 percent. The
difference was found statistically significant.

Nepalese Journal of Agricultural Sciences, 2021, volume 21 ISSN 2091-042X; eISSN 2091-0428
250
Table 1. Prevalence of parasites as affected by deworming
Comparative prevalence of helminthes parasites
Four species of gastro-intestinal parasites found in the study were as shown in
Table 2: Heterakis gallinae (64.28%), Capillaria spp. (23.80%), Ascaridia gali
(7.14%), and Strongyloides ovium (4.76%).
Table 2. Comparative prevalence of different spp of helminthes parasites
SN Species of the
parasite
Positive sample Negative sample Percentage of
positive Sample
1 Heterakis gallinae 27 73 64.28
2 Ascaridia galli 3 97 7.14
3 Strongyloides ovium 2 98 4.76
4 Capillaria spp. 10 90 23.80
The prevalence of helminthes parasites of backyard poultry in Dang District
(42%) identified in this study was found to be slightly higher than the
prevalence of helminthes parasites of poultry in Kritipur (40%) as reported by
(Subedi, et al., 2014). But it was lower than the prevalence of gastrointestinal
parasites in Backyard Poultry in terai region (94.83%) reported by Khanal, et al.,
(2015). That might be due to geo-ecological alteration and different
management practices.
CONCLUSION
This study revealed 42% prevalence of helminth parasites of backyard poultry in
Dang District. There was higher prevalence of helminths parasites in poultry
without deworming (49%) as compared to the samples from dewormed poultry
population (15%).
SUGGESTIONS
Appropriate deworming schedule should be arranged to lower the level of
infections in the backyard poultry. Various trainings and awareness programs
relating to management, deworming schedule of poultry farming should be
provided to farmers.
REFERENCES CBS, (2018) Statistical book of the year of 2018, Central Bureau of Statistics, Kathmandu,
Government of Nepal
Dhakal, M., (2019) Contribution of Poultry Farming to Livelihood of Rural
Families in Nepal. Asian Journal of Agricultural Extention,Economics & sociology, 4(1-
8),30.
Jorgen, H. & Brian, P., (1994) The epidemiology, diagnosis and control of
helminth parasites of ruminants. Nairobi, Kenya: International Laboratory for Research
on Animal Diseases.
Faecal samples (N=100) Positive Negative Total
Dewormed 3 17 20
Not Dewormed 39 41 80
Total 42 58 100
Nepalese Journal of Agricultural Sciences, 2021, volume 21 ISSN 2091-042X; eISSN 2091-0428
251
Kassai, T., (1999) Veterinary Helminthology. 3rd ed. s.l.:Elsevier Health Sciences.
Kathleen, M. L. (1979) The biology of helminth parasites, The Institute of Biology's studies in
biology; no. 102. University Park Press (1979)
Khanal, T., Regmi, B. B. & Raut, S. B., (2015) Strointestinal Parasites in Backyard Poultry at Three
Ecological Region salong Gandaki River Basin, Nepal, s.l.: Utah State University.
Markos, S. B. A., (2017) Evaluation of Egg Quality Traits of Three indiginenous Chicken Ecotypes.
International of poultry science, 16(5).
Poudel, U. et al., (2020) Livestock and Poultry Production in Nepal Current
Status of Vaccine Development, s.l.: s.n.
Soulsby, E.J.L. (1976) Helminthes, Arthropods and Protozoa of Domesticated Animals, 6th ed, The
English Language Book Society and Baillere, Tindall and Cassell Ltd., pp.22-35.
Shukla, S. & Mishra, P., (2013) Gastro Intestinal Helminths Parasites of Local Chickens Samples
fromTribal Areas of Madhya Pradesh. India. Int. J.of Life Sciences, 1,284-287.
Subedi, J. R., Mujahid, T. & Cheetri, B., (2014) Prevalence of Intestinal Helminth Parasite of
Chicken in Lalitpur District, Nepal, Lalitpur: s.n.

Nepalese Journal of Agricultural Sciences, 2021, volume 21 ISSN 2091-042X; eISSN 2091-0428
252
REVIEW ARTICLES
Biochar as an efficient soil enhancer to improve soil
fertility and crop productivity in Nepal
N.R. Pandit1*
, S. Dahal2, S. Shrestha
3, S.P. Vista
3, D.K. Gautam
1
1Nepal Agroforestry Foundation (NAF)
2 Himalayan College of Agricultural Sciences and Technology (HICAST) 3 National Soil Science Research Center (NSSRC), NARC, Khumaltar
4Grain Legumes Research Program (GLRP), NARC
Corresponding author: [email protected]
ABSTRACT Biochar application in agricultural soil has shown potential
agronomic and environmental benefits through improved soil
fertility, crop productivity and carbon sequestration. In this study,
research work conducted by various organizations, universities and
researcher in Nepal were assessed to identify the potential of biochar
on improving soil fertility and crop productivity. In most of the
studies, biochar was produced from an invasive weed “Eupatorium
species” using novel flame curtain soil pit Kon-Tiki kiln, which is
easy to operate, fast and is economically and environmentally viable
(low emission of pyrolysis gases). Biochar amendment showed
significant improvement on soil physicochemical properties such as
bulk density, water holding capacity, pH, organic carbon, cation
exchange capacity (CEC), exchangeable bases (Ca+, Mg+, K+) and
available nutrients viz. total nitrogen (N), phosphorous (P) and
potassium (K). Similarly, biochar application increased crop
productivity, which was positively correlated with improved soil
chemical properties and available nutrients such as P and K.
Moreover, strong yield effect of biochar was observed when biochar
was pretreated or enriched with organic (urine) or mineral fertilizers
compared with the biochar that was added separately receiving the
same dose of organic and inorganic fertilizers in soil. Research
findings suggested that biochar could be one of the sustainable
approaches to improve farm productivity per unit of land, which
could play significant role in mitigating long term food insecurity
issues of the country. Thus, further research on biochar in
agriculture sector and upscaling through extension activities along
with appropriate policy dialogue is recommended for the wider
adoption of biochar by farmers in Nepal.
Key words: Biochar, nutrient enriched biochar, soil properties, crop production, Nepal
Nepalese Journal of Agricultural Sciences, 2021, volume 21 ISSN 2091-042X; eISSN 2091-0428
253
INTRODUCTION
Biochar, a carbon-rich material is produced by the pyrolysis of organic materials
i.e. heating biomass in the absence of oxygen (Lehmann et al., 2009). Biochar is
widely used as a soil amendment to cater two global challenges i.e. sustainable
improvement of soil fertility and combat ongoing climate change (Chan et al.,
2008). Several studies have confirmed improved soil physicochemical upon
biochar addition in a low productive soil such as texture, water holding capacity,
bulk density, pH, organic carbon (OC), cation exchange capacity (CEC),
exchangeable bases (Ca2+
, Mg2+
, K+) and available nutrients (nitrogen,
phosphorous and potassium) (Chan et al., 2008; Cornelissen et al., 2013; Kandel
et al., 2021; Martinsen et al., 2014; Yamato et al., 2006). Furthermore, biochar
addition has shown considerable beneficial effect on soil biological properties
such as enhanced colonization of arbuscular mycorrhizal fungi, which in turn,
make more nutrients available to the plant (Atkinson et al., 2010; Upadhyay,
2015; Yamato et al., 2006). In addition to soil fertility improvement, biochar
with its highly recalcitrant nature (inert) can remain stable in soil for several
years, thus, act as an efficient soil carbon sequestration technique to mitigate
ongoing global warming issues (Chan et al., 2008; Lehmann et al., 2006; Woolf
et al., 2010).
Several studies are well documented where the application of biochar in
combination with mineral or organic nutrients have shown promising effect on
improving crop productivity (Chan et al., 2008; Cornelissen et al., 2018, 2013;
Martinsen et al., 2014; Yamato et al., 2006). However, in some studies, biochar
amendment has shown no response or even negative crop productivity (Chan et
al., 2008), mainly in a temperate soil with neutral pH and high fertility level
(higher CEC, OC and available nutrients) (Gaskin et al., 2010; Jeffery et al.,
2011; Liu et al., 2013) (Jeffery et al., 2011; Liu et al., 2013). Positive yield
effect of biochar amendment was mainly observed in tropical, acidic and highly
weathered soils (Jeffery et al., 2017). Furthermore, biochar charged with nutrient
before applying in soil such as urine enriched biochar or co-composted biochar
has shown positive yield effect even in less degraded and temperate soils where
nutrient limitation were mainly the major crop limiting factors (Kammann et al.,
2015; Pandit et al., 2019; Schmidt et al., 2015). However, the exact mechanism
of biochar on improving crop productivity, nutrient cycling and nutrient use
efficiency (NUE) is poorly understood (Cornelissen et al., 2018; Qiao-Hong et
al., 2014).
In Nepal, majority of the soils are acidic in nature with low fertility status,
having low to medium amount of organic carbon, total nitrogen, available
phosphorous, potassium and other exchangeable bases (Bajracharya and
Sherchan, 2009; Brown et al., 1999). Reduced soil fertility and nutrient stresses
Nepalese Journal of Agricultural Sciences, 2021, volume 21 ISSN 2091-042X; eISSN 2091-0428
254
are one of the main reasons leading to lower crop production. Thus, it is critical
to identify the efficient soil fertility management approaches to improve farm
productivity per unit of land. One of the sustainable approaches could be the use
of biochar, which has shown improved crop productivity by enhancing soil
fertility status and alleviating nutrient stress in a low fertile nutrient deficit
acidic soil (Dahal and Bajracharya, 2013; Pandit et al., 2018a). Research study
conducted by various organizations and universities such as Asian Development
Bank (ADB) in collaboration with NARC and NAST, Nepal Agroforestry
Foundation (NAF) in partnership with Norwegian Geotechnical Institute (NGI),
Ithaka Institute, Kathmandu University etc. has reported positive agronomic
effect of biochar application, which could eventually help in mitigating the
current soil fertility challenges in Nepal (Dahal et al. 2016). In this paper,
research findings from these and other various institutions (articles, newsletters
and reports) were reviewed on different aspect of biochar, highlighting mainly
on the potential of biochar for improving soil fertility and crop productivity in
the context of Nepal.
BIOCHAR PRODUCTION AND CHARACTERIZATION
Biochar production
Various organic feedstocks (maize cobs, rice husk, woods, weeds, animal
residue etc.) and pyrolysis technologies (slow and fast pyrolysis) can be used to
produce biochar (Cornelissen et al., 2016). In Nepal, most of the studies have
used “Eupatorium adenophorum” locally named “banmara” as a feedstock
using slow pyrolysis temperature (350 - 500 0C) to produce biochar (Cornelissen
et al., 2016; Pandit et al., 2017; Schmidt et al., 2015; Shrestha and Pandit, 2017;
Upadhyay et al., 2020). Eupatorium is considered as one of the potential
feedstock as it is naturally regenerating, ubiquitous and invasive species
threatening biodiversity and livelihood (Kunwar, 2003). In the study conducted
by Pandit et al. (2017), biochar was produced from different type of kilns (small
to medium size kiln) that might be suitable in the context of Nepal; flame curtain
“Kon-Tiki” kiln (three sub types: deep-cone metal kiln, steel-shielded soil pit,
conical soil pit), brick-made traditional kilns, larger top lit up draft (TLUD)
stove and traditional earth-mound kilns (Figure 1). Biochar can also be produced
using small cookstove as shown in figure 1.(h) (Dahal and Bajracharya, 2013).
Each of the above-mentioned kiln may have both pros and cons impact on socio-
economic and environmental indicators. Traditional kiln can be operated using
different type of mixed feedstocks, however, will result in higher emission of
pyrolysis gases or green-house gases (GHG’s) such as methane (CH4), carbon
monoxide (CO) and aerosols (PM 2.5 and PM 10). Use of larger TLUD can
produce good quality biochar but is costly and require technical expertise to
operate whereas the use of small cook stove on the other hand can produce very
little biochar, suitable only for kitchen gardening. Among all, novel flame

Nepalese Journal of Agricultural Sciences, 2021, volume 21 ISSN 2091-042X; eISSN 2091-0428
255
curtain Kon-Tiki, originally developed by Schmidt and Taylor. (2014), was
found most feasible in the context of Nepal as it is easy to operate, economical,
fast, and result in lower GHG’s emission producing around 700 L biochar in one
run within 4-5 hours (Cornelissen et al., 2016). Moreover, flame curtain Kon-
Tiki can be operated without any cost by simply making conically shaped hole
in the ground (Figure 1.d), which has shown similar scale of GHGs emission
and biochar quality as produced from metal Kon-Tiki kilns (Cornelissen et al.,
2016; Schmidt et al., 2015).
Figure 1. Biochar production technologies using different types of flame curtain
Kon-Tiki (a -d), traditional brick kiln (e), large TLUD (f and g) and small stoves
(h) (Dahal and Bajracharya, 2013) and traditional earth mound kiln in Nepal
(Cornelissen et al., 2016; Pandit et al., 2017)
Biochar properties
Biochar has heterogenous properties that may vary based on the type of
feedstocks and pyrolysis conditions, which in turn, effect soil fertility and crop
productivity (Butnan et al., 2015; Downie and Van Zwieten, 2013; Nguyen et
al., 2004). Slow pyrolysis temperature ranging from 300–500°C produced higher
biochar yield and carbon content compared with fast pyrolysis temperature
(>500°C), which produced lower biochar yield and carbon content and higher
surface area (Manyà, 2012). Average biochar yields using Eupatorium feedstock
on dry weight and carbon basis were 20 % and 40 % respectively (Cornelissen et
al., 2016).
Biochar was alkaline in nature (pH ranging from 9.6 to 10.7) and contains
higher amount of organic carbon (63 to 84%), CEC (83 to 217 cmolc kg-1
),
exchangeable bases (Ca2+
, Mg2+
and K+) and surface area (35 to 215 m
2 g
-1)
(Table 1). Electrical conductivity (EC) of biochar ranges from 3300 to 9090
μS cm−1
with the use of different feedstocks using Kon-Tiki kilns (Table 1).
Polyaromatic hydrocarbons (PAH) in Eupatorium biochar ranged from 1.9 to 4.9
mg kg-1
, which was within the threshold level required to meet the premium
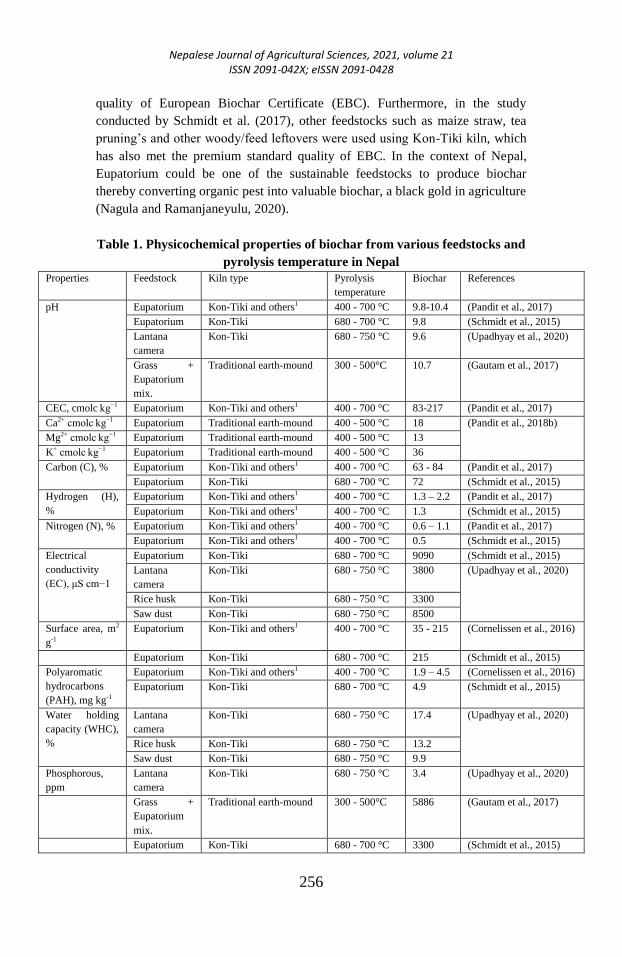
Nepalese Journal of Agricultural Sciences, 2021, volume 21 ISSN 2091-042X; eISSN 2091-0428
256
quality of European Biochar Certificate (EBC). Furthermore, in the study
conducted by Schmidt et al. (2017), other feedstocks such as maize straw, tea
pruning’s and other woody/feed leftovers were used using Kon-Tiki kiln, which
has also met the premium standard quality of EBC. In the context of Nepal,
Eupatorium could be one of the sustainable feedstocks to produce biochar
thereby converting organic pest into valuable biochar, a black gold in agriculture
(Nagula and Ramanjaneyulu, 2020).
Table 1. Physicochemical properties of biochar from various feedstocks and
pyrolysis temperature in Nepal
Properties Feedstock Kiln type Pyrolysis
temperature
Biochar References
pH Eupatorium Kon-Tiki and others1 400 - 700 °C 9.8-10.4 (Pandit et al., 2017)
Eupatorium Kon-Tiki 680 - 700 °C 9.8 (Schmidt et al., 2015)
Lantana
camera
Kon-Tiki 680 - 750 °C 9.6 (Upadhyay et al., 2020)
Grass +
Eupatorium
mix.
Traditional earth-mound 300 - 500°C 10.7 (Gautam et al., 2017)
CEC, cmolc kg−1 Eupatorium Kon-Tiki and others1 400 - 700 °C 83-217 (Pandit et al., 2017)
Ca2+ cmolc kg−1 Eupatorium Traditional earth-mound 400 - 500 °C 18 (Pandit et al., 2018b)
Mg2+ cmolc kg−1 Eupatorium Traditional earth-mound 400 - 500 °C 13
K+ cmolc kg−1 Eupatorium Traditional earth-mound 400 - 500 °C 36
Carbon (C), % Eupatorium Kon-Tiki and others1 400 - 700 °C 63 - 84 (Pandit et al., 2017)
Eupatorium Kon-Tiki 680 - 700 °C 72 (Schmidt et al., 2015)
Hydrogen (H),
%
Eupatorium Kon-Tiki and others1 400 - 700 °C 1.3 – 2.2 (Pandit et al., 2017)
Eupatorium Kon-Tiki and others1 400 - 700 °C 1.3 (Schmidt et al., 2015)
Nitrogen (N), % Eupatorium Kon-Tiki and others1 400 - 700 °C 0.6 – 1.1 (Pandit et al., 2017)
Eupatorium Kon-Tiki and others1 400 - 700 °C 0.5 (Schmidt et al., 2015)
Electrical
conductivity
(EC), μS cm−1
Eupatorium Kon-Tiki 680 - 700 °C 9090 (Schmidt et al., 2015)
Lantana
camera
Kon-Tiki 680 - 750 °C 3800 (Upadhyay et al., 2020)
Rice husk Kon-Tiki 680 - 750 °C 3300
Saw dust Kon-Tiki 680 - 750 °C 8500
Surface area, m2
g-1
Eupatorium Kon-Tiki and others1 400 - 700 °C 35 - 215 (Cornelissen et al., 2016)
Eupatorium Kon-Tiki 680 - 700 °C 215 (Schmidt et al., 2015)
Polyaromatic
hydrocarbons
(PAH), mg kg-1
Eupatorium Kon-Tiki and others1 400 - 700 °C 1.9 – 4.5 (Cornelissen et al., 2016)
Eupatorium Kon-Tiki 680 - 700 °C 4.9 (Schmidt et al., 2015)
Water holding
capacity (WHC),
%
Lantana
camera
Kon-Tiki 680 - 750 °C 17.4 (Upadhyay et al., 2020)
Rice husk Kon-Tiki 680 - 750 °C 13.2
Saw dust Kon-Tiki 680 - 750 °C 9.9
Phosphorous,
ppm
Lantana
camera
Kon-Tiki 680 - 750 °C 3.4 (Upadhyay et al., 2020)
Grass +
Eupatorium
mix.
Traditional earth-mound 300 - 500°C 5886 (Gautam et al., 2017)
Eupatorium Kon-Tiki 680 - 700 °C 3300 (Schmidt et al., 2015)
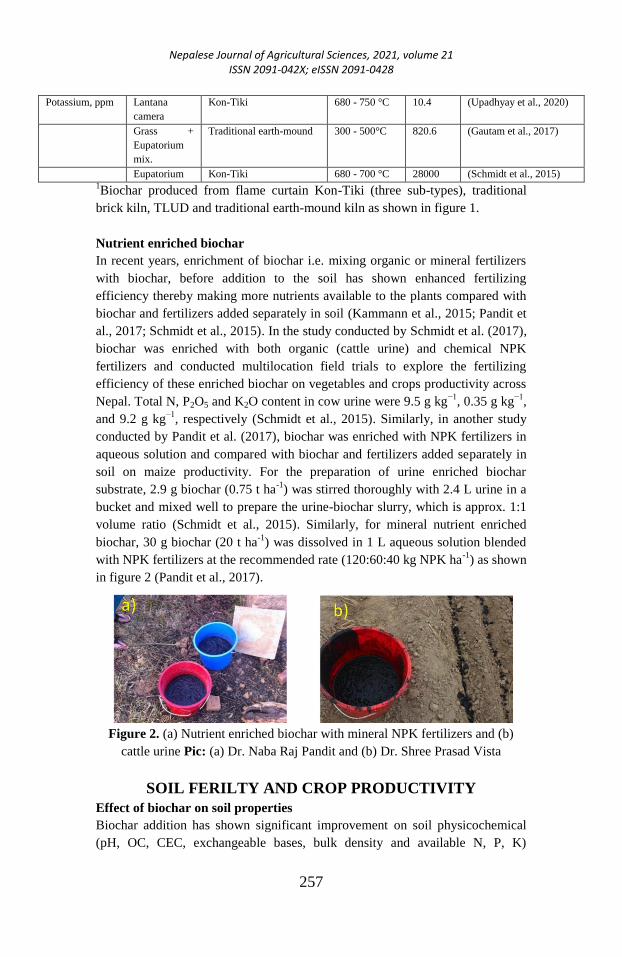
Nepalese Journal of Agricultural Sciences, 2021, volume 21 ISSN 2091-042X; eISSN 2091-0428
257
Potassium, ppm Lantana
camera
Kon-Tiki 680 - 750 °C 10.4 (Upadhyay et al., 2020)
Grass +
Eupatorium
mix.
Traditional earth-mound 300 - 500°C 820.6 (Gautam et al., 2017)
Eupatorium Kon-Tiki 680 - 700 °C 28000 (Schmidt et al., 2015) 1Biochar produced from flame curtain Kon-Tiki (three sub-types), traditional
brick kiln, TLUD and traditional earth-mound kiln as shown in figure 1.
Nutrient enriched biochar
In recent years, enrichment of biochar i.e. mixing organic or mineral fertilizers
with biochar, before addition to the soil has shown enhanced fertilizing
efficiency thereby making more nutrients available to the plants compared with
biochar and fertilizers added separately in soil (Kammann et al., 2015; Pandit et
al., 2017; Schmidt et al., 2015). In the study conducted by Schmidt et al. (2017),
biochar was enriched with both organic (cattle urine) and chemical NPK
fertilizers and conducted multilocation field trials to explore the fertilizing
efficiency of these enriched biochar on vegetables and crops productivity across
Nepal. Total N, P2O5 and K2O content in cow urine were 9.5 g kg−1
, 0.35 g kg−1
,
and 9.2 g kg−1
, respectively (Schmidt et al., 2015). Similarly, in another study
conducted by Pandit et al. (2017), biochar was enriched with NPK fertilizers in
aqueous solution and compared with biochar and fertilizers added separately in
soil on maize productivity. For the preparation of urine enriched biochar
substrate, 2.9 g biochar (0.75 t ha-1
) was stirred thoroughly with 2.4 L urine in a
bucket and mixed well to prepare the urine-biochar slurry, which is approx. 1:1
volume ratio (Schmidt et al., 2015). Similarly, for mineral nutrient enriched
biochar, 30 g biochar (20 t ha-1
) was dissolved in 1 L aqueous solution blended
with NPK fertilizers at the recommended rate (120:60:40 kg NPK ha-1
) as shown
in figure 2 (Pandit et al., 2017).
Figure 2. (a) Nutrient enriched biochar with mineral NPK fertilizers and (b)
cattle urine Pic: (a) Dr. Naba Raj Pandit and (b) Dr. Shree Prasad Vista
SOIL FERILTY AND CROP PRODUCTIVITY
Effect of biochar on soil properties
Biochar addition has shown significant improvement on soil physicochemical
(pH, OC, CEC, exchangeable bases, bulk density and available N, P, K)
Nepalese Journal of Agricultural Sciences, 2021, volume 21 ISSN 2091-042X; eISSN 2091-0428
258
(Gautam et al., 2017; Pandit et al., 2018b, 2017; Timilsina et al., 2017; Vista and
Khadka, 2017), and biological properties (increased colonization of mycorrhizal
fungi) in Nepalese soil (Upadhyay, 2015). Soil pH was significantly increased
by up to 21% (ranging from 6.9 to 21) upon biochar addition compared with
control (without biochar) in a moderately acidic soil. Furthermore, biochar
addition significantly reduced exchangeable Al3+
content in soil (0.8 to 0.2
cmolc kg-1
), which play significant role on improving soil pH in acidic soils
(Gruba et al., 2013). Absolute exchangeable Al3+
contents of the control soil (0.8
cmolc/kg) were within the range where toxic Al effects on plant roots can be
expected. Moreover, bulk density was found significantly lower upon biochar
addition (Timilsina et al., 2017). Soil OC was found significantly higher in
biochar amended soil, which was increased by up to 400% (ranging from 33 to
400) compared with control soil. Similarly, CEC and exchangeable bases were
found significantly higher upon biochar addition (Pandit et al., 2017). Improved
soil physicochemical properties upon biochar addition in Nepal is in line with
other studies reported in different parts of the world (Cornelissen et al., 2013;
Liang et al., 2006; Martinsen et al., 2014; Yamato et al., 2006).
Biochar amendment showed positive effect on soil nutrient status i.e. total
nitrogen, available P and K (Table 2). In the study, conducted by Pandit et al.
(2018b), total N content was increased from 0.12 to 1.42 % upon biochar
addition (15 t ha-1
). Similar increasing trend on soil total N upon biochar
addition was observed in other studies in Nepal (Timilsina et al., 2017; Vista
and Khadka, 2017). Similarly, biochar addition increased soil available P by
Table 2. Effect of biochar on soil physicochemical properties and nutrient
availability in Nepal
Soil Parameters Biochar rate (t
ha-1)
Control
(soil
without
biochar)
Biochar
amended
soils
% change References
pH 5 4.8 5.2 8.3 * (Gautam et al., 2017)
10 5.3 6.4 20.8 Dahal 2021(Thesis)
15 5.1 5.5 7.8 * (Pandit et al., 2018b)
20 7.2 7.7 6.9 * (Timilsina et al., 2017)
50 4.9 5.6 14.3 * (Vista and Khadka, 2017)
Organic carbon, % 5 1.2 3.5 191.7 * (Gautam et al., 2017)
10 0.8 4.0 400.2 * Dahal 2021(Thesis)
15 1.8 2.4 33.3 * (Pandit et al., 2018b)
20 0.7 1.7 142.9 * (Timilsina et al., 2017)
50 3.8 5.3 39.5 * (Vista and Khadka, 2017)
CEC, cmolc kg-1 5 17 22 29.4 ns (Gautam et al., 2017)
15 6.4 7.1 10.9 * (Pandit et al., 2018b)
Ca2+, cmolc kg-1 15 3.2 4.5 40.6 * (Pandit et al., 2018b)
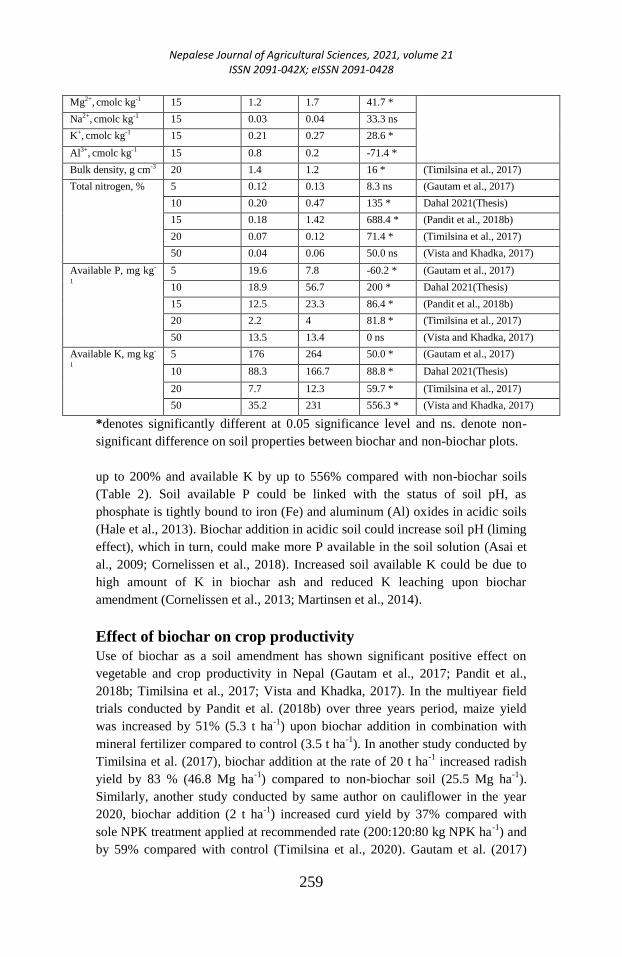
Nepalese Journal of Agricultural Sciences, 2021, volume 21 ISSN 2091-042X; eISSN 2091-0428
259
Mg2+, cmolc kg-1 15 1.2 1.7 41.7 *
Na2+, cmolc kg-1 15 0.03 0.04 33.3 ns
K+, cmolc kg-1 15 0.21 0.27 28.6 *
Al3+, cmolc kg-1 15 0.8 0.2 -71.4 *
Bulk density, g cm-3 20 1.4 1.2 16 * (Timilsina et al., 2017)
Total nitrogen, % 5 0.12 0.13 8.3 ns (Gautam et al., 2017)
10 0.20 0.47 135 * Dahal 2021(Thesis)
15 0.18 1.42 688.4 * (Pandit et al., 2018b)
20 0.07 0.12 71.4 * (Timilsina et al., 2017)
50 0.04 0.06 50.0 ns (Vista and Khadka, 2017)
Available P, mg kg-
1
5 19.6 7.8 -60.2 * (Gautam et al., 2017)
10 18.9 56.7 200 * Dahal 2021(Thesis)
15 12.5 23.3 86.4 * (Pandit et al., 2018b)
20 2.2 4 81.8 * (Timilsina et al., 2017)
50 13.5 13.4 0 ns (Vista and Khadka, 2017)
Available K, mg kg-
1
5 176 264 50.0 * (Gautam et al., 2017)
10 88.3 166.7 88.8 * Dahal 2021(Thesis)
20 7.7 12.3 59.7 * (Timilsina et al., 2017)
50 35.2 231 556.3 * (Vista and Khadka, 2017)
*denotes significantly different at 0.05 significance level and ns. denote non-
significant difference on soil properties between biochar and non-biochar plots.
up to 200% and available K by up to 556% compared with non-biochar soils
(Table 2). Soil available P could be linked with the status of soil pH, as
phosphate is tightly bound to iron (Fe) and aluminum (Al) oxides in acidic soils
(Hale et al., 2013). Biochar addition in acidic soil could increase soil pH (liming
effect), which in turn, could make more P available in the soil solution (Asai et
al., 2009; Cornelissen et al., 2018). Increased soil available K could be due to
high amount of K in biochar ash and reduced K leaching upon biochar
amendment (Cornelissen et al., 2013; Martinsen et al., 2014).
Effect of biochar on crop productivity
Use of biochar as a soil amendment has shown significant positive effect on
vegetable and crop productivity in Nepal (Gautam et al., 2017; Pandit et al.,
2018b; Timilsina et al., 2017; Vista and Khadka, 2017). In the multiyear field
trials conducted by Pandit et al. (2018b) over three years period, maize yield
was increased by 51% (5.3 t ha-1
) upon biochar addition in combination with
mineral fertilizer compared to control (3.5 t ha-1
). In another study conducted by
Timilsina et al. (2017), biochar addition at the rate of 20 t ha-1
increased radish
yield by 83 % (46.8 Mg ha-1
) compared to non-biochar soil (25.5 Mg ha-1
).
Similarly, another study conducted by same author on cauliflower in the year
2020, biochar addition (2 t ha-1
) increased curd yield by 37% compared with
sole NPK treatment applied at recommended rate (200:120:80 kg NPK ha-1
) and
by 59% compared with control (Timilsina et al., 2020). Gautam et al. (2017)
Nepalese Journal of Agricultural Sciences, 2021, volume 21 ISSN 2091-042X; eISSN 2091-0428
260
reported increased vegetable growth of radish, soyabean, chilli, garlic upon
biochar amendment (5 t ha-1
) compared to control. Furthermore, pea yield was
significantly increased by more than two fold with the use of biochar in
combination with organic nutrients (Shrestha and Pandit, 2017).
Improved crop productivity was mainly attributed to improved soil
physicochemical properties such as texture, bulk density pH, OC, exchangeable
bases (Ca, Mg and K) and available nutrients (N, P and K) upon biochar
addition (Cornelissen et al. 2013; Martinsen ets al. 2014; Pandit et al. 2018b).
Liming effect of pH was observed on maize yield, when biochar addition
increased soil pH (lower Al/Ca ratio) thereby alleviating acid stress in an acidic
soil (Cornelissen et al., 2018; Yamato et al., 2006). In the study conducted by
Pandit et al. (2018b), soil parameters such as pH (R2 = 0.85), OC (R2 =0.77),
CEC (R2 = 0.80), base saturation (R2 = 0.78), available P (R2 = 0.95) and K
(R2 = 0.80) showed significant positive relationship (p<0.05) with maize
productivity. Increased available P and K, upon biochar addition were probably
the main nutrient factors responsible for increased maize production (Pandit et
al., 2018b). Available P was increased from 23 to 86 mg kg-1
upon biochar
addition (Pandit et al., 2018b), which is within the range (50 - 70 mg kg-1
)
required for optimum crop growth (Krogstad et al., 2008). Positive effect of soil
available K on crop growth upon biochar addition was also reported in another
study (Gautam et al., 2017). However, in another study conducted by Pandit et
al. (2018a) in a similar soil type, increased soil available N (NO3- and NH4
+)
upon biochar addition did not show significant effect on maize production,
illustrating, soil N was probably not the limiting nutrient in the particular soil.
However, this may not be the case for other soil type and location as N is often
the most limiting nutrient in Nepalese soil. Thus, further experiment is
recommended on various soil types and agroecological region under various
nutrient stress conditions, to assess the mechanistic explanation of different
nutrient effect including nitrogen on crop productivity.
Effect of nutrient enriched biochar on crop productivity
Biochar enriched with fertilizers (organic or mineral) has shown enhanced
nutrient use efficiency and crop productivity compared with the application of
biochar and fertilizers that were added separately in soil (Schmidt et al. 2017;
Kammann et al. 2015; Pandit et al. 2017). In the study conducted by Pandit et al.
(2017), maize production was increased by 209% with nutrient (NPK) enriched
biochar compared with same amount of biochar and fertilizer added separately
in soil. Similarly, biochar (0.75 t ha-1
) enriched with cattle urine and applied at
the root zone increased pumpkin yield by more than 300% and 85% compared
with only urine and only biochar treatment respectively (Schmidt et al., 2015).
Furthermore, Schmidt et al. (2017) conducted multi-location field trials (21
trials) on 13 different crop species across in Nepal to explore the agronomic

Nepalese Journal of Agricultural Sciences, 2021, volume 21 ISSN 2091-042X; eISSN 2091-0428
261
effect of both mineral NPK enriched and urine enriched biochar on crop
productivity. Mineral enriched biochar increased crop yield by 20% compared
with control (without biochar) receiving same level of NPK fertilizers.
Furthermore, urine enriched biochar increased crop yield by 123% compared
with cow urine-blended compost (mixed separately) and by 103% compared
with NPK enriched biochar receiving same dose of nutrient. Similarly, in the
recent study conducted by Pandit et al. (2020), use of urine enriched biochar
under agroforestry system showed significantly higher banana yield, which was
increased by 41% and 102% compared with the use of conventional NPK
fertilizers and only compost treatment, respectively.
Enhanced agronomic performance upon nutrient enriched biochar was possibly
due to restriction of water movement in biochar micro and nano-pores which
allows retention of nutrients inside the biochar matrix for longer period and act
as a slow release fertilizer enabling synchrony between soil nutrient supply and
plant demand (Hagemann et al., 2017; Joseph et al., 2017; Schmidt et al., 2015).
Kammann, et al. (2015) reported increased nutrient retention and nutrient uptake
by plants (nitrate and phosphate) with the application of organic nutrient
enriched biochar thereby increasing crop productivity. However, the exact
mechanism of biochar on improving crop productivity has been not clearly
illustrated in earlier studies (Cornelissen et al., 2018; Jeffery et al., 2017). Thus,
the further extensive research in different agricultural domain along with
spectroscopic analysis of biochar substrates are needed to unravel the
mechanistic explanation of nutrient enriched biochar on improving crop
productivity in Nepal.
Economic implications
Economic analysis of applying various biochar rate (5, 10, 15, 25 and 40 t ha-1
)
on maize farming was performed in Nepal (Pandit et al., 2018b). In this study,
gross margin was observed highest with the use of 15 t ha-1
, which was 53%
higher compared with the control (non-biochar plot). Furthermore, biochar
application above 15 t ha-1
(i.e. 25 and 40 t ha-1
) showed drastic reduction on
gross margin, which was mainly due to higher cost and reduced crop yield
associated with higher biochar application rate. Also, based on the current status
and availability of limited feedstock (eupatorium or other organic materials) at
farm household level (Dahal and Bajracharya, 2013), it would be challenging to
produce and apply biochar at higher application rate (15 t ha-1
or above). Thus, it
is critical to identify the appropriate techniques such as preparing efficient
biochar-based fertilizers or practicing improved application methods, which can
reduce biochar rate while maintaining similar or even higher yields. In the study
conducted by Schmidt et al. (2015), biochar rate was reduced by less than 1 t ha-
1 (0.75 t ha
-1) when biochar was enriched with urine and applied at the root zone
Nepalese Journal of Agricultural Sciences, 2021, volume 21 ISSN 2091-042X; eISSN 2091-0428
262
along with compost manure supplements resulting in a yield gain of more than
300% compared with control.
In Nepal, farmers can make one ton biochar themselves from around four to five
tons of dry Eupatorium (20–25% conversion efficiency) at the farm household
level using no or low cost soil pit Kon-Tiki (Pandit et al., 2018b). Cost to
produce 1 t ha-1
biochar using soil pit Kon-Tiki is USD 25 (Schmidt et al.,
2015). Referring to the study of Schmidt et al. (2015), the cost of 0.75 t biochar
will be 19 USD, 6300 L cattle urine will be 63 USD (10 USD per 1000 L) and
10.5 t ha-1
manure will be USD 89 (8.5 USD per 1000 kg). The total cost for
urine enriched biochar with manure supplement will be USD 172. Other
agronomic management cost per hectare based on the local practice where trials
were conducted will be around USD 233 (seed: USD 25, irrigation: USD 102
and crop protection measures: USD 106). Labor cost was not included assuming
that farmers are involved on their own to carry out the agricultural activities at
local farm household level. Here, in this study, pumpkin yield upon urine
enriched biochar was 80 t ha-1
and with only urine and only biochar treatment
was 8 and 15 t ha-1
respectively. Gross margin from pumpkin sale (selling price
of USD 127 per ton) will be USD 9764, USD 611 and USD 1504 with the use of
urine enriched biochar, only urine and only biochar treatment respectively.
Gross margin with urine enriched biochar was observed 6 times higher
compared with only biochar treatment (biochar and manure added separately).
Thus, to achieve higher agronomic and economic returns with reduced biochar
rate, it is recommended to enrich the biochar with nutrients (urine) and apply at
root zone, which can enhance the fertilizing efficiency and crop productivity in
the context of Nepal.
CONCLUSION AND RECOMMENDATIONS
Biochar can be produced from an invasive forest weed “Eupatorium” and other
organic waste using low cost flame curtain soil pit Kon-Tiki, which has shown
lower GHGs emission during pyrolysis process. Biochar amendment can
significantly improve soil fertility status, which in turn, increase crop yield in a
low productive soil of Nepal. Enhanced crop productivity with the use of
nutrient enriched biochar substrate could help to combat current food insecurity
issues of the country and contribute to achieve sustainable development goals.
Based on the varied agronomic response of biochar in different soil types,
ecological region (tropical vs temperate) and crop types (Jeffery et al., 2011;
Kandel et al., 2021), it is suggested to carry out further experiments considering
these diverse factors for better mechanistic understanding of biochar effect on
crop productivity in Nepal. Use of urine enriched biochar can substantially
reduce the use of chemical fertilizers including urea nitrogen fertilizer, which
would have positive effect on reducing environmental pollution through reduced
leaching and emissions of nitrous oxides - a potential GHG’s for global

Nepalese Journal of Agricultural Sciences, 2021, volume 21 ISSN 2091-042X; eISSN 2091-0428
263
warming. Given the condition of lower imported chemical fertilizers in the
country (approx. 50% of actual demand), use of biochar-based organic fertilizers
could reduce the input of chemical fertilizers while maintaining the same or
even higher level of crop productivity per unit of land in Nepal. In addition to
improved soil fertility and crop productivity, biochar addition could
substantially store large amount of carbon in soil due to its inert nature, which
play significant role in mitigating ongoing climate change.
REFERENCES Asai, H., Samson, B.K., Stephan, H.M., Songyikhangsuthor, K., Homma, K., Kiyono, Y., Inoue, Y.,
Shiraiwa, T., Horie, T., (2009) Biochar amendment techniques for upland rice production in
Northern Laos: 1. Soil physical properties, leaf SPAD and grain yield. F. Crop. Res. 111, 81–
84.
Atkinson, C.J., Fitzgerald, J.D., Hipps, N.A., (2010) Potential mechanisms for achieving agricultural
benefits from biochar application to temperate soils: a review. Plant Soil 337, 1–18.
https://doi.org/10.1007/s11104-010-0464-5
Bajracharya, R.M., Sherchan, D.P., (2009) Fertility status and dynamics of soils in the Nepal
Himalaya: A review and analysis. Soil Fertil. 111–135.
Brown, S., Schreier, H., Shah, P.B., Lavkulich, L.M., (1999) Modelling of soil nutrient budgets: an
assessment of agricultural sustainability in Nepal. Soil use Manag. 15, 101–108.
Butnan, S., Deenik, J.L., Toomsan, B., Antal, M.J., Vityakon, P., (2015) Biochar characteristics and
application rates affecting corn growth and properties of soils contrasting in texture and
mineralogy. Geoderma 237, 105–116.
Chan, K.Y., Van Zwieten, L., Meszaros, I., Downie, A., Joseph, S., (2008) Agronomic values of
greenwaste biochar as a soil amendment. Soil Res. 45, 629–634.
Cornelissen, G., Martinsen, V., Shitumbanuma, V., Alling, V., Breedveld, G.D., Rutherford, D.W.,
Sparrevik, M., Hale, S.E., Obia, A., Mulder, J., (2013) Biochar effect on maize yield and soil
characteristics in five conservation farming sites in Zambia. Agronomy 3, 256–274.
Cornelissen, G., Nurida, N.L., Hale, S.E., Martinsen, V., Silvani, L., Mulder, J., (2018) Fading
positive effect of biochar on crop yield and soil acidity during five growth seasons in an
Indonesian Ultisol. Sci. Total Environ. 634, 561–568.
Cornelissen, G., Pandit, N.R., Taylor, P., Pandit, B.H., Sparrevik, M., Schmidt, H.P., (2016)
Emissions and char quality of flame-curtain “Kon Tiki” kilns for farmer-scale
charcoal/biochar production. PLoS One 11. https://doi.org/10.1371/journal.pone.0154617
Dahal, N., Bajracharya, R.M., (2013) Use of Biochar for enhancing soil quality in mountain
agricultural lands of Nepal, in: Proceedings of International Conference on Forest, People
and Climate: Changing Paradigm (Eds. Balla, MK, Rayamajhi, S. and Singh, A). Institute of
Forestry, Pokhara, Nepal.
Dahal, N., Bajracharya, R.M., Merz, J., (2016) Prospects of bicar as soil amendment in Nepal hill
farming systems. J. Agric. Environ. 17, 92–103.
Downie, A., Van Zwieten, L., (2013) Biochar: A Coproduct to Bioenergy from Slow-Pyrolysis
Technology, in: Advanced Biofuels and Bioproducts. Springer, pp. 97–117.
Gaskin, J.W., Speir, R.A., Harris, K., Das, K.C., Lee, R.D., Morris, L.A., Fisher, D.S., (2010) Effect
of peanut hull and pine chip biochar on soil nutrients, corn nutrient status, and yield. Agron.
J. 102, 623–633.
Gautam, D.K., Bajracharya, R.M., Sitaula, B.K., (2017) Effects of Biochar and Farm Yard Manure
on Soil Properties and Crop Growth in an Agroforestry System in the Himalaya. Sustain.
Agric. Res. 6, 74.
Gruba, P., Mulder, J., Brożek, S., (2013) Modelling the pH dependency of dissolved calcium and
aluminium in O, A and B horizons of acid forest soils. Geoderma 206, 85–91.
Hagemann, N., Joseph, S., Conte, P., Albu, M., Obst, M., Borch, T., Orsetti, S., Subdiaga, E.,
Behrens, S., Kappler, A., (2017) Composting-derived organic coating on biochar enhances its
Nepalese Journal of Agricultural Sciences, 2021, volume 21 ISSN 2091-042X; eISSN 2091-0428
264
affinity to nitrate, in: EGU General Assembly Conference Abstracts. p. 10775.
Hale, S.E., Alling, V., Martinsen, V., Mulder, J., Breedveld, G.D., Cornelissen, G., (2013) The
sorption and desorption of phosphate-P, ammonium-N and nitrate-N in cacao shell and corn
cob biochars. Chemosphere 91, 1612–1619.
Jeffery, S., Abalos, D., Prodana, M., Bastos, A., van Groenigen, J.W., Hungate, B., Verheijen, F.,
(2017) Biochar boosts tropical but not temperate crop yields. Environ. Res. Lett.
Jeffery, S., Verheijen, F.G.A., Van Der Velde, M., Bastos, A.C., (2011) A quantitative review of the
effects of biochar application to soils on crop productivity using meta-analysis. Agric.
Ecosyst. Environ. 144, 175–187.
Joseph, S., Kammann, C.I., Shepherd, J.G., Conte, P., Schmidt, H.-P., Hagemann, N., Rich, A.M.,
Marjo, C.E., Allen, J., Munroe, P., (2017) Microstructural and associated chemical changes
during the composting of a high temperature biochar: Mechanisms for nitrate, phosphate and
other nutrient retention and release. Sci. Total Environ.
Kammann, C.I., Schmidt, H.-P., Messerschmidt, N., Linsel, S., Steffens, D., Müller, C., Koyro, H.-
W., Conte, P., Joseph, S., (2015) Plant growth improvement mediated by nitrate capture in
co-composted biochar. Sci. Rep. 5, 11080.
Kandel, A., Dahal, S., Mahatara, S., (2021) A review on biochar as a potential soil fertility enhancer
to agriculture. Arch. Agric. Environ. Sci. 6, 108–113.
Krogstad, T., Øgaard, A.F., Kristoffersen, A.Ø., (2008) New P recommendations for grass and
cereals in Norwegian agriculture, in: NJF Seminar. pp. 42–46.
Kunwar, R.M., (2003) Invasive alien plants and Eupatorium: Biodiversity and livelihood. Himal. J.
Sci. 1, 129–133.
Lehmann, J., Czimczik, C., Laird, D., Sohi, S., (2009) Stability of biochar in soil. Biochar Environ.
Manag. Sci. Technol. 183–206.
Lehmann, J., Gaunt, J., Rondon, M., (2006) Bio-char sequestration in terrestrial ecosystems–a
review. Mitig. Adapt. Strateg. Glob. Chang. 11, 395–419.
Liang, B., Lehmann, J., Solomon, D., Kinyangi, J., Grossman, J., O’Neill, B., Skjemstad, J.O.,
Thies, J., Luizão, F.J., Petersen, J., Neves, E.G., (2006) Black Carbon Increases Cation
Exchange Capacity in Soils. Soil Sci. Soc. Am. J. 70, 1719.
https://doi.org/10.2136/sssaj2005.0383
Liu, X., Zhang, A., Ji, C., Joseph, S., Bian, R., Li, L., Pan, G., Paz-Ferreiro, J., (2013) Biochar’s
effect on crop productivity and the dependence on experimental conditions—a meta-analysis
of literature data. Plant Soil 373, 583–594.
Manyà, J.J., (2012) Pyrolysis for biochar purposes: a review to establish current knowledge gaps and
research needs. Environ. Sci. Technol. 46, 7939–7954.
Martinsen, V., Mulder, J., Shitumbanuma, V., Sparrevik, M., Børresen, T., Cornelissen, G., (2014)
Farmer‐ led maize biochar trials: Effect on crop yield and soil nutrients under conservation
farming. J. Plant Nutr. Soil Sci. 177, 681–695.
Nagula, S., Ramanjaneyulu, A. V, (2020) Biochar-The New Black Gold. Biot. Res. Today 2, 425–
427.
Nguyen, T.H., Brown, R.A., Ball, W.P., (2004) An evaluation of thermal resistance as a measure of
black carbon content in diesel soot, wood char, and sediment. Org. Geochem. 35, 217–234.
Pandit, B.H., Nuberg, I., Shrestha, K.K., Cedamon, E., Amatya, S.M., Dhakal, B., Schmidt, H.P.,
(2020) Revitalising Agrarian Economies: The Use of Biochar on Banana-based Agroforestry
System in Nepal’s hills. J. For. Livelihood 19, 1.
Pandit, N.R., Mulder, J., Hale, S.E., Martinsen, V., Schmidt, H.P., Cornelissen, G., (2018a) Biochar
improves maize growth by alleviation of nutrient stress in a moderately acidic low-input
Nepalese soil. Sci. Total Environ. 625. https://doi.org/10.1016/j.scitotenv.2018.01.022
Pandit, N.R., Mulder, J., Hale, S.E., Schmidt, H.P., Cornelissen, G., (2017) Biochar from “Kon Tiki”
flame curtain and other kilns: Effects of nutrient enrichment and kiln type on crop yield and
soil chemistry. PLoS One 12. https://doi.org/10.1371/journal.pone.0176378
Pandit, N.R., Mulder, J., Hale, S.E., Zimmerman, A.R., Pandit, B.H., Cornelissen, G., (2018b)
Multi-year double cropping biochar field trials in Nepal: Finding the optimal biochar dose
through agronomic trials and cost-benefit analysis. Sci. Total Environ. 637–638.
Nepalese Journal of Agricultural Sciences, 2021, volume 21 ISSN 2091-042X; eISSN 2091-0428
265
https://doi.org/10.1016/j.scitotenv.2018.05.107
Pandit, N.R., Schmidt, H.P., Mulder, J., Hale, S.E., Husson, O., Cornelissen, G., (2019) Nutrient
effect of various composting methods with and without biochar on soil fertility and maize
growth. Arch. Agron. Soil Sci.
Qiao-Hong, Z.H.U., Xin-Hua, P., Huang, T.-Q., Zu-Bin, X.I.E., Holden, N.M., (2014) Effect of
biochar addition on maize growth and nitrogen use efficiency in acidic red soils. Pedosphere
24, 699–708.
Schmidt, H.P., Pandit, B.H., Cornelissen, G., Kammann, C.I., n.d. Biochar-Based Fertilization with
Liquid Nutrient Enrichment: 21 Field Trials Covering 13 Crop Species in Nepal. L. Degrad.
Dev.
Schmidt, H.P., Pandit, B.H., Martinsen, V., Cornelissen, G., Conte, P., Kammann, C.I., (2015)
Fourfold increase in pumpkin yield in response to low-dosage root zone application of urine-
enhanced biochar to a fertile tropical soil. Agriculture 5, 723–741.
Schmidt, H.P., Taylor, P., (2014) Kon-Tiki flame curtain pyrolysis for the democratization of
biochar production. Biochar J 1, 14–24.
Shrestha, A.J., Pandit, B.H., (2017) Action Research into a Flood Resilient Value Chain–Biochar-
Based Organic Fertilizer Doubles Productivity of Pea in Udayapur, Nepal. KnE Life Sci. 3,
1–19.
Timilsina, S., Khanal, A., Vista, S.P., Poon, T.B., (2020) Effect of biochar application in
combination with different nutrient sources on cauliflower production at Kaski Nepal.
Minist. Agric. Livest. Dev. Singhdurbar, Kathmandu.
Timilsina, S., Khanal, B.R., Shah, S.C., Shrivastav, C.P., Khanal, A., (2017) Effects of biochar
application on soil properties and production of Radish (Raphanus sativus L.) on loamy sand
soil. J Agric Univ 1, 103–111.
Upadhyay, K.P., (2015) The influence of biochar on crop growth and the colonization of
horticultural crops by arbuscular mycorrhizal fungi.
Upadhyay, K.P., Dhami, N.B., Sharma, P.N., Neupane, J.D., Shrestha, J., (2020) Growth and yield
responses of potato (Solanum tuberosum L.) to biochar. Agraarteadus 31.
Vista, S.P., Khadka, A., (2017) Determining appropriate dose of biochar for vegetables. J.
Pharmacogn. Phytochem. 1, 673.
Woolf, D., Amonette, J.E., Street-Perrott, F.A., Lehmann, J., Joseph, S., (2010) Sustainable biochar
to mitigate global climate change. Nat. Commun. 1, 56.
Yamato, M., Okimori, Y., Wibowo, I.F., Anshori, S., Ogawa, M., (2006) Effects of the application
of charred bark of Acacia mangium on the yield of maize, cowpea and peanut, and soil
chemical properties in South Sumatra, Indonesia. Soil Sci. Plant Nutr. 52, 489–495.
https://doi.org/10.1111/j.1747-0765.2006.00065.x
Nepalese Journal of Agricultural Sciences, 2021, volume 21 ISSN 2091-042X; eISSN 2091-0428
266
Vertical farming: a future vegetable production system
Krish Rauniyar
HICAST, Kathmandu, Nepal
Corresponding Author: [email protected]
ABSTRACT
Due to the limited access to land for farming, there is a need
for sustaining farming tasks so as to pave the way for adding
to food needs. Many aspects press on food industry and
processing such as: growth of population and its growing
needs accordingly, reduction of natural sources due to
growing cities, earth erosion, different forms of
contamination, advent of bio-fuels, restrictions imposed on
food production techniques affected by customers and rule
providers which requires better quality, less use of chemicals
and many useful environmental attempts ‘from farm to fork’
(Albajes et al., 2013). Therefore, it has led to more interest in
providing healthy food and incorporating it in the sustainable
development project. With the aim of increasing crop yield per
unit area of land, the concept of vertical farming is currently
gathering momentum. By farming upwards rather than
outwards, this technique aims to reduce pressure on
traditional agricultural land and, by incorporating soil-free
growing systems, is particularly attractive for use in urban
areas.
INTRODUCTION
With the global population set to exceed 10 billion people by 2050, the
challenge of providing enough food for everyone in a sustainable, efficient and
cost-effective way is rising in significance. Shedding the restrictions of seasonal
weather patterns, overcoming transportation challenges and significantly
enhancing yields, the growing trend of “vertical farming” could herald the future
of food production. For thousands of years, human populations have farmed the
land for food. But with a sharp rise in the number of people on our planet over
recent centuries – as a result of the industrial revolution, increased living
standards and falling mortality rates – the pressure on traditional farming has
continually increased. Furthermore, as our cities expand, the distances between
suitable farming land and the large populations who consume their produce are
growing, raising the impact of transportation. Added to these challenges is a
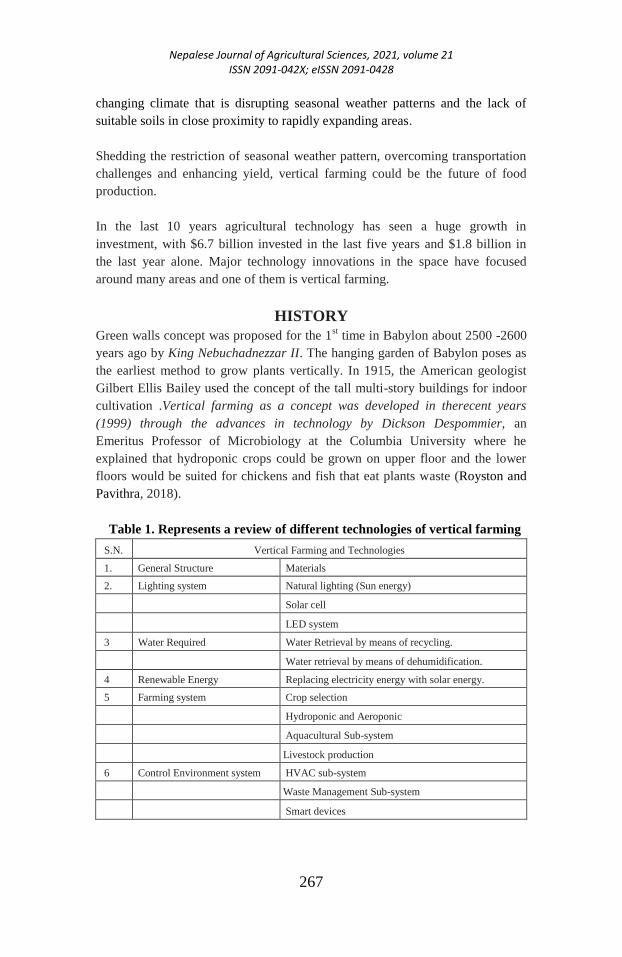
Nepalese Journal of Agricultural Sciences, 2021, volume 21 ISSN 2091-042X; eISSN 2091-0428
267
changing climate that is disrupting seasonal weather patterns and the lack of
suitable soils in close proximity to rapidly expanding areas.
Shedding the restriction of seasonal weather pattern, overcoming transportation
challenges and enhancing yield, vertical farming could be the future of food
production.
In the last 10 years agricultural technology has seen a huge growth in
investment, with $6.7 billion invested in the last five years and $1.8 billion in
the last year alone. Major technology innovations in the space have focused
around many areas and one of them is vertical farming.
HISTORY
Green walls concept was proposed for the 1st time in Babylon about 2500 -2600
years ago by King Nebuchadnezzar II. The hanging garden of Babylon poses as
the earliest method to grow plants vertically. In 1915, the American geologist
Gilbert Ellis Bailey used the concept of the tall multi-story buildings for indoor
cultivation .Vertical farming as a concept was developed in therecent years
(1999) through the advances in technology by Dickson Despommier, an
Emeritus Professor of Microbiology at the Columbia University where he
explained that hydroponic crops could be grown on upper floor and the lower
floors would be suited for chickens and fish that eat plants waste (Royston and
Pavithra, 2018).
Table 1. Represents a review of different technologies of vertical farming
S.N. Vertical Farming and Technologies
1. General Structure Materials
2. Lighting system Natural lighting (Sun energy)
Solar cell
LED system
3 Water Required Water Retrieval by means of recycling.
Water retrieval by means of dehumidification.
4 Renewable Energy Replacing electricity energy with solar energy.
5 Farming system Crop selection
Hydroponic and Aeroponic
Aquacultural Sub-system
Livestock production
6 Control Environment system HVAC sub-system
Waste Management Sub-system
Smart devices
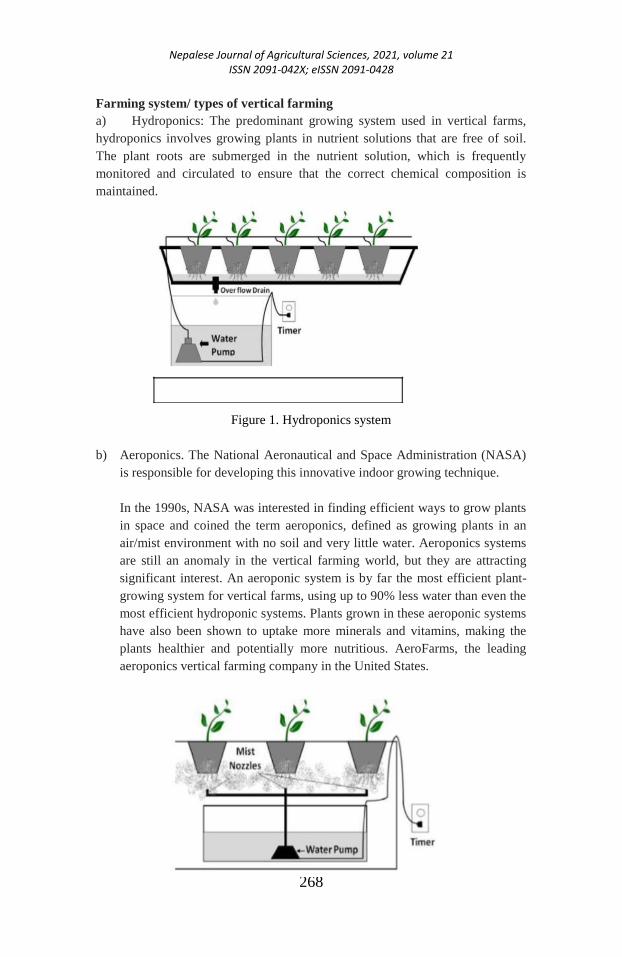
Nepalese Journal of Agricultural Sciences, 2021, volume 21 ISSN 2091-042X; eISSN 2091-0428
268
Farming system/ types of vertical farming
a) Hydroponics: The predominant growing system used in vertical farms,
hydroponics involves growing plants in nutrient solutions that are free of soil.
The plant roots are submerged in the nutrient solution, which is frequently
monitored and circulated to ensure that the correct chemical composition is
maintained.
Figure 1. Hydroponics system
b) Aeroponics. The National Aeronautical and Space Administration (NASA)
is responsible for developing this innovative indoor growing technique.
In the 1990s, NASA was interested in finding efficient ways to grow plants
in space and coined the term aeroponics, defined as growing plants in an
air/mist environment with no soil and very little water. Aeroponics systems
are still an anomaly in the vertical farming world, but they are attracting
significant interest. An aeroponic system is by far the most efficient plant-
growing system for vertical farms, using up to 90% less water than even the
most efficient hydroponic systems. Plants grown in these aeroponic systems
have also been shown to uptake more minerals and vitamins, making the
plants healthier and potentially more nutritious. AeroFarms, the leading
aeroponics vertical farming company in the United States.
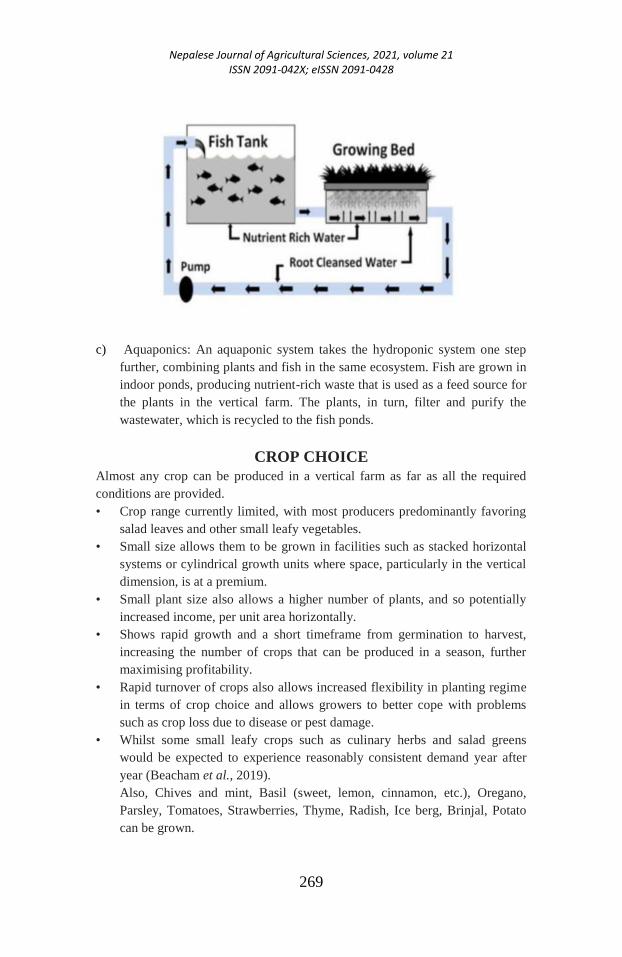
Nepalese Journal of Agricultural Sciences, 2021, volume 21 ISSN 2091-042X; eISSN 2091-0428
269
c) Aquaponics: An aquaponic system takes the hydroponic system one step
further, combining plants and fish in the same ecosystem. Fish are grown in
indoor ponds, producing nutrient-rich waste that is used as a feed source for
the plants in the vertical farm. The plants, in turn, filter and purify the
wastewater, which is recycled to the fish ponds.
CROP CHOICE
Almost any crop can be produced in a vertical farm as far as all the required
conditions are provided.
• Crop range currently limited, with most producers predominantly favoring
salad leaves and other small leafy vegetables.
• Small size allows them to be grown in facilities such as stacked horizontal
systems or cylindrical growth units where space, particularly in the vertical
dimension, is at a premium.
• Small plant size also allows a higher number of plants, and so potentially
increased income, per unit area horizontally.
• Shows rapid growth and a short timeframe from germination to harvest,
increasing the number of crops that can be produced in a season, further
maximising profitability.
• Rapid turnover of crops also allows increased flexibility in planting regime
in terms of crop choice and allows growers to better cope with problems
such as crop loss due to disease or pest damage.
• Whilst some small leafy crops such as culinary herbs and salad greens
would be expected to experience reasonably consistent demand year after
year (Beacham et al., 2019).
Also, Chives and mint, Basil (sweet, lemon, cinnamon, etc.), Oregano,
Parsley, Tomatoes, Strawberries, Thyme, Radish, Ice berg, Brinjal, Potato
can be grown.
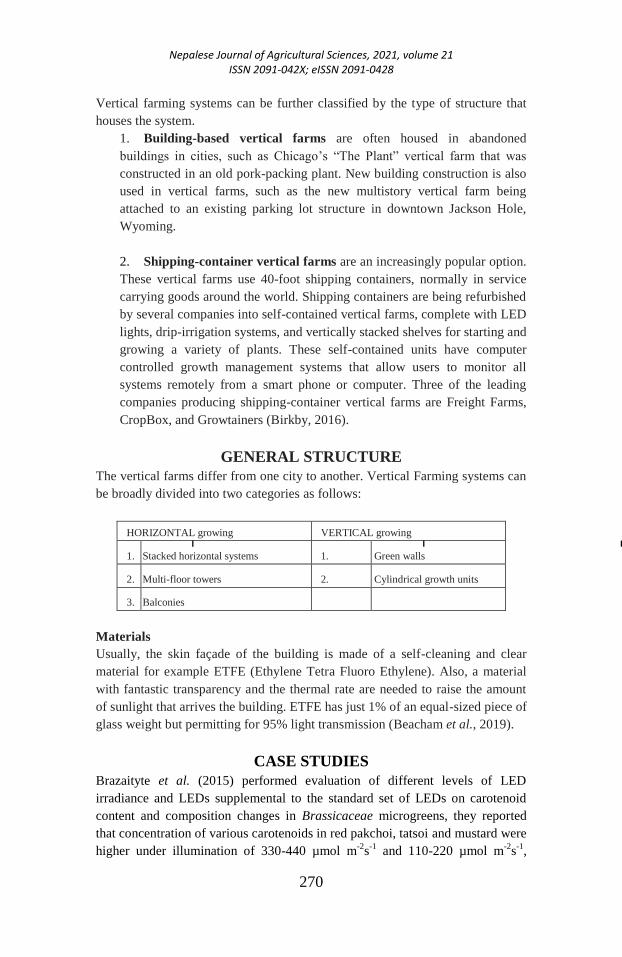
Nepalese Journal of Agricultural Sciences, 2021, volume 21 ISSN 2091-042X; eISSN 2091-0428
270
Vertical farming systems can be further classified by the type of structure that
houses the system.
1. Building-based vertical farms are often housed in abandoned
buildings in cities, such as Chicago’s “The Plant” vertical farm that was
constructed in an old pork-packing plant. New building construction is also
used in vertical farms, such as the new multistory vertical farm being
attached to an existing parking lot structure in downtown Jackson Hole,
Wyoming.
2. Shipping-container vertical farms are an increasingly popular option.
These vertical farms use 40-foot shipping containers, normally in service
carrying goods around the world. Shipping containers are being refurbished
by several companies into self-contained vertical farms, complete with LED
lights, drip-irrigation systems, and vertically stacked shelves for starting and
growing a variety of plants. These self-contained units have computer
controlled growth management systems that allow users to monitor all
systems remotely from a smart phone or computer. Three of the leading
companies producing shipping-container vertical farms are Freight Farms,
CropBox, and Growtainers (Birkby, 2016).
GENERAL STRUCTURE
The vertical farms differ from one city to another. Vertical Farming systems can
be broadly divided into two categories as follows:
HORIZONTAL growing VERTICAL growing
1. Stacked horizontal systems 1. Green walls
2. Multi-floor towers 2. Cylindrical growth units
3. Balconies
Materials
Usually, the skin façade of the building is made of a self-cleaning and clear
material for example ETFE (Ethylene Tetra Fluoro Ethylene). Also, a material
with fantastic transparency and the thermal rate are needed to raise the amount
of sunlight that arrives the building. ETFE has just 1% of an equal-sized piece of
glass weight but permitting for 95% light transmission (Beacham et al., 2019).
CASE STUDIES
Brazaityte et al. (2015) performed evaluation of different levels of LED
irradiance and LEDs supplemental to the standard set of LEDs on carotenoid
content and composition changes in Brassicaceae microgreens, they reported
that concentration of various carotenoids in red pakchoi, tatsoi and mustard were
higher under illumination of 330-440 µmol m-2
s-1
and 110-220 µmol m-2
s-1
,
Nepalese Journal of Agricultural Sciences, 2021, volume 21 ISSN 2091-042X; eISSN 2091-0428
271
respectively. All supplemental wavelengths escalated total carotenoid content in
mustard but declined in red pakchoi, elevated in tatsoi under supplemental
yellow light.
Touliatos et al. (2016) compared vertical farming system against a conventional
horizontal hydroponic system (HHS) using lettuce (Lactuca sativa L. cv. “Little
Gem”). The vertical farming system (VFS) produced more crop per unit of
growing floor area when compared with the HHS and clearly demonstrated that
VFS presents an attractive alternative to horizontal hydroponic system and
suggested further increment in yield could be achieved by incorporating
artificial lighting in the VFS.
Pennisi et al. (2019) studied the effect of spectral R and B components on the
efficiency of lettuce plant physiology, biochemistry and resource utilization.
Compared with fluorescent lamps, LED lighting improved yield (1.6 folds) and
energy usage efficiency (2.8 folds). Adoption of RB = 3 maximized yield,
increased chlorophyll of the leaf, concentrations of flavonoids and absorption of
N, P, K and Mg efficiency in water usage, efficiency in energy and land usage.
Paucek et al. (2020) studied the eff ect of supplemental LED interlighting on
vegetative development, fruit growth, yield and quality of high-wire tomato
plants (Solanum lycopersicum L. cv. ‘Siranzo’) during spring and summer
season addressed in a hydroponic greenhouse. Supplemental LED.
Advantages of vertical farming
a. The first and the major advantage of vertical farming is producing
extremely high yields per available land or area.
b. Producing the food throughout the year without the risk of vagaries of
nature of nature like floods, heavy rains, uneven rains, hail and snowfall,
drought, dry spells, extreme high temperatures, cold waves, epidemics of
pest and diseases, etc.
c. It reduces the cost over transporting loads of food grains from rural area to
urban areas and reduces the spoilage occurring therein. Fossil fuel
consumption in transporting the farm produce to cities from village places is
also reduced to a greater extent.
d. Vertical farming uses 70 to 95 % less water compared to traditional
farming.
e. Ninety percent less or no soil is needed in vertical farming and thereby no
pest and disease infestations.
f. Pesticide free or organic food is produced as there is no use of pesticides.
g. Due to reduced food supply chain, consumers get the fresh produce with all
its original nutrient qualities.
Nepalese Journal of Agricultural Sciences, 2021, volume 21 ISSN 2091-042X; eISSN 2091-0428
272
h. High productivity per unit area i.e. almost 80% more harvest per unit of
area in vertical farming.
i. It will lead to greening of the urban areas and help to reduce the rising
temperatures and mainly the air pollution in cities.
Disadvantages of vertical farming
a. Initial high cost for establishing the vertical farming system is the major
problem. It will include the cost erecting the structures along with its
automation like computerized and monitoring systems, remote control
systems and software's, automated racking and stacking systems,
programmable LED lighting systems, climate control system, etc.
b. Hugh energy cost as growing plant is entirely with artificial lights.
c. The excess nutrients used in vertical farming may interfere and contaminate
the main urban water system if not taken care of.
d. LED lighting systems emit heat though small amount will create problem of
maintaining the temperatures especially in summer months and may
overload the air conditioning systems which will again incur high energy
cost.
e. Lot of garbage, plant residues, etc. will be generated around the buildings
with vertical farming which needs to be dispose off properly.
f. Skilled workforce will be unavailable initially and will need to be trained.
CONCLUSION
From feeding the world with declining natural resources to improving food
security and safety vertical farming has been specially designed or efficient use
of resources is a new promise for the future. Today with recent technological
advances in vertical farming it has become reality-especially in the context of
increasing pressures on land and water, increased urbanization and the effects of
climate change. So substantial research, innovation challenges, policies,
regulatory models are needed to addressed for expanding vertical farming
successfully.
REFERENCES
Albajes, R., Cantero-Martínez, C., Capell, T., Christou, P., Farre, A., Galceran, J., LópezGatius, F.,
Marin, S., Martín-Belloso, O., Motilva, M. J., Nogareda, C., Peman, J., Puy, J., Recasens,
J., Romagosa, I., Romero, M. P., Sanchis, V., Savin, R., Slafer, G. A., Soliva-Fortuny, R.,
Viñas, I. and Voltas, J., (2013) Building bridges: an integrated strategy for sustainable
food production throughout the value chain. Mol. Breed., 32(4): 743–770.
Beacham, A.M., Vickers, L.H. and Monaghan, J.M., (2019) Vertical farming: a summary of
approaches to growing skywards, J. Hort. Sci Biotech., 94(3): 277-283.
Birkby, J., (2016) Vertical farming. ATTRA Sustainable aagriculture. 1-12.
Brazaityte, A., Sakalauskiene, S., Samuoliene, G., Jankauskiene, J., Virsile, A., Novickovas, A.,
Sirtautas, R., Miliauskiene, J., Vastakaite, V., Dabasinskas, L. and Duchovskis, P., (2015)
Nepalese Journal of Agricultural Sciences, 2021, volume 21 ISSN 2091-042X; eISSN 2091-0428
273
The effect of LED illumination spectra and intensity on carotenoid content in
Brassicaceae microgreens. Food Chem., 173: 600-606.
Paucek, I., Pennisi, G., Pistillo, A., Appolloni, E., Crepaldi, A., Calegari, B., Spinelli, F., Cellini, A.,
Gabarrell, X., Orsini, F. and Gianquinto, G., (2020) Supplementary LED interlighting
improves yield and precocity of greenhouse tomatoes in the Mediterranean. Agron., 10:
1-14.
Pennisi, G., Orsini, F., Blasioli, S., Cellini, A., Crepaldi, A., Braschi, I., Spinelli, F., Nicola, S.,
Fernandez, J. A., Stanghellini, C., Gianquinto, G. and Marcelis, L. M., (2019) Resource
use efficiency of indoor lettuce (Lactuca sativa L.) cultivation as affected by red:blue
ratio provided by LED lighting. Sci. Rep., 9(1): 1-11.
Royston, R. M. and Pavithra, M. P., (2018) Vertical farming: a concept, Int. J. Eng. Tech., 4(3):
500-506.
Touliatos, D., Dodd, I.C. and McAinsh, M., (2016) Vertical farming increases lettuce yield per unit
area compared to conventional horizontal hydroponics. Food Energy Secur., 5(3): 184-
191
Nepalese Journal of Agricultural Sciences, 2021, volume 21 ISSN 2091-042X; eISSN 2091-0428
274
Nepalese Journal of Agricultural Sciences
Peer Review System (PRS)
Nepalese Journal of Agricultural Sciences
(NepJAS) is a peer-reviewed scientific journal of
international standard with ISBN 2091-042X and Online ISBN
2091-0428. It conducts evaluation of the manuscripts by peers
with an expertise in the relevant subject. A thorough peer
review is conducted to maintain standard of quality.
NepJAS implements double-blind peer-review-system (PRS)
to ensure unbiased review. That means all the articles
published in this journal undergo integrated peer review by
peers and consequent revision by author(s) as per requirement.
Benefits of PRS
The author receives detailed and constructive feedback
from the experts.
The process alerts authors to the gaps in literature they
may have overlooked.
Readers can be assured that the research articles they
are reading has been verified by subject matter experts.
PRS assures that
The article is relevant to the journal's aims, scope, and
readership.
The submitted article presents original research findings.
The submitted article offers a comprehensive critical
review and evaluation of key literature sources for a
given topic; and
The article is sound both methodologically and
technically.