nesdis satellite land data products for ncep nwp and drought
TRANSCRIPT

X. Zhan, 11th JCSDA Workshop, College Park, MD, June 6, 2013
NESDIS Satellite Land Data Products for NCEP NWP and Drought Monitoring
X. Zhan, J. Liu, C. Hain, L. Fang, J. Yin NESDIS Center for Satellite Applications & Research, College Park, MD
W. Zheng, M. Ek, K. Mo, J. Huang
NWS National Centers for Environmental Predictions, College Park, MD
L. Zhao, H. Ding
NESDIS Office of Satellite and Product Operations, College Park, MD

X. Zhan, 11th JCSDA Workshop, College Park, MD, June 6, 2013 2
OUTLINE Satellite Soil Moisture Data Products
SM Data Assimilation for Drought Monitoring
SM Data Assimilation for NCEP NWPs
Future Data Assimilation Plan

X. Zhan, 11th JCSDA Workshop, College Park, MD, June 6, 2013 3
NESDIS Satellite Land Data Products
Name Satellite/Sensor/System
Albedo NOAA, MetOp, NPP/JPSS, GOES/GOES-R
Fire NOAA, MetOp, NPP/JPSS, GOES/GOES-R
LST NOAA, MetOp, NPP/JPSS, GOES/GOES-R
NDVI/GVF NOAA, MetOp, NPP/JPSS, GOES/GOES-R
Sfc Emissivity MSPPS/MiRS
SM GOES/GOES-R, GCOM-W1, SMOPS
Snow AutoSnow, MSPPS/MiRS
SWE AutoSnow, MSPPS/MiRS

X. Zhan, 11th JCSDA Workshop, College Park, MD, June 6, 2013 4
Two ways to retrieve soil
moisture from satellites:
• Microwave (MW): Observed MW brightness temperature depends on soil dielectric constant that is related to soil moisture:
– Strength: higher reliability based on direct physical relationships
– Weakness: antenna technology limits spatial resolution
• Thermal Infrared (TIR): Observed surface temperature changes result from surface energy balance that is dependent on soil moisture:
– Strength: TIR sensor could have higher spatial resolution
– Weakness: relies on land surface energy balance model that is prone to input data errors.
R soil
T c T ac
H s
T s
R a H = H c + H s
R x
H c
T a
5 km
R soil
T c T ac
H s
T s
R a H = H c + H s
R x
H c
T a T a
5 km Two-
Sou
rce
Mod
el (
ALE
XI)
TRAD fc
ABL
TMI
Microwave Sensitivity By Wavelength and Vegetation Density
0.0
1.0
2.0
3.0
4.0
0 5 10 15 20 25 Wavelength (cm)
Sens
itivi
ty (
Del
ta T
B /
Del
ta V
ol S
M)
BARE
VEGETATION WATER CONTENT (kg/m2)
1
2
4
0
SSM/I AMSR /WindSat SMOS / SMAP
Satellite Soil Moisture Remote Sensing Science

X. Zhan, 11th JCSDA Workshop, College Park, MD, June 6, 2013 5
Soil Moisture Operational Product System (SMOPS)
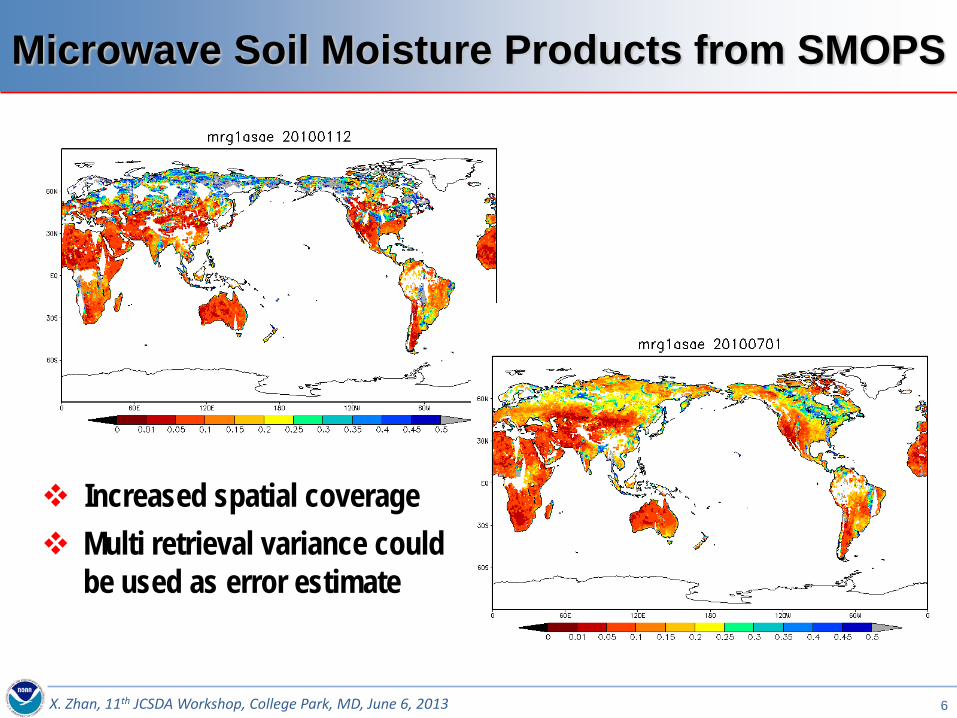
X. Zhan, 11th JCSDA Workshop, College Park, MD, June 6, 2013 6
Increased spatial coverage Multi retrieval variance could
be used as error estimate
Microwave Soil Moisture Products from SMOPS

X. Zhan, 11th JCSDA Workshop, College Park, MD, June 6, 2013 7
Microwave Soil Moisture Products from SMOPS
WindSat SMOS ASCAT
Blended
X. Zhan, 11th JCSDA Workshop, College Park, MD, June 6, 2013 8
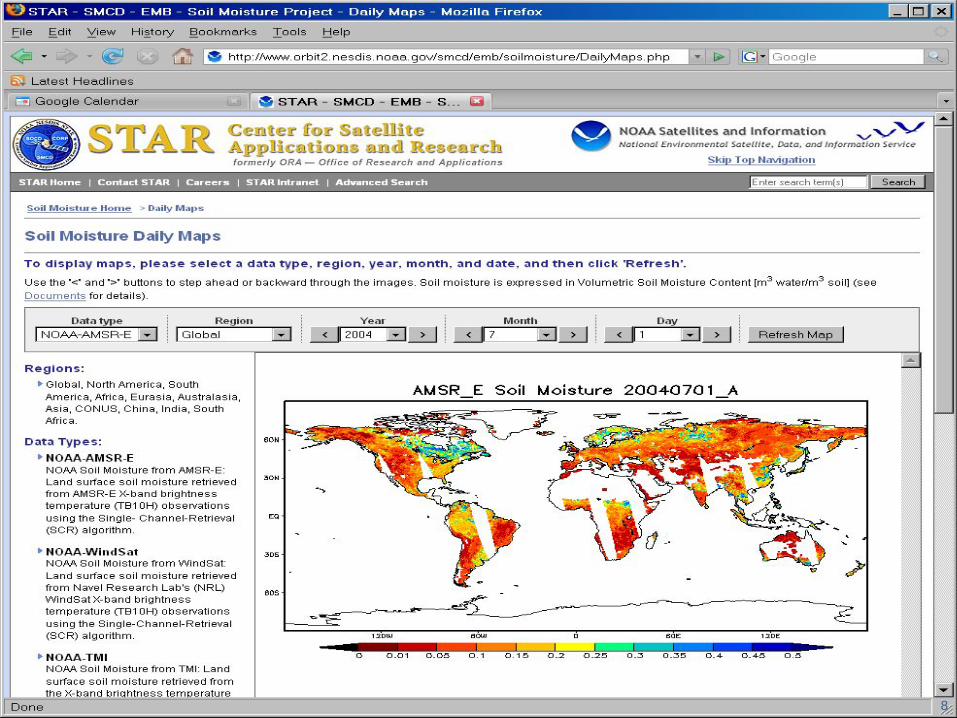
NOAA Global Soil Moisture Data Portal:
8

X. Zhan, 11th JCSDA Workshop, College Park, MD, June 6, 2013 9 9

X. Zhan, 11th JCSDA Workshop, College Park, MD, June 6, 2013 10
Land surface temperature (LST) and solar insolation (Rs) from NOAA Geostationary Operational Environmental Satellite (GOES) imager and future GOES-R Advance Baseline Imager (ABI) are used in an Atmosphere-Land Exchange Inversion (ALEXI) model to generate ET and an Evaporative Stress Index (ESI) for drought monitoring.
ALEXI model output using GOES data have good agreement with field observations and full-scale land surface model simulations of ET.
ALEXI ET and ESI data products are being used at US operational drought monitoring.
Thermal Infrared Remote Sensing for SM

X. Zhan, 11th JCSDA Workshop, College Park, MD, June 6, 2013 11
OUTLINE Satellite Soil Moisture Data Products
SM Data Assimilation for Drought Monitoring
SM Data Assimilation for NCEP NWPs
Future Data Assimilation Plan
12 X. Zhan, 11th JCSDA Workshop, College Park, MD, June 6, 2013
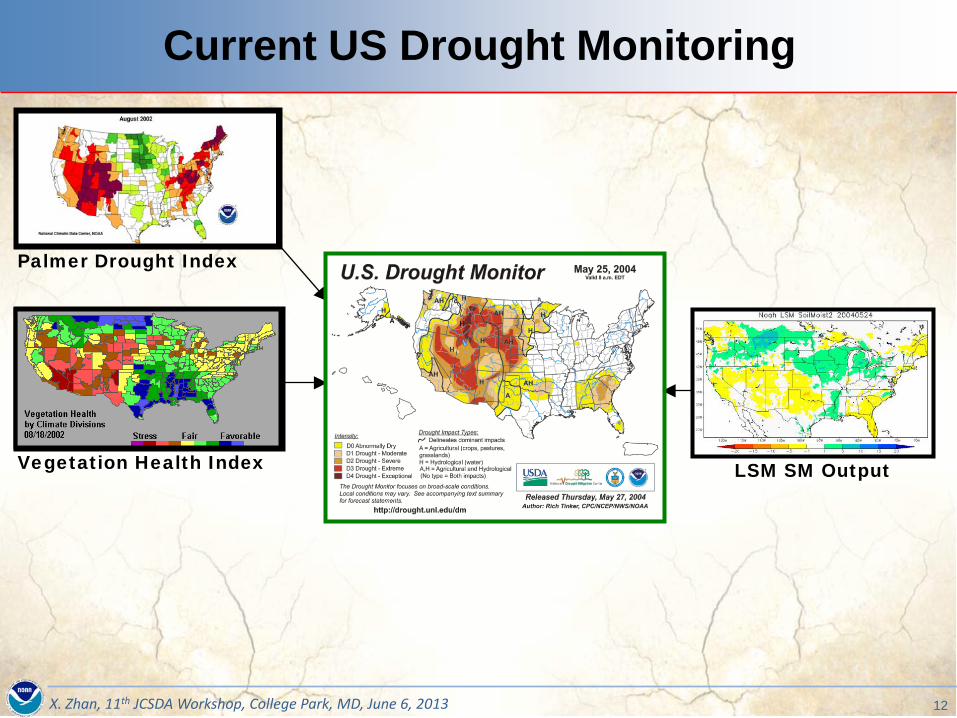
Palmer Drought Index
Vegetation Health Index LSM SM Output
Current US Drought Monitoring

13 X. Zhan, 11th JCSDA Workshop, College Park, MD, June 6, 2013
Palmer Drought Index
Vegetation Health Index
GOES/GOES-R ESI
LSM SM Output
Satellite SM
Satellite ST, Alb, GVF/VI
Enhanced Drought Monitoring

X. Zhan, 11th JCSDA Workshop, College Park, MD, June 6, 2013 14
Noah 1990s/2000s AVHRR/MODIS ST, VI/GVF, albedo
No Satellite LST, SM assimilation LIS (NLDAS)
Current Noah LSM Runs

X. Zhan, 11th JCSDA Workshop, College Park, MD, June 6, 2013 15
Noah
NRT NPP/JPSS ST, VI/GVF, albedo
NRT NPP/JPSS LST, GCOM-W/ ALEXI SM assimilation
LIS (NLDAS, GLDAS)
Enhanced Noah LSM Runs

X. Zhan, 11th JCSDA Workshop, College Park, MD, June 6, 2013 16
Time averaged improvement metric (RMSE(open loop) – RMSE (EnKF)) for (top) surface soil moisture and (bottom) root zone soil moisture from the (left) Catchment LSM and the (right) Noah LSM assimilation experiments. Units are volumetric soil moisture (m3/m3) (Kumar et al 2008)
Sat SM DA Improves LSM Runs To
p La
yer
Catchment LSM Noah LSM
Root
-zon
e
RMSE(open loop) – RMSE (EnKF)

X. Zhan, 11th JCSDA Workshop, College Park, MD, June 6, 2013 17
Dual Assimilation of MW and TIR Sat SM
Synergy between TIR and MW Methods
TIR methods provide: • Relatively higher spatial resolution (100
m to 10 km) • Potential for SM retrievals over a wider
range of vegetation cover • Longer repeat cycles (2 to 7 days,
depending on cloud climatology
MW methods provide: • Relatively low spatial resolution (25 to
60 km) • High temporal resolution (1 to 2 days) • No retrievals over dense vegetative
canopies Time Series Anomaly Correlation (2003-2008)

X. Zhan, 11th JCSDA Workshop, College Park, MD, June 6, 2013 18
Averaged RMSD [m3 m-3] in (a) 0-5 cm SM and (b) 5-100 cm SM predictions
Dual Assimilation of MW and TIR Sat SM

X. Zhan, 11th JCSDA Workshop, College Park, MD, June 6, 2013 19
• NLDAS is tested with or without ALEXI (TIR) and AMSR-E (MW) soil moisture assimilation
CONUS-Average SFC Soil Moisture RMSD (m3 m-3) OLP 0.045 ALEXI 0.039 LPRM 0.037 DUAL 0.037
Dual Assimilation of MW and TIR Sat SM

X. Zhan, 11th JCSDA Workshop, College Park, MD, June 6, 2013 20
• NLDAS is tested with or without ALEXI (TIR) and AMSR-E (MW) soil moisture assimilation
CONUS-Average RZ Soil Moisture RMSD (m3 m-3) OLP 0.055 ALEXI 0.042 LPRM 0.044 DUAL 0.042
Dual Assimilation of MW and TIR Sat SM
X. Zhan, 11th JCSDA Workshop, College Park, MD, June 6, 2013 21
OUTLINE Satellite Soil Moisture Data Products
SM Data Assimilation for Drought Monitoring
SM Data Assimilation for NCEP NWPs
Future Data Assimilation Plan

X. Zhan, 11th JCSDA Workshop, College Park, MD, June 6, 2013 22
Assimilation of MW SM into NCEP GFS
GFS Noah
EnKF
Pros: GFS can demonstrate SM impact on forecasts GFS may take advantage of satellite SM obs earlier than
full scale implementation Cons: Hardwiring limits more flexibility for assimilating other
observational data

X. Zhan, 11th JCSDA Workshop, College Park, MD, June 6, 2013 23
Assimilation of MW SM into NCEP GFS
Time: DA at 00z
from April 1 – May 5, 2012
Data: SMOPS Blended Surface SM
Method: EnKF DA within GFS/GSI
Experiments: CTL: Regular GFS run without SM DA EnKF: Daily EnKF run
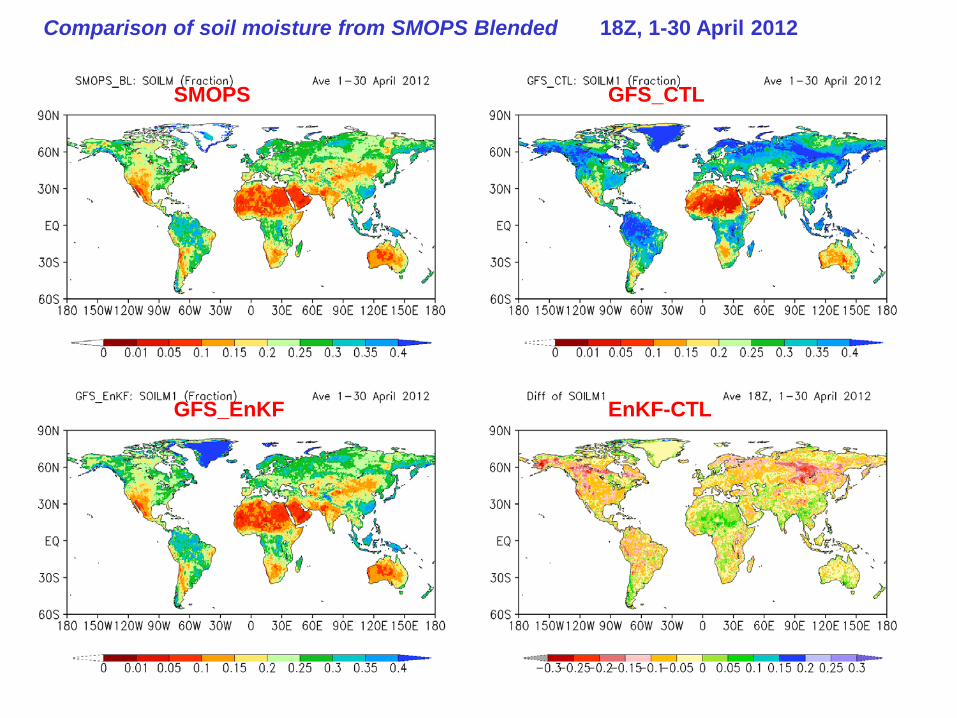
Comparison of soil moisture from SMOPS Blended 18Z, 1-30 April 2012
GFS_EnKF EnKF-CTL
GFS_CTL SMOPS

Comparison of soil moisture from SMOPS Blended 18Z, 1-30 April 2012
SMOPS GFS_CTL
GFS_EnKF EnKF-CTL

GFS Top Layer SM Validation With USDA-SCAN Measurements
1-30 of April, 2012
East CONUS (26 sites) West CONUS (25 sites) Whole CONUS
RMSE Bias Corr-Coef RMSE Bias Corr-
Coef RMSE Bias Corr-Coef
CTL 0.135 0.046 0.565 0.124 0.033 0.448 0.129 0.040 0.508
EnKF 0.130 -0.031 0.613 0.114 -0.021 0.549 0.123 -0.031 0.587
SMOPS 0.133 -0.055 0.601 0.098 -0.036 0.402 0.117 -0.048 0.524

- 0.36
- 0.43
Bias
RMSE

+ 0.004

700 hPa
1000 hPa
+ 0.003
+ 0.003

+ 0.002
+ 0.007
NHX
SHX

X. Zhan, 11th JCSDA Workshop, College Park, MD, June 6, 2013 31
OUTLINE Satellite Soil Moisture Data Products
SM Data Assimilation for Drought Monitoring
SM Data Assimilation for NCEP NWPs
Future Data Assimilation Plan

• S-NPP/JPSS data processing tools ready for input files of albedo, GVF, ST and LST to LIS (NLDAS/GLDAS)
Gridded ST EDR for day 12/31/2012
32
Assimilation of S-NPP/JPSS Land EDRs
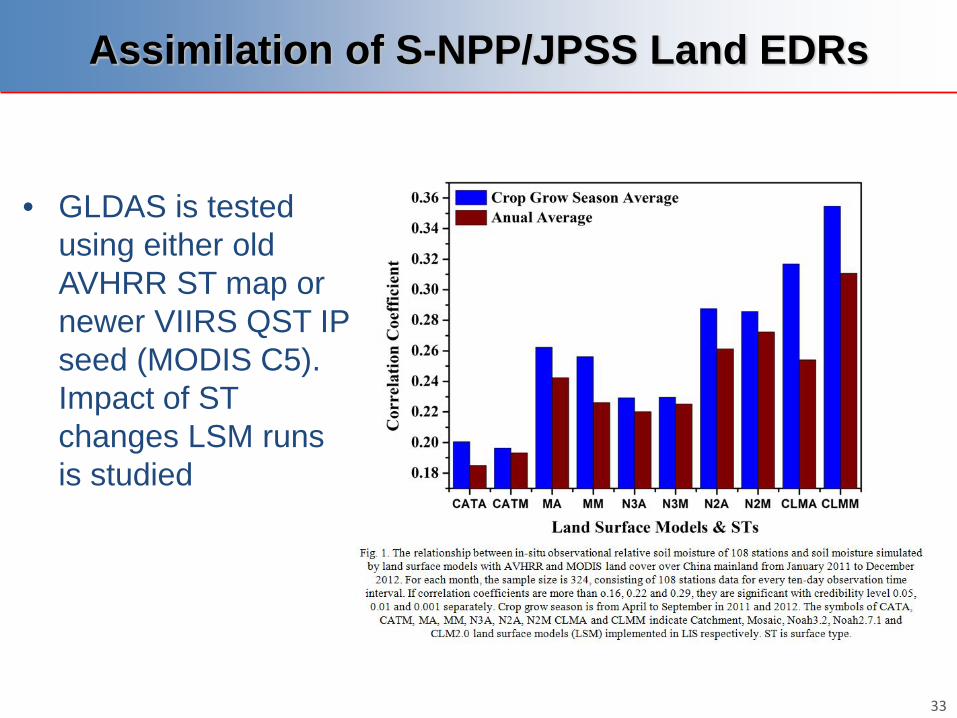
• GLDAS is tested using either old AVHRR ST map or newer VIIRS QST IP seed (MODIS C5). Impact of ST changes LSM runs is studied
33
Assimilation of S-NPP/JPSS Land EDRs

• NLDAS is being tested using either multi-year albedo average or NRT MODIS monthly values
a) Original Vegetation Type-dependent Albedo
b) Satellite-based MODIS Albedo
34
Assimilation of S-NPP/JPSS Land EDRs

X. Zhan, 11th JCSDA Workshop, College Park, MD, June 6, 2013 35
Many satellite land data products are ready for
NWP model assimilation
Drought monitoring could be significantly enhanced by dual assimilation of both MW and TIR soil moisture observations
GFS forecasts are improved by assimilating SMOPS daily soil moisture products
More land data could be tested if ……
SUMMARY

X. Zhan, 11th JCSDA Workshop, College Park, MD, June 6, 2013 36
Thanks ……