nestlé, mobilising people to implement change dealing with ... · pdf filerwanda -...
TRANSCRIPT
Rwanda
Consulting Abroad Program
Spring 2012
By John Brittell

Agenda
• MacroView
• Agricultural Sector
Overview
• Value Chain
Analysis – Kenya
• Value Chain
Analysis – Rwanda
• Appendix
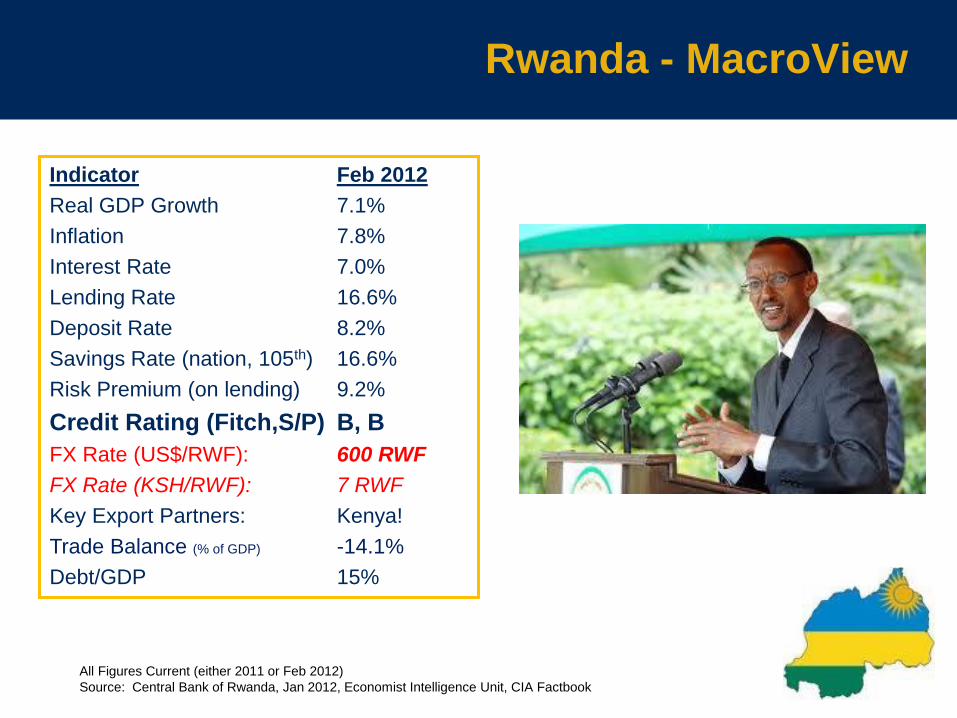
Rwanda - MacroView
All Figures Current (either 2011 or Feb 2012)
Source: Central Bank of Rwanda, Jan 2012, Economist Intelligence Unit, CIA Factbook
Indicator Feb 2012
Real GDP Growth 7.1%
Inflation 7.8%
Interest Rate 7.0%
Lending Rate 16.6%
Deposit Rate 8.2%
Savings Rate (nation, 105th) 16.6%
Risk Premium (on lending) 9.2%
Credit Rating (Fitch,S/P) B, B
FX Rate (US$/RWF): 600 RWF
FX Rate (KSH/RWF): 7 RWF
Key Export Partners: Kenya!
Trade Balance (% of GDP) -14.1%
Debt/GDP 15%

Rwanda – MacroView FX Rates
Source: EIU Rwanda 2012, Oanda.com
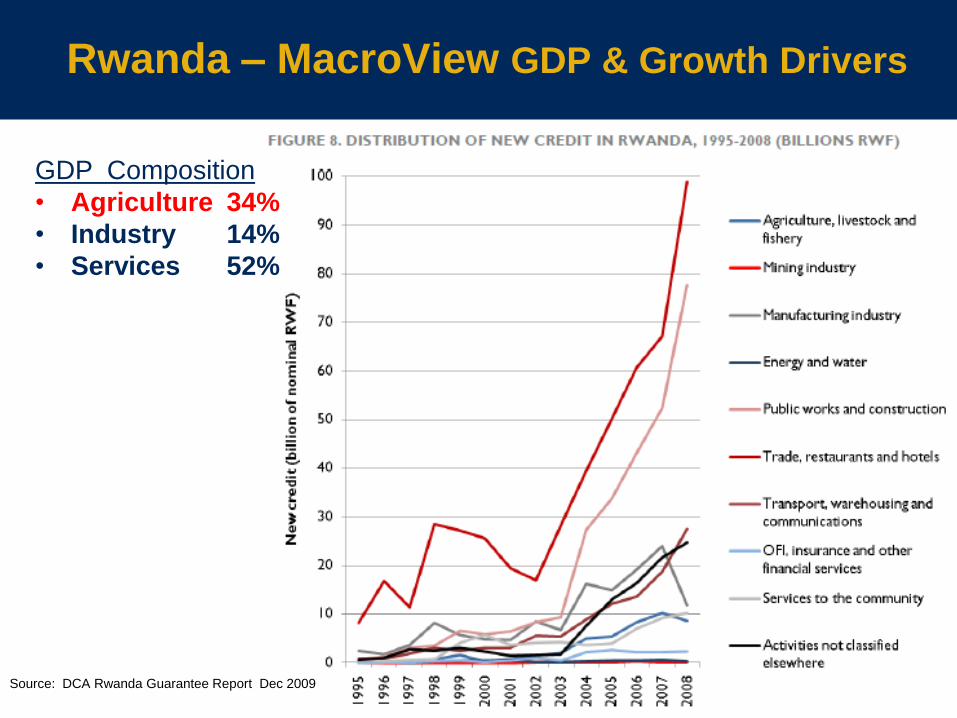
Rwanda – MacroView GDP & Growth Drivers
GDP Composition
• Agriculture 34%
• Industry 14%
• Services 52%
Source: DCA Rwanda Guarantee Report Dec 2009

Rwanda – MacroView Exports
Source: EIU Rwanda 2012

Rwanda – MacroView Social
• Population (2009 Census) *11.4 million people, 81% rural, 2.8% growth rate
overall, 8.2% urban growth rate; *400 pple/sqkm! The
most dense country in Africa…
• Age Demographic: youth < 14yrs are
> 41% of population
• Labor: xx% unemployment rate. xx% of formal
employment and more than xx% of informal
employment in agriculture
• Income distribution:
• Education: Mostly agrarian. 70% literacy rate
(men 76%, women 64%), 96% primary school
enrollment
• Societies: cooperatives limited

Agriculture Sector Overview

Agricultural Sector Overview
• Agriculture Products: coffee, tea, pyrethrum
(insecticide made from chrysanthemums), bananas,
beans, sorghum, potatoes; livestock
• Challenges: land degradation, overuse, and
fragmentation
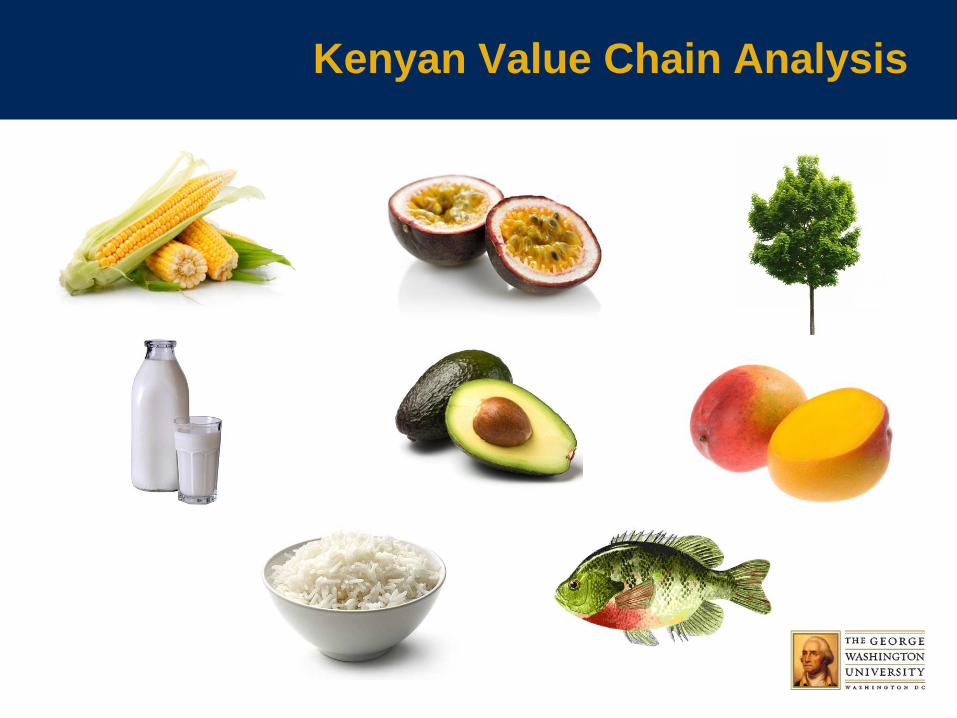
Kenyan Value Chain Analysis

USAID’s Value Chain Analysis
What Does Value Chain Analysis Entail Per USAID?
• In identifying opportunities for upgrading and the constraints to these
opportunities, the analysis should focus on answering the following
questions:
• What and where are the market opportunities?
• What upgrading is needed to exploit them?
• Who will benefit from this upgrading?
• Who has the resources, skills and incentives to drive upgrading?
• Why has it not happened already?
• What will it take to make it happen?
Kenyan Dairy Value Chain
Kenyan Dairy Value Chain
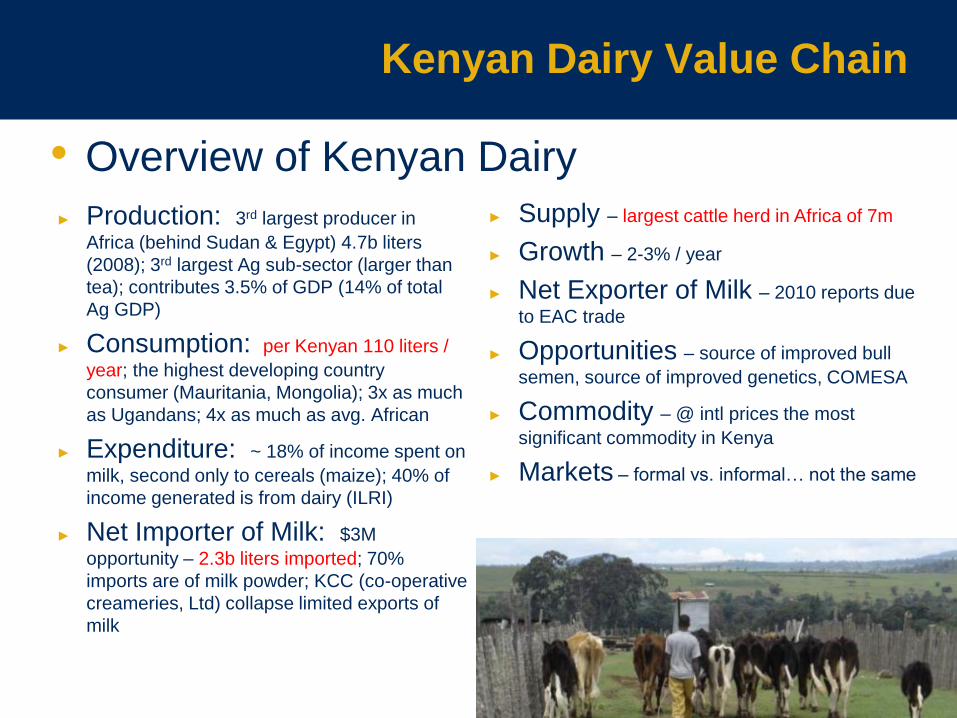
► Production: 3rd largest producer in
Africa (behind Sudan & Egypt) 4.7b liters
(2008); 3rd largest Ag sub-sector (larger than
tea); contributes 3.5% of GDP (14% of total
Ag GDP)
► Consumption: per Kenyan 110 liters /
year; the highest developing country
consumer (Mauritania, Mongolia); 3x as much
as Ugandans; 4x as much as avg. African
► Expenditure: ~ 18% of income spent on
milk, second only to cereals (maize); 40% of
income generated is from dairy (ILRI)
► Net Importer of Milk: $3M
opportunity – 2.3b liters imported; 70%
imports are of milk powder; KCC (co-operative
creameries, Ltd) collapse limited exports of
milk
► Supply – largest cattle herd in Africa of 7m
► Growth – 2-3% / year
► Net Exporter of Milk – 2010 reports due
to EAC trade
► Opportunities – source of improved bull
semen, source of improved genetics, COMESA
► Commodity – @ intl prices the most
significant commodity in Kenya
► Markets – formal vs. informal… not the same
• Overview of Kenyan Dairy

Kenyan Dairy Value Chain
► Employment: husbandry skills low; but
milk bars, mini-dairies, processors, cooling
plants, cottage industries all offer employment
(account for 3.5% of GDP); 1.8m dairy farms
or 35% of rural households
► Efficiency of local production
compared to global averages
(yield gap): yields per cow in US ~
9,000 kg / year; SA & Argentina ~ 2,500 to
3,500 kg / year; Kenya ~ 670 kg / year
(NewKCC) ~ 564 kg / year by FAO
► Geography of production: 53% in
Rift Valley, 25% in Central Province
► Major players: NewKCC, Brookside
Dairy, SpinKnit, Githunguru account for 92%
of market
• Constraints ► Regulation – heavy with very low support
for artificial insemination (improved bull
semen) and veterinary services
► Capacity - smallholder (2-3 cows) farms
produce 80% supply, low per farmer
production – supply to processors shady
► Quality – is poor; adoption of technology
low
► Costs – high production costly, processing
and packaging costs high and preclude
investment
► Investments – weather to volatile; price
premium for chilled milk
• Overview of Kenyan Dairy

Kenyan Dairy Value Chain
VC Point Inputs Production Transport / Bulking / Cooling
Distribution / Processing
Marketing / Distribution
Stakeholders Who is doing this?
- Cows, Goats, Camels of good breed
- Land & Water - Limited feed supply (no
napier grass), - Little vet services, - Structure/ housing - Waste management
- 80% from small (1-4 cows) holder farmers
- Produce 3.2b liters (2005) ~32% of this enters formal market (based on rainy seasons x2)
- Zero grazing = lower production due to feed
- Semi and Open range grazing offer 15-30liters per day
- milk marketed (2005)increased by 21.2% to over 1 billion liters
- Low technology adoption
- 85% milk is fresh, 3% yogurt, fermented 7%, 2% value added products (cheese, butter)
- 75% of total costs of production; 90% variable costs
- ~ 20-25% of total marketed milk sold through formal processors; remainder goes through informal sector
- 34 registered processors (>80% market controlled by 3 companies NewKCC (39%), Brookside (31%), SpinKnit (13%)
- Kakuzi (largest one) - New packaging brings
price point lower (250ml and 500ml = 25% lower price point)
- Sustainable Distribution system: via bikes!
Financing Needs that have/have not been met
- Feeding (nutrient intake) - Purchase of land to
prevent Common land grazing; also to seed feed (napier grass)
- Access to water
- Access to improved breeding (AI – artificial insemination); lower costs to semen
- Transportation from Farmer to Cooler/Processor
- Cooling centers a must in bank loans to farmers; largest problem in supply chain
- Large players only utilize 30-40% capacity; Brookside the exception @ 70% capacity utilization
- Consumption happens in small quantities, typically for tea drinking
- Raw milk ‘better’ for Kenyans
- Boiling is ‘good enough’ over pasteurized milk
- Transportation
Additional Info/Notes
- Fodder preservation smoothens milk flows
- New technology (by ICIPE) controls crop pests affecting dairy
Suppliers - Animal feed - Breeding / Vets - Dairy Equip - Farm Equip - Livestock Insurance
Other uses - Compost Manure - Biogas
- Center for Development Enterprises
- EADD Kenya (east Africa dairy development)
- Heifer Intl.

Kenyan Dairy Value Chain
Farmer (Producer)
• Spread: 13-20 Ksh / lliter
Transporter or Hawker
• Spread: 4-5 Ksh / liter
Bulking & Cooling
• Spread: 2 Ksh / liter
Distribution
• Spread: n/a
Processing
• Spread: 14-25 Ksh / liter
Marketing & Distribution
• Spread: 1-2 Ksh / liter
Consumption
• Price: 30-60 Ksh / liter
Rwanda Dairy Value Chain
Rwanda Dairy Value Chain
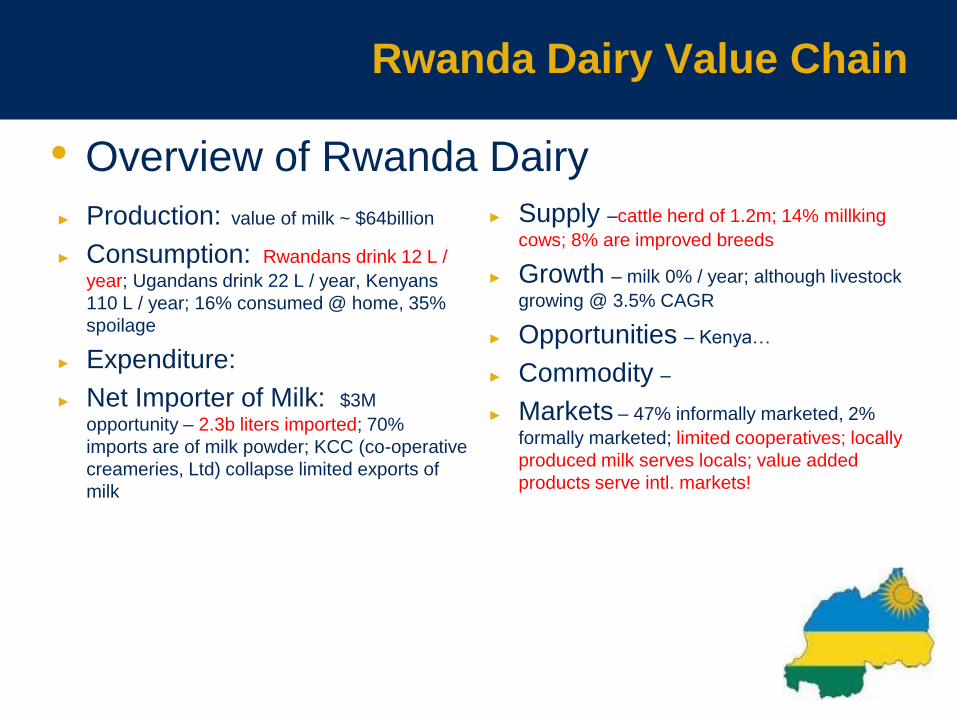
► Production: value of milk ~ $64billion
► Consumption: Rwandans drink 12 L /
year; Ugandans drink 22 L / year, Kenyans
110 L / year; 16% consumed @ home, 35%
spoilage
► Expenditure:
► Net Importer of Milk: $3M
opportunity – 2.3b liters imported; 70%
imports are of milk powder; KCC (co-operative
creameries, Ltd) collapse limited exports of
milk
► Supply –cattle herd of 1.2m; 14% millking
cows; 8% are improved breeds
► Growth – milk 0% / year; although livestock
growing @ 3.5% CAGR
► Opportunities – Kenya…
► Commodity –
► Markets – 47% informally marketed, 2%
formally marketed; limited cooperatives; locally
produced milk serves locals; value added
products serve intl. markets!
• Overview of Rwanda Dairy
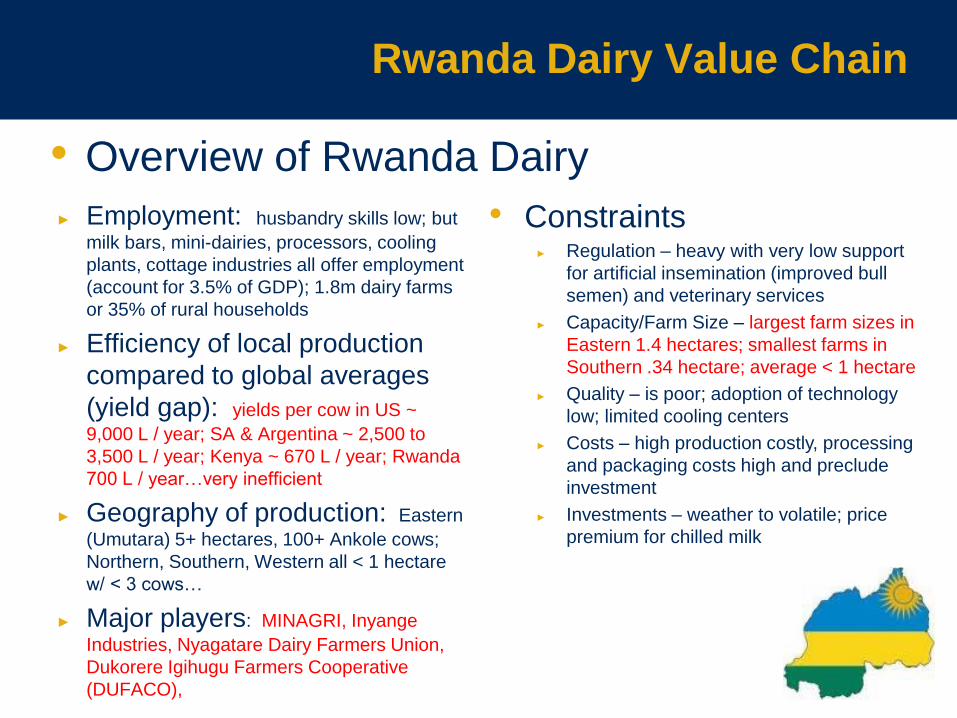
Rwanda Dairy Value Chain
► Employment: husbandry skills low; but
milk bars, mini-dairies, processors, cooling
plants, cottage industries all offer employment
(account for 3.5% of GDP); 1.8m dairy farms
or 35% of rural households
► Efficiency of local production
compared to global averages
(yield gap): yields per cow in US ~
9,000 L / year; SA & Argentina ~ 2,500 to
3,500 L / year; Kenya ~ 670 L / year; Rwanda
700 L / year…very inefficient
► Geography of production: Eastern
(Umutara) 5+ hectares, 100+ Ankole cows;
Northern, Southern, Western all < 1 hectare
w/ < 3 cows…
► Major players: MINAGRI, Inyange
Industries, Nyagatare Dairy Farmers Union,
Dukorere Igihugu Farmers Cooperative
(DUFACO),
• Constraints ► Regulation – heavy with very low support
for artificial insemination (improved bull
semen) and veterinary services
► Capacity/Farm Size – largest farm sizes in
Eastern 1.4 hectares; smallest farms in
Southern .34 hectare; average < 1 hectare
► Quality – is poor; adoption of technology
low; limited cooling centers
► Costs – high production costly, processing
and packaging costs high and preclude
investment
► Investments – weather to volatile; price
premium for chilled milk
• Overview of Rwanda Dairy
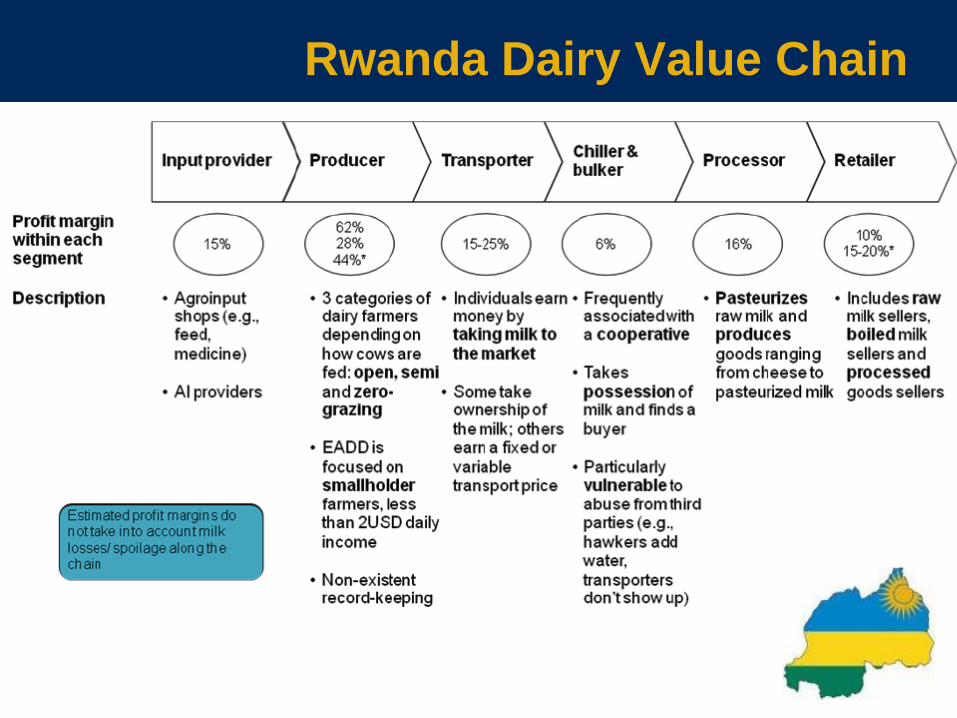
Rwanda Dairy Value Chain
Rwanda Dairy Value Chain
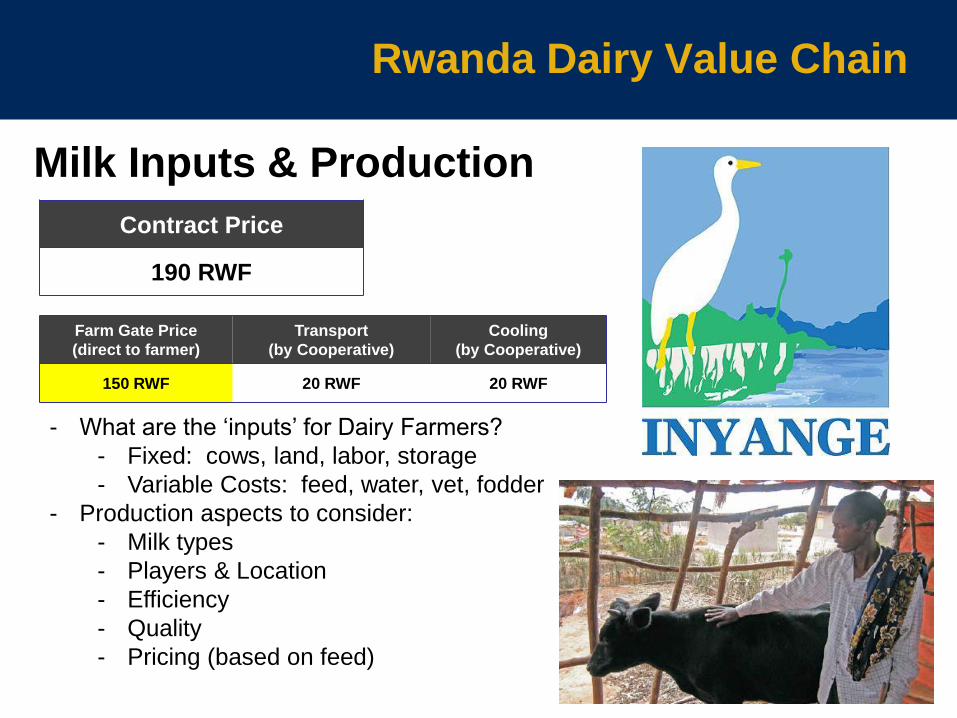
Farm Gate Price
(direct to farmer)
Transport
(by Cooperative)
Cooling
(by Cooperative)
150 RWF 20 RWF 20 RWF
Contract Price
190 RWF
Milk Inputs & Production
- What are the ‘inputs’ for Dairy Farmers?
- Fixed: cows, land, labor, storage
- Variable Costs: feed, water, vet, fodder
- Production aspects to consider:
- Milk types
- Players & Location
- Efficiency
- Quality
- Pricing (based on feed)

Rwanda Dairy Value Chain
Transportation (I) – bicycle vs…

Rwanda Dairy Value Chain
Transportation (I) – …commercial
Rwanda Dairy Value Chain
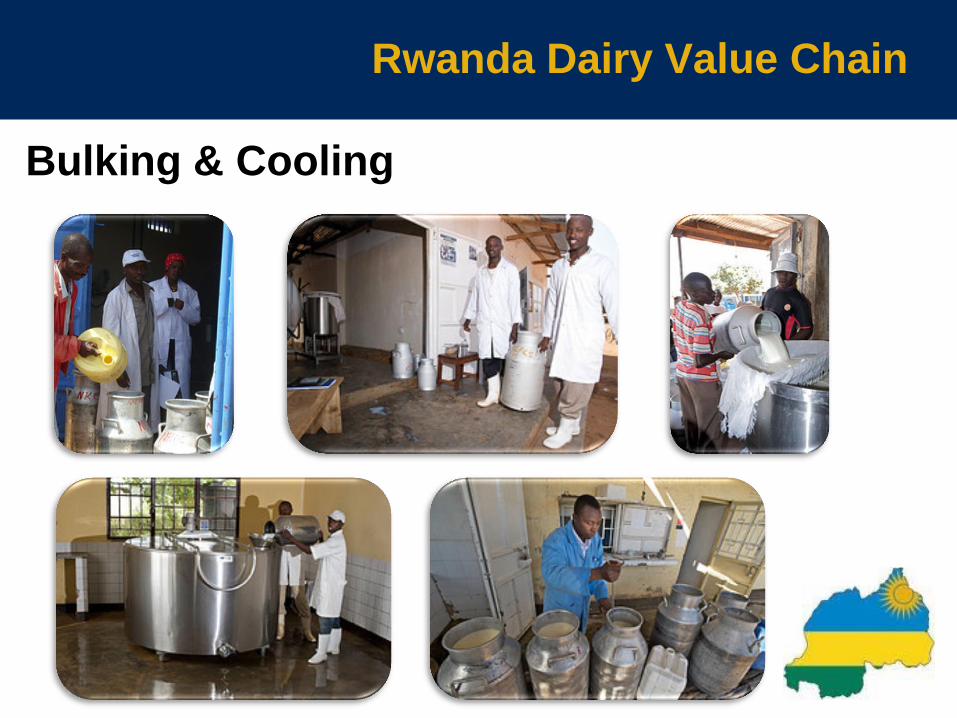
Bulking & Cooling
Rwanda Dairy Value Chain
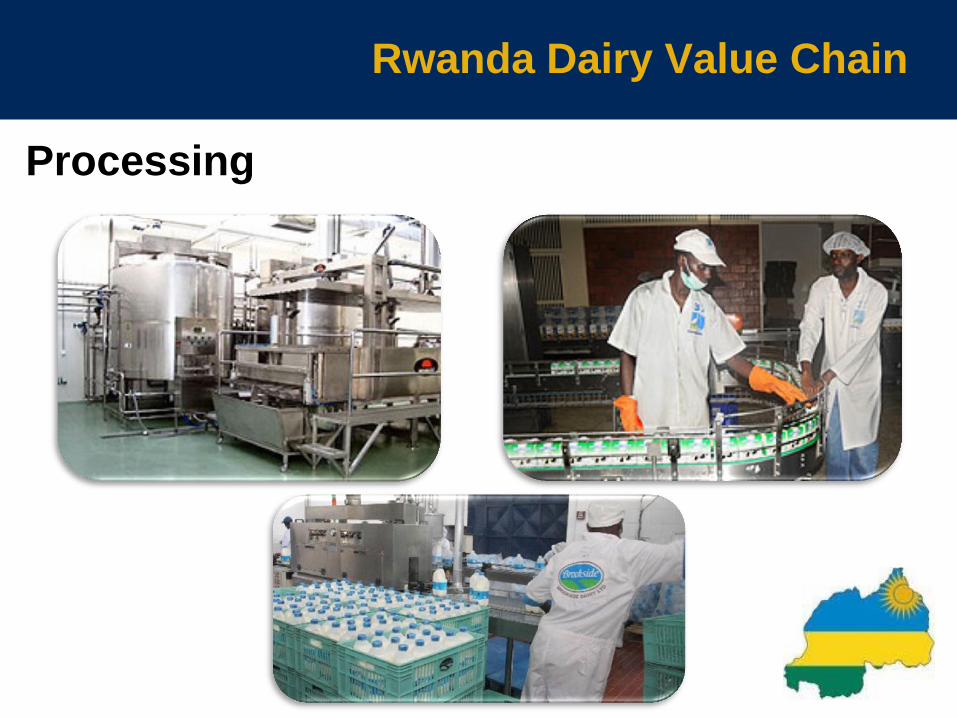
Processing

Rwanda Dairy Value Chain
Milk Vendor Location ?
Retail Vendors
Rwanda Dairy Value Chain
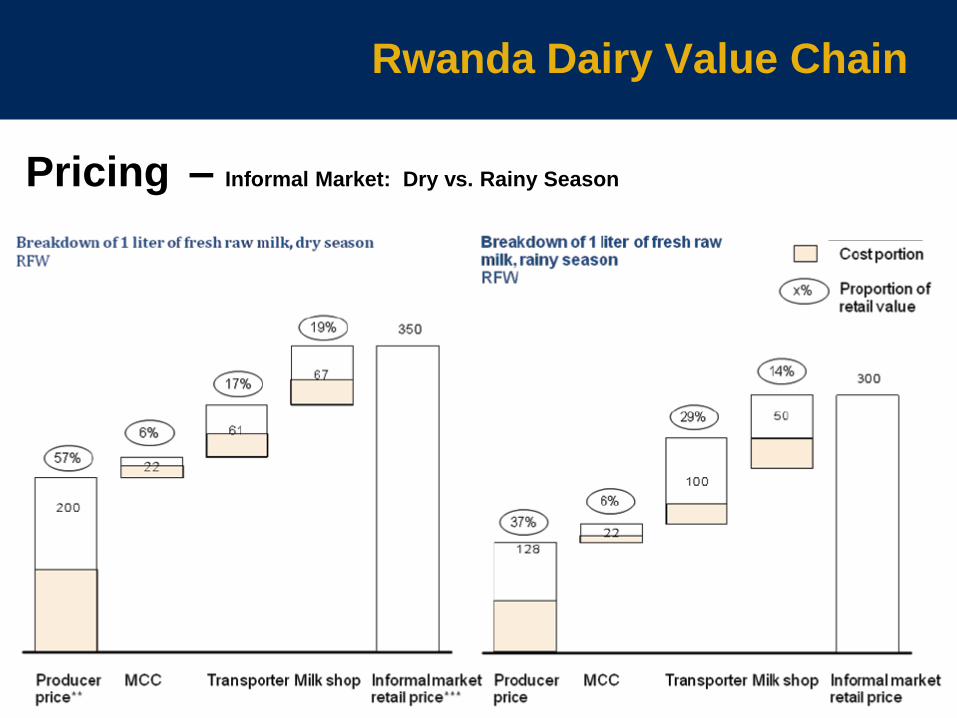
Pricing – Informal Market: Dry vs. Rainy Season

Rwanda Dairy Value Chain
Pricing – Formal Market: All Seasons
Rwanda Dairy Value Chain
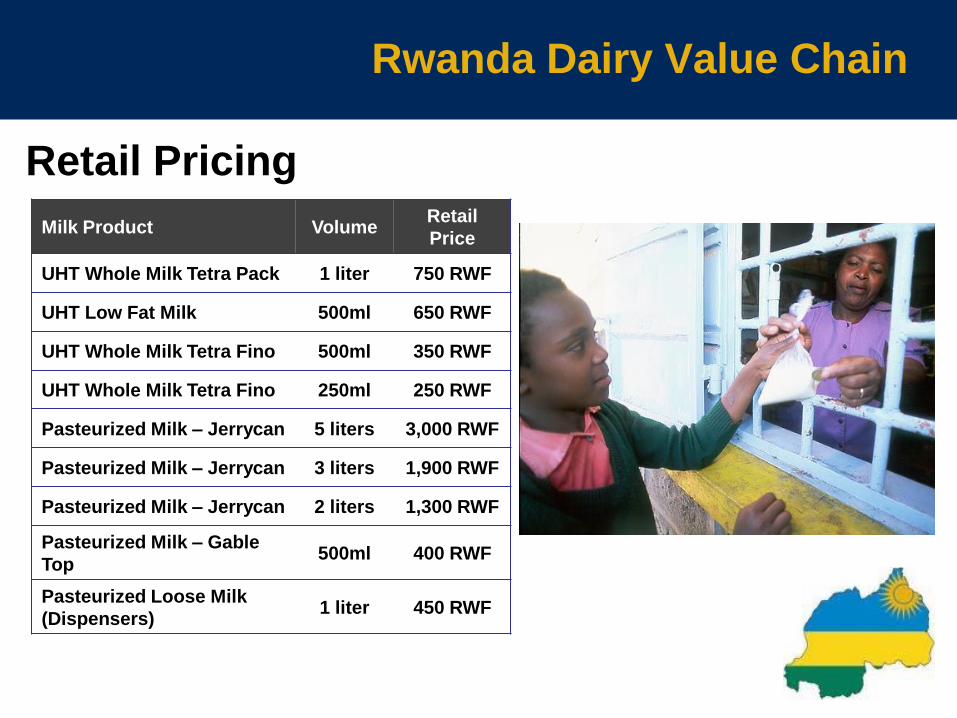
Milk Product Volume Retail
Price
UHT Whole Milk Tetra Pack 1 liter 750 RWF
UHT Low Fat Milk 500ml 650 RWF
UHT Whole Milk Tetra Fino 500ml 350 RWF
UHT Whole Milk Tetra Fino 250ml 250 RWF
Pasteurized Milk – Jerrycan 5 liters 3,000 RWF
Pasteurized Milk – Jerrycan 3 liters 1,900 RWF
Pasteurized Milk – Jerrycan 2 liters 1,300 RWF
Pasteurized Milk – Gable
Top 500ml 400 RWF
Pasteurized Loose Milk
(Dispensers) 1 liter 450 RWF
Retail Pricing

Questions
Appendix

Kenyan Dairy Value Chain

Kenyan Dairy Value Chain
Margins Analysis

Dairy Case Study: BSMDP DfID
Business Services Market Development Project: Local Model
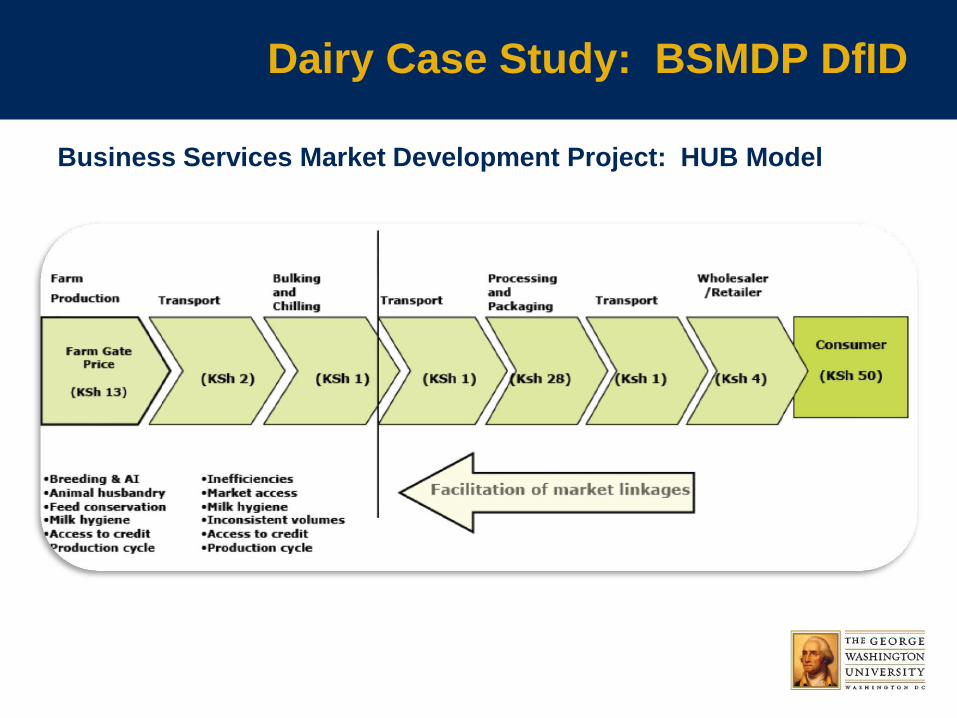
Dairy Case Study: BSMDP DfID
Business Services Market Development Project: HUB Model