net for hackers
TRANSCRIPT
.NET for Hackers Antonio “s4tan” Parata
Who am I
˃ A so/ware developer with passion for func:onal programming (F#)
˃ A so/ware security consultant ˃ Collaborate with OWASP Italy (Co-‐authored OWASP Tes:ng Guide v2 and v3)
˃ In the spare :me write so/ware (see hMp://nebula.tools) ˃ Currently working for Reply Communica:on Valley as head of the so/ware development team
Agenda
˃ Introduc:on to .NET ˃ Diassemble a binary ˃ How to debug .NET applica:on ˃ Using Reflec:on ˃ Decompila:on and an:-‐decompila:on tricks ˃ Profile API and extended Reflec:on ˃ Use case: reversing a malware
.NET CLR
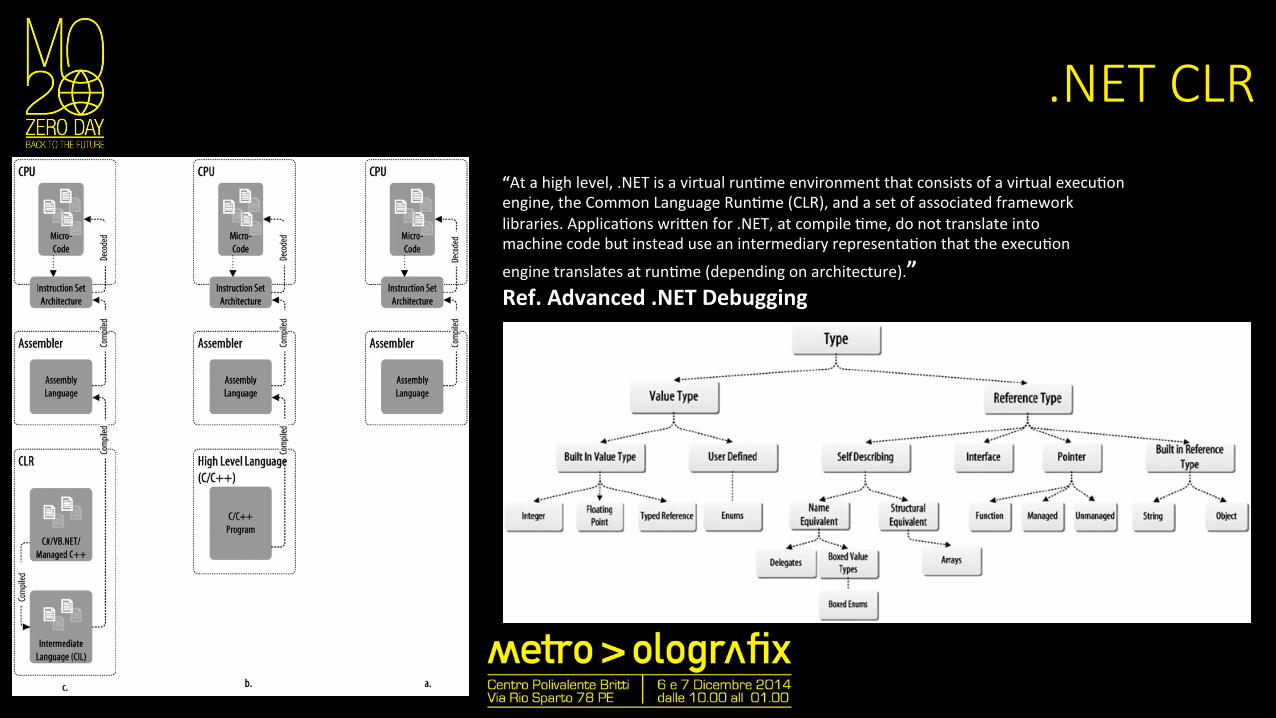
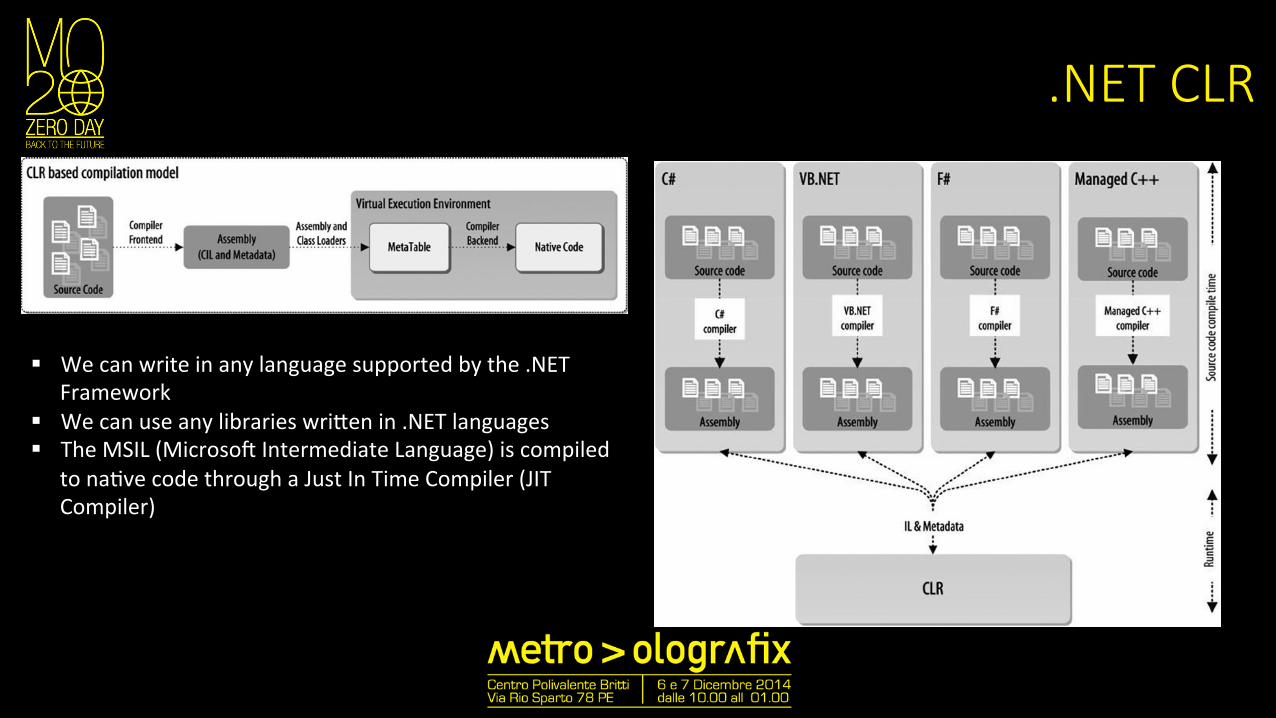
“At a high level, .NET is a virtual run:me environment that consists of a virtual execu:on engine, the Common Language Run:me (CLR), and a set of associated framework libraries. Applica:ons wriMen for .NET, at compile :me, do not translate into machine code but instead use an intermediary representa:on that the execu:on
engine translates at run:me (depending on architecture).” Ref. Advanced .NET Debugging
.NET CLR
§ We can write in any language supported by the .NET Framework
§ We can use any libraries wriMen in .NET languages § The MSIL (Microso/ Intermediate Language) is compiled
to na:ve code through a Just In Time Compiler (JIT Compiler)
.NET Assembly File format
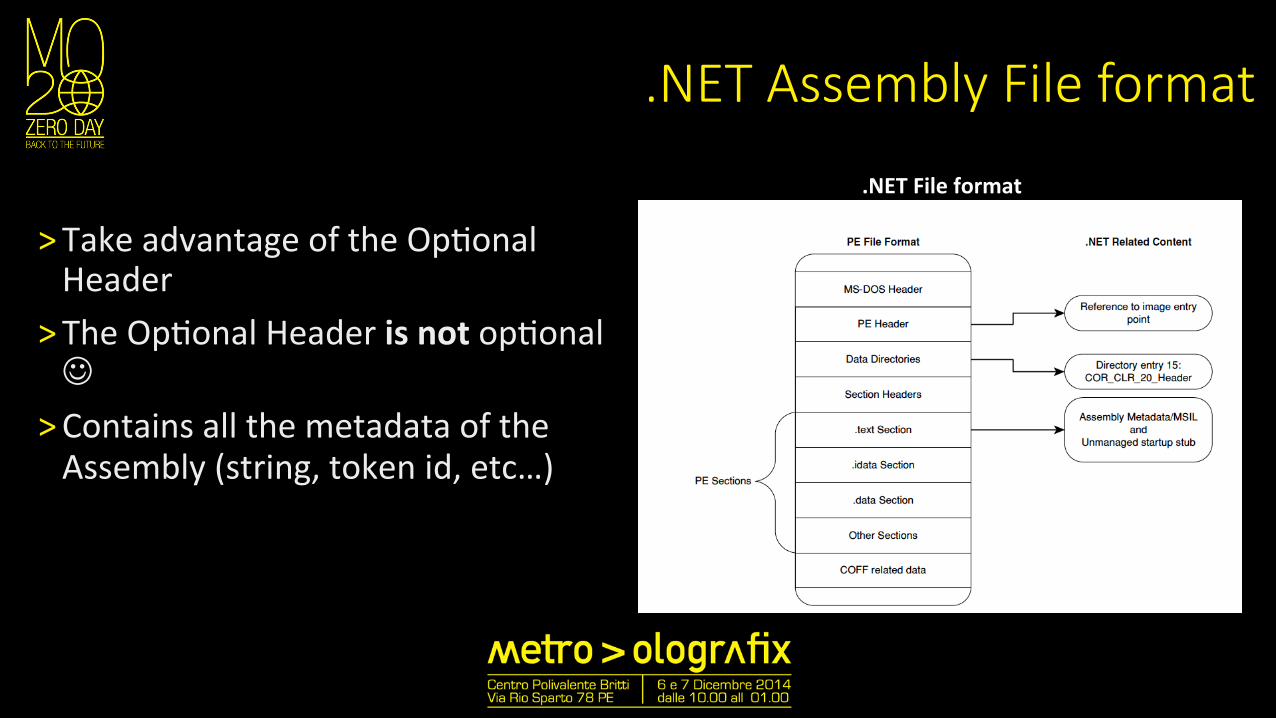
.NET File format
˃ Take advantage of the Op:onal Header
˃ The Op:onal Header is not op:onal J
˃ Contains all the metadata of the Assembly (string, token id, etc…)
.NET CLR Memory Model
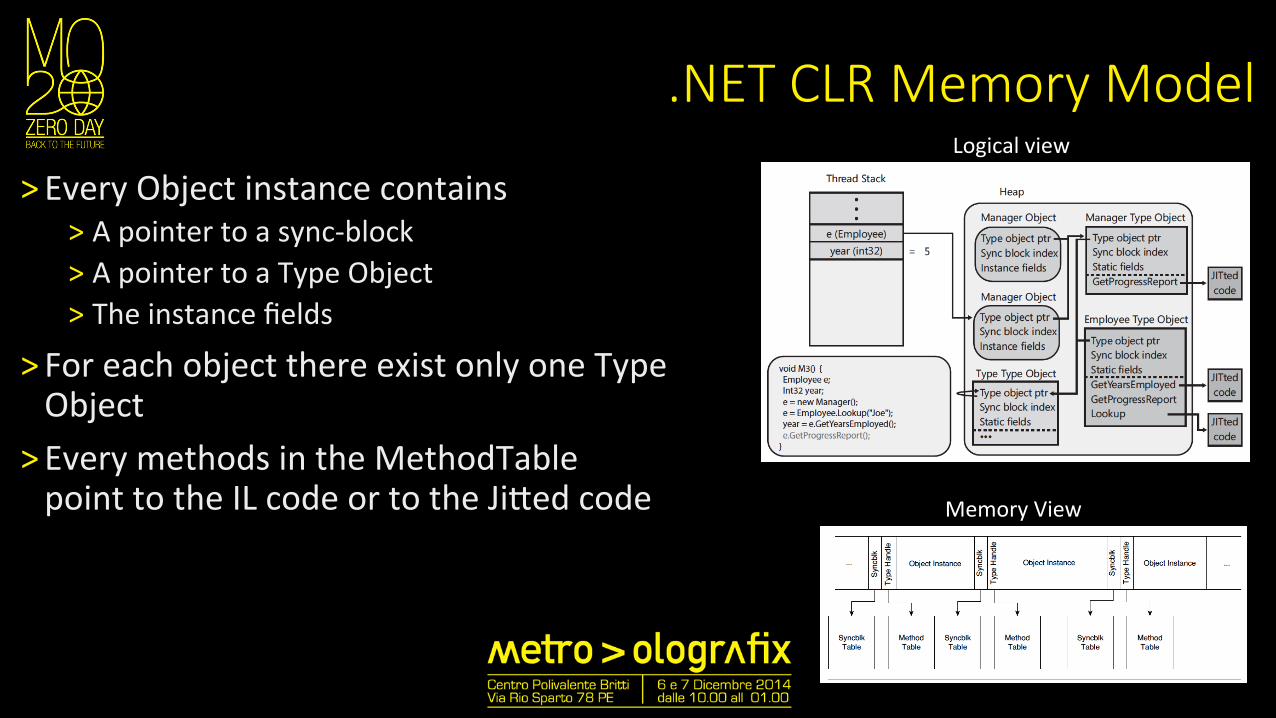
˃ Every Object instance contains ˃ A pointer to a sync-‐block ˃ A pointer to a Type Object ˃ The instance fields
˃ For each object there exist only one Type Object
˃ Every methods in the MethodTable point to the IL code or to the JiMed code Memory View
Logical view
.NET Just In Time CompilaEon
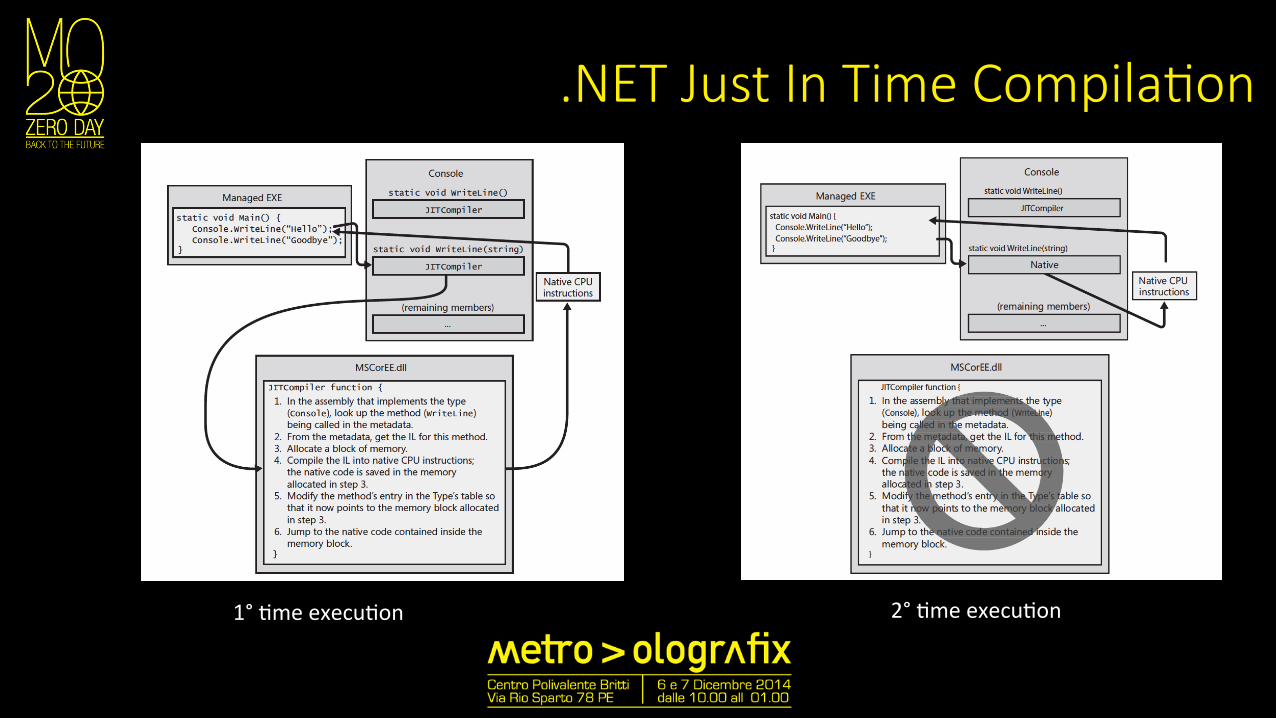
1° :me execu:on 2° :me execu:on
.NET CLR
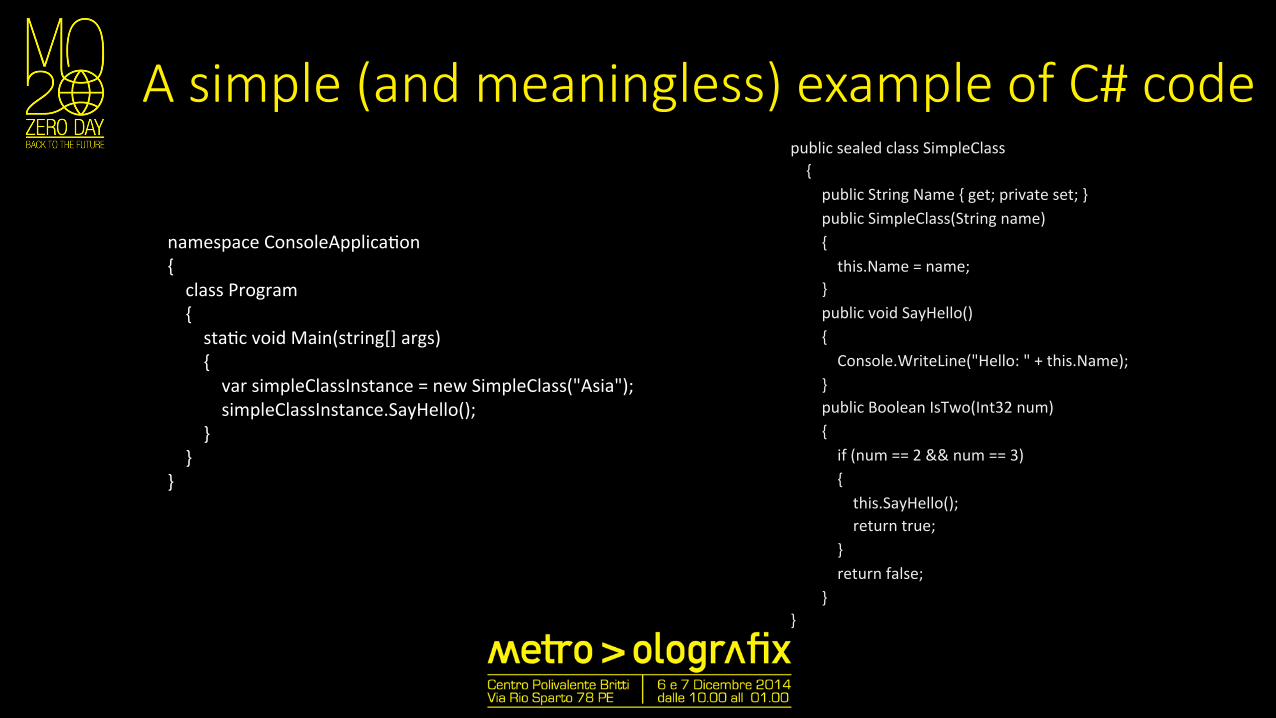
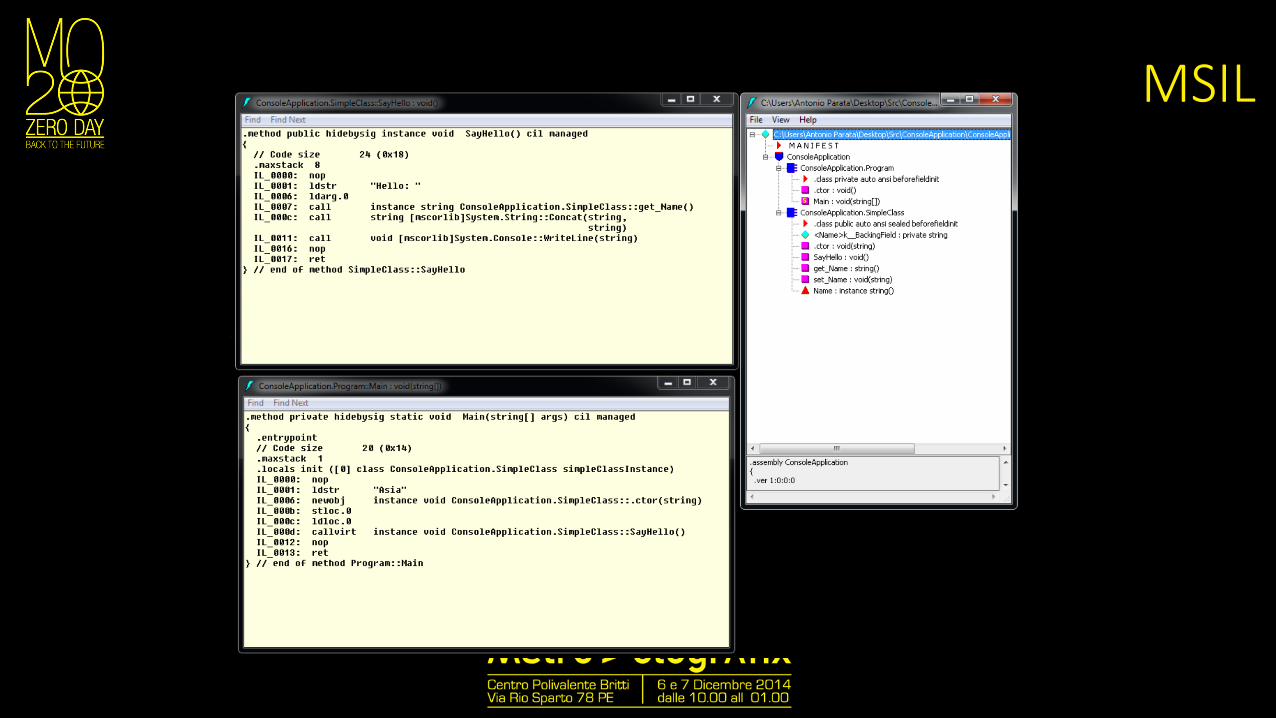
A simple (and meaningless) example of C# code
namespace ConsoleApplica:on { class Program { sta:c void Main(string[] args) { var simpleClassInstance = new SimpleClass("Asia"); simpleClassInstance.SayHello(); } } }
public sealed class SimpleClass { public String Name { get; private set; } public SimpleClass(String name) { this.Name = name; } public void SayHello() { Console.WriteLine("Hello: " + this.Name); } public Boolean IsTwo(Int32 num) { if (num == 2 && num == 3) { this.SayHello(); return true; } return false; } }
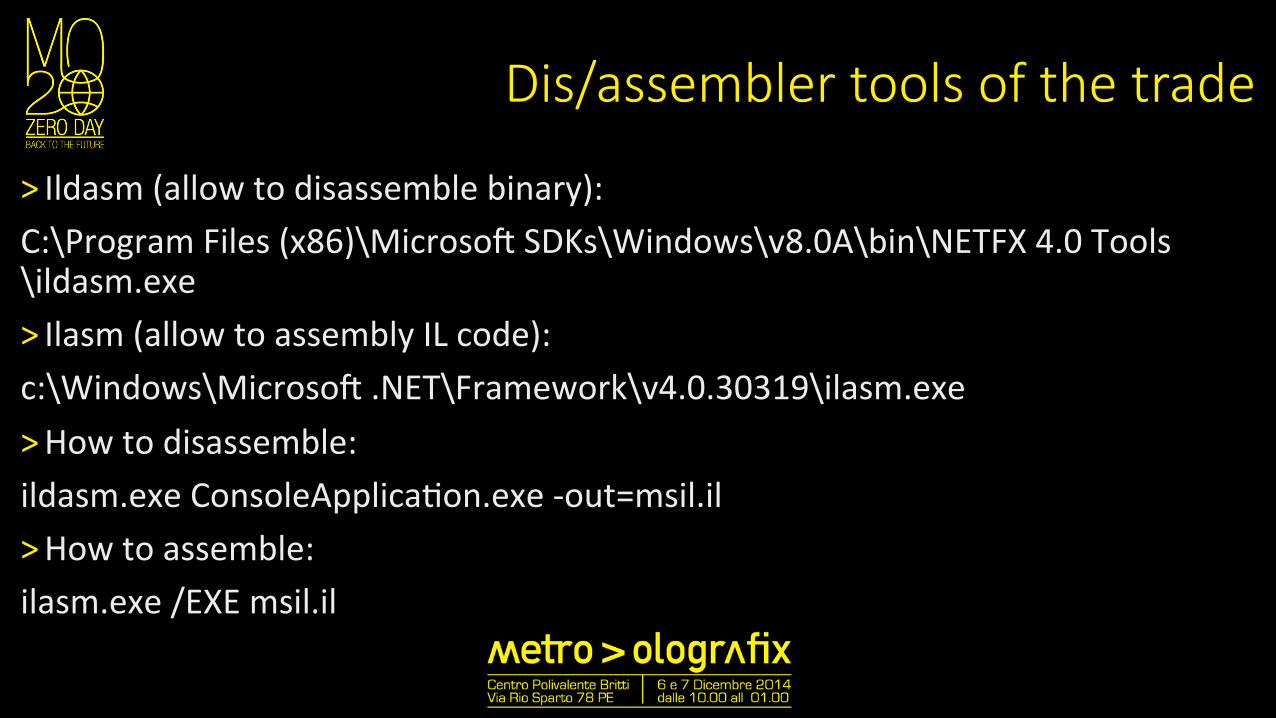
Dis/assembler tools of the trade
˃ Ildasm (allow to disassemble binary): C:\Program Files (x86)\Microso/ SDKs\Windows\v8.0A\bin\NETFX 4.0 Tools\ildasm.exe ˃ Ilasm (allow to assembly IL code): c:\Windows\Microso/ .NET\Framework\v4.0.30319\ilasm.exe ˃ How to disassemble: ildasm.exe ConsoleApplica:on.exe -‐out=msil.il ˃ How to assemble: ilasm.exe /EXE msil.il
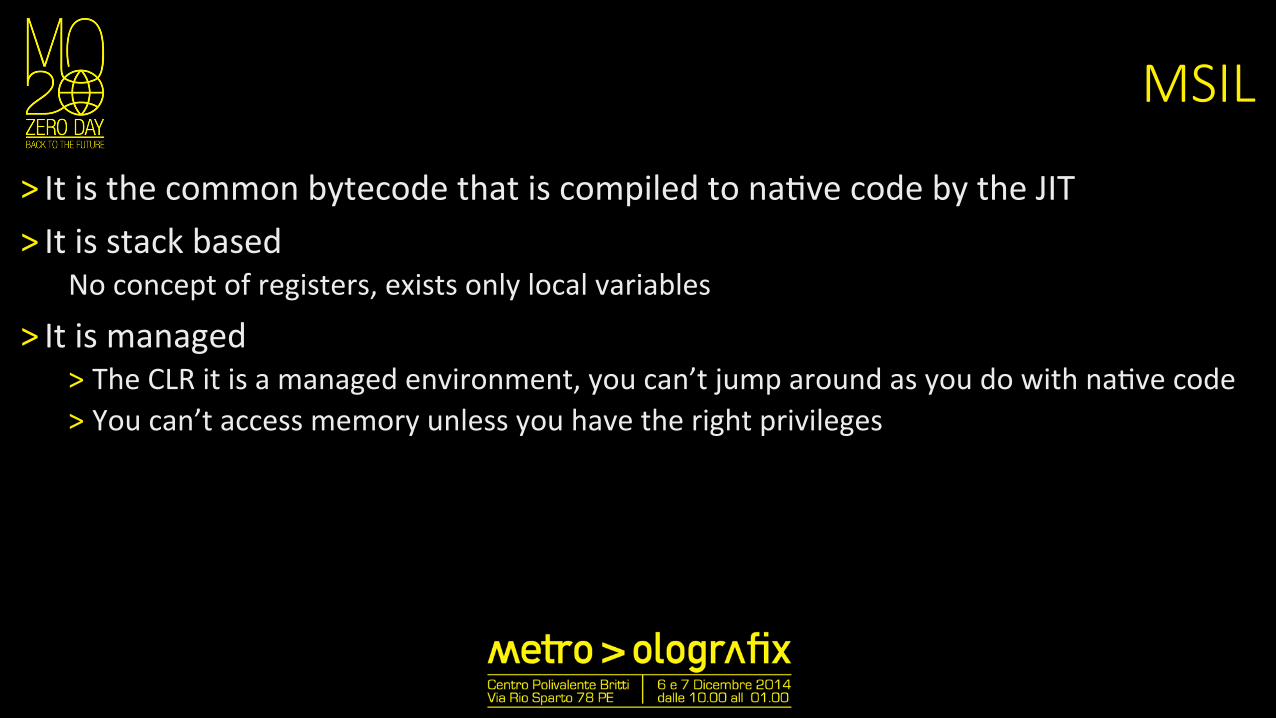
MSIL
˃ It is the common bytecode that is compiled to na:ve code by the JIT ˃ It is stack based
No concept of registers, exists only local variables
˃ It is managed ˃ The CLR it is a managed environment, you can’t jump around as you do with na:ve code ˃ You can’t access memory unless you have the right privileges
MSIL
.NET Debugging
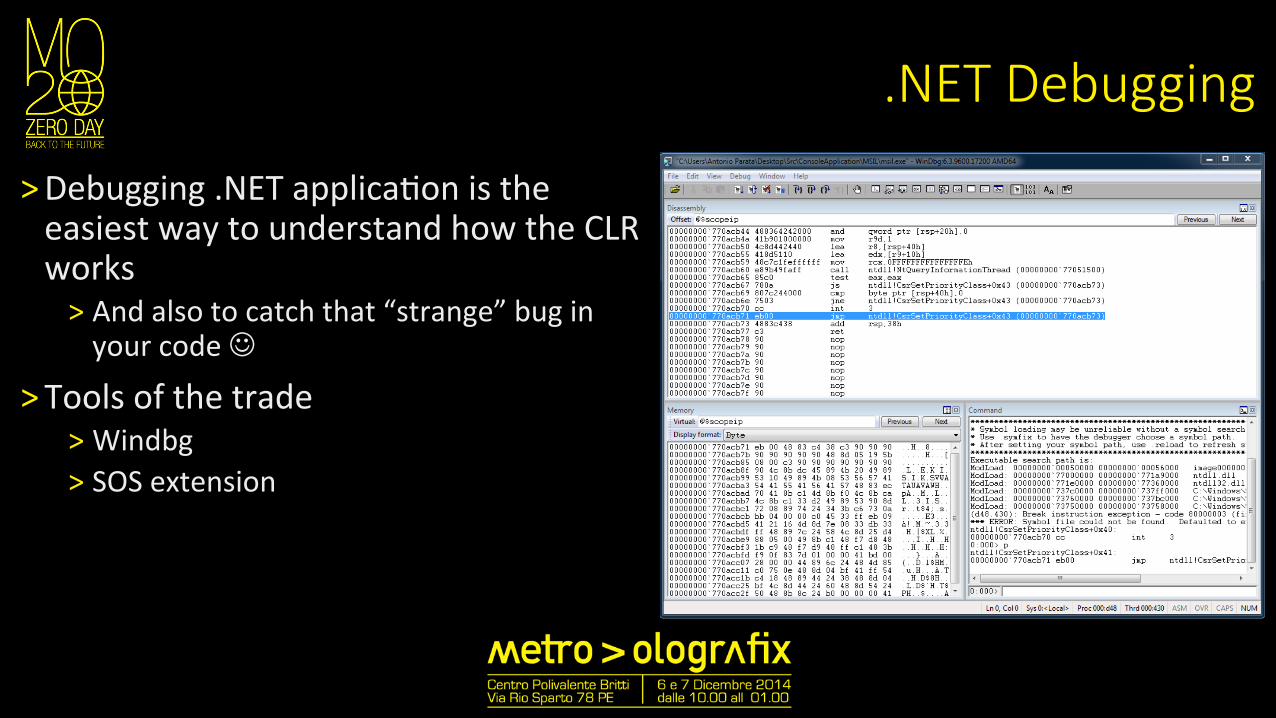
˃ Debugging .NET applica:on is the easiest way to understand how the CLR works ˃ And also to catch that “strange” bug in your code J
˃ Tools of the trade ˃ Windbg ˃ SOS extension
.NET Debugging
˃ In order to debug .NET program is necessary to load the SOS extension compa:ble with the version of the loaded CLR ˃ To do this list the loaded modules ˃ Iden:fy a CLR dll (like clrjit.dll) ˃ Use this dll to load the correct version of the SOS extension
˃ Use the .loadby command to load the SOS extension ˃ Eg. .loadby sos.dll clrjit (if the execu:on fails, run the command sxe ld clrjit.dll and than g to breakpoint at CLR loading)
.NET Debugging
˃ Some usefull command during your .NET sessione debugging ˃ !bpmd : set a breakpoint to a given method ˃ !ClrStack: show the current CLR stack ˃ !DumpDomain : show all the current available domains ˃ !DumpAssembly : show details about a specific assembly ˃ !DumpModule : show details about a specific module. The –mt op:on show also info on the MethodTable
˃ !DumpMt : show details about the specific method table. The –md op:on show also info on the methods available
˃ !DumpIL : show the MSIL code of the specified method
.NET Debugging – Demo
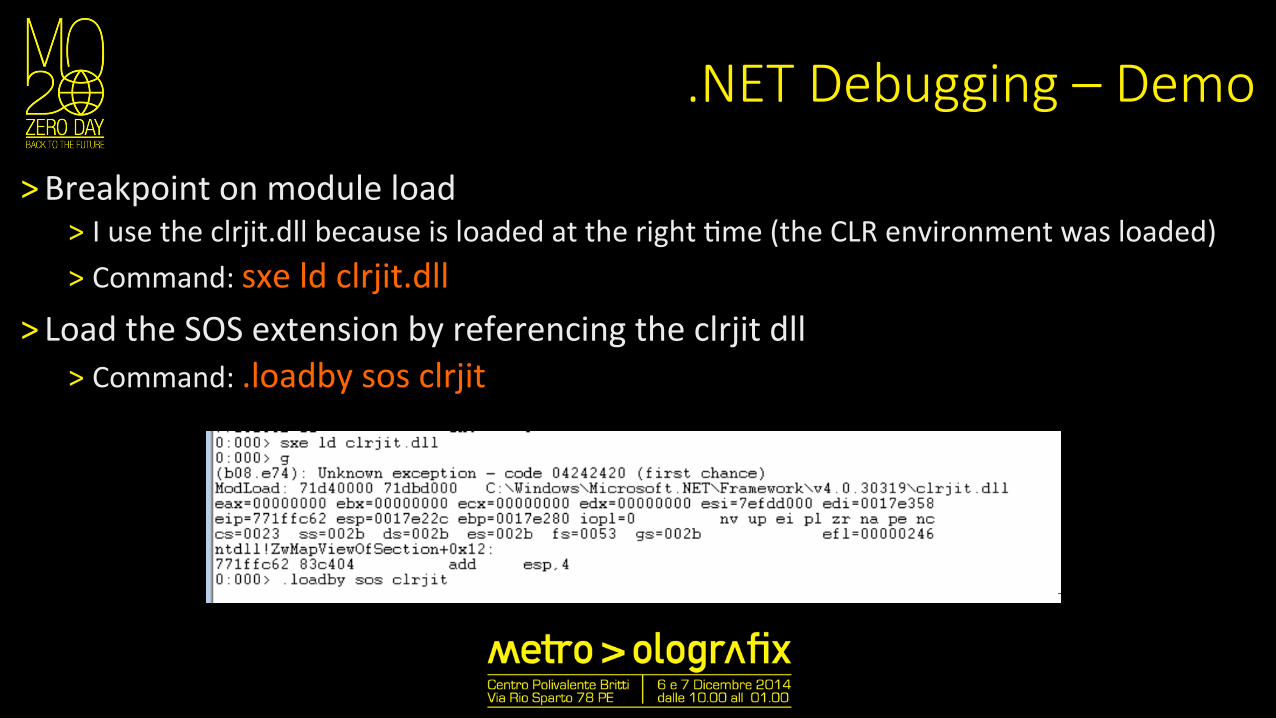
˃ Breakpoint on module load ˃ I use the clrjit.dll because is loaded at the right :me (the CLR environment was loaded) ˃ Command: sxe ld clrjit.dll
˃ Load the SOS extension by referencing the clrjit dll ˃ Command: .loadby sos clrjit
.NET Debugging – Demo
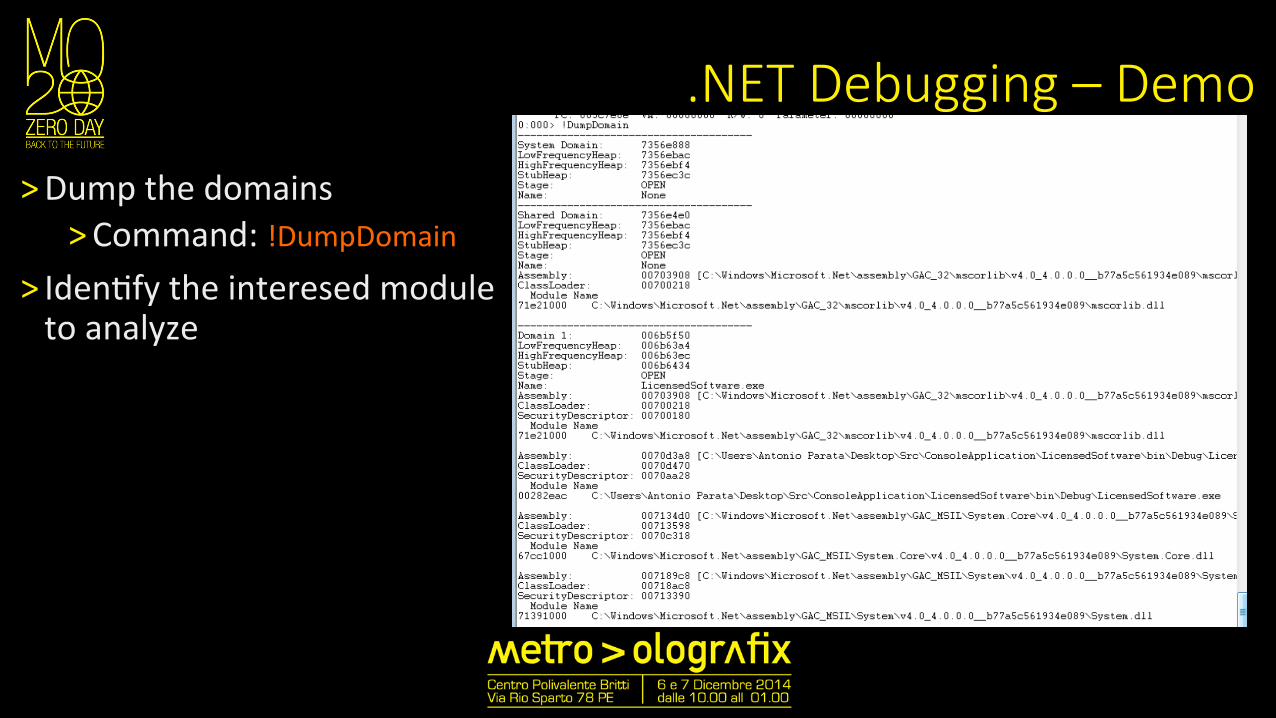
˃ Dump the domains ˃ Command: !DumpDomain
˃ Iden:fy the interesed module to analyze
.NET Debugging – Demo
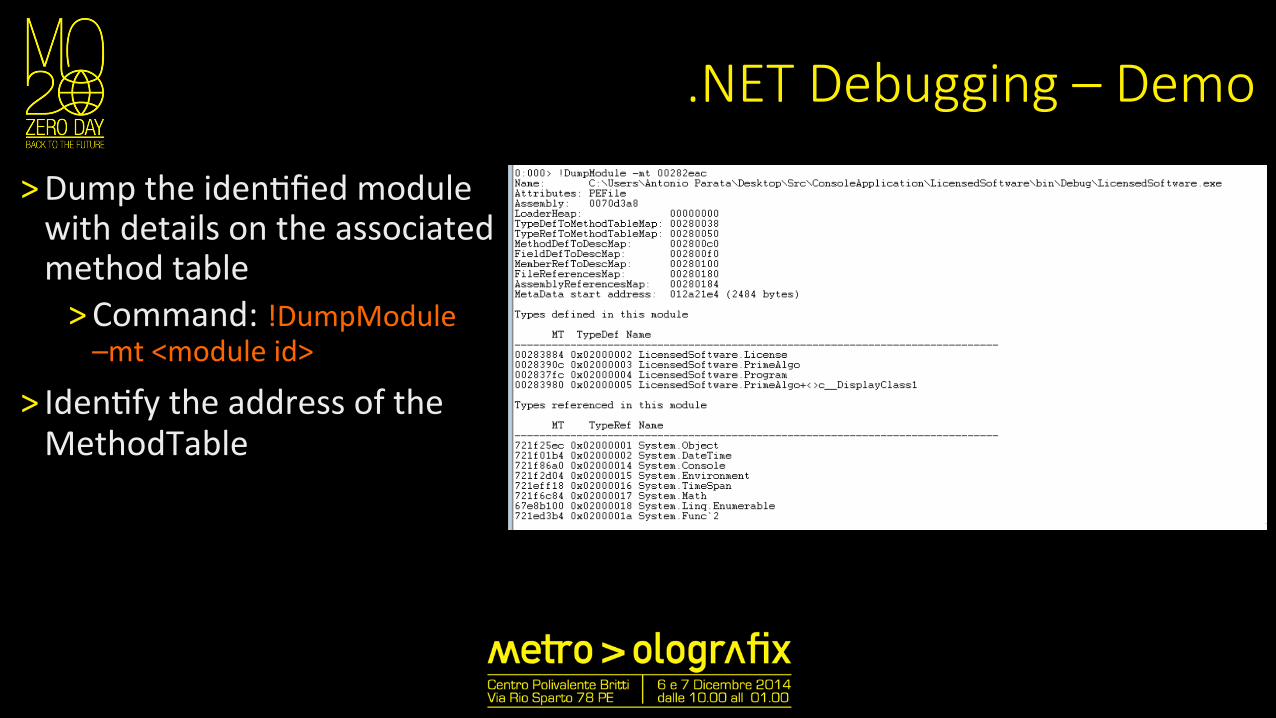
˃ Dump the iden:fied module with details on the associated method table ˃ Command: !DumpModule –mt <module id>
˃ Iden:fy the address of the MethodTable
.NET Debugging – Demo
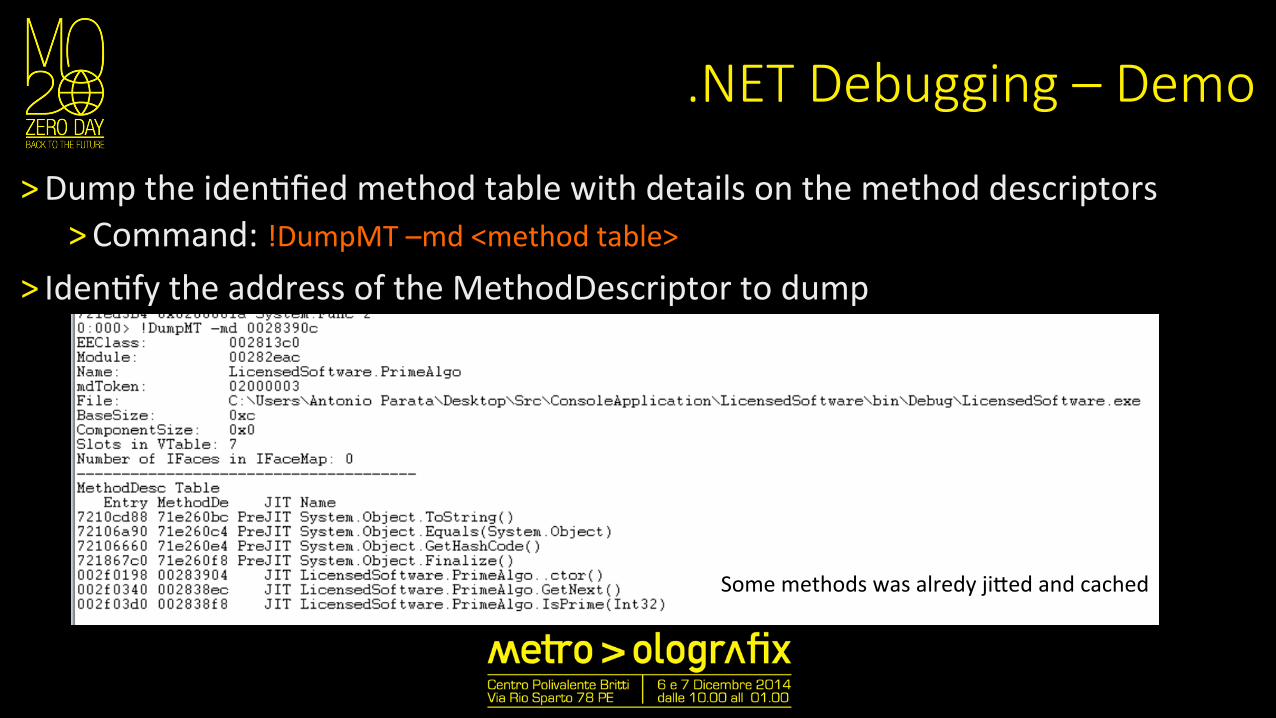
˃ Dump the iden:fied method table with details on the method descriptors ˃ Command: !DumpMT –md <method table>
˃ Iden:fy the address of the MethodDescriptor to dump
Some methods was alredy jiMed and cached
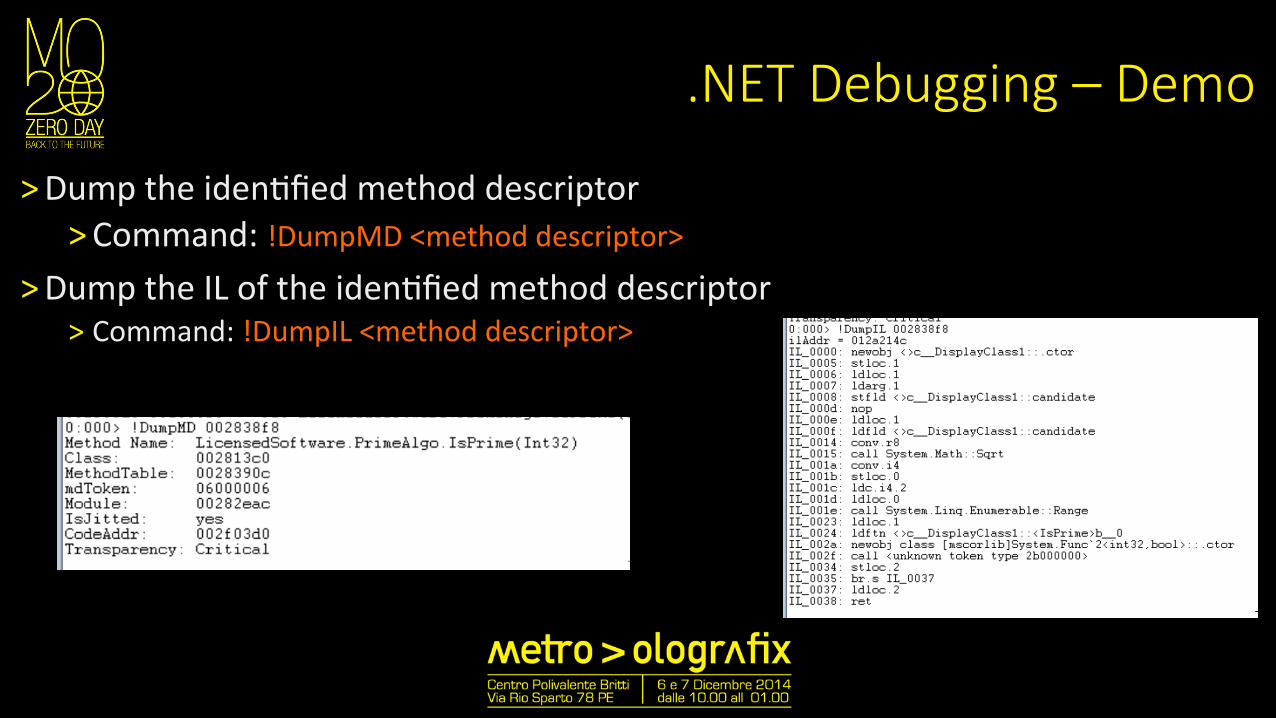
.NET Debugging – Demo
˃ Dump the iden:fied method descriptor ˃ Command: !DumpMD <method descriptor>
˃ Dump the IL of the iden:fied method descriptor ˃ Command: !DumpIL <method descriptor>
.NET Debugging
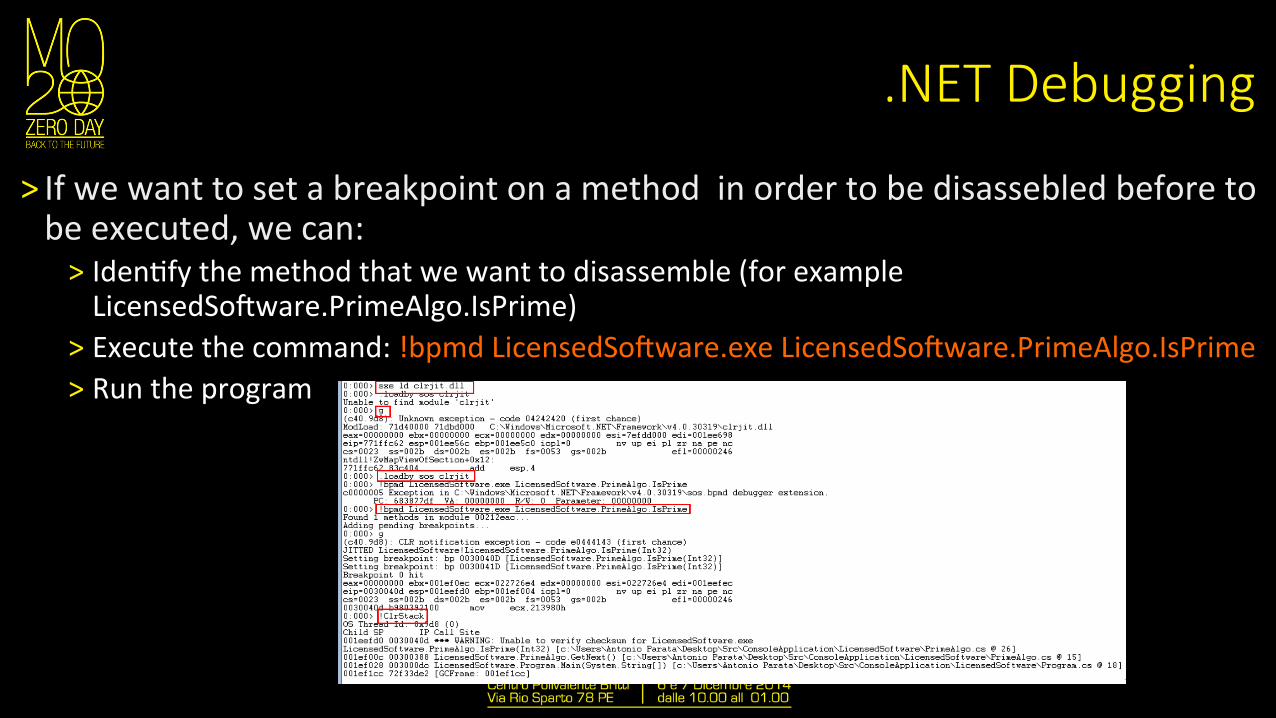
˃ If we want to set a breakpoint on a method in order to be disassebled before to be executed, we can: ˃ Iden:fy the method that we want to disassemble (for example LicensedSo/ware.PrimeAlgo.IsPrime)
˃ Execute the command: !bpmd LicensedSo/ware.exe LicensedSo/ware.PrimeAlgo.IsPrime ˃ Run the program
.NET Debugging
˃ As said debugging is the most useful ac:vity to know exactly what happen in the program ˃ If necessary you can also analyze the transi:on to unmanaged code
˃ Unfortunatly is not very user friendly ˃ If you don’t use WindDbg every days you will forget very soon the name of the commands :\
˃ Fortunatly we have s:ll one secret weapon…
.NET ReflecEon
“The classes in the System.Reflec3on namespace, together with System.Type, enable you to obtain informa3on about loaded assemblies and the types defined within them, such as classes, interfaces, and value types. You can also use reflec3on to create type instances at run 3me, and to invoke and access them. For topics about specific aspects of reflec3on, see Related Topics at the end of this overview.” If you known at least one .NET high level language, you will love reflec:on J
.NET ReflecEon
.NET ReflecEon
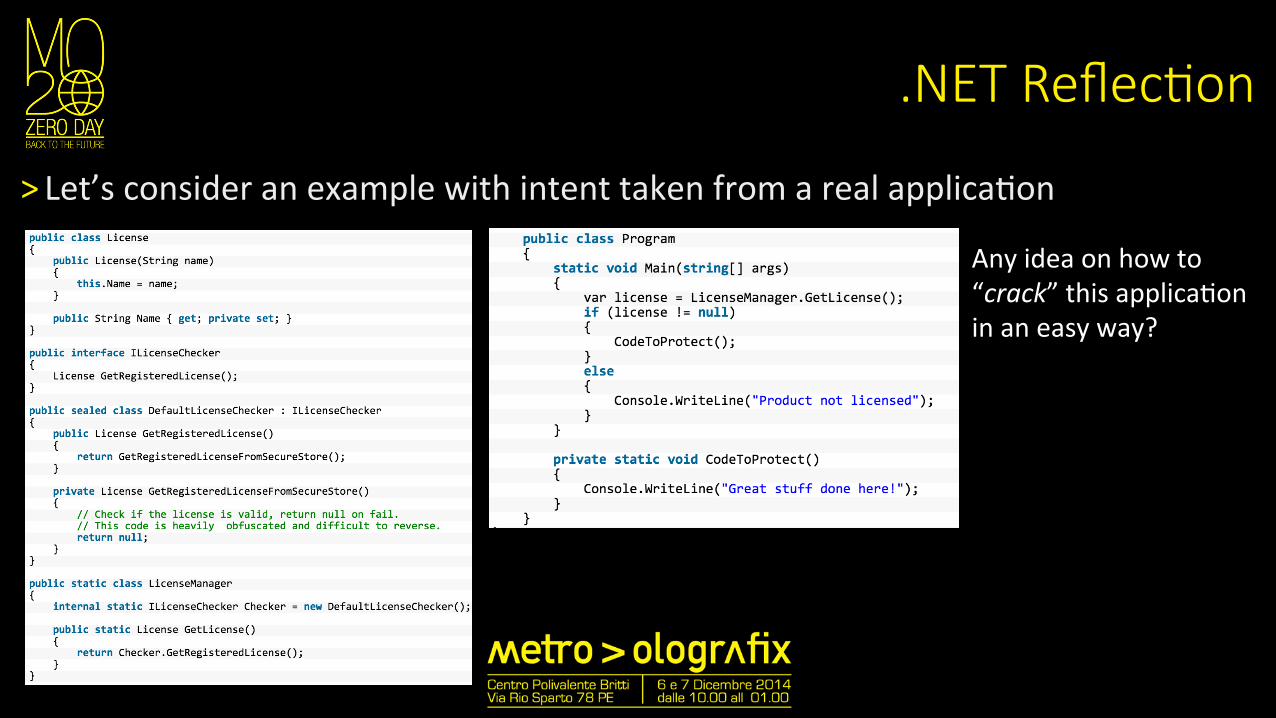
˃ Let’s consider an example with intent taken from a real applica:on
Any idea on how to “crack” this applica:on in an easy way?
.NET ReflecEon
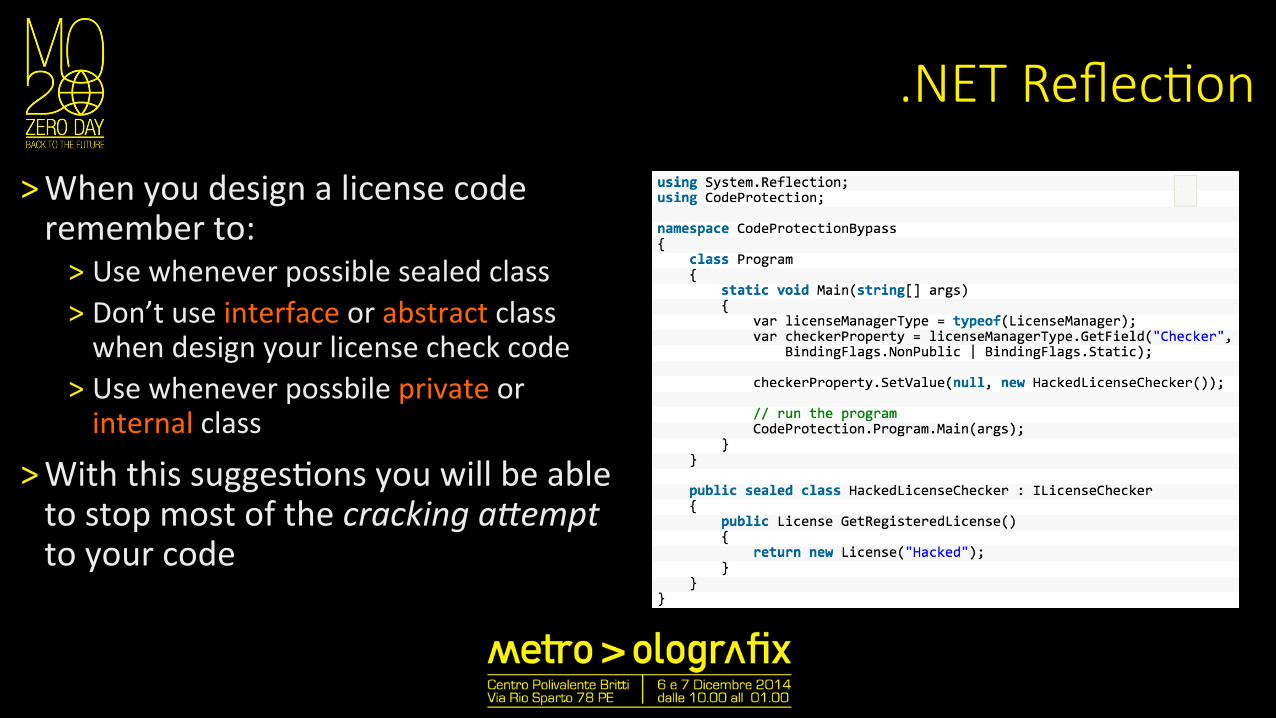
˃ When you design a license code remember to: ˃ Use whenever possible sealed class ˃ Don’t use interface or abstract class when design your license check code
˃ Use whenever possbile private or internal class
˃ With this sugges:ons you will be able to stop most of the cracking aDempt to your code
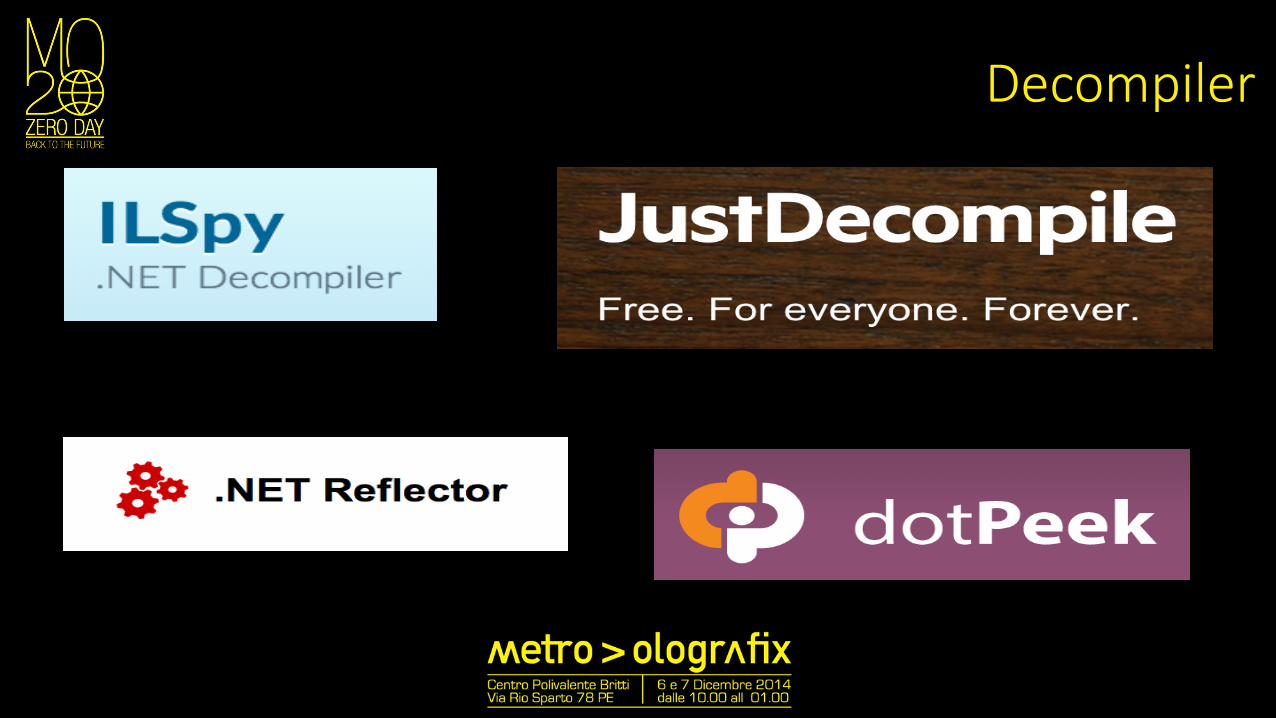
Decompiler
Decompiler
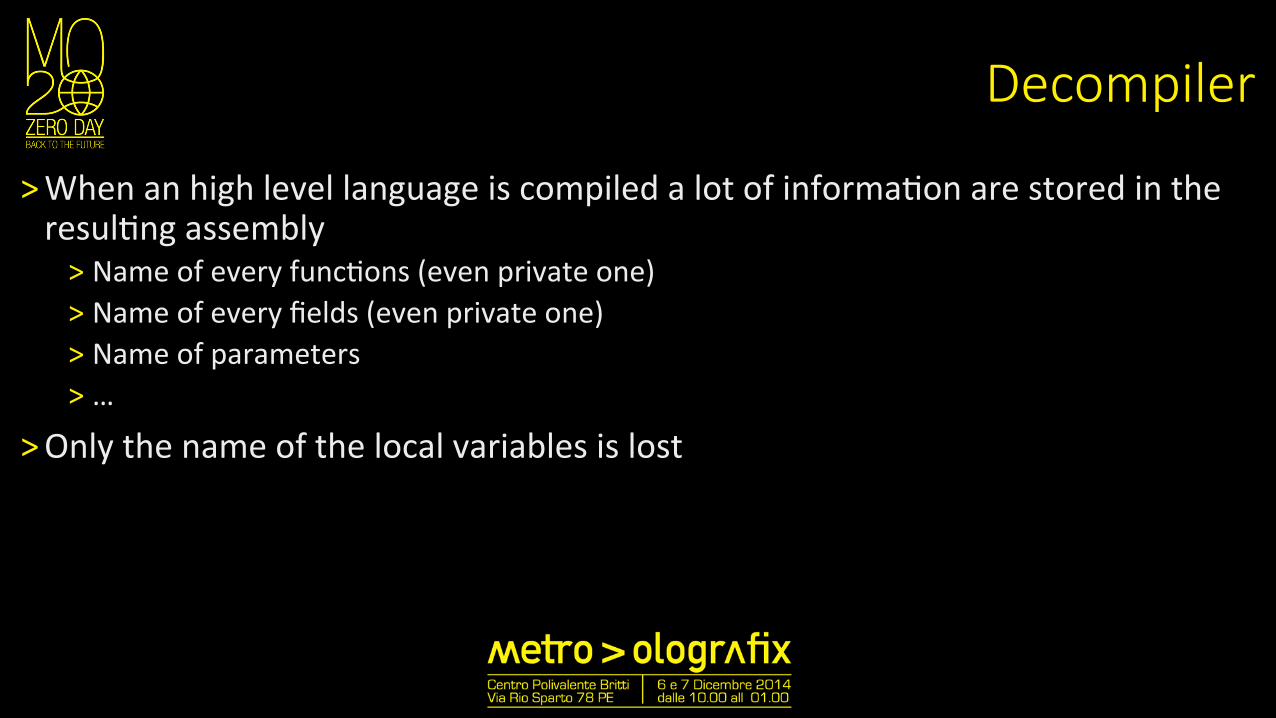
˃ When an high level language is compiled a lot of informa:on are stored in the resul:ng assembly ˃ Name of every func:ons (even private one) ˃ Name of every fields (even private one) ˃ Name of parameters ˃ …
˃ Only the name of the local variables is lost
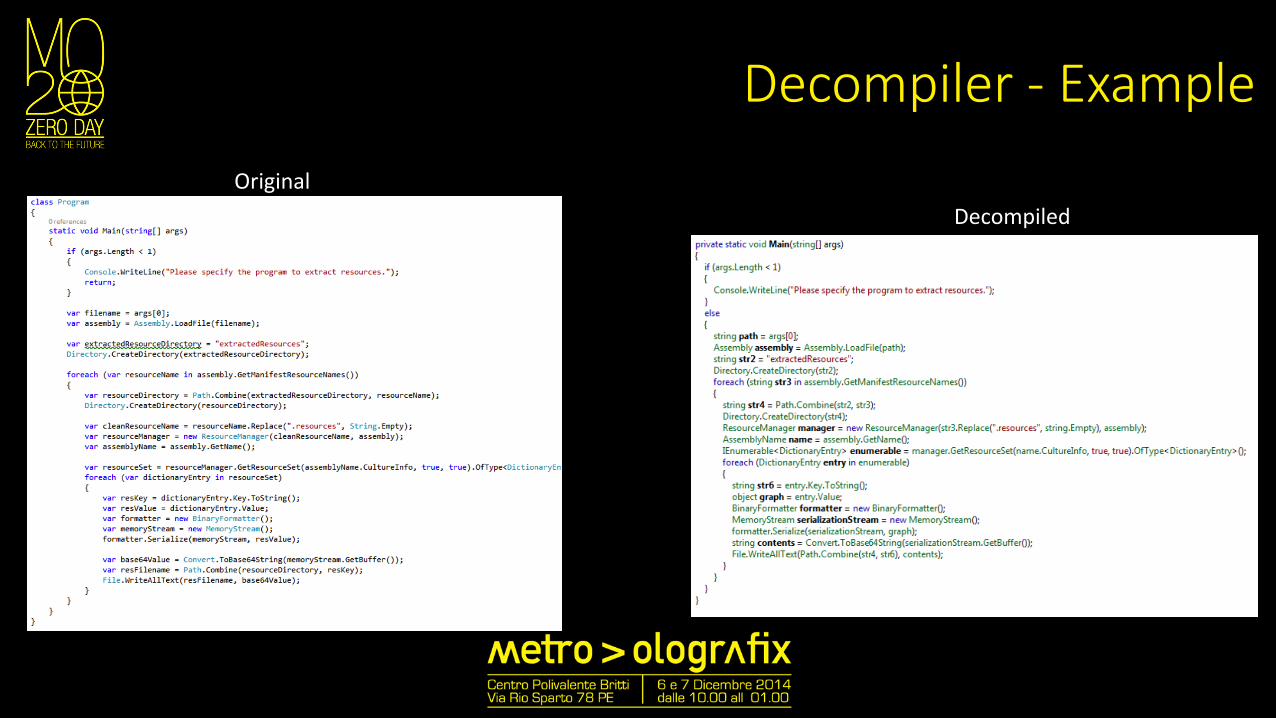
Decompiler -‐ Example
Original Decompiled
AnE-‐DecompilaEon tricks
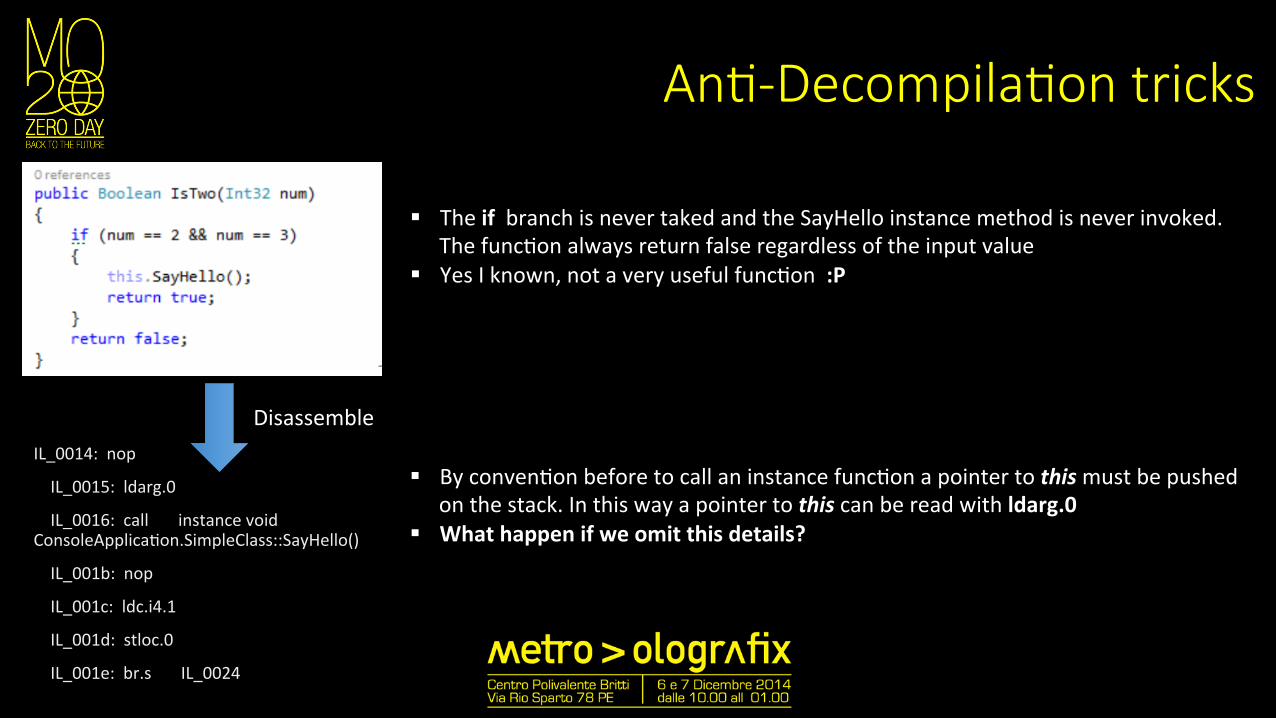
IL_0014: nop
IL_0015: ldarg.0
IL_0016: call instance void ConsoleApplica:on.SimpleClass::SayHello()
IL_001b: nop
IL_001c: ldc.i4.1
IL_001d: stloc.0
IL_001e: br.s IL_0024
Disassemble
§ The if branch is never taked and the SayHello instance method is never invoked. The func:on always return false regardless of the input value
§ Yes I known, not a very useful func:on :P
§ By conven:on before to call an instance func:on a pointer to this must be pushed on the stack. In this way a pointer to this can be read with ldarg.0
§ What happen if we omit this details?
AnE-‐DecompilaEon tricks
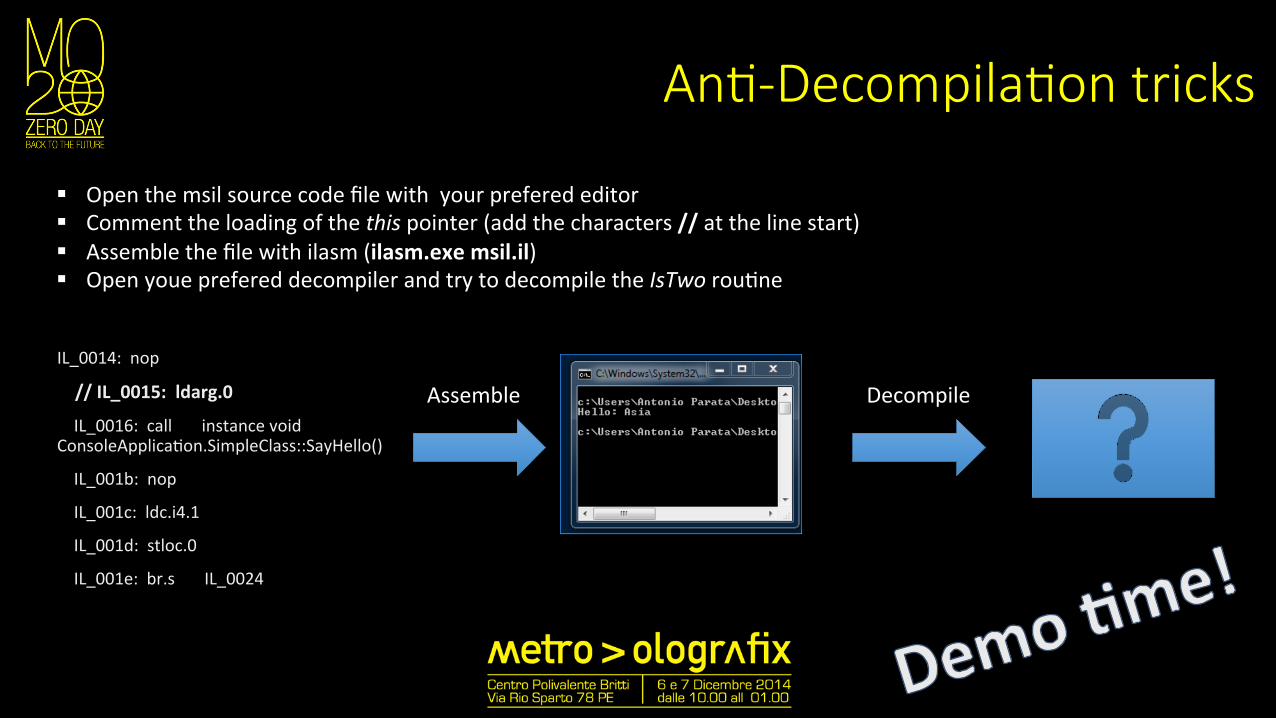
IL_0014: nop
// IL_0015: ldarg.0
IL_0016: call instance void ConsoleApplica:on.SimpleClass::SayHello()
IL_001b: nop
IL_001c: ldc.i4.1
IL_001d: stloc.0
IL_001e: br.s IL_0024
Assemble
§ Open the msil source code file with your prefered editor § Comment the loading of the this pointer (add the characters // at the line start) § Assemble the file with ilasm (ilasm.exe msil.il) § Open youe prefered decompiler and try to decompile the IsTwo rou:ne
Decompile
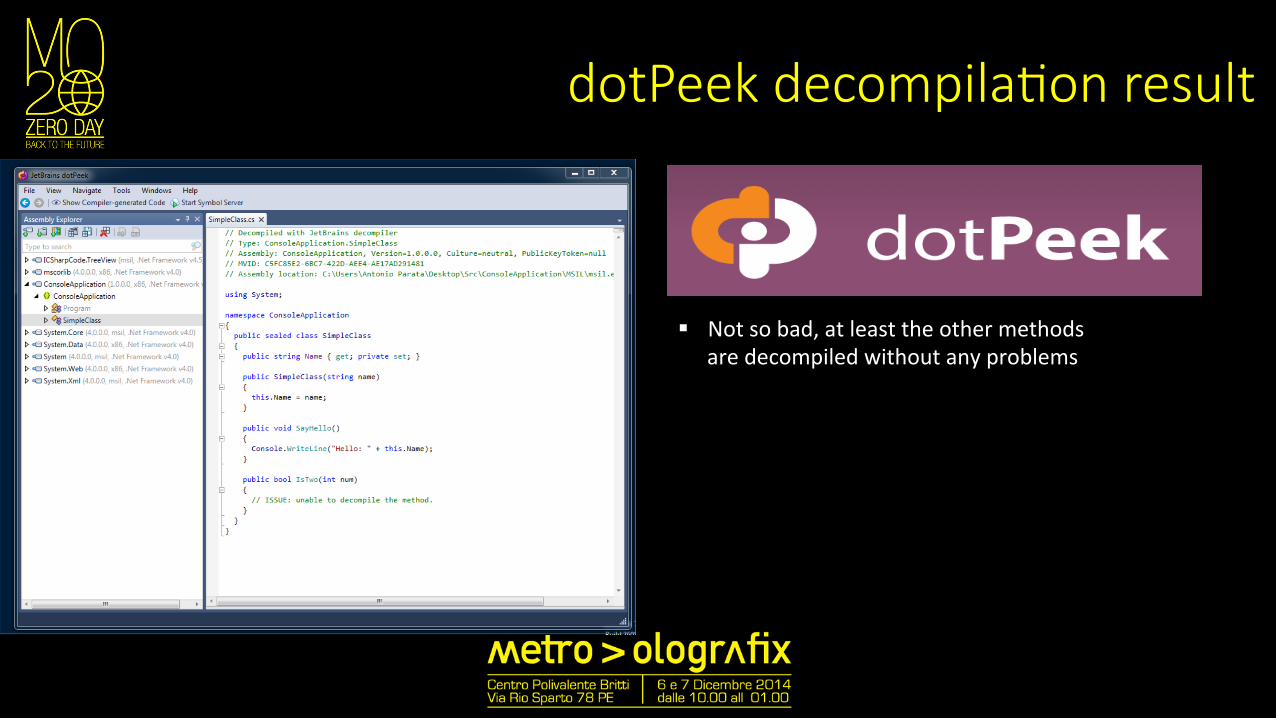
dotPeek decompilaEon result
§ Not so bad, at least the other methods are decompiled without any problems
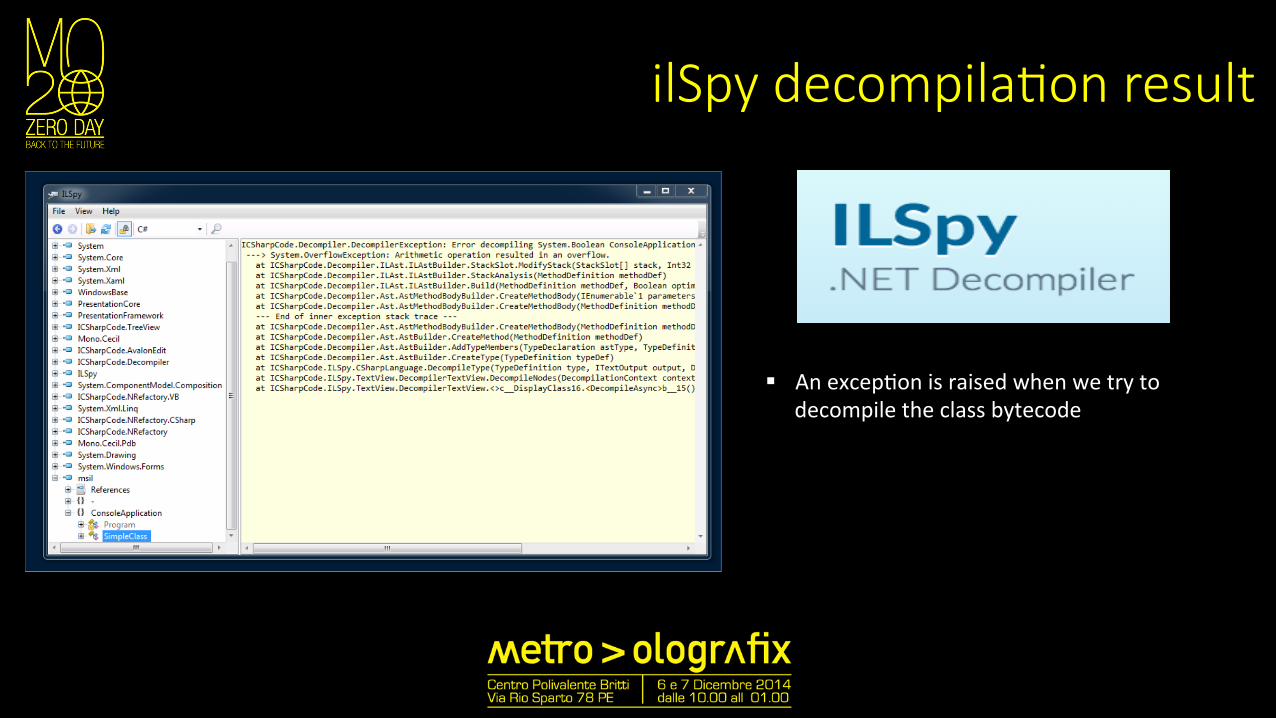
ilSpy decompilaEon result
§ An excep:on is raised when we try to decompile the class bytecode
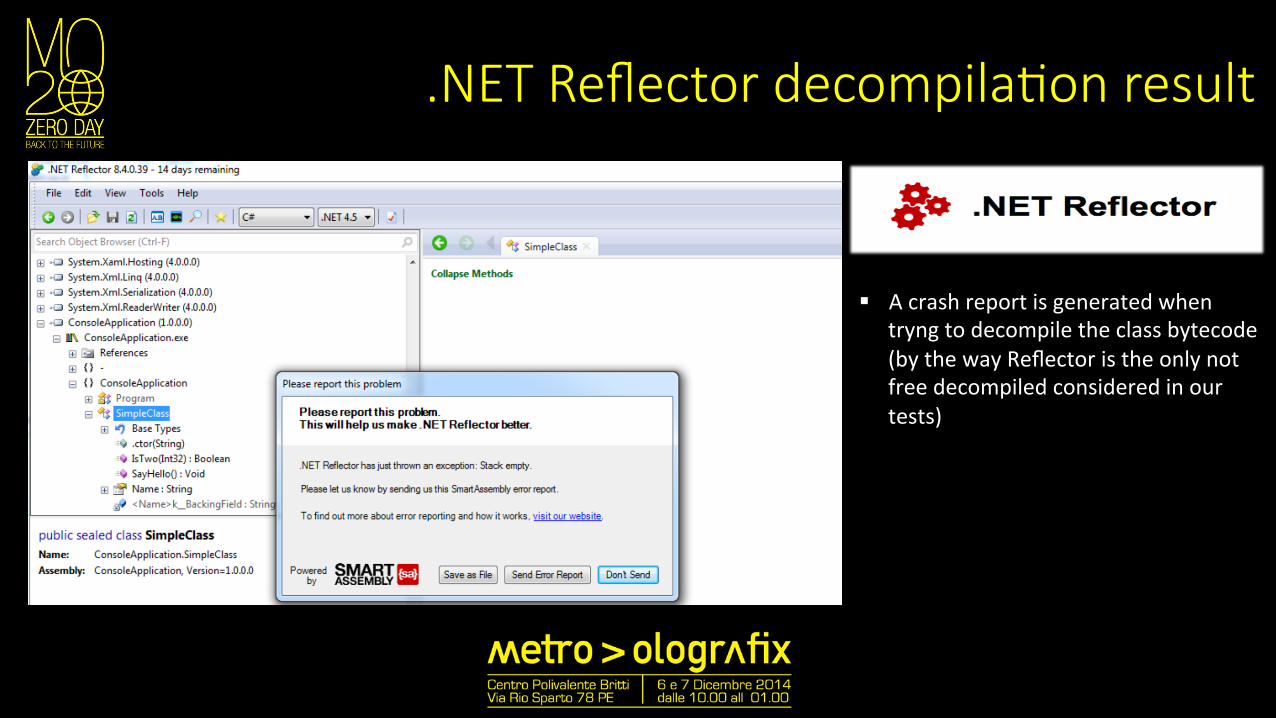
.NET Reflector decompilaEon result
§ A crash report is generated when tryng to decompile the class bytecode (by the way Reflector is the only not free decompiled considered in our tests)
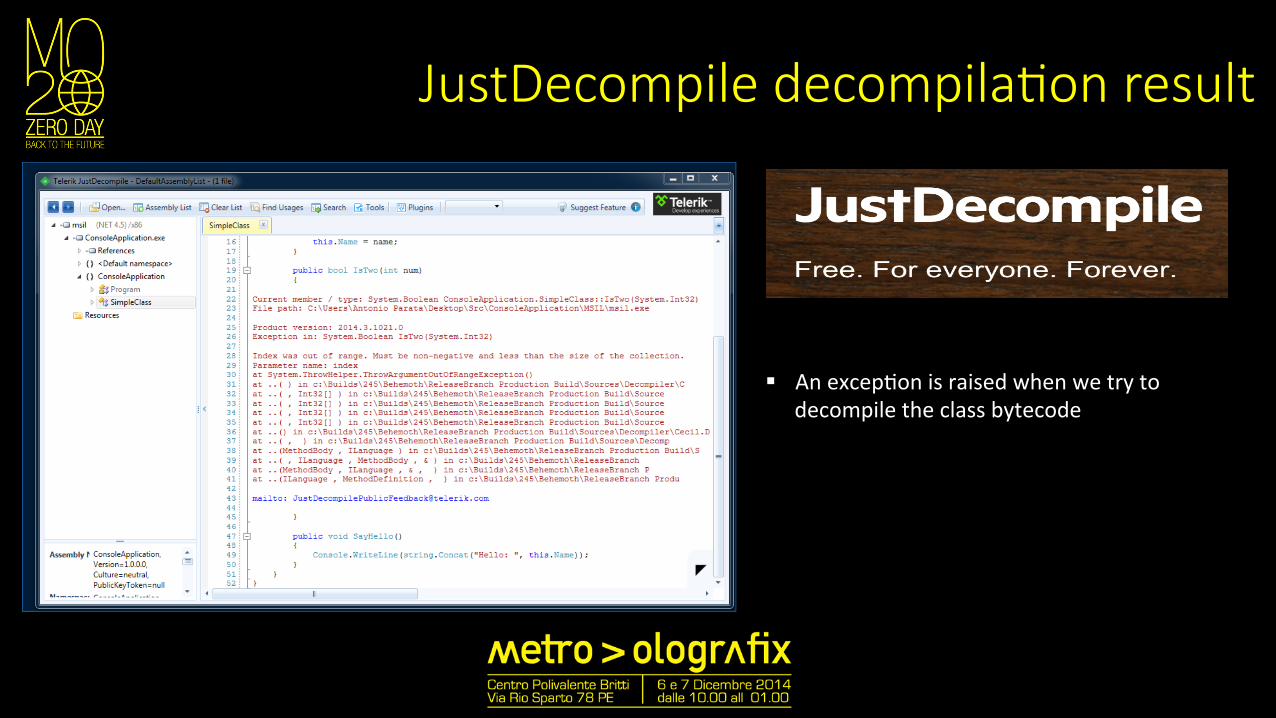
JustDecompile decompilaEon result
§ An excep:on is raised when we try to decompile the class bytecode
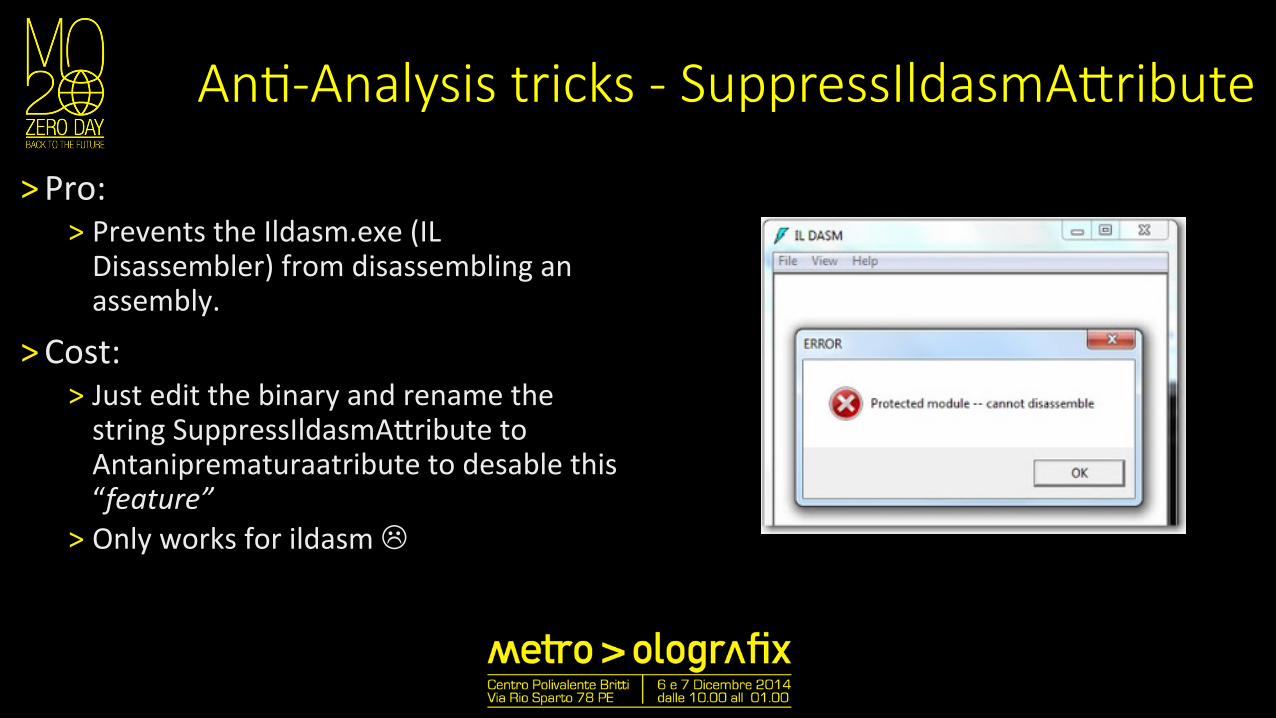
AnE-‐Analysis tricks -‐ SuppressIldasmAQribute
˃ Pro: ˃ Prevents the Ildasm.exe (IL Disassembler) from disassembling an assembly.
˃ Cost: ˃ Just edit the binary and rename the string SuppressIldasmAMribute to Antaniprematuraatribute to desable this “feature”
˃ Only works for ildasm L
AnE-‐Analysis tricks -‐ Method Name Scrambling
˃ The CLR doesn’t have a very strict rule on the characters to use for method naming
˃ At least is not strict as that of the High Level Language (C#, VB.NET, F#)
˃ Even Ildasm doen’t handle very well special characters
˃ Let’s try to edit the name of a method with not printable characters
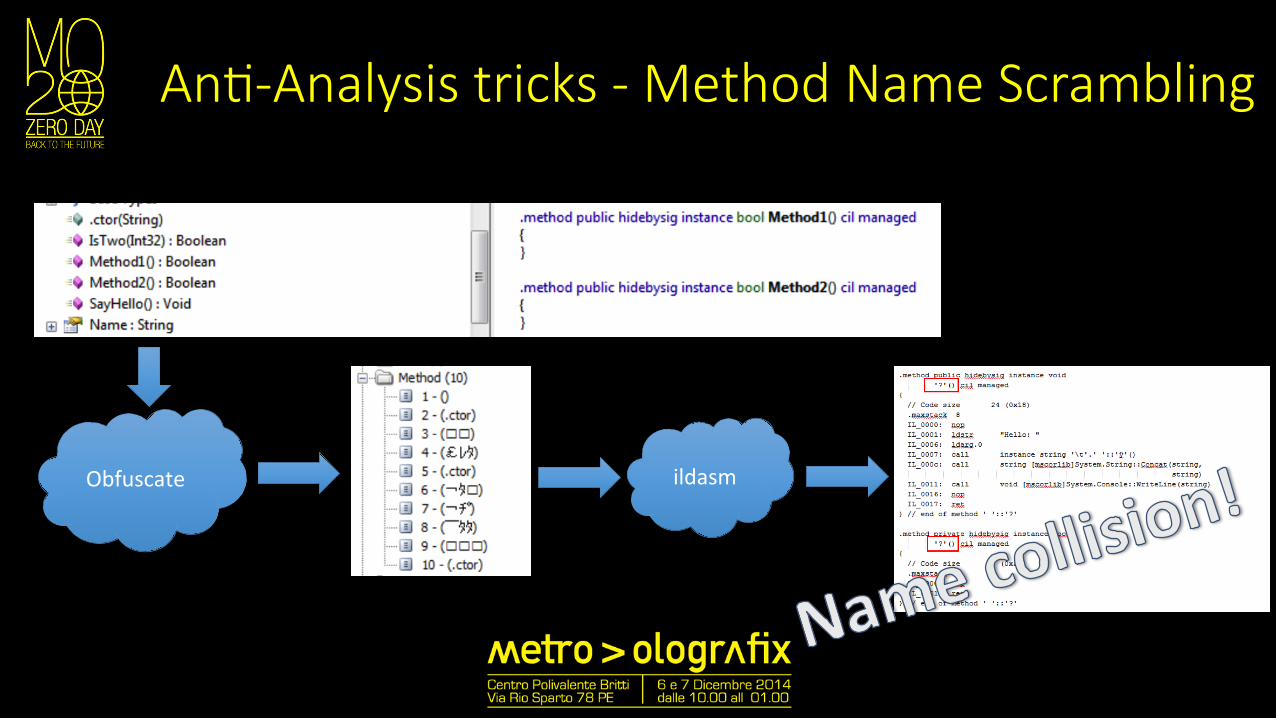
AnE-‐Analysis tricks -‐ Method Name Scrambling
Obfuscate ildasm
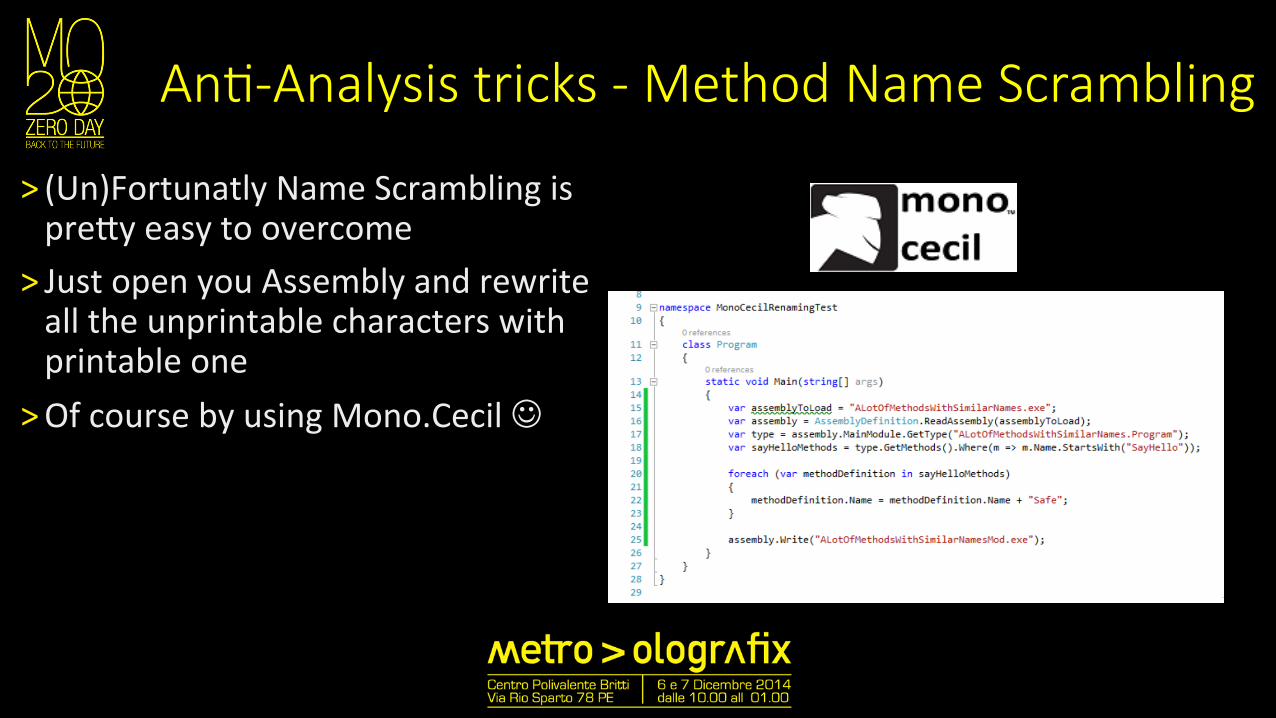
AnE-‐Analysis tricks -‐ Method Name Scrambling
˃ (Un)Fortunatly Name Scrambling is preMy easy to overcome
˃ Just open you Assembly and rewrite all the unprintable characters with printable one
˃ Of course by using Mono.Cecil J
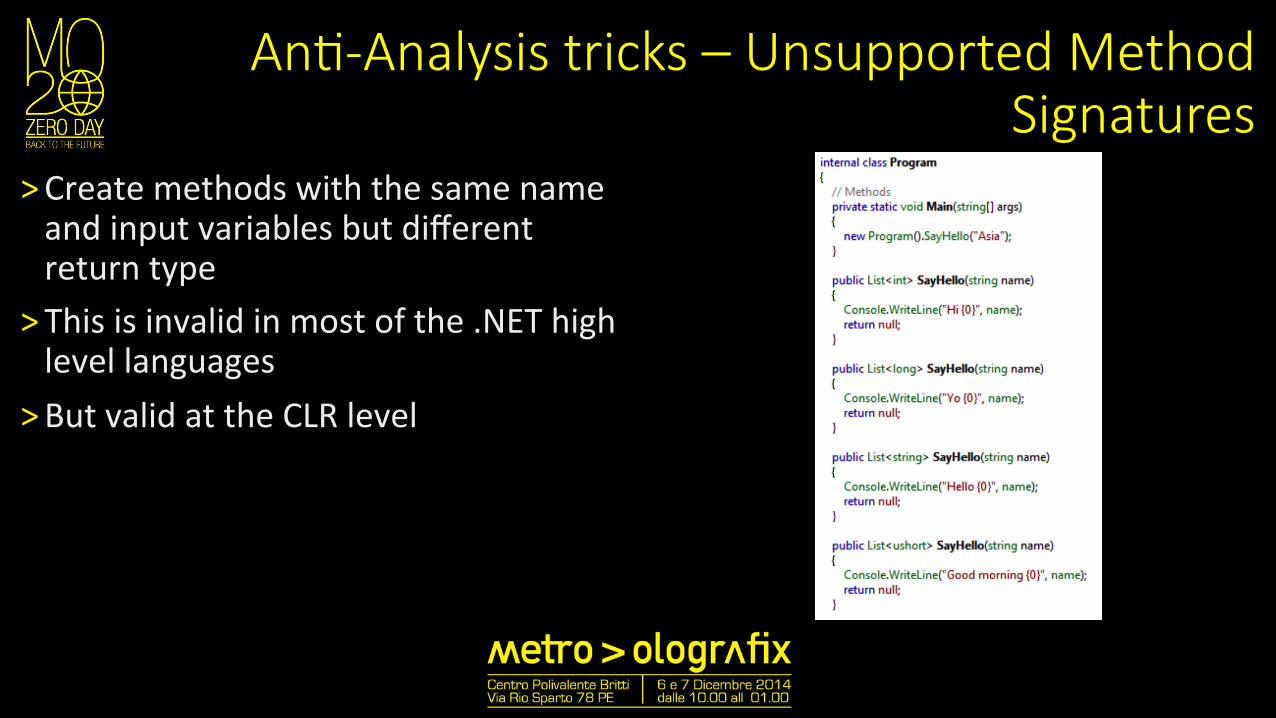
AnE-‐Analysis tricks – Unsupported Method Signatures
˃ Create methods with the same name and input variables but different return type
˃ This is invalid in most of the .NET high level languages
˃ But valid at the CLR level
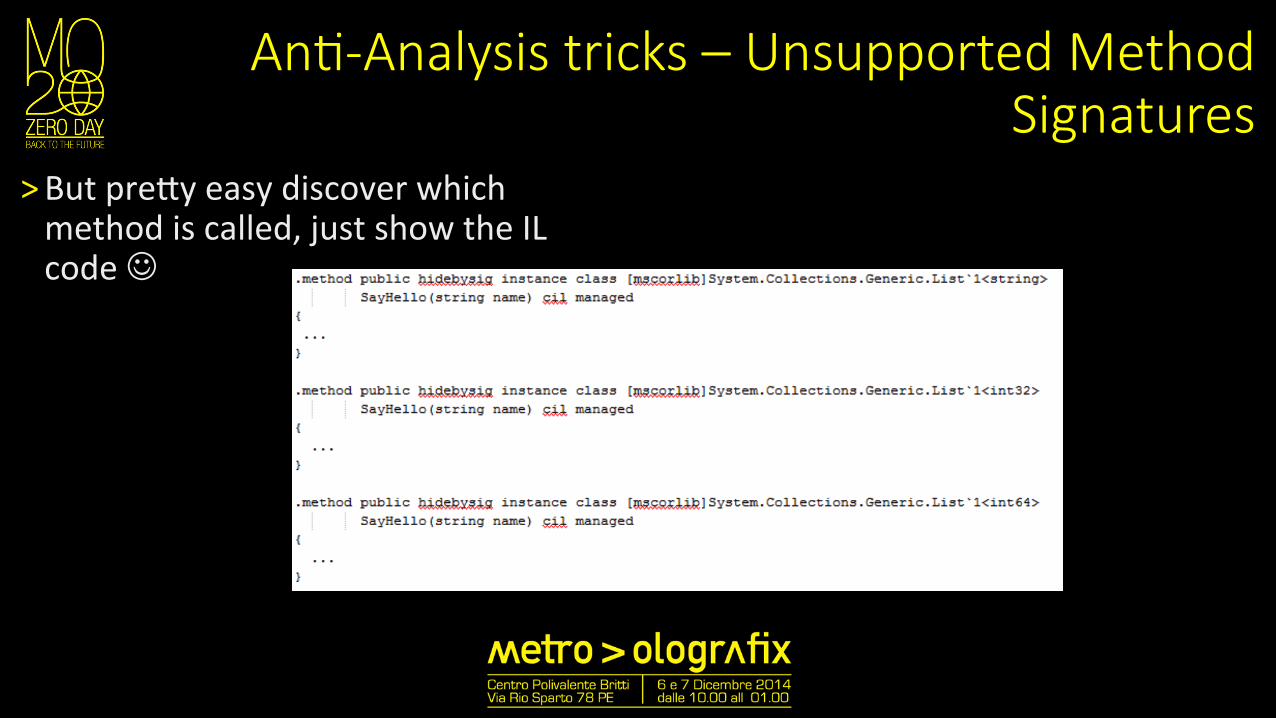
AnE-‐Analysis tricks – Unsupported Method Signatures
˃ But preMy easy discover which method is called, just show the IL code J
AnE-‐Analysis tricks
-‐ There are also other kind of obfusca:on like: -‐ Code virtualiza:on -‐ MSIL Code encryp:on (not so usefull to be honest…) -‐ Control-‐Flow obfusca:on -‐ …
Profile API & Extended ReflecEon
˃ Allow to profile .NET applica:on by intstrumen:ng the CLR
˃ Need to be ini:alizated with proper environment variables
˃ WriMen in unmanaged code ˃ In order to be used it is prefered to create an unmanaged program L
˃ Microso/ created a new and poorly documented new project in order to use the profile API from managed code
˃ Used in automata:on framework like Pex/Mole and Fakes to generate high coverege tests
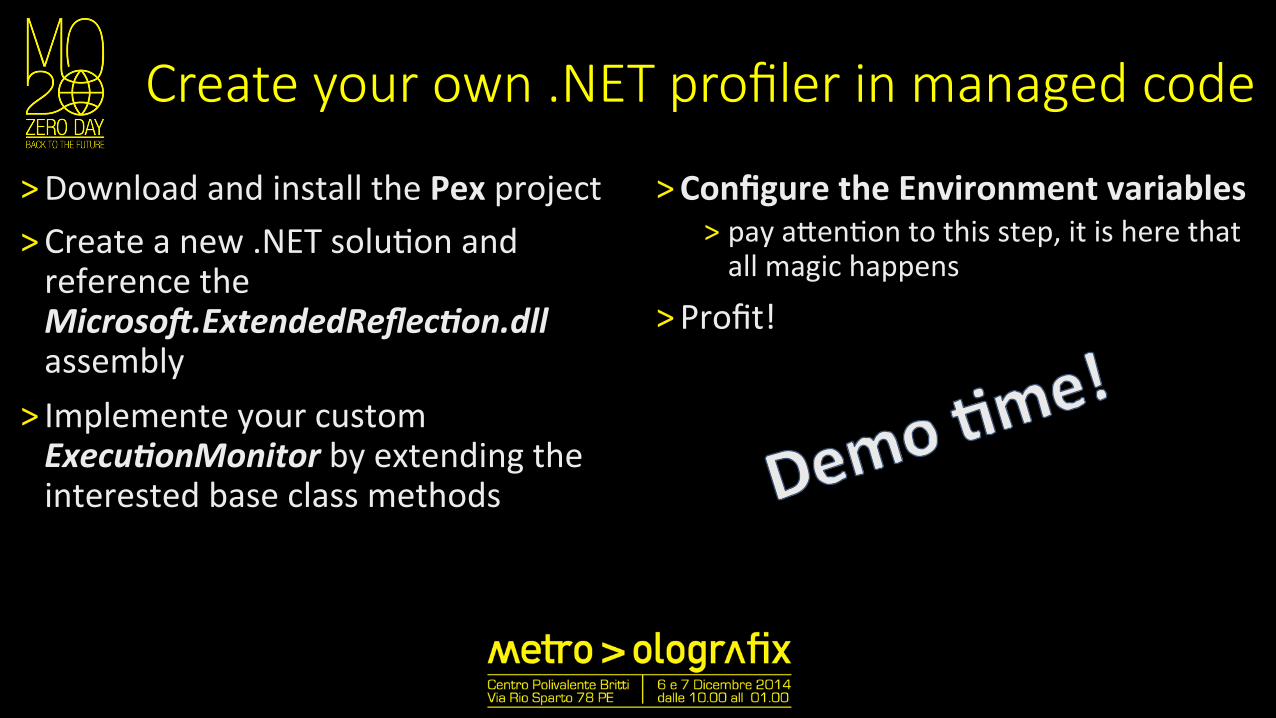
Create your own .NET profiler in managed code
˃ Download and install the Pex project ˃ Create a new .NET solu:on and reference the Microso*.ExtendedReflec3on.dll assembly
˃ Implemente your custom Execu3onMonitor by extending the interested base class methods
˃ Configure the Environment variables ˃ pay aMen:on to this step, it is here that all magic happens
˃ Profit!
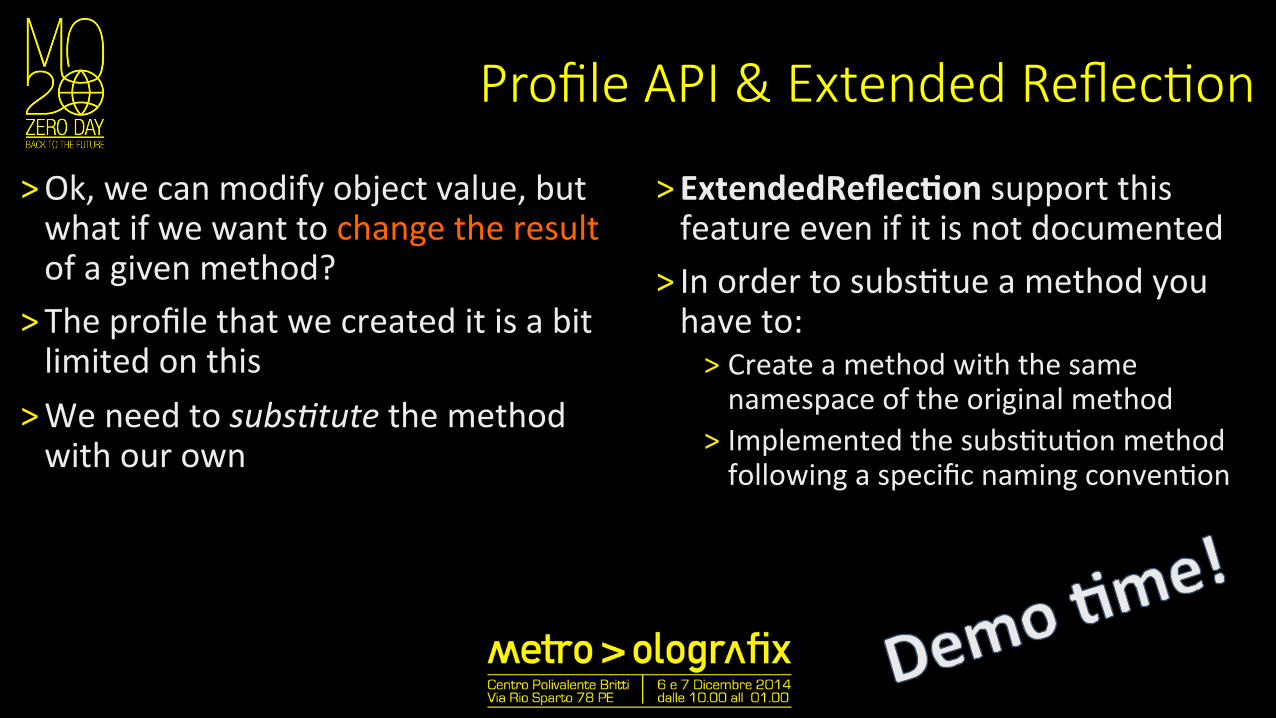
Profile API & Extended ReflecEon
˃ Ok, we can modify object value, but what if we want to change the result of a given method?
˃ The profile that we created it is a bit limited on this
˃ We need to subs3tute the method with our own
˃ ExtendedReflecTon support this feature even if it is not documented
˃ In order to subs:tue a method you have to: ˃ Create a method with the same namespace of the original method
˃ Implemented the subs:tu:on method following a specific naming conven:on
Disadvantages
˃ You need to know the niMy griMy details of the profile API and be conscious to dirty your hands with .NET code
˃ At the moment the ExtendedReflec:on is built only for x86 process L
˃ Don’t use the profile API outside of a sandbox! If the profile API are not able to instrument the assembly the program will be executed normally.
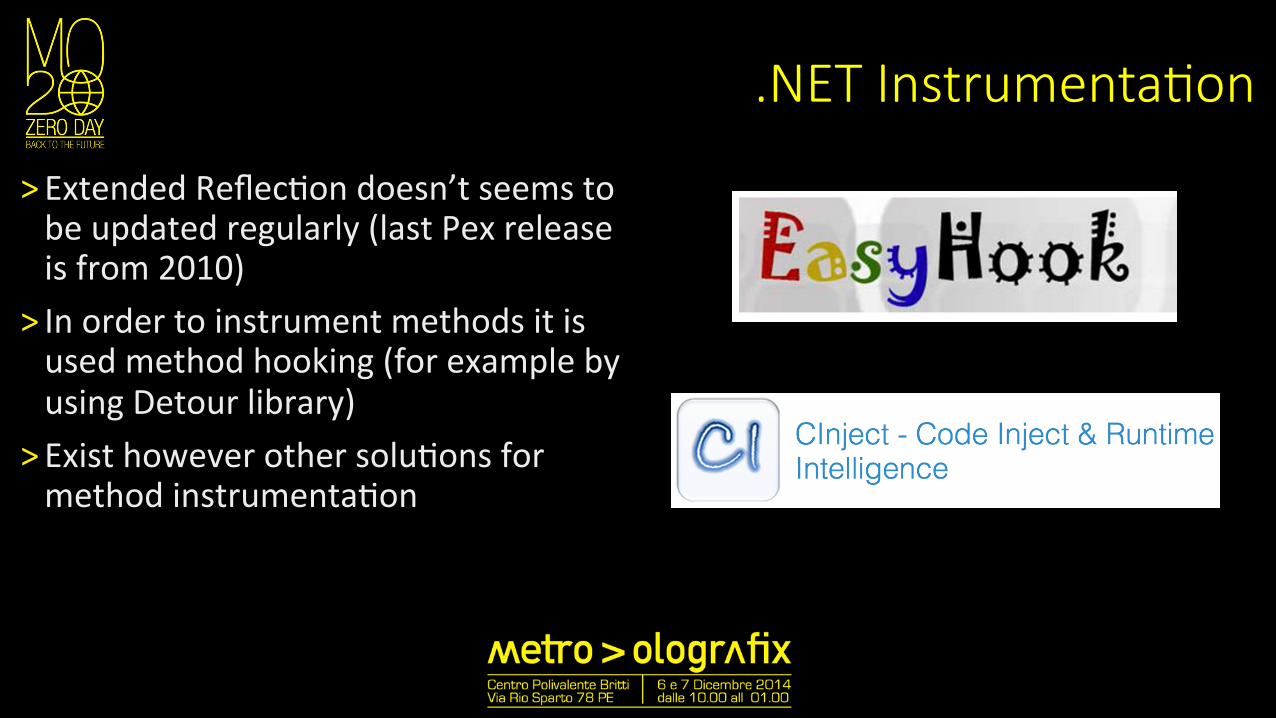
.NET InstrumentaEon
˃ Extended Reflec:on doesn’t seems to be updated regularly (last Pex release is from 2010)
˃ In order to instrument methods it is used method hooking (for example by using Detour library)
˃ Exist however other solu:ons for method instrumenta:on
A real world example
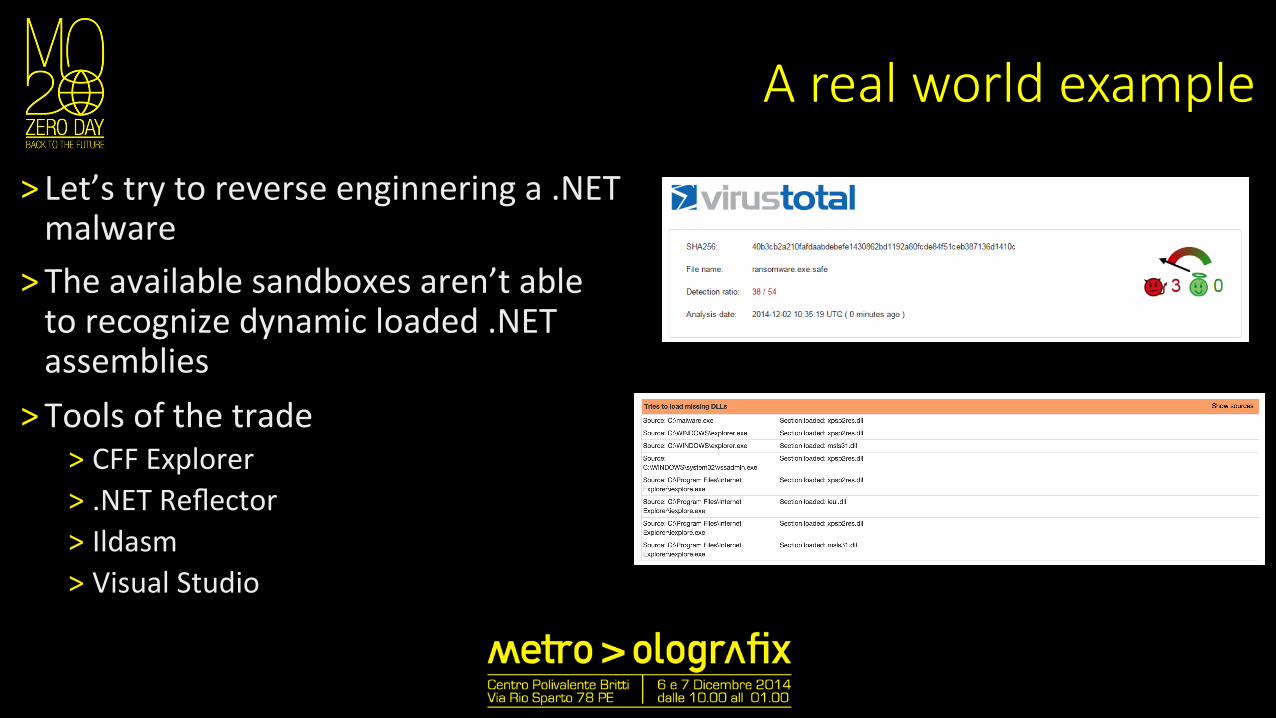
˃ Let’s try to reverse enginnering a .NET malware
˃ The available sandboxes aren’t able to recognize dynamic loaded .NET assemblies
˃ Tools of the trade ˃ CFF Explorer ˃ .NET Reflector ˃ Ildasm ˃ Visual Studio
Demo RE
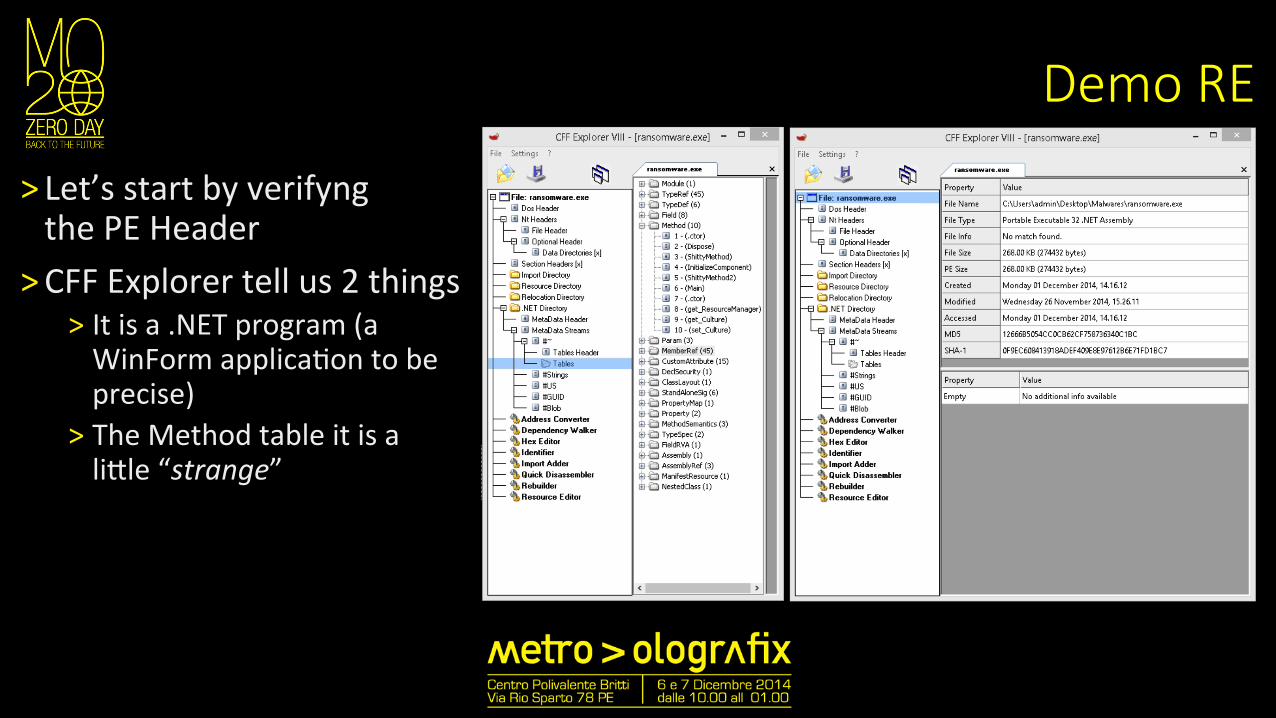
˃ Let’s start by verifyng the PE Header
˃ CFF Explorer tell us 2 things ˃ It is a .NET program (a WinForm applica:on to be precise)
˃ The Method table it is a liMle “strange”
Demo RE
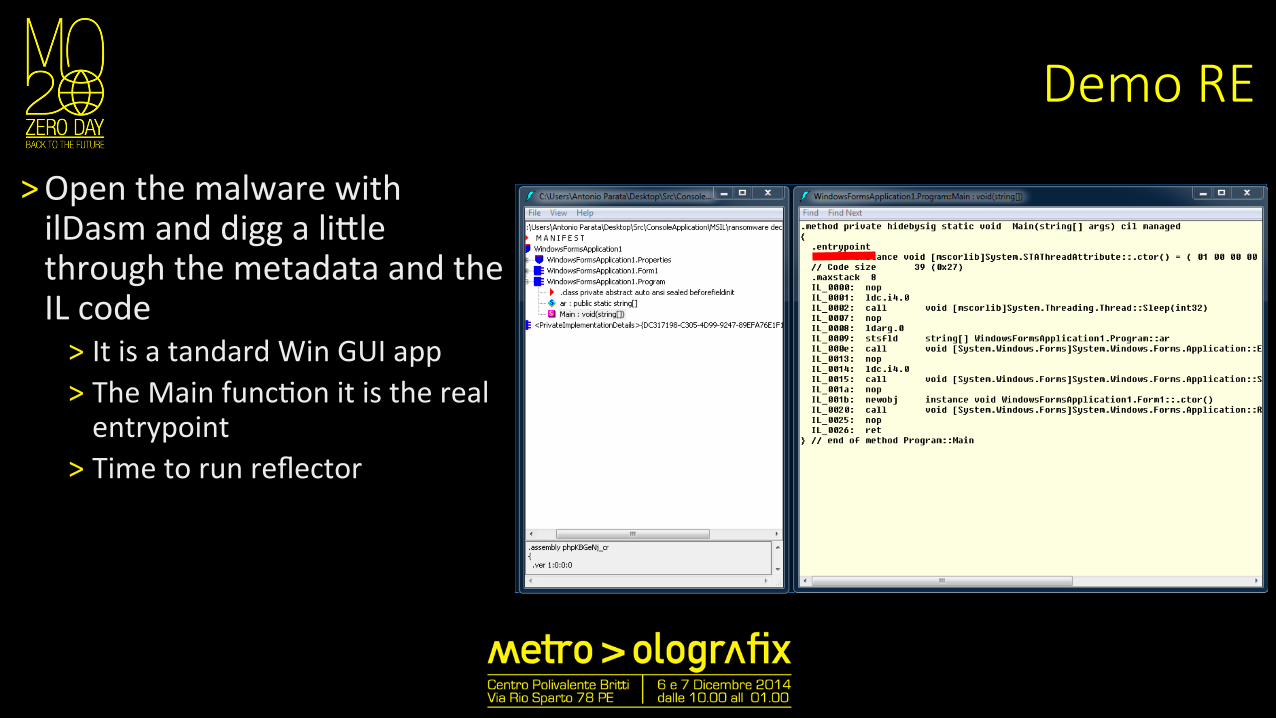
˃ Open the malware with ilDasm and digg a liMle through the metadata and the IL code ˃ It is a tandard Win GUI app ˃ The Main func:on it is the real entrypoint
˃ Time to run reflector
Demo RE
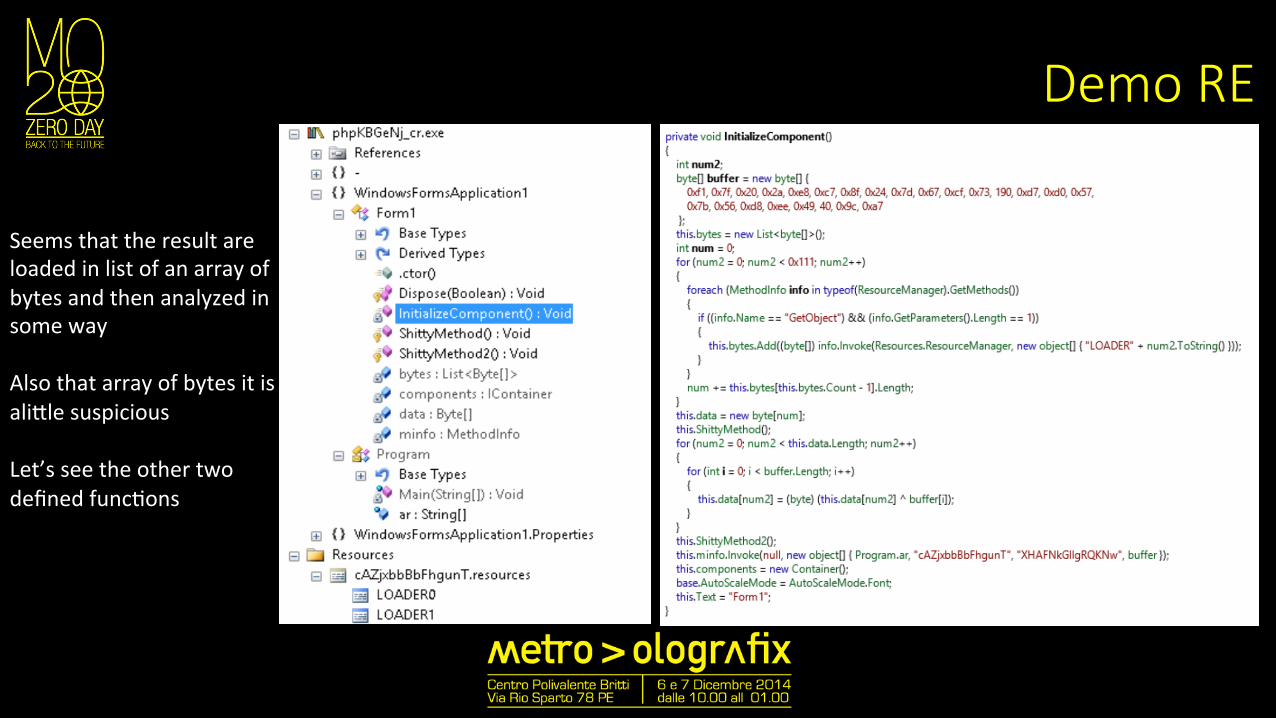
Seems that the result are loaded in list of an array of bytes and then analyzed in some way Also that array of bytes it is aliMle suspicious Let’s see the other two defined func:ons
Demo RE
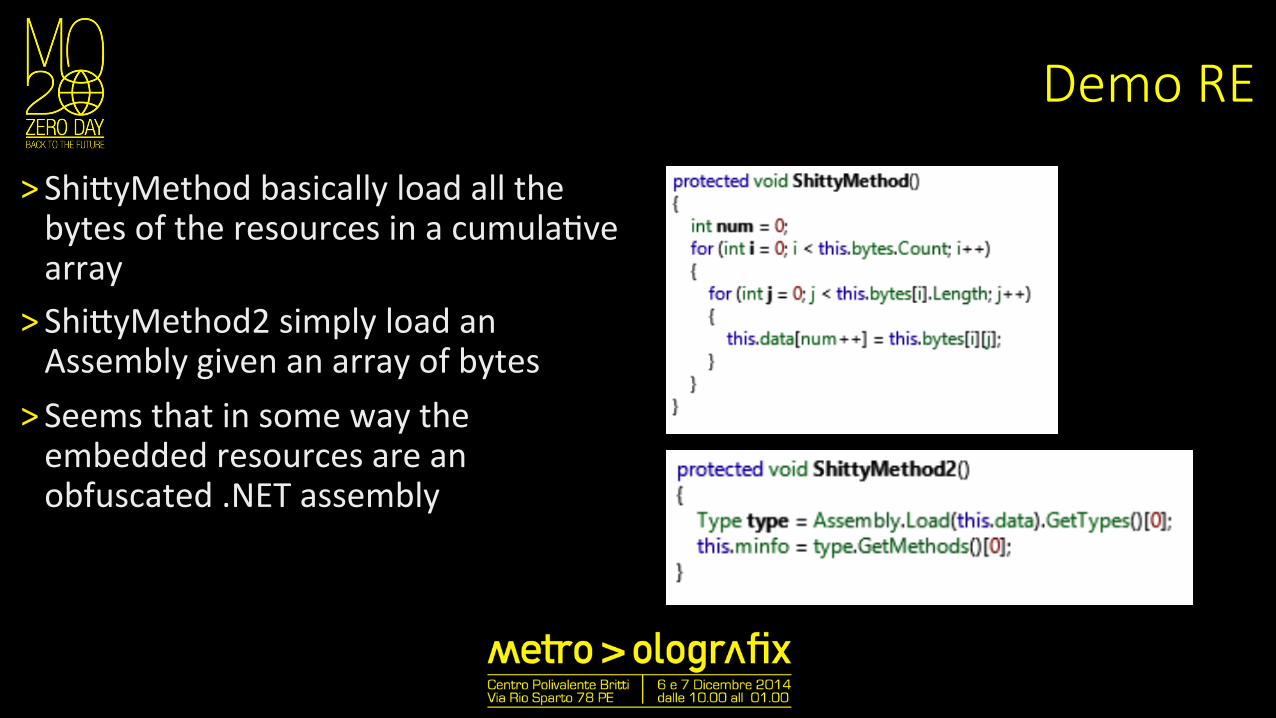
˃ ShiMyMethod basically load all the bytes of the resources in a cumula:ve array
˃ ShiMyMethod2 simply load an Assembly given an array of bytes
˃ Seems that in some way the embedded resources are an obfuscated .NET assembly
Demo RE
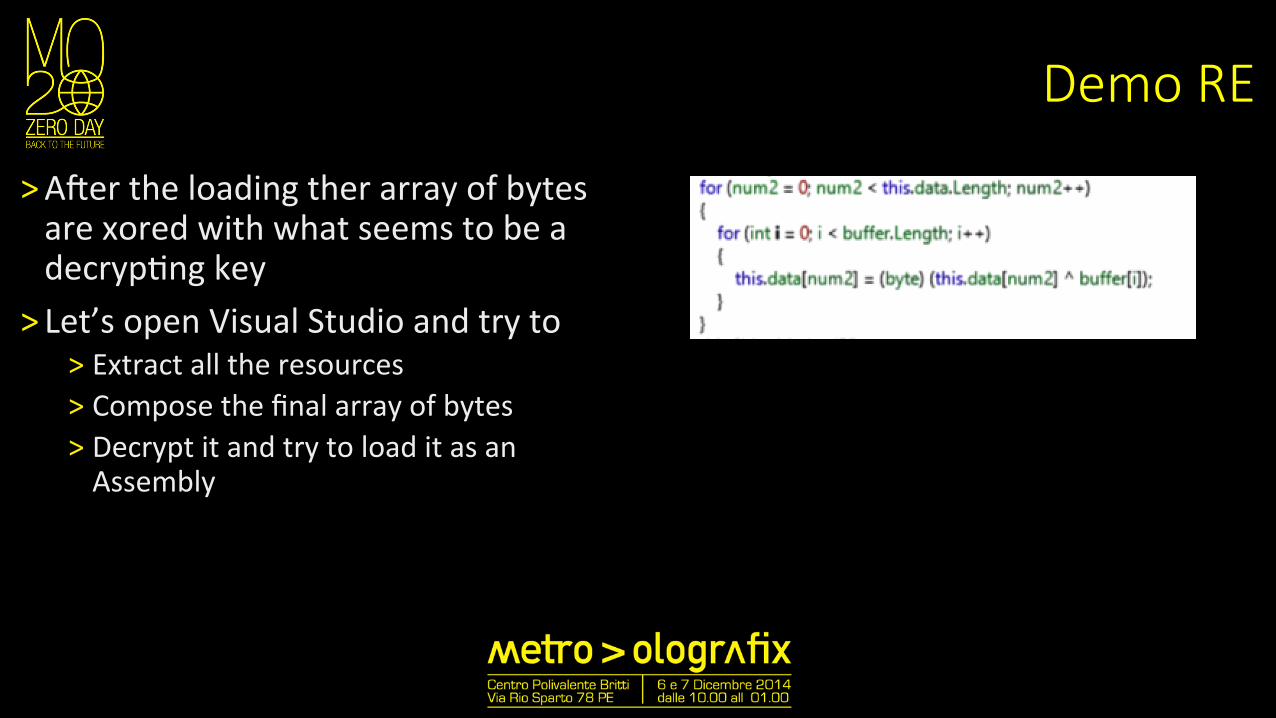
˃ A/er the loading ther array of bytes are xored with what seems to be a decryp:ng key
˃ Let’s open Visual Studio and try to ˃ Extract all the resources ˃ Compose the final array of bytes ˃ Decrypt it and try to load it as an Assembly
Demo RE
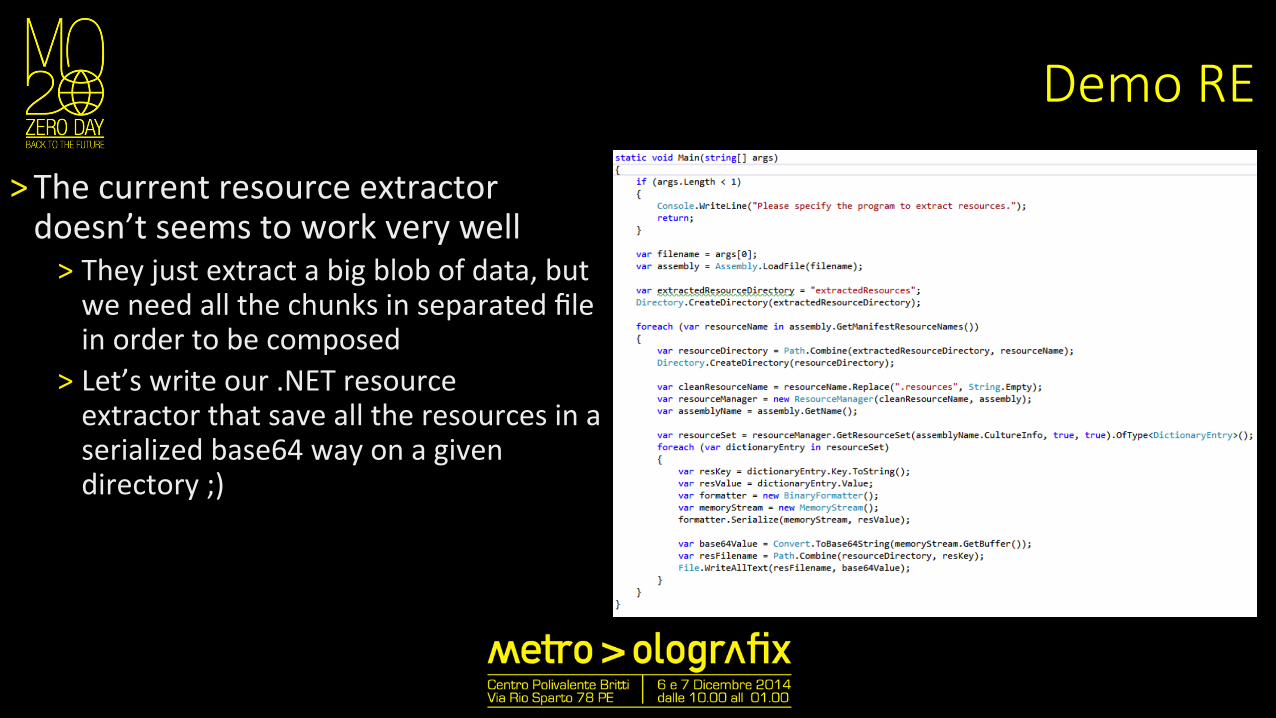
˃ The current resource extractor doesn’t seems to work very well ˃ They just extract a big blob of data, but we need all the chunks in separated file in order to be composed
˃ Let’s write our .NET resource extractor that save all the resources in a serialized base64 way on a given directory ;)
Demo RE
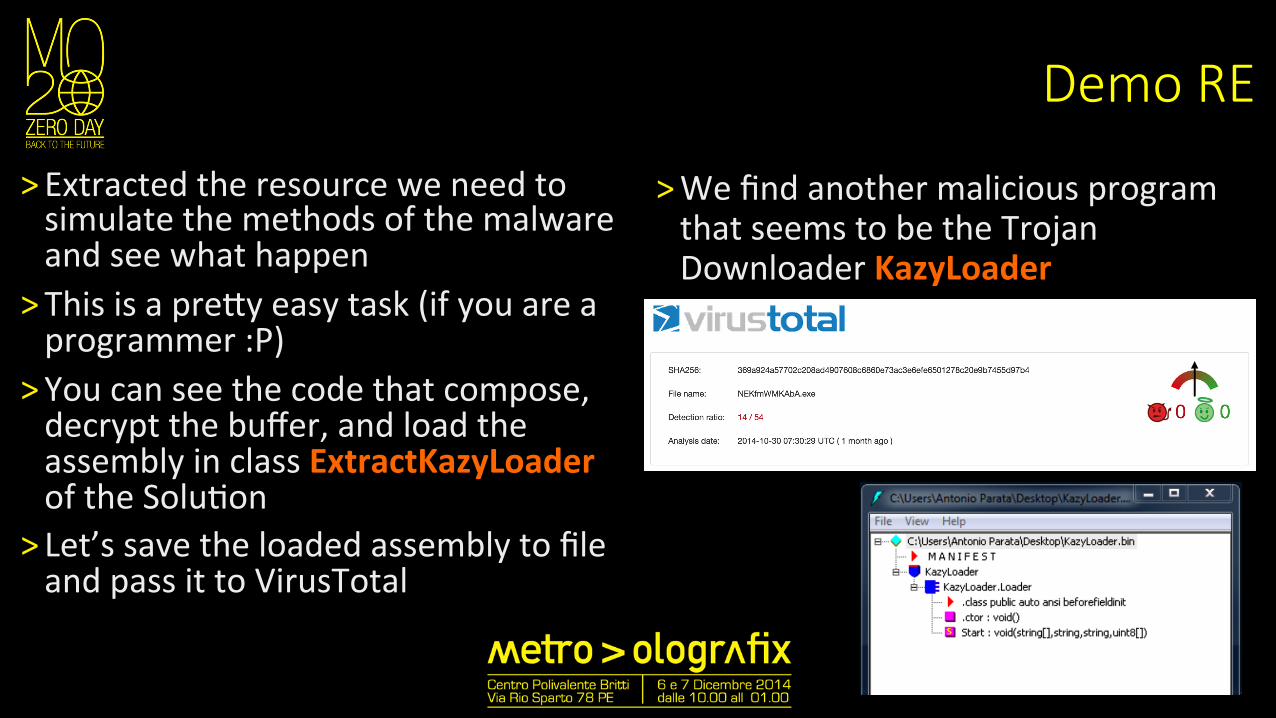
˃ Extracted the resource we need to simulate the methods of the malware and see what happen
˃ This is a preMy easy task (if you are a programmer :P)
˃ You can see the code that compose, decrypt the buffer, and load the assembly in class ExtractKazyLoader of the Solu:on
˃ Let’s save the loaded assembly to file and pass it to VirusTotal
˃ We find another malicious program that seems to be the Trojan Downloader KazyLoader
Demo RE
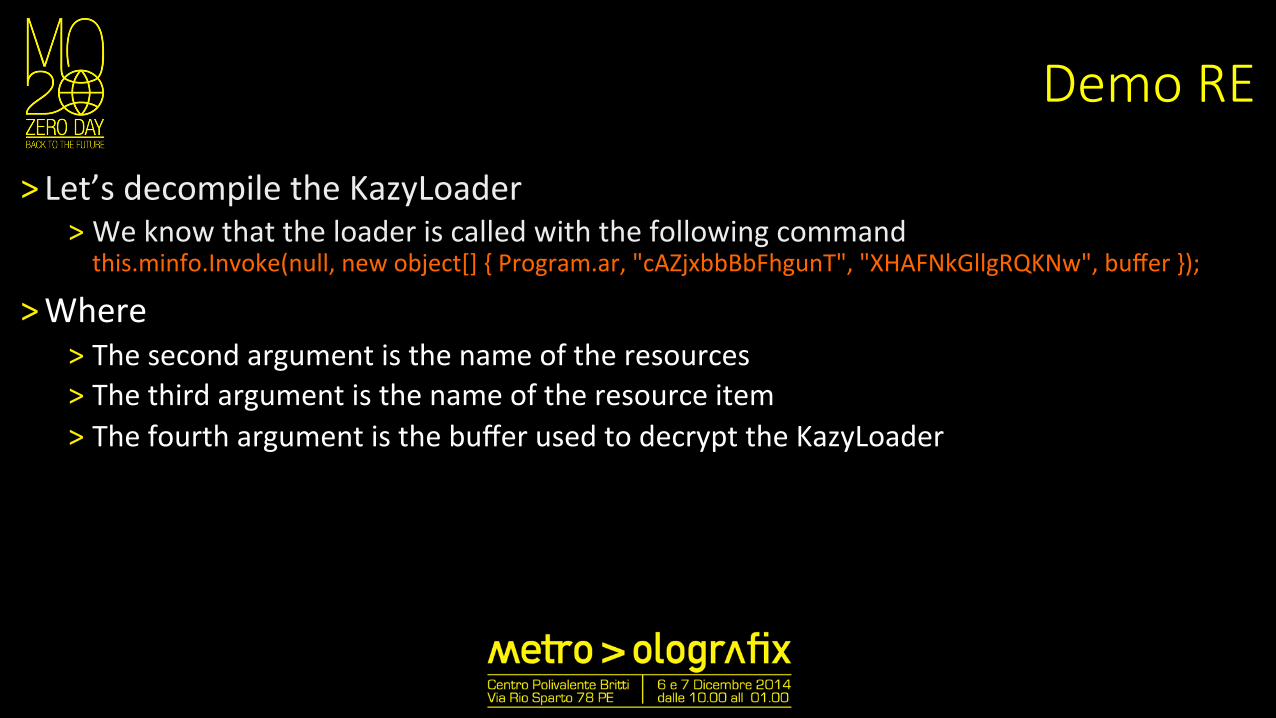
˃ Let’s decompile the KazyLoader ˃ We know that the loader is called with the following command this.minfo.Invoke(null, new object[] { Program.ar, "cAZjxbbBbFhgunT", "XHAFNkGllgRQKNw", buffer });
˃ Where ˃ The second argument is the name of the resources ˃ The third argument is the name of the resource item ˃ The fourth argument is the buffer used to decrypt the KazyLoader
Demo RE
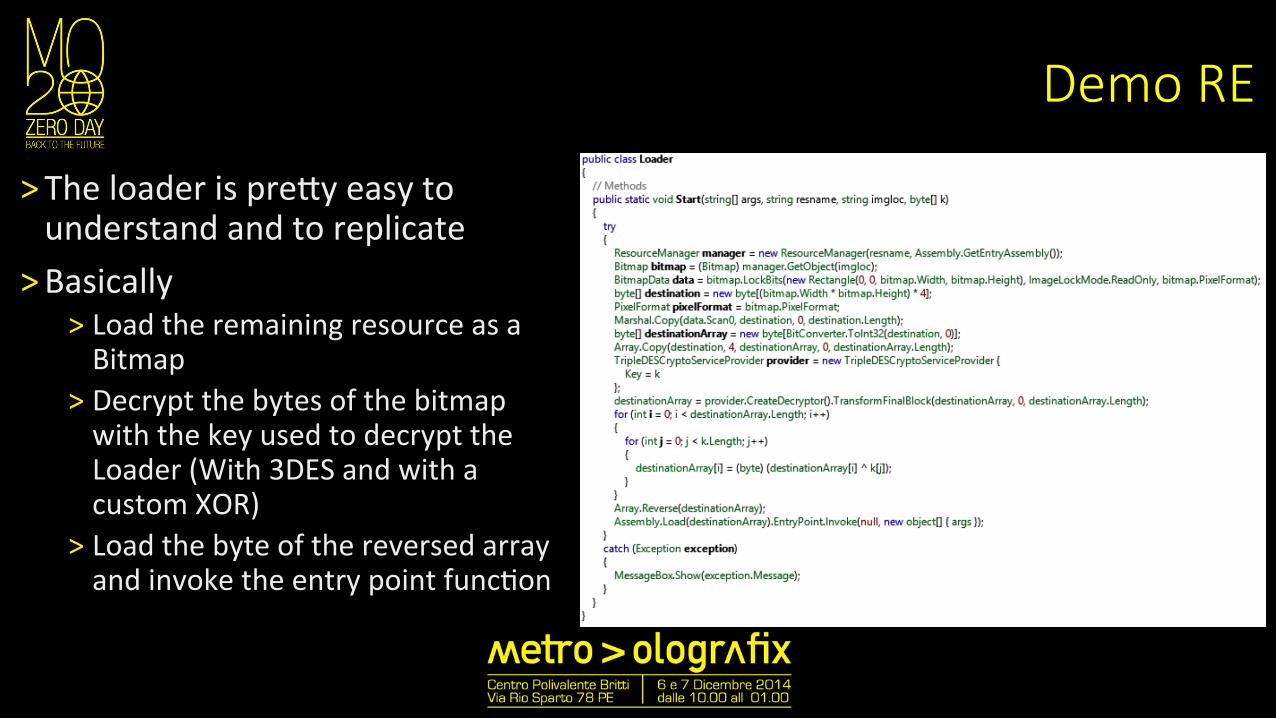
˃ The loader is preMy easy to understand and to replicate
˃ Basically ˃ Load the remaining resource as a Bitmap
˃ Decrypt the bytes of the bitmap with the key used to decrypt the Loader (With 3DES and with a custom XOR)
˃ Load the byte of the reversed array and invoke the entry point func:on
Demo RE
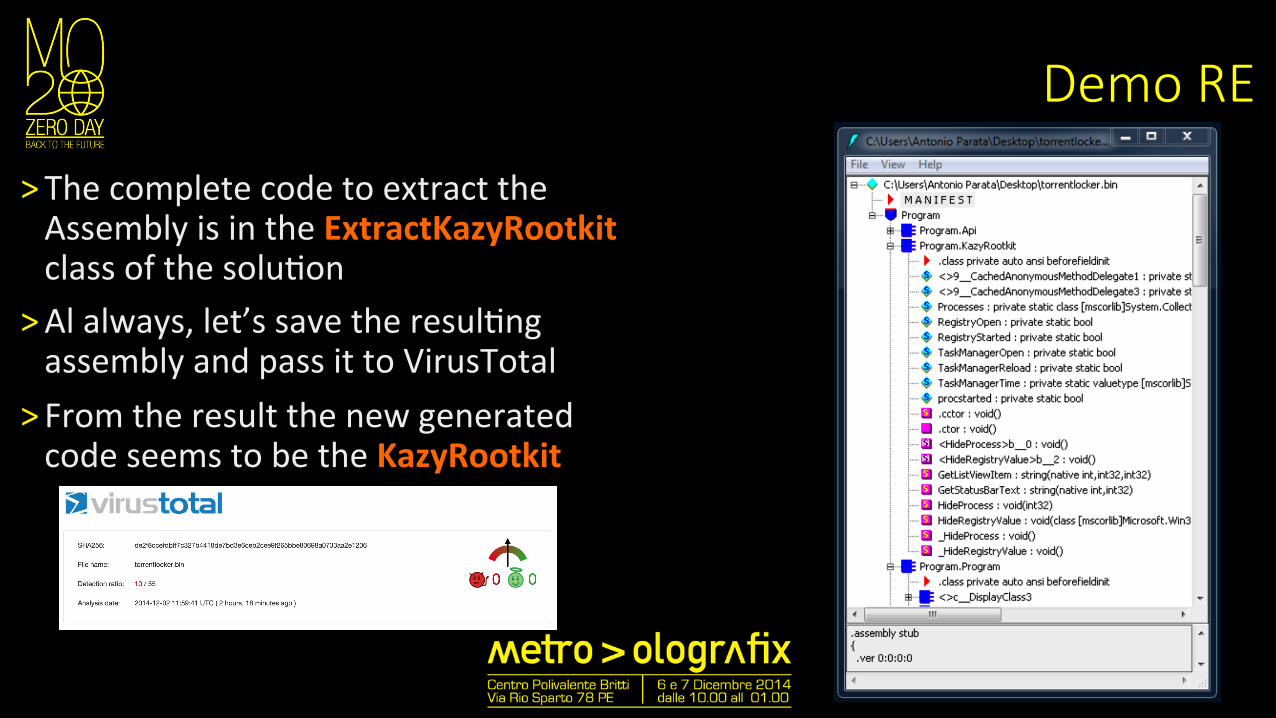
˃ The complete code to extract the Assembly is in the ExtractKazyRootkit class of the solu:on
˃ Al always, let’s save the resul:ng assembly and pass it to VirusTotal
˃ From the result the new generated code seems to be the KazyRootkit
Demo RE
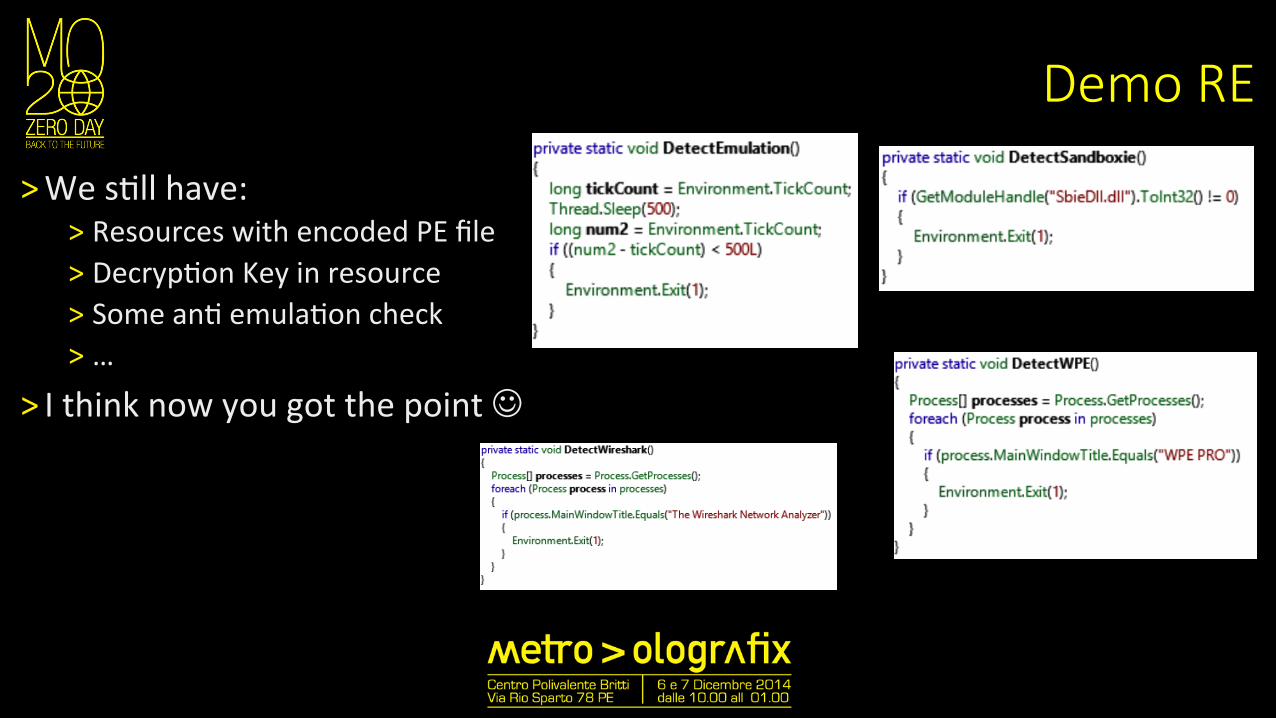
˃ We s:ll have: ˃ Resources with encoded PE file ˃ Decryp:on Key in resource ˃ Some an: emula:on check ˃ …
˃ I think now you got the point J
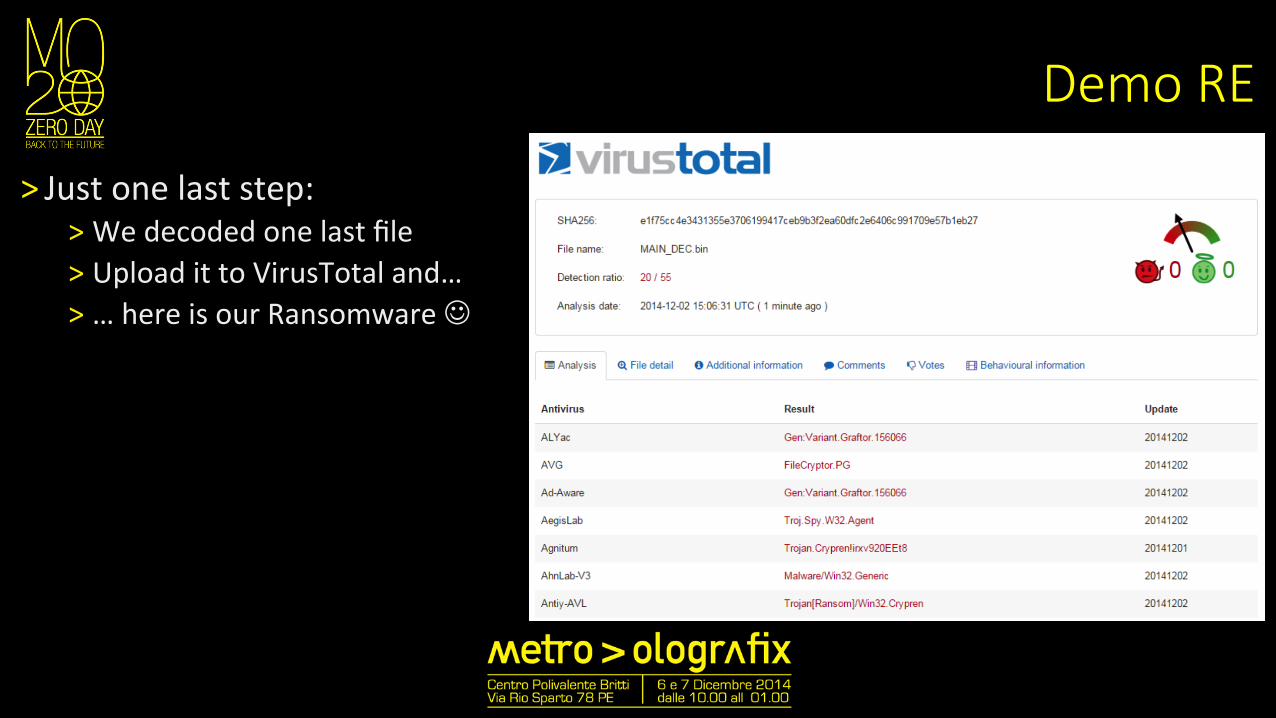
Demo RE
˃ Just one last step: ˃ We decoded one last file ˃ Upload it to VirusTotal and… ˃ … here is our Ransomware J
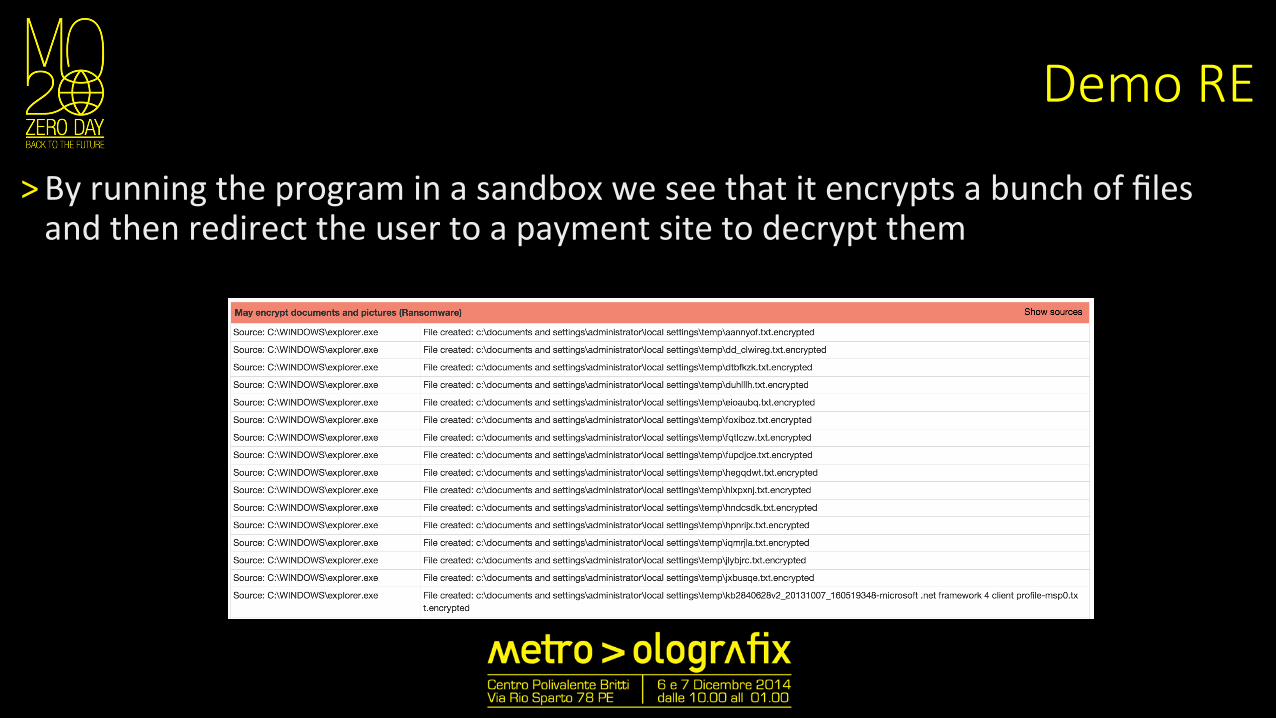
Demo RE
˃ By running the program in a sandbox we see that it encrypts a bunch of files and then redirect the user to a payment site to decrypt them
Thanks
Q&A
Reference
˃ References ˃ CLR via Csharp 4th Edi:on ˃ C# Deconstructed ˃ .NET IL Assembler ˃ Advanced .NET Debugging