net-map analysis of value network for maize and aflatoxin information flow...
TRANSCRIPT

Net-Map analysis of Value Network for Maize and Aflatoxin Information Flow in Kenya
Submitted by Marites Tiongco, IFPRI
1
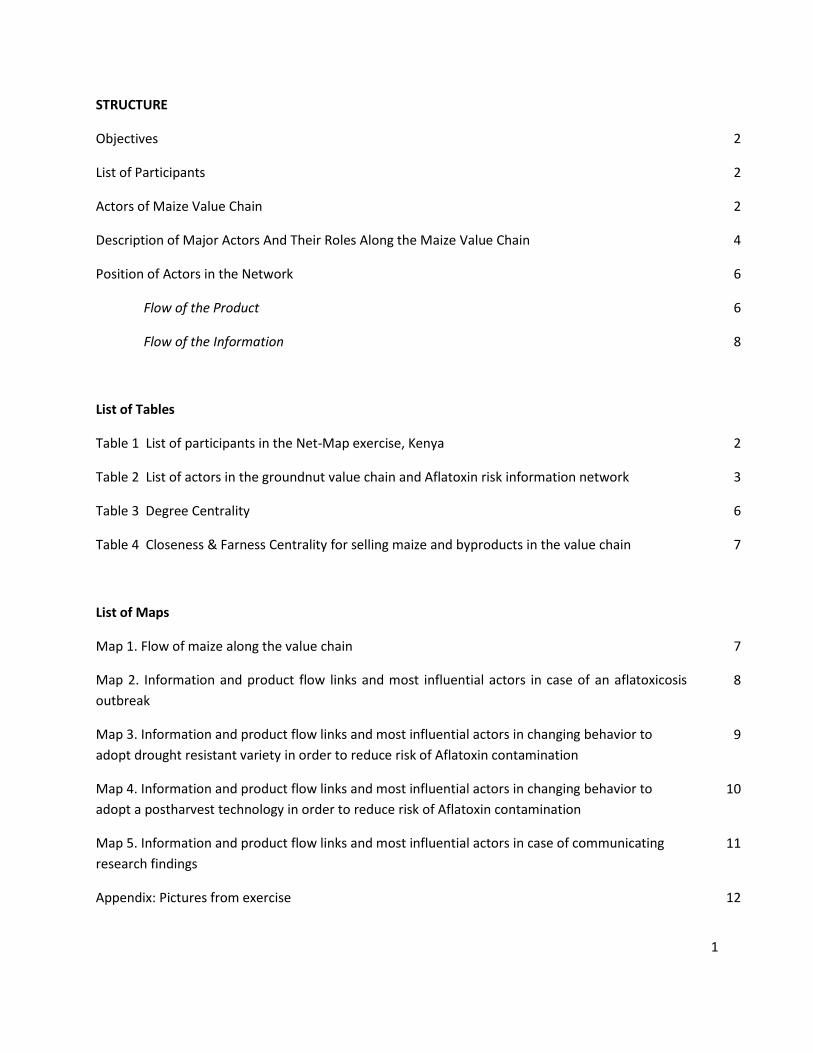
STRUCTURE
Objectives 2
List of Participants 2
Actors of Maize Value Chain 2
Description of Major Actors And Their Roles Along the Maize Value Chain 4
Position of Actors in the Network 6
Flow of the Product 6
Flow of the Information 8
List of Tables
Table 1 List of participants in the Net-Map exercise, Kenya 2
Table 2 List of actors in the groundnut value chain and Aflatoxin risk information network 3
Table 3 Degree Centrality 6
Table 4 Closeness & Farness Centrality for selling maize and byproducts in the value chain 7
List of Maps
Map 1. Flow of maize along the value chain 7
Map 2. Information and product flow links and most influential actors in case of an aflatoxicosis
outbreak
8
Map 3. Information and product flow links and most influential actors in changing behavior to
adopt drought resistant variety in order to reduce risk of Aflatoxin contamination
9
Map 4. Information and product flow links and most influential actors in changing behavior to
adopt a postharvest technology in order to reduce risk of Aflatoxin contamination
10
Map 5. Information and product flow links and most influential actors in case of communicating
research findings
11
Appendix: Pictures from exercise 12

2
Objectives The objective of this exercise was to identify the actors, information flows along the maize value chain,
and the institutional responses to Aflatoxin contamination. The following questions were asked:
• What/who are the formal and informal actors, private/public involved in the value chain?
• What are their roles? Who in the value chain is influential in terms of managing risk of Aflatoxin contamination?
• How does information flow in the value chain?
List of Participants
Twenty participants from different institutions took part in the net-mapping exercise (Table 1).
Table 1: List of participants in the Net-Map exercise, Kenya
Name Affiliation
1 Archileo N. Kaaya Makerere University
2 Briget Okumu East Africa Grain Council
3 Clare Narrod International Food Policy Research Institute (IFPRI)
4 Diana Grusczynski Bill and Melinda Gates Foundation
5 Felicia Wu University of Pittsburgh
6 Francis Nangayo African Agricultural Technology Foundation
7 George Mahuku International Maize and Wheat Improvement Center (CIMMYT)
8 Gerald Mumma Centers for Disease Control and Prevention (CDC)
9 Hugo De Groote CIMMYT
10 Jonathan Hellin CIMMYT
11 Judith Chambrelin Uniformed Services University of the Health Sciences
12 Kevin Manyara Lesiolo Grain
13 Marties Tiongco IFPRI
14 Ranajit Bandyopadhyay International Institute of Tropical Agriculture
15 Rebecca Nelson Cornell University
16 Sila Nzioki Kenya Agricultural Research Institute
17 Sophie Walker Agricultural Cooperative Development International/ Volunteers in Overseas Cooperative Assistance (ACDI/VOCA)
18 Steve Collins ACDI/VOCA
19 Vivian Hoffmann University of Maryland
20 Zippy Mbati World Food Program
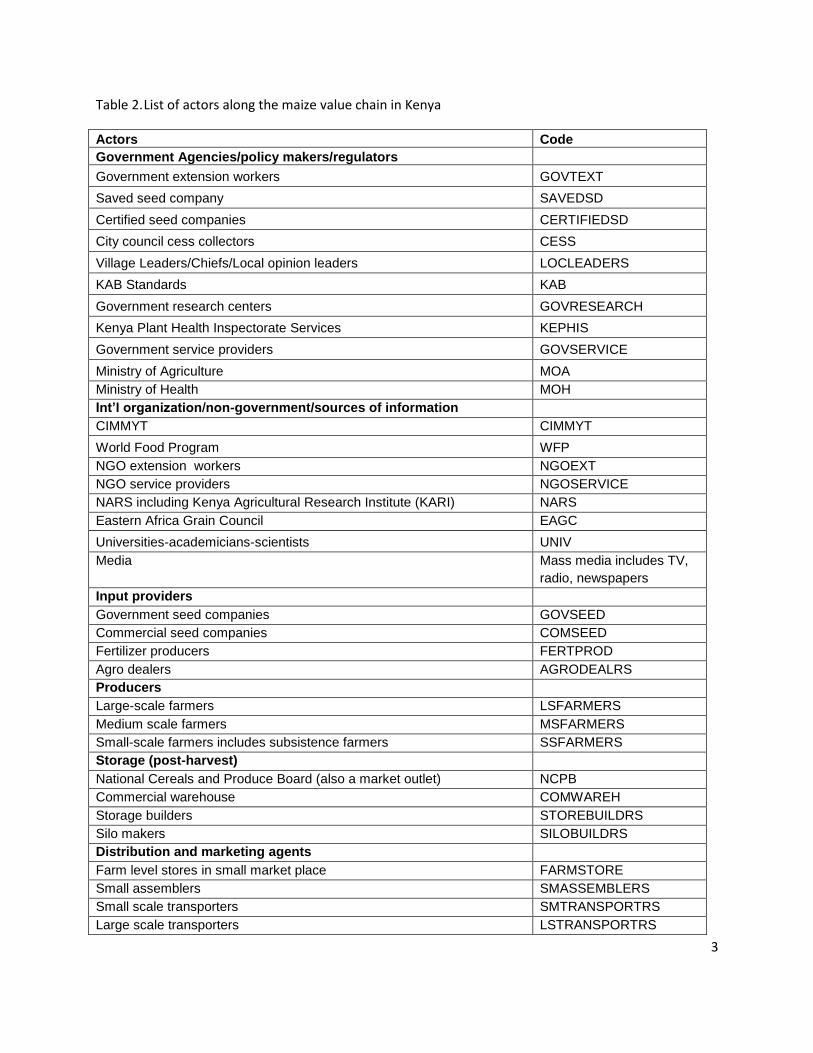
Actors of Maize Value Chain
The actors identified by the participants include farmers, service providers, and institutions involved in
managing the risk of Aflatoxin contamination in maize (Table 2).
3
Table 2. List of actors along the maize value chain in Kenya
Actors Code
Government Agencies/policy makers/regulators
Government extension workers GOVTEXT
Saved seed company SAVEDSD
Certified seed companies CERTIFIEDSD
City council cess collectors CESS
Village Leaders/Chiefs/Local opinion leaders LOCLEADERS
KAB Standards KAB
Government research centers GOVRESEARCH
Kenya Plant Health Inspectorate Services KEPHIS
Government service providers GOVSERVICE
Ministry of Agriculture MOA
Ministry of Health MOH
Int’l organization/non-government/sources of information
CIMMYT CIMMYT
World Food Program WFP
NGO extension workers NGOEXT
NGO service providers NGOSERVICE
NARS including Kenya Agricultural Research Institute (KARI) NARS
Eastern Africa Grain Council EAGC
Universities-academicians-scientists UNIV
Media Mass media includes TV,
radio, newspapers
Input providers
Government seed companies GOVSEED
Commercial seed companies COMSEED
Fertilizer producers FERTPROD
Agro dealers AGRODEALRS
Producers
Large-scale farmers LSFARMERS
Medium scale farmers MSFARMERS
Small-scale farmers includes subsistence farmers SSFARMERS
Storage (post-harvest)
National Cereals and Produce Board (also a market outlet) NCPB
Commercial warehouse COMWAREH
Storage builders STOREBUILDRS
Silo makers SILOBUILDRS
Distribution and marketing agents
Farm level stores in small market place FARMSTORE
Small assemblers SMASSEMBLERS
Small scale transporters SMTRANSPORTRS
Large scale transporters LSTRANSPORTRS

4
Primary traders PRIMTRADERS
Secondary traders SECTRADERS
Wholesale traders WHOLESALERS
Processed product retailers PROCSDRETAILRS
Grain retailers GRAINRETAILRS
Contract traders CONTRADERS
Export-Import Traders XMTRADERS
Large farm-level stores big market place LSTORES
Paid stores PDSTORES
Processors
Food processors PROCESSORS
Corn oil processors CORNOIL
Kumi-kumi producers- moonshine produced with rejected grain KUMI2
Formal commercial millers COMILLERS
Large posho millers LSPOSHO
Small posho millers SSPOSHO
Animal feed millers FEEDMILRS
CPC starch/flour processors CPCFLOUR
Alcohol producers ALCOHOL
Consumers
Rural consumers including maize farmers RURALCON
Urban Consumers URBANCON
Supermarkets SUPERMKTS
Community health workers HEALTHWORKRS
Hospital workers HOSPITALW
Schools(public) SCHOOLS
Livestock LIVESTOCK
Catholic Diocese; Church leaders & groups CHURCH
Description of major actors and their roles along the maize value chain
Small-scale farmers—these are maize producers producing small amount of maize (from less than 5
acres of land) and sell them to farm level stores; usually they run out of maize so they purchase for
home consumption. They do not produce enough grains for home consumption and are actually net
buyers of grain over the course of the year.
Medium-scale farmers—these are farmers producing medium volume of maize (from 5-20 acres of
land).
Large-scale farmers—these are farmers producing large volumes of maize (from more than 30 acres of
land) and sell their grain to NCPB and large commercial millers.
Small Assemblers –these are the first commercial purchasers of maize from the maize field. They buy
maize directly from several farmers in bulk to capture economies of scale in transport to local markets,

5
and sell it to wholesalers and retailers, and sometimes directly to consumers. In some cases, they also
act as purchasing agents of large commercial millers.
Wholesalers –are traders who buy maize from assemblers and sell it to retailers or millers. They usually
buy maize from surplus areas and sell it to deficit areas, and in large market places.
Primary and secondary traders–these are local maize traders who buy maize from large wholesalers and
assemblers and sell it to smaller-scale retailers and final consumers. Secondary traders are also retailers
in small market places where maize was stocked and sold in small volumes.
Formal commercial millers—these are large-scale millers who deal with large volumes of maize and do
their own packaging. These millers are capital intensive and use roller-milling technology that produces
a more refined meal. They acquire maize from wholesalers, NCPB stores, and large farmers.
Posho millers—these are also under the category of traders who acquire maize directly from farmers
but are involved in processing maize grain into whole maize meal (posho). Posho millers use simple
hammer milling technology where the germ and bran of the maize grain are milled together with the
kernel to produce flour. Small-scale posho millers are involved in custom milling where the customer
provides the maize grain and mill it for a fee. Large-scale posho millers are involved in production milling
with bigger capacity than small-scale posho millers and are also involved in packaging and retailing
maize meal. They also stock maize for resale to consumers.
Farm level stores—are market outlets located in small market places.
Kenya Plant Health Inspectorate Services (KEPHIS)—is an independent regulatory agency to ensure
quality of agricultural inputs, such as seeds and fertilizer produce in Kenya. It undertakes Plant Variety
Protection, Seed Certification, Phytosanitary Inspection of Imports and Exports and Analysis of Soil,
Water, Agricultural Produce, Fertilizers and Pesticides.
National Cereals and Produce Board (NCPB)—is a cereal purchasing, marketing, and price regulatory
agency that ensures a whole year round supply of cereals for the nation.
Eastern Africa Grain Council (EAGC)—is a regional organization for the grain value chain stakeholders
whose members are farmers, traders, millers and service providers such as banks, warehouse operators
and input suppliers from the East African Community (EAC), Common Market for Eastern and Southern
Africa (COMESA) and Southern Africa Development Cooperation (SADC) regional trading blocs
(http://www.eagc.org/section.asp?ID=39).
Extension service providers—these are extension workers responsible for the delivery of extension
service including dissemination of technology

6
Position of actors in the network
Flow of the product:
Maize is produced using several inputs such as seeds, fertilizer, capital, and labor. Once harvested, maize
move from the farmer/producer to the middlemen, which include assemblers, primary and secondary
traders, and transporters, then to processors, millers, wholesalers, retailers, and finally to
consumers/end users. All these actors stock maize either for consumption or retail, thus they use grain
storage facilities such as warehouse and silos. Consumers include rural and urban consumers (including
farmer/producers of maize), regional and international markets, supermarkets, livestock (fed with reject
grains), and relief organizations (such as WFP).
Degree centrality reveals the number of links an actor have in the network. Figure 1 shows that medium-
scale farmers, secondary traders, farm level stores, wholesalers, and commercial millers are among the
value chain actors that exhibited the highest degree of centrality (10-13 links). In particular, the critical
points of intervention in reducing the risk of Aflatoxin contamination are where there are medium-scale
farmers and secondary traders.
Table 3: Degree Centrality
Actors Degree
MSFARMERS 13
SECTRADERS 12
FARMSTORE 11
WHOLESALERS 10
COMILLERS 10
SSFARMERS 9
PRIMTRADERS 9
MEDIA 9
SMASSEMBLERS 8
AVG: 4.323
STD: 3.042
MIN: 1
MAX: 13
Closeness Centrality indicates how many steps it takes from one actor to every other actor in the
network. High closeness value means that the actor is closer to other actors (fewer steps to reach other
actors) and hence if they are contaminated, they might be epicentres of aflatoxin contamination. Among
the value chain actors that have been identified to have high closeness are primary and secondary
traders, small to medium-scale farmers, farm level stores, and wholesalers.

7
Table 4: Closeness & Farness Centrality for selling maize and byproducts in the value chain
Actors Far Close
SECTRADERS 58.0 0.017
MSFARMERS 59.0 0.017
FARMSTORE 59.0 0.017
WHOLESALERS 59.0 0.017
PRIMTRADERS 62.0 0.016
SSFARMERS 63.0 0.016
AVG: 84.7 0.012
STD: 16.6 0.002
MIN: 58.0 0.007
MAX: 141.0 0.017
Maximum possible closeness: 0.02
Map 1. Flow of maize along the value chain

8
Flow of information:
Figure 2 shows the most influential actors (with bigger nodes) in terms of managing risk of Aflatoxin
during an outbreak. The most influential actors, as represented by the size of the nodes, are the
Ministry of Health, government and non-government service providers, followed by the media such as
radio to get the message out and then the Ministry of Agriculture, and NCPB. It is important to note that
mobile phones (particularly text messaging) are effective means of communicating information related
to price and other market information.
Map 2. Information and product flow links and most influential actors in case of an aflatoxicosis
outbreak
Legend: links red information on knowledge, technology, and market
green poultry product flow
Figure 3 shows the most influential actors in facilitating changes in behavior or when communicating
knowledge and awareness of ways to mitigate risk of Aflatoxin contamination, for example using

9
drought resistant varieties. The most influential actor is CIMMYT, followed by commercial seed
distributors, media, then agro dealers, medium-scale farmers, urban and rural consumers, non-
government service providers, local leaders, Ministry of Agriculture, and feed millers and commercial
millers. It should be noted that CIMMYT works very closely with Kenya Agricultural Research Institute
(KARI) who is involved in technology development, adoption and dissemination to farmers and other
actors. Hence, KARI should, in principle, also should be considered as most influential actor. This
however did not appear during the net-mapping exercise as KARI was not explicitly identified by the
participants.
Map 3. Information and product flow links and most influential actors in changing behavior to adopt
drought resistant variety in order to reduce risk of Aflatoxin contamination
Legend: links red information on knowledge, technology, and market
green poultry product flow
Figure 4 shows the most influential actors when communicating knowledge and awareness of ways to
minimize the risk of Aflatoxin contamination, for example adopting a postharvest technology that would
minimize harvest losses such as metal silos for storage. At the village and community levels, the most

10
influential actors identified are local leaders, followed by media, then agro dealers and non-government
extension workers.
If the risk mitigation strategy is destroying all contaminated maize and maize found within a certain
kilometer radius, then millers and traders will be the most influential actors in the whole chain. It is
interesting to note that post-harvest technology providers (such as silo makers) did not turn out to be
influential actors.
Map 4. Information and product flow links and most influential actors in changing behavior to adopt a
postharvest technology in order to reduce risk of Aflatoxin contamination
Legend: links red information on knowledge, technology, and market
green poultry product flow
Figure5 shows map of actors who are most influential in communicating research findings from this
project. The most influential actors identified are local leaders, followed by media, then agro dealers
and non-government extension workers. Research findings therefore need to be communicated to local
leaders, but most importantly to those who provide information to local leaders. The media could be the

11
most critical, in terms of acquiring the information from scientists, packaging and translating it to local
leaders and other actors.
The critical points of intervention would be wherever there is a storage or store, particularly at the farm level.
Map 5. Information and product flow links and most influential actors in case of communicating
research findings
Legend: links red information on knowledge, technology, and market
green poultry product flow
The net maps shown above are a result of perceptions of participants (mainly representing research
institutions) of the net-mapping exercise. They make look messy and complex at a glance, but the net
maps imply that all participants actively participated and discussed their ideas about the topic. It is also
possible that these net maps will vary if other actors along the value chain were present during the
exercise. Qualitative research at the beginning of the project (using participatory value chain analysis

12
and market mapping) will rapidly help the project team and its partners identify the key actors in the net
maps shown above where they can focus their efforts to prevent and control Aflatoxin contamination.
Disclaimer: The views expressed in this report are those of the authors and are not necessarily endorsed
by or representative of IFPRI or of the co-sponsoring or supporting organizations. This brief is intended
for discussion. It has not yet undergone editing.
For more information visit: http://www.ifpri.org/afla/afla.asp
APPENDIX: Pictures from exercise

13