net map (influence network mapping) theory 02 networking mapping... · net‐map (influence network...
TRANSCRIPT
Small Reservoirs Toolkit
1
Net‐Map (Influence Network Mapping) ‐ Theory
Authors Eva Schiffer, International Food Policy Research Institute
Jennifer Hauck, Center for Development Research, ZEF
Acknowledgements
The authors want to thank the people and institutions that made the development and use of the Net-Map tool possible. The tool was developed within the project “Integrating Governance and Modeling” funded by the CGIAR Challenge Program for Water and Food and lead by the International Food Policy Research Institute. The case studies are drawn from this project and from a PhD thesis hosted at the Center for Development Research, University of Bonn and supported by the IPSWaT-Program and the GLOWA Volta Project, which are both funded by the German Federal Ministry of Education and Research. We are grateful for the support and inspiration we received from our research colleagues, especially Regina Birner, Boru Douthwaite and Douglas Waale. The work presented here wouldn’t have been possible without the collaboration and patience of our local collaborators, the governance actors of the White Volta Basin (especially basin officer Aaron Aduna), the translators and research assistants in the villages and the community members in selected fishing communities in the Upper East Region of Ghana.
Scope: questions/ challenges the tool addresses Net-Map is an interview-based mapping tool that helps stakeholders understand, visualize, discuss, monitor, evaluate and improve situations in which many different actors influence outcomes. Net-Map can be used as a facilitation tool, or in the context of research interviews. By creating Influence Network Maps, individuals and groups can clarify their own views of a situation, foster discussion, and develop a strategic approach to networking activities. For a specific situation, Net-Map helps stakeholders define:
• The kinds of influence that exist • The roles played by actors • The actors that are involved in a given network • How and why different actors are linked • The degree to which different actors have influence • The respective goals of different actors
Because they have a better understanding of linkages among actors, and their respective levels of influence and goals, Net-Map users can be more strategic in planning which actions to take in complex situations. It helps users answer such as questions: “Should we strengthen our links to influential supporters who share our goals? Which influential actors do not share our goals? Can increased networking help empower otherwise powerless stakeholders? Which actors typically cause conflicts? Which actors are parties to a conflict? Where are the bottle-necks that prevent a free flow of information?
Small Reservoirs Toolkit
2
The Net-Map tool can be used to examine networks at any scale of analysis: local, national, international, or even global. The scale of analysis depends only on the question being addressed. Moreover, the tool can be used to analyze networks and linkages at multiple scales. For example, assessment of marketing chains can begin with local producers and end with regional and national middlemen, or global markets. The tool can help analyze flows in project networks as well as influence within organizations. In combination with other participatory tools such as timelines, Net-Maps can identify the critical path to success for policies or projects, and understand how the influence of actors changes at different turning points.
Target groups The Net-Map tool can be used by a wide range of researchers, development workers, policy makers and project managers who would like to better understand complex governance and management situations, and alternative ways of dealing with them.
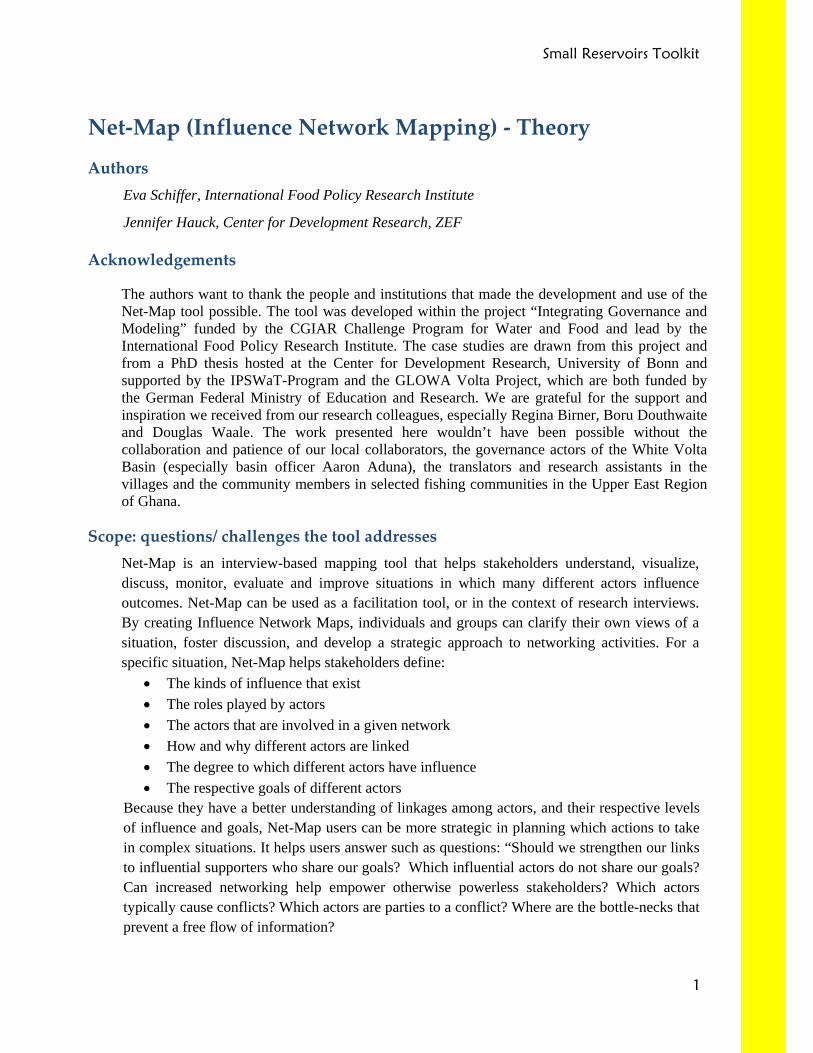
Requirements for application Net-Maps are a low-tech and low-cost tool that can be used with a wide range of participants, from rural community members with little formal education, to policy makers or international development actors. The tool can be used with groups or with one participant at a time. Materials include:
• Large sheets of paper for drawing network maps, one per interview, preferably A2 (420x594 mm) or similar in size
• Felt pens for drawing links between actors: different colors are used for different kinds of links
• Adhesive or “Post-It” paper for actor cards: different colors are used for different kinds/groups of actors
• Flat stackable discs for building influence-towers, for example, checker pieces or bicycle spare parts
• A person with a field notebook: for recording observations and additional information emerging from the interview
• Actor figures or board game figures: optional but useful when some participants lack literacy
• Small mat or carpet for sitting: optional, but useful when tables are not available
Picture 1: Some equipment used for the mapping (Source: Hauck, 2007).
Small Reservoirs Toolkit
3
Description and application The Net-Map tool is easy to use and is structured around the steps described below. This list of steps is intended as a guide. Steps may be performed in a different order or they may be modified. Some steps may be left out entirely, or new steps added, according to the needs of the interview and the convenience of participants. Lengthy interviews can be divided into two sessions. Careful preparation before going to the field will avoid wasting participants’ time and will reduce problems in data processing and analysis.
Preparation • Define the research question. This is the question that guides the rest of the process.
Experience shows that data collection and analysis and implementation of results go more smoothly if the research question is concrete, well chosen and properly framed. Examples of suitable questions are: “Who influences the success of your project?” “Who influenced this change in legislation?” “Who influences water use in this small reservoir?”
• Collect needed non-network information in advance. If the research question focuses on who influences the performance of an institution or project, performance information is needed for that institution or project.
• Define kinds of links. Identify which kinds of links should be mapped. This can include e.g. giving money, issuing command, giving advice etc. Assign different colors to different kinds of links, for example, links involving the giving of money might be drawn in red.
• Define goals of actors. Explore the conflicting goals of different actors, for example, the goals they might have with regard to “the success of the project”, “a change in legislation” or “water use in the reservoir” (actors may be in favor of or against the change in legislation, or have an environmental vs. development orientation regarding water use).
• Select participants. Decide who should be involved in interviews/discussion. Select specific partners or groups for the first round of interviews.
These preparatory steps should be done in cooperation with stakeholders to make sure the right questions are asked and the outcomes relevant.
During the interview 1. Define concepts
• Discuss with participants their understanding of what is meant by “influence”, and what is meant by the different links between actors such as “disturbing each other”, “giving command”, etc.
• Note examples given by participants that clarify these meanings
2. Select actors
• Ask: “Who is involved in this process?”
Small Reservoirs Toolkit
4
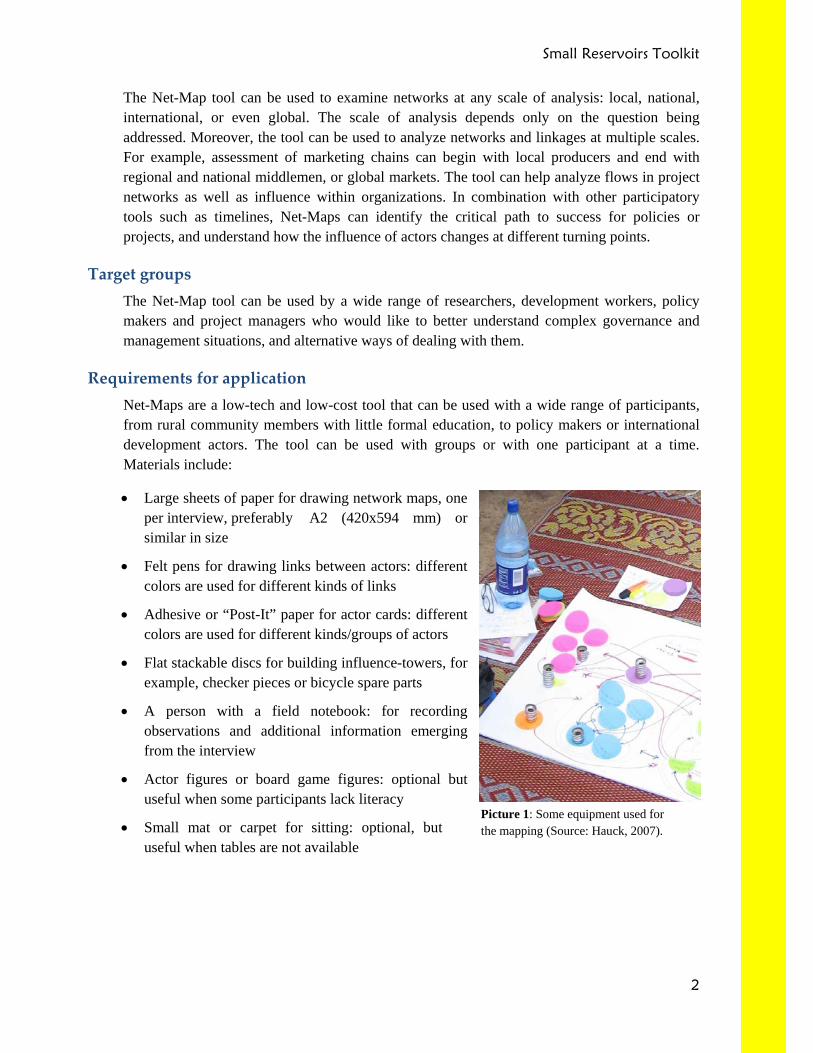
• Write names of actors on “actor cards” (one name per card) and distribute the cards on an empty Net-Map sheet (picture 2). When working with an illiterate participant, actor figures can be placed next to the corresponding cards to make it easier to identify actors. Cards of different colors can used for different categories of actors, in which case a legend should be added, for example, “red = NGO” or “green = government”.
Picture 2: Collect actor names, write on actor ards and distribute them on map (Source: Schiffer, 2008).
3. Draw links
• Ask: “Who is linked to whom?” Go through the links one by one (e.g. “Who gives money to whom? Who disturbs whom?”)
• Draw arrows linking actor cards, according to the participant’s directions.
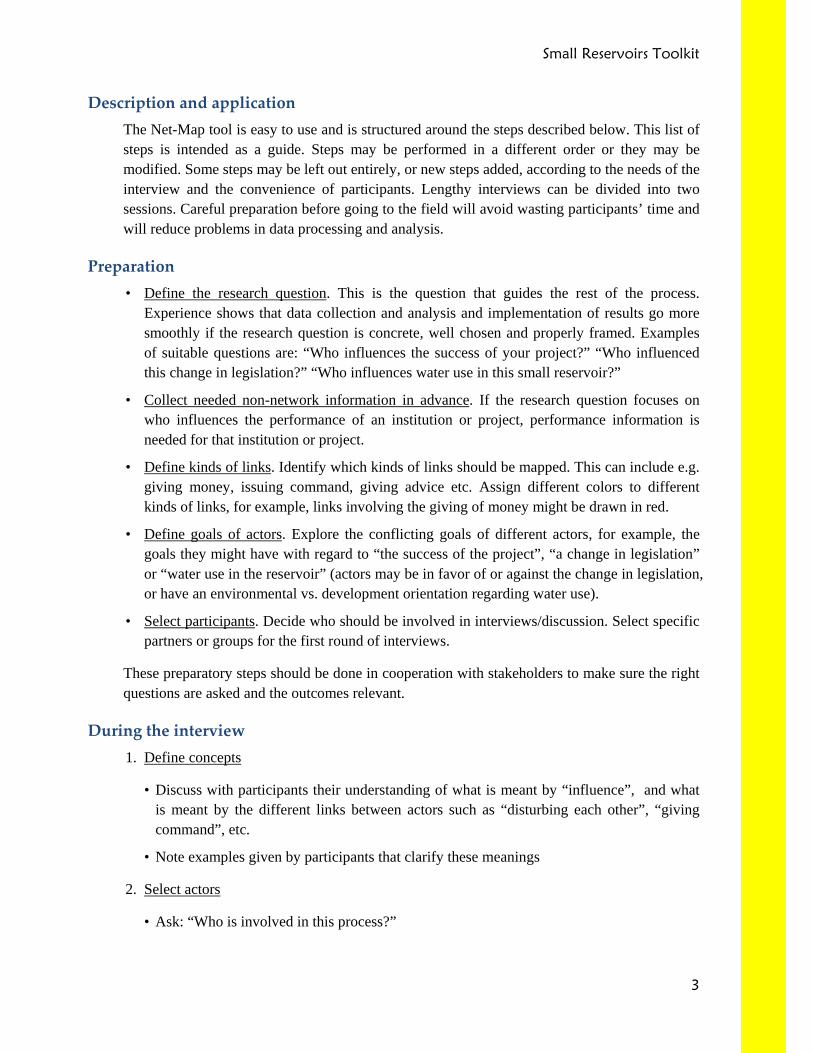
• If pairs of actors engage in two-way exchange, for example, exchanging information with each other, draw double headed arrows. If pairs of actors engage in more than one kind of exchange, indicate this by using extra arrow heads in the line that links them, with the colors of arrow heads indicating the kinds of exchange (see picture 3).
Picture 3: If actors have more than one link (e.g. giving money and giving command), add arrow heads of different color to links (Source: Schiffer, 2008).
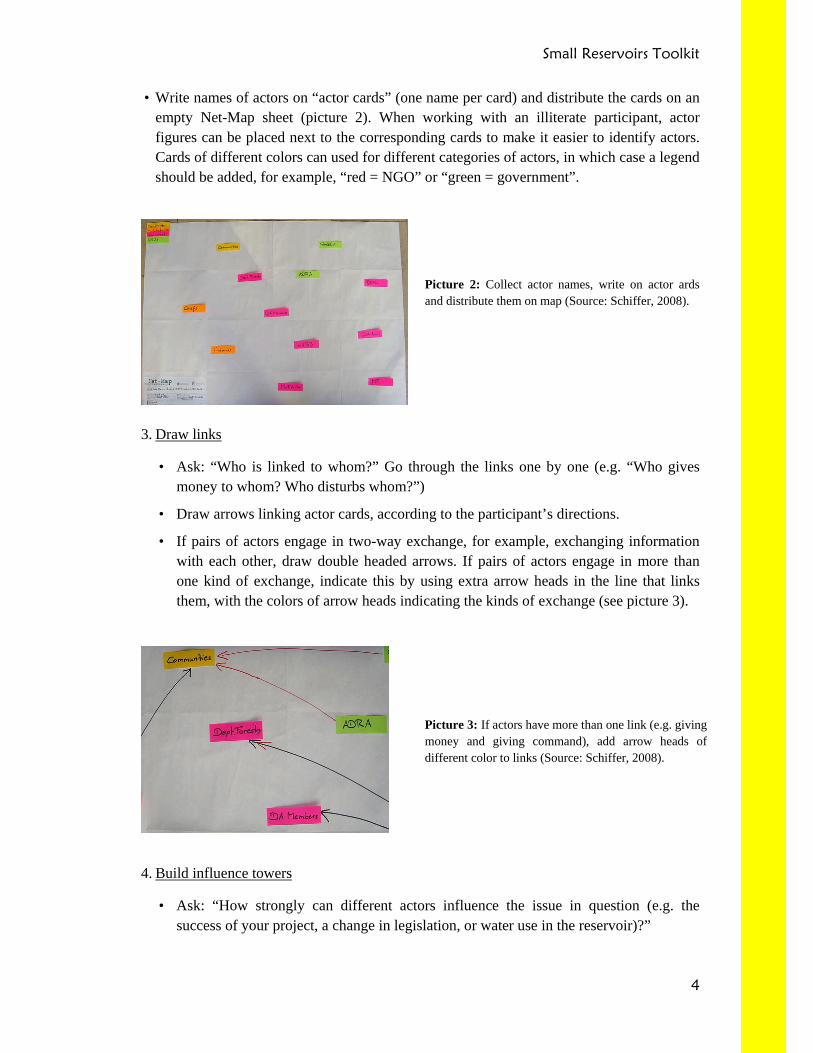
4. Build influence towers
• Ask: “How strongly can different actors influence the issue in question (e.g. the success of your project, a change in legislation, or water use in the reservoir)?”
Small Reservoirs Toolkit
5
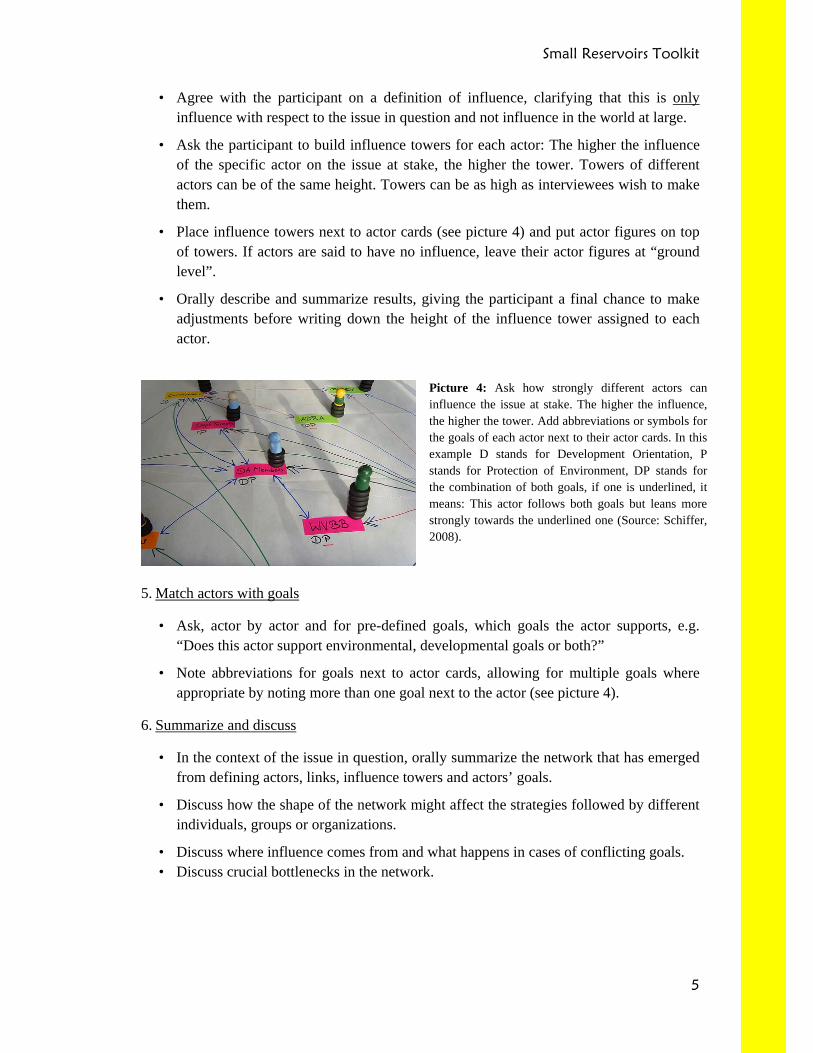
• Agree with the participant on a definition of influence, clarifying that this is only influence with respect to the issue in question and not influence in the world at large.
• Ask the participant to build influence towers for each actor: The higher the influence of the specific actor on the issue at stake, the higher the tower. Towers of different actors can be of the same height. Towers can be as high as interviewees wish to make them.
• Place influence towers next to actor cards (see picture 4) and put actor figures on top of towers. If actors are said to have no influence, leave their actor figures at “ground level”.
• Orally describe and summarize results, giving the participant a final chance to make adjustments before writing down the height of the influence tower assigned to each actor.
Picture 4: Ask how strongly different actors can influence the issue at stake. The higher the influence, the higher the tower. Add abbreviations or symbols for the goals of each actor next to their actor cards. In this example D stands for Development Orientation, P stands for Protection of Environment, DP stands for the combination of both goals, if one is underlined, it means: This actor follows both goals but leans more strongly towards the underlined one (Source: Schiffer, 2008).
5. Match actors with goals
• Ask, actor by actor and for pre-defined goals, which goals the actor supports, e.g. “Does this actor support environmental, developmental goals or both?”
• Note abbreviations for goals next to actor cards, allowing for multiple goals where appropriate by noting more than one goal next to the actor (see picture 4).
6. Summarize and discuss
• In the context of the issue in question, orally summarize the network that has emerged from defining actors, links, influence towers and actors’ goals.
• Discuss how the shape of the network might affect the strategies followed by different individuals, groups or organizations.
• Discuss where influence comes from and what happens in cases of conflicting goals. • Discuss crucial bottlenecks in the network.
Small Reservoirs Toolkit
6
Data collection and analysis The Net-Map tool is based on the principles of social network analysis (SNA). However, it is not necessary that users be SNA experts. For a qualitative understanding of networks, the maps themselves give immediate, easy-to-understand insights. Users and facilitators may further benefit from an understanding of basic principles of SNA, such as ways to measure the centrality of actors. Data collected from maps can also be used in more complex and quantitative forms of SNA (e.g. Cross et. al. 2002, Hanneman, 2001, Schiffer, 2007).
Data analysis can be done at three levels according to the specific goals of the exercise:
1. Visual analysis of maps with participants: Through short feedback and learning loops, implementers and participants can visually and intuitively interpret the network maps they have drawn.
2. Transformation of maps into computer graphics for visual analysis by non-participants: When the number of network maps is small, they can be entered into a visualization program such as VisuaLyzer™ (see Schiffer, Hauck, Abukari 2007) and shared with readers who were not involved in the interview process.
3. Quantitative analysis of maps: When the number of network maps is large, quantitative analysis and comparisons can be performed through the use of programs such as UCINet™ or VisuaLyzer™. Both offer free trial versions on the internet. The former seems more refined in quantitative analysis while the later appears more user-friendly.
Possible questions for further quantitative analysis:
• Who are “gate-keepers”, or actors capable of either encouraging or cutting links between different well-connected network clusters, or between different kinds of actors (e.g. between regional and village level actors)?
• For different kinds of links (commands, funds, advice, etc.), how does the centrality of actors affect their influence as measured by the height of their respective influence towers?
• How similar or different are networks drawn by different participants? To what extent does the position of a participant in a network result in its map being drawn differently?
• How is network structure related to performance? For example, do communities with dense and complex networks attract more external assistance than those with weak networks? For this kind of analysis, additional (non-network) data about performance is needed.
Lessons learned and recommendations Net-Map provides a flexible structure that can be adapted to a wide variety of issues and questions (see Part 2 and 3 on case studies in this volume). It is most effective when research questions, the goals of the exercise, the kinds of links, and the notion of “influence” are concretely and clearly defined. Interviews should be “as short as possible and as long as necessary”.
Small Reservoirs Toolkit
7
A pre-test is highly recommended. During a pre-test, the translation of key terms into local languages can be discussed and agreed. If two kinds of links nearly always occur together in the pre-test, they might be collapsed into a single link, or one link might be selected that represents both. Links that “link everyone to everyone else” in the network should be either deleted or re-defined. (This situation may occur when links are left vague, for example, “information transfer” links where the kind of information is not specified). It usually makes sense to limit the network exercise to three or four different colors/kinds of links so as to avoid cluttered maps and lengthy interviews.
The result of each interview is a representation of how one participant or group perceives the network. Krackhardt has written extensively about how these different views can be joined into one more general and reliable network view (which he calls “cognitive social structure” Krackhardt 1987). While it is not always necessary to perform the rather complex stacking of individual networks and quantitative analysis of the resulting cognitive social structure, it is highly recommended that network views from different perspectives be collected, to get a more complete picture.
Limitations • Net-Map is a time consuming tool. Preparing for field work, gathering relevant non-network
information, conducting the interviews, and subsequent data entry and analysis are all inherently time-consuming. However, some participants in group sessions observed that the Net-Map process can also be seen as a “short-cut”: it allows participants to understand each others’ perceptions more quickly than if the tool were not used.
• When trained enumerators are used for field work, network mapping interviews can be conducted with relative ease, even in larger studies with more communities or more interviews per community. Nonetheless, in these larger studies, it becomes more important to use quantitative approaches to data management and analysis to complement visual/qualitative analysis. This in turn requires that researchers have a greater depth of knowledge of the concepts and methods of SNA. (For further insights into combining different network views into a cognitive social structure, see e.g. Krackhardt 1987).
• An important issue in quantitative analysis is the sampling of interview partners. Although inclusion of all actors within a network is possible, in the majority of cases the actual number of influential actors is difficult to ascertain when starting the research. Because members of a given network are not randomly selected, social network analysts cannot use traditional statistical methods of data analysis. In their place, they have developed a different set of quantitative indicators and functions.
• Many interesting questions focus on how network parameters are related to external performance indicators (for example understanding how “success” in local water use is linked to local and external social networks). To answer questions like these, triangulation with non-network time-series data (regarding reservoir productivity or household income) is often required.
Small Reservoirs Toolkit
8
References Borgatti, S.P. 2003. Centrality and Network Flow 27(1): 55-71.
Cross, R., S.P. Borgatti, and A. Parker. 2002. Making Invisible Work Visible: Using Social Network Analysis to Support Strategic Collaboration. California Management Review 44(2).
Davies, R. 2003. Network Perspectives in the Evaluation of Development Interventions: More than a Metaphor. EDAIS Conference: New Directions in Impact Assessment for Development: Methods and Practice, November 24–25.
DFID (UK Department for International Development) and World Bank. 2005. Tool for Understanding Institutional, Political and Social Analysis (TIPS). Poverty Analysis and MDGs Team/World Bank Social Development Division. https://www.worldbank.org/tips.
Douthwaite, B., A. Carvajal, S. Alvarez, E. Claros, and L.A. Hernández. 2006. Building Farmers’ Capacities for Networking (Part 1): Strengthening Rural Groups in Colombia through Network Analysis. KM4D Journal 2(2): 4-18.
Hanneman, R.A. 2001. Introduction to Social Network Methods. Department of Sociology, University of California, Riverside.
Krebs, V. 2004. Power in Networks. http://www.orgnet.com.
Krackhardt, D. 1987. Cognitive Social Structures. Social Networks 9 (1987) pp. 109-134, North-Holland. Cornell University. USA
Schiffer, E., Waale, D. 2008. Tracing power and influence in networks: Net-Map as a tool for research and strategic network planning. (IFPRI Discussion Paper 772) Washington, D.C.: International Food Policy Research Institute
Schiffer, E. 2007. Net-Map – Influence Mapping of Social Networks. Manual. Presented at the Sunbelt Conference of the International Network of Social Network Analysis, 01-06 May 2007, Corfu, Greece
Schiffer, E., Hauck, J., Abukari, M. 2007. Influence Network Mapping: Mapping Linkages of Water Users’ Associations in IFAD-supported LACOSREP in Northern Ghana. Project Documentation, retrieved from: http://netmap.files.wordpress.com/2008/01/abukari_hauck_schiffer_07_netmap_wuas_ghana.pdf
Contacts and Links Eva Schiffer is an independent consultant, who works on further developing and using Net-Map as a tool for research, planning and facilitation. For more information please contact: [email protected]..
To learn more about Net-Map and the latest ideas and projects please visit: http://netmap.wordpress. com
For more details about the project “Integrating Governance and Modeling” see www.igm.uni-hohenheim.de
Small Reservoirs Toolkit
9
Annex 1
Net‐Map (Influence Network Mapping)
Case study: Organizational learning in multi‐stakeholder water governance
Author(s) Eva Schiffer (International Food Policy Research Institute)
Jennifer Hauck (Center for Development Research, ZEF)
Scope: questions/ challenges the tool addresses Net-Map is a tool for individual and organizational learning that uses visualization and mapping to facilitate the sharing of knowledge and opinions about complex governance situations, the discussion of differences and the development of common visions and strategic influence network planning. Furthermore the tool can be used for monitoring and evaluation of the network-development and as a basis for the planning of concrete interventions in complex policy fields.
The case study is drawn from the Challenge Program Project 40: “Integrating Governance and Modeling”. In this case the tool was used for a combined research and organizational learning activity with a new multi-stakeholder water governance organization, the White Volta Basin Board in northern Ghana. The organization is a river basin board on the sub-national level consisting of 17 institutional members representing district assemblies, regional level line ministries, traditional authorities, NGOs and the research sector. The basin board has low formal decision-making and enforcement authority and thus needs to strategically use its governance networks to achieve its developmental and environmental goals. In a process of three interventions spread over one year, the members of the new board clarified their own view of the governance network in which they are going to operate, discussed differing views in small groups, agreed on a common network for the whole group and developed strategic ideas based on the strengths and weaknesses of their network situation.
Target group The target groups of the tool are: Researchers, consultants (evaluation and organizational development), policy makers and development practitioners.
Requirements for application The tool is low-tech and low-cost and can easily be used with a variety of stakeholders. While a facilitator is needed especially for the group exercises, the method is easy to learn and a group member can take over the role of facilitation after a brief training.
Small Reservoirs Toolkit
10
Equipment needed for individual interviews or small groups:
Large sheets of paper for network maps (1 per interview), pens in different colors, adhesive paper as actor cards (e.g. “post-it”), flat round stackable discs (e.g. checker’s pieces) for building influence-towers, actor figurines, a field note-book.
Equipment needed for bigger groups:
Very large sheet of paper to stick to a wall, pens in different colors, cellular-tape, cardboard for actor cards (if names from previous interviews are used: print-out of actor cards in big print), cut-out cardboard rectangles to represent the stackable discs and cut-out actor figurines. During the network mapping with a bigger group it was more feasible to transform the flat three dimensional layout into a two dimensional one, which can be stuck to the wall. Thus every component was big enough to be clearly seen by every group member.
Description and application While the general steps for individual interviews are described in Net-Map (Influence Network Mapping) Part I, the focus here is on the way this tool can be used as part of a bigger process of research, learning and group development.
Preparation: • Question defined: “Who will influence whether and how the basin board will achieve its
goals?”
• Links defined: Lines of command, flow of funds, giving of advice and flow of information.
• Target group and interview partners defined: all members of the White Volta Basin Board.
Steps taken during the process: 1. Qualitative interviews with all board members about their goals and expectations for the
basin board. Feedback to board members through write-up and discussion.
2. First round of Net-Maps: Individual interviews, drawing Net-Maps with all board members concerning:
ο Who will influence the goal achievement of the board?
ο How are they linked (command, funds, advice, information)
ο How influential are they (influence towers)?
ο What are their goals (environmental, developmental or both)?
3. Second round of Net-Maps: Feedback on results from first round. Small group activity with groups of 6-7 board members and higher level policy makers in same governance field. Each group developed a network together (questions as in first round, actors limited to those mentioned in the previous step, small groups choose from prepared actor card print-outs).
Small Reservoirs Toolkit
11
4. Third round of Net-Maps: Feedback on results from second round. Whole basin board group develops a common network together (questions as in first round, actors limited to those mentioned in the previous step, group chooses from prepared actor card print-outs).
Data collected, learning processes and results The exercise described was done as both research and organizational development. So the results are significant both in terms of data collected and in terms of learning processes instilled in the group. One factor that distinguishes this tool from many other pure data collection tools is that a lot of the learning process happens during data collection and not through documents produced after data analysis. This makes using Net-Map very rewarding both for interviewer and interviewee. Furthermore it addresses the conflicting time frames of researchers and policy makers, where researchers often take more time to analyze collected data than policy makers can afford to wait before taking the related decision.
The data collected consist of network diagrams that can be analyzed with the standard social network analysis computer programs (e.g. VisuaLyzer™ or UCINet™, both offer free trial versions on the internet). In addition to the network data, a number of actor attributes is collected (height of influence towers, goals of actors plus characteristics like kind of organization, government level etc.). Depending on the research interest, different network parameters can be analyzed in relation to the actor characteristics.
The learning process for the board members started in the individual interviews by structuring and making their implicit network knowledge explicit. Every member had a certain understanding of who is involved in the governance setting, how they are linked, what their goals and influence are. However, in day-to-day business, they tended not to reflect upon the setting as a whole. Most interviewees commented on the increased understanding they gathered through visualizing their complex views of the governance field.
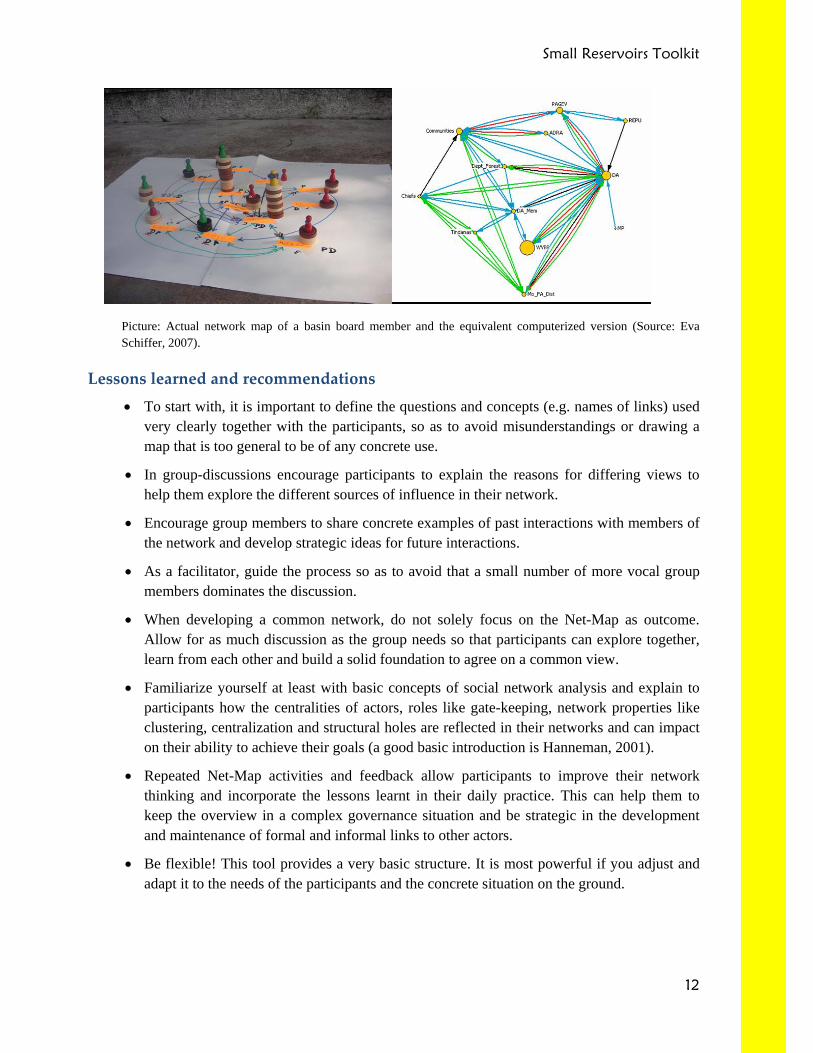
The work with the basin board showed that many board members assumed that everyone would share their view of the network (“This is how it is! Everybody will see it this way!”). So the first learning step for the members of the organization was to understand that views of the network can differ. In a facilitated group process board members explored how they could benefit from the different views represented in their organization. They understood the reasons for differences, and integrated their views into a common network map. When board members disagreed about details of the map they would explain the reasons for the disagreement and thus learn of previous interactions that other board members had with different actors and develop strategies for future use of the network together. Drawing a common Net-Map allowed the board members to identify a group of central, core-influence actors that they need to strongly involve in their activities, a bigger circle of influential actors that they want to collaborate with to a certain extent and a fringe of low influence actors that are not yet important but might increase the board’s success in the future.
Small Reservoirs Toolkit
12
Picture: Actual network map of a basin board member and the equivalent computerized version (Source: Eva Schiffer, 2007).
Lessons learned and recommendations • To start with, it is important to define the questions and concepts (e.g. names of links) used
very clearly together with the participants, so as to avoid misunderstandings or drawing a map that is too general to be of any concrete use.
• In group-discussions encourage participants to explain the reasons for differing views to help them explore the different sources of influence in their network.
• Encourage group members to share concrete examples of past interactions with members of the network and develop strategic ideas for future interactions.
• As a facilitator, guide the process so as to avoid that a small number of more vocal group members dominates the discussion.
• When developing a common network, do not solely focus on the Net-Map as outcome. Allow for as much discussion as the group needs so that participants can explore together, learn from each other and build a solid foundation to agree on a common view.
• Familiarize yourself at least with basic concepts of social network analysis and explain to participants how the centralities of actors, roles like gate-keeping, network properties like clustering, centralization and structural holes are reflected in their networks and can impact on their ability to achieve their goals (a good basic introduction is Hanneman, 2001).
• Repeated Net-Map activities and feedback allow participants to improve their network thinking and incorporate the lessons learnt in their daily practice. This can help them to keep the overview in a complex governance situation and be strategic in the development and maintenance of formal and informal links to other actors.
• Be flexible! This tool provides a very basic structure. It is most powerful if you adjust and adapt it to the needs of the participants and the concrete situation on the ground.
Small Reservoirs Toolkit
13
References Borgatti, S.P. 2003. Centrality and Network Flow 27(1): 55-71.
Cross, R., S.P. Borgatti, and A. Parker. 2002. Making Invisible Work Visible: Using Social Network Analysis to Support Strategic Collaboration. California Management Review 44(2).
Davies, R. 2003. Network Perspectives in the Evaluation of Development Interventions: More than a Metaphor. EDAIS Conference: New Directions in Impact Assessment for Development: Methods and Practice, November 24–25.
DFID (UK Department for International Development) and World Bank. 2005. Tool for Understanding Institutional, Political and Social Analysis (TIPS). Poverty Analysis and MDGs Team/World Bank Social Development Division. https://www.worldbank.org/tips.
Douthwaite, B., A. Carvajal, S. Alvarez, E. Claros, and L.A. Hernández. 2006. Building Farmers’ Capacities for Networking (Part 1): Strengthening Rural Groups in Colombia through Network Analysis. KM4D Journal 2(2): 4-18.
Hanneman, R.A. 2001. Introduction to Social Network Methods. Department of Sociology, University of California, Riverside.
Krebs, V. 2004. Power in Networks. http://www.orgnet.com.
Krackhardt, D. 1987. Cognitive Social Structures. Social Networks 9 (1987) pp. 109-134, North-Holland. Cornell University. USA
Schiffer, E., Waale, D. 2008. Tracing power and influence in networks: Net-Map as a tool for research and strategic network planning. (IFPRI Discussion Paper 772) Washington, D.C.: International Food Policy Research Institute
Schiffer, E. 2007. Net-Map – Influence Mapping of Social Networks. Manual. Presented at the Sunbelt Conference of the International Network of Social Network Analysis, 01-06 May 2007, Corfu, Greece
Contacts and Links Eva Schiffer is an independent consultant, who works on further developing and using Net-Map
as a tool for research, planning and facilitation. For more information please contact: [email protected].
To learn more about Net-Map and the latest ideas and projects please visit: http://netmap.wordpress. com
For more details about the project “Integrating Governance and Modeling” see www.igm.uni-hohenheim.de
Jennifer Hauck applied the tool in her PhD research aiming at managing fisheries in small reservoirs for resilience and harmonizing fisheries activities with other water uses and ecosystem needs. Her research in northern Ghana is supported by the IPSWaT-Program and the GLOWA Volta Project, which are both funded by the German Federal Ministry of Education and Research.
Small Reservoirs Toolkit
14
Annex 2
Net‐Map (Influence Network Mapping)
Case study: Research on Fisheries Management in Small Multipurpose Reservoirs
Author(s): Jennifer Hauck (Center for Development Research, ZEF)
Eva Schiffer (International Food Policy Research Institute)
Scope: questions/ challenges the tool addresses
Scope: questions/ challenges the tool addresses Increased fishing pressure and the absence of proper management structures lead to over-fishing and conflicts with other water users of small multi-purpose reservoirs in northern Ghana. These problems are the focus of the PhD research undertaken by Jennifer Hauck, who used Net-Map in four communities in the Upper East Region. The aim was to identify and understand networks of actors who influenced fisheries activities in small reservoirs, by answering the following questions:
– Which actors were involved and influenced fishing activities directly or indirectly?
– What kind of rules existed to regulate fisheries activities?
– Which actors were setting the rules and who broke them?
– What were the reasons for breaking the rules?
– How are new and traditional knowledge shared between the actors and where are dead ends in communication?
– How important were fishing activities as livelihood strategies compared to other water uses?
– Which actors profited from fishing activities and who felt negatively affected?
– What kind of dependencies did exist (e.g. networks of reciprocity or patron-client relations) and who was involved/excluded?
– Who could help to design sound management regulations and who could implement them successfully in the future?
The focal scale of the case study was clearly a local one. However, considerable influence came from the governmental organizations on the regional level that were in turn influenced by national policy and international research and development projects.
Small Reservoirs Toolkit
15
Target group In this case study the tool was used primarily as a research tool. However the results were used to enhance group formation procedures and proved useful for researchers as well as for research oriented development practitioners.
Requirements for application The tool is low-tech and low-cost and can be used when working with rural community members with low formal education. Equipment needed: large sheets of paper for network map, pens in different colors, adhesive paper as actor cards, flat round stackable discs for building influence-towers, a field note-book, actor figurines, small mat or carpet to sit on. For a more detailed description see Net-Map Part I.
Description and application The tool is easy to use and has a very clear structure, which is easy to follow. The interviews were shortened in the course of the research in order to respect time limitations of farmers in the beginning of the rainfed farming season.
Preparation: • Question defined: “Who influenced the fisheries activities in the last 5 years?”
• Links defined: giving/receiving advice, help/support, instructions and disturbance.
• Target group defined: fishermen, fish traders, extension agents, livestock owners, gardeners, Water User Association executives, local politicians, and traditional leaders.
• Interview partners selected from four reservoir communities: 24 interviews, partly with groups, partly with individuals.
Steps taken during the process: 1. Discussion of the terms influence, advice, help/support, instructions and disturbance with
interview partners.
2. Writing the actors who influenced the fisheries activities on colored post-its. Putting the pots-its on A1 paper so that individual actors could be grouped together (e.g. fishermen got the color green, fish traders got the color blue, extension agents were put on red paper).
3. Drawing of a legend that explains which color belongs to which kind of link on the same paper and adding the links according to the interview partner’s answers.
4. Building of influence towers with bicycle spare parts according to the amount of influence assigned to the respective actor by the interview partner.
5. Asking in which direction the influence goes (e.g. Does the actor encourage or discourage fishing activities).
Small Reservoirs Toolkit
16
The data collection took place during July and August 2007. The data will be processed and analyzed using VisuaLyzer™. For further information and follow up please contact [email protected].
Lessons learned and recommendations • In social sciences it proved to be useful to “cross-examine” results in order to avoid intrinsic
bias. This can be done asking a wide variety of people on their perspective of the network (see Krackhardt 1987 for procedures of assembling cognitive social structures out of individual social networks). In addition, other methods of data collection, such as observation, secondary data, questionnaires or group discussions can be used to validate the findings from the network maps.
• The information generated during the exercise can be highly sensitive, especially when there are individuals and groups with conflicting interests involved, which is often the case in natural resources management. In the purely academic application, harm can be avoided by thoroughly disguising the data (e.g., removing names and other identifying attributes) so that interview partners cannot take action against each other (Borgatti and Molina, 2005).
• Concerning the more logistical issues related to data-collection, it is recommended to arrange that the venue of the interview provides as much privacy as possible (sometimes difficult in a village level setting) and that the interview partner has a fair idea about the amount of time needed. It is easier to undertake the activity with a team of two interviewers, so that one can basically observe and take notes while the other one is more active. If an interpreter is needed, it is recommended to pre-test the method with the interpreter so as to make sure that he/she understands it well before going to the field.
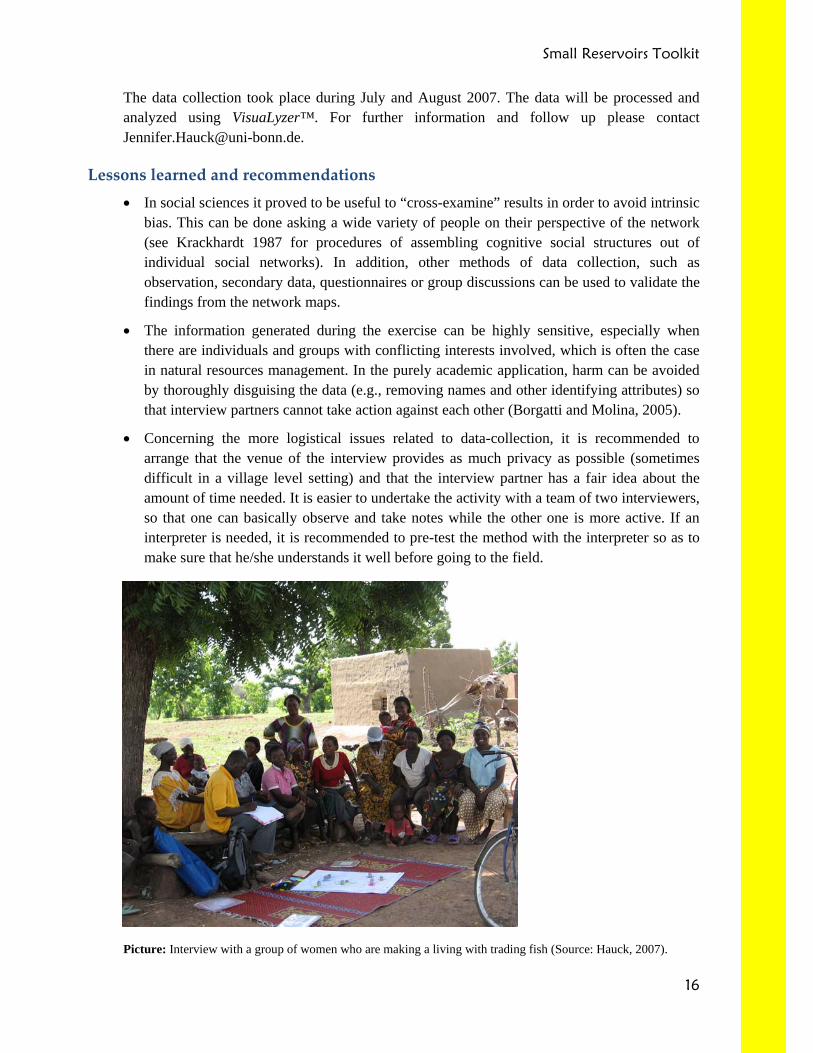
Picture: Interview with a group of women who are making a living with trading fish (Source: Hauck, 2007).
Small Reservoirs Toolkit
17
Limitations • By asking who is influential to collect actor names, people who are not influential are
automatically excluded and thus the reason why they do not have a voice will not be explored. The case study tried to identify people who were not mentioned as being influential for example young or poor fishermen, to include their perception about network structures. However the risk remains that actors are unknowingly excluded from analysis disqualifying the study from being representative for the whole community.
• A learning process of the interview partners with increased understanding of structures and flows, described in the case study “Organizational learning in multi-stakeholder water governance”, could not be observed while working on a local level. Though it was tried to visualize groups of actors and links with different colors, most interview partners were unable to read the networks because of illiteracy but also a lack of understanding somehow abstract network concepts, which could not be imparted in the shortness of time. However, the net-map exercise was used as a first step to facilitate group formation amongst local fishermen and fishmongers.
References
Borgatti, S.P. 2003. Centrality and Network Flow 27(1): 55-71.
Borgatti, S. P., Molina, J.-L. (2005). Toward ethical guidelines for network research in organizations. Social Networks 27 (2005) 107–117.
Cross, R., S.P. Borgatti, and A. Parker. 2002. Making Invisible Work Visible: Using Social Network Analysis to Support Strategic Collaboration. California Management Review 44(2).
Davies, R. 2003. Network Perspectives in the Evaluation of Development Interventions: More than a Metaphor. EDAIS Conference: New Directions in Impact Assessment for Development: Methods and Practice, November 24–25.
DFID (UK Department for International Development) and World Bank. 2005. Tool for Understanding Institutional, Political and Social Analysis (TIPS). Poverty Analysis and MDGs Team/World Bank Social Development Division. https://www.worldbank.org/tips.
Douthwaite, B., A. Carvajal, S. Alvarez, E. Claros, and L.A. Hernández. 2006. Building Farmers’ Capacities for Networking (Part 1): Strengthening Rural Groups in Colombia through Network Analysis. KM4D Journal 2(2): 4-18.
Hanneman, R.A. 2001. Introduction to Social Network Methods. Department of Sociology, University of California, Riverside.
Krebs, V. 2004. Power in Networks. http://www.orgnet.com.
Krackhardt, D. 1987. Cognitive Social Structures. Social Networks 9 (1987) pp. 109-134, North-Holland. Cornell University. USA
Schiffer, E., Waale, D. 2008. Tracing power and influence in networks: Net-Map as a tool for research and strategic network planning. (IFPRI Discussion Paper 772) Washington, D.C.: International Food Policy Research Institute
Small Reservoirs Toolkit
18
Schiffer, E. 2007. Net-Map – Influence Mapping of Social Networks. Manual. Presented at the Sunbelt Conference of the International Network of Social Network Analysis, 01-06 May 2007, Corfu, Greece
Contacts and Links Jennifer Hauck applied the tool in her PhD research aiming at managing fisheries in small
reservoirs for resilience and harmonizing fisheries activities with other water uses and ecosystem needs. Her research in northern Ghana is supported by the IPSWaT-Program and the GLOWA Volta Project, which are both funded by the German Federal Ministry of Education and Research.
Eva Schiffer is an independent consultant, who works on further developing and using Net-Map as a tool for research, planning and facilitation. For more information please contact: [email protected].
To learn more about Net-Map and the latest ideas and projects please visit: http://netmap.wordpress. com