net metering policy development and distributed solar
TRANSCRIPT

Technical Report NREL/TP-6A2-46670 December 2009
Net Metering Policy Development in Minnesota: Overview of Trends in Nationwide Policy Development and Implications of Increasing the Eligible System Size Cap Elizabeth Doris, Sarah Busche, and Stephen Hockett

National Renewable Energy Laboratory 1617 Cole Boulevard, Golden, Colorado 80401-3393 303-275-3000 • www.nrel.gov
NREL is a national laboratory of the U.S. Department of Energy Office of Energy Efficiency and Renewable Energy Operated by the Alliance for Sustainable Energy, LLC
Contract No. DE-AC36-08-GO28308
Technical Report NREL/TP-6A2-46670 December 2009
Net Metering Policy Development in Minnesota: Overview of Trends in Nationwide Policy Development and Implications of Increasing the Eligible System Size Cap Elizabeth Doris, Sarah Busche, and Stephen Hockett Prepared under Task No. PVC9.92X8

NOTICE This report was prepared as an account of work sponsored by an agency of the United States government. Neither the United States government nor any agency thereof, nor any of their employees, makes any warranty, express or implied, or assumes any legal liability or responsibility for the accuracy, completeness, or usefulness of any information, apparatus, product, or process disclosed, or represents that its use would not infringe privately owned rights. Reference herein to any specific commercial product, process, or service by trade name, trademark, manufacturer, or otherwise does not necessarily constitute or imply its endorsement, recommendation, or favoring by the United States government or any agency thereof. The views and opinions of authors expressed herein do not necessarily state or reflect those of the United States government or any agency thereof.
Available electronically at http://www.osti.gov/bridge
Available for a processing fee to U.S. Department of Energy and its contractors, in paper, from:
U.S. Department of Energy Office of Scientific and Technical Information P.O. Box 62 Oak Ridge, TN 37831-0062 phone: 865.576.8401 fax: 865.576.5728 email: mailto:[email protected]
Available for sale to the public, in paper, from: U.S. Department of Commerce National Technical Information Service 5285 Port Royal Road Springfield, VA 22161 phone: 800.553.6847 fax: 703.605.6900 email: [email protected] online ordering: http://www.ntis.gov/ordering.htm
Printed on paper containing at least 50% wastepaper, including 20% postconsumer waste

i
Acknowledgments This report is prepared for the Cities of Minneapolis and Saint Paul, Minnesota, under the Solar America Cities Technical Assistance Grant through the United States Department of Energy Solar Energy Technology Program. The authors thank Stacy Miller (State of Minnesota), Gayle Prest (City of Minneapolis), Anne Hunt (City of St. Paul), Brian Ross (CRP Planning), and Jason Coughlin (NREL) for thoughtful and thorough reviews of earlier versions of this report. The input of the state net metering program implementers was critical in increasing understanding of the policy mechanics of net metering. We also thank Karen Atkison of the NREL Communications Office for her skilled technical editing. Any remaining errors, of course, are the responsibility of the authors.
Abstract The goal of the Minnesota net metering policy is to give the maximum possible encouragement to distributed generation assets, especially solar electric systems (MN 2008). However, according to a published set of best practices (NNEC 2008) that prioritize the maximum development of solar markets within states, the Minnesota policy does not incorporate many of the important best practices that may help other states transform their solar energy markets and increase the amount of grid-connected distributed solar generation assets. Reasons cited include the low system size limit of 40kW (the best practices document recommends a 2 MW limit) and a lack of language protecting generators from additional utility fees. This study was conducted to compare Minnesota’s policies to national best practices. It provides an overview of the current Minnesota policy in the context of these best practices and other jurisdictions’ net metering policies, as well as a qualitative assessment of the impacts of raising the system size cap within the policy based on the experiences of other states. The report finds that increasing the cap may move the state toward its goal of providing the maximum possible encouragement to distributed generation assets, including a larger average size of solar PV systems and a broader array of stakeholders. Quantitative evaluation of the policy changes are necessary to better understand the quantitative impacts on all interested parties (e.g. utility, rate payers, project developers). The report also finds, however, that most states that have increased the size limits have not developed such cost/benefit studies before raising the limit. Reasons cited include the increase being a legislative action and/or the lack of data and financial resources to perform such a study. Program implementers in these states do not report negative impacts on ratepayers as result of the increase in system size limit. This is likely the result of the small relative impact of the systems on the larger utility grids. Implementers cite the lack of data, resulting from the changes in net metering being recent at this stage, as a limitation in quantifying the benefits and costs of expanded net metering system size caps.

ii
Table of Contents Acknowledgments .......................................................................................................................... i
Abstract ........................................................................................................................................... i
1. Introduction and Net Metering Policy Background .............................................................. 1
2. Net Metering Design Options, Best Practices, and Minnesota’s Policy ............................... 5
3. Policy Trends and Impacts: Increasing the Individual System Size Maximum ............... 11
Increased System Size Limits in Other States: Solar Installed Capacity Impacts .................... 12
Increased System Size Limits in Other States: Context, Process, and Studies ......................... 14
Case Study: Raising the System Size Limit in North Carolina ................................................ 18
4. Interaction with Other Policies .............................................................................................. 21
5. Conclusions/Next Steps ........................................................................................................... 24
6. References ................................................................................................................................ 25
Appendix 1: State Policy Contact Interview Methodology and Questions ............................ 28

1
1. Introduction and Net Metering Policy Background In general, net metering policy allows customers to produce onsite electricity and sell excess generation to the utility at a set price. Net metering policies are market-based incentives addressing the market barrier of project economics that exists for most high initial cost renewable energy technologies. The main goal of most net metering policies is to create incentives for private investment in distributed renewable energy technologies by providing value to the electricity generation that, during certain times of day or season, exceeds the customer’s electricity demand. This valuation can also lower the project related risks and increase market penetration, broadening the impacts of net metering policies generally. Most net metering policies focus on valuing the energy produced by the system owner to more accurately reflect its value, although stakeholders in the system define the value of the electricity delivered to the grid differently (Stoutenborough and Beverlin 2008, Wan and Green 1998).1
In addition, the simplicity of the mechanism, which, after implementation, requires minimal oversight and limited public investment, is attractive to many policy makers.
The earliest net metering policies were adopted the early 1980s in Minnesota and Iowa. Figure 1 shows a rapid increase in the number of states adopting this policy since 1997 (DSIRE 2009a). To date, 42 states and the District of Columbia have implemented net metering policies (Figure 2).
Figure 1. Number of states with net metering policies by year (including Washington, D.C.)
1 The value of the electricity delivered to the grid can be determined in multiple ways. See “Compensation for Net Excess Generation” in Section 2 for further discussion.

2
Figure 2. Overview of net metering policies in the United States as of July 2009 (IREC 2009d, DSIRE 2009j). Asterisks indicate a reference to the note. The numbers represent the system size cap in each state in kilowatts. For states with separate system size caps for different sectors (i.e., residential
and commercial), the cap sizes per sector are all listed. For further information, see DSIRE 2009j. Amongst its advocates, net metering policy is widely considered to play a strong role in the development of customer-sited solar electric systems nationwide (e.g. Solar Alliance 2009). In addition, there is a growing body of research literature that indicates that net metering policies play a role in the development of distributed renewable energy. As examples:
• Forsyth et al (2002), focusing on the impact of the policy on small wind development, found that while net metering addresses the economics of distributed generation systems, these policies alone are insufficient to encourage customers to develop renewable energy distributed generation systems. Instead, they find that states with a proven track record of renewable energy growth and development implement a suite of policies that prepared the market and reduced barriers to renewable energy generation.
• Kroposki et al (2008) found when net metering caps were lifted as compared to the base case, projected cumulative installed PV nationwide in 2015 increased from 7.5 gigawatts (GW) to 12 GW.
• Most recently, Doris et al (2009) found that the existence of the policy in states, over time, correlated significantly with increased non-hydroelectric renewable electricity generation per capita and per gross state product (GSP). The study evaluated states with net metering in place in 2005 with renewable energy generation data for calendar year
3
2007, to allow time for the policy to be implemented and systems to be installed.2
The existence of a net metering policy also correlated significantly with electricity from wind generation per capita and per GSP. While these statistical analyses are based on limited data, they do indicate a connection between net metering policy and increased renewable energy generation.
While net metering policies are usually designed to support the development of multiple types of distributed renewable energy technologies, as Minnesota is most interested in the impacts that this policy has on distributed solar technologies, this report will focus on the relationship between state net metering policies and distributed solar generation. Specifically related to solar development, there is little quantitative evidence that the policy leads directly to increased solar development or leads to market transformation of the market for solar technologies. This lack of direct connection between net metering and solar development may be the result of data limitations. For example, a comprehensive list of existing small-scale (<100kW) distributed solar system capacity by state has only been available in recent years (IREC 2009d and NREL 2009 being the most recent). In addition, because net metering is typically part of a set of policies promoting clean energy, detailed individual study of net metering policies is lacking. With overall increases in the growth of both solar related policies (DSIRE 2009a) and the solar industry in general (e.g. Solar Alliance 2009, IREC 2009c), there is increased interest from the research community in better understanding the impacts of net metering policies to determine their impacts. However, at the time of this study, there is limited evidence of a quantifiable connection. There is, however, evidence connecting relatively higher net metering system size limits to increased solar production per person in states that have net metering. That is, based on statistical analyses of available data, state policies that currently have a system limit of 1 MW or greater have a mean of 3.44 watts of installed solar capacity per person as of 2008. Alternatively, states that have a system limit of less than 1 MW have a mean of 0.74 watts of solar capacity per person, or 366% less than the states with a higher system limit (see Section 3 for more information on larger system size limitation impacts). Minnesota began implementing its original a net metering policy in 1981. The stated goal of the policy is to give the maximum possible encouragement to distributed generation assets (MN 2008). To date, the policy is generally in line with other policies nationwide, but is currently being reviewed by several stakeholders to determine if the 40 kW system size cap is still relevant. Fourteen states have increased or are in the process of increasing the system size net metering caps.
2 States with a net metering policy in 2005 had a mean 128% higher than states that did not have a policy in terms of non-hydro generation as a percent of total state generation. States that had a policy in 2005 had a mean 127% higher than states that did not have a net metering policy in terms of non-hydro generation per capita. States that had a net metering policy in 2005 had a mean 103% higher than states that did not have a NM policy in terms of non-hydro generation per GSP (gross state product). This means, statistically, that there is a difference in renewable energy generation in states with and without the policy. See Doris et al 2009 for detailed methodology and further discussion.

4
This report provides background and context for the Minnesota policy and provides an overview of other jurisdictions’ policies and the impacts of increases to those system size caps on the development of distributed solar technologies.3
This report uses interviews with state program implementers and data on solar installations to date in those states to draw conclusions about the likely impacts of increasing the maximum system size for the net metering policy in Minnesota, as well as catalogue the level of analysis that has gone into other state efforts in making changes to their policies.
First, the report provides an overview of the Minnesota policy in comparison to other policies nationwide and a set of “best practices” (NNEC 2008), attempting to identify policy designs that promote renewable energy distributed generation (Section 2). These best practices were chosen because they are most in line with the distributed generation market penetration goals of the Minnesota policy.4
3 Net metering policies can have an impact on a broad suite of technologies. This report focuses on the impact of the policies on solar systems, but information is provided for context of the general impact of the policy type.
Section 3 then provides an overview of the activities surrounding the development of system size cap increases in other states, and presents the results of implementer interviews conducted to better understand the impacts of the programmatic changes as well as provides a compilation of solar data in states that made this policy change, in an effort to showcase the potential impacts. The results of this analysis reflect the challenge of identifying policy change impacts at this early stage (most system size caps have been increased in the last two years) and the difficulty of separating the policy impacts from other market impacts. Section 4 describes other policies in the state (and being proposed or implemented in surrounding states) and discusses the likely interaction of changing the system size limits with those policies. Finally, Section 5 provides a conclusion regarding the likely impacts of increasing the system size limit.
4 Note that there are other policy goals that may not be reflected by this set of best practices, including ratepayer impact minimization. However, these best practices reflect the primary stated goal of the Minnesota net metering policy.

5
2. Net Metering Design Options, Best Practices, and Minnesota’s Policy
There are several options within the development of a net metering policy, allowing for customized policy design to specifically address a state’s needs and priorities. Policy design options include:
• Identifying eligible renewable technologies. Some jurisdictions prioritize the development of certain renewable resources over others. Targeting specific technologies, such as solar PV, can direct the market impacts of the policy toward those technologies.
• Identifying the customer classes that can net meter. In addition to identifying specific technologies that qualify, jurisdictions can identify specific customer classes that are allowed to net meter as a method for targeting specific market sectors for renewable energy development, in addition to limiting the potential economic and technical impact on the participating utilities.
• Identifying the utilities that must offer net metering. Jurisdictions can define the types of utilities (i.e. IOUs, co-ops) that must implement net metering programs.
• Assigning or disallowing additional fees for net metering customers. Jurisdictions can direct the utility to collect or refrain from collecting fees associated with net metering.
• Directing the renewable credit ownership (REC) of the renewable energy system generation. This design option allows policymakers to determine which entity, the generator of the renewable energy or the utility accepting the excess generation, receives the credit for renewable generation production. Because of the economic value of RECs, determining ownership has been a negotiation point amongst stakeholders and part of the process of creating acceptance of net metering policies.
• Directing the allowance or disallowance of meter aggregation. This allows organizations with multiple meters to aggregate their electricity load and allocate the benefits of the renewable energy system across the entire load and collection of meters.
• Compensation for Net Excess Generation (NEG). The jurisdiction controls the payment from the utility to the generator as well as the frequency of the payment. The payment from the utility is usually determined based on either the loss of value of the excess generation, the avoided utility costs of the fuel purchase (where the utility maintains the fixed payment for distribution), or in repayment of the retail rate of electricity. Defining compensation for NEG also requires determining the rollover limitations (i.e., does excess generation rollover to be counted towards next month’s bill? Does rollover generation expire annually?) (See Table 2 for further discussion).
• Aggregate net metering limits. This design option sets the total aggregate amount of net metering systems on the utility grid. This can be done in a number of ways, including, but not limited to total capacity, maximum load, and percentage of total energy generation.
• Setting the maximum individual system size that can net meter. This can also impact the customer classes that can net meter, as a lower cap will favor smaller scale systems, effectively limiting the customers to those with modest electricity loads.
Net metering was adopted in Minnesota in 1981 (MN 2008). Table 1 summarizes the policy options (as described above) implemented in the state. In general, the state policy is broader than

6
most other policies in terms of eligibility of customer classes and energy technologies, and falls on the lower end of system size limitations, especially among policies that permit net metering of commercial and industrial systems, which tend to be larger than residential systems. In a published broader comparison across states, the Minnesota policy does not incorporate many of the important best practices that may help other states transform the solar energy market and increase the amount of grid-connected distributed solar generation assets (NNEC 2008, Table 2). This best practice methodology prioritizes the goal of increasing the total capacity and generation of renewable energy systems on the utility grid, and therefore favors both the development of a broad array of markets and the express inclusion of larger systems. While the NNEC methodology is only one “best practices” design methodology, and its quantitative effectiveness in accomplishing its stated goal is still under evaluation, it is the most comprehensive net metering best practices design catalogue to date and is a useful document for better understanding the activities in other states and policy design elements that are qualitatively seen to be effective. In order to bring the state’s policy in line with national best practices, and, by that methodology, increase the likelihood of renewable energy being added to the grid, the NNEC recommends: • Increasing system capacity from 40 kW to at least 2 MW. • Adopting safe harbor language to protect customer-sited generators from extra and/or
unanticipated fees.

7
Table 1. Minnesota Net Metering Policy in Context Policy Design Option
Minnesota Implementation Other Jurisdictions*
Eligible Renewable Energy Technologies
PV, landfill gas, wind, biomass, hydroelectric, MSW, CHP, anaerobic digestion, small hydroelectric, other DG technologies
Varies. Most allow a wide variety of DG; 8 jurisdictions are limited to PV, Wind, and Hydro
Eligible Customer Classes
Residential, commercial, industrial
18 other states use this eligibility; most others broaden eligibility to other classes; 11 limit eligibility to commercial and residential or only residential
Utility Applicability All Varies, typically with jurisdictional control of entity issuing rules. Typically IOU’s only.
Additional Fees Not addressed Unknown at this time REC Ownership Not addressed Varies, not typically addressed Meter Aggregation Not allowed Not generally allowed; 7 states explicitly allow
it. Net Excess Generation
Monthly check for excess production from the utility at a per kWh rate close to retail rate.
MN is unique in this requirement.** Payment and monthly carryover varies by jurisdiction
Aggregate net metering limits
None No limit generally; where limits are defined, they are usually between 1-2% of utility peak load with a maximum of 10% of utility peak load. Can be other metrics for aggregate limit as well
Maximum Size of Systems
40 kW Ranges from 10kW to 2 MW.*** Most separated by customer class with lower limits (10kW-100kW) for residential.
Source: See IREC 2009b (jurisdictional details) and MN 2008 (MN policy details). *Information on policy design in the 42 states (and D.C.) that have implemented a net metering policy. **Wisconsin has a similar requirement but the minimum check amount is $25. ***New Mexico is an outlier with an 80 MW limit. No limit is specified in Ohio, but the Public Utilities Commission of Ohio has ruled that an “implied limitation” is in effect, limiting system size based on customer load. DG=Distributed Generation MSW=Municipal Solid Waste
8
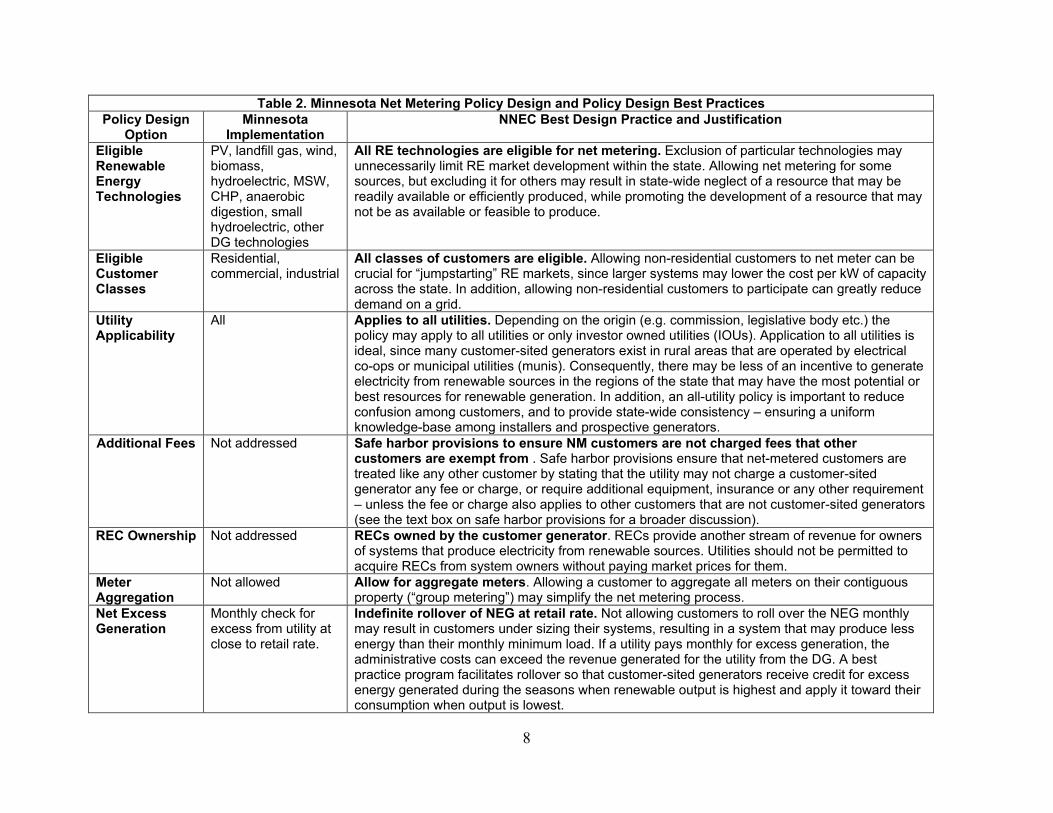
Table 2. Minnesota Net Metering Policy Design and Policy Design Best Practices Policy Design
Option Minnesota
Implementation NNEC Best Design Practice and Justification
Eligible Renewable Energy Technologies
PV, landfill gas, wind, biomass, hydroelectric, MSW, CHP, anaerobic digestion, small hydroelectric, other DG technologies
All RE technologies are eligible for net metering. Exclusion of particular technologies may unnecessarily limit RE market development within the state. Allowing net metering for some sources, but excluding it for others may result in state-wide neglect of a resource that may be readily available or efficiently produced, while promoting the development of a resource that may not be as available or feasible to produce.
Eligible Customer Classes
Residential, commercial, industrial
All classes of customers are eligible. Allowing non-residential customers to net meter can be crucial for “jumpstarting” RE markets, since larger systems may lower the cost per kW of capacity across the state. In addition, allowing non-residential customers to participate can greatly reduce demand on a grid.
Utility Applicability
All Applies to all utilities. Depending on the origin (e.g. commission, legislative body etc.) the policy may apply to all utilities or only investor owned utilities (IOUs). Application to all utilities is ideal, since many customer-sited generators exist in rural areas that are operated by electrical co-ops or municipal utilities (munis). Consequently, there may be less of an incentive to generate electricity from renewable sources in the regions of the state that may have the most potential or best resources for renewable generation. In addition, an all-utility policy is important to reduce confusion among customers, and to provide state-wide consistency – ensuring a uniform knowledge-base among installers and prospective generators.
Additional Fees Not addressed Safe harbor provisions to ensure NM customers are not charged fees that other customers are exempt from . Safe harbor provisions ensure that net-metered customers are treated like any other customer by stating that the utility may not charge a customer-sited generator any fee or charge, or require additional equipment, insurance or any other requirement – unless the fee or charge also applies to other customers that are not customer-sited generators (see the text box on safe harbor provisions for a broader discussion).
REC Ownership Not addressed RECs owned by the customer generator. RECs provide another stream of revenue for owners of systems that produce electricity from renewable sources. Utilities should not be permitted to acquire RECs from system owners without paying market prices for them.
Meter Aggregation
Not allowed Allow for aggregate meters. Allowing a customer to aggregate all meters on their contiguous property (“group metering”) may simplify the net metering process.
Net Excess Generation
Monthly check for excess from utility at close to retail rate.
Indefinite rollover of NEG at retail rate. Not allowing customers to roll over the NEG monthly may result in customers under sizing their systems, resulting in a system that may produce less energy than their monthly minimum load. If a utility pays monthly for excess generation, the administrative costs can exceed the revenue generated for the utility from the DG. A best practice program facilitates rollover so that customer-sited generators receive credit for excess energy generated during the seasons when renewable output is highest and apply it toward their consumption when output is lowest.

9
Table 2. Minnesota Net Metering Policy Design and Policy Design Best Practices Policy Design
Option Minnesota
Implementation NNEC Best Design Practice and Justification
Aggregate Net Metering Limit
None No arbitrary limits on aggregate DG capacity. Capacity limits can greatly restrict the expansion of on-site renewable generation and restrain the market for new renewable energy systems.
Maximum Size of Renewable Energy Systems
40 kW Renewable Energy System caps at no less than 2MW. Limits on the size of eligible systems can prevent customers from properly sizing their DG system to meet their electricity demand, and inhibit the participation of some of the most cost effective systems. Customer load and demand should determine the system’s design parameters. Larger limits promote the widespread development of renewable energy systems, and can encourage the participation of large investors in net metering programs.
Source: See NNEC 2008 (Best Practices) and MN 2008 (Minnesota Policy). DG=Distributed Generation MSW=Municipal Solid Waste

10
Beyond best practice design elements, the effectiveness of a net metering program can be measured against how well it meets the primary goal. The primary goal of the Minnesota policy is to “give the maximum possible encouragement to cogeneration and small power production consistent with the protection of the ratepayers and the public (MN 2008).” It is challenging to parse out the effect of the net metering policy on the growth of renewable energy generation in the state of Minnesota, as a result of data challenges (e.g. number of small power producers before and after the implementation of the policy and increased consumer costs before and after the policy) as well as major market and other policy changes at the local, state and federal levels during the time the net metering rule has been in place. As stated in the introduction, there is national level evidence that net metering policies are significantly connected to states with increased renewable energy generation when considering policies that are at least two years old (Doris et al 2009) However, more specific Minnesota impacts require data collection and evaluation beyond the scope of this current report. As the next section finds, no states that have increased the limits have developed such comprehensive evaluations previous to the policy change, and none report excessive negative ratepayer impact to date.
Safe Harbor Provisions In the event of the intermittency of a distributed generating system utilities may be obligated to meet the resulting additional electrical demand to the grid. Consequently, many states permit the utilities to impose a “standby charge” on net metering customers to compensate the utility for the cost required to produce the additional electricity. This may come in the form of a fee, insurance, an obligation to obtain additional equipment, or similar requirement. These charges may be particularly burdensome to small generators (e.g. residential net metering customers) for whom utilities would only need to provide a small amount of the power load for the building. These fees can be sufficiently costly to diminish most, if not all, of the economic incentive that a net metering program may provide to small generators. The practice of charging additional fees or requirements in this manner has been compared to punishing customers for purchasing a more energy efficient appliance (e.g. air conditioning unit), since the customer would have to compensate the utility in the event that the efficient unit fails and has to be replaced by a less-efficient unit (NNEC 2008). Safe harbor provisions eliminate this disincentive by ensuring that net-metered customers are not charged any fee, or required to purchase additional equipment, insurance or any other requirement – unless the fee or charge also applies to other customers that are not customer-sited generators. These fees, and the provisions protecting net metering customers from them, need be carefully evaluated by the utility regulatory body to ensure fairness between the fees charged the customer and the actual costs incurred to the utility from the smaller systems.

11
3. Policy Trends and Impacts: Increasing the Individual System Size Maximum
Over time, state policy makers update initial net metering rules to better meet the needs and priorities of the market. In recent years, fourteen states revised the net metering system size limits to increase the eligibility of larger systems and reduce some of the market barriers that limit the growth of distributed solar technology installations. In Minnesota, as a result of public interest and market development, there currently is interest in increasing the system size cap from its current 40kW limit. Published reasons for increasing the system size cap in any state include:
• the average size of both large scale (multi-family) residential and non-residential grid-tied PV installations has been steadily growing over the past few years in addition to an increase in the number of installations (Sherwood 2009); increasing the net metering system size cap may allow for the market to develop more quickly and benefits of market transformation accrue to both non-residential and residential installations.
• low caps may exclude some of the most cost-effective projects that meet the load demands of a larger building or facility interested in net metering (NNEC 2008);
• “Lifting net metering caps and establishing net metering had significant effects on projected PV market penetration in some states. In fact, the projected cumulative installed PV in 2015 increased by about 4 GW. Cumulative installed PV in 2015 increased from 7.5 GW in the base case to 12 GW when net metering caps were lifted (Kroposki et al 2008).”
In addition to these previously published discussions of the drive to increase net metering system size caps, statistical analyses conducted for this report find that states with higher limits have larger overall capacity installations of solar facilities and generation per state resident. State policies that currently have a net metering system size cap of 1 MW or greater have a mean of 3.44 watts of installed solar capacity per person as of 2008. Alternatively, states that have a cap of less than 1 MW have a mean of 0.74 watts of solar capacity per person, or 79% less than the states with a higher system limit. This relationship was found to be statistically significant at the 5% level.5
Similarly, the states with a system size cap of 1 MW or greater had a mean of 2,888,470 MWh of electricity generated from non-hydro renewable sources in 2007, compared to the mean states with a limit of less than 1 MW which is 1,525,375 MWh.
Despite the benefits, changing the system size cap can have potentially negative impacts on multiple players involved in net metering. Included in this category are:
• Revenue loss for the utility, and • Subsidization of net metered energy systems by the non-participating rate base
Understanding the various positive and negative impacts of changes to the policy can help inform the development of a balanced policy promoting increased distributed generation and renewable energy. However, a literature review and interviews with program implementers
5 A t-test was conducted, resulting in a t-value of -2.14 and a p-value of 0.0457, indicating that the null hypothesis, which states that there is no relationship between a net metering system limit of ≥ 1 MW for any class of customer for any utility and the amount of solar capacity per person that has been installed in that state, can be rejected.

12
completed for this report found that there are no generally acceptable methodologies for quantifying and balancing these impacts. The remainder of this section provides further information on the potential impacts of raising the system size limits through the prism of other state experiences in this area. In the absence of published methodologies, the experience of other states in the development of policies can provide context to the benefits and drawbacks of increasing the system size limit in a net metering policy. This analysis is in two parts. First, the solar installations in each state with increased net metering system size caps are compared in an effort to provide insights into the effect of the changes on the market. Second, the implementers of the net metering programs in the states with increased limits were contacted and asked a range of questions to better understand the context, process, and outcomes of the changes to the net metering policies (see Appendix 1 for questions posed to implementers). The results, in aggregate, illustrate
• the varied processes that states use for updating legislation, • the recentness of most changes to net metering policies, specifically those increasing the
net metering system size cap, • the resulting lack of impact analyses completed, • and the various challenges and benefits of changing the system size caps, depending on
state and stakeholder interests.
In addition to the results in aggregate, a case study of North Carolina’s recent process for increasing the net metering limit is provided to further explore the intricacies involved in evaluating the impacts of raising the system size limits and reflect how this particular state made decisions in an environment of based on limited data but with strong leadership and state involvement.
Increased System Size Limits in Other States: Solar Installed Capacity Impacts
Table 3 summarizes the installed capacity over time in the states with increased net metering system size limits. The shaded boxes represent the year that the change was legislated.

13
Table 3. Cumulative PV installations (kW) Source: IREC 2009c
State 2000 2001 2002 2003 2004 2005 2006 2007 2008 Arkansas 38 38 38 38 38 38 38 38 38 Connecticut 11 34 34 37 68 224 896 3,421 8,704 Hawaii 310 515 562 659 919 1,370 2,078 4,939 13,525 Maryland 301 301 301 301 301 360 459 780 3,022 Massachusetts 275 276 303 587 1,170 1,810 3,262 4,643 7,527 Nevada 138 147 171 258 374 914 3,249 19,167 34,084 New Jersey 85 94 858 1,800 3,936 9,456 27,334 47,782 70,236 New York 715 753 1,694 3,792 5,322 7,344 10,311 14,105 21,132 North Carolina 46 53 133 133 180 180 276 677 4,683 Oregon 119 210 260 456 814 1,167 1,696 2,819 7,651 Rhode Island 71 99 116 128 231 350 513 566 574 West Virginia 0 0 0 0 0 0 0 0 0 Utah 138 165 202 202 202 202 202 202 202 Vermont 76 104 127 171 337 381 481 717 1,110 Notes: New York and Massachusetts expanded the system size cap in 2009. Rhode Island's increase is effective in 2009. In 2009, West Virginia legislation ordered the PUC to look at the impacts of raising the limit.
Because most states that have implemented increases in the system size cap have done so within the last three years, parsing out the impacts of the individual system capacity increase from other market changes is challenging. For example, while there is a clear increase in the installed PV capacity in recent years, it is difficult to say how increases in net metering limits have contributed to this higher level of installed capacity (Figure 3). It is likely that these increases in solar capacity are due to a combination of the increase in the system size cap as well as other policy and market changes. As time passes and analysis quantifying the impacts of market changes and other policy developments improves, impacts of system size changes may become clearer. Another likely impact of increasing the system size limit in the net metering program will be an increase in system size of systems installed. The lack of systems exceeding the current cap in Minnesota (MN OES 2009) indicates that the existing net metering threshold limits system size. Should the net metering cap be increased, developers may begin proposing larger projects, thereby stimulating the larger multi-family residential and commercial markets.6 This may also result in result in a lower price per kW of solar installations given the economies of scale of larger systems (IREC 2009d).7
This improvement in system economics may be a catalyst for the currently underserved commercial markets in Minnesota.
6 To ensure that customers do not install systems that are oversized for their demand, the policy can be defined to limit the system size based on the customer’s energy demands. Raising the net metering system size limit allows customers with greater demand to install systems that properly meet their needs. 7 In California, systems larger than 500kW are found to be 17% less expensive than systems less than 10 kW in size. (IREC 2009d)

14
Figure 3. Installed PV capacity (kW) over time in states with increased net metering system size limits. Source: IREC 2009c, state legislation.
Increased System Size Limits in Other States: Context, Process, and Studies
This analysis profiles fourteen states that have increased the system size limit for net metering systems, in an effort to identify potential solar installed capacity impacts of such a change in Minnesota.8
Table 4 provides an overview of the timing and context of the changes to the net metering policies in states that have increased the limit. It is clear from the table that the processes for changing the limits are as varied as the states in which they are implemented.
Interviews with the program implementers offered further insights into the development of system size changes:
• The changes to the net metering policy system size caps were driven by legislation, regulation, or a mixture of both. The most common forum for changes to the net metering policy in these states is legislative – either through the legislature setting the limit or through the legislature directing the regulatory agency to open a proceeding to determine the most appropriate level. In a few states, the net metering policies and the subsequent changes were regulatory driven
• Incremental changes to the system size cap are common. In longer running net metering policies, changes to the system size cap are completed in an incremental (e.g.
8 Because Minnesota is most interested in the impacts that net metering policies have on distributed solar generation, this report focuses specifically on solar technology-related impacts.

15
25kW, 100kW) fashion (e.g. Hawaii, New York). It is possible that this is the result of the lack of solid quantitative data on the impacts of the policy as market penetration increases. More recent policy changes (e.g. Massachusetts, North Carolina, and Rhode Island) seem to be rapidly increasing the overall system size cap, at least for commercial systems up to 1-2 MW, perhaps recognizing that the incremental changes in other states are not having a quantifiable negative impact on ratepayers to date.
• Differences between residential and commercial caps remain common. While some states have stopped delineating between residential and commercial system size limits (perhaps because other aspects of the policies, such as limitations on percentage of building load, are in place), others are continuing to limit residential systems to smaller system sizes (generally up to 25kW).
• The most common increase in system size cap – setting the commercial limit at 2MW – had different drivers. No state legislation or regulation articulated clear, decisive reasoning for incorporating the 2MW limit specifically. In Massachusetts, where legislation reset the cap, the primary driver appears to be the drive toward community scale renewable energy. The change in legislation came through the Green Communities Legislation of 2006. The implementer postulated that the limit of 2MW was roughly the size of large community based distributed energy systems (e.g. wind farms), and that the limit was set with that in mind (Phelps 2009). In New Jersey, the impetus for the increase is stated as, “The Board [of Public Utilities] is committed to advancing clean energy in New Jersey. As a net importer of electricity where demand has outpaced supply in a state surrounded by water where leaders accept climate change as human-induced phenomena that threatens it taxpayers, we are in the process of implementing the Governor’s Energy Master Plan with an all hands on deck -type mentality (Hunter 2009).”
• No state reported conducting a full cost benefit analysis to evaluate the impacts of changing the net metering policies. Although implementers report that it was suggested in both Maryland and North Carolina, no studies were completed in either state, based on the argument that experience in other states with minimal market penetration of renewable energy had not shown a negative ratepayer impact (Hughes 2009, North Carolina 2009). The state of New York, having implemented a change in system size cap from 10kW to 25kW in 2004 and to 2 MW in 2009 for commercial and industrial systems, is currently gathering data from the intervening years to analyze the ratepayer impacts of the change. To date, the impacts have not been large enough to measure under the current data collection scheme. This report is in the early stages of development, and the release date is unknown at the time of this printing (Worden 2009). The states that have increased the net metering system size cap generally cited the limited impacts of net metering on ratepayers in other states (see the North Carolina Case Study below for a more detailed example).

16
Table 4. Summary of State Processes for Changes to System Size Limits St Original Leg/Reg Enact Orig. Limit
(Res/ Comm)
Rev Date
Leg or Reg Process
New Leg/ Reg Current Limit
(Res/Comm)
Regs/ Tariffs
Released AR AR 2325 2001 25kW/
100kW 2007 Leg AR2334 25kW/
300kW --
CT Conn. Gen. Stat. § 16-243h
1998 100kW Jun-07 Leg HB 7432, Section 39 2 MW Oct-07
HI HRS 101.5, 101.4 2001 10kW 2004*/ 2008
Leg/Reg Docket 2006-0084 100kW 2008
MD Annotated Code of Maryland Article 78, Section 54M,
1997 200kW Apr-07 Leg/Reg
PSC Art. 7-306
2MW Jul-08
MA 220 CMR 8.00 et seq.
1982 30kW (CHP only)**
2004***/ 2008
Leg 220 CMR 18.00 et seq. 2MW Jun-09
NC Docket No. E-100, Sub 83
2005 20kW/100kW
2008 Leg driven Reg
Session Law 2007-397 (G.S. 62-133.8(i)(6)), Docket No. E-100, Sub 83
1 MW Jun-09
NJ N.J. Stat. § 48:3-87 1999 100kW 2004 Reg N.J.A.C. § 14:8-4.1 et seq.
2 MW Oct-04
NV NRS 704.766 et seq. 1997 100kW 2007 Leg NRS 704.771, NRS 704.771
1MW 2007
NY Solar Choice Act of 1997
1997 10kW**** 2004/ 2008
Leg 2002 Am: S.B. 6592, 2008 Am: S.B. 7171, S.B. 8415, and S.B. 8481/NY CLS Public Service, Article 4 § 66-j and § 66-l
25kW/2 MW Jul-09
OR OR Revised Statutes 757.300
1999 25kW 2007 Leg Or. Admin. R. 860-022-0075/Or. Admin. R. 860-039
25kW/2 MW Jul-09
RI R.I. Gen. Laws § 39-1-27.7
1998 25kW 2008 Leg R.I. Gen. Laws § 39-26-6/Rhode Island PUC Order, Docket No. 3999/SB 485 (not implemented at time of printing)
1.65MW ***** 2009

17
Table 4. Summary of State Processes for Changes to System Size Limits St Original Leg/Reg Enact Orig. Limit
(Res/ Comm)
Rev Date
Leg or Reg Process
New Leg/ Reg Current Limit
(Res/Comm)
Regs/ Tariffs
Released WV West Virginia PSC
Order, Case No. 06-0708-E-GI
2006 500kW 2009 Leg HB 103 2 MW 7/2010 -planned
UT Utah Code § 54-15-101 et seq.
2002 25kW 2008 Leg PSC Order, Docket No. 08-035-78
25kW/2 MW Apr-09
VT 30 V.S.A. § 219a 1998 10kW* 2008 Leg Rule 5.100 250kW 2009 Sources: DSIRE 2009a-j, Implementer Interviews, Leg and Reg language as referenced. Notes: * In 2004, the limit was raised from 10kW to 50kW. In 2008, the limit was raised for all utilities but KIUC to 100kW **2004: limit raised to 60kW, 2008: limit raised to 2 MW ***Limit was raised to 60kW in 1997 under 220 CMT 8.00 et. Seq. Only CHP qualified until changes in 2008 ****PV systems only included here, other limits for other renewable energy technologies *****3.5 MW for municipalities and Narragansett Bay Commission; 2.25 MW for certain systems serving municipalities; 1.65 MW for all other systems

18
Case Study: Raising the System Size Limit in North Carolina
In North Carolina, net metering policy was originally filed through a regulatory driven docket process in 1998 (North Carolina 1998). In this process, the Commission’s decision was to allow net metering of 10kW for residential systems and 100kW for commercial ones. In 2005, the North Carolina docket was reopened to address concerns whether or not the incentive for small generators (running the meter backward during over production) resulted in a fair incentive for renewable energy generation (North Carolina 2005). Some commenting agencies argued that running the meter backward credited the generator for both the electricity as well as the distribution and other non-energy charges resulting in overcompensation for generators that produced electricity in off-peak times and used electricity during on-peak times. Others commented that the societal benefits of the renewable energy on the electricity grid outweighed the costs to the utility of providing power during peak times. None of the commenting agencies offered quantified cost and benefit information. The decision of the Commission at that time was that the costs of net metering were not appreciable at such low levels of market penetration, and it ordered that the system size limits be raised to 20kW for residential and kept at 100kW for commercial generating systems. In addition, the Commission installed an aggregate cap of 0.2% of the utilities’ jurisdictional peak load for the previous year. In 2007, the North Carolina legislature, through Session Law 2007-397 (G.S. 62-133.8(i)(6)), requested that the PUC consider raising the net metering generation cap to 1 MW. The PUC opened a docket on June 9, 2008, to comply with the mandate (North Carolina 2009). The primary question revolved around whether or not the increased limit would provide an unacceptable level of cross-subsidization between participating and non-participating customers. Referencing the 2005 decision that net metering does create cross subsidization but that the overall benefits of renewable energy on the grid balance out these cost impacts at low levels of renewable energy market penetration, the Commission solicited comments and questions on whether increasing the system size limit would create an imbalance between the costs and benefits. Between June and December of 2008, the Commission held public hearings, accepted briefs from intervenors, and heard expert testimony from multiple parties on the potential impacts of increasing the system size limit. In this proceeding, the Commission decided that the utility-provided quantification of the costs and benefits of the cross subsidization to be ineffective at estimating the actual costs and benefits due to methodology challenges and lack of inclusion of the non-monetary benefits of renewable energy to the state. The Commission also considered a suggestion from its Public Staff to consider a more thorough cost and benefit quantification, but declined so as not to further delay the state’s clear goal to meet more of its electricity needs with renewable energy resources. Based on a lack of information on the actual impacts of cross-subsidization and a decision that the existence of such subsidies may further the state goals of increased renewable energy generation, the commission allowed an increase in the net metering system size limit to 1 MW for all systems.

19
In addition to raising the limit, the Commission made several other changes to the net metering regulations to help achieve the state goal of increasing renewable energy based electrical generation:
• Removed the aggregate system-wide cap of 0.2% peak load per utility. The justification for this was that the year long limited energy generation carryover of the net metering generators effectively limited the total capacity of net metering facilities on the grid.
• Allowed Standby-Charges for residential facilities larger than 20kW and commercial systems larger than 100kW. The fees (which vary by system) are waived for smaller systems per the 2005 ruling justified by the lack of impact from low market penetration at that time. The Commission-offered justification for this that it provided equity across all larger generators, whether or not they are net metering.
• Time of Use Metering. In all the proceedings, there was significant discussion surrounding the fairness of requiring net metering facilities to use time of use rates. Proponents of this strategy argued that requiring time of use metering allows customers to better understand the value of the on-site renewable energy generation as compared to purchasing electricity from the utility. Detractors stated that the TOU requirement limited the interest in the net metering program by imposing undue complications. This most recent ruling, based on the state interest in increasing renewable energy electricity generation in the state, removes the requirement, but allows the net metering customer the choice of rate type.
• REC ownership. One utility, Duke Energy, argued that because of the increasing value of solar renewable energy credits, the increase to 1 MW for those types of systems was fair, as long as the utility was still able to retain the RECs at no cost. The other utilities argued that this solution was not likely to offer a timely recovery of the costs of net metering to the utility, as the market prices for RECs and electricity are not directly connected. The Commission ruled that net metering customers taking the TOU rate option would receive the RECs produced by the system, but that net metering customers on other rate structures turn over the RECs to the utility. The justification for this is that the utility costs of allowing net metering at a flat rate and not valuing the electricity at the cost based on time of day is made up by the value of the RECs.
• Utility Cost Recovery. One of the utilities suggested that it should be able to recoup the costs of net metering through the Renewable Energy Portfolio Standard recovery rider, the state RPS cost recovery provision. The Commission denied this suggestion based on a lack of evidence of the real costs of net metering to be recovered.
• Eligible Technologies. In accordance with the state mandate to increase electricity generation from renewable resources, the Commission expanded the definition of qualifying renewable energy technologies to include all renewable electricity-producing facilities outlined in the state statutes (Senate Bill 3).
These changes to the net metering policy resulted in necessary tariff/rider revisions for the utilities, which the Commission ordered to be completed in time to become effective on June 1, 2009. The recent nature of the changes to the North Carolina bill mean that the effectiveness of the changes on meeting the state goals of increased renewable energy generation cannot yet be measured.

20
Despite the lack of data to evaluate the impacts of the policy, this North Carolina example provides several insights into the development of higher system size caps. In particular, the lack of quantifiable data on the costs and benefits of net metering did not limit the decision making capability of the Commission, but did lead them to increase the limits on net metering system size caps while continuing to offer protections to the non-participating rate payers, such as allowing the stand-by fees to be levied against larger generators. The Commission awaits compelling quantified evidence of the weighting of the benefits and costs of net metering in order to make further changes to the system size limits and other associated changes to the regulations (Ellis 2009).

21
4. Interaction with Other Policies
A potential concern related to over subsidizing larger solar projects could arise in the discussion of increasing the net metering system size cap, as the costs of paying for electricity infrastructure are ultimately passed on to the utility customers (rate based). This section provides a qualitative overview of these potential interactions and preliminarily finds that many of the policies in place will not be affected by a change in the system size cap because the policies are limited by other factors (e.g. maximum incentive caps or programmatic budget). Further research integrating the many costs and benefits of increased solar capacity in Minnesota is required to determine the quantitative impacts of increasing the system size caps. However, state implementers contacted to provide insights into their experiences with raising system size caps commented that such studies were not completed in their states and that negative ratepayer impacts of the policy are not seen at current levels of market penetration (See Appendix A for questionnaire and Section 3 for summary of results). There is, however, due to the early stage of implementation, uncertainty regarding the impacts of the revised federal incentives for solar. The federal government offers personal and business energy investment tax credits (ITC) of 30% of the installed costs of a PV system. The Energy Investment and Security Act of 2008 (EISA) extended the availability of this tax credit out to 2016 and removed the $2,000 cap that had been in place for PV systems. Should the net metering system size cap be increased in Minnesota, commercial and industrial consumers may be more likely to install larger systems in order to take advantage of available these federal credits and to offset a greater percentage of their electricity load. This could have an impact on the utility, but it is unclear at this stage what those impacts might be, as a result of the early stage of implementation of the changes. In addition, such analysis would need to be completed in coordination with an evaluation of the increased distributed generation impacts on the utility grid and the offset of otherwise necessary and costly infrastructure improvements. In addition to federal programs, several Minnesota state and utility programs (DSIRE 2009k) applicable to solar electricity systems interact with the net metering policies.9
The following summary of potential interactions provides an overview of likely impacts. However, a more comprehensive analysis of the benefits and costs of increasing solar installations in the state would more accurately reflect the actual impacts of combining the policies.
• Renewable Portfolio Standard (RPS). The Minnesota RPS requires Xcel Energy, the state’s primary utility, to account for 30% of total retail sales with renewable energy generation by 2020. Other utilities operating in the state must meet 25% of total retail sales with renewable energy generation by 2025. An increase in total solar generation resulting from an increase in the net metering cap may assist in meeting the RPS goals in all utility service territories. However, solar is limited to 1% of the total RPS requirements for Xcel Energy, an electric utility that serves approximately half the state. The 1% limit results in a
9 There are a number of Minnesota policies in place that influence the development of non-PV technologies and interaction of these should also be considered in the discussion of increasing the system size limit. However, these technologies are outside the scope of this report.

22
default utility-wide system cap for solar installations connected to the grid, and likely limits the total growth of solar.
• Solar Electric (PV) Rebate Programs. The state Department of Commerce (funded by the Xcel Energy Renewable Development Fund10
• PV Property Tax Exemption. This policy excludes for tax purposes, the value added to the property as a result of installing a PV system.
administers a rebate program for residential, commercial, and industrial consumers. Rebates are set at $2.00/kW up to a maximum of $20,000. Minnesota Power and 28 rural electric cooperatives augment the program with an additional rebate of up to $4,000 in their service areas. If the net metering system size cap is increased, interest in the rebate programs may increase as well. However, since the program funding is capped per system and is typically saturated long before the program period is reached (MN OES 2009), increased demand would likely have little effect on the effectiveness of the program. Increasing the limit may, however, change the make-up of the rebate participants in the program with average system size increasing from today’s average of 4.6 kW. However, solar system sizes do seem to be constrained by the net metering cap, evidenced by only three systems in the state exceeding the cap size of 40kW (MN OES 2009).
• Sales Tax Exemption. In the state of Minnesota, solar equipment (including panels, racks, wiring and pipes) is exempt from sales tax. An increase in solar installations that may result from the change in the net metering cap will increase the number of exemptions and exacerbate potential revenue losses to the state resulting from the exemption. There is also the potential that this could be balanced by the creation of jobs and other economic benefits from larger solar installations.
• Neighborhood Energy Connection (NEC), Center for Energy and the Environment (and other implementer run) Loan Programs. This program offers households with annual incomes below $91,300 access to 6.25% interest rate loans of between $2,000 and $35,000 for energy efficiency improvements and renewable energy technologies (PV, solar water heat, and geothermal heat pump) installation. This program requires an in-home energy audit and stipulates that the loan must cover at least one of the auditor’s recommendations. However, given the lower cost of energy efficiency improvements, the loan program has not financed a large number of PV systems. For PV systems that are financed through this program, the maximum loan cap of $35,000 effectively limits the size of solar systems that can be financed. As a result, it is unlikely that a higher net metering cap will create significant additional demand under the loan program.
In addition to existing Minnesota policies and programs, there are emerging policies that may interact with the net metering program. One example is Feed-in-Tariff policies (FITs), a type of a production-based incentive that requires utilities to purchase renewable energy generated by qualifying generators at a fixed price for a predetermined number of years. FITs are receiving more attention throughout the United States, although experience with them is limited. Net 10 This fund is the result of an agreement between the utility Xcel Energy and the state of Minnesota concerning spent nuclear fuel. It has completed three rounds of funding for R&D and renewable energy project development (DSIRE 2009k).

23
metering policies can interact with FITs in a variety of ways, so it is integral for the details of this interaction to be clarified prior to the concurrent implementation of net metering and FIT policies. The two policies are viewed differently by utilities: While net metering policies are considered demand reduction policies, FIT policies are supply-side oriented as payments are awarded based on generation. There are three main options for defining the interaction between FITs and net metering policies (Couture and Cory 2009):
1. Gross Metering – FITs are provided for all generation regardless of the amount of on-site usage. In this case, a supply meter must be installed at the inverter to measure total generation before it is either used on site or exported to the grid.
2. Customer Choice – Customers have the option of either choosing to receive a FIT payment for total electricity sold to the grid or to net meter their system. A separate meter is required for customers who choose to receive the FIT.
3. Hybrid – Currently used in Germany, customer-generators with PV systems 30kW and smaller receive a lower FIT payment for electricity consumed on site and a higher payment for electricity exported to the grid with the rate structure designed so as to encourage on site use of the customer-generated electricity.
Neighboring Wisconsin’s Madison Gas & Electric (MG&E) has enacted a fixed-price production-based incentive that can be considered a FIT (Cory et al. 2009). The program allows for customers who have installed a PV system from 1 kW to 10 kW in size to choose between net metering or receiving the FIT.11
11 The system must have been installed after March 6, 2007.
Since the program began in January 2008, all customers have elected to receive the FIT (Ford 2009). For customers with systems greater than 10 kW in size, they can receive the FIT for the generation from the first 10 kW and net meter the remaining generation. The FIT is currently capped at 1 MW aggregate generation as the energy generated through this program is used to meet the demand MG&E’s Green Power Tomorrow Program in which customers pay a price premium for clean energy (MG&E 2009). As more of these policies gain prominence, a review of the potential interactions may provide more insights into the impacts of the interactions.

24
5. Conclusions/Next Steps The goal of the Minnesota net metering policy, which began implementation in 1981, is to give the maximum possible encouragement to distributed generation assets on the utility grid (MN 2008). According to published best practices that prioritize the maximum development of solar markets within states, the Minnesota policy does not incorporate many of the important best practices that may be helping other states transform their solar energy markets and increase the amount of grid-connected distributed solar generation assets (NNEC 2008). This report provides an overview of the current Minnesota solar policies as well as a qualitative assessment of the impacts of raising the system size cap within this context. The report finds that increasing the cap may move the state closer towards its goal of providing the maximum possible encouragement to distributed generation assets, but that a more quantitative evaluation of the policy changes would be necessary to better understand the impacts on all interested parties (e.g. utility, rate payers, project developers). However, this report also finds that no states that have increased net metering system size limits have performed exhaustive cost/benefit analyses beforehand to the change and no state implementers report extensive, quantified negative rate payer impacts as a result of the changes. As the market for solar rapidly expands, rate payer impacts may be more pronounced. However, at the time of this research, the negative ratepayer impacts of net metering, even in the states with the greatest market penetration and highest net metering thresholds, are not significant. Based on other states’ experiences with increasing their net metering caps, the likely outcome of such a system size cap increase in Minnesota would be:
1) Increase in the installed PV capacity in the state, 2) Increase in the average size of an installed PV system, and 3) Limited interaction with existing policies.
Careful design of a net metering policy to accurately reflect the value of the net metered systems to the public good, the system owner, ratepayers, and the utility is required to minimize the potential unfair impacts to any one party. However, capturing all of these impacts in a single study is difficult. Nonetheless, a higher net metering system size cap seems to coincide with accelerated market transformation and a greater installed capacity without significant negative rate payer impacts. If there is funding and interest in a comprehensive study of the impacts, suggested next steps include a thorough evaluation of the impact of the net metering policy to date under the existing cap. Data requirements for such an evaluation include a listing of those systems (including sizes and generation) currently net metering from each utility, and the program’s associated ratepayer and grid impacts. Should interested parties wish to estimate the rate impacts of raising the net metering limits, utility data and participation is necessary to provide an accurate quantitative assessment.

25
References
Cory, K., T. Couture, and C. Kreycik. 2009. Feed-in Tariff Policy: Design, Implementation, and RPS Policy Interactions. NREL: Golden, Co.
Couture, T. and K. Cory. 2009. State Clean Energy Policies Analysis (SCEPA) Project: An
Analysis of Renewable Energy Feed-in Tariffs in the United States. NREL: Golden, Co. Doris, E., J. Mclaren, V. Healey, and S. Hockett. 2009. State of the States 2009: Renewable
Energy Generation and the Role of Policy. NREL: Golden, Co. [DSIRE] Database of Incentives for Renewable Energy and Energy Efficiency. 2009a.
DSIREusa Homepage. URL: http://www.dsireusa.org -----. 2009b. California: Incentives/Policies for Renewable Energy – Net Metering. URL:
http://www.dsireusa.org/incentives/incentive.cfm?Incentive_Code=CA02R&re=1&ee=0 Accessed July 15, 2009.
-----. 2009c. Connecticut: Incentives/Policies for Renewable Energy – Net Metering. URL:
http://www.dsireusa.org/incentives/incentive.cfm?Incentive_Code=CT01R&re=1&ee=0 Accessed July 15, 2009.
-----. 2009d. Hawaii: Incentives/Policies for Renewable Energy – Net Metering. URL:
http://www.dsireusa.org/incentives/incentive.cfm?Incentive_Code=HI04R&re=1&ee=0 Accessed July 15, 2009.
-----. 2009e. Maryland: Incentives/Policies for Renewable Energy – Net Metering. URL:
http://www.dsireusa.org/incentives/incentive.cfm?Incentive_Code=MD03R&re=1&ee=0 Accessed July 15, 2009.
-----. 2009f. Massachusetts: Incentives/Policies for Renewable Energy – Net Metering. URL:
http://www.dsireusa.org/incentives/incentive.cfm?Incentive_Code=MA01R&re=1&ee=0 Accessed July 15, 2009.
-----. 2009g. Nevada: Incentives/Policies for Renewable Energy – Net Metering. URL:
http://www.dsireusa.org/incentives/incentive.cfm?Incentive_Code=NV04R&re=1&ee=0 Accessed July 15, 2009.
-----. 2009h. New York: Incentives/Policies for Renewable Energy – Net Metering. URL:
http://www.dsireusa.org/incentives/incentive.cfm?Incentive_Code=NY05R&re=1&ee=0 Accessed July 15, 2009.
-----.2009l. North Carolina: Incentives/Policies for Renewable Energy – Net Metering. URL:
http://www.dsireusa.org/incentives/incentive.cfm?Incentive_Code=NC05R&re=1&ee=1. Accessed August 25, 2009.

26
-----. 2009i. Oregon: Incentives/Policies for Renewable Energy – Net Metering. URL: http://www.dsireusa.org/incentives/incentive.cfm?Incentive_Code=OR03R&re=1&ee=0 Accessed July 15, 2009.
-----. 2009j. Summary Maps – Net Metering. URL:
http://www.dsireusa.org/summarymaps/index.cfm?ee=0&RE=1 Accessed July 29, 2009. -----. 2009k. Minnesota: Incentives/Policies for Renewable Energy. URL:
http://www.dsireusa.org/incentives/index.cfm?re=1&ee=1&spv=0&st=0&srp=1&state=MN. Accessed July 29, 2009.
Ford, J. 2009. Personal Communication with Sarah Busche. August 20, 2009. Forsyth, T., M. Pedden, and T. Gagliano. 2002. The Effects of Net Metering on the Use of Small
Scale Wind Systmes in the United States. URL: http://www.nrel.gov/docs/fy03osti/32471.pdf
Hughes, J. (MD PSC). 2009. Personal Communication to Sarah Busche. Hunter, B.S. (NJ BPU). 2009. Personal Communication to Elizabeth Doris. [IREC] Interstate Renewable Energy Council. 2009a. Connecting to the Grid Resources. URL:
http://www.irecusa.org/index.php?id=31. Accessed July 29, 2009. -----. 2009b. IREC State by State Net Metering Table. URL:
http://www.irecusa.org/index.php?id=31&tx_ablinklist_pi1[action]=getviewclickedlink&tx_ablinklist_pi1[uid]=15&no_cache=1. Accessed July 29, 2009.
-----.2009c. Personal Communication from Larry Sherwood to Vickie Healey, including updated
state-by-state solar capacity data, officially released in the July 2009 IREC Solar Trends Report. June 8, 2009.
----- 2009d. US Solar Market Trends 2008. URL:
http://www.irecusa.org/fileadmin/user_upload/NationalOutreachDocs/SolarTrendsReports/IREC_Solar_Market_Trends_Report_2008.pdf. Accessed July 20, 2009.
Ellis, K. (NC PUC). 2009. Personal Communication to Elizabeth Doris. Kroposki, B, R. Margolis, G. Kuswa, J. Torres, W. Bower, T., Key, and D. Ton. 2008.
Renewable Systems Interconnection: Executive Summary. URL: http://www.nrel.gov/docs/fy08osti/42292.pdf.
MG&E. 2009. Clean Power Partner Program. Madison Gas & Electric. URL:
http://www.mge.com/home/rates/cleanpower.htm. Accessed August 20, 2009.

27
[MN] Minnesota Revised Statutes. 2008. 216B.164: Cogeneration and Small Power Production. URL: https://www.revisor.leg.state.mn.us/statutes/?id=216B.164 Accessed July 29, 2009.
[MN OES] Minnesota Office of Energy Security. Minnesota Solar Electric Rebate Program
Report. URL: http://www.state.mn.us/mn/externalDocs/Commerce/MN_Solar_Electric_Rebate_Report_040809051301_MinnesotaSolarElectricRebateProgram.pdf. Accessed September 22, 2009
[NNEC] Network for New Energy Choices. 2008. Freeing the Grid 2008: Best and Worst
Practices in State Net Metering Policies and Interconnection Standards. URL: http://www.newenergychoices.org/uploads/FreeingTheGrid2008_report.pdf
North Carolina. 2009. Docket E100 Sub 83: 2009 Decision. URL:
http://www.dsireusa.org/documents/Incentives/NC05Rd.pdf. August 25, 2009. North Carolina. 2005. Docket E100 Sub 83: 2005 Decision. URL:
http://www.dsireusa.org/documents/Incentives/NC05R.pdf. Accessed August 25, 2009. North Carolina. 1998. Docket E100 Sub 83: 1998 Decision. URL:
http://ncuc.commerce.state.nc.us/cgi-bin/webview/senddoc.pgm?dispfmt=&itype=Q&authorization=&parm2=GAAAAA22389A&parm3=000113520
[NREL] National Renewable Energy Laboratory. 2009. OpenPV database at
http://openpv.nrel.gov/. Accessed December 17, 2009. Phelps, N. (MA PUC). 2009. Personal Communication to Elizabeth Doris. Sherwood, L. 2009. IREC Webinar (June 23, 2009). “State Solar Policy and Market Trends”.
http://www.irecusa.org/index.php?id=98&no_cache=1&tx_ttnews[tt_news]=1443&tx_ttnews[backPid]=96&cHash=6a218fae1b
Solar Alliance. 2009. Solar Alliance Home Page. URL:
http://www.solaralliance.org/home/index.html. Accessed 7/28/09. Stoutenborough, J. W. and M. Beverlin. 2008. Encouraging Pollution-Free Energy: The
Diffusion of State Net Metering Policies. Social Science Quarterly, 89(5): 1232. Wan, Y. and J. Green. 1998. Current Experience with Net Metering Programs. Presented at
Windpower 1998, Bakersfield 1998. URL: http://apps3.eere.energy.gov/greenpower/resources/pdfs/current_nm.pdf. Accessed July 29, 2009.
Worden, M. 2009 (NY PSC). Personal Communication to Elizabeth Doris.

28
Appendix 1. State Policy Contact Interview Methodology and Questions August 2009 Purpose: the purpose of interviewing the program contacts is to better understand the development and implementation of the net metering policies and programs, specifically with reference to system size limit increases. Process: Interviews were informal in style, conducted over email or phone. Questions: 1) Why did your state lift the NM limit in xx year? 2) What was the process for raising the limit (regulatory, legislative, referendum)? 3) How long did that process take for the original policy and for the revisions? 4) What else changed in the policy when the cap was raised? 5) Was there anything else notable (challenges or other ideas that came out of the process that supported or presented barriers to RE development) in the NM change process? 6) Did the state or other entities produce cost benefit analyses of the changes (either before or after the change)? If studies: who paid for them and how much did they cost? Who carried them out? If no study, why not? 7) Have you seen any tangible results of the change? E.G. Rate related, increased reliability, peak reduction? 8) Is there anything else we should know about your experience with net metering policy that may be of assistance to others as they develop and implement these? Interviewees: Programmatic contacts at the PUC or other regulatory body. Also interviewed were people that were suggested by PUC contacts. Respondents included representatives from 8 states, as outlined in Table A1.
Table A1. State Net Metering Program Respondents State Contact/Title/Office CT Mark Quinlan HI Brian Chang, HI PUC MA Nathan Phelps, MA PUC MD Jerry Hughes, MD PSC NC Kennie Ellis, NC PSC NJ B. Scott Hunter, NJ BPU NV Mark Harris, NV PUC NY Mike Worden, NY PSC VT Anne Margolis, Clean Energy Development Fund Manager
VT Dept. of Public Service

F1147-E(10/2008)
REPORT DOCUMENTATION PAGE Form Approved OMB No. 0704-0188
The public reporting burden for this collection of information is estimated to average 1 hour per response, including the time for reviewing instructions, searching existing data sources, gathering and maintaining the data needed, and completing and reviewing the collection of information. Send comments regarding this burden estimate or any other aspect of this collection of information, including suggestions for reducing the burden, to Department of Defense, Executive Services and Communications Directorate (0704-0188). Respondents should be aware that notwithstanding any other provision of law, no person shall be subject to any penalty for failing to comply with a collection of information if it does not display a currently valid OMB control number. PLEASE DO NOT RETURN YOUR FORM TO THE ABOVE ORGANIZATION. 1. REPORT DATE (DD-MM-YYYY)
17-12-2009 2. REPORT TYPE
Technical Report 3. DATES COVERED (From - To)
4. TITLE AND SUBTITLE
Net Metering Policy Development and Distributed Solar Generation in Minnesota: Overview of Trends in Nationwide Policy Development and Implications of Increasing the Eligible System Size Cap
5a. CONTRACT NUMBER DE-AC36-08-GO28308
5b. GRANT NUMBER
5c. PROGRAM ELEMENT NUMBER
6. AUTHOR(S) E. Doris, S. Busche, and S. Hockett
5d. PROJECT NUMBER NREL/TP-6A2-46670
5e. TASK NUMBER PVC9.92X8
5f. WORK UNIT NUMBER
7. PERFORMING ORGANIZATION NAME(S) AND ADDRESS(ES) National Renewable Energy Laboratory 1617 Cole Blvd. Golden, CO 80401-3393
8. PERFORMING ORGANIZATION REPORT NUMBER NREL/TP-6A2-46670
9. SPONSORING/MONITORING AGENCY NAME(S) AND ADDRESS(ES)
10. SPONSOR/MONITOR'S ACRONYM(S) NREL
11. SPONSORING/MONITORING AGENCY REPORT NUMBER
12. DISTRIBUTION AVAILABILITY STATEMENT National Technical Information Service U.S. Department of Commerce 5285 Port Royal Road Springfield, VA 22161
13. SUPPLEMENTARY NOTES
14. ABSTRACT (Maximum 200 Words) The goal of the Minnesota net metering policy is to give the maximum possible encouragement to distributed generation assets, especially solar electric systems (MN 2008). However, according to a published set of best practices (NNEC 2008) that prioritize the maximum development of solar markets within states, the Minnesota policy does not incorporate many of the important best practices that may help other states transform their solar energy markets and increase the amount of grid-connected distributed solar generation assets. Reasons cited include the low system size limit of 40kW (the best practices document recommends a 2 MW limit) and a lack of language protecting generators from additional utility fees. This study was conducted to compare Minnesota’s policies to national best practices. It provides an overview of the current Minnesota policy in the context of these best practices and other jurisdictions’ net metering policies, as well as a qualitative assessment of the impacts of raising the system size cap within the policy based on the experiences of other states. 15. SUBJECT TERMS
Minnesota; solar electric systems; net metering; solar markets; distributed solar generation; electric grid; electric utilities; net metering policy; net metering system; energy analysis; NREL; Elizabeth Doris; Sarah Busche; Stephen Hockett
16. SECURITY CLASSIFICATION OF: 17. LIMITATION OF ABSTRACT
UL
18. NUMBER OF PAGES
19a. NAME OF RESPONSIBLE PERSON a. REPORT
Unclassified b. ABSTRACT Unclassified
c. THIS PAGE Unclassified 19b. TELEPHONE NUMBER (Include area code)
Standard Form 298 (Rev. 8/98) Prescribed by ANSI Std. Z39.18